international workshop on supply and use tables
TRANSCRIPT
1
INTERNATIONAL WORKSHOP ON
SUPPLY AND USE TABLES
COMPILATION OF MALAYSIA
SUPPLY AND USE TABLES
BEIJING, CHINA
11-13 SEPTEMBER 2018
2
OUTLINES
1
2
3
4
Introduction
Malaysia : Supply and Use Table
Valuation
Challenges and Moving Forward

3
OUTLINES
1
2
3
4
Introduction
Malaysia : Supply and Use Table
Valuation
Moving Forward

4
The Insights of DOSM
14 DOSM State 28 Operation Office
Established in 1949
The main government agency entrusted with
the responsible for collecting, interpreting and
distributing timely and up to date statistics
VISION“To Become A Leading Statistical Organisation
Internationally by 2020”
MISSION“Producer of National Statistics of Integrity and
Reliability”

5
Amongst DOSM Products
State Socioeconomic Report
My Local Stats
ICT Use and Access by Individuals and Households Survey Report
Compendium of Environmental Statistics
Salaries & Wages Survey Report
Social Statistics Bulletin
Household Expenditure Survey Report
Labor Force Survey Report
Household Income Survey Report and Basic Amenities
Population Projections
Vital Statistics
Statistics on Causes of Death
Domestic Tourism Survey
Economic Census
Balance of Payments
Rubber Statistics
External Trade Statistics
Index of Industrial Production
Gross Domestic Product
Consumer Price Index
Statistics of International Trade in Services
Malaysia Economic Indicator – Leading, Coincident and Lagging Indices
SOCIAL & DEMOGRAPH ECONOMY
Portal : www.dosm.gov.my
Malaysia Input-Output Tables

6
HOST COUNTRY
5th ASEAN Community Statistical System (ACSS) – 2015
Meeting of the ASEAN Community Statistical System Sub-Committee on Planning and Coordination (ACSS-SCPC) & Project Steering Committee (PSC-5) and Workshop Monitoring & Evaluation Framework,
2017
62nd ISI World Statistics Congress 2019
STUDY VISIT/ COURTESY CALL Pakistan, Bangladesh, Mozambique, Korea, Netherland, Nepal, Ethiopia, Afghanistan,
Nigeria, Madagascar, China, Cambodia, Lao PDR, Vietnam, Myanmar
UNFPA, UNCEF, World Bank, ADB, SESRIC,
CHAIR MEETING
WGDSA (2011-2017), IMTS (2016-2017), SITS (2016), WGIIS Steering Committee Meeting of The EU-ASEAN Capacity Project For Monitoring
Integration Progress And Statistics (PSC) (2015) Working Group on Statistical Database (2017 – 2018) Task Force on Asia-Pacific Economic Statistics Week (APES) – (2017-2018) 8th ASEAN Community Statistical System (ACSS)-Sub-Committee on Planning
and Coordination (SCPC) – 2014-2015 Mesyuarat Brunei Darussalam- Indonesia-Malaysia- Philippines East ASEAN
Growth Area (BIMP - EAGA), 2017
PILOT COUNTRY Pilot country for the Development Account on Green Economy/Green Growth
Indicators project ( 2014-2015) Pilot country for System of Environmental-Economic Accounting (SEEA) project (2015 –
2017)
ADB Project : R-CDTA 8838 Updating and Constructing the Supply and Use Tables (SUT) for Selected Member Economies (2018)
Projek EU-ASEAN Capacity Building Project For Monitoring Integration Progress (2014-2018);
Trade in Value Added (APEC TiVA) Under Global Value Chains
(GVCs) And Its Action Plan; Business Register for Small, Medium
Enterprise of Laos, Sri Lanka, Cambodia and Vietnam.
EXPERT GROUP Improving Rural Statistics - Rural Definition & Indicator Refugees and Internally Displaced Persons Statistics Environmental-Economic Accounting (UNCEEA) High-level Group for Partnership, Coordination and Capacity-Building for statistics for the
2030 Agenda for Sustainable Development (HLG-PCCB) The Guidelines And Principles For The Development Of Disability Experts on Business Registers
TRAINER/EXPERT Sustainable Development Statistics
Tourism Satellite Account
International Trade Statistics
Education Statistics
International Merchandise Trade Statistics (IMTS)
Labour Statistics
WORKING/ CITY GROUP / STEERING GROUP
ASEAN: WGDSA, WGSITS, WGIMTS, WGFDI Friends of The Chair Group on the Fundamental Principles Of Official Statistics
(FOC-FPOS) The Network for the Coordination of Statistical Training in Asia and the Pacific Praia Group – Governance Statistics Washington Group – Disability London Group – Steering Group for the Regional Programme on Economic
Statistics (SGRPES) – Chair
Regional Steering Group on Population and Social Statistics in Asia and the
Pacific
Regional Steering Group On Civil Registration And Vital Statistics (CRVS)
International Involvement

7
OUTLINES
1
2
3
4
Introduction
Malaysia: Supply and Use Table
Valuation
Challenges and Moving Forward

8
Why SUT & I-O?
The SUT and IO tables offer the most detailed potrait of aneconomy.
The tables provide a detailed analysis on the process ofproduction and the use of goods and services (products) andthe income generated in that production.
It also illustrates the relationship between consumers andproducers and interdependence between industries.
I-O Tables are derived from SUT.

9
Malaysia I-O Tables
1970 1983 1991 2005
1978 1987 2000 2010
1970
10
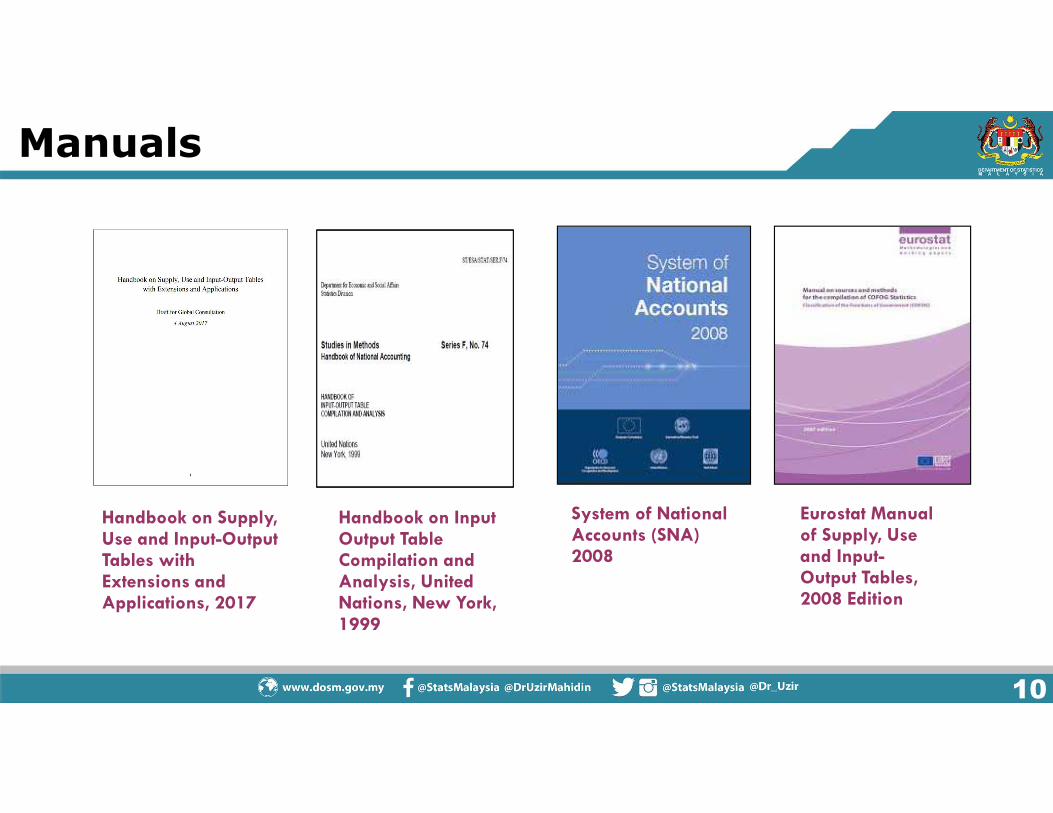
Manuals
System of National Accounts (SNA) 2008
Eurostat Manual of Supply, Use and Input-Output Tables, 2008 Edition
Handbook on Input Output Table Compilation and Analysis, United Nations, New York, 1999
Handbook on Supply, Use and Input-Output Tables with Extensions and Applications, 2017
11
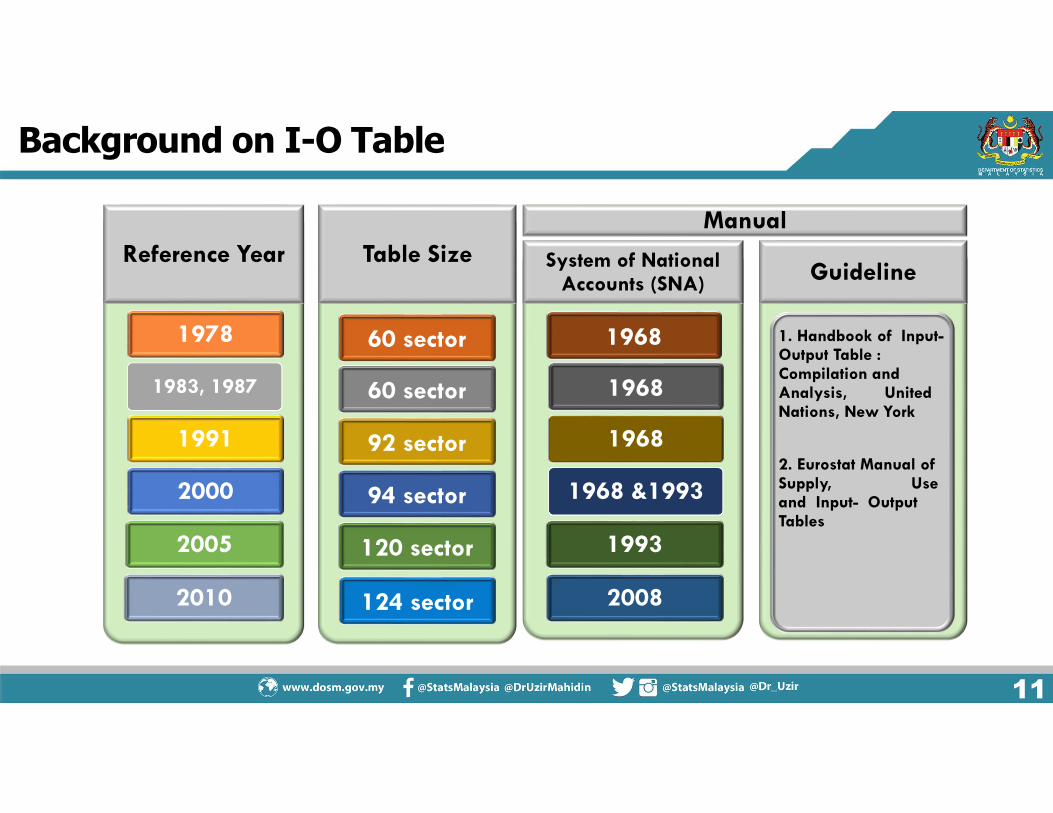
Background on I-O Table
System of National Accounts (SNA)
Reference Year
1978
1983, 1987
1991
2000
2005
Table Size
60 sector
60 sector
92 sector
94 sector
120 sector
2010 124 sector
1968
1968
1968
1968 &1993
1993
2008
Guideline
1. Handbook of Input-Output Table : Compilation and Analysis, United Nations, New York
2. Eurostat Manual of Supply, Use and Input- Output Tables
Manual
12
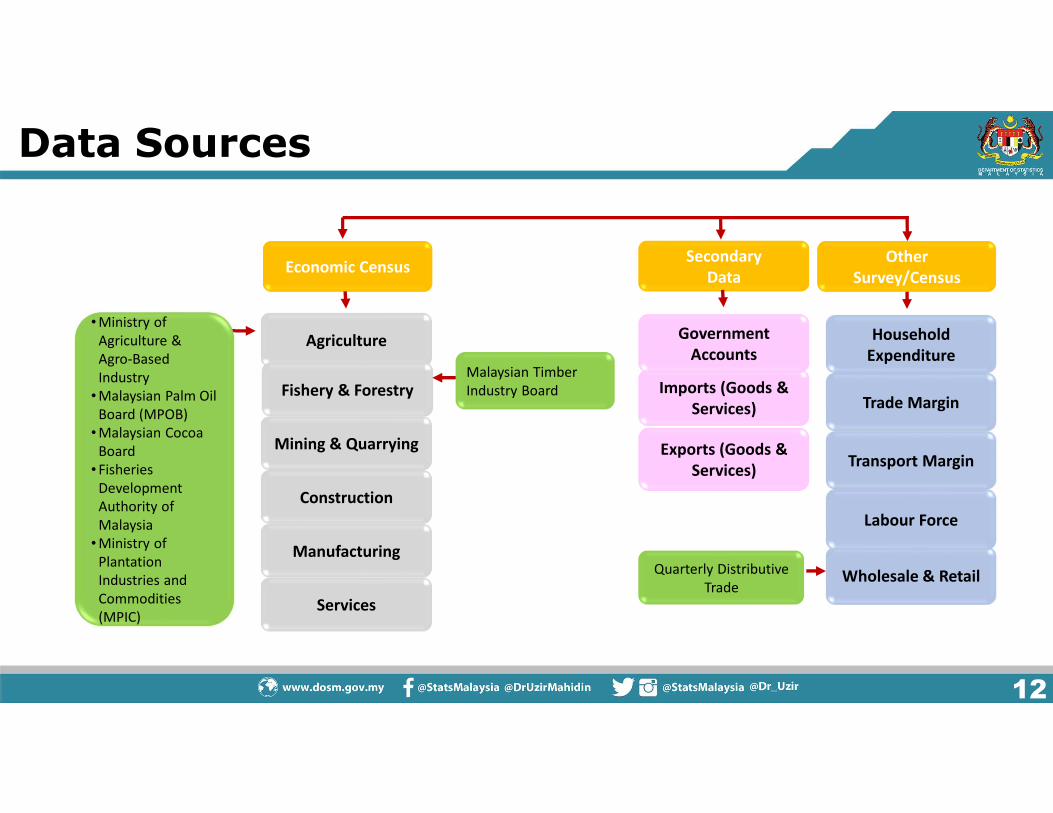
Data Sources
Economic CensusSecondary
Data
Other
Survey/Census
Agriculture
Services
Manufacturing
Construction
Mining & Quarrying
Imports (Goods &
Services)
Wholesale & Retail
Fishery & Forestry
• Ministry of
Agriculture &
Agro-Based
Industry
• Malaysian Palm Oil
Board (MPOB)
• Malaysian Cocoa
Board
• Fisheries
Development
Authority of
Malaysia
• Ministry of
Plantation
Industries and
Commodities
(MPIC)
Malaysian Timber
Industry Board
Quarterly Distributive
Trade
Exports (Goods &
Services)
Government
Accounts
Household
Expenditure
Labour Force
Trade Margin
Transport Margin

13
Classifications
01
02
03
04
05
06
Imports & Exports
• Harmonized System
(HS) Code
• Standard Industrial
Trade Classification
(SITC)
Household ExpenditureClassification of
Individual Consumption
by Purpose (COICOP)
Industry
Malaysia Standard
Industrial Classification
(MSIC)
NPISHsClassification of Purpose
of Non-Profit Institution
Serving Household
(COPNI)
.
Product
Malaysia Classification
of Products by Activity
(MCPA)
Government Consumption
Classification of the Function
of Government (COFOG)
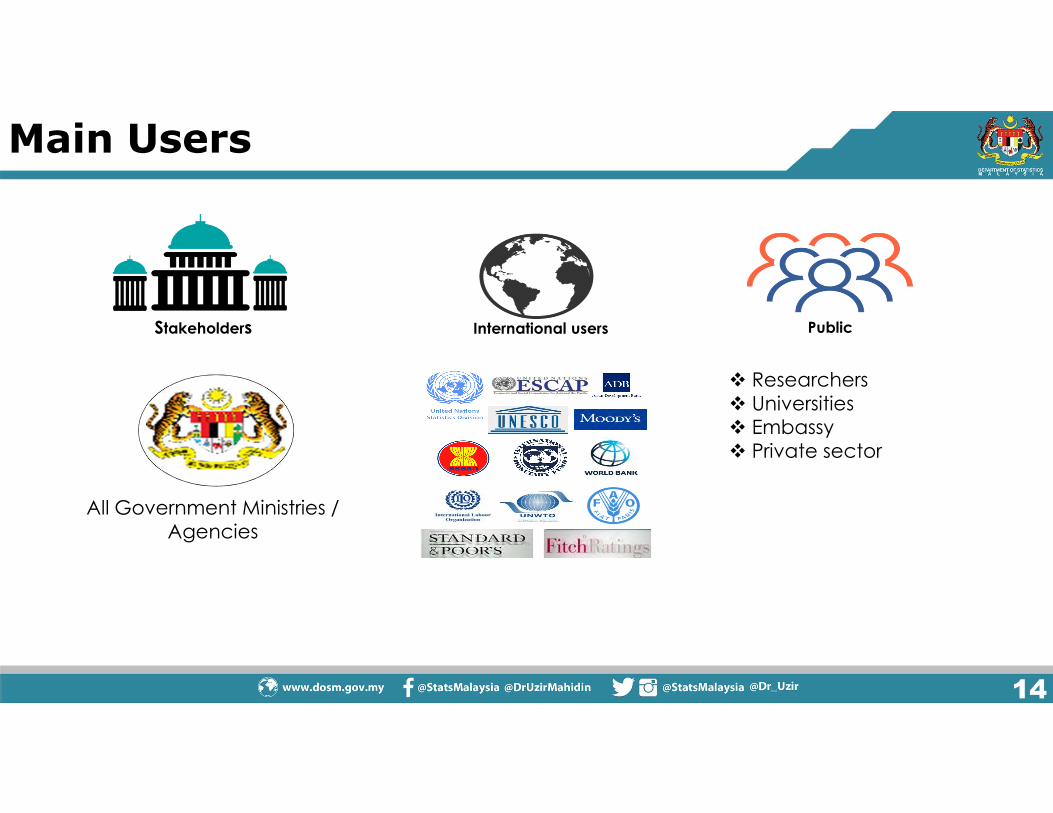
14
Stakeholders International users Public
Researchers
Universities Embassy
Private sector
All Government Ministries /
Agencies
Main Users

15
Relationship between Supply and Use
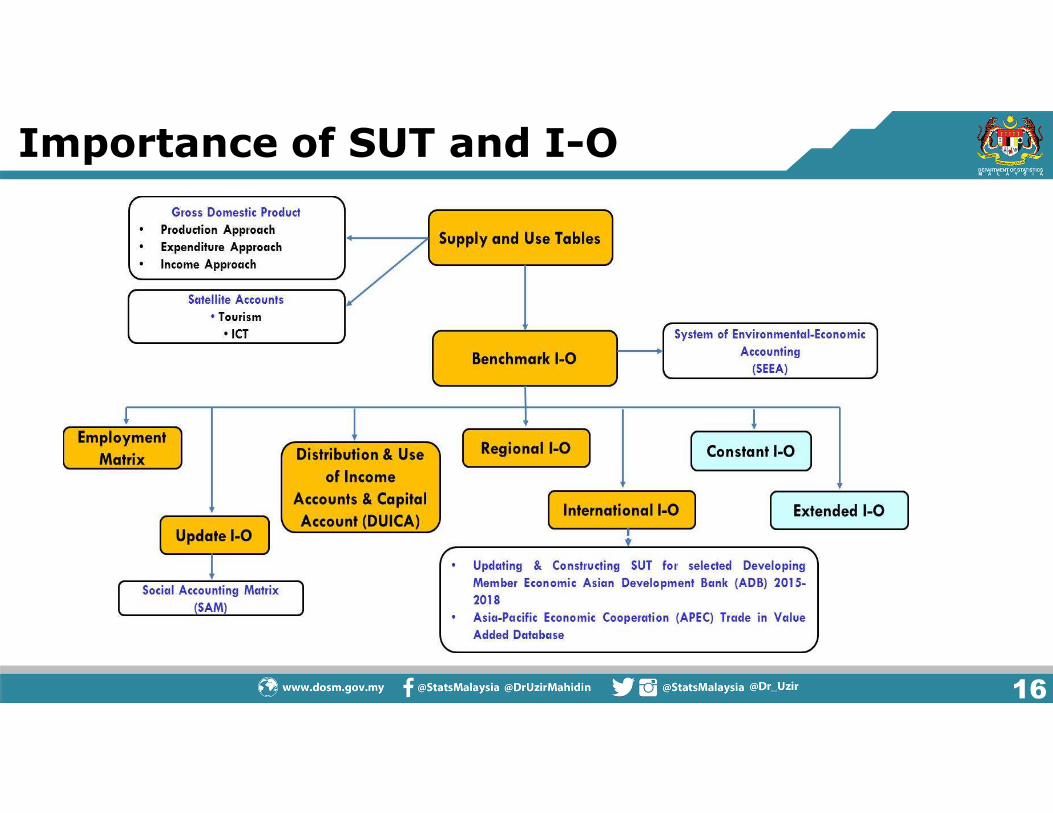
16
Importance of SUT and I-O

17
Flow of Compilation For Supply Table 2010

18
Flow of Compilation For Use Table 2010


20
Framework of Supply & Use Tables
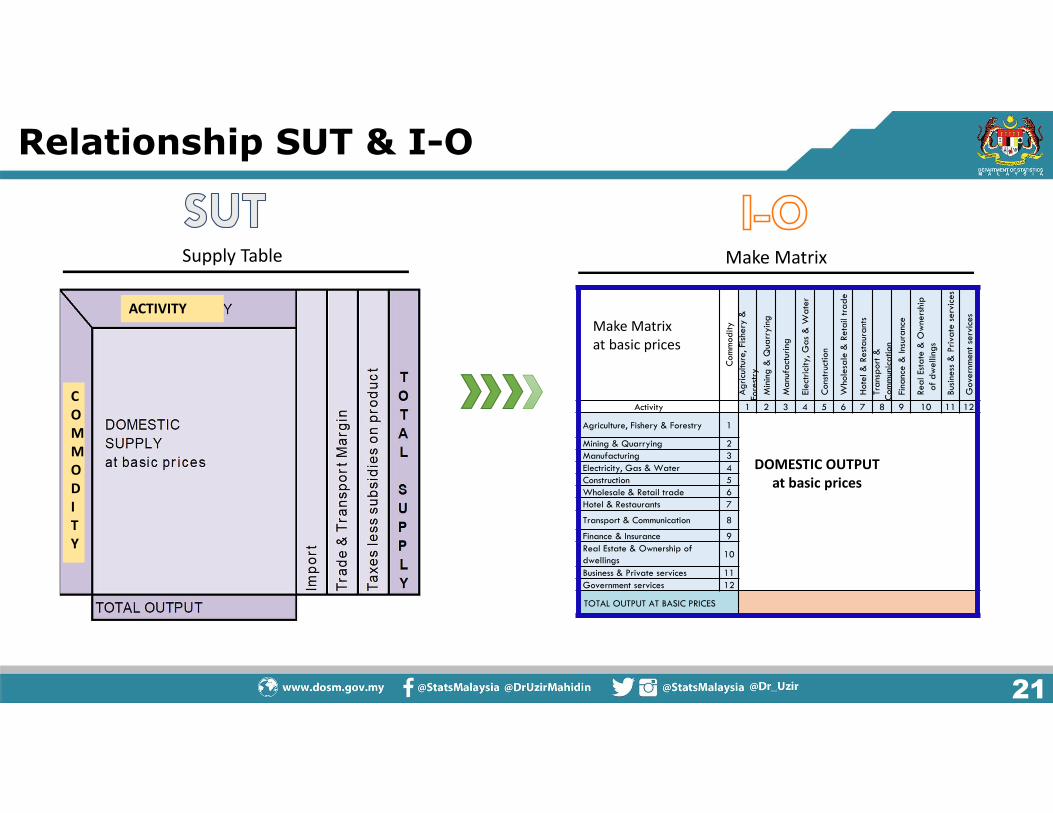
21
Com
modity
Agri
cultur
e, Fi
shery
&
Fore
stry
Min
ing &
Qua
rryin
g
Manu
fact
urin
g
Elect
rici
ty, G
as
& W
ate
r
Cons
truc
tion
Who
lesa
le &
Reta
il tr
ade
Hote
l &
Rest
aur
ant
s
Trans
port
&
Com
mun
ication
Fina
nce &
Ins
uranc
e
Real Es
tate
& O
wne
rshi
p
of
dw
elli
ngs
Bus
iness
& P
riva
te s
erv
ices
Gove
rnm
ent
serv
ices
Activity 1 2 3 4 5 6 7 8 9 10 11 12
Agriculture, Fishery & Forestry 1
Mining & Quarrying 2
Manufacturing 3
Electricity, Gas & Water 4
Construction 5
Wholesale & Retail trade 6
Hotel & Restaurants 7
Transport & Communication 8
Finance & Insurance 9
Real Estate & Ownership of
dwellings10
Business & Private services 11
Government services 12
TOTAL OUTPUT AT BASIC PRICES
Make MatrixSupply Table
DOMESTIC OUTPUT
at basic prices
Make Matrix
at basic prices
ACTIVITY
C
O
M
M
O
D
I
T
Y
Relationship SUT & I-O
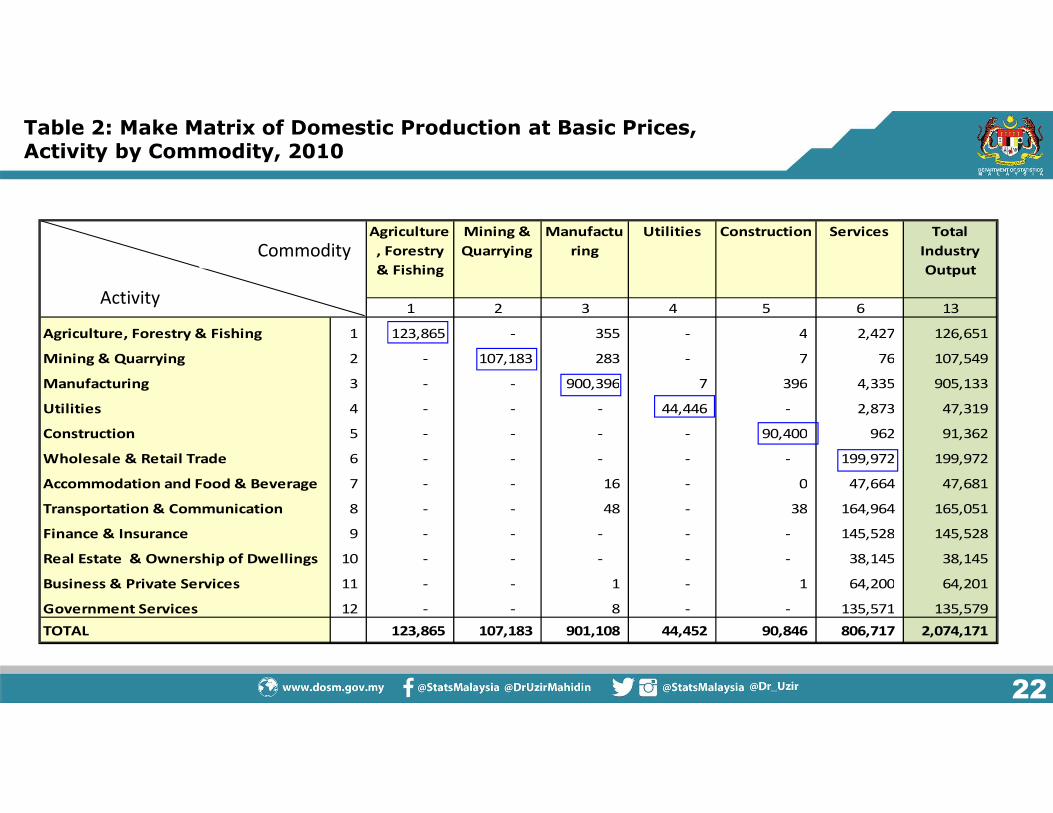
22
Agriculture
, Forestry
& Fishing
Mining &
Quarrying
Manufactu
ring
Utilities Construction Services Total
Industry
Output
1 2 3 4 5 6 13
Agriculture, Forestry & Fishing 1 123,865 - 355 - 4 2,427 126,651
Mining & Quarrying 2 - 107,183 283 - 7 76 107,549
Manufacturing 3 - - 900,396 7 396 4,335 905,133
Utilities 4 - - - 44,446 - 2,873 47,319
Construction 5 - - - - 90,400 962 91,362
Wholesale & Retail Trade 6 - - - - - 199,972 199,972
Accommodation and Food & Beverage 7 - - 16 - 0 47,664 47,681
Transportation & Communication 8 - - 48 - 38 164,964 165,051
Finance & Insurance 9 - - - - - 145,528 145,528
Real Estate & Ownership of Dwellings 10 - - - - - 38,145 38,145
Business & Private Services 11 - - 1 - 1 64,200 64,201
Government Services 12 - - 8 - - 135,571 135,579
TOTAL 123,865 107,183 901,108 44,452 90,846 806,717 2,074,171
Activity
CommodityActivity
Commodity
Table 2: Make Matrix of Domestic Production at Basic Prices, Activity by Commodity, 2010
24
Commodity
Act
ivit
y
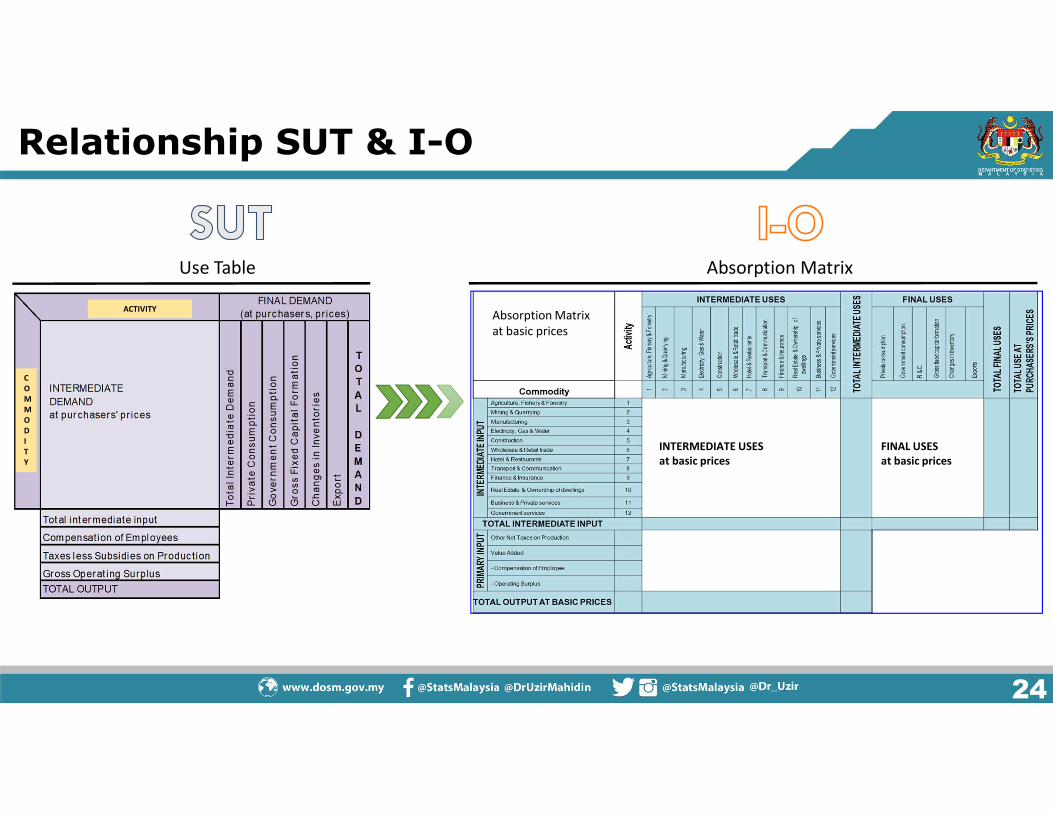
Absorption MatrixUse Table
Absorption Matrix
at basic prices
INTERMEDIATE USES
at basic prices
FINAL USES
at basic prices
ACTIVITY
C
O
M
M
O
D
I
T
Y
Relationship SUT & I-O

25
Ind
ustr
y
INTERMEDIATE DEMAND
TO
TA
L IN
TER
MED
IATE
DEM
AN
D
FINAL DEMAND
TO
TA
L FIN
AL
DEM
AN
D
TO
TA
L D
EM
AN
D
Ag
ricu
ltur
e, Fi
shery
&
Fore
stry
Min
ing
& Q
uarr
yin
g
Ma
nufa
ctur
ing
Elect
rici
ty, G
as
&
Wa
ter
Cons
truc
tion
Who
lesa
le &
Reta
il
tra
de
Hote
l &
Rest
aur
ant
s
Tra
nsp
ort
&
Com
mun
ica
tion
Fina
nce &
Ins
ura
nce
Rea
l Es
tate
&
Ow
ners
hip
o
f
Dw
elli
ngs
Bus
iness
& P
riva
te
serv
ices
Gove
rnm
ent
serv
ices
Pri
vate
cons
ump
tion
Gove
rnm
ent
cons
ump
tion
Gro
ss F
ixed
Ca
pita
l
Form
ation
Cha
nges
in Inv
ent
ory
Exp
ort
s
Product 1 2 3 4 5 6 7 8 9 10 11 12
INTER
MED
IATE I
NPU
T
Agriculture, Fishery & Forestry 1
Mining & Quarrying 2
Manufacturing 3
Electricity, Gas & Water 4
Construction 5
Wholesale & Retail trade 6
Hotel & Restaurants 7
Transport & Communication 8
Finance & Insurance 9
Real Estate & Ownership of Dwellings 10
Business & Private services 11
Government services 12
TOTAL INTERMEDIATE INPUT
PR
IMA
RY
INPU
T
Imported Commodities
Taxes on Products
Subsidies on Products
Value Added
- Compensation of Employee
- Operating Surplus
TOTAL OUTPUT
Final Uses refers to
sales by each sector
to final markets for
their production, such
as private
consumption,
government
consumption, export,
etc.
Primary Input shows the account for the non-
industrial inputs to production.
Intermediate Input: Shows the cost structures of
the industries. The supply of output from one
sector to another for intermediate use in the
process of production by industries.
Intermediate Demand: Shows the uses of goods
and services.
The Use Table shows the use of
goods and services by product
and by type of use for
intermediate and final demand
Absorption Matrix
26
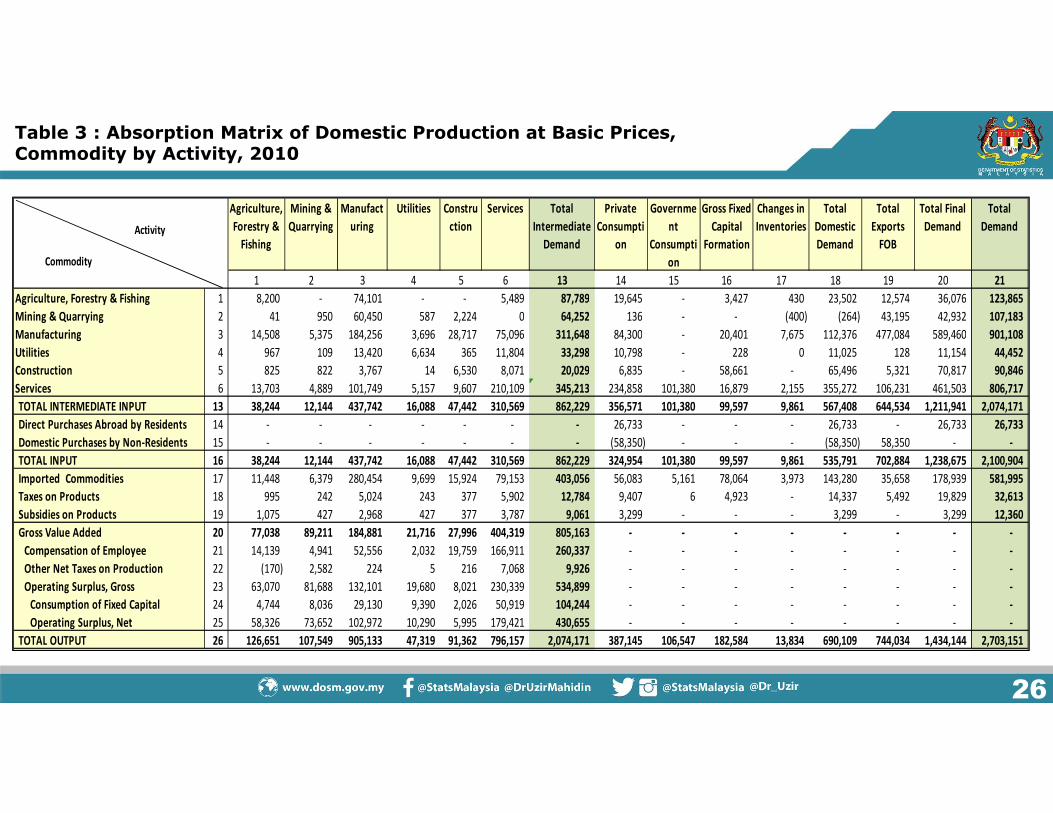
Table 3 : Absorption Matrix of Domestic Production at Basic Prices, Commodity by Activity, 2010
Agriculture,
Forestry &
Fishing
Mining &
Quarrying
Manufact
uring
Utilities Constru
ction
Services Total
Intermediate
Demand
Private
Consumpti
on
Governme
nt
Consumpti
on
Gross Fixed
Capital
Formation
Changes in
Inventories
Total
Domestic
Demand
Total
Exports
FOB
Total Final
Demand
Total
Demand
1 2 3 4 5 6 13 14 15 16 17 18 19 20 21
Agriculture, Forestry & Fishing 1 8,200 - 74,101 - - 5,489 87,789 19,645 - 3,427 430 23,502 12,574 36,076 123,865
Mining & Quarrying 2 41 950 60,450 587 2,224 0 64,252 136 - - (400) (264) 43,195 42,932 107,183
Manufacturing 3 14,508 5,375 184,256 3,696 28,717 75,096 311,648 84,300 - 20,401 7,675 112,376 477,084 589,460 901,108
Utilities 4 967 109 13,420 6,634 365 11,804 33,298 10,798 - 228 0 11,025 128 11,154 44,452
Construction 5 825 822 3,767 14 6,530 8,071 20,029 6,835 - 58,661 - 65,496 5,321 70,817 90,846
Services 6 13,703 4,889 101,749 5,157 9,607 210,109 345,213 234,858 101,380 16,879 2,155 355,272 106,231 461,503 806,717
TOTAL INTERMEDIATE INPUT 13 38,244 12,144 437,742 16,088 47,442 310,569 862,229 356,571 101,380 99,597 9,861 567,408 644,534 1,211,941 2,074,171
Direct Purchases Abroad by Residents 14 - - - - - - - 26,733 - - - 26,733 - 26,733 26,733
Domestic Purchases by Non-Residents 15 - - - - - - - (58,350) - - - (58,350) 58,350 - -
TOTAL INPUT 16 38,244 12,144 437,742 16,088 47,442 310,569 862,229 324,954 101,380 99,597 9,861 535,791 702,884 1,238,675 2,100,904
Imported Commodities 17 11,448 6,379 280,454 9,699 15,924 79,153 403,056 56,083 5,161 78,064 3,973 143,280 35,658 178,939 581,995
Taxes on Products 18 995 242 5,024 243 377 5,902 12,784 9,407 6 4,923 - 14,337 5,492 19,829 32,613
Subsidies on Products 19 1,075 427 2,968 427 377 3,787 9,061 3,299 - - - 3,299 - 3,299 12,360
Gross Value Added 20 77,038 89,211 184,881 21,716 27,996 404,319 805,163 - - - - - - - -
Compensation of Employee 21 14,139 4,941 52,556 2,032 19,759 166,911 260,337 - - - - - - - -
Other Net Taxes on Production 22 (170) 2,582 224 5 216 7,068 9,926 - - - - - - - -
Operating Surplus, Gross 23 63,070 81,688 132,101 19,680 8,021 230,339 534,899 - - - - - - - -
Consumption of Fixed Capital 24 4,744 8,036 29,130 9,390 2,026 50,919 104,244 - - - - - - - -
Operating Surplus, Net 25 58,326 73,652 102,972 10,290 5,995 179,421 430,655 - - - - - - - -
TOTAL OUTPUT 26 126,651 107,549 905,133 47,319 91,362 796,157 2,074,171 387,145 106,547 182,584 13,834 690,109 744,034 1,434,144 2,703,151
Activity
Commodity

27
Also known as intermediate input.
Records the various type of input used by industries to meet the needs of their production activities.
Intermediate input is compiled at basic price.
Absorption Matrix
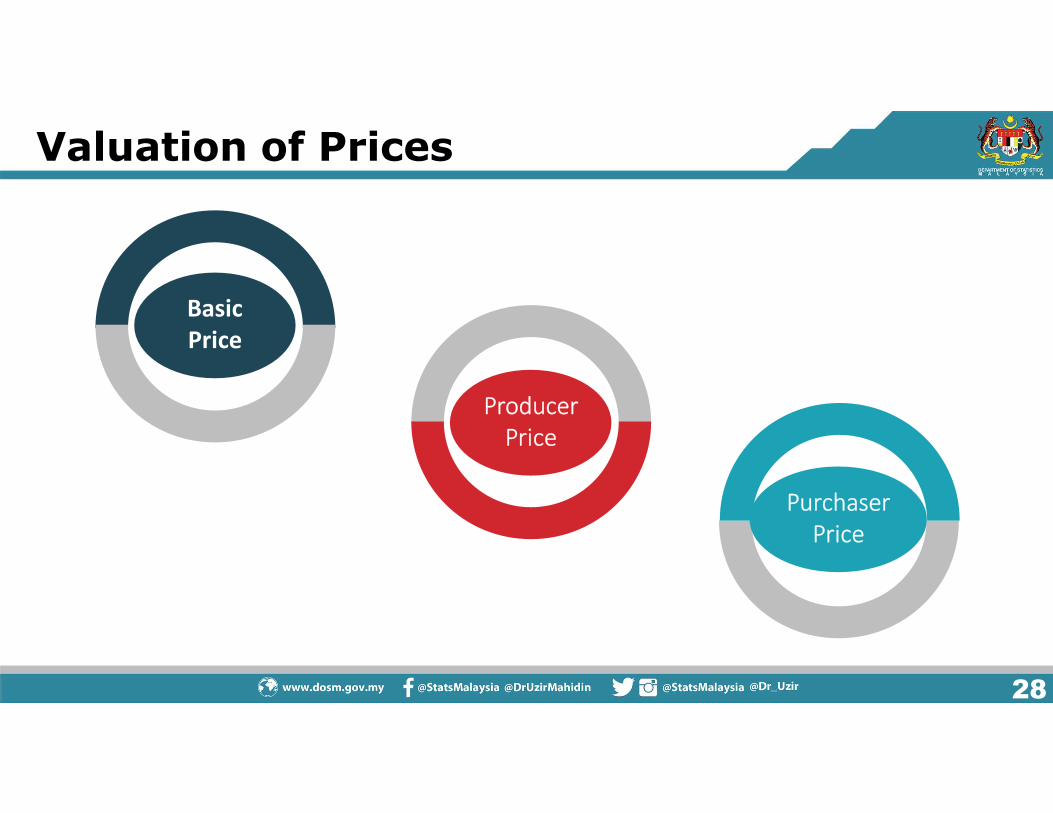
28
Basic
Price
Producer
Price
Purchaser
Price
Valuation of Prices

29
Valuation of Producer Price
Basic
Price
Taxes on
products
Subsidies
on
Products
Producer
Price

30
Valuation of Purchaser Price
Producer
Price
Trade
Margin
Transport
margin
Purchaser
Price

31
Valuation - Illustration
Summary:
Output at basic prices = RM 1,000
Plus: taxes less subsidies on product = RM 100
Equal: Producers’ prices = RM 1,100
Plus: trade and transport margin = RM 800
Equal: Purchasers’ prices = RM 1,900
• Output at basic prices = RM1000
Computer Factory
• Tax given10% from the total output =RM100
• No subsidies
Plus: taxes less subsidies on
product• Producers’
Prices = RM1,100
Computer shop
• Assume trade margin= RM 500
• Assume transport margin= RM300
Plus: trade and transport margin
• Purchasers’ Prices = RM1900
Household

32
Challenges
Compilation of GST (VAT) vector and derivation of GST matrix sincethere are three rates of GST in Malaysia (zero rated, standard rated& exempted).
Compilation of trade and transport margin (TTM) vector. At themoment, the compilation of TTM is based on recommendation byEurostat Manual of Supply, Use and Input-Output Tables (2008).
Seeks for best practices on TTM and imports matrices. Currently,TTM and imports matrices is derived using use structure.
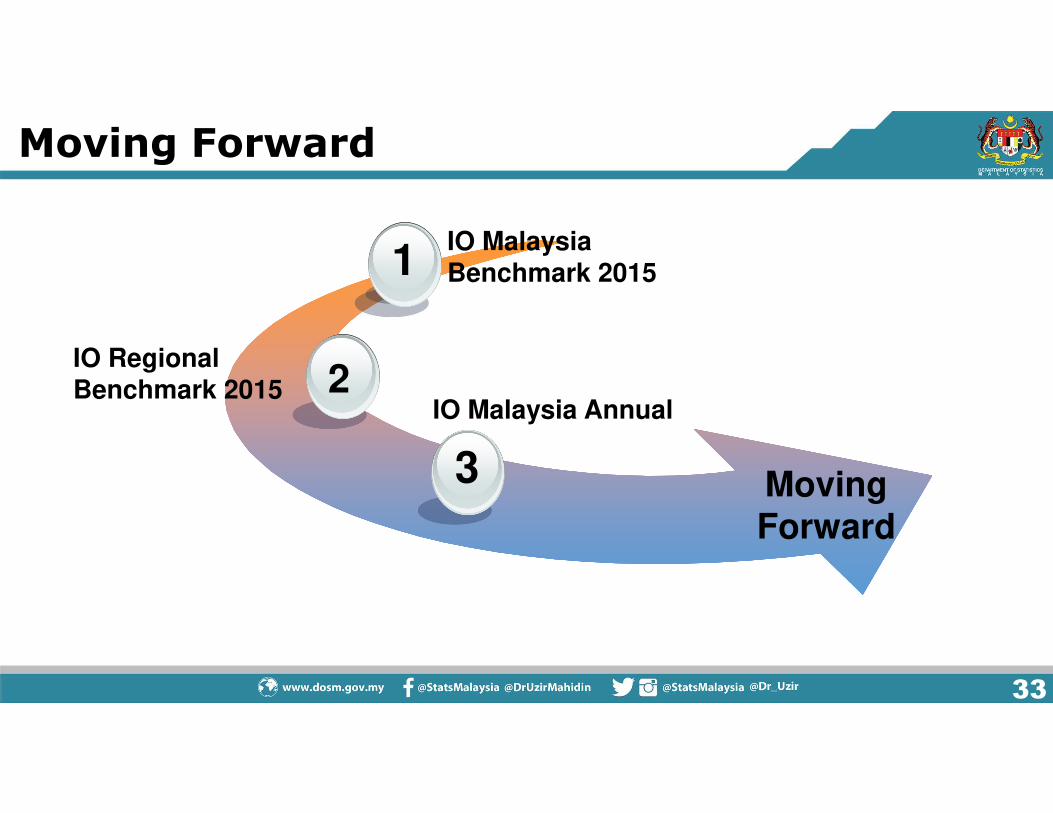
33
Moving Forward
SUT Malaysia Benchmark
IO Malaysia Benchmark 2015
Moving Forward
IO Malaysia Annual
IO Regional
Benchmark 2015 2
1
3
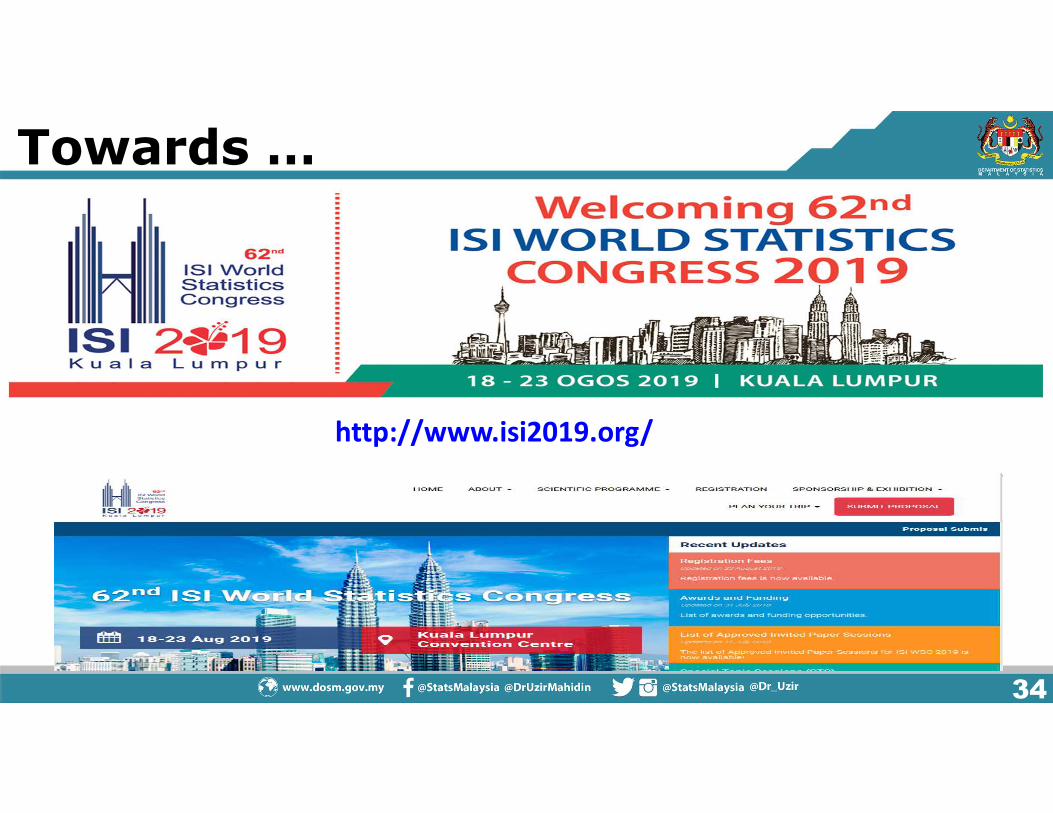
34
Towards …
http://www.isi2019.org/

THANK YOUSiti Norhudah Nordin
Senior Assistant Director
Economic Indicators Division
Department of Statistics, Malaysia
Email: [email protected]
For more details, visit our pages at:
www.statistics.gov.my
https://www.facebook.com/StatsMalaysia
https://www.twitter.com/StatsMalaysia