international journal of research in management and...
TRANSCRIPT

© Universal Multidisciplinary Research Institute Pvt Ltd
1
International Journal of Research in Management and Business (ISSN: 2395-4329): Volume 3 Issue 1
Impact of Perceived Quality as Moderator on Brand Equity as a Mediating effect on brand
preference in Shampoo sector of Pakistan
Muhammad Hamid
Department of Business Administration, University of Sargodha, Pakistan
Hafiz Kamran
Department of Business Administration, University of Sargodha, Pakistan
Muhammad Rehan Hassan
Department of Business Administration, University of Sargodha, Pakistan
Beenish Shafqat
Department of Business Administration, University of Sargodha, Pakistan
Abstract
The aim of present article is, define the relation between perceived quality with the brand image
brand association brand equity and brand preference among the customers of shampoo brand in
Sargodha. This is a survey research. The research method is a descriptive survey. Examine the
indirect relationship between brand image and brand preference also between brand association
and brand preference through mediating effect of brand equity. This research addresses the
knowledge gap by discussing the moderating role of perceive quality between brand image and
brand equity also between brand association and brand equity. Data was collected from 250
respondents which randomly were chosen through self-administered questionnaires. The sample
consisted of students of University of Sargodha. Convenience sampling technique was used to
collect data. Moderation was analyzed through interaction term in SPSS 21 and AMOS 21 was
used for mediation analysis. The validity of the instrument was confirmed by validity of content
and the reliability by cronbach alpha. In terms of effect, we concluded that brand image and
brand association has a significant positive effect on brand preference. The results of our study are
generalized to the cosmetic sector focus on shampoo brands of Pakistan.
Keywords: brand image, brand association, perceive quality, brand equity, brand preference.
1. Introduction
In this era, fashion sector cosmetic becomes an main thing in the life of a people so that's why
every person select a brand on which he/she feel comfy and felt that it is reliable.so brand
becomes a very important thing. Brands are fundamental hotspots for creating and supporting an
aggressive edge which helps in diminishing quality contrasts , as well as is a wellspring of solid
and great differentiators by Aaker (2012). Brand contains of a name term sign symbol or any
blend of them that attempts to signify the matchless advantages an organization can deliver to
consumers through a specific item or service in terms of attributes value and culture (Wang and

© Universal Multidisciplinary Research Institute Pvt Ltd
2
International Journal of Research in Management and Business (ISSN: 2395-4329): Volume 3 Issue 1
Yang, 2010). As pointed out by Keller, Parameswaran et al. (2011), an important role played by
brand is that it empowers purchasers to distinguish a company's items or benefits and can separate
them from those of other in worldwide market where practically comparative
items/administrations are open from a far reaching of providers, the 'brand name' has turned into
an essential separating apparatus as it offers a guarantee of significant worth and quality to
consumers (Aggarwal, Sharma, Rao et al. 2013). Branding is about finding the sweet spot
between what the organization is and what their people needs (Aggarwal Sharma, Rao et al.,
2013). In this research proposal we will discover diverse relationship because of which client felt
agreeable and feels merchandise on its decision.
Brand equity is gradually prevalent as some researchers have determined that brands are
one of the supreme respected assets that a business has. Extraordinary brand equity intensities are
recognized clue to greater consumer preferences. We take variables like brand image, brand
association as independent, perceived quality as moderator, brand equity as a mediator and brand
preference as dependent variable. In first we explain these all terms one by one; brand image is
the general impression of an item held by genuine or potential customers. Brand association is
everything and attributes of brand which is profound situated in customer's mind when the brand
is discussed. Perceived quality can be characterized as the client's impression of the complete
quality or predominance of an item or service as for its arranged reason in respect to options.
Perceived quality is a perception by clients. Brand equity is an expression utilized as a part of the
promoting business which characterizes the benefit of having an outstanding brand name, in view
of the proprietor of a well-known, brand can create more money from items with that brand name
and purchasers trust that an item with a well-known name is superior to anything items with less
well-known names. Brand preference is the time when you pick a specific organization's thing or
service when you have other, comparatively similarly equally-priced and available choices. Brand
image have been taken as major contributors to brand equity (Na, Marshall et al. 1999). In
association with a brand, brand equity is used to condense all of the many assets that are part of a
brand by Caldwell and Freire (2004). It is considered to have various advantages, such as higher
levels of brand preference. The creation of brand equity is dependent on the perception of
consumers towards a brand (De Chernatony, Cottam et al. 2006) brand image are vital signs
connected to how customers perceive the brand. It has dependably been contemplated that
consumers assume a dynamic part as co constructors of brand equity. Brand preference is the
main factor that affects the brand and branding strategy. There are different tactics when firms
focus on the amplification of perceived quality because both perceive quality and brand equity are
elements that can be used to manage brand. Based on this reasoning, we consider how consumers’
judgments of perceive quality vary with different levels of brand associations and brand image.
The study also examines the various factors which influence the consumers to buy a shampoo of
particular brand and this study conducted in the hope that it will give benefits to different
service/product industries or firms.
2. Research Problem
There are a few powerful variables with regards to the customer brand preference. Among those,
brand equity is one of the essential. However, with regards to the cosmetics market, it can be
viewed as a quickly developing industry came about with the new advancements took after by the
current young shoppers. Inside the cosmetics market, shampoo products are observably
developing business sector areas. Likewise in current point of view, advertisers are tested with the

© Universal Multidisciplinary Research Institute Pvt Ltd
3
International Journal of Research in Management and Business (ISSN: 2395-4329): Volume 3 Issue 1
question of how they can be more useful in tending to shampoo products to purchasers
debilitating brand equity tool.
Set up on this market environment, three crucial components in research issue was
distinguished as "to what degree the brand image, brand association and perceived quality could
effect on customer giving brand preference"
The general purpose of the study is to test the perceived quality of brand. Specific
objectives: the sub goals included are as follows:
To examine the relational linkages between brand equity dimensions (brand image, brand
associations) and brand preferences
To identify the mediating role of brand equity
To identify the moderating role of perceived quality.
To know the most preferred shampoo brand variant of the customer
3. Background of Research
Brand Image
In present article, brand image is described as 'the client's perceptions toward a particular brand
name. According to Romaniuk and Sharp (2003) firm keeps distinctive images that change
according to a specific group, each of whom has differing sorts of encounters and contacts with
the association. (Nguyen and Leblanc, 2001). A not too bad starting stage to depict a brand image
is as a group of traits and affiliations that buyers associate with the brand name (Biel, 1992).
Brand image is as consumer view of a brand and brand associations kept in buyers' memory.
Brand image with brand associations are the enlightening centers associated with the brand hub in
memory, and contain the criticalness of the brand for shoppers.(Aaker 1991) states that brand
image could be an arrangement of association which is significant to the buyers. Exactly when a
given hub idea is inspected, the quality of the association makes sense of what diverse hubs will
be started from memory. Faircloth, Capella et al. (2001) proposed that brand equity can be
molded particularly or roundabout over and finished with brand image. Their outcomes exhibited
that brand image affects brand equity. Biel (1992) views brand equity as being driven by brand
image. Jacoby, Olson et al. (1971) direct a test look into and have observed that shoppers'
perceived quality and regards are out and out impacted by brand image. Customers' perception of
quality is essentially influenced by brand image. Richardson, Dick et al. (1994) presume that there
is a positive relationship between brand image and perceived quality.
Brand Association
Brand association surprisingly influences the information, recalling and processing, it additionally
gives a genuine point of distinction from contenders, gives a substantial reason to creates
positives feelings and attitudes about a brand (Aaker, 2012) consumers use brand associations to
help process, organize, and retrieve information in memory. A perceived positive mental image
associated with any brand is called as brand association. Good brand associations act as a barrier
in a selection of other brands (Aaker 1996) and brand association is likewise thought to be a
measurement of brand equity and can be anything which associates to the memory of a brand.
Brand association succor in the construction of brand image (Biel, 1992). Brand image contains
© Universal Multidisciplinary Research Institute Pvt Ltd
4
International Journal of Research in Management and Business (ISSN: 2395-4329): Volume 3 Issue 1
of functional and emblematic brand convictions it depends on the suggestion that purchasers
purchase a product as well as the image association of the product, for example, distinguishing
proof and association with different users of the brand. Brand associations and brand image are
found to be at the core of brand equity in most of the discussions (Aaker, 2009).
Aaker (1991) believes that brand association and brand equity are powerfully interrelated
to each other because b.a is an element that supports a brand to be evoked and proposed brand
association as a dimension of brand equity, which is tested by researchers (Yoo, Donthu et al.,
2000, Pappu and Quester, 2006, Buil, Martínez et al., 2013). Perceived quality of a brand may be
obtained from a direct experience with the brand or just brand association (Rao and Ruekert,
1994). According to Aaker (1991), (Keller 1993) brand association is whatever relates to the
brand preference. It plays an important role in building the stronger reaction in the memory of the
consumer; brand association is most obliging to provide quality which the customer perceived to
attain the organizational objectives. We mainly focus and check on the brand association in the
cosmetic sector that are represented in the form of package, rates and signal of the company, it
also helpful in increasing the brand equity, when brand equity increased then brand preference of
particular product/service is also increased.
Perceived Quality
Perceived quality is the "center" part of brand equity. Seen quality advances esteem to a brand
from numerous points of view. See quality s in the mind of the consumer. This implies measuring
quality requires chatting with customers. Quality mirrors the degree to which a product or service
meets or exceeds customer's expectations. Seen quality contrasts from objective or actual quality.
As per Aaker (1991), perceived quality can be characterized as the general perception of
customers about brilliance and quality of products or services. Aaker (1991) and Zeithaml (1988)
expressed that perceived quality turns into the valuation of customer towards the entire greatness
and product dominance or service, which is unique in relation to the genuine quality. This implies
perceived quality is a subjective valuation of consumer towards a specific product. It is extreme
for customers to sort a levelheaded administering of the quality and it is troublesome for
customers to make a sane judgment of the quality. To the extent perceived quality adds to the
advancement of brand equity as a part of the brand association by Keller (1993).
Brand image is used customers to evaluation the perceived quality of products.
(Richardson, Dick et al., 1994) define that there is a reformist relationship between brand image
and perceived quality. (Aaker, 1991) has specified that one of the significant elements of brand
equity is perceived quality and it is the crucial concept in the research to estimate brand equity.
Yoo, Donthu et al. (2000) discourses that brand equity will be amplified with the provision of
animating positive perceived quality and it is parts of brand image that leads consumers to choose
a specific brand instead of another contending brand. As characterized by Woodruff (1997)
quality is the peak significant preference of customers when they antedate their purchases.
According to Aaker (1996) one of the fundamental elements of brand equity is perceived quality
and it is a basic piece of study in assessing brand equity. As indicated by Motameni and
Shahrokhi (1998) and Yoo, Donthu et al. (2000), perceived quality is positively linked to the
brand equity. According to Jacoby, Olson et al. (1971) that lead research and uncovered that
consumers' feeling of perceived quality are impressively pompous by brand image. Seen quality
gives customers motivation to buy a brand since brands can be segregated by the perceived
quality (Pappu, Quester et al., 2005). High-perceived quality frontrunners and gives consumers a

© Universal Multidisciplinary Research Institute Pvt Ltd
5
International Journal of Research in Management and Business (ISSN: 2395-4329): Volume 3 Issue 1
seemly reason to prefer the brand (Aaker, 1991).therefore, it is recommended that the higher the
perceived quality the higher brand equity and brand preference.
Brand Equity
Researchers provide comparable definitions (Lassar, Mittal et al., 1995) compresses five vital
contemplations brand equity:
A) Refers to consumer discernments, as opposed to objective pointers
B) Is a worldwide impression of the value connected with a brand?
C) Originates from the brand name, and not just physical attributes
D) Is a relative measure that must be contrasted with important contenders?
E) Influences the money related brand equity positively
Brand equity is essential as a result of its advantages in quality demonstrating, look cost
reduction, obtaining hazard diminishment, typical power and etc. Since consumer reaction in
marketing is characterized as far as consumer perceptions and preferences ascending from
marketing mix activity (Hartman and Spiro, 2005). Brand equity in this review is thoughtfully
characterized as the general consumer reaction to the fundamental indicators of brand. Aaker
(1996) has expressed that one of the key components of brand equity is perceived quality and it is
the center build in the examination to assess brand equity. (Jacoby, Olson et al., 1971) notices that
brand equity will be expanded with the assistance of advancing positive perceived quality;
perceived quality is bits of brand that leads consumers to decision a specific brand instead of
another battling brand. In light of the previously mentioned, hypothetical interrelationship among
perceived quality, brand image brand association and brand equity has been demonstrated.
According to Aaker (1996) brand equity is affected by perceived quality and brand associations.
A high positive outcome of brand value is on brand preference. Other research investigators
(Cobb-Walgren, Ruble et al., 1995; De Chernatony, Harris et al., 2004; Buil, Martínez et al.,
2013) also agree that high brand equity results in high brand preference. An empirical
experimental proof demonstrated that brand equity could influence brand preference. Different
analysts (Cobb-Walgren, Ruble et al., 1995, Chang and Liu, 2009) called attention to that high
equity is connected with high brand preference.
Brand Preference
Brand preference is the inclination a customer holds toward a specific brand. Inclination for
accommodation, oddity, chance experiences, and buying conduct are yet specific explanations
behind redundant purchase (De Chernatony, Harris et al., 2004). Hellier, Geursen et al. (2003)
characterized brand preference as 'the degree to which the customer supports the designated
product/service giving by his or her present organization, as opposed to the designated
product/service gave by different companies in his or her thought set'. The writing prescribes that
strong brands get specific assessment furthermore higher in general preference (Keller 2009).
Customers with high brand preference would have more grounded full of feeling connection for
the brand. Mark image is characterized as client view of and preferences for a brand, as uncovered
by the many sorts of brand associations held in clients' memory. It ought to be conspicuous that,
once clients associated with a specific product or brand, they offer preference to the product. So

© Universal Multidisciplinary Research Institute Pvt Ltd
6
International Journal of Research in Management and Business (ISSN: 2395-4329): Volume 3 Issue 1
keeping in mind the end goal to make a consumer to purchase or prefer a brand they should first
be made image of the brand and exertion on holding and observing brand association. Anderson
(1983) brand associations can be formed thru direct and indirect evaluations, then again brand
associations give customers thought processes to, they comfort consumers to methodology and
save truths and initiate positive effect and intellectual worries of favorable circumstances and all
together that brand associations are specifically associated with brand preferences. Chang and Liu
(2009) said the significance of building brand equity, which gets the upside of more customer
brand preference to the firm. The review directed on the shampoo brand demonstrated a solid
relationship between brand equity and brand preference. Different scientists, as Prasad and Dev
(2000) pointed out that high brand equity is associated with high brand preference. To sum up,
brand equity is normally accepted huge giver to brand preference.
4. Conceptual Framework
Our research consists of total five variables: independent variables are Brand Image (BI) and
Brand Association (BA), dependent variable is Brand Preference (BP) in which moderated
variable is BE and mediator is perceive quality. On the basis of model and literature review
discussed, following research hypothesis can be formed:
H1: The relationship between BI & BE is positively affected
H2: The relationship between BA & BE is positively affected
H3: The relationship between BE &BP is positively affected
H4: Perceived quality moderates the relationship among BI, BA & BE
5. Methodology
Research design: descriptive research design was adopted in this. The research design is based on
primary and secondary data and primary data it is collected through a questionnaire.
Questionnaire design: basically the questionnaire was designed and separated into three parts,
part 1.2.3. Part 1 consists of indicating of brand and using of years. In part 2, the questionnaire
data and information that related to the respondents were elaborated, such as gender (male,
female), age, marital status and educational qualification. In part 3 measuring elements, which
include; brand image, brand association, perceived quality brand equity and brand preference.
Brand
Image
Brand
Associa
tion
Brand Preference
Brand
Equity
Perceived
Quality

© Universal Multidisciplinary Research Institute Pvt Ltd
7
International Journal of Research in Management and Business (ISSN: 2395-4329): Volume 3 Issue 1
Research scales were operationalizing on previous work. The response scale for the study is 5
point liker scale, anchored by 1 strongly agrees and 5 strongly disagree (Kim and Kim, 2005).
The reason for referring to their scale development studies that their scales are the most
commonly accepted. For measuring brand image a five-liker scales is adopted from Salciuviene,
Ghauri et al. (2009). Items of brand association is adopted by Kim and Kim (2005). Items that are
used for measuring perceived quality are adopted from Pappu, Quester et al. (2006). Items to
measure overall brand equity were adapted from the scale developed by Yoo, Donthu et al.
(2000). Brand preference measures were adopted from Cobb-Walgren, Ruble et al. (1995) and
Chen and Chang (2008).
Sampling: in this research, the target sector of our study is university of Sargodha. The target
population of the study all department of UOS the target population covers all the existing
students who are study in university of Sargodha. 250 potential respondents geographically spread
among the University of Sargodha students were used as a sampling size and in order to choose
the potential respondents in this survey. Convenience sampling is used to collect the data from the
customers of cosmetic sector in different brand of shampoo. There are large size companies in
Pakistan of shampoo. There were five constructs in the study brand image, brand association,
brand equity, brand preference, and perceived quality.
Administration of survey: in this research, the drop-off study strategies have been utilized. The
copies of self-administered survey questionnaires have been given to the respondents with a
specific end goal to ensure the secrecy and privacy aspects of members in the review. Before the
actual study being led, a pilot test with 50 potential respondents was done. The pilot test was
completed with the reason to guarantee the dependability of the scale measurement as well as the
quality of the questionnaire. In view of the input from the pilot test contemplate; a set
arrangement of survey was produced. Out of 300 questionnaires that have been circulated in the
real overview, 250 surveys were assembled. A section from 50 questionnaires that were
unfinished for the reason of either the respondents were not willing to collaborate or they didn't
consider the review important.
6. Results
We used SPSS 21 software for data analysis. In SPSS 21, we computed frequencies, descriptive
analysis, reliability and validity of test and also in AMOS, correlation and at the end we ran
regression, model summary, ANOVA and coefficient analysis.
Demographic profile analysis: Respondents of this survey consist of 55.2 percent male and 44.8
percent female, the age trend of the participants is as follows:
Between the age of 18-24 years old group has the highest respondents ( 61.2 percent) that is
followed by the age group of 25-34 years old ( 34.4 percent), 35-44 ( 3.6 percent), 45 years old or
above ( 8 percent) and finally the age group of 45 years old and above ( 8 percent) had the lowest
participant amongst all the age groups participated in this assessment.in which (75.2 percent)
respondent are single, (24.4 percent) married and (0.8 percent) are widow/divorce. The
respondents education levels were primary (2.8 percent), secondary (0.8 percent), college (2.4
percent), university (90.4 percent), and other are (3.6 percent).

© Universal Multidisciplinary Research Institute Pvt Ltd
8
International Journal of Research in Management and Business (ISSN: 2395-4329): Volume 3 Issue 1
Model Summary
Model R R Square
Adjusted R
Square
Std. Error of the
Estimate Durbin-Watson
1 .909a .826 .821 .74324 2.002
a. Predictors: (Constant), Interaction term
b. Dependent Variable: Brand Equity
Joint correlation of all independent variables with dependent variables is 0.909. independent
variables explains 82.6% variation in dependent variables which displays significant
relationship. Adjusted R square is also presenting significant relationship.
ANOVA
Model Sum of Squares df Mean Square F Sig.
1 Regression 104.846 1 104.846 189.800 .000b
Residual 136.443 247 .552
Total 241.289 248
a. Dependent Variable: Brand Equity
b. Predictors: (Constant), Interaction term
ANOVA table is viewing significance of outcomes and indicates that variation expounded by the
model is different from variation unexplained.
Coefficients
Model
Unstandardized Coefficients
Standardized
Coefficients
t Sig. B Std. Error Beta
1 (Constant) 2.677 .102 26.324 .000
Interaction term .017 .001 .659 13.777 .000
a. Dependent Variable: Brand Equity
The value of unstandardized constant shows the value of dependent variable when our
independent variables are zero. Standardized coefficients beta indication marginal change in
dependent variable is due to each unit increase in our different independent variables. All
regression outcomes are significant at 5% level of significance which display strong relationship
between variables.
Reliability Test
According to Cavana, Delahaye et al. (2001) reliability test can be used as a measure that signals
the consistency and stability of the instruments use as a part of the review when research
estimations are made. A famous method to measure reliability is to practice the cronbach alpha.
Reliability was mainly checked using composite reliability (CR). The value of cronbach alpha
with the range of more than 0.70 is viewed as acceptable and good. CR is computed as (sum of
standardized loading)2 / [(sum of standardized loading)2 + (sum of measurement error)]. Higher
the value of CR, greater is the internal consistency and reliability in questionnaire. Results from

© Universal Multidisciplinary Research Institute Pvt Ltd
9
International Journal of Research in Management and Business (ISSN: 2395-4329): Volume 3 Issue 1
the table below show that the values of cronbach alpha are above 0.70. Based on the finding,
cronbach alpha for the construct ranged from lowest of 0.884 (brand preference) to 0.917 (brand
equity). Based on the finding, cronbach alpha for the construct ranged from lowest of 0.755
(brand preference) to 0.860 (brand association). The result determined that the mensuration scales
of the constructs were stable and consistent in mensuration the constructs.
Constructs composite reliability
Constructs Composite reliability Cronbach alpha
Brand image 0.934733 0.858
Brand association 0.91327 0.860
Brand equity 0.917552 0.828
Brand preference 0.884803 0.755
Perceived quality 0.899363 0.825
To ensure convergent validity, items loaded on their respective constructs were checked
and their loadings were greater than( 0.5) and findings revealed that brand image and brand
association positively affects brand equity and also have brand image and brand association has
strong indirect relationship through perceive quality.
Validity Test
Every estimation model is separately investigated through CFA. Not a single item was dropped
because all extracted variances were above 0.5 and in which all factor loadings are above 0.5 and
were statistically significant. Unidementionality, convergent validity, discriminant validity and
reliability of each construct with retained items were checked. Unidimensionality is the degree to
which a set of given indicators measures only and only 1 construct. The components of
Unidimensionality are ratio of chi-square to degrees of freedom, comparative fit index (CFI),
goodness of fit index (GFI), and root mean squared residual (RMR). The values of every
construct with cut off values are compared in table-1. Using multiple fitness indices is a
conservative approach. The degree to which each test item measures the same construct again
and again is called reliability or internal consistency of a measure. Composite reliability and
cronbach alpha are indicators of internal consistency. All construct reliability coefficients are
higher than threshold level of 0.6. Cronbach alpha for all latent variables is also greater than cut
off value of 0.7. Construct validity is measured through convergent and discriminant validity.
Convergent validity refers to the degree to which items of a construct that are theoretically related
are statistically related. Convergent validity is measured through NFI (normed fit index ), SFL (
standardized factor loadings ), t-values (also called critical ratio), and average variance extracted
that is the average of squared loadings. Calculates the average variance extracted (AVE) to check
the discriminate validity in our study (Fornell and Larcker 1981). The AVE for each construct
should be equal to at least (0.5) or higher., it shows that this questionnaire holds the high
discriminate validity (Batra and Sinha 2000). Ave is calculated as (sum of square standardized
loadings2) / [(sum of square standardized loadings2) + (sum of measurement error)]. Our study
obtains the CR and AVE of each variable. Table shows that all mechanisms of convergent
validity are showing good results. All AVE’s of retained items are higher as indicated in table and
values for AVE ranged from 0.59 to 0.706 that sustaining the criteria of 0.50 and the composite

© Universal Multidisciplinary Research Institute Pvt Ltd
10
International Journal of Research in Management and Business (ISSN: 2395-4329): Volume 3 Issue 1
reliability (c r) speckled from 0.755 (brand preference) to 0.860 (brand association) are greater
than ( 0.7 ) that sustaining the criteria of 0.70 which guarantee the internal validity of the
dimension model by Bagozzi and Yi (1988). All the results support the discriminant validity of
the scales it is also called divergent validity tests whether measures that are supposed to be
unrelated are statistically unrelated. One standard for adequate discriminant validity is that the
square root of AVE for a latent should be higher than correlation among all latent variables.
Highlighted figures in table are representing sq. Root of AVE. Other values in the table are
correlation coefficients among all constructs. As indicated in table, correlation coefficients are
less than square root of AVE, thus discriminant validity is achieved. All measurement models
gave an acceptable fit to the data.
Table
Construct
No of items Unidimensionality Convergent validity Reliability
Tot
al
Retai
ned
after
CFA
Chi-
squar
e/
d f
CFI
GFI
RMR
NFI
SF
L
T-
value
AV
E
CR
Alph
a
Criteria <5 >0.95 >0.95 <0.05 >0.95 >0.
5
>1.95 >0.5 >0.6 >0.7
Brand
image
5 5 3.89 0.96 0.975 0.045 0.97 0.5
1
-
0.8
0
9.6
-
29.4
0.7 0.934733
0.858
Brand
Associatio
n
5 5 4.21 0.97 0.998 0.053 0.98 0.5
4
-
0.7
8
15.6
-
19.4
0.65
8
0.91327
0.860
Brand
Equity
5 5 2.78 0.99 0.967 0.039 0.95 0.5
4
-
0.8
4
11.8
-
16.6
0.70
6
0.917552
0.828
Brand
Preference
5 5 4.52 0.98 0.985 0.049 0.99 0.6
2
-
0.9
8
15.8
-
31.1
0.60
8
0.884803
0.755
Perceived
Quality
5 5 5.1 0.97 0.995 0.008 0.94 0.5
0
-
0.6
7
14.6
-
19.3
0.59 0.899363
0.825
© Universal Multidisciplinary Research Institute Pvt Ltd
11
International Journal of Research in Management and Business (ISSN: 2395-4329): Volume 3 Issue 1
CFI=comparative fit index; GFI= goodness of fit index; RMR= root mean squared residual
NFI =normed fit index; SFL=standardized factor loadings; AVE=average variance extracted;
CR=composite reliability
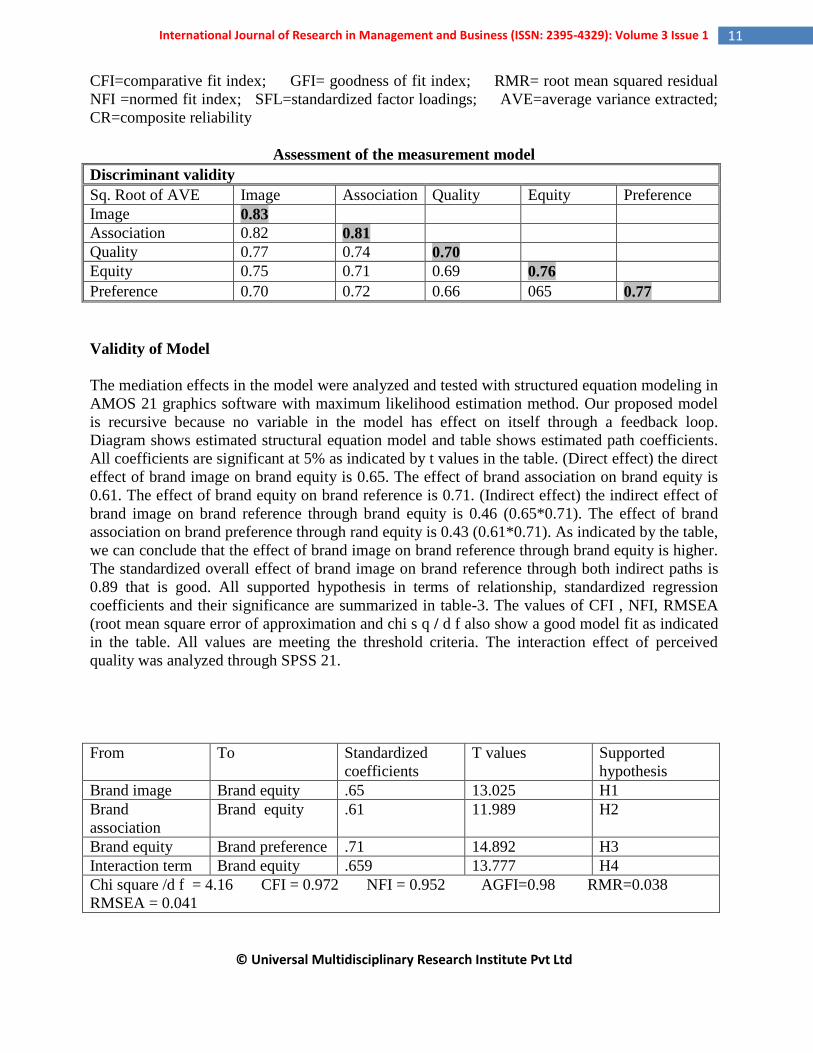
Assessment of the measurement model
Discriminant validity
Sq. Root of AVE Image Association Quality Equity Preference
Image 0.83
Association 0.82 0.81
Quality 0.77 0.74 0.70
Equity 0.75 0.71 0.69 0.76
Preference 0.70 0.72 0.66 065 0.77
Validity of Model
The mediation effects in the model were analyzed and tested with structured equation modeling in
AMOS 21 graphics software with maximum likelihood estimation method. Our proposed model
is recursive because no variable in the model has effect on itself through a feedback loop.
Diagram shows estimated structural equation model and table shows estimated path coefficients.
All coefficients are significant at 5% as indicated by t values in the table. (Direct effect) the direct
effect of brand image on brand equity is 0.65. The effect of brand association on brand equity is
0.61. The effect of brand equity on brand reference is 0.71. (Indirect effect) the indirect effect of
brand image on brand reference through brand equity is 0.46 (0.65*0.71). The effect of brand
association on brand preference through rand equity is 0.43 (0.61*0.71). As indicated by the table,
we can conclude that the effect of brand image on brand reference through brand equity is higher.
The standardized overall effect of brand image on brand reference through both indirect paths is
0.89 that is good. All supported hypothesis in terms of relationship, standardized regression
coefficients and their significance are summarized in table-3. The values of CFI , NFI, RMSEA
(root mean square error of approximation and chi s q / d f also show a good model fit as indicated
in the table. All values are meeting the threshold criteria. The interaction effect of perceived
quality was analyzed through SPSS 21.
From To Standardized
coefficients
T values Supported
hypothesis
Brand image Brand equity .65 13.025 H1
Brand
association
Brand equity .61 11.989 H2
Brand equity Brand preference .71 14.892 H3
Interaction term Brand equity .659 13.777 H4
Chi square /d f = 4.16 CFI = 0.972 NFI = 0.952 AGFI=0.98 RMR=0.038
RMSEA = 0.041

© Universal Multidisciplinary Research Institute Pvt Ltd
12
International Journal of Research in Management and Business (ISSN: 2395-4329): Volume 3 Issue 1
The fit statistics CFI & GFI (> 0.9) , AGFI (> 0.8) , RMSEA & RMR (< 0.1) were all a good
fit and the Model fit standards recommended by Hu and Bentler (1998).
Structured Model Diagram
Note: BA= brand association; BI= brand image; BE= brand equity; BP= brand preference
Figure that show the structural model with coefficient and virtually significant relationship
between variables.
7. Conclusion
Theoretical implication: as far as hypothetical implication, this study has concluded as takes after;
relationship between brand image and brand preference is mediated by brand equity; relationship
between brand association and brand preference is mediated by brand equity; relationship
between brand association and brand equity is moderated by perceived quality. Finally
relationship between brand image and brand equity is moderated by perceived quality.
Managerial implication: the result of this research has given important feedbacks which
can be used for planning distinctive strategies to attract in customers with emphasizing on brand
equity with perceived quality of the products. Marketers should to remember that there are a few
variables impact consumer's perception towards brand preference. In view of the results from this
research finding, marketers should to organize perceive quality constructs as their technique /
strategy to attract potential customers. Thus, it has been concluded that usage rate of shampoo
among the select individuals has been high and their buying behavior is also very frequent. It has

© Universal Multidisciplinary Research Institute Pvt Ltd
13
International Journal of Research in Management and Business (ISSN: 2395-4329): Volume 3 Issue 1
been seen that most of the people are aware of cosmetic shampoos rather than herbal and
medicated ones. Price, availability and packaging of the product also plays an important role in
buying the shampoo products. It has been found that most of the consumers preferred gifts, extra
quantity, discount, price off while making decision for buying the shampoos. Also, it has been
seen that various factors influence the switching behavior of the consumers like impact of
Packaging, Price rise of current brand, scheme of brands, impact of advertisement, no availability
of brand, to try new option and influence by others etc. More research is required to be done on
the magnitudes of the brand equity.
8. Limitations
The result of this research has given important feedbacks. These results had a few restrictions.
The essential confinement of this review is examining and information collection
procedure used. The sample from just in university of Sargodha Pakistan.
This study can be wired by amassed the sample size and including participants in other
Geographical zones
The current study did not inspect such factors as brand involvement, brand commitment,
brand experience and brand awareness customer loyalty. Forthcoming studies should
attention on these antecedents
Solitary limitation was that environmental and economic factors were not studied
It did not reconnoiter a longitudinal study. Forthcoming researchers could practice
longitudinal study to examine
Because of the restriction, the results and findings of the research are not competent to
"clarify why the observed examples are there". Moreover, the confinement of using
convenience sampling techniques has shown that the results of this research can't be
generalized.
9. Recommendations
Although this research has done by questionnaires, using altered settings will affect the outcomes.
Having said so for further research route it would be interesting if we do the study contain
cultural variables in multifarious settings such as cross nationals, and regional research.
This sort of research will be essential for international marketing strategies. Furthermore,
in terms of curb of generalization it would be recommended to use probability sampling
technique in forthcoming study for the reason of refining and increasing the validity and
generalization of these research outcomes. As this exploration has experienced a few
constraints, a couple of recommendations have been recommended for further research.
Psychological judgment will change after some time. In due regard, longitudinal studies,
which consistently measure a similar specimen units of population over a period of time
is prescribed to be used in the future research . Moreover, as far as limitation of
generalization, it would be recommended to utilize likelihood examining method later on
study for the reason of enhancing and improving the validity and generalization of these
examination discoveries

© Universal Multidisciplinary Research Institute Pvt Ltd
14
International Journal of Research in Management and Business (ISSN: 2395-4329): Volume 3 Issue 1
Through hypotheses testing the study exposed that brand image, brand association and
brand equity brand preference and perceived quality have a strong and significant degree
of relationship with consumer buying decision. So the inland marketers can familiarize
this information and use it in their marketing strategy and actions to satisfy customers.
Refining the quality of the products in order to generate customers towards their brands.
Using effective promotional tools to create strong brand image and brand association
within customers‟ minds. Offering better products with a correct level of component
quality and applied quality and also using attractive, quality, and packages for their
products in order to motivate the purchasing judgment of the consumers.
According to the judgments of the study perceived quality ‟ was the most influential
factor on consumer purchase decision among other elements of brand equity”. Based on
this understanding organizations could tactically plan to apportion budget over diverse
branding activities, giving preference & priority to the more influencing brand equity
elements. Also can practice more promotional tackles in order to increase the image of
brand. Finally, from all of the findings of this study brand marketers can identify that
brand image; brand association and brand perceived quality have an impact on consumer
purchase decision with their perceived quality of the product. So based on that
information, the firms can improve plan out their branding activities in the future.
References
Aaker, D. A. (1991). "Managing Brand Equity: Capitalizing on the Value of a Brand Name
(Управление капиталом бренда: повышение стоимости фирмы за счет ценности
бренда)."
Aaker, D. A. (1996). "Measuring brand equity across products and markets." California
management review 38(3): 102-120.
Aaker, D. A. (2009). Managing brand equity, Simon and Schuster.
Aaker, D. A. (2012). Building strong brands, Simon and Schuster.
Aggarwal Sharma, A., et al. (2013). "Measuring consumer-based brand equity for Indian business
schools." Journal of Marketing for Higher Education 23(2): 175-203.
Anderson, J. R. (1983). "A spreading activation theory of memory." Journal of verbal learning
and verbal behavior 22(3): 261-295.
Bagozzi, R. P. and Y. Yi (1988). "On the evaluation of structural equation models." Journal of the
Academy of Marketing Science 16(1): 74-94.
Batra, R. and I. Sinha (2000). "Consumer-level factors moderating the success of private label
brands." Journal of retailing 76(2): 175-191.
Biel, A. L. (1992). "How brand image drives brand equity." Journal of advertising research 32(6):
6-12.
Buil, I., et al. (2013). "The influence of brand equity on consumer responses." Journal of
consumer marketing 30(1): 62-74.
Caldwell, N. and J. R. Freire (2004). "The differences between branding a country, a region and a
city: Applying the Brand Box Model." The Journal of Brand Management 12(1): 50-61.
Cavana, R. Y., et al. (2001). Applied business research: Qualitative and quantitative methods,
John Wiley & Sons Australia.

© Universal Multidisciplinary Research Institute Pvt Ltd
15
International Journal of Research in Management and Business (ISSN: 2395-4329): Volume 3 Issue 1
Chang, H. H. and Y. M. Liu (2009). "The impact of brand equity on brand preference and
purchase intentions in the service industries." The Service Industries Journal 29(12): 1687-
1706.
Chen, C.-F. and Y.-Y. Chang (2008). "Airline brand equity, brand preference, and purchase
intentions—The moderating effects of switching costs." Journal of Air Transport
Management 14(1): 40-42
Cobb-Walgren, C. J., et al. (1995). "Brand equity, brand preference, and purchase intent." Journal
of advertising 24(3): 25-40.
De Chernatony, L., et al. (2006). "Communicating services brands' values internally and
externally." The Service Industries Journal 26(8): 819-836.
De Chernatony, L., et al. (2004). "Developing a brand performance measure for financial services
brands." The Service Industries Journal 24(2): 15-33.
Faircloth, J. B., et al. (2001). "The effect of brand attitude and brand image on brand equity."
Journal of Marketing Theory and Practice: 61-75.
Fornell, C. and D. F. Larcker (1981). "Evaluating structural equation models with unobservable
variables and measurement error." Journal of marketing research: 39-50.
Hartman, K. B. and R. L. Spiro (2005). "Recapturing store image in customer-based store equity:
a construct conceptualization." Journal of business research 58(8): 1112-1120.
Hellier, P. K., et al. (2003). "Customer repurchase intention: A general structural equation
model." European journal of marketing 37(11/12): 1762-1800.
Hu, L.-t. and P. M. Bentler (1998). "Fit indices in covariance structure modeling: Sensitivity to
underparameterized model misspecification." Psychological methods 3(4): 424.
Jacoby, J., et al. (1971). "Price, brand name, and product composition characteristics as
determinants of perceived quality." Journal of Applied Psychology 55(6): 570.
Keller, K. L. (1993). "Conceptualizing, measuring, and managing customer-based brand equity."
The Journal of Marketing: 1-22.
Keller, K. L. (1993). Memory retrieval factors and advertising effectiveness, Hillsdale, NJ:
Lawrence Erlbaum Associates.
Keller, K. L. (2009). "Building strong brands in a modern marketing communications
environment." Journal of marketing communications 15(2-3): 139-155.
Keller, K. L., et al. (2011). Strategic brand management: Building, measuring, and managing
brand equity, Pearson Education India.
Kim, H.-b. and W. G. Kim (2005). "The relationship between brand equity and firms’
performance in luxury hotels and chain restaurants." Tourism management 26(4): 549-
560.
Lassar, W., et al. (1995). "Measuring customer-based brand equity." Journal of consumer
marketing 12(4): 11-19.
Motameni, R. and M. Shahrokhi (1998). "Brand equity valuation: a global perspective." Journal
of Product & Brand Management 7(4): 275-290.
Na, W. B., et al. (1999). "Measuring brand power: validating a model for optimizing brand
equity." Journal of product & brand management 8(3): 170-184.
Nguyen, N. and G. Leblanc (2001). "Corporate image and corporate reputation in customers’
retention decisions in services." Journal of retailing and Consumer Services 8(4): 227-236.
Pappu, R. and P. Quester (2006). "Does customer satisfaction lead to improved brand equity? An
empirical examination of two categories of retail brands." Journal of Product & Brand
Management 15(1): 4-14.

© Universal Multidisciplinary Research Institute Pvt Ltd
16
International Journal of Research in Management and Business (ISSN: 2395-4329): Volume 3 Issue 1
Pappu, R., et al. (2005). "Consumer-based brand equity: improving the measurement-empirical
evidence." Journal of Product & Brand Management 14(3): 143-154.
Pappu, R., et al. (2006). "Consumer-based brand equity and country-of-origin relationships: Some
empirical evidence." European journal of marketing 40(5/6): 696-717.
Prasad, K. and C. S. Dev (2000). "Managing hotel brand equity: A customer-centric framework
for assessing performance." The Cornell Hotel and Restaurant Administration Quarterly
41(3): 22-24.
Rao, A. R. and R. W. Ruekert (1994). "Brand alliances as signals of product quality." Sloan
management review 36(1): 87.
Richardson, P. S., et al. (1994). "Extrinsic and intrinsic cue effects on perceptions of store brand
quality." The Journal of Marketing: 28-36.
Romaniuk, J. and B. Sharp (2003). "Measuring brand perceptions: Testing quantity and quality."
Journal of Targeting, Measurement and Analysis for Marketing 11(3): 218-229.
Salciuviene, L., et al. (2009). "Brand image perceptions across cultures: a study of symbolic and
functional associations." Advances in International Marketing 20: 177-191.
Wang, X. and Z. Yang (2010). "The effect of brand credibility on consumers’ brand purchase
intention in emerging economies: The moderating role of brand awareness and brand
image." Journal of Global Marketing 23(3): 177-188.
Woodruff, R. B. (1997). "Customer value: the next source for competitive advantage." Journal of
the Academy of Marketing Science 25(2): 139-153.
Yoo, B., et al. (2000). "An examination of selected marketing mix elements and brand equity."
Journal of the Academy of Marketing Science 28(2): 195-211.
Zeithaml, V. A. (1988). "Consumer perceptions of price, quality, and value: a means-end model
and synthesis of evidence." The Journal of Marketing: 2-22.
Appendix: The questionnaire of this study is given below.
Brand image
I think this brand is well known and prestigious.
I think this brand have a reputation for high quality.
I think this brand is fashionable and elegant.
I think this brand is number one among others brands.
The organization manufacturing this brand is trustworthy.
Brand Association

© Universal Multidisciplinary Research Institute Pvt Ltd
17
International Journal of Research in Management and Business (ISSN: 2395-4329): Volume 3 Issue 1
This particular product/brand that appeared in the media has its own personality.
This particular product/brand is different in comparison with the other competing
product/brand that appeared in the media.
I trust the company who owns the particular product/brand that appeared in the media.
This particular product/brand that appeared in the media is familiar to me.
There are reasons to buy this particular product/brand over the competing product/brand
that appeared in the media.
Perceived Quality
This Brand offers products with very good quality.
This Brand offers products with consistent quality.
This Brand offers products with consistent quality.
This Brand offers very reliable products.
This Brand offers very reliable products.
Brand Equity
Even if another brand has same features as my brand, I would still prefer to buy my brand.
Even if another brand has same features as my brand, I would still prefer to buy my brand.
Even if there is another brand as good as my brand, I would still prefer to buy my brand.
Even if another brand is similar to my brand, it still seems smarter to purchase my brand.
Using my brand adds value to my experience.
Brand Preference
I feel that this brand is appealing to me.
I prefer this brand to other Brand of its type.
I prefer this brand to other Brand of its type.
I think my preferred brand is superior to other competing brands.
I prefer my brand.