international journal of geographic information …acascipub.com/international journal of...
TRANSCRIPT
International Journal of Geographic Information System Vol. 4, No. 2, September 2017, pp. 1Available Online at
Research article
geoclassifiablebiosignature estimatorsinvasion of
Patricia
aDepartment of Environmental Health, College of Public Health. University of South Florida, Tampa, FL, USA. bDepartment of Global Health, College of Public Health. University of South Florida, Tampa, FL, USA
cDepartment of Integratived Center for Virtualization & Applied Spatial Technologies
__________________________________________Abstract
After decades of absence,
urban species
hazard if authorities do not halt its expansion over
potential breeding areas within Mediterranean
entomological surveilla
passengers flux, the
order to assess the areas of the city with the highest
criteria spatial model
reproduction
courtyards.
neighborhoods
making and interventions
International Journal of Geographic Information System Vol. 4, No. 2, September 2017, pp. 1Available Online at http://acascipub.com/Journals.php
Research article
Fuzzification of geoclassifiable
biosignature estimatorsinvasion of
Patricia Leandro
Department of Environmental Health, College of Public Health. University of South Florida, Tampa, FL, USA.
Department of Global Health, College of Public Health. University of South Florida, Tampa, FL, USA
Department of Integrative
Center for Virtualization & Applied Spatial Technologies
E-mail: [email protected], [email protected],
This work is licensed under a
__________________________________________Abstract
After decades of absence,
species - major vector of Dengue, Chikungunya, and Zika virus
authorities do not halt its expansion over
breeding areas within Mediterranean
entomological surveillance and vector source reduction programs.
passengers flux, the port city of Barcelona
order to assess the areas of the city with the highest
criteria spatial model was constructed.
reproduction, risk factor
courtyards. Results highlight
neighborhoods; being the historic centre most at risk due its seaport proximity.
making and interventions
International Journal of Geographic Information System Vol. 4, No. 2, September 2017, pp. 1
http://acascipub.com/Journals.php
ification of geoclassifiable
biosignature estimatorsinvasion of Aedes
Leandro-Reguilloa
Department of Environmental Health, College of Public Health. University of South Florida, Tampa, FL, USA.
Department of Global Health, College of Public Health. University of South Florida, Tampa, FL, USA
Department of Integrative Biology, College of Arts and Sciences
Center for Virtualization & Applied Spatial Technologies
[email protected], [email protected],
*Corresponding author. E
This work is licensed under a
__________________________________________
After decades of absence, Aedes
major vector of Dengue, Chikungunya, and Zika virus
authorities do not halt its expansion over
breeding areas within Mediterranean
nce and vector source reduction programs.
port city of Barcelona
order to assess the areas of the city with the highest
was constructed. A
risk factor geolocations: narrow streets, high population density, urban vegetation and
highlight three main risk areas, Ciutat Vella (historic centre), Sants and El Clot
; being the historic centre most at risk due its seaport proximity.
making and interventions may be enhanced by considering the u
International Journal of Geographic Information System Vol. 4, No. 2, September 2017, pp. 1-19
http://acascipub.com/Journals.php
ification of multigeoclassifiable vegetation
biosignature estimators Aedes aegypti
a, Toni Panaou
Department of Environmental Health, College of Public Health. University of South Florida, Tampa, FL, USA.
Department of Global Health, College of Public Health. University of South Florida, Tampa, FL, USA
College of Arts and Sciences
Center for Virtualization & Applied Spatial Technologies
Florida, Tampa, FL, USA.
[email protected], [email protected],
*Corresponding author. E
This work is licensed under a Creative Commons Attribution
__________________________________________
Aedes aegypti mosquito has returned
major vector of Dengue, Chikungunya, and Zika virus
authorities do not halt its expansion over
breeding areas within Mediterranean temperate
nce and vector source reduction programs.
port city of Barcelona was considered
order to assess the areas of the city with the highest
A fuzzy overlay analysis
: narrow streets, high population density, urban vegetation and
three main risk areas, Ciutat Vella (historic centre), Sants and El Clot
; being the historic centre most at risk due its seaport proximity.
be enhanced by considering the u
International Journal of Geographic Information System
http://acascipub.com/Journals.php
multi-criteria vegetation and
to predict the potential egypti in Barcelona,
Panaoub, Ryan Carney
Department of Environmental Health, College of Public Health. University of South Florida, Tampa, FL, USA.
Department of Global Health, College of Public Health. University of South Florida, Tampa, FL, USA
College of Arts and Sciences. University of South Florida, Tampa, FL, USA.
Center for Virtualization & Applied Spatial Technologies, College of Arts and Sciences
Florida, Tampa, FL, USA.
[email protected], [email protected],
*Corresponding author. E-mail:[email protected]
Creative Commons Attribution
__________________________________________
mosquito has returned
major vector of Dengue, Chikungunya, and Zika virus
authorities do not halt its expansion over this continent
temperate cities
nce and vector source reduction programs.
was considered most at risk of
order to assess the areas of the city with the highest possibility of
fuzzy overlay analysis was implemented for four
: narrow streets, high population density, urban vegetation and
three main risk areas, Ciutat Vella (historic centre), Sants and El Clot
; being the historic centre most at risk due its seaport proximity.
be enhanced by considering the u
International Journal of Geographic Information System
criteria proxy and landscape
to predict the potential in Barcelona,
Ryan Carneycd, Benjamin G. Jacob
Department of Environmental Health, College of Public Health. University of South Florida, Tampa, FL, USA.
Department of Global Health, College of Public Health. University of South Florida, Tampa, FL, USA
. University of South Florida, Tampa, FL, USA.
College of Arts and Sciences
Florida, Tampa, FL, USA.
[email protected], [email protected], [email protected]
mail:[email protected]
Creative Commons Attribution 4.0 International License
__________________________________________
mosquito has returned to European
major vector of Dengue, Chikungunya, and Zika virus - may pose a major public health
continent. Therefore, it is necessary to target
cities to improve the effectiveness of
nce and vector source reduction programs. Due to its intense commercial and
at risk of Ae. aegypti
of breeding site
was implemented for four
: narrow streets, high population density, urban vegetation and
three main risk areas, Ciutat Vella (historic centre), Sants and El Clot
; being the historic centre most at risk due its seaport proximity.
be enhanced by considering the use of multi-criteria spatial modeling
International Journal of Geographic Information System
proxy landscape
to predict the potential in Barcelona, Spain
Benjamin G. Jacob
Department of Environmental Health, College of Public Health. University of South Florida, Tampa, FL, USA.
Department of Global Health, College of Public Health. University of South Florida, Tampa, FL, USA
. University of South Florida, Tampa, FL, USA.
College of Arts and Sciences. University of South
mail:[email protected]
4.0 International License
__________________________________________
to European domains. This
may pose a major public health
Therefore, it is necessary to target
improve the effectiveness of
its intense commercial and
egypti re-introduction
eding site concentration,
was implemented for four, vector
: narrow streets, high population density, urban vegetation and
three main risk areas, Ciutat Vella (historic centre), Sants and El Clot
Public health decision
criteria spatial modeling
landscape to predict the potential
Spain
Benjamin G. Jacobb*
Department of Environmental Health, College of Public Health. University of South Florida, Tampa, FL, USA.
Department of Global Health, College of Public Health. University of South Florida, Tampa, FL, USA.
. University of South Florida, Tampa, FL, USA.
. University of South
4.0 International License.
__________________________________________
domains. This
may pose a major public health
Therefore, it is necessary to target
improve the effectiveness of
its intense commercial and
introduction. In
concentration, a multi-
vector, urban-
: narrow streets, high population density, urban vegetation and
three main risk areas, Ciutat Vella (historic centre), Sants and El Clot
Public health decision-
criteria spatial modeling
1
Department of Environmental Health, College of Public Health. University of South Florida, Tampa, FL, USA.
. University of South Florida, Tampa, FL, USA.
. University of South

International Journal of Geographic Information System Vol. 4, No. 2, September 2017, pp. 1-19 Available Online at http://acascipub.com/Journals.php
2 Copyright © acascipub.com, all rights reserved.
freely available satellite images and fuzzy logic software for predictive habitat mapping Ae. aegypti
spatial distribution patterns.
Keywords: Aedes aegypti; Barcelona; multi-criteria spatial modeling; fuzzy overlay analysis; urban
breeding sites.
__________________________________________1. Introduction
The expansion of Aedes egypti mosquitoes in Europe could pose a major public health threat on this
continent. Ae. aegypti is considered a major vector of diseases such as Yellow Fever, Dengue, Chikungunya and
Zika (Akiner et al. 2016). Current European vector control interventions and surveillance programs could be
significantly improved by implementing targeted geomorphic, predictive, Ae. aegypti habitat epidemiological,
risk models in decision making.
During the late nineteenth century until the 1950s, Yellow Fever and Dengue outbreaks were common
along the temperate Mediterranean coast, due mainly to the introduction and spread of this species from Africa
through sailing ships (Schaffner and Mathis 2014). However, post World War II, the vector mosquito
disappeared from this geographic area; an event that is not clearly explained (Akiner et al. 2016).
Currently, Europe is closely monitoring two well established populations of Ae. aegypti that appeared
in the Atlantic isle of Madeira and Turkey in 2004 and 2008 respectively (Akiner et al. 2016), areas that were
previously geographically unsuitable for the vector. Due to the intense commercial and passenger flux that
Europe maintains both internally and with the Americas, the World health Organization (WHO) and the
European Centre for Disease Prevention and Control (ECDC) have recommended the implementation of vector
control-source reduction programs and entomological surveillance throughout the continent to hamper the
vector’s expansion (ECDC 2016, WHO 2016). These actions were successfully applied in The Netherlands in
2010, after the discovery of Ae. aegypti mosquitoes that were introduced in the country through a shipment of
tires from Miami, USA (Brown et al. 2011).
However, these programs were not generally implemented in all European countries. According to the
ECDC’s known distribution map of Ae. aegypti mosquitoes in Europe in April 2017, few countries possess data
throughout all its territory, including Spain (ECDC 2017). This country is one of the European areas with
highest risk of imported cases of Zika due its elevated commercial and passenger flux from South and Central
America (Rocklöv et al. 2016). According to the Spanish Ministry of Health, from 2015 to May 2017 there were

International Journal of Geographic Information System Vol. 4, No. 2, September 2017, pp. 1-19 Available Online at http://acascipub.com/Journals.php
3 Copyright © acascipub.com, all rights reserved.
321 recorded cases of Zika virus, all imported except two cases infected within the territory via sexual
transmission (Ministerio de Sanidad, Servicios Sociales e Igualdad 2017). Since Aedes albopictus mosquitoes -
present in this country - have not yet shown effective for Zika transmission, the re-introduction of Ae. aegypti
could pose a major public health threat.
Under this scenario, prediction spatial models may analyze topographic and urban patterns for potential
breeding sites of Ae. aegypti which may be useful in decision making to detain its propagation. The use of
geographic information systems (GIS) has risen as one of the most powerful tools in vector control. High-
resolution satellite imagery and Lidar (light detection and ranging) data provide researchers with high quality
remote sensing information that combined with GIS software allow the creation of improved predictive spatial
models in rural and urban environments (Delmelle et al. 2014, Fuller et al.2010, Kolivras 2006, Troyo et al.
2008, Yoo 2014, Zou et al. 2016).
In Jacob and Novak (2016) a predictive spatial C++ model was constructed to epidemiologically
forecast, Yellow Fever case distribution employing geographically and entomologically sampled, Ae aegypti,
breeding foci, time series information for an agro-irrigated, riceland, village eco-epidemiological, ecosystem,
study site in Gulu, Uganda. Initially, a grid-stratified, panchromatic, QuickBird 0.61m, spatial resolution,
uncoalesced dataset of endmember, transmittance, land use land cover, (LULC), spectral signatures of the study
site was differentitated by visible and near-infrared, (NIR) frequency, wavelength, irradiance values. The object-
based classification algorithm employed a divergence measure to match mixed pixels (“mixels”) to a dataset of
derivative, end member, LULC spectra. A mosaiciked dataset was then employed to manage, display, serve, and
distribute, raster, time series, discontinuous data of intermittent, forest-canopied, Aedes aegypti, oviposition,
capture point, larval habitat georeferenced, geolocations along the peripheral, riceland, forest-canopied,
interface corridor. A new mosaiciked dataset was created as an empty container in the geodatabase cyber-
environment with default properties which was subsequently added to the raster dataset. Thereafter, the virus
data was cartographically illustratable as non-mixelated, riceland, agro-village, non-homogeneous, gridded,
LULC eco-zones (e.g., sparsely shaded, pre-flooded, densely canopied, post-tillering) within a supervised
classification matrix in ArcGIS. Interfaces of the geoclassified landscape were noted. Non-normalized,
geometric, seasonal, case distribution data was articulated from various spatial perpsectives (e.g., iterative
Bayesian). The models took inputs from table file in the geodatabase which subsequently imput information of
yearly population and yellow fever cases from 1990 to 2012. Log-likelihood functions were also generated in
PROC REG for each geosampled, diagnostic, time series, Ae.aegypti endmember, sub-mixel, geoclassified,

International Journal of Geographic Information System Vol. 4, No. 2, September 2017, pp. 1-19 Available Online at http://acascipub.com/Journals.php
4 Copyright © acascipub.com, all rights reserved.
LULC-specified, visible and NIR, explantorial regressor while the joint log-likelihood function was
exponentially logrithmically quantitated.
Spatial autoregressive moving average models were then extended to autoregressive, integrated,
moving average, models in PROC ARIMA for conducting, observation-driven, sub-mixel, endmember
modelling of any non-Gaussian, non-stationary, time series, Ae aegypti geosampled, count variables. A
negative binomial, mean model fit was compared to that of a Bayesian Gaussian fit employing Box-Cox
transformed data. For the Gaussian the posterior distributions appeared to be platykurtic. The logarithm of the
posterior density was calculated. Geospatial outliers were teased out in the residual plots. The normalized modes
were validated employing a Monte Carlo simulation. Subsequently, the Ae. aegypti data was eco-
epidemiologically forecasted in C++ employing a stochastic-dynamic, random, weighted matrix. The model
data included, LULC and meteorologically-derived, probabilistic, discrete, integer values which then were
employed to prognosticate population growth and number of case occurrences to 2020 in C++ for the Gulu
study site.
Ae. aegypti mosquito is highly adapted to urban milieus; it is able to breed in small containers, vases,
flower pot dishes, tree holes, rock pools, street and patio drains, etc. (Schaffner and Mathis 2014). Therefore,
potential breeding sites in Mediterranean cities will be characterized by three main variables: narrow streets,
high dense populated neighborhoods, urban vegetation and the presence of courtyards or patios within building
blocks. Barcelona is a large coastal metropolitan area that possesses one of the highest commercial and travelers
flux of the Mediterranean Sea, is characterized by the Cerda’s courtyard blocks typology (Figure 1), which is
featured in large parts of the city (Urbano 2016).
Figure 1: Cerda’s courtyard block typology with urban vegetation, narrow streets and high dense populated neighborhoods in Barcelona, Spain. Source: Google Earth 2017.

International Journal of Geographic Information System Vol. 4, No. 2, September 2017, pp. 1-19 Available Online at http://acascipub.com/Journals.php
5 Copyright © acascipub.com, all rights reserved.
This study develops a multi-criteria spatial model that displays areas with the highest breeding
potential for Ae. aegypti in Barcelona. The model will help us to predict future spatial-temporal distribution of
this species throughout the city especially if we consider its re-introduction via maritime traffic (Figure 2)
during suitable months for vector reproduction (June, July and August) (Rocklöv et al. 2016).
Figure 2: Port of Barcelona. Source: Google Earth 2017.
B. Materials and methods
B.1. Resources
Georeferenced datasets employed in this research were: sub-parcel cartographic maps for four districts of the
Barcelona: Ciutat Vella, L’Example, Sants-Montjuic and Sant Martí (Figure 3); released by the City Plan
Department of the Barcelona City Council in 2017.

International Journal of Geographic Information System Vol. 4, No. 2, September 2017, pp. 1-19 Available Online at http://acascipub.com/Journals.php
6 Copyright © acascipub.com, all rights reserved.
Figure 3: Districts of interest within the street network map of Barcelona: (1) Ciutat Vella, (2) Example, (3) Sants-Montjuic and (4) Sant Marti.
Multispectral band Sentinel-2 satellite imagery with 10 m of size resolution and dated on 2017-06-22
was obtained from the European Spatial Agency (ESA 2017). Lidar data was also obtained from the Geological
and Cartographic Institute of Catalonia (2017). Lidar points were distributed in LAS 1.2 files containing blocks
of 2 x 2 km and with a minimum density of 1.5 points/m2. The blocks obtained for this work are shown in
Figure 4.

International Journal of Geographic Information System Vol. 4, No. 2, September 2017, pp. 1-19 Available Online at http://acascipub.com/Journals.php
7 Copyright © acascipub.com, all rights reserved.
Figure 4: Gridded map depicting Lidar data blocks used in this study.
B.2. Density and NDVI raster maps
For this study, a multi-criteria spatial modelling and the fuzzy overlay function was adopted to create a
distribution map of potential, urban, breeding sites, areas for Ae. aegypti in four districts of Barcelona. Although
the overlay analysis method has been used in decision making mainly for site selection and suitability projects
(Esri 2016, Baidya et al. 2014), the objective of this work was to employ this methodology as a useful tool in
vector control-source reduction programs and entomological surveillance. The general process followed for the
overlay analysis is graphically explained in Figure 5.
Figure 5: Flow chart for fuzzy overlay analysis

International Journal of Geographic Information System Vol. 4, No. 2, September 2017, pp. 1Available Online at
To perform an overlay analysis it is necessary to measure a variety of
Following the breeding pattern of this mosquito,
areas were identified as potential breeding sites: drains in narrow streets, courtyards within building blocks
population density
First, three
Barcelona City Council
density tool, used
a circumference with radius
building density
within a circum
Figure 6: Density
International Journal of Geographic Information System Vol. 4, No. 2, September 2017, pp. 1Available Online at http://acascipub.com/Journals.php
To perform an overlay analysis it is necessary to measure a variety of
Following the breeding pattern of this mosquito,
were identified as potential breeding sites: drains in narrow streets, courtyards within building blocks
population density and vegetation
First, three raster
Barcelona City Council:
density tool, used to generate the
a circumference with radius
building density, geoclassified,
within a circumference with radius
Density maps process
International Journal of Geographic Information System Vol. 4, No. 2, September 2017, pp. 1
http://acascipub.com/Journals.php
To perform an overlay analysis it is necessary to measure a variety of
Following the breeding pattern of this mosquito,
were identified as potential breeding sites: drains in narrow streets, courtyards within building blocks
and vegetation. Accordingly,
raster density maps were created
: street network density, courtyards density
to generate the road density map,
a circumference with radius = x shaped around the cell
geoclassified, LULC
ference with radius = x shaped around the cell.
process and fuzzification
International Journal of Geographic Information System Vol. 4, No. 2, September 2017, pp. 1-19
http://acascipub.com/Journals.php
To perform an overlay analysis it is necessary to measure a variety of
Following the breeding pattern of this mosquito, four
were identified as potential breeding sites: drains in narrow streets, courtyards within building blocks
. Accordingly, four
maps were created
network density, courtyards density
road density map, yielded
shaped around the cell
maps, featured
x shaped around the cell.
and fuzzification.
International Journal of Geographic Information System
http://acascipub.com/Journals.php
To perform an overlay analysis it is necessary to measure a variety of
four urban LULC
were identified as potential breeding sites: drains in narrow streets, courtyards within building blocks
four raster maps were developed
maps were created based on cartographic information
network density, courtyards density
yielded the number
shaped around the cell. Point density tool, used
featured the number of points
x shaped around the cell.
International Journal of Geographic Information System
To perform an overlay analysis it is necessary to measure a variety of
LULC characteristics of populated metropolitan
were identified as potential breeding sites: drains in narrow streets, courtyards within building blocks
raster maps were developed
cartographic information
network density, courtyards density and building
the number of polylines
. Point density tool, used to create
of points (obtained from polygons) included
International Journal of Geographic Information System
To perform an overlay analysis it is necessary to measure a variety of inputs (www.esri.com
characteristics of populated metropolitan
were identified as potential breeding sites: drains in narrow streets, courtyards within building blocks
using ArcMap 10.5
cartographic information obtained from the
building density (see
of polylines per unit area that contain
to create courtyards density and
(obtained from polygons) included
(www.esri.com
characteristics of populated metropolitan
were identified as potential breeding sites: drains in narrow streets, courtyards within building blocks
ap 10.5.
obtained from the
see Figure 6). Line
rea that contained
courtyards density and
(obtained from polygons) included
8
(www.esri.com).
characteristics of populated metropolitan
were identified as potential breeding sites: drains in narrow streets, courtyards within building blocks,
obtained from the
. Line
ed
courtyards density and
(obtained from polygons) included

International Journal of Geographic Information System Vol. 4, No. 2, September 2017, pp. 1-19 Available Online at http://acascipub.com/Journals.php
9 Copyright © acascipub.com, all rights reserved.
Finally, a normalized difference vegetation index (NDVI) map of Barcelona was generated through
near-infrared NIR light and visible (Red) spectral bands included within the composite raster image obtained
from Sentinel-2 multispectral bands. The NDVI is a simple graphical indicator that can be employed to analyze
remote sensing measurements, typically but not necessarily from a space platform, and assess whether the target
being observed contains live green vegetation or not (www.esri.com). The appeal of NDVI is its simplicity and
its relationship either empirically or theoretically to biophysical LULC variables (Bannari et al.1995). NDVI's
have been proven to be well correlated with various vegetation parameters such as green biomass (Tucker et al.
1986), chlorophyll concentration (Buschmann and Nagel 1993), leaf area index (LAI) (Asrar et al. 1984), foliar
loss and damage (Olgemann 1990), photosynthetic activity (Sellers 1985) and carbon fluxes (Tucker et al.
1986).
The NDVI is a widely used vegetation index in arboviral mosquito epidemiology (Jacob et al. 2009,
Brown et al. 2008, Cooke et al. 2006, Kunkel and Novak 2005, Ward et al. 2004, Backenson et al. 2002,
Brownstein et al. 2002, Linthicum et al. 1987). For example, Brown et al. (2008) employed canonical
correlation analyses to determine if a significant relationship existed between NDVI, disease/water stress index
and distance to water and four local West Nile Virus (WNV) competent vectors (Culex. pipiens, Culex.
restuans, Culex. salinarius, and Ae. vexans). Their model determined a significant relationship existed between
the sampled explanatory predictor covariates and the sampled mosquito habitats (0.93, P=0.03). The final model
outputs explained 86% of the variance in the environmental and mosquito measures. Diuk-Wasser et al. (2006)
constructed regression models to predict high and low adult mosquito abundance sites for determining arboviral
activity in Fairfield County, Connecticut USA. The best predictive models included non-forested areas for Cx.
pipiens, surface water and distance to estuaries for Cx. salinarius, surface water and grasslands/agriculture for
Ae. vexans, distance to palustrine habitats for Culiseta melanura, and, seasonal difference in the NDVI
parameters. The best models included non-forested, grid-strtaified LULC areas for Cx. pipiens, surface water
and distance to estuaries for Cx. salinarius, surface water and grasslands/agriculture for optimally quantitating
Ae. vexans and seasonal difference in the NDVI and distance to palustrine habitats for Cs. melanura.
The equation used to generate the NDVI map of the Barcelona study regions was:
. Results obtained from this formula were employed to provide a discrete integer value per raster cell that ranges
from -1 to +1. No deduced, vegetation, grid-stratified, LULC raster cell rendered values close to zero,
meanwhile vegetation areas values will approach to +1.

International Journal of Geographic Information System Vol. 4, No. 2, September 2017, pp. 1Available Online at
B.3. Fuzzy
Since
and homogenization of these values
for overlay analysis was implemented through the fuzzy membership process and fuzzy overlay
logic is a form of
be employed to handle the concept of partial truth, where the truth value may range between completely true
and completely
The
finite set X
A =
where μA(x
In every raster map, transformed values of each
linear Fuzzy M
certainty that the
Figure 7: Variations of the fuzzy linear membership function
Once all
Fuzzy Overlay
georeferenceable
multiple variable
the FuzzyOr
fuzzyOrValue = max(arg1, ..., argn)
International Journal of Geographic Information System Vol. 4, No. 2, September 2017, pp. 1Available Online at http://acascipub.com/Journals.php
. Fuzzy overlay methodology
Since the four raster map
and homogenization of these values
for overlay analysis was implemented through the fuzzy membership process and fuzzy overlay
is a form of many-valued logic
employed to handle the concept of partial truth, where the truth value may range between completely true
and completely false (Novák
The fuzzy logic
X where the fuzzy set equation
A = μA (x1) / x1 +
(xi) / xi was the membership value to fuzzy set
In every raster map, transformed values of each
linear Fuzzy Membership
certainty that the cell was in
Variations of the fuzzy linear membership function
Once all four set explanative
Fuzzy Overlay not only analyze
georeferenceable inputs; the
variable inputs.
Or overlay function
fuzzyOrValue = max(arg1, ..., argn)
International Journal of Geographic Information System Vol. 4, No. 2, September 2017, pp. 1
http://acascipub.com/Journals.php
overlay methodology
raster map possessed
and homogenization of these values in order to develop the final multi
for overlay analysis was implemented through the fuzzy membership process and fuzzy overlay
valued logic in which th
employed to handle the concept of partial truth, where the truth value may range between completely true
Novák et al. 1999).
defined the possibility (not probability) that a value is in the
fuzzy set equation
+ μA (x2) / x2 +...+
was the membership value to fuzzy set
In every raster map, transformed values of each
embership function, (i.e.,
was in the raster data
Variations of the fuzzy linear membership function
set explanative
not only analyzed the possibility that certain
; the overlay analysis also
inputs. To determine the area
function was performed
fuzzyOrValue = max(arg1, ..., argn)
International Journal of Geographic Information System Vol. 4, No. 2, September 2017, pp. 1-19
http://acascipub.com/Journals.php
overlay methodology
possessed different
in order to develop the final multi
for overlay analysis was implemented through the fuzzy membership process and fuzzy overlay
in which the truth values
employed to handle the concept of partial truth, where the truth value may range between completely true
et al. 1999).
the possibility (not probability) that a value is in the
fuzzy set equation A on X was expressed as following:
+...+μA (xn) / xn =
was the membership value to fuzzy set
In every raster map, transformed values of each
i.e., fuzzification process
raster dataset and 0 indicated certainty
Variations of the fuzzy linear membership function
set explanative values were homogeni
the possibility that certain
analysis also asse
the areas with the
was performed. This function follow
fuzzyOrValue = max(arg1, ..., argn)
International Journal of Geographic Information System
http://acascipub.com/Journals.php
different scale values, it was necessary
in order to develop the final multi
for overlay analysis was implemented through the fuzzy membership process and fuzzy overlay
truth values of variables may be any real number
employed to handle the concept of partial truth, where the truth value may range between completely true
the possibility (not probability) that a value is in the
s expressed as following:
= μA(xi) / xi ,
was the membership value to fuzzy set A for xi (see
In every raster map, transformed values of each raster cell
fuzzification process) which
indicated certainty
Variations of the fuzzy linear membership function.
values were homogenized, the
the possibility that certain data
assessed the relationships existing among the memberships of
with the maximum values
. This function followed
International Journal of Geographic Information System
, it was necessary
in order to develop the final multi-criteria map
for overlay analysis was implemented through the fuzzy membership process and fuzzy overlay
of variables may be any real number
employed to handle the concept of partial truth, where the truth value may range between completely true
the possibility (not probability) that a value is in the
s expressed as following:
(see Kainz W. n.d.
cell, w
which ranged from 0 to 1
indicated certainty that the cell
ed, the Fuzzy Overlay function was run.
data feature attributes
the relationships existing among the memberships of
maximum values of membership in all
ed the equation:
International Journal of Geographic Information System
, it was necessary to conduct a
criteria map. Therefore, t
for overlay analysis was implemented through the fuzzy membership process and fuzzy overlay
of variables may be any real number
employed to handle the concept of partial truth, where the truth value may range between completely true
the possibility (not probability) that a value is in the raster data
Kainz W. n.d.).
was defined by the
from 0 to 1. The value 1 indicate
cell was not in the set (Figure
Fuzzy Overlay function was run.
attributes appear
the relationships existing among the memberships of
of membership in all
the equation:
10
to conduct a transformation
Therefore, the fuzzy logic
for overlay analysis was implemented through the fuzzy membership process and fuzzy overlay analysis. Fuzzy
of variables may be any real number which may
employed to handle the concept of partial truth, where the truth value may range between completely true
raster dataset employing
by the ArcMap
he value 1 indicate
s not in the set (Figure 7
Fuzzy Overlay function was run. The
appeared in multiple
the relationships existing among the memberships of
of membership in all four criteria sets
10
transformation
he fuzzy logic
uzzy
which may
employed to handle the concept of partial truth, where the truth value may range between completely true
employing a
ap
he value 1 indicated
7).
The
multiple
the relationships existing among the memberships of
criteria sets

International Journal of Geographic Information System Vol. 4, No. 2, September 2017, pp. 1-19 Available Online at http://acascipub.com/Journals.php
11 Copyright © acascipub.com, all rights reserved.
Thereafter, Lidar cloud points were employed to create a digital elevation model (DEM) slope
coefficients and contour lines from ground class 2 data in order to build a the final 3D model in ArcScene 10.5.
Automated generation of drainage networks has become increasingly popular with the use of GIS and
availability of digital elevation models (DEMs) (www.esri.com). These models account for topographic
variability and their control over soil moisture heterogeneity and runoff within a shed. Jacob et al. (2010)
evaluated environmental factors such as elevation range to determine human Eastern Equine Encephilitis Virus
(EEEV) risk in Tuskegee, Alabama. The model yielded several catchment eco-hydrological explanators
including percent surface saturation and total surface runoff for identification of potential productive Culex
erracticus aquatic larval habitats, a mosquito vector of EEEV. Results of the DEM analyses indicated a
statistically significant inverse linear relationship between total sampled mosquito data and elevation (R2 = -
.4262; p < .0001), with a standard deviation (SD) of 10.46, and total sampled bird data and elevation (R2 = -
.5111; p < .0001), with a SD of 22.97. DEM statistics also indicated a significant inverse linear relationship
between total sampled Cx. erracticus data and elevation (R2 = -.4711; p < .0001), with a SD of 11.16. Here we
combined the resulting Fuzzy Overlay DEM with the topography of the Barcelona study site.
3. Results and Conclusions
In this work fuzzified maps detailed potential Ae. aegypti breeding sites areas for each predictor
variable tested within neighbourhoods geolocated nearby seaports in Barcelona. Since the flight range of these
species is limited, an average of 400m according to WHO (2017), density value was considered a suitable
parameter in forecasting mosquito habitat distribution. The building density map located zones that possessed an
elevated geoclassifiable, LULC built area. Using these variables as an indicator of population density in mixed
use districts in Barcelona, the fuzzified building density map revealed that the historic centre and west area have
a possible high population density of potential habitats (value=1) (Figure 8).
The courtyard or patio density map revealed the distribution and concentration of this Mediterranean
feature along our area of study. Since it was chosen as an indicator of location of small containers, vases, flower
pot dishes and patio drains, the fuzzified patio density LULC map located the possible accumulation of these
potential breeding sites. We observed that the possible highest density of potential habitat occurs mainly in the
first mayor development of Barcelona (Figure 9), characterized by Cerda’s courtyard blocks typology (see
Urbano, 2016).

International Journal of Geographic Information System Vol. 4, No. 2, September 2017, pp. 1-19 Available Online at http://acascipub.com/Journals.php
12 Copyright © acascipub.com, all rights reserved.
Our third variable, road density, was selected as a predictive indicator of narrow streets location in
Barcelona. Road drains geolocated along these usually shaded and low motor traffic streets are suitable breeding
habitats for Ae. aegypti mosquitoes. The fuzzified road density map revealed the possibility of highest
concentration of narrow roads mainly within the historic centre (Figure 10).
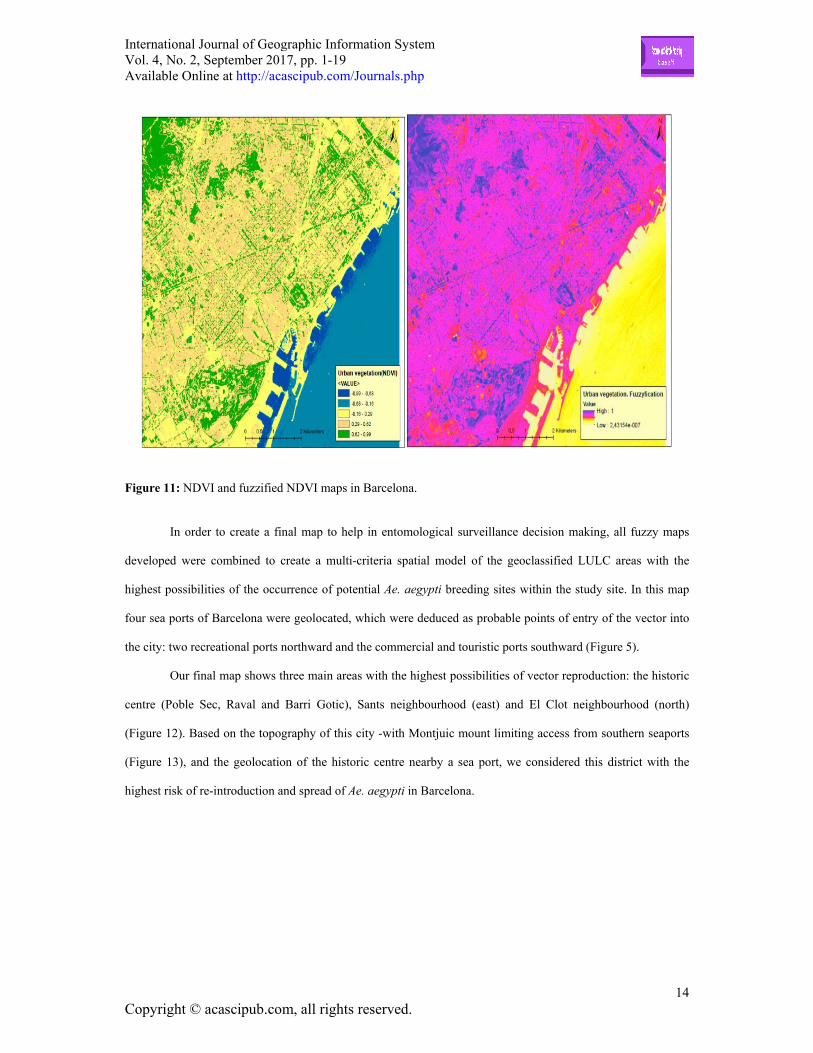
The last urban explanatory variable for mosquito reproduction assessed in this study was urban LULC
vegetation. This included not only urban parks but also road vegetation such as bushes and trees. The NDVI
map geolocated these areas and the fuzzified NDVI map revealed the possibility of urban geoclassified LULC
vegetation in Barcelona. The mayor concentrations of urban green areas are Montjuic – just in front the
commercial port- and Ciutadella Park – nearby the historic centre (see Figure 11).
Figure 8: Building density and building density fuzzification maps in selected districts of Barcelona.

International Journal of Geographic Information System Vol. 4, No. 2, September 2017, pp. 1-19 Available Online at http://acascipub.com/Journals.php
13 Copyright © acascipub.com, all rights reserved.
Figure 9: Courtyard-patio density and courtyard-patio density fuzzification maps in selected districts of Barcelona.
Figure 10: Road density and road density fuzzification maps in Barcelona.
International Journal of Geographic Information System Vol. 4, No. 2, September 2017, pp. 1-19 Available Online at http://acascipub.com/Journals.php
14 Copyright © acascipub.com, all rights reserved.
Figure 11: NDVI and fuzzified NDVI maps in Barcelona.
In order to create a final map to help in entomological surveillance decision making, all fuzzy maps
developed were combined to create a multi-criteria spatial model of the geoclassified LULC areas with the
highest possibilities of the occurrence of potential Ae. aegypti breeding sites within the study site. In this map
four sea ports of Barcelona were geolocated, which were deduced as probable points of entry of the vector into
the city: two recreational ports northward and the commercial and touristic ports southward (Figure 5).
Our final map shows three main areas with the highest possibilities of vector reproduction: the historic
centre (Poble Sec, Raval and Barri Gotic), Sants neighbourhood (east) and El Clot neighbourhood (north)
(Figure 12). Based on the topography of this city -with Montjuic mount limiting access from southern seaports
(Figure 13), and the geolocation of the historic centre nearby a sea port, we considered this district with the
highest risk of re-introduction and spread of Ae. aegypti in Barcelona.

International Journal of Geographic Information System Vol. 4, No. 2, September 2017, pp. 1-19 Available Online at http://acascipub.com/Journals.php
15 Copyright © acascipub.com, all rights reserved.
Figure 12: Potential Ae. aegypti breeding sites (1. historic centre, 2. Sants, 3. El Clot) and seaports as probable vector re-introduction.
Figure 13: Port of Barcelona 3D map: potential Ae. aegypti breeding sites and elevation.

International Journal of Geographic Information System Vol. 4, No. 2, September 2017, pp. 1-19 Available Online at http://acascipub.com/Journals.php
16 Copyright © acascipub.com, all rights reserved.
In this work we employed a multi-criteria spatial modelling in assessing a future possible scenario ( e.g.,
geolocations of breeding hotspots) : the risk of distribution and infection after a possible re-introduction of Ae.
aegypti mosquitoes into a georeferenceable geolocation in Barcelona; an area where currently imported cases of
Zika virus occur but no suitable vector for its transmission. We calculated fuzzy scores for these layers
employing ArcGIS and produced overlays where the analysis determined the risk due to the breeding potential
of Ae. aegypti based on numerous datasets,( i.e. a multi-criteria overlay investigation). The fuzzy overlay
combined all possible layers (e.g., NDVI), influencing the Ae aegypti breeding foci by analyzing the spatial
associations between urban habitat parameters. We were able to determine if Ae. aegypti landed via maritime
traffic that they could possibly first breed and spread within the historic centre, and possibly create a risk of Zika
virus transmission in this area. Consequently, we recommend the implementation of entomological surveillance
and vector source reduction programs in this district.
Public health interventions for arboviral infection processes can be enhanced by remotely targeting efforts
and resources in specific geoclassified LULC risk areas. We recommend the use of GIS multi-criteria spatial
modelling, and the fuzzy overlay function, for the prediction of Ae. aegypti spatial distribution. Developing
countries, where resources are limited, will particularly benefit from GIS methodologies not only for
cartographically representing rural LULC areas but also in highly dense, urban, geoclassifiable, LULC areas and
growing cities, where ento-ecological, bio-geographical and urban factors overlap in many different ways. The
spatial, epidemiological, GIS, forecast modelling of Ae. aegypti distribution should be based on a combination
of LULC variables that may influence the prevalence and incidence of arboviral diseases. In doing so public
health professionals may better understand potential intervention sites which can aid in designing more effective
vector control interventions and surveillance programs.
References
Akiner, M.M., Demirci, B., Babuadze, G., Robert, V. and Schaffner, F., 2016. Spread of the invasive
mosquitoes aedes aegypti and aedes albopictus in the black sea region increases risk of chikungunya,
dengue, and zika outbreaks in Europe. PLoS Neglected Tropical Diseases, 10(4).
doi:10.1371/journal.pntd.0004664
Asrar, G., Fuchs, M., Kanemasu, E.T. and Hatfield, J.L., 1984. Estimating absorbed photosynthetic radiation
and leaf area index from spectral reflectance in wheat. Agron J., 76, 300-306.
International Journal of Geographic Information System Vol. 4, No. 2, September 2017, pp. 1-19 Available Online at http://acascipub.com/Journals.php
17 Copyright © acascipub.com, all rights reserved.
Backenson PB, et al., 2002. Mapping of West Nile virus risk in the Northeast United States using multi-temporal
meteorological satellite data. New Zealand: Rigby J, Skelly C and Whigham PA.
Baidya, P., Chutia, D., Sudhakar, S., Goswami, C., Goswami, J., Saikhom, V., Singh, P. and Sarma, K., 2014.
Effectiveness of Fuzzy Overlay Function for Multi-Criteria Spatial Modeling—A Case Study on
Preparation of Land Resources Map for Mawsynram Block of East Khasi Hills District of Meghalaya,
India. Journal of Geographic Information System, 6, 605-612.
Bannari, A., Morin, D., Bonn, F. and Huete, A. R.,1995. A review of vegetation indices, Remote Sensing
Reviews, 13(1), 95-120.
Barcelona City Council, 2017. Cartobcn [online]. City Plan Department. Available from:
http://w20.bcn.cat/cartobcn/default.aspx?lang=es [Accessed 17 June 2017].
Brown, H.E., Diuk-Wasser, M.A., Guan, Y., Caskey, S. and Fish D, 2008. Comparison of three satellite sensors
at three spatial scales to predict larval mosquito presence in Connecticut wetlands. Remote Sens. Environ.
112, 2301-2308.
Brown, J.E., Scholte, E., Dik, M., Den Hartog, W., Beeuwkes, J and Powell, J. R., 2011. Aedes aegypti
mosquitoes imported into the Netherlands, 2010. Emerging Infectious Diseases, 17, 2335-2337.
Brownstein, J.S., Rosen, H., Purdy, D., Miller, J.R., Merlino, M., Mostashari, F. and Fish D, 2002. Spatial
analysis of West Nile virus: rapid risk assessment of an introduced vector-borne zoonosis. Vector Borne
& Zoonotic Diseases. 2,157-164
Buschmann, C. and Nagel, E., 1993. In vivo spectroscopy and internal optics of leaves as basis for remote
sensing of vegetation. Int J Remote Sens., 14:711-722.
Cooke, W.H. III, Grala, K. and Wallis, R.C., 2006. Avian GIS models signal human risk for West Nile virus in
Mississippi. Int. J. Health Geograph. 5, 36
Delmelle, E., Dony, C., Casas, I., Jia, M., and Tang, W., 2014. Visualizing the impact of space-time
uncertainties on dengue fever patterns. International Journal of Geographical Information Science
[online], 28(5). Available from: http://dx.doi.org/10.1080/13658816.2013.871285
Diuk-Wasser, M.A., Brown, H.E., Andreadis, T.G., Fish, D., 2006. Modelling the spatial distribution of
mosquito vectors for West Nile virus in Connecticut, USA. Vector Borne Zoonotic Dis, 6(3), 283-95.
Esri, 2016. Overlay analysis approaches [online]. Available from:
https://desktop.arcgis.com/en/arcmap/10.4/tools/spatial-analyst-toolbox/overlay-analysis-approaches.htm
[Accessed 17 June 2017].

International Journal of Geographic Information System Vol. 4, No. 2, September 2017, pp. 1-19 Available Online at http://acascipub.com/Journals.php
18 Copyright © acascipub.com, all rights reserved.
ESA, 2017. Copernicus Open Access Hub. Available from: https://scihub.copernicus.eu/dhus/#/home [Accessed
17 June 2017].
European Centre for Disease Prevention and Control, 2016. Zika virus disease epidemic: preparedness planning
guide for diseases transmitted by Aedes aegypti and Aedes albopictus. ECDC, Stockholm. Available from:
https://ecdc.europa.eu/sites/portal/files/media/en/publications/Publications/zika-preparedness-planning-
guide-aedes-mosquitoes.pdf
European Centre for Disease Prevention and Control, 2017. Mosquito maps [online]. Available from:
http://ecdc.europa.eu/en/healthtopics/vectors/vector-maps/Pages/VBORNET_maps.aspx [Accessed 11
June 2017].
Fuller, D.O., Troyo, A., Calderón-Arguedas, O. and Beier, J.C., 2010. Dengue vector (Aedes aegypti) larval
habitats in an urban environment of Costa Rica analyzed with ASTER and QuickBird imagery.
International Journal of Remote Sensing [online], 31 (1). Available from:
http://dx.doi.org/10.1080/01431160902865756
Geological and Cartographic Institute of Catalonia, 2017. Datos lidar [online]. Available from:
http://www.icgc.cat/es/Administracion-y-empresa/Descargas/ Elevaciones/Datos-lidar [Accessed 17
June 2017].
Jacob, B.G. and Novak, R.J., 2016. Pernicious quasi-normal non-monotonic Poissionian non-negativity
constraints for optimally rectifying incompatibilistic endeogeneity in sub-meter resolution pseudo-
Euclidean regression space employing analogs of the Pythagorean theorem and parallelogram laws for
semi-arameterically demarcating non-trivial land cover wavelength filters and time series impulse-
response metrological functions in an invertible Hermitian transjugate matrix while consolidating
synergistic semi-logarithmic non- ordinate axis-scaled covariances in C++ for forecasting episodical
yellow fever sylvatic, case distributions in an eco-georeferenceable irrigated riceland complex in Gulu,
Uganda. Journal of Applied Mathematics and Statistics, (in press).
Jacob, B.G, Burkett-Cadena, N. D., Luvall, J.C., Parcak, S.H., McClure, C.J.W., Estep, L.K., Hill, G.E., Cupp,
E.W., Novak R.J. and Unnasch, T.R., 2010. Developing GIS-based eastern equine encephalitis vector-
host models in Tuskegee, Alabama. International Journal of Health Geographics [online], 9(12).
Available from: https://doi.org/10.1186/1476-072X-9-12
Jacob, B.G., Lampman, R.L., Ward, M.P., Muturi, E., Funes, J.and Morris, J.C., 2009. Geospatial variability in
the egg raft distribution and abundance of Culex pipiens and Culex restuans in Urbana Champaign,
International Journal of Geographic Information System Vol. 4, No. 2, September 2017, pp. 1-19 Available Online at http://acascipub.com/Journals.php
19 Copyright © acascipub.com, all rights reserved.
Illinois. International Journal of Remote Sensing, 30, 8. Available from:
http://dx.doi.org/10.1080/01431160802549195
Kainz W., n.d. Fuzzy logic and GIS [online]. University of Vienna, Austria. Available from:
http://homepage.univie.ac.at/wolfgang.kainz/Lehrveranstaltungen
/ESRI_Fuzzy_Logic/File_2_Kainz_Text.pdf [Accessed 17 June 2017].
Kunkel, K.E. and Novak, R., 2005. Climate index for West Nile Virus. Am. Meteorol. Soc. B, 86, 18.
Linthicum, K.J., Bailey, C.L., Davies, F.G. and C.J. Tucker, 1987. Detection of Rift Valley fever viral activity
in Kenya by satellite remote sensing imagery. Science, 235, 1656–1659.
Novák, V., Perfilieva, I. and Močkoř, J.,1999. Mathematical principles of fuzzy logic Dodrecht: Kluwer
Academic.
Olgemann, J.E., 1990. Comparison between two vegetation indices for measuring different types of forest
damage in the north-eastern United States. Int. J. Remote Sens., 11, 2281-2297.
Sellers, P.J., 1985. Canopy reflectance, photosynthesis and transpiration. Int. J. Remote Sens., 6, 1335-1372.
Tucker, C.J., Fung, I.Y., Keeling, C.D. and Gammon, RH., 1986. Relationship between atmospheric CO2
variations and a satellite-derived vegetation index. Nature, 319, 195-199.
Urbano, J., 2016. The Cerdà Plan for the Expansion of Barcelona: A Model for Modern City Planning. Focus
[online], 12 (13). Available from: http://digitalcommons.calpoly.edu/focus/vol12/iss1/13
Ward, M.P., Levy, M., Thacker, H.L., Ash, M., Norman, S.K.L., Moore, G.E. and Webb, P.W., 2004. An
outbreak of West Nile virus encephalomyelitis in a population of Indiana horses: 136 cases. Am Vet Med
Assoc. 222, 84-89
WHO, 2017. Dengue control. The mosquito [online]. Available from:
http://www.who.int/denguecontrol/mosquito/en/