international journal of chemical and environmental
TRANSCRIPT

Editorial and Administrative Information
FEBRUARY 2020| VOL.1 |ISSUE 2
INTERNATIONAL JOURNAL OF CHEMICAL AND ENVIRONMENTAL SCIENCES
www.ijcaes.thesmartsociety.org
US ISSN Center at the Library of Congress ISSN: 2689-6389 (Print) ISSN: 2687-7939 (Online)
(Online)
A Publication of
Society for Makers, Artists, Researchers and Technologists
6408 Elizabeth Avenue SE, Auburn, Washington 98092, USA

INTERNATIONAL JOURNAL OF
CHEMICAL AND ENVIRONMENTAL
SCIENCES
VOLUME 1, ISSUE 2
(FEBRUARY, 2020)
SOCIETY FOR MAKERS, ARTISTS, RESEARCHERS AND TECHNOLOGISTS
6408 ELIZABETH AVENUE SE, AUBURN, WA 98092, USA

SMART
SOCIETY FOR MAKERS, ARTISTS, RESEARCHERS AND TECHNOLOGISTS
SMART is a publishing organization which seeks to bring to light new and innovative research ventures and publish original works of study. All publications by SMART is undertaken with due authorization of the related author(s).
International Journal of Chemical and Environmental Sciences is a publication by SMART.
First Published in November, 2019
Auburn, USA
ISSN: 2689-6389 (Print) ISSN 2687-7939 (Online)
Copyright © 2019 SMART
All rights reserved. No part of this publication may be reproduced, distributed, or transmitted in any form or by any means, including photocopying, recording, or other electronic or mechanical methods, without the prior written
permission of the publisher, except in the case of brief quotations embodied in critical reviews and certain other non-commercial uses permitted by copyright law. For permission requests, write to the publisher, addressed “Attention:
Permissions Coordinator,” at the address below.
SMART
SOCIETY FOR MAKERS, ARTISTS, RESEARCHERS AND TECHNOLOGISTS
6408 ELIZABETH AVENUE SE, AUBURN, WA 98092, USA
Price: 200 USD
Editorial and Administrative Information
From Managing Editor’s Desk
International Journal of Chemical and Environmental Sciences is an open access, peer reviewed journal that provides authoritative source of information for professionals in a wide range of chemical and environmental disciplines. It provides an international forum for the rapid communication of research that broadly embraces the interface consisting of new research opportunities and discoveries.
The journal publishes original papers, brief communications, reviews and letters related to every aspect of theory and practice of chemical, (bio) chemical, nano-sciences, environmental sciences and chemical engineering disciplines. Actually, interdisciplinary studies require an integration of many different scientific and professional disciplines. The Journal provides a platform for the exposure in advancement of interdisciplinary approaches related to every aspects of science. Manuscripts are initially reviewed by the editors and, if found appropriate are sent to scientists who assess the quality, originality, significance, and validity of the work before finally approving for publication. All rights are reserved with the publishers. A Reprint Service is available and copies might be obtained on prior permission for limited and specified reproduction sought on payment of prescribed charges.
We are taking this opportunity to announce the publication of the first volume of IJCAES, a journal published by SMART SOCIETY, USA. The contributions involve multi-disciplinary or trans-disciplinary aspects of science and identify the ways in which the work will be instrumental in present day research, education, or related activities. The editors are pinning their hopes that this present issue will be able to get across students, faculties and researchers. We are confident that IJCAES will act as a podium for its related scientific community it caters around the world and a trusted medium to interact and communicate.
Dr.Ruchira Mukherjee
Dr, Pratap Mukherjee
THE EDITORS:
PATRON Prof. (Dr) Satyajit Chakrabarti Director Institute of Engineering & Management. Salt Lake Electronics Complex, Kolkata-700091 India.
THE MANAGING EDITORS
Dr. Ruchira Mukherjee Professor Department of Basic Sciences and Humanities Institute of Engineering & Management. Salt Lake Electronics Complex, Kolkata-700091 India
Dr. Pratap Mukherjee Associate Professor Department of Basic Sciences and Humanities Institute of Engineering & Management. Salt Lake Electronics Complex, Kolkata-700091 India
1 Navonil Banerjee, Ph.D Department of Microbiology,Immunology and Molecular Genetics University of California, Los Angeles [email protected] 2. Neeladri Roy, Ph.D Laboratory of Cellular and Molecular Biology National Cancer Institute National Institute of Health Bethesda.MA [email protected] 3. Koushik Roy, Ph.D Department of Biophysics University of California, Los Angeles [email protected]
4. Subrata Debnath, Ph.D Department of Biochemistry and Molecular Biology, Howard University College of Medicine, Adams Building, Room 4105, 520 W Street, NW Washington, DC 20059. [email protected]
5. Sanchaita Das,Ph.D Department of Chemistry & Biochemistry University of California, Los Angeles [email protected] 6. Sayantan Das, Ph.D Faculty Member, College of Science and Mathematics Texas A&M University, SA [email protected]

THE ASSOCIATE EDITORS
Dr. Tina De Assistant Professor Department of Basic Science & Humanities, Institute of Engineering & Management. Salt Lake Electronics Complex, Kolkata-700091 India.
Dr. Kakoli Dutta Associate Professor Department of Basic Sciences and Humanities Institute of Engineering & Management. Salt Lake Electronics Complex, Kolkata-700091 India
Contact Us:
Society for Makers, Artist, Researchers and Technologists. 6408 Elizabeth Avenue SE, Auburn, WA 98092, USA.
Email: [email protected]
Phone- 1-425-605-0775
CONTENTS
Page No.
DNA damage-independent interaction of CBX4 with SUMO1
Sulagna Sanyal1, 2, Chandrima Das1* and Sumita Sengupta (Bandyopadhyay)2*
7
Rapid and nondestructive assessment of freshness of potatoes using a piezo based sensor
Rishin Banerjee1, Abhra Pal1, Indranil Ganguly1, Gopinath Bej1, Tapas Sutradhar1, Tamal Dey1,Subhankar Mukherjee1,Soumyadeb Bhattacharyya1, Alokesh Ghosh1, Brajesh Singh2, Nabarun Bhattacharya1,*.
12
Synthesis, Characterization and Sorptive Removal of Heavy metals on Nano-Structured Agglomerates of Iron (III)-Cerium (IV) Bimetal Mixed Oxide (NICMO): Search For An Efficient, Low Cost Decontamination Technique Tina De1*, Abir Ghosh1, Uday Chand Ghosh1
19
Bizarre movements of Earth cause deadliest tragedies and Climate Change Nagendra Nath Mondal1*
32
A review article on ChIP-Seq tools: MACS2, HOMER, SICER, PEAKANNOTATOR AND MEME Shrestha Bhowmik1, Anish Ganguly2*
38
Antimicrobial Properties of Nanoparticles (NPS)
Tathagata Kayal1*, Titas Ghosh 2
46
Assessment of Physio-chemical and microbial characteristics of water of some ponds in Kolkata Phanibhusan Ghosh1*, Sudipto Mandal1
54
In vitro study of anti–arthritic activity and Calcium content of Cissusquadrangularis Esther. Niroj. Kujur1*
62


International Journal of Chemical and Environmental Sciences Vol 1 Issue 2, 2020 ISSN 2689-6389 (Print) ISSN2687-7939 (Online)
Corresponding author
Email address: [email protected] 7 [email protected]
DNA damage-independent interaction of CBX4 with SUMO1
Received for publication, December 3, 2019, and in revised form, January 5, 2020 Sulagna Sanyal1, 2, Chandrima Das1* and Sumita Sengupta (Bandyopadhyay)2*
1Saha Institute of Nuclear Physics, 1/AF, Bidhannagar Kolkata 700 064, India, 2Department of Biophysics, Molecular Biology and Bioinformatics, University of Calcutta, 92 A.P.C. Road, Kolkata 700009, West Bengal, India Abstract The versatile role of CBX4, an important SUMO E3 ligase has been well studied in different biological processes including DNA damage response, transcriptional regulation and cancer.Although very few reports suggest that CBX4 itself gets SUMOylated by SUMO1, still in depth study to explore the biological implication of this association is yet to be divulged. Here we found that CBX4 indeed interacts with SUMO1 in HeLa cells. Subsequently, DNA damage induction was done using UV radiation to examine the effect on CBX4-SUMO1 interaction. Interestingly, no alteration in the SUMO1 mediated SUMOylation status of CBX4 suggested that the interaction between CBX4 and SUMO1 is quite robust and it works in a DNA damage-independent manner.
Key words: DDR, SUMOylation, UV radiation, polycomb, regulation
Introduction
PcG bodies are considered as hubs for gene repression because polycomb groups of proteins are mainly gene silencing factors involved in regulating various gene expressions. In mammals, flies and plants, a number of PcG components are reported to have a role in maintaining higher-order chromosome structure and function as a SUMOylation hub (1). Different PcG body proteins unite to make complexes responsible for various functions that belong to two distinct families: the Polycomb repressive complexes 1 and 2 (PRC1 and PRC2 respectively).The core part of the mammalian PRC1 complex shows E3 ligase activity because of the presence of E3 ubiquitin ligase RING1 (RING1A or RING1B) along with and one of the six members of polycomb group of RING finger proteins (PCGF 1-6) (2). However, PRC1 complex can further be divided into two sub-families namely canonical PRC1 (cPRC1) having homologous function like Drosophila PRC1 and non- canonical PRC1 (ncPRC1) that contains different heterogeneous proteins (3). cPRC1 can be identified by the occurrence of five Chromobox (Cbx) containing proteins (CBX2, 4, 6-8) which are the determinant factors for the recruitment of the complex to chromatin (2). Mammalian CBX proteins show their reader protein like function as a result of the presence of a highly conserved chromo domain at the amino-terminal (N-term) site which specifically recognizes methylated lysine residues. Additionally, the members of the family contain a c-box or PcG box at their C-terminal end which is responsible for its interaction to the catalytic core of the complex, Ring1A/B and thus show an enzymatic property or writer protein like function (4). Chromobox 4 (CBX4) (or Pc2) is an important PcG body protein that acts as SUMO E3 ligase by bringing different substrates and E2 inside the PcG body and thereby making it a SUMOylation hub (5). Before the discovery of CBX4, the enzymatic activities of SUMO E3 ligases were not very clearly known. But in 2005, Kagey et al. demonstrated the detailed E3

IJCAES Vol 1, Issue 2, 2020
ISSN 2689-6389 (Print)
ISSN2687-7939 (Online) 8
ligase activity of the protein (CBX4) and it was found to enhance the SUMOylation status of the transcriptional corepressor CtBP by recruiting both the substrate protein and the E2, Ubc9 inside the PcG body (5,6). Later studies have shown that CBX4 can SUMOylate several other proteins like BMI1, hnRNPK, HIPK2 etc. and recruit them at the DNA damage site by initiating p53 mediated DNA damage response (DDR) pathway (7,8,9). SUMOylation of ‘de novo’ methyltransferase Dnmt3a and zinc finger protein CTCF by SUMO E3 ligase CBX4 also contributes majorly to their repressive activity (10,11). In hepatocellular carcinoma and osteosarcoma, CBX4 exerts its effect as a tumor-promoting gene by modulating different biological pathways through its SUMO E3 ligase property (12,13). It was previously reported that besides acting as SUMO E3 ligase, CBX4 itself gets SUMOylated by SUMO1 in MEF (Mouse embryonic fibroblast) and COS-1 cells (14). But in spite of acting as an early DNA damage response (DDR) protein, the effect of DNA damage on the SUMO1 association of CBX4 still remains unknown. In this study, we found that CBX4 interacts with SUMO1 in human cervical cancer cells and this association is not dependent on the DNA damage responsiveness of the protein. Materials and Methods
Cell culture and treatments HeLa cells were maintained in Dulbecco’s Modified Eagle’s Medium (Gibco, Invitrogen) supplemented with 10% fetal bovine serum (Gibco, Invitrogen) and penicillin/streptomycin (10μl/mL of medium, Gibco, Invitrogen) at 37°C in 5% (v/v) CO2. UV treatment was done in HeLa cells by placing it insideUV stratalinker (Vilber lourmat) under 30 Joules of radiation for 5mins and then allowed to recover for two hours before doing further experiments.
HeLa cells were transiently transfected with FLAG-CBX4 (for coimmunofluorescence experiment) using Lipofectamine2000 (Invitrogen) as per manufacturer’s protocol.
Co-immunoprecipitation (Co-IP)
Cross-linked cells were subjected to Co-IP as described elsewhere(15). In brief, after cross-linking, 20 mM freshly prepared N-ethylmaleimide (NEM) was added to the lysis buffer to block the degradation of SUMOylation and then the cells were lysed with 50mM HEPES (pH7.5), 150mM NaCl, 1.5mM MgCl 2, 1mM EDTA, 1mM EGTA, 1% Triton X-100, 0.5% Sodium deoxycholate, 5% Glycerol, 1mM DTT along with complete protease inhibitor cocktail and incubated on ice for 1hr followed by centrifugation at 13000 rpm for 10mins at 4oC. After pre-clearing the lysates, immunoprecipitation was done with anti-CBX4 antibody (ab4189) followed by washes with the same buffer and immunoblotting with anti-SUMO1 (S8070).
Western blot analysis
Whole cell extracts were prepared using Laemmli Buffer (4% SDS, 20% Glycerol and 120mM Tris-HCL pH 6.8) and sonicated for complete lysis followed by boiling at 100oC. The samples were then electrophoresed on 11% or 15% SDS-PAGE and transferred on the nitrocellulose membrane followed by blocking with non-fat skimmed milk and probed with anti- ϒ-H2AX (ab11174) and anti-H3 (ab1791) antibodies.
Coimmunofluorescence and confocal microscopy
Coimmunofluorescence staining was performed following the standard protocol (16). Briefly, the cells were fixed with 4% Paraformaldehyde, permeabilized with 1% Triton X-100 and blocked with 3% BSA. Cells were then incubated with anti- ϒ-H2AX (ab11174), anti-FLAG (F1804) and anti-SUMO1 (S8070) antibodies for 1 hour. Following washes with PBST the cells were incubated with Alexa fluor 488 and Alexa fluor 594 conjugated secondary antibodies for 1hr at room temperature. The coverslips were again washed with PBST and mounted with DAPI-containing Prolong Gold antifade mounting medium

IJCAES Vol 1, Issue 2, 2020
ISSN 2689-6389 (Print)
ISSN2687-7939 (Online) 9
(Invitrogen). Andor Spinning Disk Ti-E confocal scanning microscope with A1RMP scanner head (Nikon) was used for confocal imaging.
Results and Discussion CBX4 itself interacts with SUMO1 in a DNA damage independent manner CBX4-mediated SUMOylation of BMI1, another important member of the PRC1 complex, helps in the recruitment of the protein to the laser micro-irradiated DNA damage site and can initiate the PARP mediated DNA damage response pathway(7). Interestingly, DNA damage also triggers theSUMOylation of heterogeneous nuclear ribonucleopeotein K (hnRNP K) by CBX4 which is required for transcriptional activation of p53 (8). This DDR property of CBX4 as a SUMO E3 ligase led us to check the effect of DNA damage on the SUMOylation status of the protein itself. To induce DNA damage, HeLa cells were subjected to 30J/m2 of UV radiation for 5 mins and then allowed to recover for two hours before doing the experiment (1A). DNA damage induction was further confirmed by checking the level of ϒ-H2AX through immunofluorescence and western blotting (Figure 1B, panel I and panel IV). Co-immunoprecipitation assay was then performed in untreated and UV treated HeLa cells with anti-CBX4 antibody and the association of the protein was checked with SUMO1 (Figure 1C). Fascinatingly, in both the cases CBX4 showed robust association with SUMO1 and the extent of interaction was also similar for untreated and UV-treated cells. Further through co-immunofluorescence, this interaction was visualized by overexpressing FLAG-CBX4 in HeLa cells and significant co-localization was found in between FLAG-CBX4 and SUMO1 in untreated as well as UV-treated condition (Figure 2A and 2B, panel IV). Additionally, calculated Pearson’s coefficient was greater than 0.5 in both the conditions which strengthened our observation.
Figure 1: (A) Diagram showing experimental design for UV damage induction. (B) Hela cells were immunostained with anti- ϒ-H2AX antibody (panel I, II, III) followed by western blotting with anti- ϒ-H2AX and anti-H3 antibodies (panel IV) after DNA damage induction. H3 was used as the loading control. (C) Co-immunoprecipitaion was done with anti-CBX4 antibody in untreated and UV treated HeLa cells followed by immunoblotting with the anti-SUMO1 antibody

IJCAES Vol 1, Issue 2, 2020
ISSN 2689-6389 (Print)
ISSN2687-7939 (Online) 10
Figure 2: Co- immunofluorescence was done in untreated (A) and UV-treated (B) HeLa cells after transfecting FLAG-CBX4 with anti-FLAG (panel II) and anti-SUMO1 (panel III) antibodies. DAPI was used to stain the nucleus (panel I). Pearson’s coeffiecients was >0.5. Conclusion A plethora of proteins, which show cellular response to DNA double-strand breaks (DSBs), are modulated by several highly dynamic and reversible post-translational modifications like methylation, acetylation, ubiquitination and SUMOylation (7). But the role of SUMOylation has always remained elusive in the context of the DDR pathway. CBX4 has been identified as an early DDR protein and DNA damage seems to affect the SUMO E3 ligase property of the protein in several ways (17). However, besides acting as a SUMO E3 ligase, CBX4 itself gets SUMOylated by SUMO1 probably through an autoregulatory mechanism (14)(18). So, we sought to check the effect of DNA damage on this CBX4-SUMO1 interaction. Here we report that, CBX4 indeed gets SUMOylated by SUMO1 in human cervical cancer cells also and this robust CBX4-SUMO1 association is not affected by the DNA damage induction. In the future, detailed investigation based on this observation could be helpful to unravel the underlying mechanism. Acknowledgements The authors would like to thank Prof David Wotton (University of Virginia) for providing the FLAG-CBX4 construct as a kind gift. This work was financially supported in part by Biomolecular Assembly, Recognition and Dynamics (BARD) (Grant 12-R&D-SIN-5.04−0103) by the Department of Atomic Energy (DAE), Ramalingaswami fellowship, Department of Biotechnology (DBT) and Swarnajayanti Fellowship, Department of Science and Technology (DST), Government of India provided to C. Das. S. Sanyal would like to thank Council for Scientific and Industrial Research, Government of India for the fellowship support. The authors declare no conflicts of interest. References

IJCAES Vol 1, Issue 2, 2020
ISSN 2689-6389 (Print)
ISSN2687-7939 (Online) 11
[1] Niessen, H. E. C., Demmers, J. a, and Voncken, J. W. (2009) Talking to chromatin: post-translational modulation of polycomb group function. Epigenetics Chromatin2, 10
[2] Schuettengruber, B., Bourbon, H., Croce, L. Di, and Cavalli, G. (2017) Review Genome Regulation by Polycomb and Trithorax : 70 Years and Counting. Cell171, 34–57
[3] Aranda, S., Mas, G., and Croce, L. Di. (2015) Regulation of gene transcription by Polycomb proteins. 2, 1–16
[4] Pherson, M., Misulovin, Z., Gause, M., Mihindukulasuriya, K., Swain, A., and Dorsett, D. (2017) Polycomb repressive complex 1 modifies transcription of active genes. 2, 1–18
[5] Kagey, M. H., Melhuish, T. A., and Wotton, D. (2003) The polycomb protein Pc2 is a SUMO E3. Cell113, 127–137
[6] Kagey, M. H., Melhuish, T. a, Powers, S. E., and Wotton, D. (2005) Multiple activities contribute to Pc2 E3 function. EMBO J.24, 108–119
[7] Ismail, I. H., Gagné, J. P., Caron, M. C., McDonald, D., Xu, Z., Masson, J. Y., Poirier, G. G., and Hendzel, M. J. (2012) CBX4-mediated SUMO modification regulates BMI1 recruitment at sites of DNA damage. Nucleic Acids Res.40, 5497–5510
[8] Li, T., Evdokimov, E., Shen, R.-F., Chao, C.-C., Tekle, E., Wang, T., Stadtman, E. R., Yang, D. C. H., and Chock, P. B. (2004) Sumoylation of heterogeneous nuclear ribonucleoproteins, zinc finger proteins, and nuclear pore complex proteins: a proteomic analysis. Proc. Natl. Acad. Sci. U. S. A.101, 8551–8556
[9] Roscic, A., Möller, A., Calzado, M. A., Renner, F., Wimmer, V. C., Gresko, E., Lüdi, K. S., and Schmitz, M. L. (2006) Phosphorylation-Dependent Control of Pc2 SUMO E3 Ligase Activity by Its Substrate Protein HIPK2. Mol. Cell24, 77–89
[10] Kang, E. S., Park, C. W., and Chung, J. H. (2001) Dnmt3b, de novo DNA methyltransferase, interacts with SUMO-1 and Ubc9 through its N-terminal region and is subject to modification by SUMO-1. Biochem. Biophys. Res. Commun.289, 862–868
[11] Macpherson, M. J., Beatty, L. G., Zhou, W., Du, M., and Sadowski, P. D. (2009) The CTCF Insulator Protein Is Posttranslationally Modified by SUMO ᰔ. 29, 714–725
[12] Li, J., Xu, Y., Jiao, H. K., Wang, W., Mei, Z., and Chen, G. Q. (2014) Sumoylation of hypoxia inducible factor-1α and its significance in cancer. Sci. China Life Sci.57, 657–664
[13] Yang, J., Cheng, D., Zhu, B., Zhou, S., Ying, T., and Yang, Q. (2016) Chromobox homolog 4 is positively correlated to tumor growth, survival and activation of HIF-1α signaling in human osteosarcoma under normoxic condition. J. Cancer7, 427–435
[14] Kang, X., Qi, Y., Zuo, Y., Wang, Q., Zou, Y., Schwartz, R. J., Cheng, J., and Yeh, E. T. H. (2011) NIH Public Access. 38, 191–201
[15] Zhan, X., Shi, X., Zhang, Z., Chen, Y., and Wu, J. I. (2011) Dual role of Brg chromatin remodeling factor in Sonic hedgehog signaling during neural development. Proc. Natl. Acad. Sci. U. S. A.108, 12758–12763
[16] Adhikary, S., Sanyal, S., Basu, M., Sengupta, I., Sen, S., Srivastava, D. K., Roy, S., and Das, C. (2016) Selective recognition of H3.1K36 dimethylation/H4K16 acetylation facilitates the regulation of all-trans-retinoic acid (ATRA)-responsive genes by putative chromatin reader ZMYND8. J. Biol. Chem.291, 2664–2681
[17] Gieni, R. S., Ismail, I. H., Campbell, S., and Hendzel, M. J. (2011) Polycomb group proteins in the DNA damage response: A link between radiation resistance and “stemness.” Cell Cycle10, 883–894
[18] Merrill, J. C., Melhuish, T. A., Kagey, M. H., Yang, S., Sharrocks, A. D., and Wotton, D. (2010) A Role for Non-Covalent SUMO Interaction Motifs in Pc2 / CBX4 E3 Activity. 5
International Journal of Chemical and Environmental Sciences Vol 1 Issue 2, 2020 ISSN 2689-6389 (Print) ISSN2687-7939 (Online)
Rapid and nondestructive assessment of freshness of potatoes using a piezo
based sensor
Received for publication, December 5, 2019, and in revised form, January 5, 2020
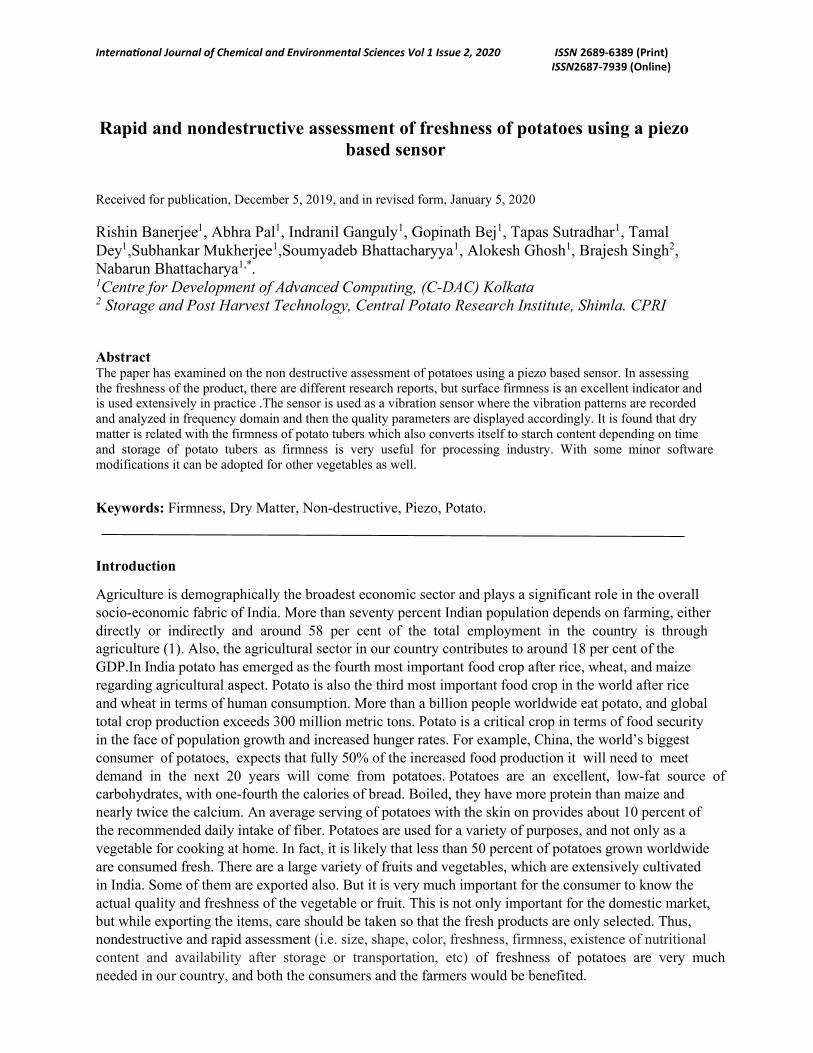
Rishin Banerjee1, Abhra Pal1, Indranil Ganguly1, Gopinath Bej1, Tapas Sutradhar1, Tamal Dey1,Subhankar Mukherjee1,Soumyadeb Bhattacharyya1, Alokesh Ghosh1, Brajesh Singh2, Nabarun Bhattacharya1,*. 1Centre for Development of Advanced Computing, (C-DAC) Kolkata 2 Storage and Post Harvest Technology, Central Potato Research Institute, Shimla. CPRI Abstract The paper has examined on the non destructive assessment of potatoes using a piezo based sensor. In assessing the freshness of the product, there are different research reports, but surface firmness is an excellent indicator and is used extensively in practice .The sensor is used as a vibration sensor where the vibration patterns are recorded and analyzed in frequency domain and then the quality parameters are displayed accordingly. It is found that dry matter is related with the firmness of potato tubers which also converts itself to starch content depending on time and storage of potato tubers as firmness is very useful for processing industry. With some minor software modifications it can be adopted for other vegetables as well.
Keywords: Firmness, Dry Matter, Non-destructive, Piezo, Potato.
Introduction
Agriculture is demographically the broadest economic sector and plays a significant role in the overall socio-economic fabric of India. More than seventy percent Indian population depends on farming, either directly or indirectly and around 58 per cent of the total employment in the country is through agriculture (1). Also, the agricultural sector in our country contributes to around 18 per cent of the GDP.In India potato has emerged as the fourth most important food crop after rice, wheat, and maize regarding agricultural aspect. Potato is also the third most important food crop in the world after rice and wheat in terms of human consumption. More than a billion people worldwide eat potato, and global total crop production exceeds 300 million metric tons. Potato is a critical crop in terms of food security in the face of population growth and increased hunger rates. For example, China, the world’s biggest consumer of potatoes, expects that fully 50% of the increased food production it will need to meet demand in the next 20 years will come from potatoes. Potatoes are an excellent, low-fat source of carbohydrates, with one-fourth the calories of bread. Boiled, they have more protein than maize and nearly twice the calcium. An average serving of potatoes with the skin on provides about 10 percent of the recommended daily intake of fiber. Potatoes are used for a variety of purposes, and not only as a vegetable for cooking at home. In fact, it is likely that less than 50 percent of potatoes grown worldwide are consumed fresh. There are a large variety of fruits and vegetables, which are extensively cultivated in India. Some of them are exported also. But it is very much important for the consumer to know the actual quality and freshness of the vegetable or fruit. This is not only important for the domestic market, but while exporting the items, care should be taken so that the fresh products are only selected. Thus, nondestructive and rapid assessment (i.e. size, shape, color, freshness, firmness, existence of nutritional content and availability after storage or transportation, etc) of freshness of potatoes are very much needed in our country, and both the consumers and the farmers would be benefited.

IJCAES Vol 1, Issue 2, 2020
In assessing the freshness of the product, there are different research reports, but surface firmness is an excellent indicator and is used extensively in practice. The grape berries on vines were investigated with a nondestructive acoustic method by Takahashi et al in (1). Mizrach et al (2) developed a spring-loaded “mechanical thumb” to measure the force deformation of a peel.
In this present paper, we present the development of an instrument based on piezo-based accelerometers and the results obtained with a large number of potato samples. Firmness is related to the degree of maturation of fruits of many kinds (3).It is generally recognized that firmness changes of fruit or plant tissue are attributed to changes in the mechanical properties of the cell walls; therefore,pre- and post-version, changes in cell wall components of berries have been reported. For example, Nunan et al. (1998) revealed the alteration of specific polysaccharide components and protein composition in the cell walls of ripening grape berries(4). Subsequently, Yakushiji et al. (2001) reported depolymerization of pectin and xyloglucan, and a decreased amount of cellulose related to softening of the grape berry (5). Deytieux-Belleau et al.(2008) suggested that pectin methylesterase and polygalacturonase contribute to the softening of berry skin (6). Another group measured turgor of berries and revealed that turgor decreased along the ripening stages of grapes. These biochemical and physiological changes in the berry are supposed to be related to firmness changes through grape maturation.
Materials and Methods
The study on firmness has been done at an international and as well as national scale. Firmness being a key factor as it is related to the degree of maturation and quality. Quality determines the shelf life and sell price of fruits and vegetables (7). Grape berries show characteristic changes in firmness through ripening. Non destructive acoustic vibration techniques methods were implemented for study of firmness (1). Different methods for non destructive quality monitoring of fruits and vegetables were mentioned such as mechanical methods, optical methods including visible or NIR Spectroscopy, Ultrasonic and acoustic response methods (7).They have mentioned some possible methods which can be implemented for firmness detection. Particularly ultrasonic techniques were implemented for quality evaluation of fresh fruits and vegetables using the characteristic of sound waves in ultrasonic regions and also the propagation parameters and implemented on freshness detection of apples in specific (8).
Non destructive assessment of freshness has not been performed specifically on potato which will be a rapid assessment and also will be a handheld instrument. Dry matter which corresponds to the freshness and also the starch content has not been taken into account. This paper presents the research on the non destructive assessment of freshness of potato tubers where instrument is developed which is handheld, portable and also rapid in nature.
Potatoes are also extensively cultivated in India. A huge amount is exported also. But it is very much important for the consumer to know the actual quality and freshness of this highly important vegetable with respect to food security concern. This is not only important for the domestic market, but while exporting the items, care should be taken so that the fresh and nutritious products are only selected. Thus, nondestructive and rapid assessment of quality of different varieties of potato is very much needed in our country, and both the consumers and the farmers would be benefited. In assessing the freshness of the vegetables, there are different research reports, but surface firmness is an excellent indicator and is used extensively in practice. Starch content is determined by biochemical means. The grape berries on vines were investigated with a nondestructive acoustic method by Takahashi et al. in (1). Mizrach et al (2) developed a spring-loaded “mechanical thumb” to measure the force-deformation of a peel. There are also conventional methods (like NIR, Spectrophotometry etc.) of detecting nutritional value also, though they are not rapid and nondestructive always. There is no such instrument, which correlates freshness with the inherent significant chemical compounds (such as starch) in potato.
Theory
IJCAES Vol 1, Issue 2, 2020
The first problem area is the non destructive method for determination of quality parameters of potato. For quality parameter detection three biochemical components plays a significant role regarding processing and storage time of potato tubers. These are dry matter, sucrose content, reducing sugar content, bacterial wilt.
Sucrose content gives us the indication of the storage time of potato tubers. Dry matter and reducing sugar content are significant towards the processing of potato tubers. Dry matter is intensely related with the firmness of potato tubers, thus the indication of firmness is very useful for processing industry of potatoes as dry matter is the key indication towards processing of potato. The other significant prospect behind the detection of dry matter content is the quantity of starch in the potato tuber as the dry matter actually converts itself to starch depending on time and storage aspect. Presently there is no such instrument which can predict the starch content of potato tubers in a rapid and handheld manner. The advantage of the proposed system in this paper is regarding cost, sensitivity, reliability, portability, rapidity, whereas no such system in the national mark.
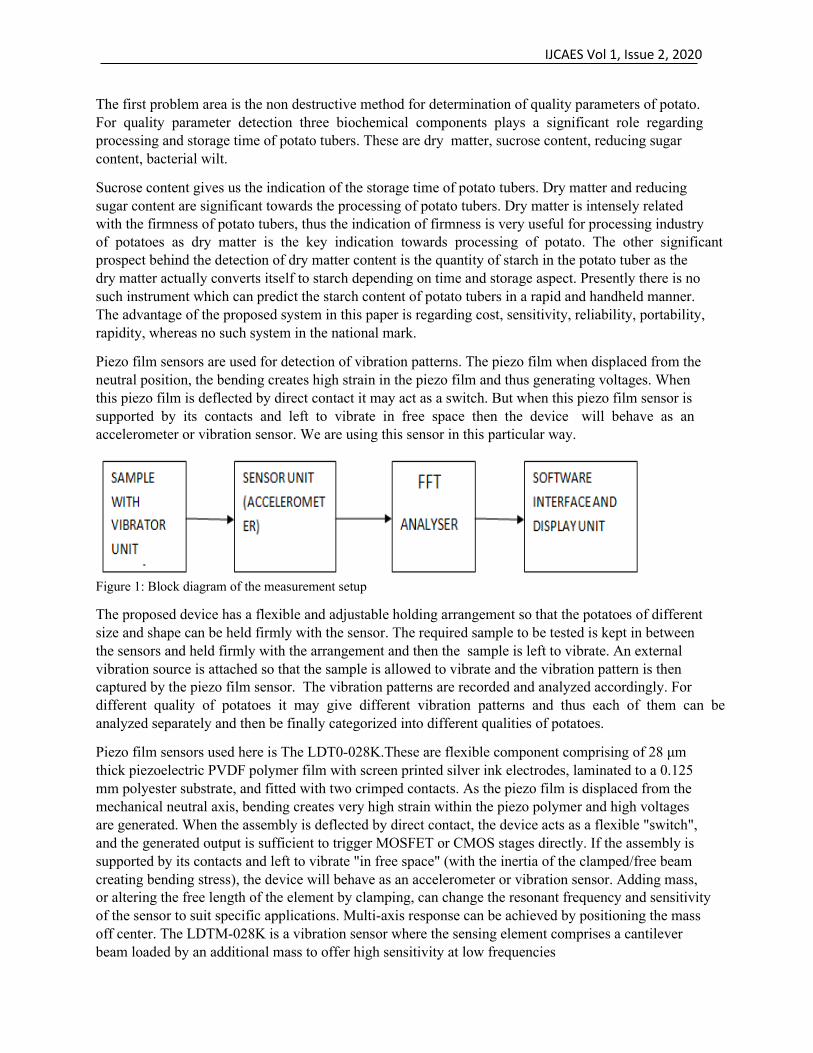
Piezo film sensors are used for detection of vibration patterns. The piezo film when displaced from the neutral position, the bending creates high strain in the piezo film and thus generating voltages. When this piezo film is deflected by direct contact it may act as a switch. But when this piezo film sensor is supported by its contacts and left to vibrate in free space then the device will behave as an accelerometer or vibration sensor. We are using this sensor in this particular way.
Figure 1: Block diagram of the measurement setup
The proposed device has a flexible and adjustable holding arrangement so that the potatoes of different size and shape can be held firmly with the sensor. The required sample to be tested is kept in between the sensors and held firmly with the arrangement and then the sample is left to vibrate. An external vibration source is attached so that the sample is allowed to vibrate and the vibration pattern is then captured by the piezo film sensor. The vibration patterns are recorded and analyzed accordingly. For different quality of potatoes it may give different vibration patterns and thus each of them can be analyzed separately and then be finally categorized into different qualities of potatoes.
Piezo film sensors used here is The LDT0-028K.These are flexible component comprising of 28 μm thick piezoelectric PVDF polymer film with screen printed silver ink electrodes, laminated to a 0.125 mm polyester substrate, and fitted with two crimped contacts. As the piezo film is displaced from the mechanical neutral axis, bending creates very high strain within the piezo polymer and high voltages are generated. When the assembly is deflected by direct contact, the device acts as a flexible "switch", and the generated output is sufficient to trigger MOSFET or CMOS stages directly. If the assembly is supported by its contacts and left to vibrate "in free space" (with the inertia of the clamped/free beam creating bending stress), the device will behave as an accelerometer or vibration sensor. Adding mass, or altering the free length of the element by clamping, can change the resonant frequency and sensitivity of the sensor to suit specific applications. Multi-axis response can be achieved by positioning the mass off center. The LDTM-028K is a vibration sensor where the sensing element comprises a cantilever beam loaded by an additional mass to offer high sensitivity at low frequencies
IJCAES Vol 1, Issue 2, 2020
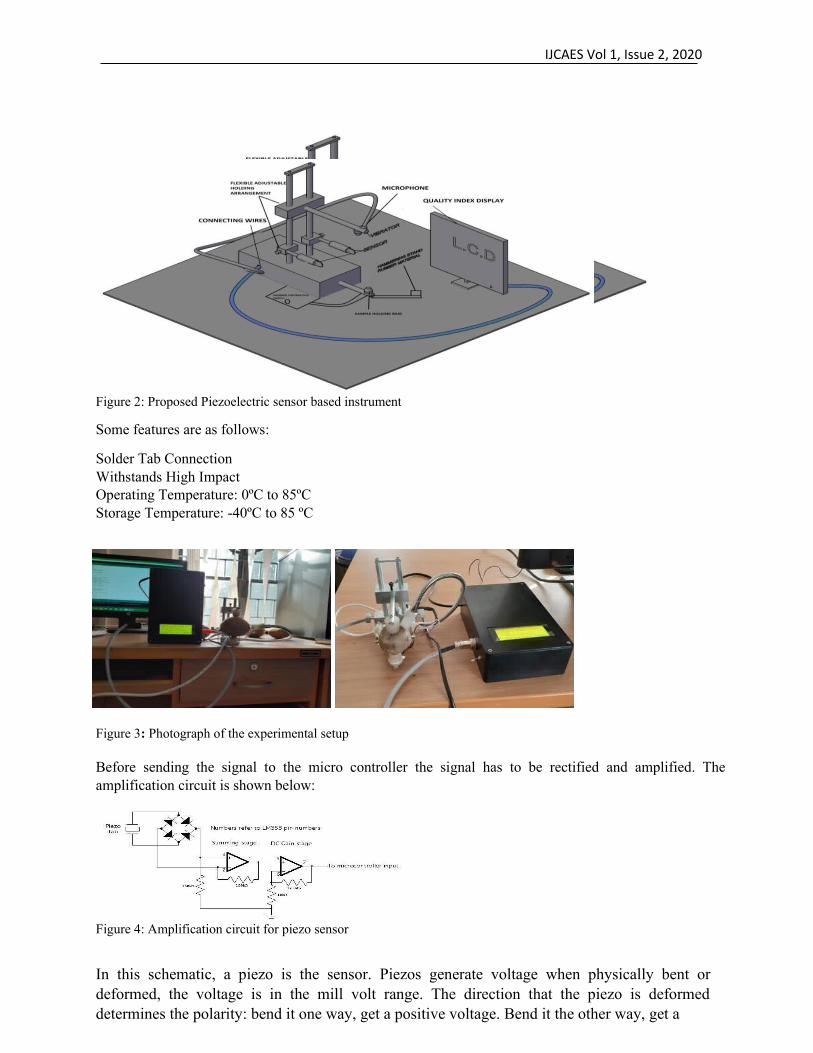
Figure 2: Proposed Piezoelectric sensor based instrument
Some features are as follows:
Solder Tab Connection Withstands High Impact Operating Temperature: 0ºC to 85ºC Storage Temperature: -40ºC to 85 ºC
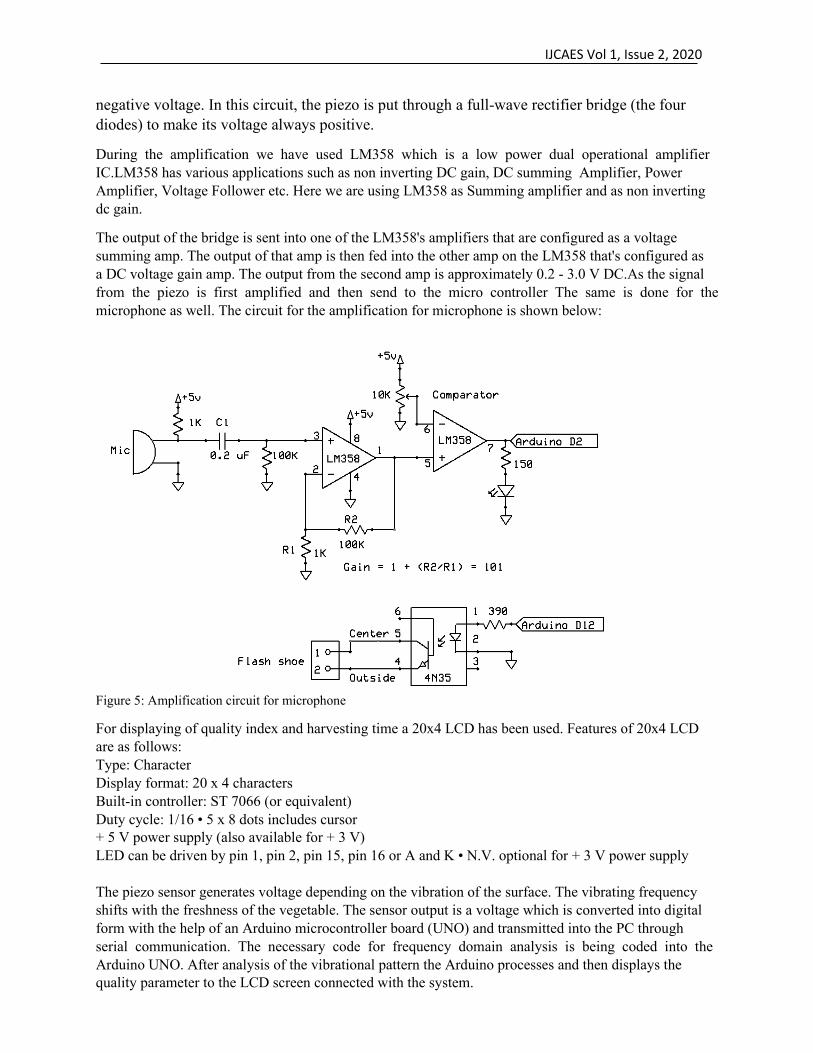
Figure 3: Photograph of the experimental setup Before sending the signal to the micro controller the signal has to be rectified and amplified. The amplification circuit is shown below:
Figure 4: Amplification circuit for piezo sensor
In this schematic, a piezo is the sensor. Piezos generate voltage when physically bent or deformed, the voltage is in the mill volt range. The direction that the piezo is deformed determines the polarity: bend it one way, get a positive voltage. Bend it the other way, get a
IJCAES Vol 1, Issue 2, 2020
negative voltage. In this circuit, the piezo is put through a full-wave rectifier bridge (the four diodes) to make its voltage always positive.
During the amplification we have used LM358 which is a low power dual operational amplifier IC.LM358 has various applications such as non inverting DC gain, DC summing Amplifier, Power Amplifier, Voltage Follower etc. Here we are using LM358 as Summing amplifier and as non inverting dc gain.
The output of the bridge is sent into one of the LM358's amplifiers that are configured as a voltage summing amp. The output of that amp is then fed into the other amp on the LM358 that's configured as a DC voltage gain amp. The output from the second amp is approximately 0.2 - 3.0 V DC.As the signal from the piezo is first amplified and then send to the micro controller The same is done for the microphone as well. The circuit for the amplification for microphone is shown below:
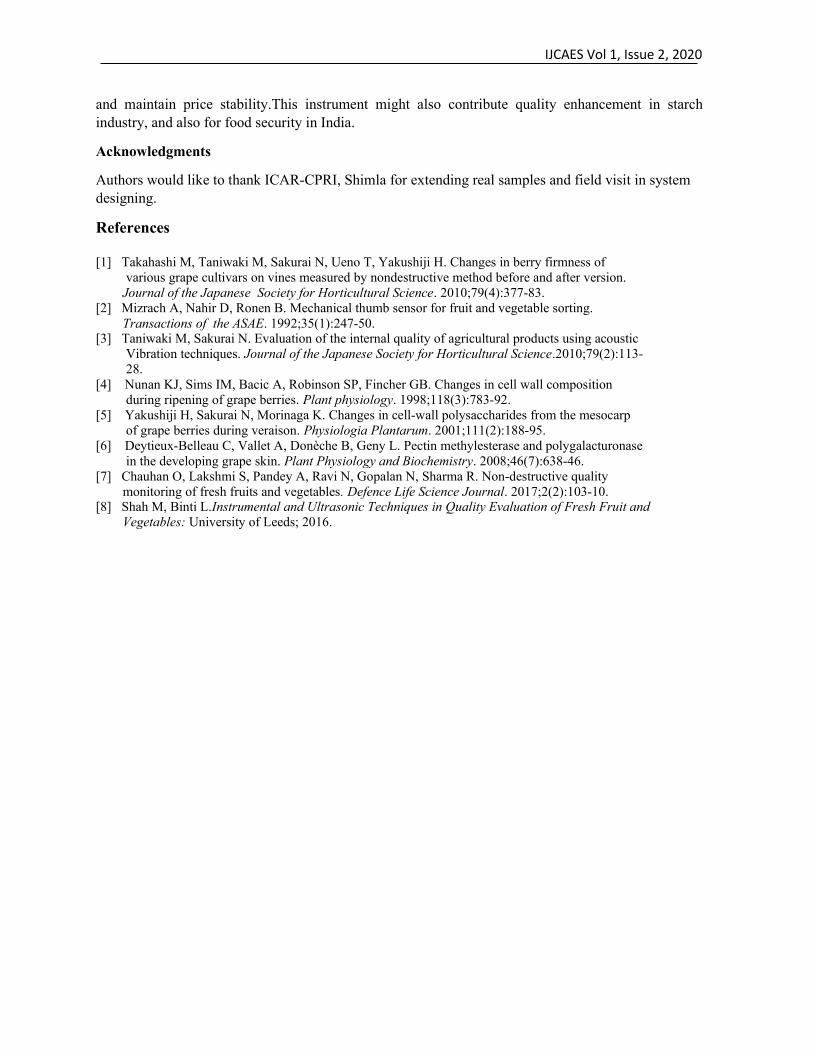
Figure 5: Amplification circuit for microphone
For displaying of quality index and harvesting time a 20x4 LCD has been used. Features of 20x4 LCD are as follows: Type: Character Display format: 20 x 4 characters Built-in controller: ST 7066 (or equivalent) Duty cycle: 1/16 • 5 x 8 dots includes cursor + 5 V power supply (also available for + 3 V) LED can be driven by pin 1, pin 2, pin 15, pin 16 or A and K • N.V. optional for + 3 V power supply The piezo sensor generates voltage depending on the vibration of the surface. The vibrating frequency shifts with the freshness of the vegetable. The sensor output is a voltage which is converted into digital form with the help of an Arduino microcontroller board (UNO) and transmitted into the PC through serial communication. The necessary code for frequency domain analysis is being coded into the Arduino UNO. After analysis of the vibrational pattern the Arduino processes and then displays the quality parameter to the LCD screen connected with the system.

IJCAES Vol 1, Issue 2, 2020
Results and Discussion
Different samples of potatoes with varying freshness were collected beforehand and the approximate date of picking of the potatoes was noted. The experiment was then conducted with different samples of potatoes. The results were quiet promising when the amplitude of the frequency domain analysis is being considered. The amplitude showed quite significant changes while conducting the experiment with different potato samples each for firm quality potatoes, less firm quality potatoes and low dry matter (extensively less firm) quality potatoes respectively. Here the major peak of the frequency domain analysis has been considered. From the results we can clearly state that we can determine the quality index of the potatoes. It has also been noticed that there is a promising relation of firmness with frequency shift in frequency domain. The experimentally observed datasheet table is given below:
Table 1: Freshness and frequency shift table
The unit of frequency calculation has been taken as Hertz and amplitude frequency as dB for the sake of simplified calculation. Dry matter is intensely related with the firmness of potato tubers, thus the indication of firmness is very useful for processing industry of potatoes as dry matter is the key indication towards processing of potato. The other significant prospect behind the detection of dry matter content is the quantity of starch in the potato tuber as the dry matter actually converts itself to starch depending on time and storage aspect. So far we have dealt with 20 different variant of potato tubers with distinguishable dry matter content. It is observed a suitable proportional relation of freshness of potato tubers to its firmness. The above table signifies the data variation with respect to the predictive algorithm towards the concern issue.
Conclusion:
This paper presents a low cost and simple methodology to objectively estimate the freshness of potatoes. The results are obtained with different potato samples, but the same methodology with minor modifications may be adopted for other vegetables and fruits. Thus, in the future, it is expected that the presented methodology may be adopted widely by the producers, consumers and the exporters. Commercialization of this low cost and handheld instrument would actually help at every stage starting from farmers to the consumers or exporters could easily and in a rapid manner verify the quality of this highly important produce that actually will cut down the manipulation behind consumer producer chain
Sl. No. Freshness(in days) Standard deviation in frequency shift
1. 10 18.21
2. 9 19.65
3. 8 20.28
4. 7 21.96
5. 6 23.66
6. 5 26.74
7. 4 27.02
8. 3 28.76
9. 2 29.21
10. 1 29.62
IJCAES Vol 1, Issue 2, 2020
and maintain price stability.This instrument might also contribute quality enhancement in starch industry, and also for food security in India.
Acknowledgments
Authors would like to thank ICAR-CPRI, Shimla for extending real samples and field visit in system designing.
References [1] Takahashi M, Taniwaki M, Sakurai N, Ueno T, Yakushiji H. Changes in berry firmness of various grape cultivars on vines measured by nondestructive method before and after version. Journal of the Japanese Society for Horticultural Science. 2010;79(4):377-83. [2] Mizrach A, Nahir D, Ronen B. Mechanical thumb sensor for fruit and vegetable sorting. Transactions of the ASAE. 1992;35(1):247-50. [3] Taniwaki M, Sakurai N. Evaluation of the internal quality of agricultural products using acoustic Vibration techniques. Journal of the Japanese Society for Horticultural Science.2010;79(2):113- 28. [4] Nunan KJ, Sims IM, Bacic A, Robinson SP, Fincher GB. Changes in cell wall composition during ripening of grape berries. Plant physiology. 1998;118(3):783-92. [5] Yakushiji H, Sakurai N, Morinaga K. Changes in cell‐wall polysaccharides from the mesocarp of grape berries during veraison. Physiologia Plantarum. 2001;111(2):188-95. [6] Deytieux-Belleau C, Vallet A, Donèche B, Geny L. Pectin methylesterase and polygalacturonase in the developing grape skin. Plant Physiology and Biochemistry. 2008;46(7):638-46. [7] Chauhan O, Lakshmi S, Pandey A, Ravi N, Gopalan N, Sharma R. Non-destructive quality monitoring of fresh fruits and vegetables. Defence Life Science Journal. 2017;2(2):103-10. [8] Shah M, Binti L.Instrumental and Ultrasonic Techniques in Quality Evaluation of Fresh Fruit and Vegetables: University of Leeds; 2016.

International Journal of Chemical and Environmental Sciences Vol 1 Issue 2, 2020 ISSN 2689-6389 (Print) ISSN2687-7939 (Online)
Synthesis, Characterization and Sorptive Removal of Heavy metals on Nano-Structured Agglomerates of Iron (III)-Cerium (IV) Bimetal Mixed Oxide (NICMO): Search For An Efficient, Low Cost Decontamination Technique Received for publication, December 10, 2019, and in revised form, January 15, 2020
Tina De1*, Abir Ghosh1, Uday Chand Ghosh1 1Department of Chemistry, Presidency University, 86/1 College Street, Kolkata-700073
Abstract
Nano particles usually exhibit remarkable physical properties, rapid chemical reactivity, and high sorption capacity for inorganic compounds. Studies of the fate and transport of nano particles were largely concerned with their properties and behavioral change over time, whether they would interact with toxic contaminants after being released into the environment.Keeping in line with the above facts, here, we aim to develop an efficient material by eco-friendly green synthetic route that was further characterized to be crystalline ranging in nano-dimension for filtering heavy metals containing groundwater. The average particle size was found to be approximately 3.56 nm calculated from the Gaussian fit of the distinct peaks and then computing its modeled data into Scherrer’s equation.The thermal stability of iron(III)-cerium(IV) mixed oxide nanoparticle agglomerates (NICMO) was well established from the consistent particle size at different temperature and also, from differential thermal. The bimetal mixed oxide contained agglomerated crystalline nano-particles of dimension 10-20 nm held together by crystal packing forces and, its corresponding empirical composition FeCe1.1O7.6. Appearance of weak band at 534 cm-1 in the FTIR spectrum of NICMO is presumed for the presence of hetero- metal bonding via oxygen linkage (i.e, Fe-O-Ce). Scanning electron microscopic (SEM) image of NICMO established the agglomerated surface morphology with irregular shape that was unevenly dispersed over a base matrix of oxide surface almost covering up its porous nature. Decreasing sharpness of inflexion points of NICMO in BET isotherm indicates porosity arising out of channels of the template framework but surely with non uniformity in pore size distribution.The positive change in entropy (∆S°) values of both Pb(II) and Cd(II) species with NICMO in the systems investigated conclude that the reactions were entropy driven, occurring with increase of randomness at solid-liquid interface owing to the release of water molecules when hydrated Pb(II) and Cd(II) species binds on to the solid surface
Keywords Nano-dimension,surface morphology, pore size distribution, solid-liquid interface
Introduction
The multifold increase in the use of heavy metals over the past few decades has inevitably resulted in an increased flux of metallic substances into the environment. Water pollution has become an emergent anxiety over the last century as more and more waste is being disposed off in water bodies. The presence of metal ions in industrial waste water, ground water and soils can pose a significant threat to human health and ecological systems. Heavy metal ions in water pose a serious threat to human health and environment due to their toxic effects, carcinogenicity, bio- accumulation and non- biodegradability [1]. Heavy metals such as lead (Pb), cadmium (Cd), arsenic (As), mercury (Hg), and chromium (Cr) are the most concerned as these are potentially accountable for most of the heavy metal related diseases. Heavy metal ions such as Cd(II) and Pb(II) are dangerously toxic to the public health for their high mobilization ability via complex formation through surface soil onto the groundwater. Cd(II) & Pb(II) have been known as carcinogens. The Water Supply (Water

IJCAES Vol 1, Issue 2, 2020
ISSN 2689-6389 (Print)
ISSN2687-7939 (Online) 20
Quality) Regulations 2000 of United Kingdom suggested that the maximum allowed concentration (MAC) limit is 0.005 ppm in drinking water for cadmium. On the other hand EPA drinking water standards for lead are 0.02 ppm. Lead has no significant use and biological function in human body, but its presence has severe impact on health of children as well as adults which include harsh toxic effect such as damage of brain, cancer, hepatitis, nerve disorders, high blood pressure, renal failure, anaemia, insomnia, reproductive problems [2]. The key sources of lead are mainly industrial processes such as lead smelting, battery manufacturing, ceramic and glass manufacturing industries, printing and pigment, iron and steel manufacturing [3]. Cadmium is considered as a non-essential and a highly toxic element possibly because it forms a strong bond with sulphur and hence, can displace essential metals e.g, Zn 2+ and Ca2+ from the binding sites of certain enzymes. Cadmium is extensively used in manufacturing Ni–Cd cells, metal plating, metallurgical alloying, fertilizers, mining, etc. Chronic exposure in Cd(II) is known to cause lung insufficiency, bone lesions, kidney damage and hypertension in mammals and humans. To avoid health problems due to intake of excess metal ions, several methods developed for the treatment of contaminated water are surface adsorption, chemical precipitation, ion-exchange, nano-filtration, membrane separation, reverse osmosis, etc. Among them, surface adsorption is found to be the most popular method for easy operation, reusability, the requirement of less space and cost effectiveness. Adsorption of Cd(II) for the removal was investigated using sugar beet pulp [4], iron ore slime [5], macro fungus biomass [6], algal biomass [7] etc. On the other hand, adsorption of Pb(II) for the removal was also investigated using various adsorbents such as activated carbon, iron oxides, filamentous fungal biomass, natural condensed tannin etc have been explored [8]. Despite the materials tested are cheap yet their low removal capacities limit their usability in practice. Adsorption capacity and reusability of ion- exchange resins are a quite satisfactory but low thermal stability and high production cost limit the practical utility in third world countries like India. Ceria nano-particles were considered to be a representative member of an industrially important class of metal oxide nano-particles; they could be used as automotive catalytic converters, UV-blocking agents, and single, nanowire- based gas sensors. Owing to the presence of high affinity surface hydroxyl groups, hydrous cerium oxide (HCO) nano-partices showed encouraging sorption capacity. Therefore, we have aimed to investigate the sorption behavior of Pb(II) and Cd(II) on nano-structured iron(III)-cerium(III) mixed oxide (NICMO) and report systematically. Materials and Methods Chemicals The stock solutions (1000 mg·L −1) of Cd(II) and Pb(II) were made separately by dissolving an appropriate amount of cadmium(II) chloride and Lead(II) nitrate, (guaranteed reagents, E. Merck India) in slightly acidic solution (1.5% nitric acid) that were further diluted to get the desired concentrations for the experiments. The exact concentration of each test solution was analyzed by atomic absorption spectrophotometer (AAS) against the standard. Synthesis of NICMO Solutions of ferric chloride (0.1M) and ACN (0.1M) were prepared separately by dissolving appropriate amounts in 0.1 M hydrochloric acid. Then, ACN solution was added slowly to

IJCAES Vol 1, Issue 2, 2020
ISSN 2689-6389 (Print)
ISSN2687-7939 (Online) 21
ferric chloride solution with vigorous stirring (v/v = 1:1). To it 5(M) sodium hydroxide solution was added drop wise into the above mixture with continuous stirring to increase pH 9.0 to 9.5.The gel like precipitate with mother liquid was allowed to stand for 48 hours before filtration without disturbing. The filtered precipitate was washed three times with distilled water and dried at 100°C in an air oven. The dried product was ground in a mortar and pestle and sieved to separate the agglomerates having dimension ranged in 140-290 µm. The sieved material was homogenized at pH 7.0 (± 0.2) before its use in experiments. Results and Discussions Physicochemical characterization of NICMO XRD pattern analysis X-ray diffraction (XRD) patterns of (a) iron(III) oxide, (b) cerium(IV) oxide and (c) NICMO samples have been shown in Fig. 1A, which showed crystalline nature of the samples. Comparison of °2θ values for the XRD peak positions of three synthetic materials have shown that the two peaks were identical with CeO2 phase having cubic structures corresponding to (hkl) values (111) and (220), and one common to Ce2O3 phase having hexagonal structures corresponding to the (hkl) value (201), respectively. However, only one XRD peak of NICMO has been found close to α-Fe 2O3, indicating incorporation of some Fe3+ ion in to the crystal structure of cerium oxide either by replacement or occupying void space. It has also revealed that the sharpness of XRD peaks of CeO 2 (pattern-b, Fig. 1A) is greater than that of NICMO owing to the incorporation of Fe3+ ions into the well defined crystallites of CeO2. The broader peaks of XRD patterns of NICMO than its corresponding pure counterparts (CeO2 or Fe2O3) was presumably due to the crystal strain owing to the substitution of some Ce4+ (0.97 Å) by smaller Fe3+ (0.65 Å) in the unit cell.
Figure 1A: X-ray diffraction patterns of synthetic (a) Fe2O3, (b) CeO2 and (c) NICMO
Figure 1B: X-ray diffraction patterns of NICMO calcined at (°C) (a) 100, (b) 200, (c) 300, (d) 400, (e) 500
XRD patterns of the NICMO samples prepared by calcining at 100°, 200°, 300°, 400° and 500° C temperatures respectively have been shown in Fig. 1B. Comparing the peaks at °2θ values (= 28.5°, 33.1°, 47.5°, 56.6° and 58.28°) among the calcined samples with the standard JCPDS data has established (Table-1a) that the peak at °2θ = 33.1 was common to all calcined NICMO samples, indicating α-Fe2O3 phase of hematite variety having rhombohedra structures with (h k l ) value (104). The peaks obtained at °2θ = 28.5° (hkl = 111) and 47.5° (hkl = 220) are for the cubic CeO2 in NICMO. The well-defined XRD peak at °2θ = 56.6° obtained for NICMO sample calcined at 100˚C has been assigned for the hexagonal Ce 2O3 phase (hkl = 201). The lowering of intensity of this peak and gradual superimposing with the adjacent peak with increasing incinerated
IJCAES Vol 1, Issue 2, 2020
ISSN 2689-6389 (Print)
ISSN2687-7939 (Online) 22
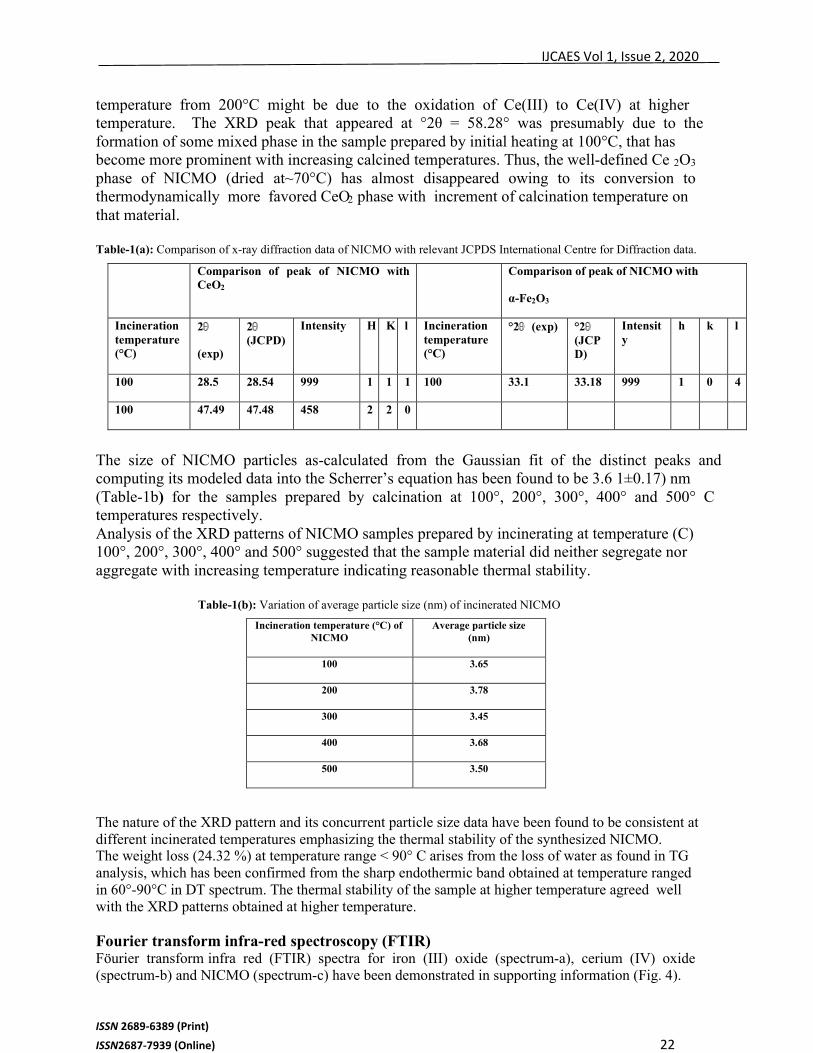
temperature from 200°C might be due to the oxidation of Ce(III) to Ce(IV) at higher temperature. The XRD peak that appeared at °2θ = 58.28° was presumably due to the formation of some mixed phase in the sample prepared by initial heating at 100°C, that has become more prominent with increasing calcined temperatures. Thus, the well-defined Ce 2O3 phase of NICMO (dried at~70°C) has almost disappeared owing to its conversion to thermodynamically more favored CeO2 phase with increment of calcination temperature on that material. Table-1(a): Comparison of x-ray diffraction data of NICMO with relevant JCPDS International Centre for Diffraction data.
Comparison of peak of NICMO with CeO2
Comparison of peak of NICMO with
α-Fe2O3
Incineration temperature (°C)
2
(exp)
2 (JCPD)
Intensity H K l Incineration temperature (°C)
°2 (exp) °2 (JCPD)
Intensity
h k l
100 28.5 28.54 999 1 1 1 100 33.1 33.18 999 1 0 4
100 47.49 47.48 458 2 2 0
The size of NICMO particles as-calculated from the Gaussian fit of the distinct peaks and computing its modeled data into the Scherrer’s equation has been found to be 3.6 1±0.17) nm (Table-1b) for the samples prepared by calcination at 100°, 200°, 300°, 400° and 500° C temperatures respectively. Analysis of the XRD patterns of NICMO samples prepared by incinerating at temperature (C) 100°, 200°, 300°, 400° and 500° suggested that the sample material did neither segregate nor aggregate with increasing temperature indicating reasonable thermal stability.
Table-1(b): Variation of average particle size (nm) of incinerated NICMO
Incineration temperature (°C) of NICMO
Average particle size (nm)
100 3.65
200 3.78
300 3.45
400 3.68
500 3.50
The nature of the XRD pattern and its concurrent particle size data have been found to be consistent at different incinerated temperatures emphasizing the thermal stability of the synthesized NICMO. The weight loss (24.32 %) at temperature range < 90° C arises from the loss of water as found in TG analysis, which has been confirmed from the sharp endothermic band obtained at temperature ranged in 60°-90°C in DT spectrum. The thermal stability of the sample at higher temperature agreed well with the XRD patterns obtained at higher temperature. Fourier transform infra-red spectroscopy (FTIR) Föurier transform infra red (FTIR) spectra for iron (III) oxide (spectrum-a), cerium (IV) oxide (spectrum-b) and NICMO (spectrum-c) have been demonstrated in supporting information (Fig. 4).

IJCAES Vol 1, Issue 2, 2020
ISSN 2689-6389 (Print)
ISSN2687-7939 (Online) 23
Bands (spectra- a to c, Fig. S1) that appeared at wave number (υ, cm -1) range 3700-3300 and 1750-1600 are due to the symmetrical and asymmetrical stretching and bending vibration modes of O-H bonds of hydroxyl groups, respectively. Additionally, the absorption band around 870 cm-1 in pure iron (III) oxide (spectrum-a) and 860 cm-1 in pure cerium (IV) oxide (spectrum-b) are probably for the metal- oxygen (Fe-O and Ce-O) bonds, respectively. Bands at wave number (cm-1) 1385 and 1060 cm-
1 are presumed for symmetrical and asymmetrical bending vibration of metal bonded hydroxyl group (M-OH) in the bimetal mixed oxide, respectively (spectrum-c). Appearance of a weak band at 534 cm-
1 in the spectrum-c of NICMO (Fig. 4) is presumed for the hetero metal oxygen bond (Fe-O-Ce). Thus, the oxide as-prepared by the precipitation method has been characterized as a bimetal hydrous mixed oxide.
Figure- 4: FTIR analysis of (a) Synthetic Iron(III) oxide, (b) Synthetic Cerium(IV) oxide, and (c) Iron(III)-Cerium (IV) bimetal mixed oxide formed by chemical precipitation (NICMO)
Scanning electron microscopic (SEM) image of NICMO
Fig. 5(a) shows SEM image of NICMO, which established the agglomerated surface morphology with irregular shape that was unevenly dispersed over a base matrix of oxide surface almost covering up its porous nature. SEM image of NICMO with EDAX analyzed data at marked site [(Fig. 5(b)] shows that the surface mean percentage (parenthesis) composition of NICMO sample was O (37.39), Ce (47.52) and Fe (17.06), indicating Fe: Ce mole ratio to 1: 1.1 and empirical composition FeCe1.1 O7.6.
(a) (b)
Figure5. .Scanning electron microscopic (SEM) image of (a) NICMO (b) Scanning electron microscopic (SEM)
image with EDAX data of NICMO

IJCAES Vol 1, Issue 2, 2020
ISSN 2689-6389 (Print)
ISSN2687-7939 (Online) 24
Figure5. .Scanning electron microscopic (SEM) image of (a) NICMO (b) Scanning electron microscopic (SEM)
image with EDAX data of NICMO
Transmission electron microscopic (TEM) image of NICMOTransmission electron microscopic (TEM) image of NICMO with 4.3×10⁴ fold magnification has been shown in Fig. 6.
All results in weight%
The size of crystallite particles ranged between 8 to 10 nm under crystal packing force as estimated from the TEM image. The crystallites size of NICMO obtained by inserting XRD peak data into Scherrer’s equation (3.56 nm) were found to be lower than that obtained from the TEM image owing to the approximation incorporated to drive that solid state physics equation. Microcrystalline nature with crystallite size 8 to 10 nm packed within NICMO agglomerates under crystal packing forces is estimated from TEM image analysis which is about 2.5 times greater compared to XRD data.
Figure6.Transmission electron microscopic image of NICMO
BET surface area analysis of NICMO
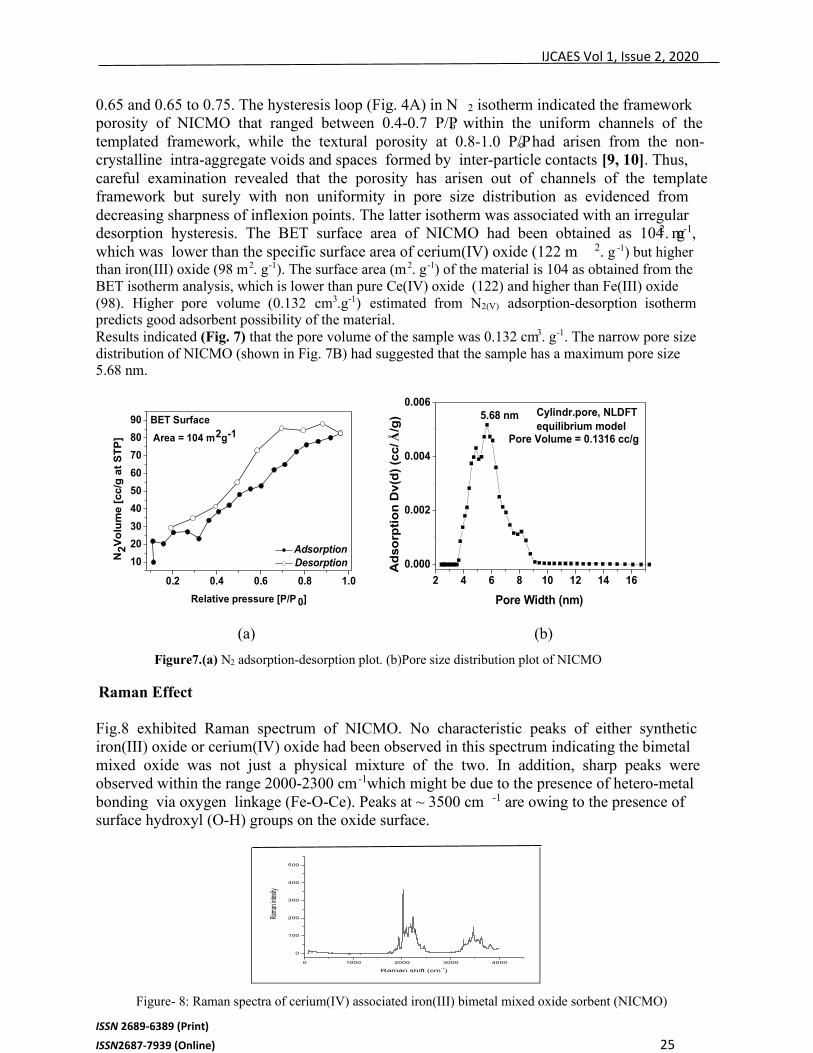
Plots of (A) N2(vapor) adsorption-desorption and (B) pore size distribution of NICMO has been presented in Fig. 7. The isotherm clearly showed the gradual increase of adsorption from P/P o 0.1 to 0.2 followed by a large and two small inflections at P/P o ranged in 0.1 to 0.35, 0.55 to
Spectrum In stats. O Fe Ce Total
Spectrum 1 Yes 40.47 13.91 45.62 100.00
Spectrum 2 Yes 7.29 17.85 74.85 100.00
Spectrum 3 Yes 34.31 16.27 49.42 100.00
Mean 27.36 16.01 56.63 100.00
Std. deviation 17.65 1.98 15.90
Max. 40.47 17.85 74.85
Min. 7.29 13.91 45.62
IJCAES Vol 1, Issue 2, 2020
ISSN 2689-6389 (Print)
ISSN2687-7939 (Online) 25
0.65 and 0.65 to 0.75. The hysteresis loop (Fig. 4A) in N 2 isotherm indicated the framework porosity of NICMO that ranged between 0.4-0.7 P/Po within the uniform channels of the templated framework, while the textural porosity at 0.8-1.0 P/Po had arisen from the non-crystalline intra-aggregate voids and spaces formed by inter-particle contacts [9, 10]. Thus, careful examination revealed that the porosity has arisen out of channels of the template framework but surely with non uniformity in pore size distribution as evidenced from decreasing sharpness of inflexion points. The latter isotherm was associated with an irregular desorption hysteresis. The BET surface area of NICMO had been obtained as 104 m2. g-1, which was lower than the specific surface area of cerium(IV) oxide (122 m 2. g -1) but higher than iron(III) oxide (98 m2. g-1). The surface area (m2. g-1) of the material is 104 as obtained from the BET isotherm analysis, which is lower than pure Ce(IV) oxide (122) and higher than Fe(III) oxide (98). Higher pore volume (0.132 cm3.g-1) estimated from N2(V) adsorption-desorption isotherm predicts good adsorbent possibility of the material. Results indicated (Fig. 7) that the pore volume of the sample was 0.132 cm3. g-1. The narrow pore size distribution of NICMO (shown in Fig. 7B) had suggested that the sample has a maximum pore size 5.68 nm.
0.2 0.4 0.6 0.8 1.0
10
20
30
40
50
60
70
80
90
Adsorption DesorptionN
2V
olu
me [
cc/g
at
ST
P]
Relative pressure [P/P 0]
BET Surface
Area = 104 m2g-1
2 4 6 8 10 12 14 16
0.000
0.002
0.004
0.006A
dso
rpti
on
Dv(d
) (c
c/ Å
/g)
Pore Width (nm)
5.68 nm Cylindr.pore, NLDFT equilibrium model
Pore Volume = 0.1316 cc/g
(a) (b)
Figure7.(a) N2 adsorption-desorption plot. (b)Pore size distribution plot of NICMO
Raman Effect
Fig.8 exhibited Raman spectrum of NICMO. No characteristic peaks of either synthetic iron(III) oxide or cerium(IV) oxide had been observed in this spectrum indicating the bimetal mixed oxide was not just a physical mixture of the two. In addition, sharp peaks were observed within the range 2000-2300 cm -1which might be due to the presence of hetero-metal bonding via oxygen linkage (Fe-O-Ce). Peaks at ~ 3500 cm -1 are owing to the presence of surface hydroxyl (O-H) groups on the oxide surface.
0 1000 2000 3000 4000
0
100
200
300
400
500
Rama
n inte
sity
Raman shift (cm-1)
Figure- 8: Raman spectra of cerium(IV) associated iron(III) bimetal mixed oxide sorbent (NICMO)

IJCAES Vol 1, Issue 2, 2020
ISSN 2689-6389 (Print)
ISSN2687-7939 (Online) 26
The analyzed physical characteristics of NICMO sample were summarized in Table-2
Table-2: Summarized physical characteristic features of NICMO sample
Physical Characteristic Parameters of NICMO Physical Characteristics
Average particle size (XRD Analysis) (nm) 3.56
Band Assignment in FTIR Spectra (cm -1) Hetero-metal bridging at 534.
pHZPC 7.13 (± 0.1)
Empirical formula derived from SEM Analysis FeCe1.1 O7.6
Particle size (TEM) Analysis) (nm) 10 to 20
BET Surface Area (m2. g-1)
104
Effect of pH Fig. 9 (a, b & c) demonstrates the sorption capacity of Cd(II) and Pb(II) from their aqueous solutions of concentration 5.0 and 10.0 mg. L -1 respectively against initial solution pH (pH i) from 2.0 to 9.0 . It was found that the metal ion sorption capacity increases rapidly with increasing pH i from 0 to 5.0, and there after it remain almost constant or slowly decreased. Further which it was followed by steady increase at higher pH (pH > 8.0). Comparison of the data with control experiments showed that removal of Cd(II) and Pb(II) before pHi 6.0 by other principles were insignificant because the OH− concentration before pH 6.0 is insufficient to overcome the solubility product of M(OH) 2 where M=Cd(II)/Pb(II). However, removal of Cd(II) or Pb(II) increased at higher pH owing to precipitation, because the OH− concentration after pH 8.0 is sufficient to overcome the solubility product of M(OH) 2 .Thus, the pHi was optimized to be 5.0 for removal of the metal ions from their aqueous solutions.
2 3 4 5 6 7 8 9 101.4
1.6
1.8
2.0
2.2
2.4
q e
(m
g.g-
1 )
pH
2 3 4 5 6 7 8 9 10
8
10
12
14
16
18
20
q e
( m
g.g-1
)
p H
A B
Figure- 9: Effect of initial solution pH on (A) Cd (II) and (B) Pb (II) sorption
Kinetic modeling For the analysis of kinetic data the two kinetic equations viz. pseudo first order and pseudo-second order equation were used .The non-linear form of the equations are given below in

IJCAES Vol 1, Issue 2, 2020
ISSN 2689-6389 (Print)
ISSN2687-7939 (Online) 27
Table-3k1 (min-1) and k2 (mg. g-1. min-1) are rate constants, qe (mg. g-1) the equilibrium sorption capacity, and qt (mg. g-1) is the amount of adsorption at time, t (min). Figure 10 demonstrates q t (mg. g -1) versus reaction time (t, min) at T = 303 ± 1.6 K and pH i = 5.0 0.2 on NICMO. It was observed that q t increased rapidly in the first 50 minutes where more than 80-85% of the sorption occurred in case of Cd(II) sorption (Fig. 10 A and B). While 90% of Pb(II) sorption was almost completed within 35-40 minutes while remaining 10-15% sorption took place between 50 and 120 mins as shown in (Fig. 10 C and D). Results showed that the time required to reach equilibrium increased with increasing adsorbate concentration. The parameters calculated from the analysis of modeled kinetic equation had been given in Table 3(a, b) for Cd(II) and Pb(II) respectively.
Table-3(a): Kinetic parameters estimated for Cd(II) sorption onto NICMO at 30°C and pHi = 5.0 (±0.2) Kinetic models Kinetic parameters Concentration(mg. dm-3)
5.0 10.0
Pseudo-first order
χ2 0.0113 0.17
R2 0.7086 0.8641
k1(min.-1) 0.0856 0.0311
qe (mg.g-1) 0.9497 3.9323
Pseudo-second order
χ2 0.004 0.097
R2 0.8959 0.9225
k2 (mg. g-1min-1) 0.0129 0.0084
qe (mg.g-1) 1.0334 4.5893
Table- 3(b): The kinetic parameters estimated for Pb(II) sorption onto NICMO at 30°C and pHi = 5.0 (±0.2)
Kinetic
models
Kinetic parameters
Concentration(mg. dm-3)
5.0 10.0
Pseudo-first order
χ2 0.0113 0.0473
R2 0.7086 0.8039
k1(min.-1) 0.0856 0.1541
qe (mg.g-1) 0.9496 3.1213
Pseudo-second order
χ2 0.004 0.0065
R2 0.8959 0.9729
k2 (mg.g-1min-1) 0.1293 0.0722
qe (mg.g-1) 1.0333 3.3407

IJCAES Vol 1, Issue 2, 2020
ISSN 2689-6389 (Print)
ISSN2687-7939 (Online) 28
Analysis of the result showed that pseudo-second order kinetic model fit was better than that of first in case of sorption reaction of both the metals onto NICMO surface. Pseudo-second order rate constant values (k2) decreased with increase of initial metal ion concentration for both the sorption reactions. This was due to higher time required to reach equilibrium for higher concentration of metal ion (10.0 mg/l).
0 20 40 60 80 100 120 140 160 180 200
0.5
0.6
0.7
0.8
0.9
1.0
1.1
q t (m
g.g-1
)
T (min)
p s e u d o 1 s t o r d e r
p s e u d o 2 n d o r d e r
0 20 40 60 80 100 120 140 160 180 2001.8
2.0
2.2
2.4
2.6
2.8
3.0
3.2
3.4
3.6
q t (m
g.g-1
)
T (m i n)
P s e u d o 1 s t o r d e r P s e u d o 2 n d o r d e r
A B
0 20 40 60 80 100 120 140 160 180 2000.0
0.2
0.4
0.6
0.8
1.0
q t(mg.
g-1)
T ( m i n )
P s e u d o 1 s t o r d e r P s e u d o 2 n d o r d e r
0 20 40 60 80 100 120 140 160 180 2001.0
1.5
2.0
2.5
3.0
3.5
4.0
4.5
q t (
mg.
g-1)
T ( m i n )
P s e u d o 1 s t o r d er P s e u d o 2 n d o r d e r
C D
Figure 10: Kinetic modeling of Pb, Cd sorption on NICMO (A) 5 ppm (B) 10 ppm Pb solution, (C) 5 ppm (D) 10 ppm Cd solution
Isotherm modeling
For the analysis of equilibrium data, two isotherm equations viz Langmuir (27) and Freundlich (28) were used. The detailed of the equations has been given in table-II where q e is the equilibrium sorption capacity (mg.g-1), Ce the equilibrium concentration (mg. dm-3), qm, the Langmuir monolayer adsorption capacity (mg. g -1) and b is the binding constant (dm 3. mg-1) for the sites of identical energy, KF (mL1/n mg1-1/n) and n (dimensionless) are the Freundlich constants. Variations of qe (mg·g−1) against Ce (mg· L−1) were demonstrated in Figs. 11 (A, B & C) and 11(D, E & F), respectively, for Cd(II) and Pb(II) sorption reaction at temperature 15°, 30°and 45 °C. The data for Cd(II) and Pb(II) sorptions by NICMO were separately analyzed by isotherm models using non-linear regression fit method. It was found that the equilibrium data described the Langmuir model better than Freundlich model for both the metal ions. Values of Langmuir monolayer sorption capacity qm (mg/g) increased with increasing reaction temperature. This indicated that the availability of higher energy sorption sites of the adsorbents increased with increasing temperature of the reactions. Langmuir monolayer sorption capacity qm (mg/g) were 3.16, 8.84 and 10.99 while that of 7.40, 11.01 and 17.18 respectively for Cd(II) and Pb(II) sorption reaction onto NICMO surface at temperature 15, 30 and 45 °C. This indicated that the available higher energy active site consequently increases with increase of temperature since greater amount of adsorbate was sorbed at the

IJCAES Vol 1, Issue 2, 2020
ISSN 2689-6389 (Print)
ISSN2687-7939 (Online) 29
sorbent surface. This also indicated the endothermic nature of Cd(II) sorption onto NICMO surface. Identical trends of observations were also found in case of Pb(II) sorption reaction Table- 4(a): The isotherm parameters estimated for Cd(II) sorption onto NICMO at different temperatures and pHi = 5.0 (±0.2)
Isotherm
models
Isotherm parameters
Temperature (oC)
15 30 45
Langmuir
χ2 2.405 0.0798 0.1006
R2 0.9640 0.9482 0.9865
b (dm3. mg-
1) 0.5603 0.0496 0.2686
qm (mg.g-1) 3.16441 8.8409 10.9912
Freundlich
χ2 0.01457 0.1132 0.5404
R2 0.97822 0.9266 0.9278
n 3.25554 1.2689 2.3050
KF 1.29582 0.4733 2.4099
Table- 4(b): The isotherm parameters estimated for Pb(II) sorption onto NICMO at different temperatures and
at pHi = 5.0 (±0.2)
Isotherm
models
Isotherm parameters
Temperature (o C)
15 30 45
Langmuir
χ2 0.16921 0.24155 0.19082
R2 0.96661 0.97931 0.98549
b (dm3. mg-
1) 1.09265 1.42379 0.45849
qm (mg.g-1) 7.42969 11.01408 17.17869
Freundlich
χ2 .34474 0.67835 .62933
R2 0.93198 0.94188 0.95214
n 3.06012 2.74684 2.27015
KF 3.70218 5.87384 5.77023

IJCAES Vol 1, Issue 2, 2020
ISSN 2689-6389 (Print)
ISSN2687-7939 (Online) 30
0 1 2 3 4 5 6 7 80
1
2
3
4
5
6
7
qe
(mg.
g-1)
Ce (mg.L-1)
L a n g m u i r
F r e u n d l i c h
0 1 2 3 40
1
2
3
4
5
6
7
8
9
qe
(mg.
g-1)
Ce(mg.L-1)
L a n g m u i r F r e u n d l i c h
1 2 3 4 5 6 7 8
4
6
8
10
12
14
qe (
mg.
g-1)
Ce (mg.L-1)
L a n g m u i r F r e u n d l i c h
0 2 4 6 8 10 12 14 160.5
1.0
1.5
2.0
2.5
3.0
L a n g m u i r F r e u n d l i c h
q e
(mg .
g-1)
Ce (mg.L-1)
2 4 6 8 10 12 14
0.5
1.0
1.5
2.0
2.5
3.0
3.5
4.0
L a n g m u i r F r e u n d l i c h
q e
( m
g.g
-1)
C e (m g.L-1)
0 2 4 6 8 10 12 14 160
2
4
6
8
L a n g m u i r F r e u n d l i c h
q e
(m
g.g-1
)C e (mg.L-1)
A B C
D E F
Figure 11: Isotherm modeling of sorption of Pb (K) at (A) 288, (B) 303, (C) 313 and Cd (K) at (D) 288 (E) 303 (F) 313 on
NICMO
Conclusion
Present work explore a new cheaper and selective sorbent (NICMO) as an alternative of costly sorbents for the separation of Pb(II) and Cd(II) ions. The main advantages of procedure are the ease and simplicity of preparation of sorbent, sensitivity, rapid attainment of phase equilibration and high capacity values. Sorption of Cd(II) and Pb(II) on NICMO obeyed pseudo-second order kinetics and Langmuir sorption isotherm. The monolayer sorption capacity increase with increasing temperature on the reactions.
References
[1] J. Chawla, R. Kumar, I. Kaur, Carbon nanotubes and graphenes as adsorbents for adsorption of lead ions from water: a review, J. of Water Supply: Research and Technology AQUA, 64 (6) (2015) 641–659
[2] O. Yavuz, R. Guzel, F. Aydin, I. Tegin, R. Ziyadanogullari, Removal of cadmium and lead from aqueous solution by calcite. Polish Journal of Environmental Studies, 16 (3) (2007) 467–471.
[3] S. K. Srivastava, V. K. Gupta, D. Mohan, Removal of lead and chromium by activate slab– A blast furnance waste, Journal of Environmental Engineering, 123 (1999) 461–468.
[4] Y.N. Mata, M.L. Blázquez, A. Ballester, F. González, J.A. Muñoz, Sugar beet pulp pectin gels as biosorbent for heavy metals: preparation and determination of biosorption and desorption characteristics, Chem. Eng. J. 150 (2009) 289–301.
[5] M. Mohapatra, K. Rout, B. K. Mohapatra, S. Anand, Sorption behaviour of Pb(II) and Cd(II) on iron ore slime and characterization of metal ion loaded sorbent, J. Hazard. Mater. 166 (2009) 1506–1513
[6] R. A. Anayurt, A. Sari, M. Tuzen, Equilibrium, thermodynamic and kinetic studies on biosorption of Pb(II) and Cd(II) from aqueous solution by macrofungus (Lactarius scrobiculatus) biomass, Chem. Eng. J. 151 (2009) 255–261
IJCAES Vol 1, Issue 2, 2020
ISSN 2689-6389 (Print)
ISSN2687-7939 (Online) 31
[7] V.J.P. Vilar, S.C. Santos, R.J.E. Martins, C.M.S. Botelho, R.A.R. Boaventura, Cadmium uptake by algal biomass in batch and continuous (CSTR and packed bed column) adsorbers, Biochem. Eng. J. 42 (2008) 276–289.
[8] Y.H. Li, Z.C. Di, J. Ding, D.H.Wu, Z.K. Luan, Y.Q. Zhu, Adsorption thermodynamic, kinetic and desorption studies of Pb2+ on carbon nanotubes, Water Res. 39 (2005) 605–609.
[9] Zhang, Y., Yang, M., Don, X.M. Arsenate adsorption on an Fe-Ce bimetal oxide adsorbent: role of surface properties. Environ. Sci. Technol. 39 (2005) 7246-7253.
[10] Kim, Y., Kim, C., Choi, I., Rengaraj, S., Yi, J. Arsenic Removal Using Mesoporous Alumina Prepared via a Templating Method. Environ. Sci. Technol. 38 (2004) 924-931.
International Journal of Chemical and Environmental Sciences Vol 1 Issue 2, 2020 ISSN 2689-6389 (Print) ISSN2687-7939 (Online
Corresponding author Email address: [email protected] 32
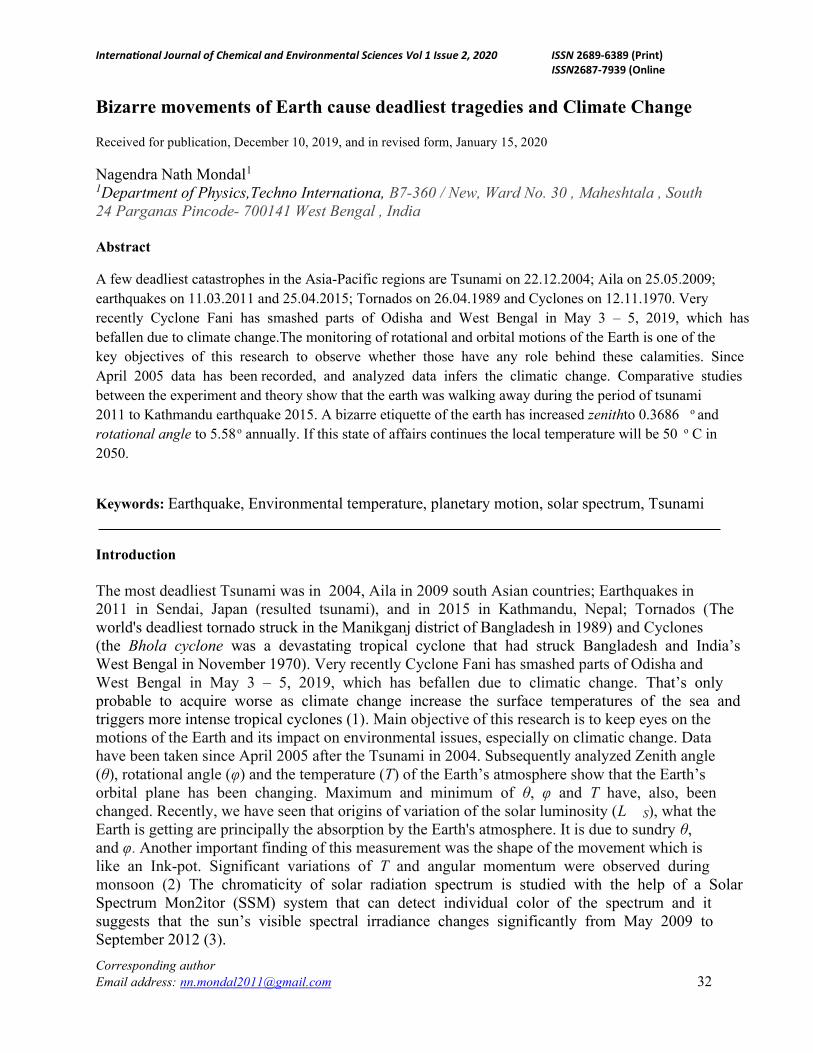
Bizarre movements of Earth cause deadliest tragedies and Climate Change Received for publication, December 10, 2019, and in revised form, January 15, 2020
Nagendra Nath Mondal1 1Department of Physics,Techno Internationa, B7-360 / New, Ward No. 30 , Maheshtala , South 24 Parganas Pincode- 700141 West Bengal , India Abstract A few deadliest catastrophes in the Asia-Pacific regions are Tsunami on 22.12.2004; Aila on 25.05.2009; earthquakes on 11.03.2011 and 25.04.2015; Tornados on 26.04.1989 and Cyclones on 12.11.1970. Very recently Cyclone Fani has smashed parts of Odisha and West Bengal in May 3 – 5, 2019, which has befallen due to climate change.The monitoring of rotational and orbital motions of the Earth is one of the key objectives of this research to observe whether those have any role behind these calamities. Since April 2005 data has been recorded, and analyzed data infers the climatic change. Comparative studies between the experiment and theory show that the earth was walking away during the period of tsunami 2011 to Kathmandu earthquake 2015. A bizarre etiquette of the earth has increased zenithto 0.3686 o and rotational angle to 5.58o annually. If this state of affairs continues the local temperature will be 50 o C in 2050.
Keywords: Earthquake, Environmental temperature, planetary motion, solar spectrum, Tsunami
Introduction The most deadliest Tsunami was in 2004, Aila in 2009 south Asian countries; Earthquakes in 2011 in Sendai, Japan (resulted tsunami), and in 2015 in Kathmandu, Nepal; Tornados (The world's deadliest tornado struck in the Manikganj district of Bangladesh in 1989) and Cyclones (the Bhola cyclone was a devastating tropical cyclone that had struck Bangladesh and India’s West Bengal in November 1970). Very recently Cyclone Fani has smashed parts of Odisha and West Bengal in May 3 – 5, 2019, which has befallen due to climatic change. That’s only probable to acquire worse as climate change increase the surface temperatures of the sea and triggers more intense tropical cyclones (1). Main objective of this research is to keep eyes on the motions of the Earth and its impact on environmental issues, especially on climatic change. Data have been taken since April 2005 after the Tsunami in 2004. Subsequently analyzed Zenith angle (θ), rotational angle (φ) and the temperature (T) of the Earth’s atmosphere show that the Earth’s orbital plane has been changing. Maximum and minimum of θ, φ and T have, also, been changed. Recently, we have seen that origins of variation of the solar luminosity (L S), what the Earth is getting are principally the absorption by the Earth's atmosphere. It is due to sundry θ, and φ. Another important finding of this measurement was the shape of the movement which is like an Ink-pot. Significant variations of T and angular momentum were observed during monsoon (2) The chromaticity of solar radiation spectrum is studied with the help of a Solar Spectrum Mon2itor (SSM) system that can detect individual color of the spectrum and it suggests that the sun’s visible spectral irradiance changes significantly from May 2009 to September 2012 (3).

IJCAES Vol 1, Issue 2, 2020
ISSN 2689-6389 (Print) ISSN2687-7939 (Online) 33
We have developed another SSM with different colored LEDs (Victoria Lighting Pvt. Ltd.) and applied in reverse biased mode. Experimental and theoretical analyzed data had confirmed the attachment of Celestial Positronium (Ps) in the sun and its impact on solar radiation spectrum (4). The origin of the solar spectrum and its associated colors are the fusion reactions, thermal radiation and fundamental interactions of particles-antiparticles. We are worried about the global warming, earthquake, volcanic eruption, tornado and other relevant issues of natural causalities and some of them are directly influenced by the solar irradiation and motion of the earth.A detector based on a diffraction grating is an excellent and inexpensive tool for studying the chromaticity of solar spectrum. The sun is one of the second largest G2-type stars in the Milky Way which is going to grow old, since its birth about 4.5 billion years ago. Bose-Einstein Condensate (BEC) is the fifth state of matter and its studies infer that Ps-BEC is the densest ingredient of our early celestial bodies (5, 6). A bizarre etiquette of the earth is studied and it is found that its motion had made the tsunami in 2011. The report is framed on the measurement of θ, φ, Tand solar spectrum. Some inconsistencies among the parameters have been found, after excavating those data from the month of February to April at around 11:00 hrs. The average rate of change of θ in 2007, 2011 and 2016 respectively are 25ˈ/day, 23ˈ42ˈˈ/day and 17ˈ24ˈˈ/day, and average changes of φ are found to be 65o15ˈ, 71o11ˈ and 63o46ˈ respectively. Remarkable variations of those astronomical parameters show offbeat motions of the earth (7). Recent experimental evidence shows that the deficit of higher frequency photons in solar spectrum transforms greenery to desertification (8). In a recent study we find that mortality of trees of Amazonian rainforest has been driven by climate and functional traits. This report is based on the monthly monitoring of over 1,000 survival rainforest canopy trees from over 200 species over five decades in the Central Amazon (9). Experiments In order to observe the motion of the earth and temperature of the local area a solar spectrum monitor (SSM) was developed using a spike on a protractor based table, thermometer, color filters and photodiodes. Details of this SSM and data taking system can be found elsewhere [1, 4].
Measurement of Earth’s Motions Earth’s motions are of two kinds: (a) Rotational motion around its own axis. It takes 24 hrs. to complete a single rotation. (b) Orbital motion around the sun which takes 365 days or 8760 hrs. Both data were recorded manually by measuring the shadow length and its position respectively during time 7:00 - 16:00 in an hour interval.
Measurement of Temperature In each position of the earth T of the local area was recorded with a laboratory thermometer. In this report only higher T at sunny days around noon are taken into account. In Fig. 1 a typical spectrum of T is displayed. Data are plotted as a histogram and fitted it with Gaussian. The mean T is noted to be 38.40o C. Results & Discussion In this report the highest T per week is considered, i.e., every months 4 – 5 data of each parameter are taken which resulted in 48 – 50 data (January – December) in a year except 2015 (August – December). Data are analyzed statistically in order to find out the average of

IJCAES Vol 1, Issue 2, 2020
ISSN 2689-6389 (Print) ISSN2687-7939 (Online) 34
Fig 1. A histogram is depicted of measured Temperature.
each parameter and those averages are plotted along the vertical axis with respect to year along the horizontal scale. Spectra of each parameter are depicted in Fig. 2 (a-d).
Fig 2. Experimental results of different astronomy and environmental parameters The statistical and observational errors were estimated using the following formula.
�̂�𝑒𝑟𝑟2 (𝑥) = ∑ [𝑥𝑖−𝑥 �̅]2𝑛𝑖=1𝑛−1 (1)
Or, 𝜎𝑒𝑟𝑟 (𝑥) = �̂̅�𝑒𝑟𝑟√𝑛 (2)
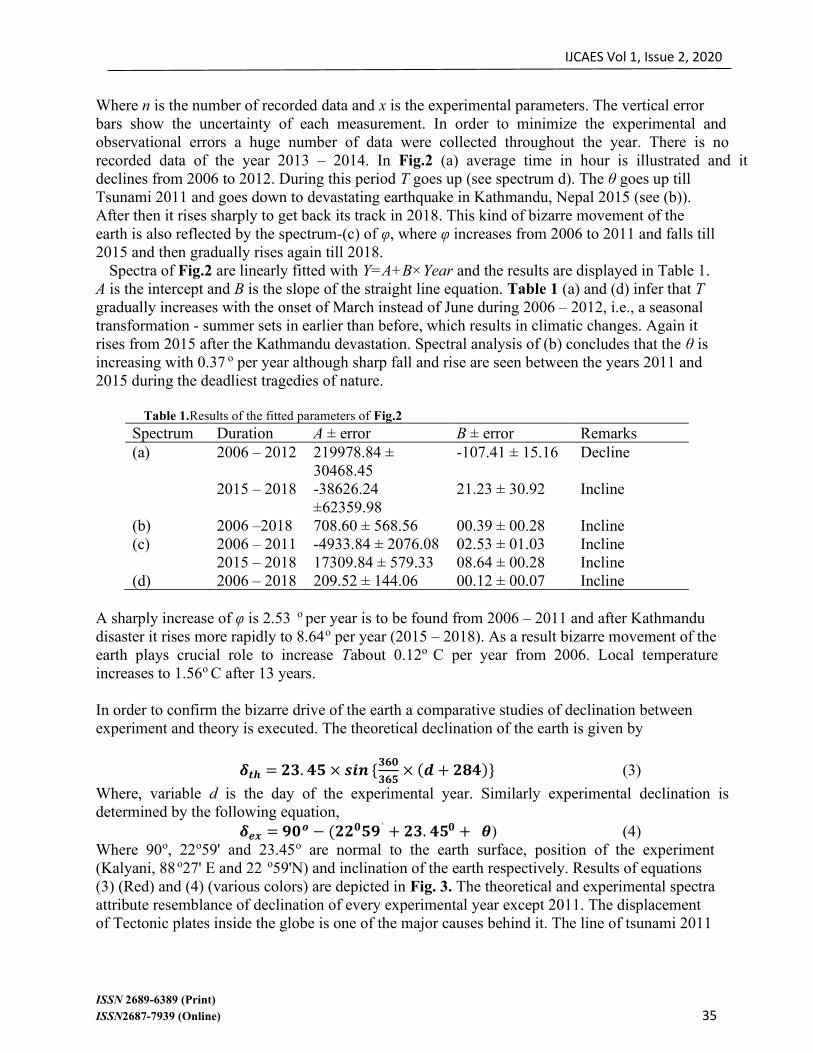
IJCAES Vol 1, Issue 2, 2020
ISSN 2689-6389 (Print) ISSN2687-7939 (Online) 35
Where n is the number of recorded data and x is the experimental parameters. The vertical error bars show the uncertainty of each measurement. In order to minimize the experimental and observational errors a huge number of data were collected throughout the year. There is no recorded data of the year 2013 – 2014. In Fig.2 (a) average time in hour is illustrated and it declines from 2006 to 2012. During this period T goes up (see spectrum d). The θ goes up till Tsunami 2011 and goes down to devastating earthquake in Kathmandu, Nepal 2015 (see (b)). After then it rises sharply to get back its track in 2018. This kind of bizarre movement of the earth is also reflected by the spectrum-(c) of φ, where φ increases from 2006 to 2011 and falls till 2015 and then gradually rises again till 2018.
Spectra of Fig.2 are linearly fitted with Y=A+B×Year and the results are displayed in Table 1. A is the intercept and B is the slope of the straight line equation. Table 1 (a) and (d) infer that T gradually increases with the onset of March instead of June during 2006 – 2012, i.e., a seasonal transformation - summer sets in earlier than before, which results in climatic changes. Again it rises from 2015 after the Kathmandu devastation. Spectral analysis of (b) concludes that the θ is increasing with 0.37 o per year although sharp fall and rise are seen between the years 2011 and 2015 during the deadliest tragedies of nature.
Table 1.Results of the fitted parameters of Fig.2
Spectrum Duration A ± error B ± error Remarks (a) 2006 – 2012 219978.84 ±
30468.45 -107.41 ± 15.16 Decline
2015 – 2018 -38626.24 ±62359.98
21.23 ± 30.92 Incline
(b) 2006 –2018 708.60 ± 568.56 00.39 ± 00.28 Incline (c) 2006 – 2011 -4933.84 ± 2076.08 02.53 ± 01.03 Incline
2015 – 2018 17309.84 ± 579.33 08.64 ± 00.28 Incline (d) 2006 – 2018 209.52 ± 144.06 00.12 ± 00.07 Incline
A sharply increase of φ is 2.53 o per year is to be found from 2006 – 2011 and after Kathmandu disaster it rises more rapidly to 8.64o per year (2015 – 2018). As a result bizarre movement of the earth plays crucial role to increase Tabout 0.12o C per year from 2006. Local temperature increases to 1.56o C after 13 years.
In order to confirm the bizarre drive of the earth a comparative studies of declination between experiment and theory is executed. The theoretical declination of the earth is given by
𝜹𝒕𝒉 = 𝟐𝟑. 𝟒𝟓 × 𝒔𝒊𝒏 {𝟑𝟔𝟎𝟑𝟔𝟓 × (𝒅 + 𝟐𝟖𝟒)} (3)
Where, variable d is the day of the experimental year. Similarly experimental declination is determined by the following equation, 𝜹𝒆𝒙 = 𝟗𝟎𝒐 − (𝟐𝟐𝟎𝟓𝟗ˈ + 𝟐𝟑. 𝟒𝟓𝟎 + 𝜽) (4) Where 90o, 22o59' and 23.45o are normal to the earth surface, position of the experiment (Kalyani, 88 o27' E and 22 o59'N) and inclination of the earth respectively. Results of equations (3) (Red) and (4) (various colors) are depicted in Fig. 3. The theoretical and experimental spectra attribute resemblance of declination of every experimental year except 2011. The displacement of Tectonic plates inside the globe is one of the major causes behind it. The line of tsunami 2011

IJCAES Vol 1, Issue 2, 2020
ISSN 2689-6389 (Print) ISSN2687-7939 (Online) 36
is noted in the spectrum of 2011 after which the bizarre nature of the earth is clearly visible. This nature of movements continue until 2015 (see Fig.2 (b) and (c)).
Fig 3. Theoretical and experimental declinations
Hence, it is not only an alarming situation but also a Global threat for many Asiatic countries like India, Bangladesh, Maldives, Sri Lanka, Indonesia, Japan, Philippines etc.; the countries which are surrounded by many Seas. More than 5 sq. km Island of Sunderban is sinking every year because the sediment has been inflating the basement and the Global warming has been melting the large amount of Arctic Sea ices annually. Not only have that, but a seasonal transformation (climatic change) forced extinction of many species of insects, grass, bush, birds, animals, seeds and fruits in our local area. In a recent research it is found that ghost forests created by the submergence of low-lying land are one of the most striking indicators of climate change along the Atlantic coast of North America. It has led to new recognition that the submergence of earthly land is geographically prevalent, ecologically and economically important, and globally relevant to the survival of coastal wetlands in the face of rapid sea level rise [10]. British Broad Casting (BBC) news in April 30, 2019 mentioned that Indonesia is shifting its capital city Jakarta as it is sinking into the Sea. News also dubbed that Jakarta is one of the fastest- sinking cities in the world [11]. According to Reuter many parts of the city has sunk 13 ft in the past 30 years and it will be fully flooded by 2050 expected by several researchers. Many countries are suffering from heat waves. In a news of Japan Times we have found that millions dead fish causes environmental stink in Australia (fishes died in the Darling River, New South Wales). Not only in Asia but also in European countries like UK heat-wave of 2018 led to changes in consumer behavior in summer, including large increases in electricity demand due to increased use and intensity of refrigeration and air-conditioning devices [12].

IJCAES Vol 1, Issue 2, 2020
ISSN 2689-6389 (Print) ISSN2687-7939 (Online) 37
Conclusion A bizarre movement of the earth is studied by measuring the rotational, orbital motions and local temperature. The significant results of every measurement infer that those parameters play crucial roles behind the deadliest tragedies in the past, present and will act in future too. In order to save living creatures and our beloved planet we should develop scientific awarness to controll the vagaries of nature. Acknowledgements Author is pleased to acknowledge to his family members for allowing him to perform this prolong experiments in the house premises and having financial support from them. References
[1] Dasgupta A. and Priyadarshini S., Why Odisha is a sitting duck for extreme cyclones doi:10.1038/nindia.2019.69 Published online 29 May 2019.
[2] Mondal N. N., Versatile nature of the earth causes disasters. Journal of Environmental Research and Development Vol. 9 No. 01, 75–82, 2014
[3] Mondal N. N., Study chromaticity of Solar spectrum,International Journal of Astronomy and Astrophysics, Vol. 4, 510-518 (2014.
[4] Mondal N. N., Discovered solar Positronium, International Journal of Astronomy and Astrophysics, Vol. 4, 620-627, 2014.
[5] Mondal N. N., Development of solar spectrum monitor based on diffraction grating. IOSR Journal of Applied Physics (IOSR-JAP) e-ISSN: 2278-4861.Volume 8, Issue 6 Ver. II 01-03 2016.
[6] Mondal N. N., Does the fifth state of matter originate the early universe? Journal of Physical Science and Application Vol. 5 Issue 6, 407-414 2015.
[7] Mondal N. N., Studies atypical behavior of earth during Tsunami 2011 in Japan, Journal of Environmental Research and Development Vol. 12 No. 01, 8 –14, 2017.
[8] Mondal N. N., Deficit of higher frequency photons in solar spectrum transforms greenery to desertification, Journal of Environmental Research and Development Vol. 13 No. 02, 181 –185 2018.
[9] Izabela Aleixo, Darren Norris, LiaHemerik, Antenor Barbosa, EduardorPrata, Flavia Costa and LourensPoorter, Amazonian rainforest tree mortality driven by climate and functional traits,Nature Climate Change 9, 384 – 388, 2019.
[10] Katthew L. Kiran and Keryn B. Gedan, Sea-level driven land conversion and the formation of ghost forests. Nature Climate Change 9, 450–457, 2019.
[11] https://earther.gizmodo.com/indonesia-is-moving-its-capital-city-as-the-current-one-1834420363. [12] Shaun Larcom, Po-Wen She and Terry van Gevelt, The UK summer heatwave of 2018 and public
concern over energy security,Nature Climate Change 9, 370–373, 2019.

International Journal of Chemical and Environmental Sciences Vol 1 Issue 2, 2020 ISSN 2689-6389 (Print) ISSN2687-7939 (Online)
Corresponding author Email address: [email protected] 38
A review article on ChIP-Seq tools: MACS2, HOMER, SICER, PEAKANNOTATOR AND MEME Received for publication, December 15, 2019, and in revised form, January 8, 2020
Shrestha Bhowmik1, Anish Ganguly2* 1Department of Microbiology, University of Calcutta 2Department of Environmental Science, University of Calcutta Abstract: Sequencing techniques are improving day by day and along with its improvement Chromatin Immuno-Precipitation followed by high-throughput sequencing(ChIP-Seq) for genome-wide analysis of protein-DNA interaction is getting popular (1). But due to lack of proper powerful ChIP-Seq analysis method several tools with different functions have been developed to identify different transcription factor binding sites, histone modifications, etc.,that influences genome complexity along with other post-transcriptional changes (2). MACS2, HOMER, SICER, PEAK ANNOTATOR, MEME, etc., are some of the tools that help to identify different types of genome modifications due to protein-DNA interaction (3) (4). Keywords: ChIP-Seq, transcription factor binding sites, histone modification, MACS2, HOMER, SICER, PEAK ANNOTATOR, MEME, post-transcriptional changes. Introduction Immunoprecipitation (IP) is the technique of precipitating a protein antigen out of a blendwith the administration of an antibody that specifically binds to that particular protein. This process can be used to seclude and concentrate a specific protein from a test containing many thousands of different proteins. Immunoprecipitation requires an antibody to be conjoin to a solid substrate at some point in the procedure (5) Chromatin Immunoprecipitation (ChIP) uses the same technique of immunoprecipitation to precipitate the particular protein that interacts with the DNA in vivo (Fig 1).
Figure 1:-Workflow of Chromatin Immunoprecipitation(Retrieved from
:https://patents.google.com/patent/US20160140289A1/en)

IJCAES Vol 1, Issue 2, 2020
ISSN 2689-6389 (Print) ISSN2687-7939 (Online) 39
ChIP-Seq is used primarily to determine how transcription factors and other chromatin-associated proteins (histones, RNA polymerase, etc.) influence phenotype-affecting (morphology, biochemical or physiological properties and behaviours, etc) mechanisms[6]. It is essential to understand how proteins interconnect with DNA for authorisation of gene expressions which in turn is important for understanding the various biological processes and disease states. ChIP-Seq technology allows: 1.Combination of chromatin immune-precipitation (ChIP) with ultra-high-throughput massively parallel sequencing.(7) 2.Portraying of protein–DNA interactions in-vivo on a genome-scale.(8,9) Sequencers are used to perform the DNA sequencing process. In ChIP-Seq many types of sequencing platforms are used which are listed below:-
Table1. Different types of Sequencers NAME OF SEQUENCERS SIZE BASE LENGTH
Solexa (Illumina)[7]
1 GB of sequences in a single run 35 bases in length
454 Life Sciences (Roche Diagnostics)[8] 25-50 MB of sequences in a single run
Up to 500 bases in length
SOLiD (Applied Biosystems)[9]
6 GB of sequences in a single run 35 bases in length
Quality control of given datasetsare done using FASTQC software where we get the idea of the read sequence length, number of tags, GC content, adapter content etc(10). Thereafter, adapter trimming is done and reads are aligned to the reference genome using BOWTIE software and the aligned reads are further used for peak calling(11). Peak Calling is a computational protocol which is utilised to detect sectors in a genome that have been augmented with aligned reads as a result of performing a ChIP-sequencing (12). These zones are those where a protein links with DNA. When the protein is a transcription factor, the enhanced area is its transcription factor binding site (TFBS) (12) Popular software programs we use for transcription factors containing data sets include MACS2 (13). When the protein is a histone modification the software we generally use is HOMER or SICER (14).
Figure 2:- Workflow for ChIP-Seq

IJCAES Vol 1, Issue 2, 2020
ISSN 2689-6389 (Print) ISSN2687-7939 (Online) 40
The workflow of ChIP-Seq data generation and analysis is given below: Different Tools Used for ChIP-Seq Analysis: FastQC is a software executed for quality control.[14] The protocol in FastQC is employed by a succession of analysis modules like basic statistics, adapter content, sequence duplication levels, individual sequence quality score, individual sequence GC content, sequence length distribution, over expressed sequences, etc. The results of the module give a normal score when it shows green tick, slightly abnormal if it shows orange triangle or very unusual if it shows red cross[10]. Table 2:. Summary of the modules with quick evaluation(Leggett et. al, 2013)
! Basic Statistics
+ Per base sequence quality
+ Per tile sequence quality
+ Per sequence quality scores
+ Per base sequence content
! Per sequence GC content
+ Per base N content
! Sequence Length Distribution
! Sequence Duplication Levels
+ Overrepresented sequences
+ Adapter Content
BOWTIE is the alignment software which is utilized to align the files.[11]This software is an meteoric, memory-efficient short read aligner. It orients short DNA sequences (reads) to the human genome at a rate of over 25 million 35-bp reads per hour. Bowtie gives its result in SAM format[11]’ MACS2 or Model based Analysis on ChIP-Seq is used on short read sequencers such as Genome Analyzer (Illumina / Solexa). This is a peak calling software which usually operates for transcription factors that gives narrow peaks although it has option for analyzing for both narrow and broad peaks[13]. Usage macs2 [-h] [--version] {callpeak,bdgpeakcall,bdgbroadcall,bdgcmp,bdgopt,cmbreps,bdgdiff,filterdup,predictd,pileup,randsample,refinepeak} Example for regular peak calling: macs2 callpeak -t ChIP.bam -c Control.bam -f BAM -g hs -n test -B -q 0.01 Example for broad peak calling: macs2 callpeak -t ChIP.bam -c Control.bam --broad -g hs --broad-cutoff 0.1 There are twelve functions available in MAC2S serving as sub-commands.
Table3. Twelve Sub-commands of MACS2 (Retrieved from: https://taoliu.github.io/MACS/) Subcommand Description callpeak Main MACS2 Function to call peaks from alignment results. bdgpeakcall Call peaks from bedGraph output. bdgbroadcall Call broad peaks from bedGraph output. bdgcmp Comparing two signal tracks in bedGraph format. bdgopt Operate the score column of bedGraph file. cmbreps Combine BEDGraphs of score from replicates. bdgdiff Differential peak detection based on paired four bedGraph files. filterdup Remove duplicate reads, then save in BED/BEDPE format. predictd Predict d or fragment size from alignment results. pileup Pileup aligned reads (single-end) or fragments (paired-end) randsample Randomly choose a number/percentage of total reads. refinepeak Take raw reads alignments, refine peak summits.
IJCAES Vol 1, Issue 2, 2020
ISSN 2689-6389 (Print) ISSN2687-7939 (Online) 41
HOMER or Hyper-geometric Optimization of Motif Enrichment (http://homer.ucsd.edu/) is a software whose operation is based on the tracing the location of histone modification that gives broad peaks[4]. Make Tag Directory: It facilitates the analysis of ChIP-Seq, by transforming the sequence alignment into platform independent data structure representing the experiment which is analogous to loading the data into a database. HOMER does this by creating a "Tag Directory", which is essentially a directory on your computer that contains several files describing your experiment where all the relevant data of the experiment is placed[4][15] makeTagDirectory also performs several quality control steps shown below. tagInfo.txt – this file contains all basic configuration information, such as the total number of reads, the total number of unique positions with aligned reads (by genome and chromosome), and various other statistics. tagLengthDistribution.txt – this file contains a histogram of read lengths used for alignment. tagCountDistribution.txt – this file contains the histogram of clonal read depth, that shows the number of reads per unique position. [4][15] tagAutocorrelation.txt- The autocorrelation routine creates a distribution of distances between two adjacent reads in the genome. If reads are mapped to the same strand, they are added to the first column. If adjacent reads map to different strands, they are added to the second column. The results from autocorrelation analysis are very useful for troubleshooting problems with the experiment, and are used to estimate the fragment length for ChIP-Seq. The fragment length is estimated by finding the position were the "opposite strand" distribution is maximum. (http://homer.ucsd.edu/)[16] SICER or Spatial clustering for Identification of ChIP-Enriched Regionsis a clustering approach for identification of enriched domains from histone modification ChIP-Seqdata[17]. The key concept that SICER uses to capture spatial clustering of reads is island[17].To delineate the islands and assess the statistical significance of ChIP enrichment on them, SICER carry out the following steps: It partitions the genome into non-overlapping windows of size w. It identifies windows with enrichment (i.e., “eligible” windows). A window is deemed “eligible” or “ineligible” if the number of ChIP-Seq reads in this window is equal to or above/below a read count threshold l0. It identifies islands as clusters of “eligible” windows separated by gaps of size no larger than a predetermined value g. A gap is a contiguous stretch of “ineligible” windows between two neighboring “eligible” windows. When g = 0, islands are uninterrupted clusters of “eligible” windows. [17]. It identifies “candidate” islands that exhibit significant clustering of “eligible” windows that are unlikely to appear by chance. If a control library be found, SICER will further filter the “candidate” islands using that control library, releasing all excluding those that exhibit significant enrichment of ChIP signal compared to control on the islands[17]. The statistical significance versus control library is characterized by a p-value based on Poisson distribution. A false discovery rate (FDR) is also reported using p-value adjusted for multiple testing. Because of the presence of systematic biases in a typical ChIP-Seq library, it is highly desirable to have a matching control library[17]. PEAK ANNOTATOR[18] is a software that helps us to find the nearest downstream gene (NDG) from the peak that we found by MACS2, HOMER and SICER as well as the transcription start sites (TSS). It has three utility:- NDG - For each locus, search for its Nearest Downstream Genes on both the forward and reverse strand. If the position of the locus is within a gene, the program describes in which part of that gene the locus is located. It generates the types of file[18]. NDG.TEST;-This file identifies the closest downstream genes for each locus, and contains the following fields[18]: Chromosome Start End - These first three columns describe the genomic location of the peak. Overlapped Genes - Number of transcripts overlapping the genomic loci. Details about these genes are reported in the second output file described below.

IJCAES Vol 1, Issue 2, 2020
ISSN 2689-6389 (Print) ISSN2687-7939 (Online) 42
Downstream_FW_Gene- ID of the closest downstream gene on the forward strand. Symbol- Symbol of the closest downstream gene on the forward strand. Distance- Peak distance to its closest downstream gene on the forward strand. Downstream_REV_gene- ID of the closest downstream gene on the reverse strand. Symbol- Symbol of the closest downstream gene on the reverse strand. Distance- Peak distance to its closest downstream gene on the reverse strand. OVERLAP.TEST:- This file describes the transcripts overlapping the peaks, if any such are found[18]. Chromosome Start End - These first three columns describe the genomic location of the peak OverlapGene - Overlapping gene ID Symbol- Overlapping gene symbol Overlap_Begin- In which part of the gene does the peak's start position overlap Overlap_Center- In which part of the gene does the peak's central position overlap Overlap_End - In which part of the gene does the peak's end position overlap SUMMARY.TEST:- This file contains the following fields[18] Chromosome Start End - These first three columns describe the genomic location of the peak. OverlapGene - Overlapping gene Symbol. Downstream Gene- Nearest downstream gene. Distance- Peak distance to its nearest downstream gene. TSS - For each locus, find its closest TSS (transcription start site). In order to do this, the program searches both upstream and downstream for the closest genes to the genomic coordinate. [18] TSS.TEST:- This file contains the following fields[18]: Chromosome Start End- These first three columns describe the genomic location of the peak. Distance- The distance from the peak to its closest TSS. GeneStart - The start location of the closest gene on the genome. GeneEnd- The end location of the closest gene on the genome. ClosestTSS_ID- ID of the closest gene. Symbol- Symbol of the closest gene. Strand- Strand of closest gene. ODS - Compare between two position files, to identify overlapping and unique genomic locations. MEME-ChIP performs comprehensive motif analysis (including motif discovery) on large sets of (typically nucleotide) sequences such as those identified by ChIP-seq or CLIP-seq experiments (sample output from sequences)[19].
Usage:
meme-chip [options] [-db<motif file>]* <primary sequence file>
Input
[-db<motif file>]*
(Optional but recommended) The names of one or more files containing MEME formatted motifs. Outputs from MEME and DREME are supported, as well as Minimal MEME Format. You can convert many other motif formats to MEME Motif format using conversion scripts available with the MEME Suite. These motif file(s) will used by Tomtom and CentriMo.

IJCAES Vol 1, Issue 2, 2020
ISSN 2689-6389 (Print) ISSN2687-7939 (Online) 43
<primary sequence file>
The name of a file of sequences in FASTA format. Ideally the sequences should be all the same length, between 100 and 500 base-pairs long and centrally enriched for motifs. The immediate regions around individual ChIP-seq "peaks" from a transcription factor (TF) ChIP-seq experiment are ideal. The suggested 100 base-pair minimum size is based on the typical resolution of ChIP-seq peaks but it is useful to have more of the surrounding sequence to give CentriMo the power to tell if a motif is centrally enriched. We recommend that you "repeat mask" your sequences, replacing repeat regions to the "N" character. [19].
Output
MEME-ChIP writes its output to files in a directory named memechip_out, which it creates if necessary[19]. You can change the output directory using the -o or -oc options. The directory will contain the following files: meme-chip.html - an HTML file that provides the results in an interactive, human-readable format that contains links to the other files produced by the analyses performed by MEME-ChIP summary.tsv - a TSV (tab-separated values) file that provides a summary of the results in a format suitable for parsing by scripts and viewing with Excel combined.meme - a text file that contains all the motifs identified by MEME-ChIP in MEME Motif Format In addition, the MEME-ChIP output directory will contain sub-directories with the results of each of the individual analyses it performed. The results in these directories are all linked to from the MEME-ChIP HTML output file. MEME-ChIP outputs a tab-separated values (TSV) file ('summary.tsv') that contains one line for each motif found by MEME-ChIP. The lines are sorted in order of decreasing statistical significance. The first line in the file contains the (tab-separated) names of the fields[20]. Your command line is given at the end of the file in a comment line starting with the character '#' [21]. The names and meanings of the fields in the output are described in the table below.
Table4. The names and meanings of the fields in the output. (Retrieved from https://academic.oup.com/nar/article/40/4/e31/2411061)
Field Name Contents
1 MOTIF_INDEX The index of the motif in the “Motifs in MEME text format” file(‘combined meme’)output by MEME-ChIP.
2 MOTIF_SOURCE The name of the program that found the de novo motif, or the name of the motif file containing the known motif.
3 MOTIF_ID The name of the motif, which is unique database file.
4 ALT_ID An alternate name for the motif, which is unique in the motif database file .
5 CONSENSUS The ID of the de novo motif, or a consensus sequence computed from the letter frequencies in the known motif (as described above )
6 WIDTH The width of the motif.
7 SITES The number of sites reported by the de novo program , or the number of “Total Matches “ reported by CentriMo.
8 E-VALUE The statistical significance of the motif.
9 E-VALUE_SOURCE The program that reported the E-value
10 MOST_SIMILAR_MOTIF
The known motif most similar to this motif according to Tomtom.
11 URL A link to a description of the most similar motif, or to the known motif.
A consensus sequence is constructed from each column in a motif's frequency matrix using the "50% rule" as follows:
The letter frequencies in the column are sorted in decreasing order.
IJCAES Vol 1, Issue 2, 2020
ISSN 2689-6389 (Print) ISSN2687-7939 (Online) 44
Letters with frequency less 50% of the maximum are discarded. The letter used in this position in the consensus sequence is determined by the first rule below that applies: If there is only one letter left, or if the remaining letters exactly match an ambiguous symbol in the alphabet, the letter or ambiguous symbol, respectively, is used. Otherwise, if the remaining set contains at least 50% of the core symbols in the alphabet, the alphabet's wildcard (e.g., "N" for DNA or RNA, and "X" for protein) is used. Otherwise, the letter with the maximum frequency is used. Note: The input sequences should be centered on a 100 character region expected to contain motifs. (http://meme-suite.org/tools/meme-chip)
MEME-ChIP Combined Motifs Format (text) Format
MEME-ChIP outputs a text file ('combined.meme') containing all the significant motifs found by MEME-ChIP. The motifs are in Minimal MEME Motif format, and their IDs correspond to the motif indices given in the "Summary in TSV Format" file ('summary.tsv') [20]. Note: The 'nsites=' and 'E=' fields in the motif headers are only relevant for the MEME and DREME motifs. For known motifs, those values do not refer to the number of sites in the input sequences. Conclusion Chip-Seq is a widely applicable method which is useful for tracking various epigenetic modifications, the type of signal is diverse, and makes the detection of differential regions, a challenging task. Thus various tools are required to interpret its result. So here we have put down all the important tools that are required to obtain analysis of transcription factor-binding sites, histone modifications,etc., along with protein binding site model building tools which will make accession and usage of tools very easy. Reference
[1] Visel, A., Blow, M. J., Li, Z., Zhang, T., Akiyama, J. A., Holt, A., & Afzal, V. ChIP-seq accurately predicts tissue-specific activity of enhancers. Nature, 457(7231), 854, 2009.
[2] Bailey, T. L. DREME: motif discovery in transcription factor ChIP-seq data. Bioinformatics, 27(12), 1653-1659, 2011.
[3] Schmidl, C., Rendeiro, A. F., Sheffield, N. C., & Bock, C..ChIPmentation: fast, robust, low-input ChIP-seq for histones and transcription factors. Nature methods, 12(10), 963, 2015.
[4] Barta, E. Command line analysis of ChIP-seq results. EMBnet. journal, 17(1), 13-17, 2011. [5] Kaboord, B., &Perr, M. Isolation of proteins and protein complexes by immunoprecipitation. In 2D
PAGE: sample preparation and fractionation (pp. 349-364). Humana Press 2008. [6] Valouev, A., Johnson, D. S., Sundquist, A., Medina, C., Anton, E., Batzoglou, S., ...&Sidow, A.
Genome-wide analysis of transcription factor binding sites based on ChIP-Seq data. Nature methods, 5(9), 829, 2008.
[7] Whiteford, N., Skelly, T., Curtis, C., Ritchie, M. E., Löhr, A., Zaranek, A. W., ...& Brown, C. Swift: primary data analysis for the IlluminaSolexa sequencing platform. Bioinformatics, 25(17), 2194-2199 2009.
[8] Niklas, N., Pröll, J., Danzer, M., Stabentheiner, S., Hofer, K., & Gabriel, C. Routine performance and errors of 454 HLA exon sequencing in diagnostics. BMC bioinformatics, 14(1), 176, 2013.
[9] Ondov, B. D., Varadarajan, A., Passalacqua, K. D., & Bergman, N. H. Efficient mapping of Applied BiosystemsSOLiD sequence data to a reference genome for functional genomic applications. Bioinformatics, 24(23), 2776-2777, 2008.
[10] Brown, J., Pirrung, M., & McCue, L. A. FQC Dashboard: integrates FastQC results into a web-based, interactive, and extensible FASTQ quality control tool. Bioinformatics, 33(19), 3137-3139, (2017)..
IJCAES Vol 1, Issue 2, 2020
ISSN 2689-6389 (Print) ISSN2687-7939 (Online) 45
[11] Langmead, B. Aligning short sequencing reads with Bowtie. Current protocols in bioinformatics, 32(1), 11-7,2010.
[12] Diaz, A., Park, K., Lim, D. A., & Song, J. S. Normalization, bias correction, and peak calling for ChIP-seq. Statistical applications in genetics and molecular biology, 11(3), 2012.
[13] Liu, T. Use model-based analysis of ChIP-Seq (MACS) to analyze short reads generated by sequencing protein–DNA interactions in embryonic stem cells. In Stem Cell Transcriptional Networks (pp. 81-95). Humana Press, New York, NY 2014.
[14] Leggett, R. M. Ramirez⁃ Gonzalez RH, Clavijo BJ, et al. Sequencing quality assessment tools to enable data⁃ driven informatics for high throughput genomics, 4, 288, 2013.
[15] De la Rosa, J. V., Ramón-Vázquez, A., Tabraue, C., &Castrillo, A. Analysis of LXR nuclear receptor cistrome through ChIP-seq data bioinformatics. In Lipid-Activated Nuclear Receptors (pp. 99-109). Humana Press, New York, NY, 2019.
[16] Homer.(n.d.)Retrieved from: http://homer.ucsd.edu/) [17] Xu, S., Grullon, S., Ge, K., &Peng, W. Spatial clustering for identification of ChIP-enriched regions
(SICER) to map regions of histone methylation patterns in embryonic stem cells. In Stem Cell Transcriptional Networks (pp. 97-111). Humana Press, New York, NY2014.
[18] Zhu, L. J., Gazin, C., Lawson, N. D., Pagès, H., Lin, S. M., Lapointe, D. S., & Green, M. R.ChIPpeakAnno: a Bioconductor package to annotate ChIP-seq and ChIP-chip data. BMC bioinformatics, 11(1), 237. 2010
[19] Machanick, P., & Bailey, T. L. MEME-ChIP: motif analysis of large DNA datasets. Bioinformatics, 27(12), 1696-1697,2011.
[20] Ma, W., Noble, W. S., & Bailey, T. L. Motif-based analysis of large nucleotide data sets using MEME-ChIP. Nature protocols, 9(6), 1428, (2014)..
[21] Thomas-Chollier, M., Herrmann, C., Defrance, M., Sand, O., Thieffry, D., & van Helden, J. (2011). RSAT peak-motifs: motif analysis in full-size ChIP-seq datasets. Nucleic acids research, 40(4), e31-e31.
[22] Gibiansky, A. L., Haque, I. S., Maguire, J. R., & Robertson, A. D. J. (2016). U.S. Patent Application No. 14/884,656.
International Journal of Chemical and Environmental Sciences Vol 1 Issue 2, 2020 ISSN 2689-6389 (Print) ISSN2687-7939 (Online)
Corresponding author Email address: [email protected] 46
Antimicrobial Properties of Nanoparticles (NPS) Received for publication, December 3, 2019, and in revised form, January 5, 2020
Tathagata Kayal1*, Titas Ghosh 2 1Biochemistry Lab Assistant, MEDILAB (ISO 9001:2015), Garia, Kolkata, India 2School of Life Science and Biotechnology, Adamas University, Kolkata-700126
Abstract With the help of nanoparticles treatment of diseases without any side effects can be achieved with the help of nanotechnology. The devices operating at nanoscale range such as nanoparticles, paves the path for a new method for imaging, diagnosis and therapy. Nanoparticles have antimicrobial properties which can locally destroy bacteria, without doing any harm to the surrounding tissues. This review focuses on the antimicrobial effects of nanoparticles. Keywords: Nano particles, nanoscale, antimicrobial properties Introduction Antibacterial activity is related to compounds that locally kill bacteria or slow down their growth, without being in general toxic to surrounding tissues. Chemically modified natural compounds are the most current antibacterial agents [1], viz. β-lactams and carbapenems. Sometimes aminoglycosides – a pure natural product and sulfonamides – purely synthetic compounds are often used. Antibacterial agents are used to fight bacterial diseases. These agents are classified as bactericidal which kill bacteria or slows down bacteria growth [2]. With the wide use of antibacterial drugs, the emergence of bacterial resistance has become a common and a major problem .Resistance- which is a common evolutionary problem taking place during , for example, antibiotic therapy which leads to diseases which are inheritable. Moreover, horizontal gene transfer through conjugation, transduction or transformation is a probable way for building up resistance [3]. These antibacterial resistant strains are known as superbugs which contribute to the emergence of diseases that were in perfect control for several years. Tuberculosis is a prominent example of disease caused by bacterial strains which is resistant to treatment of previous antibacterial treatments. Multidrug-resistant (MDR-TB) tuberculosis occurs every year at a rate of half a million new cases worldwide [4]. Delhi metallo-β-lactamase-1 (NDM-1), a newly identified enzyme, which is responsible for bacterial resistance to a broad range of β – lactam antibacterial, and it seems that most isolates with NDM-1 enzyme are resistant to all standard intravenous antibiotics for treatment of severe infections [5]. Bacteria develop resistance to many conventional procedures of antibacterial activities which is a major problem around the world. Secondary effects (side effects) of such prevailing antibacterial treatments are a major concern and as the bacteria develop resistance to these treatments, high doses of these drugs are being administered inside the body which causes serious toxic effects to the body and dew to this problems the search for alternative antimicrobial agents such as NPs are in vogue. Nanosized particles as well as nanoparticles which are used to deliver drugs have proven themselves effective in treating microbial diseases and also antibiotic-resistance ones in-vitro as well as animal models. NPs offer improved properties because they have high surface area to volume ratio, which results into a new mechanical , chemical,

IJCAES Vol 1, Issue 2, 2020
ISSN 2689-6389 (Print) ISSN2687-7939 (Onlline) 47
electrical, optical, magnetic, electro-optical, and magneto-optical properties that NPs that are much different from their bulk properties [6].NPs have interesting properties which can control bacteria and are discussed below. Multifunctional Nano-particles Nanoparticles are small sized particles around (1-100nm) in size. Nanometer-sized particles are in the same range of dimension as antibodies, membrane receptors, nucleic acids and proteins, amongst other biomolecules. These unique features alone with their attractive surface: volume ratio makes nano particles a very powerful tool for combating bacteria, their diagnosis and therapy[7,8].Nanoparticles have many advantages over the other available procedures for disinfecting bacteria and it is gaining popularity in the market nowadays[9]. Some types of nanoparticles are described below- Liposomes- They are phospholipid vescicles (50-100nm). They have a phospholipid bilayer which are very similar to the other biological membranes and it consists of an aqueous internal phase. They are classified as multi-, oligo-, or uni-lamellar, according to their size and number of layers. They are used to transport hydrophilic drugs which are being entrapped into their aqueous interior and hydrophobic drugs dissolved in their membrane [10]. Dendrimers- These are highly branched synthetic polymers (<15nm) which consists of a centralized core, an internal region and numerous terminal groups which determine the characteristics of a dendrimer. Dendrimers are used to repair tissue-scaffolds which is due to their intrinsic drug properties. They are also excellent diagnosis-carrier agents [11]. Carbon nanotubes- Carbon nanotubes are formed of coaxial graphite sheets (<100nm) which are rolled into cylinders. These nanotubes are often obtained as – one graphite sheet or several concentric graphite sheets. They are very efficient heat conductors too. They are often used as bio-sensors because of their excellent semiconductor nature. They are water soluble and they are widely used as drug carriers and tissue repair scaffolds [12]. Quantum dots- They are of (2-10nm) in size. They are mostly colloidal fluorescent semiconductor nanocrystals. The central core consists of elements ( CdSe, CdTe, Cds ,PbSe , Zns and Znse) or the elemts of the periodic tale group II-VI OR, III-V (GaAs , GaN, InP, and lnAs) and are overcoated with a layer of Zns. They are resistant to- photo bleaching, photo and chemical degradation. All these thongs make quantam dots very good agents for imaging, labels and bioassays [13]. Gold Nanoparticles- They are a type of metallic nanoparticles having sizes (<50nm).They have localized localized surface plasmon resonant properties. They have the property of absorbing light and emitting photons with same frequency in every directions. They detect numerous techniques such as optic absorption, fluorescence and electric conductivity and can act as excellent bio sensors [14]. Silver Nanoparticles- Silver nanoparticles are nanoparticles of silver of between 1 nm and 100 nm in size. While frequently described as being 'silver' some are composed of a large percentage of silver oxide due to their large ratio of surface-to-bulk silver atoms [15].

IJCAES Vol 1, Issue 2, 2020
ISSN 2689-6389 (Print) ISSN2687-7939 (Onlline) 48
Multifunctional nanoparticles for drug and gene delivery- Multifunctional drug delivery is a new emerging scientific technology but they are already in use for several in vivo studies with multifunctional nanoparticles. They provide an interesting prospect and a bright future of these novel nanoparticles. An excellent example of the effectiveness of these nanoparticles is the treatment of cancer which is done by Yang and co-workers. These scientists developed a multifunctional nano system combining magnetic nano crystals (MRI),with antibodies which are therapeutic and a chemotherapeutic drug doxorubicin. Multifunctional NPs are used for in vivo imaging and si RNA delivery and silencing tumors. Fig. 1- Multifunctional nanoparticles for drug delivery- Multifunctional nanocarriers can combine a specific targeting agent (usually an antibody or peptide) with nanoparticles for imaging (such as quantum dots or magnetic nanoparticles), a cell-penetrating agent (e.g. the polyArg peptide TAT), a stimulus-sensitive element for drug release, a stabilising polymer to ensure biocompatibility (polyethylene glycol most frequently) and the therapeutic compound. Development of novel strategies for controlled released of drugs will provide nanoparticles with the capability to deliver two or more therapeutic agents (16) Development of novel strategies for controlled released of drugs will provide nanoparticles with the capability to deliver two or more therapeutic agents [16]. Properties of bacteria and their highly specific ways to destroy them Role of cell wall- The bacterial cell wall provides strength and and many other protective properties to the cell [17]. According to the properties of the bacterial cell they can be divided into two groups- Gram negative(-) and Gam-positive(+) bacteria .There is a thick peptidoglycan(PG) layer is present in the walls of the Gram positive cells that are attached to techoic acids. Whereas, the cell wall of gram negative are more complex both structurally and chemically. In Gram-negative it contains a thin PG layer and an outer membrane. In Gram-Negative bacteria I provides resistance to various detergents and contains lipopolysaccharide, which is responsible for the negative charge of cell membranes and are also responsible for structural integrity and viability of the bacteria. The structure of the cell wall plays a very important role to tolerate the presence of NPs. Role of the NP type and surface – Several additional factors including species sensitivity has the power to influence the susceptibility or tolerance of bacteria to NPs. Example, E.coli(-) is highly susceptible whereas S.aureus (+) and B.subtilis (+) are less susceptible to CuO NPs [18].
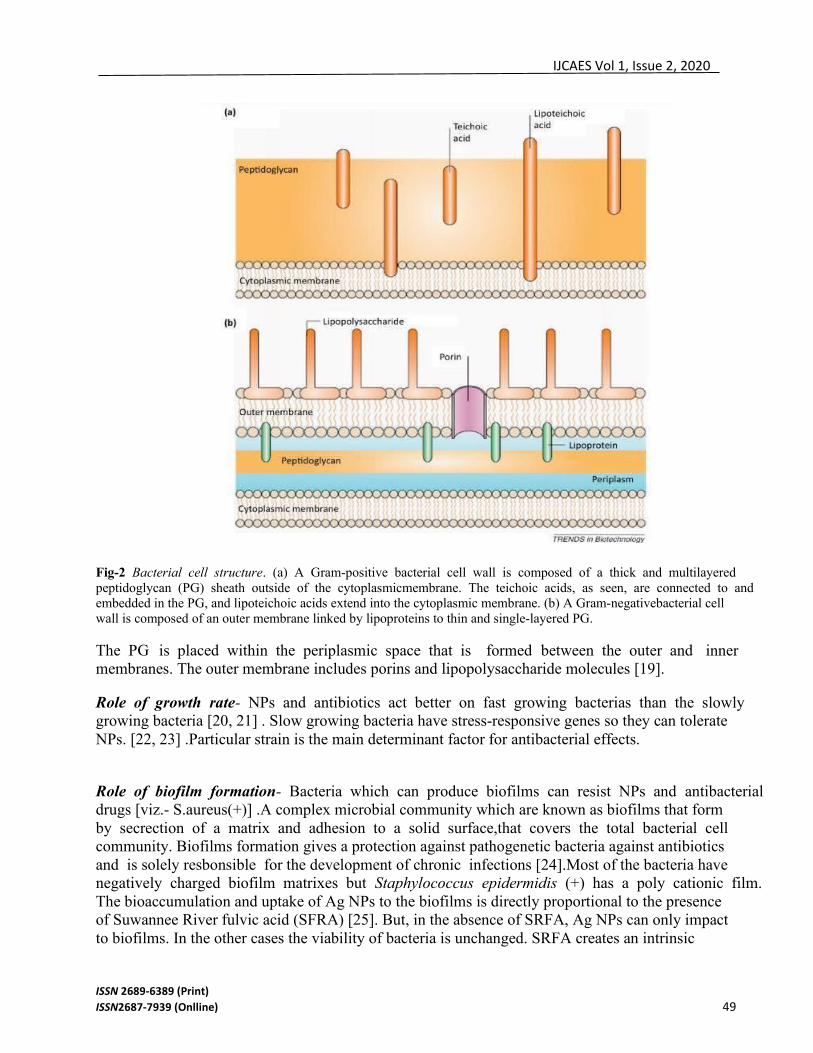
IJCAES Vol 1, Issue 2, 2020
ISSN 2689-6389 (Print) ISSN2687-7939 (Onlline) 49
Fig-2 Bacterial cell structure. (a) A Gram-positive bacterial cell wall is composed of a thick and multilayered peptidoglycan (PG) sheath outside of the cytoplasmicmembrane. The teichoic acids, as seen, are connected to and embedded in the PG, and lipoteichoic acids extend into the cytoplasmic membrane. (b) A Gram-negativebacterial cell wall is composed of an outer membrane linked by lipoproteins to thin and single-layered PG. The PG is placed within the periplasmic space that is formed between the outer and inner membranes. The outer membrane includes porins and lipopolysaccharide molecules [19]. Role of growth rate- NPs and antibiotics act better on fast growing bacterias than the slowly growing bacteria [20, 21] . Slow growing bacteria have stress-responsive genes so they can tolerate NPs. [22, 23] .Particular strain is the main determinant factor for antibacterial effects. Role of biofilm formation- Bacteria which can produce biofilms can resist NPs and antibacterial drugs [viz.- S.aureus(+)] .A complex microbial community which are known as biofilms that form by secrection of a matrix and adhesion to a solid surface,that covers the total bacterial cell community. Biofilms formation gives a protection against pathogenetic bacteria against antibiotics and is solely resbonsible for the development of chronic infections [24].Most of the bacteria have negatively charged biofilm matrixes but Staphylococcus epidermidis (+) has a poly cationic film. The bioaccumulation and uptake of Ag NPs to the biofilms is directly proportional to the presence of Suwannee River fulvic acid (SFRA) [25]. But, in the absence of SRFA, Ag NPs can only impact to biofilms. In the other cases the viability of bacteria is unchanged. SRFA creates an intrinsic

IJCAES Vol 1, Issue 2, 2020
ISSN 2689-6389 (Print) ISSN2687-7939 (Onlline) 50
antioxidant activity can protect the bacteria against the NPs from significant damage [26]. Concentration of Ag NPs are responsible for Ag NP uptake by marine biofilms and reduction of marine biofilms [27]. Colonization of new bacteria into the biofilms and decrease its development and succession may be prevented by the exposure of Ag NPs . The anti microbial activity of Mg F2 NPs have the capability to prevent biofilm formation of common pathogens such as E. coli and S. aureus [28]. Catherers modified by Mg F2 NP are able to restrict the biofilm formation of the bacteria significantly [29].They have also demonstrated that glass surfaces coated with ZnO NPs are able to produce reactive oxygen species (ROS) that interfere with E.coli and S. aureus biofilm formation [30].NPs with different surface coatings (ex with gold and silver) are called Supermagnetic iron oxide NPs (SPIONS) and shows the capacity to show highest activity against the biofilms [31, 32] The toxicity of NPs against bacteria-Electrostatic interaction interactions helps the NPs to attach to the membrane of the bacteria to disrupt the integreity of the membrane [33]. Following the administration of NPs the nano-toxicity is generated by the induction of oxidative stress by free radical formation which is called the ROS ( Reative Oxygen Species) . [34,35] Figure-3 Mechanisms of toxicity of nanoparticles (NPs) against bacteria. NPs and their ions (e.g., silver and zinc) can produce free radicals, resulting in induction ofoxidative stress (i.e., reactive oxygen species; ROS). The produced ROS can irreversibly damage bacteria (e.g., their membrane, DNA, and mitochondria), resulting inbacterial death [45] The TiO2 and Zno NPs have the capability of making frameshift mutations in Salmonella typhimurium (-), (TA 98 and TA 1537) [36]. The presence of S9 fractions in Zno NPs are responsible for the frameshift mutation. Internalization of NPs are activated by the S9 fraction which then generates the ROS that helps in making the frameshift mutation in bacteria. TiO2 NPs are toxic to P. aeruginosa (–), E. hire (+), E. coli (–), S. aureus (+), and B. fragilis (–), only under UV illumination and killed approximately all bacteria in 60 min. These NPs have combination of several factors such as temperature, aeration, pH, concentration of NPs and the concentration of bacteria (E. coli) determines the toxicity of NPs. The agglomeration can be decreased and toxicity can be increased by the high temperature, high aeration and low pH. The lower agglomeration provides more available surface area for interaction with bacterial membranes and for solubilization of copper ions, which leads to more toxicity [39]. Metallic and ionic forms of copper produce hydroxyl radicals that damage essential proteins and DNA [40]. Au NPs which are prepared in solution by using the citrate reducing method are photomutagenic against the S. typhimurium strain

IJCAES Vol 1, Issue 2, 2020
ISSN 2689-6389 (Print) ISSN2687-7939 (Onlline) 51
TA102. The coexisting Au3+ ions and citrate are responsible for the photomutagenicity of Au NPs and it
is not related to their intrinsic properties. In the presence of light the oxidation of Oxidation of Au3+ and decarboxylation of citrate induce the generation of free radicals that damage essential proteins and DNA [41]. Living organisms produce Biogenic Ag NPs, are co-operative effects with antibiotics such as erythromycin, chloramphenicol, ampicillin, and kanamycin against Gram-negative and Gram positive bacteria [42]. Biogenic Ag NPs with antibiotics has a very efficient antibacterial activity. Ampicilin, which damages the cell wall and helps to internalize NPs into the bacteria. Internalization of NPs makes NPs binds to DNA and inhibits the unwinding of DNA resulting to cell death. Titanium modified NPs are toxic to E. coli and S. aureus Ag NPs disrupt the membrane inegrity of bacteria and inhibit bacterial growth [43]. These above studies reveals the antibacterial activity of the NPs. NPs against drug-resistant bacteria – The emergence of antibiotic resistance are a global concern for mankind. To destroy antibiotic resistanc bacteria requirres many expensive drugs which are very expensive as well as it has many toxic effects to the body. This problems can be tackled by the NPs (44).Four variants of silver carbon complexes (SCCs) with dwith various formulations including the micelles and NPs have great toxicity against medicalyy important pathogens such as P. aeruginosa (–), B. cepacia (–), methicillin-resistant S. aureus, multidrug-resistant A.baumannii (–), and K.pneumoniae (–) in the range of 0.5–90 mg/l (44). The growth of bio-defense bacteria such as B. subtilis and Y. pestis (-) are inhibited by SCCs [44]. Conclusion Nanoparticles can be administered by parental, nasal, oral and occular routes. By attaching specific ligands to their surface, nano particles can be used for directing the drugs to specific targets. It also improves stability and therapeutic index and reduce toxic effects. Both active and passive drug targeting can be achieved by particle size and the surface characteristics of the nano particles. [45].Nano particles can also pave the way for treatment of diseases without the help of antibiotics resulting in less antibiotic resistance and ultimately will reduce the global concern for antibiotic resistance. Acknowledgements- I want to express my sincere thanks to Ankita Mukherjee and Manmata Dhara for helping me out in writing this review work.
References
1. Von Nussbaum, F. et al. (2006) Antibacterial natural products inmedicinal chemistry – exodus or revival? Angew. Chem. Int. Ed. 45,5072–5129
2. Hajipour MJ, Fromm KM, Ashkarran AA, Jimenez de Aberasturi D, de Larramendi IR, Rojo T, SerpooshanV, ParakWJ, MahmoudiM.Antibacterial properties of nanoparticles, Trends Biotechnol. 2013 Jan;31(1):61-2.
3. Witte, W. (2004) International dissemination of antibiotic resistant strains of bacterial pathogens. Infect. Genet. Evol. 4, 187–191
IJCAES Vol 1, Issue 2, 2020
ISSN 2689-6389 (Print) ISSN2687-7939 (Onlline) 52
4. Oldenburg, A.L. et al. (2004) Magnetic contrast agents for optical coherence tomography. Proc. of SPIE 5316, 91–98
5. Rakow, N.A. and Suslick, K.S. (2000) A colorimetric sensor array for odour visualization. Nature 406, 710–713
6. Whitesides, G.M. (2005) Nanoscience, nanotechnology, and chemistry.Small 1, 172–179 7. Yezhelyev, M.V. et al. (2006) Emerging use of nanoparticles indiagnosis and treatment of breast cancer.
Lancet Oncol. 7, 657–667 8. Pison, U. et al. (2006) Nanomedicine for respiratory diseases. Eur. J. Pharmacol. 533, 341–350 9. Wagner, V. et al. (2006) The emerging nanomedicine landscape. Nat. Biotechnol. 24, 1211–1217 10. Torchilin, V.P. (2005) Recent advances with liposomes as pharmaceutical carriers. Nat. Rev. Drug Discov. 4,
145–160 11. Medintz, I.L. et al. (2005) Quantum dot bioconjugates for imaging,labelling and sensing. Nat. Mater. 4, 435–
446 12. Polizu, S. et al. (2006) Applications of carbon nanotubes-based biomaterials in biomedical nanotechnology. J.
Nanosci. Nanotechnol.6, 1883–1904 13. Medintz, I.L. et al. (2005) Quantum dot bioconjugates for imaging,labelling and sensing. Nat. Mater. 4, 435–
446 14. Huang, X. et al. (2007) Gold nanoparticles: interesting optical properties and recent applications in cancer
diagnostics and therapy. Nanomed. 2, 681–693 15. Silver Nanoparticles: Properties and Applications By: Steven J. Oldenburg, Ph.D. Website Link-
https://www.sigmaaldrich.com/technical-documents/articles/materials science/nanomaterials/silver-nanoparticles.html
16. Multifunctional nanoparticles – properties and prospects for their use in human medicine(2008) - Nuria Sanvicens and M. Pilar Marco(fig-1),425-433
17. Singleton, P. (2004) Bacteria, In Biology, Biotechnology and Medicine,(6th ed.), John Wiley & Sons Ltd, (West Sussex, England) 570 pp.,ISBN 0-470-09027-8
18. Baek, Y.W. and An, Y.J. (2011) Microbial toxicity of metal oxidenanoparticles (CuO, NiO, ZnO, and Sb2O3) to Escherichia coli,Bacillus subtilis, and Streptococcus aureus. Sci. Total Environ. 409,1603–1608
19. Cabeen, M.T. and Jacobs-Wagner, C. (2005) Bacterial cell shape. Nat.Rev. Microbiol. 3, 601–610 20. Brown, M.R. et al. (1988) Resistance of bacterial biofilms to antibiotics:a growth-rate related effect? J.
Antimicrob. Chemother. 22, 777–780 21. Mah, T.F. and O’Toole, G.A. (2001) Mechanisms of biofilm resistance to antimicrobial agents. Trends
Microbiol. 9, 34–39 22. Lu, C. et al. (2009) Slow growth induces heat-shock resistance in normal and respiratory-deficient yeast. Mol.
Biol. Cell 20, 891–903 23. Stewart, P.S. (2002) Mechanisms of antibiotic resistance in bacterial biofilms. Int. J. Med. Microbiol. 292,
107–113 24. Landini, P. et al. (2010) Molecular mechanisms of compounds affecting bacterial biofilm formation and
dispersal. Appl. Microbiol. Biotechnol.86, 813–823 25. Bolla, J.M. et al. (2011) Strategies for bypassing the membrane barrier in multidrug resistant Gram-negative
bacteria. FEBS Lett. 585, 1682–1690 26. Fabrega, J. et al. (2009) Silver nanoparticle impact on bacterial growth:effect of pH, concentration, and organic
matter. Environ. Sci. Technol.43, 7285–7290 27. Lara, H.H. et al. (2011) Silver nanoparticles are broad-spectrumbactericidal and virucidal compounds. J.
Nanobiotechnol. 9-30 28. Musee, N. et al. (2011) The antibacterial effects of engineered nanomaterials: implications for wastewater
treatment plants J. Environ. Monit. 13, 1164–1183 29. Lellouche, J. et al. (2012) Antibiofilm surface functionalization ofcatheters by magnesium fluoride
nanoparticles. Int. J. Nanomed. 7,1175–1188
IJCAES Vol 1, Issue 2, 2020
ISSN 2689-6389 (Print) ISSN2687-7939 (Onlline) 53
30. Applerot, G. et al. (2012) ZnO nanoparticle-coated surfaces inhibit bacterial biofilm formation and increase antibiotic susceptibility.RSC Adv. 2, 2314–2321
31. Mahmoudi, M. and Serpooshan, V. (2012) Silver-coated engineered magnetic nanoparticles are promising for the success in the fight against antibacterial resistance threat. ACS Nano 6, 2656–2664
32. Park, H. et al. (2011) Inactivation of Pseudomonas aeruginosa PA01 biofilms by hyperthermia using superparamagnetic nanoparticles. J. Microbiol. Methods 84, 41–45
33. Thill, A. et al. (2006) Cytotoxicity of CeO2 nanoparticles for Escherichia coli. Physico-chemical insight of the cytotoxicity mechanism. Environ.Sci. Technol. 40, 6151–6156
34. Soenen, S.J. et al. (2011) Cellular toxicity of inorganic nanoparticles: common aspects and guidelines for improved nanotoxicity evaluation.Nano Today 6, 446–465
35. Nel, A.E. et al. (2009) Understanding biophysicochemical interactions at the nano-bio interface. Nat. Mater. 8, 543–557
36. Pan, X. et al. (2010) Mutagenicity evaluation of metal oxide nanoparticles by the bacterial reverse mutation assay. Chemosphere 79, 113–116
37. Maness, P-C. et al. (1999) Bactericidal activity of photocatalytic TiO2 reaction: toward an understanding of its killing mechanism. Appl.Environ. Microbiol. 65, 4094–4098
38. Wan, Y. et al. (2011) Vancomycin-functionalised Ag@TiO2 phototoxicity for bacteria. J. Hazard. Mater. 186, 306–312
39. Pramanik, A. et al. (2012) A novel study of antibacterial activity of copper iodide nanoparticle mediated by DNA and membrane damage.Colloids Surf. B 96, 50–55
40. Wang, S. et al. (2011) Toxic effects of gold nanoparticles on Salmonella typhimurium bacteria. Toxicol. Ind. Health 27, 547–554
41. Santo, C.E. et al. (2007) Contribution of copper ion resistance for survival of Escherichia coli on metallic copper surfaces. Appl.Environ. Microbiol. 74, 977–986
42. Devi, L.S. and Joshi, S.R. (2012) Antimicrobial and synergistic effects of silver nanoparticles synthesized using: Soil fungi of high altitudes of Eastern Himalaya. Mycobiology 40, 27–34
43. Juan, L. et al. (2010) Deposition of silver nanoparticles on titanium surface for antibacterial effect. Int. J. Nanomed. 5, 261–267
44. Leid, J.G. et al. (2012) In vitro antimicrobial studies of silver carbine complexes: activity of free and nanoparticle carbene formulations against clinical isolates of pathogenic bacteria. J. Antimicrob.Chemother. 67, 138–148
45. Hajipour MJ, Fromm KM, Ashkarran AA, Jimenez de Aberasturi D, de Larramendi IR, Rojo T, Serpooshan V, Parak WJ, Mahmoudi M. 2012 Oct;30(10):499-511. doi: 10.1016/j.tibtech.2012.06.004. Epub 2012 Aug 9.61-62

IJCAES Vol 1, Issue 2, 2020
ISSN 2689-6389 (Print) ISSN2687-7939 (Onlline) 54
International Journal of Chemical and Environmental Sciences Vol 1 Issue 2, 2020 ISSN 2689-6389 (Print) ISSN2687-7939 (Online)
Corresponding author Email address:[email protected]
54
Assessment of Physico-chemical and Microbial Characteristics of Water
of Some Ponds in Kolkata
Received for publication, December 12, 2019, and in revised form, January 8, 2020
Phanibhusan Ghosh, Sudipto Mandal*
Ecology and Environmental Modelling Laboratory, Department of Environmental
Science, University of Burdwan , Burdwan- 713104, India.
Abstract:
Physico-chemical and microbial characteristics of some pond waters in Kolkata were assessed during dry season. Study revealed that water of the ponds were alkaline with pH ranging from 7.50 to 8.10 at water temperature between 28.0 0C and 28.5 0C. Light penetration was greatly attenuated per meter depth in Science City (2.83), followed by BBD Bag (1.88), Mintu Park (1.70) and Victoria (1.54). Total Dissolved Solids (TDS) ranged from 240 to 710 mg/L with lower in pond water of Mintu Park and higher in Science City. Higher oxygen demanding wastes could cause minimum dissolved oxygen saturation value (50%) in the pond water of Science City. N/P ratios were less and varied from 0.11 to 0.39 implying occurrence of higher level of P in these pond water. Similarly, lower ratios of BOD/COD (0.14 to 0.21) indicated the presence of comparatively higher level of non-biodegradable organic matter. Total microbial density was found higher in Science City (35.5 × 10³) and lower in Minu Park (2.1×10³) and showed positive relationship with BOD. On the basis of National Sanitation Foundation Water Quality Index (NSF-WQI) values, water quality of two ponds (Victoria and Mintu Park) were classified as good to excellent, one (B.B.D. Bag) was medium to good and another (Science City) was bad. According to Central Pollution Control Board (CPCB), these were in the class A, B and C respectively. Key Words: Water Characteristics; Assessment; Ponds; Water Quality; Kolkata.
Life is originated from the core of water bodies and this result in strong interaction between the inorganic compound water and the organically combined form of biotic lives [1]. Water bodies like ponds, lakes, reservoirs, rivers, streams and seas are considered as the most essential and the most valuable resources gifted by the nature to human beings for their multiple roles to the mankind during the ages [1,13]. In ecological perspectives, some of these are hydrological cycle, controlling of flood, conservation of nature, recharging of ground water, various economic facilities through the cultivation of aquaculture products and controlling of local weather. In addition, these water resources have also attracted the people from all over the world for water sports, fishing, irrigation, bathing, tourism and religious activities [2, 11]. However, the present increase in rate of unplanned urbanization, population explosion as well as indiscriminate human activities in the immediate vicinity of water bodies specially in urban areas, have resulted a cause on degradation in water quality . All the same, local inhabitants without any alternatives use the water for their daily activities with no idea about the quality; and are very prone

IJCAES Vol 1, Issue 2, 2020
ISSN 2689-6389 (Print) ISSN 2687-7939 (Online)
55
to be affected and become easily victimized with so many untoward effects on their life processes.
Present dissertation is an endeavor to high light the assessment of physico-chemical and microbial characteristics of water of some ponds situated in most populated areas in various parts of the city, Kolkata in West Bengal, India.
Materials and Methods:
Physiographic conditions of study sites:
From visual observation, it was found that the pond in Science City (22.5400N- 88.3960E) is larger in size followed by the ponds at Victoria (22.5440N- 88.3420E), BBD Bag (22.5710N- 88.3470E) and Mintu Park (22.5410N- 88.3540E). However, in terms of depth, the order is as follows: B B D Bag (12-16 ft) > Victoria (8 - 10 ft) > Mintu Park (7 - 9 ft) > Science City (6 - 8 ft). In respect to water replacement, both the ponds at BBD Bag and Mintu Park are connected to the river Hooghly and water replacement is done through the pipes whenever required. The pond at Victoria is fed with ground water while Science city is rainwater fed pond. Among these ponds, only the pond at Scince City is used for washing, bathing and fish cultivation and all other ponds are normally used for recreation purposes.
Sample collection and Method of Analysis:
Water samples from accessible sides of each of the ponds were collected from several places by using water samplers at noon of the day from below 10 cm of the surface during dry season. The collected samples in a particular pond were well mixed together to make composite sample and kept in plastic containers. The non-conservative components like pH, temperature and conductivity were measured at the spot by using potable instruments. Dissolved Oxygen (DO) was also immediately fixed after collection.
The water transparency was measured by immersing Secchi disc, a circular disc of metal with 20 cm of diameter, painted alternately black and white and observing its visual in pond water [4]. Extinction coefficient (ƞ) of sunlight penetration in pond water was calculated by using following formula ƞ = 1.7 /z, where z is the Secchi disc transparency of water in meter [1].
The other samples were brought to the laboratory on the same day in ice-box and analyzed the remaining parameters such as total alkalinity, total hardness, bio-chemical oxygen demand (BOD), chemical oxygen demand (COD), total nitrogen (TN) and total phosphorous (TP) by using standard methods as described in APHA [3]. For microbial analysis, water samples were collected in sterilized container and the samples were kept in ice box. Total microbial density is assessed in terms of maximum population numbers (MPN) per 100 ml by following the method as outlined in APHA [3]. All analytical
IJCAES Vol 1, Issue 2, 2020
ISSN 2689-6389 (Print) ISSN 2687-7939 (Online)
56
results were recorded as the average of duplicate analysis. The water quality status was assessed by NSF-WQI, based on ratings and weightings [5, 6] of the studied parameters comprising of pH, DO, BOD and MPN values.
Results and discussions:
Physical characteristics of water:
Studies on physical characteristics of pond water demonstrated that water remained always alkaline ranges of pH (7.5 to 8.10) within the temperature 28.0 to 28.5 0C. The pH of natural water usually exists towards near neutral region for the strong buffering activity of the aquatic system largely by the presence of carbonate-bicarbonate ions in the medium along with ion-exchange capacity of the pond sediments [2, 10]. This condition has protected the aquatic life from adverse situation that could arise during large change in pH. It has been known [1,11] that the physiological activities of biotic life perform well at this near neutral pH condition of the medium. In the present study, a well buffering capacity of the water was recorded in these pond aquatic ecosystems (Table-1) that could restrict the large fluctuation of pH.
Transparency of pond water ranged from minimum of 60 cm to the maximum of 110 cm depth (Table-1). It is the degree of light penetration in the aquatic medium that extends up to euphotic depth or photic zone depth where at least 1% of sunlight can reach [8]. The high value of transparency indicated that water is well illuminated and high rate of biotic activity in presence of sunlight. Higher values of transparency were registered in Victoria (110 cm) and Mintu Park (100 cm) highlighting higher degree of light penetration most probably due to gradual removal of water borne suspended solids introduced from various sources on to the sediments from the overlying aquatic medium. The lower value was encountered in the pond water of Science City, probably for the development of turbidity contributed from either natural or intense anthropogenic activities on this water body by the local residents. The ability of light penetration in aquatic medium [2,8] is conventionally expressed in terms of extinction coefficient (ƞ). It was recorded that light was greatly attenuated per meter depth in Science City pond (2.83), followed by BBD Bag (1.88), Mintu Park (1.70) and Victoria (1.54).
Since, water bodies are interlinked with air above and soil below of it, and then always some gaseous components and soil minerals depending on solubility get dissolved in water [4, 10]. These dissolved salts of soil minerals constitute large fraction of total dissolved salts (TDS) [11]. Conductivity and TDS in the study were always found positively correlated with each other [3]. Lower levels of TDS was observed in the pond at Mintu Park (240 mg/L) and BBD Bag (275 mg/L) possibly for proper maintenance of inflow and outflow of the water coming from the Hooghly River and absence of anthropogenic activities like bathing, washing etc. in the periphery of the ponds. An intermediate value of TDS in the ponds at Victoria (380 mg/L) and BBD Bag (275 mg/L)
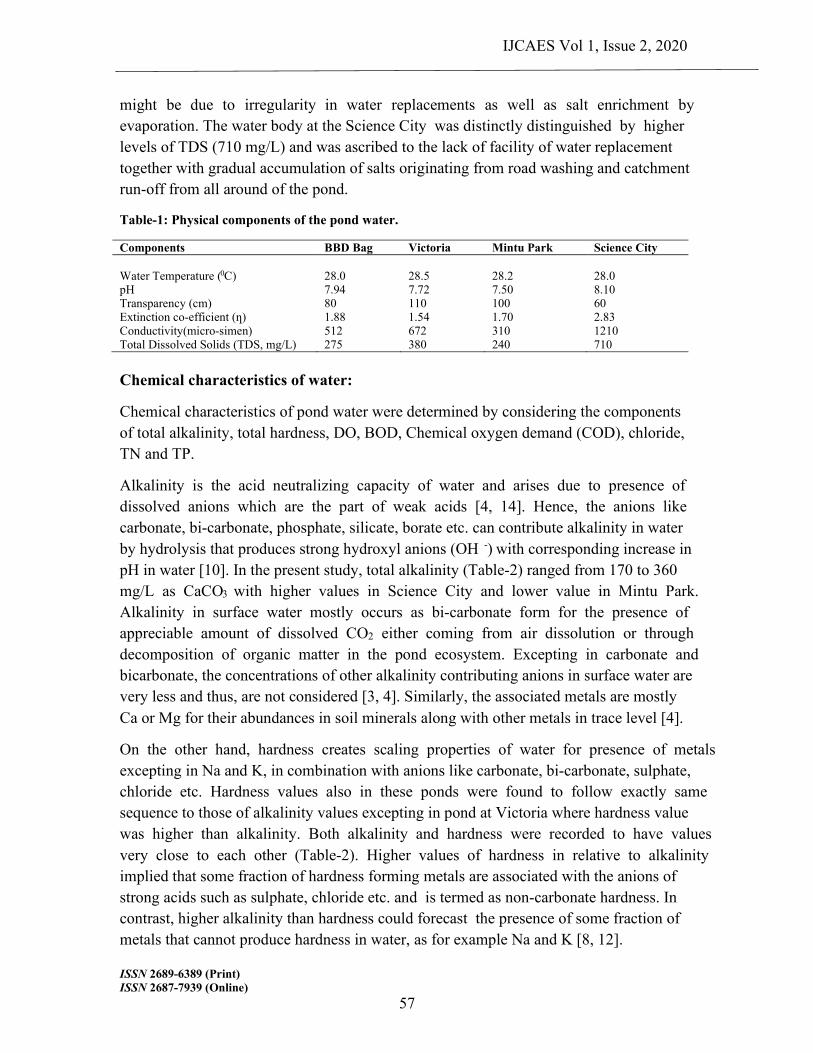
IJCAES Vol 1, Issue 2, 2020
ISSN 2689-6389 (Print) ISSN 2687-7939 (Online)
57
might be due to irregularity in water replacements as well as salt enrichment by evaporation. The water body at the Science City was distinctly distinguished by higher levels of TDS (710 mg/L) and was ascribed to the lack of facility of water replacement together with gradual accumulation of salts originating from road washing and catchment run-off from all around of the pond.
Table-1: Physical components of the pond water.
Components BBD Bag Victoria Mintu Park Science City Water Temperature (0C)
28.0
28.5
28.2
28.0
pH 7.94 7.72 7.50 8.10 Transparency (cm) 80 110 100 60 Extinction co-efficient (ƞ) 1.88 1.54 1.70 2.83 Conductivity(micro-simen) 512 672 310 1210 Total Dissolved Solids (TDS, mg/L) 275 380 240 710
Chemical characteristics of water:
Chemical characteristics of pond water were determined by considering the components of total alkalinity, total hardness, DO, BOD, Chemical oxygen demand (COD), chloride, TN and TP.
Alkalinity is the acid neutralizing capacity of water and arises due to presence of dissolved anions which are the part of weak acids [4, 14]. Hence, the anions like carbonate, bi-carbonate, phosphate, silicate, borate etc. can contribute alkalinity in water by hydrolysis that produces strong hydroxyl anions (OH -) with corresponding increase in pH in water [10]. In the present study, total alkalinity (Table-2) ranged from 170 to 360 mg/L as CaCO3 with higher values in Science City and lower value in Mintu Park. Alkalinity in surface water mostly occurs as bi-carbonate form for the presence of appreciable amount of dissolved CO2 either coming from air dissolution or through decomposition of organic matter in the pond ecosystem. Excepting in carbonate and bicarbonate, the concentrations of other alkalinity contributing anions in surface water are very less and thus, are not considered [3, 4]. Similarly, the associated metals are mostly Ca or Mg for their abundances in soil minerals along with other metals in trace level [4].
On the other hand, hardness creates scaling properties of water for presence of metals excepting in Na and K, in combination with anions like carbonate, bi-carbonate, sulphate, chloride etc. Hardness values also in these ponds were found to follow exactly same sequence to those of alkalinity values excepting in pond at Victoria where hardness value was higher than alkalinity. Both alkalinity and hardness were recorded to have values very close to each other (Table-2). Higher values of hardness in relative to alkalinity implied that some fraction of hardness forming metals are associated with the anions of strong acids such as sulphate, chloride etc. and is termed as non-carbonate hardness. In contrast, higher alkalinity than hardness could forecast the presence of some fraction of metals that cannot produce hardness in water, as for example Na and K [8, 12].

IJCAES Vol 1, Issue 2, 2020
ISSN 2689-6389 (Print) ISSN 2687-7939 (Online)
58
Dissolved oxygen in water has been recognized as one of the most important ecological component [15] that reveals the sanitary condition of water body [10, 11]. It is originated from the atmosphere through dissolution in water medium and may also be contributed by photosynthesis of aquatic algal and submerged macrophytes [12, 13]. DO levels in ponds depend on temperature, atmospheric pressure, TDS and the presence of biodegradable organic substances [14, 15].The pond water at Mintu Park and B B D Bag areas recorded (Table-2) the occurrence of dissolved oxygen (DO) in near saturation level of 87 and 98% respectively. Boating activities in BBD Bag pond might play as the most active role for attaining maximum saturation level of DO during this time. Although oxygen saturation values at Science City (50%) registered lower values, yet it was not below 40% of saturation or less than the critical levels as prescribed [7] for fish culture.
BOD and COD were lower in Victoria (2.47 mg/L) and Mintu Park (2.50 mg/L) and the ratio of BOD/COD followed the sequence as: Science City (0.21) > Victoria (0.19) > Mintu Park (0.16) > BBD Bag (0.14) with ascribing less amount of biodegradable organic matter than the total amount of combined non-biodegradable and biodegradable organic compounds, represented by COD in all these ponds. This might be due to higher residence time of water in the ponds and presence of less amount of biodegradable organic matter.
Chloride is a conservative element and does not take part directly in biological activities [8, 12]. Higher values (37.0 mg/ L) of chloride were registered in Science City, possibly due to contribution from intense human activities as it has been reported that humans release about 6 to 8 gm of salts per day during bathing [4] and this might be one of the crucial reason for higher values of chloride in this pond. Besides, the contribution of salt through mixing of land runoff from the large catchment areas into the pond might not also be ruled out. Ground water normally contains higher TDS due to seepage and leaching of various types of soil minerals present in different layers of the soil strata as observed in case of pond water at Victoria.
Table-2: Chemical and microbial components of the pond water
Components BBD Bag Victoria Mintu Park Science City
Alkalinity (mg/L as CaCO3)
226
210
170
360
Hardness (mg/L as CaCO3) 190 275 150 310 Dissolved Oxygen (mg/L) 8.1 7.0 7.7 4.45 Percent O2 saturation 98 82 87 50 BOD (mg/L) 4.0 2.47 2.50 12.6 COD (mg/L) 28 12.5 16.0 60.5 Chloride (mg/L ) 12.5 25.0 10.0 37.0 Total Nitrogen (mg/L) 0.10 1.64 0.07 1.25 Total Phosphorus (mg/L) 0.89 0.10 0.62 3.20 MPN (× 103)/100 ml 12.5 1.84 2.1 35.5
IJCAES Vol 1, Issue 2, 2020
ISSN 2689-6389 (Print) ISSN 2687-7939 (Online)
59
N and P are the main nutritional elements without which no biotic life can survive and these are mostly available by several sources [4]. Water consumption as well as water irrigation in the agricultural land can satisfy the need of these nutrients to animal and plant community [12]. In the present study, TN ranged from 0.07 to 1.64 mg/L and TP from 0.10 to 3.20 mg/L (Table-2). Higher values of TN were recorded in Victoria (1.64 mg/L) and Science City (1.25 mg/L) and the maximum values of TP were registered in Science City (3.20 mg/L), followed by BBD Bag (0.89 mg/L). Excepting in Victoria, N/P ratios were lower ranging from 0.11 to 0.39 implying occurrence of higher level of P, probably contributed by the sources of soaps, detergents etc. during bathing and washing. Higher levels of TP in these ponds water might encourage the nitrogen fixing algae to proliferate extensively causing a state of eutrophication [12, 14]. High ratio (16.4) of N/P at Victoria could arise for the presence of significant amount of nitrate forms in ground water.
Microbial qualities of water:
Water bodies contain different types of dissolved and particulate form of organic matter that serves as a food source for various types of micro-organisms such as bacteria, fungi, etc. [11, 14]. Microbial study revealed that total microbial density as expressed by maximum population number (MPN) per 100 ml of water was found higher in the pond water of Science City ( 35.5 × 10³ ) and lower in Mino Park (2.1×10³) and showed positive relationship with the content of BOD in water, which might serve as food source. Large size, intense human activities in and around the pond at Science City and large number of point as well as non-point sources of organic pollutants could be responsible for higher population of microbial community [14]. The prescribed limit of MPN of bathing water is 2.4 × 10 3 per 100ml of water [8] and hence, bathing in the pond at BBD Bag and Science City are risky.
Water quality index values:
Water quality is the overall characteristics of water contributed by all components together. Water quality index (WQI) has been recognized as a useful tool for assessing the overall water quality by a single numerical expression reflecting the composite influence of all parameters [5, 6]. In the present study, NSF-WQI values were calculated on the basis of weighing and rating of the components. It ranged from 45 to 74 with comparatively higher values (Table-3) of the pond water at Minu Park (74) and Victoria (73) and lower values in Science City (45). The stipulated grades lie between bad and good to excellent as prescribed on the basis of WQI values. The WQI value of pond water at BBD Bag (62) was found to lie almost in very near to class Good to excellent, but still it was less than 63 and placed in the class of medium to good.
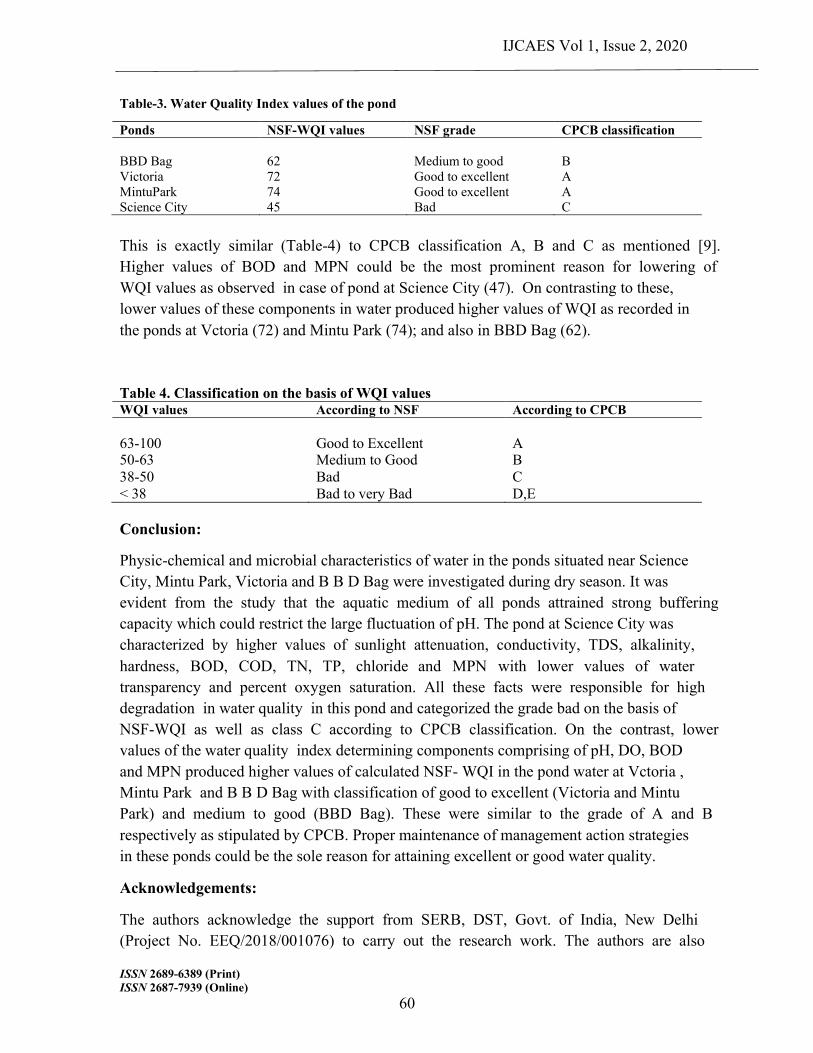
IJCAES Vol 1, Issue 2, 2020
ISSN 2689-6389 (Print) ISSN 2687-7939 (Online)
60
Table-3. Water Quality Index values of the pond
Ponds NSF-WQI values NSF grade CPCB classification BBD Bag
62
Medium to good
B
Victoria 72 Good to excellent A MintuPark 74 Good to excellent A Science City 45 Bad C This is exactly similar (Table-4) to CPCB classification A, B and C as mentioned [9]. Higher values of BOD and MPN could be the most prominent reason for lowering of WQI values as observed in case of pond at Science City (47). On contrasting to these, lower values of these components in water produced higher values of WQI as recorded in the ponds at Vctoria (72) and Mintu Park (74); and also in BBD Bag (62).
Table 4. Classification on the basis of WQI values WQI values According to NSF According to CPCB 63-100
Good to Excellent
A
50-63 Medium to Good B 38-50 Bad C < 38 Bad to very Bad D,E Conclusion:
Physic-chemical and microbial characteristics of water in the ponds situated near Science City, Mintu Park, Victoria and B B D Bag were investigated during dry season. It was evident from the study that the aquatic medium of all ponds attrained strong buffering capacity which could restrict the large fluctuation of pH. The pond at Science City was characterized by higher values of sunlight attenuation, conductivity, TDS, alkalinity, hardness, BOD, COD, TN, TP, chloride and MPN with lower values of water transparency and percent oxygen saturation. All these facts were responsible for high degradation in water quality in this pond and categorized the grade bad on the basis of NSF-WQI as well as class C according to CPCB classification. On the contrast, lower values of the water quality index determining components comprising of pH, DO, BOD and MPN produced higher values of calculated NSF- WQI in the pond water at Vctoria , Mintu Park and B B D Bag with classification of good to excellent (Victoria and Mintu Park) and medium to good (BBD Bag). These were similar to the grade of A and B respectively as stipulated by CPCB. Proper maintenance of management action strategies in these ponds could be the sole reason for attaining excellent or good water quality.
Acknowledgements:
The authors acknowledge the support from SERB, DST, Govt. of India, New Delhi (Project No. EEQ/2018/001076) to carry out the research work. The authors are also
IJCAES Vol 1, Issue 2, 2020
ISSN 2689-6389 (Print) ISSN 2687-7939 (Online)
61
grateful for the help of research scholars of the Ecology and Environmental Modelling Laboratory (EEML), Department of Environmental Science, University of Burdwan, in this research work.
Referrences:
1. Wetzel, R.G. 2001. Limnology of Lake and River Ecosystems. Academic Press, USA, 3rd edition. 2. Stumm, W and Morgan, J. J. 1996. Aquatic Chemistry, Chemical Equilibria and Rates in Natural
Waters, Wiley Interscience, New York. 3. APHA. 1992. Standard Methods for the Examination of Water and Waste waters, 18th edition. 4. Trivedy, R. K and Goel, P. K. 1986. Chemical and Biological Methods of Water Pollution Studies.
Environmental Publication, India. 5. Ott, W.R. 1978. Environmental Indices-Theory and Practice, Ann. Arbor. Sci. Publs, Inc: 202. 6. Horton, R. R. 1965. An Index Number System for Rating Water Quality. J. Wat. Pollt. Control.
Fed. 37:300-306. 7. BIS: 2296.Tolerance Limit for Inland Surface Water Subject to Pollution. 1982. 8. Fair, G .M. Geyer, G.C and Okun, D.A.1981. Aquatic biology in water and waste water
treatment. Wiley International Edition, 2:32-35.CPCB. 1979. Scheme for Zoning and Classification of Indian Rivers, Estuaries and Coastal Water. ADSORBS/3/1978-1979.
9. Mukherjee, S, Das, P and Ghosh, P. B. 2012. Understanding some Physic-chemical Components for Estimation of Eutrophication of an Aquatic system. International Journal of Management & Technology, 2 (1): 64-66.
10. Odum, E, P. 1971. Fundamentals of Ecology, Third Edition. USA. 11. Palmer, C.M, 1980. Algae and Water Pollution, Castle House Publication Ltd, England. 12. Mortimer, C.H. 1981. The oxygen content of air saturated fresh water over ranges of temperature
and atmospheric pressure of Limnological interest, Mitt. Int. Ver. Limnol. 22,23. 13. Rheinheimer, G. 1985. Aquatic Microbiology, Wiley & Sons Ltd. Third Edn. 14. Das, P. K, Mukherjee, S and Ghosh, P. B. 2012. Method of interpretation of Dissolved Oxygen for
Assessing Aquatic Systems. Journal of Institution of Public Health Engineers, India.1 (2): 34-37.
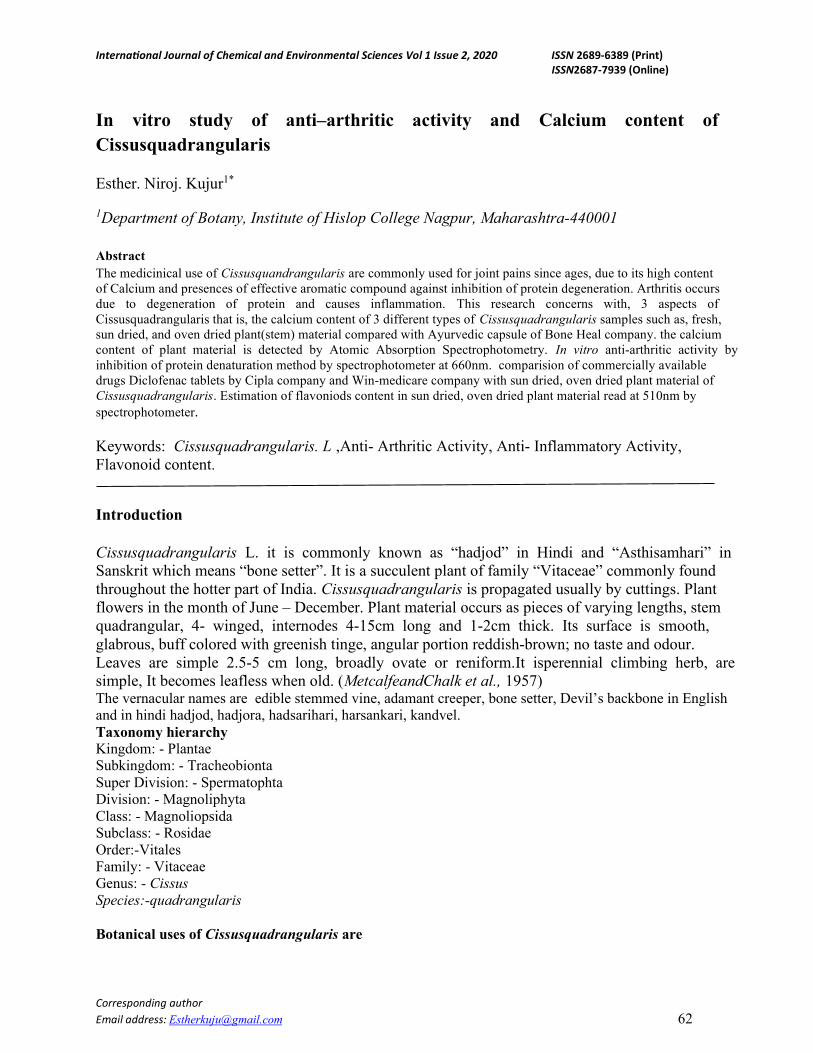
International Journal of Chemical and Environmental Sciences Vol 1 Issue 2, 2020 ISSN 2689-6389 (Print) ISSN2687-7939 (Online)
Corresponding author Email address: [email protected] 62
In vitro study of anti–arthritic activity and Calcium content of Cissusquadrangularis
Esther. Niroj. Kujur1*
1Department of Botany, Institute of Hislop College Nagpur, Maharashtra-440001 Abstract The medicinical use of Cissusquandrangularis are commonly used for joint pains since ages, due to its high content of Calcium and presences of effective aromatic compound against inhibition of protein degeneration. Arthritis occurs due to degeneration of protein and causes inflammation. This research concerns with, 3 aspects of Cissusquadrangularis that is, the calcium content of 3 different types of Cissusquadrangularis samples such as, fresh, sun dried, and oven dried plant(stem) material compared with Ayurvedic capsule of Bone Heal company. the calcium content of plant material is detected by Atomic Absorption Spectrophotometry. In vitro anti-arthritic activity by inhibition of protein denaturation method by spectrophotometer at 660nm. comparision of commercially available drugs Diclofenac tablets by Cipla company and Win-medicare company with sun dried, oven dried plant material of Cissusquadrangularis. Estimation of flavoniods content in sun dried, oven dried plant material read at 510nm by spectrophotometer. Keywords: Cissusquadrangularis. L ,Anti- Arthritic Activity, Anti- Inflammatory Activity, Flavonoid content.
Introduction Cissusquadrangularis L. it is commonly known as “hadjod” in Hindi and “Asthisamhari” in Sanskrit which means “bone setter”. It is a succulent plant of family “Vitaceae” commonly found throughout the hotter part of India. Cissusquadrangularis is propagated usually by cuttings. Plant flowers in the month of June – December. Plant material occurs as pieces of varying lengths, stem quadrangular, 4- winged, internodes 4-15cm long and 1-2cm thick. Its surface is smooth, glabrous, buff colored with greenish tinge, angular portion reddish-brown; no taste and odour. Leaves are simple 2.5-5 cm long, broadly ovate or reniform.It isperennial climbing herb, are simple, It becomes leafless when old. (MetcalfeandChalk et al., 1957) The vernacular names are edible stemmed vine, adamant creeper, bone setter, Devil’s backbone in English and in hindi hadjod, hadjora, hadsarihari, harsankari, kandvel. Taxonomy hierarchy Kingdom: - Plantae Subkingdom: - Tracheobionta Super Division: - Spermatophta Division: - Magnoliphyta Class: - Magnoliopsida Subclass: - Rosidae Order:-Vitales Family: - Vitaceae Genus: - Cissus Species:-quadrangularis Botanical uses of Cissusquadrangularis are

IJCAES Vol 1, Issue 2, 2020
ISSN 2689-6389 (Print) ISSN2687-7939 (Online) 63
Strong bones
Research reveals that greater chances of healing fractures with hadjod supplementation. It also helps in increase uptake of calcium which is a key nutrient for bone strength .Calcium aids in joining broken segments of bone. hadjod supplementation also help reduce chances of fracture by 40%.there is also less pain and swelling observed. (Udupa K. N et al., (1965)
Promotes bone Mineralization
Osteoporosis is a softening of bone majorly related to age. Menopause also contributes to loss of bone mass in women with greater risk of fracture. Cissusquadrangularis increases the osteoblasts and bone mineralization process by increasing the uptake of calcium.so it reduces bone reabsorption and increase bone formation. (DekaDketal., 1994)
Relieve pain
Cissusquadrangularis is very much rich in vitamin C which has anti-inflammatory property. Inflammation can reduce pain, swelling and many other health issues. Cissusquadrangularis also used by athletes. To relieve pain and inflammation. The pain-relieving effect is found as potent as Aspirin. (ViswanathaSAHMetal., 2006)
Decreases post workout injuries
Cissusquadrangularis possess anti-glucocorticoids properties, it is beneficial for athletes and body-builder. Glucocorticoids, along with body’s cortisol hormone, may induce muscle breakdown, loss of skeletal muscle proteins and weakens the bones. Here, C.quadrangularis is a competitor to glucocorticoids. C. quadrangularisis anabolic in nature and increases bone tensile strength. During periods of stress, over-training, or illness, the cortisol level rises, this can be halted by using C. quadrangularis. (LinnJetal., 1999).
Helps in weight loss and reduces cardiovascular risk
Supplements of Cissusquadrangularis with exercise and natural diet, has shown very good results with weight loss. It helps burn fats and increases muscle mass, along with managing appetite. Several studies have noticed that positive built up of lean muscle mass, which helps in boost metabolism and burn more calories. It helps in reducing the adsorption of dietary fat and staying satiated. (Obenetal., 2006).
Obesity high body fat percentage, central obesity or high waist to hip ration can put one at risk of cardiovascular diseases. Cissusquadrangularis helps in reducing the bad LDL- cholesterol, total cholesterol and triglycerides. Many studies suggest that it also helps in increasing HDL- the good cholesterol. (Ogyeyetal., 2001)
Material and Methods Aim and Objectives Comparison of calcium content in fresh plant material of Cissusquadrangulari, Sun dried and oven dried plant material of Cissusquadrangularis, with commercially available ayurvedic product Cissusquadrangularis tablets by Bone Heal Company.In vitro anti- arthritic activity of Cissusquadrangularis comparison with commercially available standard drug i.e. Diclofenac of two different company Cipla and Win-Medicare. Quantatitive analysis of flavonoid of Cissusquadrangularis plant material.
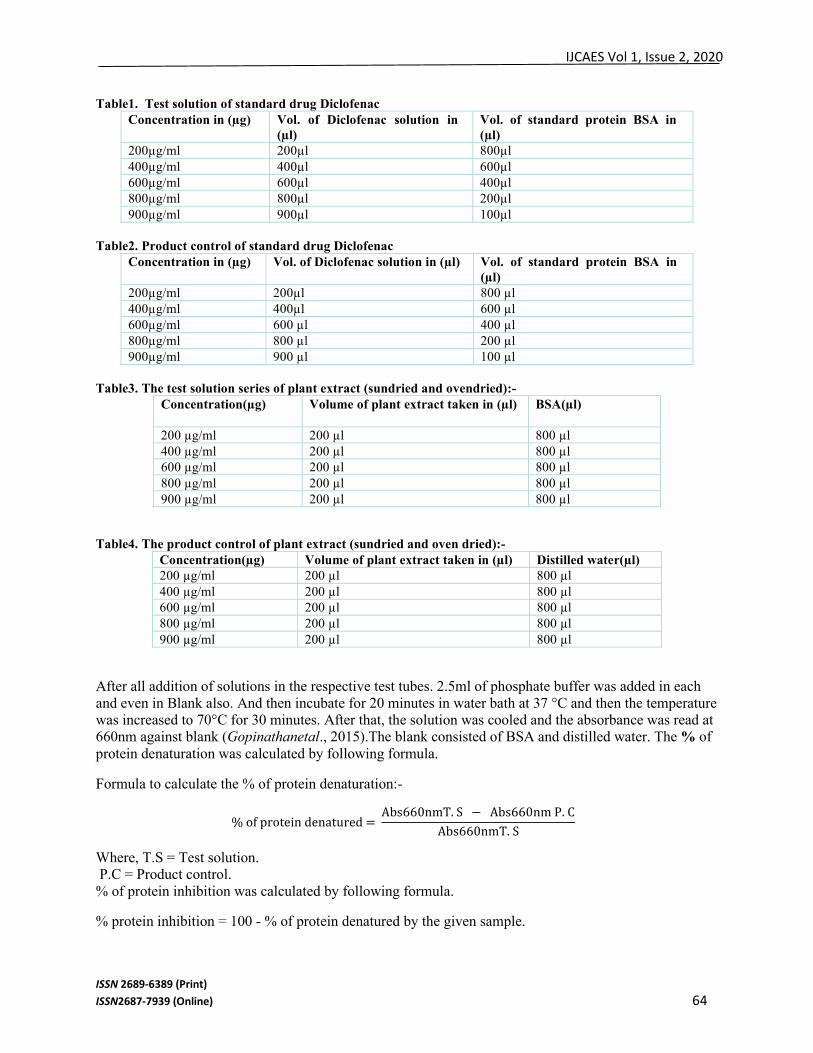
IJCAES Vol 1, Issue 2, 2020
ISSN 2689-6389 (Print) ISSN2687-7939 (Online) 64
Table1. Test solution of standard drug Diclofenac Concentration in (µg) Vol. of Diclofenac solution in
(µl) Vol. of standard protein BSA in (µl)
200µg/ml 200µl 800µl 400µg/ml 400µl 600µl 600µg/ml 600µl 400µl 800µg/ml 800µl 200µl 900µg/ml 900µl 100µl
Table2. Product control of standard drug Diclofenac
Concentration in (µg) Vol. of Diclofenac solution in (µl) Vol. of standard protein BSA in (µl)
200µg/ml 200µl 800 µl 400µg/ml 400µl 600 µl 600µg/ml 600 µl 400 µl 800µg/ml 800 µl 200 µl 900µg/ml 900 µl 100 µl
Table3. The test solution series of plant extract (sundried and ovendried):-
Table4. The product control of plant extract (sundried and oven dried):- Concentration(µg) Volume of plant extract taken in (µl) Distilled water(µl) 200 µg/ml 200 µl 800 µl 400 µg/ml 200 µl 800 µl 600 µg/ml 200 µl 800 µl 800 µg/ml 200 µl 800 µl 900 µg/ml 200 µl 800 µl
After all addition of solutions in the respective test tubes. 2.5ml of phosphate buffer was added in each and even in Blank also. And then incubate for 20 minutes in water bath at 37 °C and then the temperature was increased to 70°C for 30 minutes. After that, the solution was cooled and the absorbance was read at 660nm against blank (Gopinathanetal., 2015).The blank consisted of BSA and distilled water. The % of protein denaturation was calculated by following formula.
Formula to calculate the % of protein denaturation:-
% of protein denatured = Abs660nmT. S − Abs660nm P. CAbs660nmT. S
Where, T.S = Test solution. P.C = Product control. % of protein inhibition was calculated by following formula.
% protein inhibition = 100 - % of protein denatured by the given sample.
Concentration(µg)
Volume of plant extract taken in (µl) BSA(µl)
200 µg/ml 200 µl 800 µl 400 µg/ml 200 µl 800 µl 600 µg/ml 200 µl 800 µl 800 µg/ml 200 µl 800 µl 900 µg/ml 200 µl 800 µl
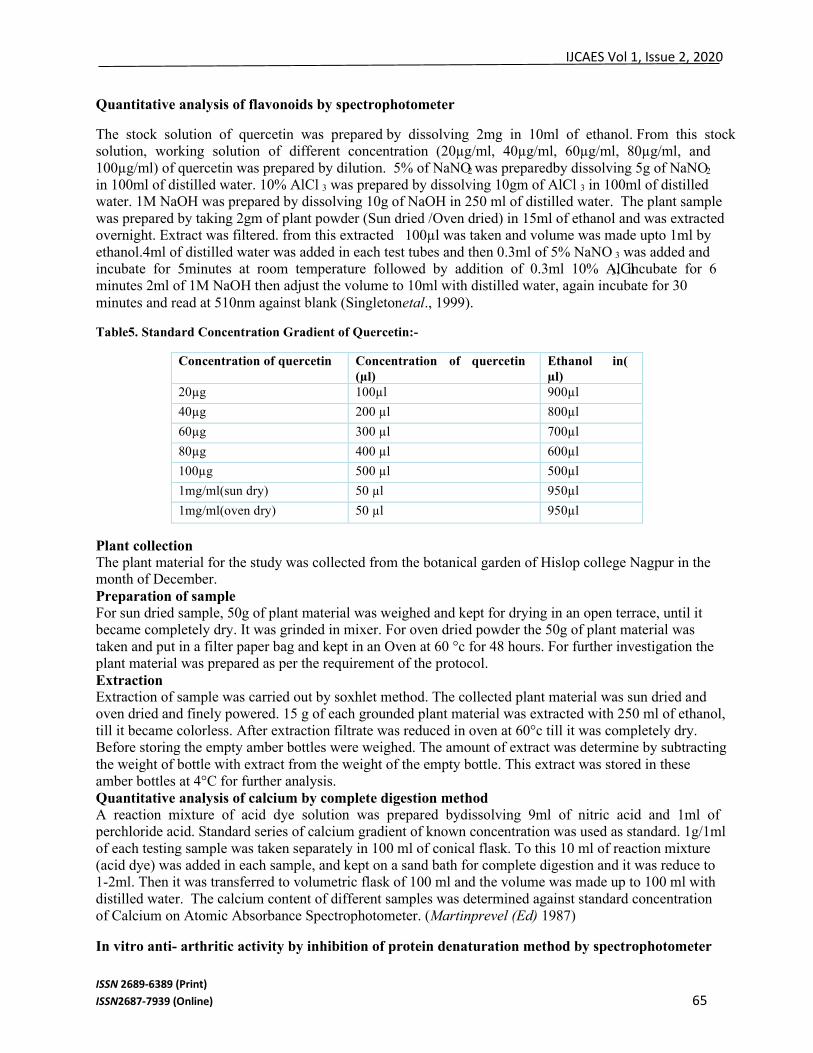
IJCAES Vol 1, Issue 2, 2020
ISSN 2689-6389 (Print) ISSN2687-7939 (Online) 65
Quantitative analysis of flavonoids by spectrophotometer
The stock solution of quercetin was prepared by dissolving 2mg in 10ml of ethanol. From this stock solution, working solution of different concentration (20µg/ml, 40µg/ml, 60µg/ml, 80µg/ml, and 100µg/ml) of quercetin was prepared by dilution. 5% of NaNO2 was preparedby dissolving 5g of NaNO2 in 100ml of distilled water. 10% AlCl 3 was prepared by dissolving 10gm of AlCl 3 in 100ml of distilled water. 1M NaOH was prepared by dissolving 10g of NaOH in 250 ml of distilled water. The plant sample was prepared by taking 2gm of plant powder (Sun dried /Oven dried) in 15ml of ethanol and was extracted overnight. Extract was filtered. from this extracted 100µl was taken and volume was made upto 1ml by ethanol.4ml of distilled water was added in each test tubes and then 0.3ml of 5% NaNO 3 was added and incubate for 5minutes at room temperature followed by addition of 0.3ml 10% AlCl3, incubate for 6 minutes 2ml of 1M NaOH then adjust the volume to 10ml with distilled water, again incubate for 30 minutes and read at 510nm against blank (Singletonetal., 1999).
Table5. Standard Concentration Gradient of Quercetin:-
Plant collection The plant material for the study was collected from the botanical garden of Hislop college Nagpur in the month of December. Preparation of sample For sun dried sample, 50g of plant material was weighed and kept for drying in an open terrace, until it became completely dry. It was grinded in mixer. For oven dried powder the 50g of plant material was taken and put in a filter paper bag and kept in an Oven at 60 °c for 48 hours. For further investigation the plant material was prepared as per the requirement of the protocol. Extraction Extraction of sample was carried out by soxhlet method. The collected plant material was sun dried and oven dried and finely powered. 15 g of each grounded plant material was extracted with 250 ml of ethanol, till it became colorless. After extraction filtrate was reduced in oven at 60°c till it was completely dry. Before storing the empty amber bottles were weighed. The amount of extract was determine by subtracting the weight of bottle with extract from the weight of the empty bottle. This extract was stored in these amber bottles at 4°C for further analysis. Quantitative analysis of calcium by complete digestion method A reaction mixture of acid dye solution was prepared bydissolving 9ml of nitric acid and 1ml of perchloride acid. Standard series of calcium gradient of known concentration was used as standard. 1g/1ml of each testing sample was taken separately in 100 ml of conical flask. To this 10 ml of reaction mixture (acid dye) was added in each sample, and kept on a sand bath for complete digestion and it was reduce to 1-2ml. Then it was transferred to volumetric flask of 100 ml and the volume was made up to 100 ml with distilled water. The calcium content of different samples was determined against standard concentration of Calcium on Atomic Absorbance Spectrophotometer. (Martinprevel (Ed) 1987)
In vitro anti- arthritic activity by inhibition of protein denaturation method by spectrophotometer
Concentration of quercetin Concentration of quercetin (µl)
Ethanol in( µl)
20µg 100µl 900µl
40µg 200 µl 800µl
60µg 300 µl 700µl
80µg 400 µl 600µl
100µg 500 µl 500µl
1mg/ml(sun dry) 50 µl 950µl
1mg/ml(oven dry) 50 µl 950µl
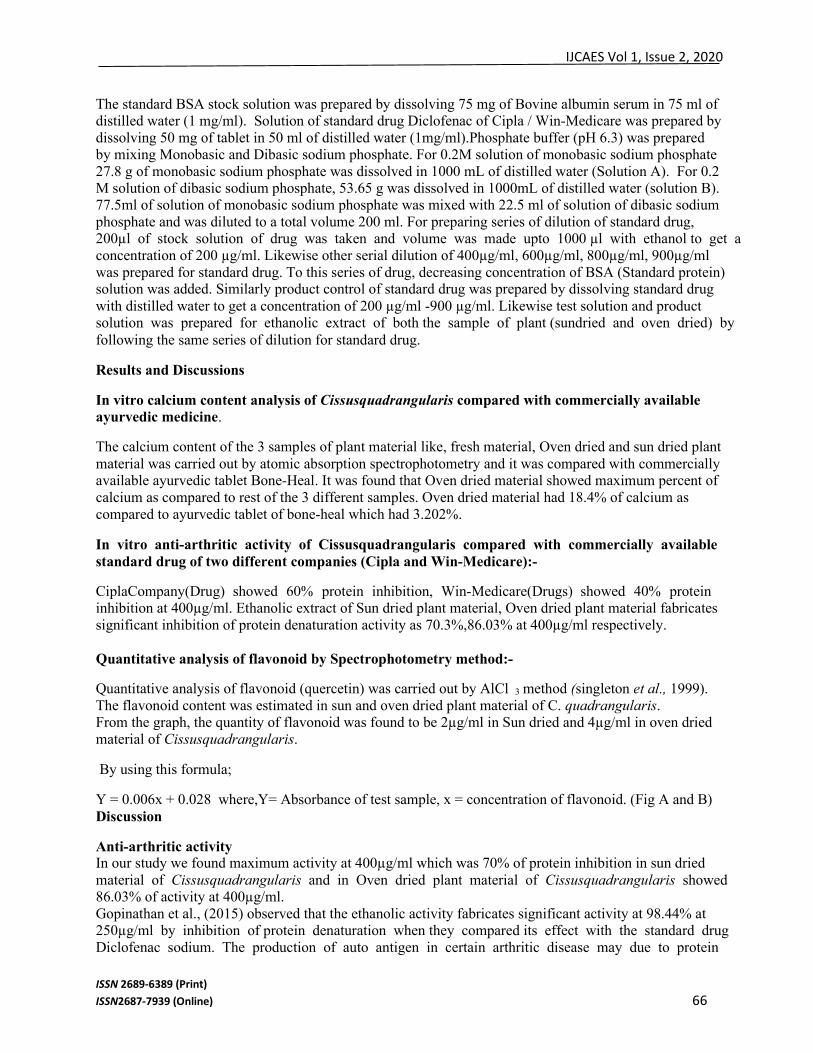
IJCAES Vol 1, Issue 2, 2020
ISSN 2689-6389 (Print) ISSN2687-7939 (Online) 66
The standard BSA stock solution was prepared by dissolving 75 mg of Bovine albumin serum in 75 ml of distilled water (1 mg/ml). Solution of standard drug Diclofenac of Cipla / Win-Medicare was prepared by dissolving 50 mg of tablet in 50 ml of distilled water (1mg/ml).Phosphate buffer (pH 6.3) was prepared by mixing Monobasic and Dibasic sodium phosphate. For 0.2M solution of monobasic sodium phosphate 27.8 g of monobasic sodium phosphate was dissolved in 1000 mL of distilled water (Solution A). For 0.2 M solution of dibasic sodium phosphate, 53.65 g was dissolved in 1000mL of distilled water (solution B). 77.5ml of solution of monobasic sodium phosphate was mixed with 22.5 ml of solution of dibasic sodium phosphate and was diluted to a total volume 200 ml. For preparing series of dilution of standard drug, 200µl of stock solution of drug was taken and volume was made upto 1000 µl with ethanol to get a concentration of 200 µg/ml. Likewise other serial dilution of 400µg/ml, 600µg/ml, 800µg/ml, 900µg/ml was prepared for standard drug. To this series of drug, decreasing concentration of BSA (Standard protein) solution was added. Similarly product control of standard drug was prepared by dissolving standard drug with distilled water to get a concentration of 200 µg/ml -900 µg/ml. Likewise test solution and product solution was prepared for ethanolic extract of both the sample of plant (sundried and oven dried) by following the same series of dilution for standard drug.
Results and Discussions
In vitro calcium content analysis of Cissusquadrangularis compared with commercially available ayurvedic medicine.
The calcium content of the 3 samples of plant material like, fresh material, Oven dried and sun dried plant material was carried out by atomic absorption spectrophotometry and it was compared with commercially available ayurvedic tablet Bone-Heal. It was found that Oven dried material showed maximum percent of calcium as compared to rest of the 3 different samples. Oven dried material had 18.4% of calcium as compared to ayurvedic tablet of bone-heal which had 3.202%.
In vitro anti-arthritic activity of Cissusquadrangularis compared with commercially available standard drug of two different companies (Cipla and Win-Medicare):-
CiplaCompany(Drug) showed 60% protein inhibition, Win-Medicare(Drugs) showed 40% protein inhibition at 400µg/ml. Ethanolic extract of Sun dried plant material, Oven dried plant material fabricates significant inhibition of protein denaturation activity as 70.3%,86.03% at 400µg/ml respectively. Quantitative analysis of flavonoid by Spectrophotometry method:-
Quantitative analysis of flavonoid (quercetin) was carried out by AlCl 3 method (singleton et al., 1999). The flavonoid content was estimated in sun and oven dried plant material of C. quadrangularis. From the graph, the quantity of flavonoid was found to be 2µg/ml in Sun dried and 4µg/ml in oven dried material of Cissusquadrangularis.
By using this formula;
Y = 0.006x + 0.028 where,Y= Absorbance of test sample, x = concentration of flavonoid. (Fig A and B) Discussion
Anti-arthritic activity In our study we found maximum activity at 400µg/ml which was 70% of protein inhibition in sun dried material of Cissusquadrangularis and in Oven dried plant material of Cissusquadrangularis showed 86.03% of activity at 400µg/ml. Gopinathan et al., (2015) observed that the ethanolic activity fabricates significant activity at 98.44% at 250µg/ml by inhibition of protein denaturation when they compared its effect with the standard drug Diclofenac sodium. The production of auto antigen in certain arthritic disease may due to protein
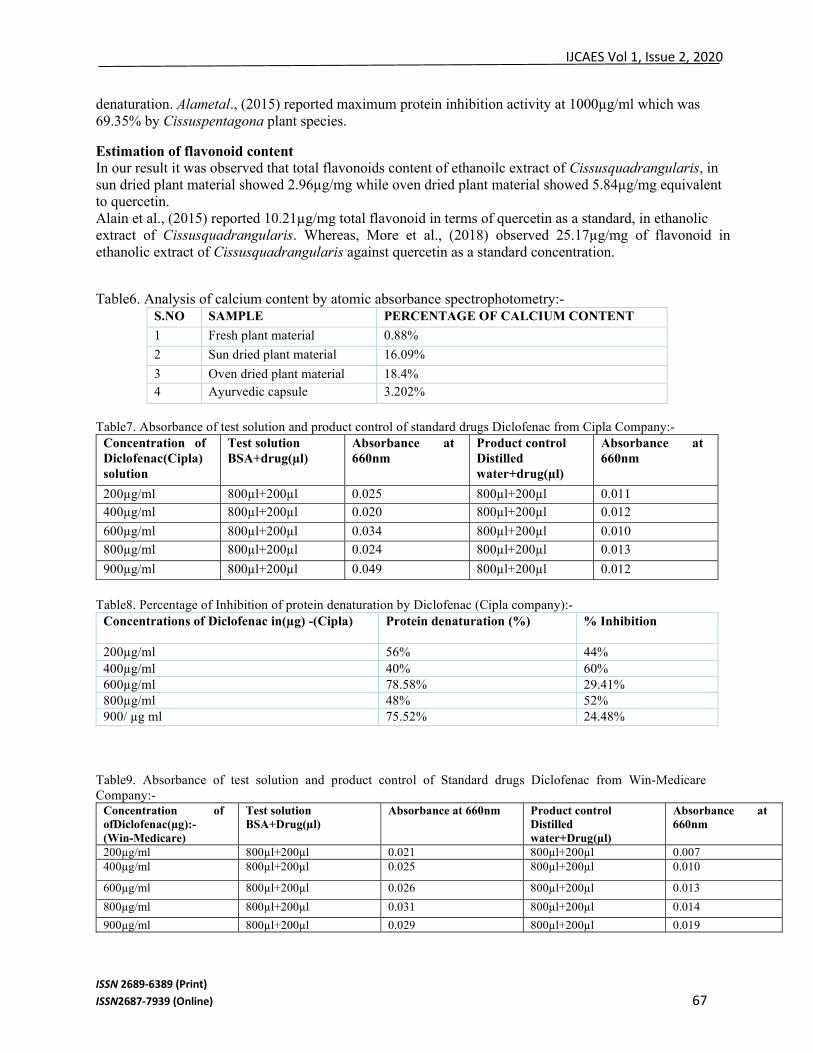
IJCAES Vol 1, Issue 2, 2020
ISSN 2689-6389 (Print) ISSN2687-7939 (Online) 67
denaturation. Alametal., (2015) reported maximum protein inhibition activity at 1000µg/ml which was 69.35% by Cissuspentagona plant species.
Estimation of flavonoid content In our result it was observed that total flavonoids content of ethanoilc extract of Cissusquadrangularis, in sun dried plant material showed 2.96µg/mg while oven dried plant material showed 5.84µg/mg equivalent to quercetin. Alain et al., (2015) reported 10.21µg/mg total flavonoid in terms of quercetin as a standard, in ethanolic extract of Cissusquadrangularis. Whereas, More et al., (2018) observed 25.17µg/mg of flavonoid in ethanolic extract of Cissusquadrangularis against quercetin as a standard concentration.
Table6. Analysis of calcium content by atomic absorbance spectrophotometry:- S.NO SAMPLE PERCENTAGE OF CALCIUM CONTENT
1 Fresh plant material 0.88%
2 Sun dried plant material 16.09%
3 Oven dried plant material 18.4% 4 Ayurvedic capsule 3.202%
Table7. Absorbance of test solution and product control of standard drugs Diclofenac from Cipla Company:-
Concentration of Diclofenac(Cipla) solution
Test solution BSA+drug(µl)
Absorbance at 660nm
Product control Distilled water+drug(µl)
Absorbance at 660nm
200µg/ml 800µl+200µl 0.025 800µl+200µl 0.011 400µg/ml 800µl+200µl 0.020 800µl+200µl 0.012
600µg/ml 800µl+200µl 0.034 800µl+200µl 0.010
800µg/ml 800µl+200µl 0.024 800µl+200µl 0.013
900µg/ml 800µl+200µl 0.049 800µl+200µl 0.012
Table8. Percentage of Inhibition of protein denaturation by Diclofenac (Cipla company):-
Concentrations of Diclofenac in(µg) -(Cipla) Protein denaturation (%)
% Inhibition
200µg/ml 56% 44% 400µg/ml 40% 60% 600µg/ml 78.58% 29.41% 800µg/ml 48% 52% 900/ µg ml 75.52% 24.48%
Table9. Absorbance of test solution and product control of Standard drugs Diclofenac from Win-Medicare Company:-
Concentration of ofDiclofenac(µg):-(Win-Medicare)
Test solution BSA+Drug(µl)
Absorbance at 660nm Product control Distilled water+Drug(µl)
Absorbance at 660nm
200µg/ml 800µl+200µl 0.021 800µl+200µl 0.007 400µg/ml 800µl+200µl 0.025 800µl+200µl 0.010
600µg/ml 800µl+200µl 0.026 800µl+200µl 0.013
800µg/ml 800µl+200µl 0.031 800µl+200µl 0.014
900µg/ml 800µl+200µl 0.029 800µl+200µl 0.019
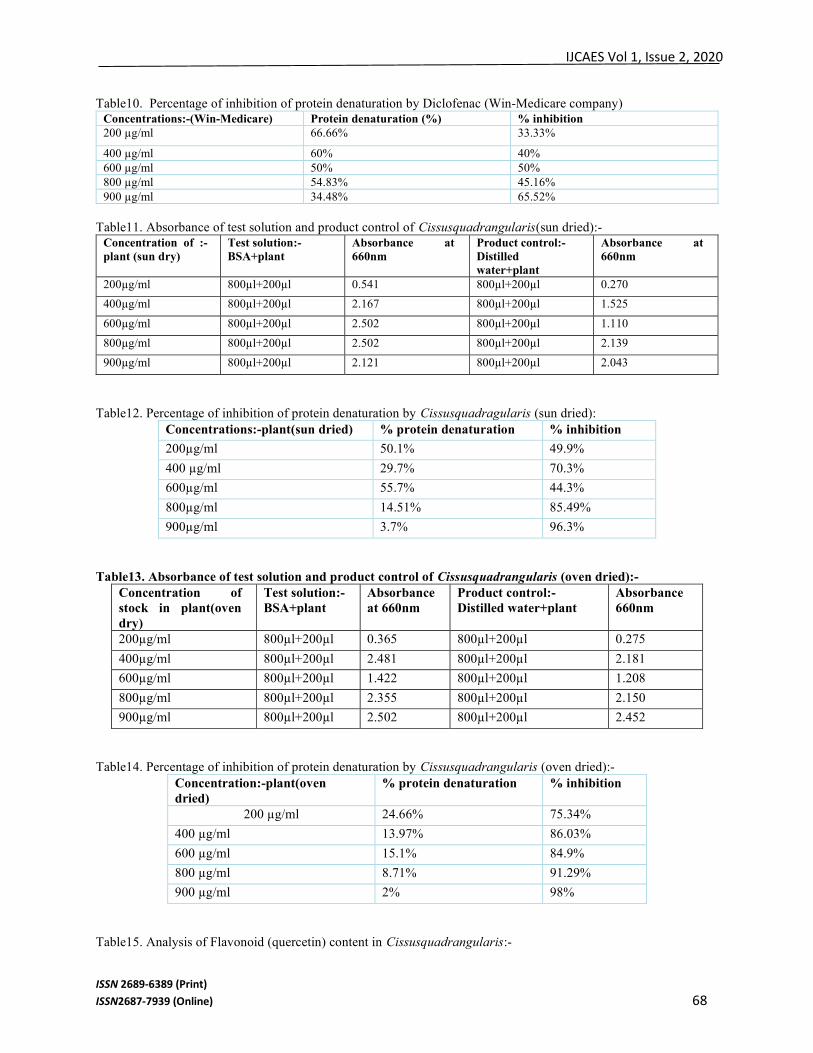
IJCAES Vol 1, Issue 2, 2020
ISSN 2689-6389 (Print) ISSN2687-7939 (Online) 68
Table10. Percentage of inhibition of protein denaturation by Diclofenac (Win-Medicare company) Concentrations:-(Win-Medicare) Protein denaturation (%) % inhibition 200 µg/ml 66.66% 33.33%
400 µg/ml 60% 40% 600 µg/ml 50% 50% 800 µg/ml 54.83% 45.16% 900 µg/ml 34.48% 65.52%
Table11. Absorbance of test solution and product control of Cissusquadrangularis(sun dried):-
Concentration of :-plant (sun dry)
Test solution:- BSA+plant
Absorbance at 660nm
Product control:- Distilled water+plant
Absorbance at 660nm
200µg/ml 800µl+200µl 0.541 800µl+200µl 0.270
400µg/ml 800µl+200µl 2.167 800µl+200µl 1.525
600µg/ml 800µl+200µl 2.502 800µl+200µl 1.110
800µg/ml 800µl+200µl 2.502 800µl+200µl 2.139
900µg/ml 800µl+200µl 2.121 800µl+200µl 2.043
Table12. Percentage of inhibition of protein denaturation by Cissusquadragularis (sun dried): Concentrations:-plant(sun dried) % protein denaturation % inhibition
200µg/ml 50.1% 49.9%
400 µg/ml 29.7% 70.3%
600µg/ml 55.7% 44.3%
800µg/ml 14.51% 85.49%
900µg/ml 3.7% 96.3%
Table13. Absorbance of test solution and product control of Cissusquadrangularis (oven dried):- Concentration of stock in plant(oven dry)
Test solution:- BSA+plant
Absorbance at 660nm
Product control:- Distilled water+plant
Absorbance 660nm
200µg/ml 800µl+200µl 0.365 800µl+200µl 0.275
400µg/ml 800µl+200µl 2.481 800µl+200µl 2.181
600µg/ml 800µl+200µl 1.422 800µl+200µl 1.208
800µg/ml 800µl+200µl 2.355 800µl+200µl 2.150
900µg/ml 800µl+200µl 2.502 800µl+200µl 2.452
Table14. Percentage of inhibition of protein denaturation by Cissusquadrangularis (oven dried):- Concentration:-plant(oven dried)
% protein denaturation % inhibition
200 µg/ml 24.66% 75.34%
400 µg/ml 13.97% 86.03%
600 µg/ml 15.1% 84.9%
800 µg/ml 8.71% 91.29%
900 µg/ml 2% 98%
Table15. Analysis of Flavonoid (quercetin) content in Cissusquadrangularis:-
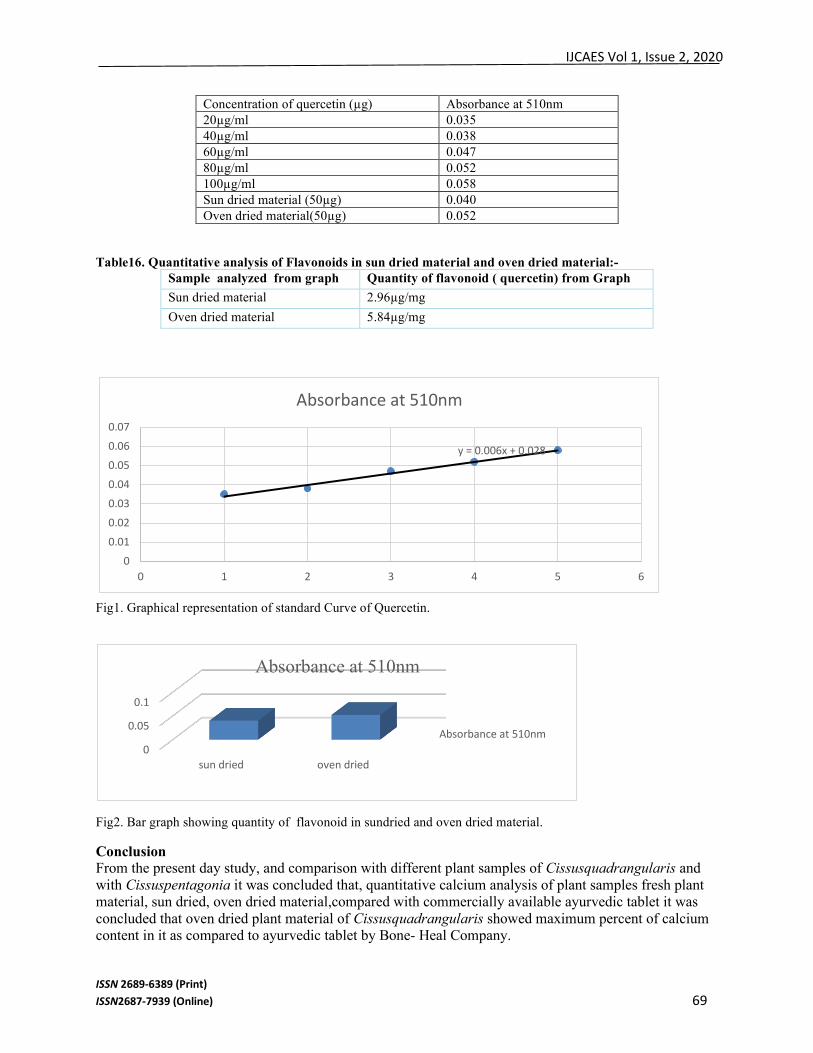
IJCAES Vol 1, Issue 2, 2020
ISSN 2689-6389 (Print) ISSN2687-7939 (Online) 69
Concentration of quercetin (µg) Absorbance at 510nm 20µg/ml 0.035 40µg/ml 0.038 60µg/ml 0.047 80µg/ml 0.052 100µg/ml 0.058 Sun dried material (50µg) 0.040 Oven dried material(50µg) 0.052
Table16. Quantitative analysis of Flavonoids in sun dried material and oven dried material:- Sample analyzed from graph Quantity of flavonoid ( quercetin) from Graph
Sun dried material 2.96µg/mg
Oven dried material 5.84µg/mg
Fig1. Graphical representation of standard Curve of Quercetin.
Fig2. Bar graph showing quantity of flavonoid in sundried and oven dried material.
Conclusion From the present day study, and comparison with different plant samples of Cissusquadrangularis and with Cissuspentagonia it was concluded that, quantitative calcium analysis of plant samples fresh plant material, sun dried, oven dried material,compared with commercially available ayurvedic tablet it was concluded that oven dried plant material of Cissusquadrangularis showed maximum percent of calcium content in it as compared to ayurvedic tablet by Bone- Heal Company.
Absorbance at 510nm0
0.05
0.1
sun dried oven dried
Absorbance at 510nm
y = 0.006x + 0.028
0
0.01
0.02
0.03
0.04
0.05
0.06
0.07
0 1 2 3 4 5 6
Absorbance at 510nm
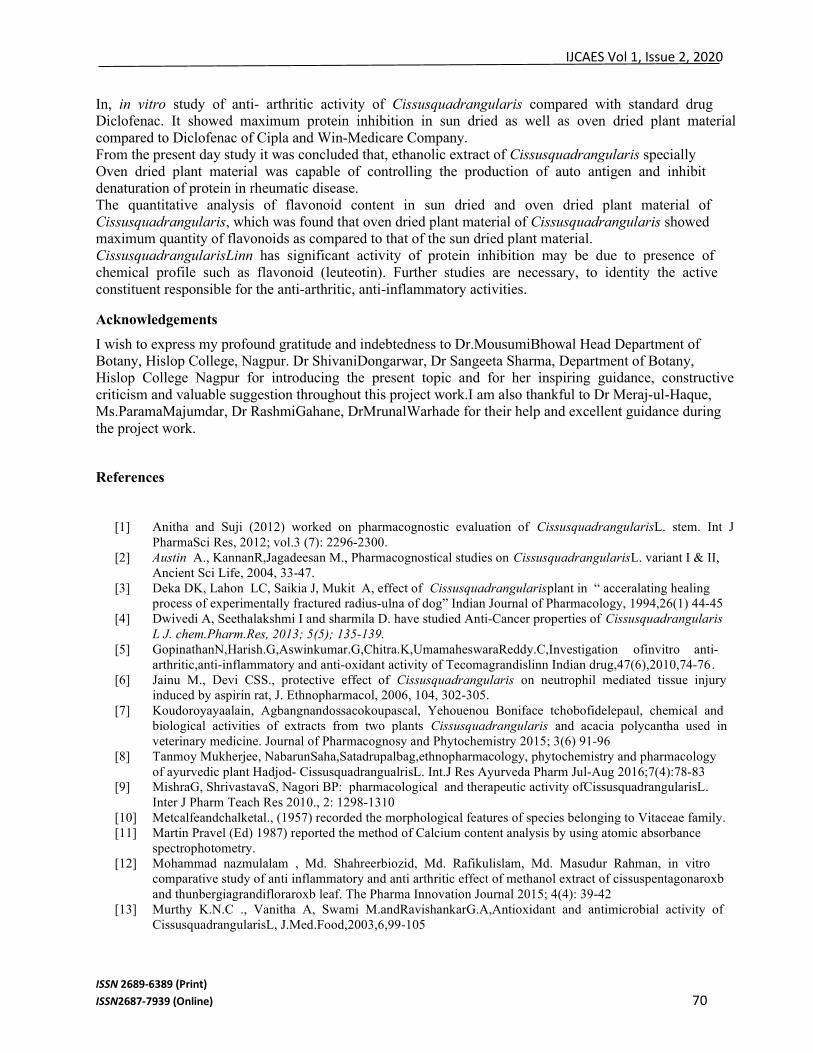
IJCAES Vol 1, Issue 2, 2020
ISSN 2689-6389 (Print) ISSN2687-7939 (Online) 70
In, in vitro study of anti- arthritic activity of Cissusquadrangularis compared with standard drug Diclofenac. It showed maximum protein inhibition in sun dried as well as oven dried plant material compared to Diclofenac of Cipla and Win-Medicare Company. From the present day study it was concluded that, ethanolic extract of Cissusquadrangularis specially Oven dried plant material was capable of controlling the production of auto antigen and inhibit denaturation of protein in rheumatic disease. The quantitative analysis of flavonoid content in sun dried and oven dried plant material of Cissusquadrangularis, which was found that oven dried plant material of Cissusquadrangularis showed maximum quantity of flavonoids as compared to that of the sun dried plant material. CissusquadrangularisLinn has significant activity of protein inhibition may be due to presence of chemical profile such as flavonoid (leuteotin). Further studies are necessary, to identity the active constituent responsible for the anti-arthritic, anti-inflammatory activities.
Acknowledgements
I wish to express my profound gratitude and indebtedness to Dr.MousumiBhowal Head Department of Botany, Hislop College, Nagpur. Dr ShivaniDongarwar, Dr Sangeeta Sharma, Department of Botany, Hislop College Nagpur for introducing the present topic and for her inspiring guidance, constructive criticism and valuable suggestion throughout this project work.I am also thankful to Dr Meraj-ul-Haque, Ms.ParamaMajumdar, Dr RashmiGahane, DrMrunalWarhade for their help and excellent guidance during the project work.
References
[1] Anitha and Suji (2012) worked on pharmacognostic evaluation of CissusquadrangularisL. stem. Int J PharmaSci Res, 2012; vol.3 (7): 2296-2300.
[2] Austin A., KannanR,Jagadeesan M., Pharmacognostical studies on CissusquadrangularisL. variant I & II, Ancient Sci Life, 2004, 33-47.
[3] Deka DK, Lahon LC, Saikia J, Mukit A, effect of Cissusquadrangularisplant in “ acceralating healing process of experimentally fractured radius-ulna of dog” Indian Journal of Pharmacology, 1994,26(1) 44-45
[4] Dwivedi A, Seethalakshmi I and sharmila D. have studied Anti-Cancer properties of Cissusquadrangularis L J. chem.Pharm.Res, 2013; 5(5); 135-139.
[5] GopinathanN,Harish.G,Aswinkumar.G,Chitra.K,UmamaheswaraReddy.C,Investigation ofinvitro anti-arthritic,anti-inflammatory and anti-oxidant activity of Tecomagrandislinn Indian drug,47(6),2010,74-76 .
[6] Jainu M., Devi CSS., protective effect of Cissusquadrangularis on neutrophil mediated tissue injury induced by aspirin rat, J. Ethnopharmacol, 2006, 104, 302-305.
[7] Koudoroyayaalain, Agbangnandossacokoupascal, Yehouenou Boniface tchobofidelepaul, chemical and biological activities of extracts from two plants Cissusquadrangularis and acacia polycantha used in veterinary medicine. Journal of Pharmacognosy and Phytochemistry 2015; 3(6) 91-96
[8] Tanmoy Mukherjee, NabarunSaha,Satadrupalbag,ethnopharmacology, phytochemistry and pharmacology of ayurvedic plant Hadjod- CissusquadrangualrisL. Int.J Res Ayurveda Pharm Jul-Aug 2016;7(4):78-83
[9] MishraG, ShrivastavaS, Nagori BP: pharmacological and therapeutic activity ofCissusquadrangularisL. Inter J Pharm Teach Res 2010., 2: 1298-1310
[10] Metcalfeandchalketal., (1957) recorded the morphological features of species belonging to Vitaceae family. [11] Martin Pravel (Ed) 1987) reported the method of Calcium content analysis by using atomic absorbance
spectrophotometry. [12] Mohammad nazmulalam , Md. Shahreerbiozid, Md. Rafikulislam, Md. Masudur Rahman, in vitro
comparative study of anti inflammatory and anti arthritic effect of methanol extract of cissuspentagonaroxb and thunbergiagrandifloraroxb leaf. The Pharma Innovation Journal 2015; 4(4): 39-42
[13] Murthy K.N.C ., Vanitha A, Swami M.andRavishankarG.A,Antioxidant and antimicrobial activity of CissusquadrangularisL, J.Med.Food,2003,6,99-105

IJCAES Vol 1, Issue 2, 2020
ISSN 2689-6389 (Print) ISSN2687-7939 (Online) 71
[14] Ogey A, Baryraktar F, Sevin G, A comparative study of Raloxifen and estrogen on bone strength and cholesterol levels in ovariectomized rats. Endocrine Abstracts, 2001 3, 10.
[15] Oben and Juliusetal., (2008) have reported the use of Cissusquadrangularis/ Irivingiagabonensis combination in the management of weight loss; a double-blind placebocontrolled study. Lipids in health and disease 2008; 7.1:1
[16] Oben J, Kuate D , Agbor G , Momo C , Talla X ., The use of a cissusquadrangularis formulation in the management of weight loss and metabolic syndrome. Lipids in Health and Disease, 2006, 5, 24.
[17] PathomwichchaiwatThanika, et al.Alkaline Phosphatase activity guided isolation of active compounds and new Dammarane-type triterpene from Cissusquadrangularis Hexane extract, Journal of Ethanpharmacology 2015;160:52-60.
[18] Potuetal., have examined the effect of petroleum ether extract of CissusquadrangularisL. on the proliferation rate of bone marrow mesenchymal stem cells and suggested that CissusquadrangularisL. stimulates osteoblastogenesis and can be used as preventive alternate natural medicine for osteoporosis. Clinics 2009; 64.10: 993-998
[19] RajSJ. Pharmacognotic and traditional properties of Cissusquadragularis L.-A overview International Journal of Pharma and Bio Sciences.2011; 2(1):131-139.
[20] RaoMS, Bhagath KP, NarayanaSwamy VB, the extract of CissusquadrangularisL.enhances the development of cortical bone and trabeculae in the fetal femur. Pharmacology Online 2007; 3:190-202SINGLETON, V.L., ORTHOFER .R, LAMUEL- RAVENTOS, R.M (1999): analysis of total phenols and other oxidation substrates and antioxidants by means of Folin-Ciocalteu reagent. Method Enzymol.299, 152-178
[21] Shah and Unnati Cissusquadrangularislinn ;phytochemical, traditional uses and pharmacological activities-A Review Int J of Pharmacy and Pharm Sci 2011; 41-4
[22] Smita More, Mohiniupadhye, Archanalokhare and Snehajagtap, comparative quantification of flavonoid content and antioxidant potential of indigenous medicinal plants. Journal of Pharmacognosy and Phytochemistry2018 ; 7(1): 343-345
[23] SanyalA, Ahmad A., Sastry M., calcite growth in Cissusquadrangularisplant Extract. They concluded that, the plant extract. Current Science, 2005, 89(10), 1742-1745
[24] Udupa K.N., Prasad G.C., Sen S.P., The effect of phytogenic steroid in the acceleration of fracture repair, Life Science, 1965, 4, 317.Vishwanatha SAHM, Thippeswan MDV, Mahendra KCB, some neuropharmacological effect of methanolic root extract of Cissusquadrangularis in mice. Afr.J. Biomed. Res 2006, 9, 64-75
[25] Vijay, Priyanka, RekhaVijayvergia analgesic, anti-inflammatory and [26] Antipyretic activity of CissusquandrangularisL.Journal of Pharmaceutical Science and Technology 2010;
2:1:111-118 [27] VijayalakshamiA., et al In vitro Antioxidant and anticancer activity of Flavonoid fraction from the aerial
part of Cissusquadragularislinn. Against human Breast carcinoma cell lines, Journal of chemistry 2013