chemical engineering journal - elsevier
TRANSCRIPT

Chemical Engineering Journal xxx (2012) xxx–xxx
Contents lists available at SciVerse ScienceDirect
Chemical Engineering Journal
journal homepage: www.elsevier .com/locate /cej
Dynamic modelling of a stopped flow fixed bed reactor for gas phaseolefin polymerisation
B. Browning a, I. Pitault a,⇑, N. Sheibat-Othman c, E. Tioni b, V. Monteil b, T.F.L. McKenna b,⇑a Laboratoire de Génie des Procédés Catalytiques, Université de Lyon, CNRS-CPE Lyon, 43 bd du 11 novembre 1918, 69616 Villeurbanne, Franceb Laboratoire Chimie, Catalyse, Polymères et Procédés, Université de Lyon, CNRS-CPE Lyon-UCBL, 43 bd du 11 novembre 1918, 69616 Villeurbanne, Francec Laboratoire d’Automatique et de Génie de Procédés, Université de Lyon, CNRS-UCBL, CPE Lyon, 43 bd du 11 novembre 1918, 69616 Villeurbanne, France
h i g h l i g h t s
" A dynamic model of a stopped flow, fixed bed polymerisation reactor was created." Temperature profiles throughout the reactor bed were determined." The model results are validated and in agreement with analytical findings." Higher than expected catalyst temperatures are found to be possible.
a r t i c l e i n f o
Article history:Available online xxxx
Keywords:Reactor modellingOlefin polymerisationHeat transferNascent polymerisation
1385-8947/$ - see front matter � 2012 Elsevier B.V. Ahttp://dx.doi.org/10.1016/j.cej.2012.07.027
⇑ Corresponding authors. Tel.: +33 4 72 43 17 61 (I66 (T.F.L. McKenna).
E-mail addresses: [email protected] (I.lcpp.cpe.fr (T.F.L. McKenna).
Please cite this article in press as: B. Browning etJ. (2012), http://dx.doi.org/10.1016/j.cej.2012.07
a b s t r a c t
A heterogeneous 2D dynamic model of a stopped flow fixed bed reactor for gas phase ethylene polymer-isation has been constructed and validated. The reactor contains two solid phases with accumulation ofmass within the reactor bed and the experiments modelled are of very short duration (0.1–75 s). There isa good fit between measured data and calculated values, and the model results allow us to interpret theexperimentally observed temperature rises. Higher than expected catalyst temperatures are foundtowards the reactor centre and exit which are due to the initial intensity of the polymerisation reaction.
� 2012 Elsevier B.V. All rights reserved.
1. Introduction
The gas phase polymerisation of ethylene is of great economicimportance, with several tens of millions of tonnes produced annu-ally [1]. This is a heterogeneously catalysed process, with differenttypes of active sites dispersed on a highly porous solid support;Ziegler–Natta catalysts, TiCl4 dispersed on MgCl2, and chromiumcatalysts, CrOx dispersed on silica are the two most common exam-ples. Regardless of the type of catalyst in question, the reactiontypically progresses when monomer diffuses into the poroussupport and begins to polymerise. As polymer accumulates, theoriginal support ‘‘fragments’’ and is replaced by a continuous poly-mer matrix. In an ideal situation one catalyst particle leads to theproduction of one polymer particle, (see McKenna et al. [2,3] formore details).
In their recent reviews McKenna et al. [2,3] show that the initialinstants of the polymerisation, i.e. during and just after the
ll rights reserved.
. Pitault), tel.: +33 4 72 43 17
Pitault), timothy.mckenna@
al., Dynamic modelling of a sto.027
fragmentation step, are perhaps the most important of the reactionsince it is during this phase that the morphology is determined,and when heat and mass transfer resistances can be very signifi-cant. Some particle scale models attempt to model the initial frag-mentation period from a theoretical point of view [4–9] or basedon experiments carried out under conditions milder than thosefound in industry [10]. For more detailed discussions of the strongand weak points of these approaches, the reader is referred to thereviews cited above, and references therein. Suffice to say that oneof the major difficulties associated with using these models is thatthey rely on assumptions that need to be experimentally validatedand physical properties that evolve very quickly. Since the timescales during which fragmentation takes place are relatively short(0.1–100 s under typical conditions); it is challenging to use con-ventional laboratory scale reactors to verify these models. Becauseof the precise control over reaction time and conditions required, itis necessary to use specially adapted tools for the study of the firstinstants of the polymerisation [11].
To this end, our research group has developed specialisedreactors for the study of the first instants of gas phase polyolefinpolymerisation [12,13]. Tioni et al. [14] used a simplified energybalance to approximate the average temperature difference
pped flow fixed bed reactor for gas phase olefin polymerisation, Chem. Eng.

Nomenclature
A size of upstream pressure step change, (N m�2)C concentration, (mol m�3)Dr radial diffusivity, (m2 s�1)Dm molecular diffusivity, (m2 s�1)Ea activation energy, (J mol�1)F flowrate, (mol s�1)Fex ratio of external mass transfer and reaction rates, (-)H Henry constant, (gC2 gPEamorph
�1 N�1 m2)DH heat of reaction, (J mol�1)Kp gain, (-)L specific distance,(m)MR mass of PE per unit volume of reactor, (g m3)Mwt molecular weight, (g mol)P reactor pressure, (N m�2)R ideal gas constant, (J mol�1 K�1)Scat catalyst specific surface, (m2 m�3)Sr segment cross sectional area, (m2)Sh Sherwood number, (-)T temperature, (K)U overall heat transfer coefficient, (W m�2 K�1)a,b,c constantscp specific heat capacity, (J g�1 K�1)d diameter, (m)h heat transfer coefficient, (W m�2 K�1)k lumped reaction constantkD mass transfer coefficient, (m s�1)
kD0 uncorrected mass transfer coefficient, (m s�1)lsfer effective radial bed conductivity, (W m�1 K�1)lsfax effective axial bed conductivity, (W m�1 K�1)�rp apparent reaction rate, (mol s�1 m�3
cat)rp intrinsic (max observed) reaction rate, (mol s�1 m�3
cat)�rR apparent reaction rate, (mol s�1 m�3
reactor)r radius, (m)t time, (s)y mole fraction, (-)z reactor length, (m)dex measure of effect of heat transfer resistance on reaction
rate, (-)e porosity of reactor bed, (-)q density, (g m�3)s time constant, (s)
Subscripts
C2 ethylenec catalyst/polymer phasecat catalystex externalg gas/inert phaserg reaction gasR reactorw wall
Table 1Parameter values used in the model.
Parameter Correlation Name Ref. Calculated valuea
Heat transfer coefficientsCatalyst particle Kunii & Levenspeil, 1969 in [23] 3545 Wm�2 K�1
Reactor internal wall Specchia et al., 1980 in [23] 3815 Wm�2 K�1
Reactor external wall Kunii & Smith, 1960 in [22] 3000 Wm�2 K�1
Effective bed conductivityRadial Yagi et al., 1960 in [23] 0.09 Wm�1 K�1
Axial Yagi et al., 1960 in [23] 0.04 Wm�1 K�1
Effective stainless steel fritConductivity Maxwell, 1873 [29] 5.25 Wm�1 K�1
a 353 K, inlet gas composition & full flow/pressure.
2 B. Browning et al. / Chemical Engineering Journal xxx (2012) xxx–xxx
between the bulk gas phase and the particles, and showed that gra-dients on the order of 10 K or more are possible. However, a moredetailed picture of the real bed temperatures is needed if onewishes to accurately interpret the data from this reactor.
Gas phase ethylene polymerisation is normally carried out influidised bed reactors and the usual associated assumptions andcorrelations, such as perfect mixing of the particles and the RanzMarshall equation for the particle heat transfer coefficient, areused for reactor modelling [15,16]. There is no precedent for themodelling of this reaction in a fixed bed, a few typical examplesof reactions which are carried out in catalytic fixed bed reactorsare methane cracking, synthesis of acrolein, phosgene, phthalic-anhydride and ortho-xylene and catalytic combustion. These havehigh reaction rates and tend to be externally mass transfer limitedor, in the case of catalytic combustion, heat and mass transfer lim-ited (externally). Ethylene polymerisation is different because themonomer remains within the catalyst particle creating a situationat the particle boundary layer which facilitates mass transfer andhinders heat transfer. Also, this particular packed bed containstwo different solids, which have entirely different properties: thecatalyst support and an inert used to provide extra heat capacity.To create a reactor model that includes these factors and can beused to estimate the distribution of temperature inside the gasphase reactor used in our group [12,13] we take a standard ap-proach, similar to that developed for methane cracking with cokingby Osuna Sanchez et al. [17] and employing widely accepted corre-lations for heat transfer parameters (see Table 1). The two pro-cesses are alike in that they both take into account transient heattransfer and accumulation of mass on the catalyst particles.
The principle objective of this model is to understand the tem-perature conditions experienced by the growing polymer particlesas a function of time and position in the bed. For this reason themodel will focus on the reactor scale. Particle scale effects arelumped into a single parameter to be expanded later. The modelis thus a tool for understanding reactor conditions as opposed tooptimisation of known parameters.
Please cite this article in press as: B. Browning et al., Dynamic modelling of a stoJ. (2012), http://dx.doi.org/10.1016/j.cej.2012.07.027
2. Material and methods
2.1. Description of experimental set-up
The system to be modelled consists of a laboratory scale, stain-less steel, fixed bed reactor containing a mixture of catalyst and in-ert solid. The reactor and operating method are described in detailby Tioni et al. [13]. The reactor is constructed in three sections: aninner chamber, A, which contains the reactor bed, an outer cham-ber, B, and a lid, C. The bed is 1 cm long by 2 cm diameter and isheld in place by two 15 lm, stainless steel frits of thickness3 mm. The reactor is equipped with two 1 mm T-type thermocou-ples, one at the inlet chamber and one at the exit chamber. It isplunged into a water bath that fixes the external temperature.The assembled reactor is represented in Fig. 1.
The reaction gas is a mixture of 67 mol% ethylene and 33 mol%helium (He, is not a standard process gas for ethylene polymerisa-tion, but is used here to help control the temperature of the parti-cles much as propane is used in standard dry mode ethylenepolymerisations). The gas is supplied from a tank to the reactorat 9 bar via a pressure control valve, then heated by passage
pped flow fixed bed reactor for gas phase olefin polymerisation, Chem. Eng.

Fig. 1. Section of the assembled cylindrical stainless steel reactor.
B. Browning et al. / Chemical Engineering Journal xxx (2012) xxx–xxx 3
through the coils in the hot water bath operated at 353 K, the flow-rate is measured at the reactor exit. The inert solid is NaCl and thesupported catalyst (average particle diameter 58 lm) comprises 3–5 wt.% of the bed. The catalyst is prepared using the method de-scribed by Tioni et al. [13]: a computer controlled automatic valve,maintained at 353 K by electrical resistance, is set to open andclose for a preset time period fixing the reaction duration. Beforereactant injection the system is swept with argon at atmosphericpressure to remove impurities and the reaction is stopped by rapiddegassing followed by an injection of CO2 via another automaticvalve. Temperature data is collected automatically from the ther-mocouples. The process flow diagram of the reactor and set up isshown in Fig. 2.
The recorded data set for each experiment includes: measuredinlet and outlet temperatures, masses of catalyst, inert, and pro-duced polymer, reactor exit gas flowrate and reaction duration.
The results of a typical experiment are shown in Fig. 3. It can beseen that a significant proportion of the total heat of reaction is re-moved during cooling by CO2 so this period must be included inthe model. The maximum reaction rate observed was for theexperiment of shortest duration (0.1 s) with a yield of0.068 gPE g�1
catalyst giving an average reaction rate of about2500 gPE g�1
catalyst h�1.
2.2. Model construction
Before writing the mass and energy balances, which are the ba-sis of the model presented here, the system was reviewed for phe-nomena other than the polymerisation which could affect themeasured temperature data over the very short timescales studied.Fig. 4 shows that at the start of the reaction a small temperaturespike at the reactor inlet is seen due to the heat of compressionof the gases entering the system, this is however negligiblecompared to the heat of reaction.
Fig. 2. Process flow diagram
Please cite this article in press as: B. Browning et al., Dynamic modelling of a stoJ. (2012), http://dx.doi.org/10.1016/j.cej.2012.07.027
The pressurisation rate of the unit was measured and the reac-tor was found to reach full pressure after approximately 1 s, fol-lowing the behaviour of a first order system. The results areshown in Fig. 5. Because the time for pressurisation is of the sameorder as the duration for some experiments it cannot be ne-glected and is included in the reactor model using the standardformula for the response of a first order system to a step changeshown in Eq. (1)
PðtÞ ¼ AKp 1� e�ts
� �ð1Þ
Mears criterion, Eq. (2), [18] is used to evaluate whether the ra-dial temperature profile across the reactor bed must be taken intoaccount. The heat of reaction and activation energy for ethylenepolymerisation are about 105 J mol�1 [19] and 4 � 105 J mol�1
[20] respectively. The effective radial conductivity of the reactorbed, estimated using the Kunii and Smith correlations (see Table1), is 0.09 W m�1 K�1. The combination of very high initial reactionrate and heat of reaction lead to a value of Mears criterion (Eq. (2))for this system of about 1800 which is far in excess of the limit of0.4. A two dimensional model is therefore essential.
1� eð ÞrpjDHjEaR d2
R
4lsferT2w
1þ 8lsfer
UdR
� �> 0:4 ð2Þ
The reactor bed contains not only reaction gas and solid cata-lyst but also solid inert and accumulating polymer. A reactor canbe modelled as a single pseudo-homogeneous phase if the tem-peratures and concentrations at the particle surface are suffi-ciently close to the bulk fluid values to make negligibledifference in the reaction rate. The effects of both mass and heattransfer were evaluated to determine whether this is the case.Floyd et al. state that for homo-polymerisation with only puremonomer present in the gas phase, a diffusive mechanism forboundary layer mass transfer does not apply [21], however, herethe ethylene is diluted with helium so a boundary layer does ex-ist. The ratio of maximum reaction rate to mass transfer rateacross the catalyst boundary layer, Fex, calculated from Eqs. (3)and (4) is used to determine the effect of external mass transferlimitations. The Sherwood number is close to its minimum valueof 2 due to the very small catalyst particle diameter and at thereaction conditions the molecular diffusivity of helium in ethyl-ene is 7.3 � 10�6 m2 s�1 [22]. A correction can be made for thedifference in the number of moles of gas entering and leavingthe particle which would increase kD so, based on the maximumobserved reaction rate, Fex < 0.002. Mass transfer across theboundary layer is therefore not limiting.
Fex ¼�rpL
kDCexð3Þ
of the reactor system.
pped flow fixed bed reactor for gas phase olefin polymerisation, Chem. Eng.

14 16 18 20 22 24 26 28 30 32345
350
355
360
365
370
Time (s)
Tem
pera
ture
(K)
Measured T(in)Measured T(out)
startreaction end reaction
end cooling
CO2 coolingperiod
Fig. 3. Temperature measurements for typical reaction of duration 4 s.
0 2 4 6 8 10352.4
352.6
352.8
353
353.2
353.4
353.6
353.8
Time (s)
Tem
pera
ture
(K)
T(inlet)T(outlet)heat of compression
Fig. 4. Measured inlet and outlet temperatures for NaCl reactor bed with nocatalyst.
Fig. 5. Measured pressurisation rate at reactor outlet and curve for response of afirst order system to a step change.
4 B. Browning et al. / Chemical Engineering Journal xxx (2012) xxx–xxx
kD � kD0 ¼ShDm
dcatð4Þ
For heat transfer across the catalyst boundary layer a similar ra-tio can be determined using Eq. (5) [23]. Tc – Tg is estimated to be atleast 7 K from Eq. (6), again at the maximum observed reaction
Please cite this article in press as: B. Browning et al., Dynamic modelling of a stoJ. (2012), http://dx.doi.org/10.1016/j.cej.2012.07.027
rate; hcat is estimated by Kunii and Levenspiel’s method (seeTable 1). The value of dex is greater than 0.1 indicating that for theseconditions the catalyst surface temperature is raised above theaverage temperature enough to cause a significant increase in reac-tion rate. The catalyst particles and the gas phase must thereforebe accounted for separately.
dex ¼Ea
RTg
Tc � Tg
Tc
�������� ð5Þ
Tc � Tg ¼�rpDH
Scathcatð6Þ
The inert solid represents around 95–97 wt.% of the solid in thereactor bed. The NaCl is in the form of agglomerated 5 lm NaClcubes with a large surface area, open structure and high specificsurface. The temperature difference between the NaCl and gasmuch is lower than for the catalyst particles and gas, mainly be-cause of the difference in the area for heat transfer per unit volumeof reactor bed for the two solids. The NaCl particles are smallerthan the catalyst particles, other conditions are the same, so theNaCl heat transfer coefficient will tend to be greater than that forthe catalyst. The maximum mass ratio of catalyst to NaCl is0.05:0.95; the densities of the catalyst and NaCl are 430 kg m�3
and 2170 kg m�3 respectively, the catalyst diameter is 58 lm andthe NaCl basic cube unit size is 5 lm. The ratio of the external sur-face for heat exchange of catalyst to NaCl is 1:44, so the sameamount of energy is transferred at much lower temperature differ-ence. So, finally the model will have two separate phases: (1) thegas and inert solid and (2) the catalyst and polymer.
Internal mass transfer limitations, particle growth and catalystdeactivation are amongst the possible particle scale effects occur-ring during the reaction period studied here. Since we have statedthat our aim in this publication is to provide a model that can givea good estimate of the conditions throughout the reactor bed,rather than predict the behaviour of the catalyst particles, the ef-fects of pore diffusion in both the catalyst support and polymerlayer are not considered separately in this part of the work. Wealso assume that the concentrations of ethylene in the gas andpolymer phases are at equilibrium. At a later stage it should bepossible to replace these assumptions with a more realistic particlescale model if need be. In the meantime, the reaction rate and tem-perature profiles calculated within the reactor are dependant on asingle lumped reaction rate parameter and are therefore estimates.
The data and correlations required for the fluid physical proper-ties to be used in the model are mainly drawn from the literature[22,24]. With regard to the solubility of ethylene in polyethylene,this can be represented at low pressures using Henry’s law withthe empirical formula in Eq. (7) giving the best fit with measureddata for the value of the Henry constant [25,26]. Experimental datais reported in the literature [27,28] with values dependant on thepolyethylene type under investigation. The HDPE used in the workof Moore and Wanke [27] is the most similar to that produced inour reactor so we use their data. The constants a and b are foundby regression to be �20.5 and 194000 respectively.
lnðHÞ ¼ aþ b
T2 ð7Þ
Heat transfer coefficients and effective conductivities are deter-mined according to the references in Table 1. Calculated parametervalues are given for typical reactor conditions.
Boundary conditions are required for the reactor model. Theknown temperatures in the system are those measured in thechambers at the reactor inlet and outlet and that of the hot waterbath. As well as the reactor bed, the model must then include thestainless steel inlet and outlet frits and 10 mm thick reactor wall.
pped flow fixed bed reactor for gas phase olefin polymerisation, Chem. Eng.

14 16 18 20 22 24 26 28 30 32345
350
355
360
365
370
Time (s)
Tem
pera
ture
(K)
Measured T(in)Measured T(out)Model T(out)
Fig. 6. Comparison of calculated output temperatures against measured values foran experiment of 4 s duration (T = 353 K, P = 6.67 bars of C2H4, nominal gas/particlevelocity = 0.11 ms�1).
B. Browning et al. / Chemical Engineering Journal xxx (2012) xxx–xxx 5
Plug flow is assumed and also a constant temperature in the hotwater bath which is controlled to within 1 K of 353 K. It is also as-sumed that once the reactor pressure is stable the reaction gas exitflowrate is constant and consumption of ethylene in the reactor iscompensated by increased flow of incoming reaction gas.
The material balances given in Eqs. (8) and (9) are used respec-tively to represent the gas phase mole fraction of ethylene and themass of accumulating polymer. The reaction gas flowrate decreasesalong the length of the reactor as ethylene is consumed (Eq. (10)).The gas exit flowrate is directly proportional to the reactorpressure.
@yC2
@t¼ �RTg
PekCcate
� EaRTc yC2PHð1þ yC2Þ � F
@yC2
Sr@z
�
� rDrePRTg
@
@rr@yC2
@rþ yC2
Tg
@Tg
@r
� �þ yC2eP
RT2g
@Tg
@t
!ð8Þ
dMR
dt¼ MwtC2kHCcate
� EaRTc yC2P ð9Þ
dFSrdz
¼ ��rR ð10Þ
The heat balances for the catalyst/polymer phase in the reactorand for the gas/inert phase are given by Eqs. (11) and (12) respec-tively. The form of the energy balance for the gas/inert is also usedto represent the stainless steel frits and reactor wall and for thecooling period. As there is no reaction during the CO2 flow a singleheat balance is sufficient to represent the system during thisperiod.
dTC
dt¼ 1P
ðqcpÞcMwtC2kHCcate
� EaRTc yC2P
DHMwtC2
þ cpC2ðTg � TcÞ� ��
þScathcatðTg � TcÞ�
ð11Þ
@Tg
@t¼ 1P
ðqcpÞg�ScathcatðTg � TcÞ þ FMwtrgcprg
@Tg
Sr@z
�
þ lsfer
r@
@rr@Tg
@r
� �þ lsfax
@2Tg
@z2
!ð12Þ
The experimental data shows that as the reaction progressesthe polymerisation rate drops quickly from its initial value. Inthe model the overall polymerisation rate is calculated using alumped reaction constant which represents all the particle scale ef-fects. In order to mimic the real overall reaction rate as closely aspossible its value is reduced as the polymerisation progressesand adjusted to get the best fit between measured and calculatedoutput temperatures. The form used for the pre-exponential factoris given in Eq. (13).
k ¼ a� bðMRÞc ð13Þ
The reactor is discretised along both its length and radius andthe differential equations representing the heat and mass balances,the lumped reaction constant and the reactor pressure are solvedsimultaneously for each individual element in MATLAB usingode45, to integrate only the time derivative. Calculation inputssuch as the reaction gas flowrate, physical properties and heattransfer correlations are all set to correspond to the initial condi-tions and then updated for the new conditions every 0.02 s.
3. Results and discussion
Figs. 6–9 all relate to the same experiment of 4 s duration with47 mg of catalyst and a calculated mass of polymer formed of
Please cite this article in press as: B. Browning et al., Dynamic modelling of a stoJ. (2012), http://dx.doi.org/10.1016/j.cej.2012.07.027
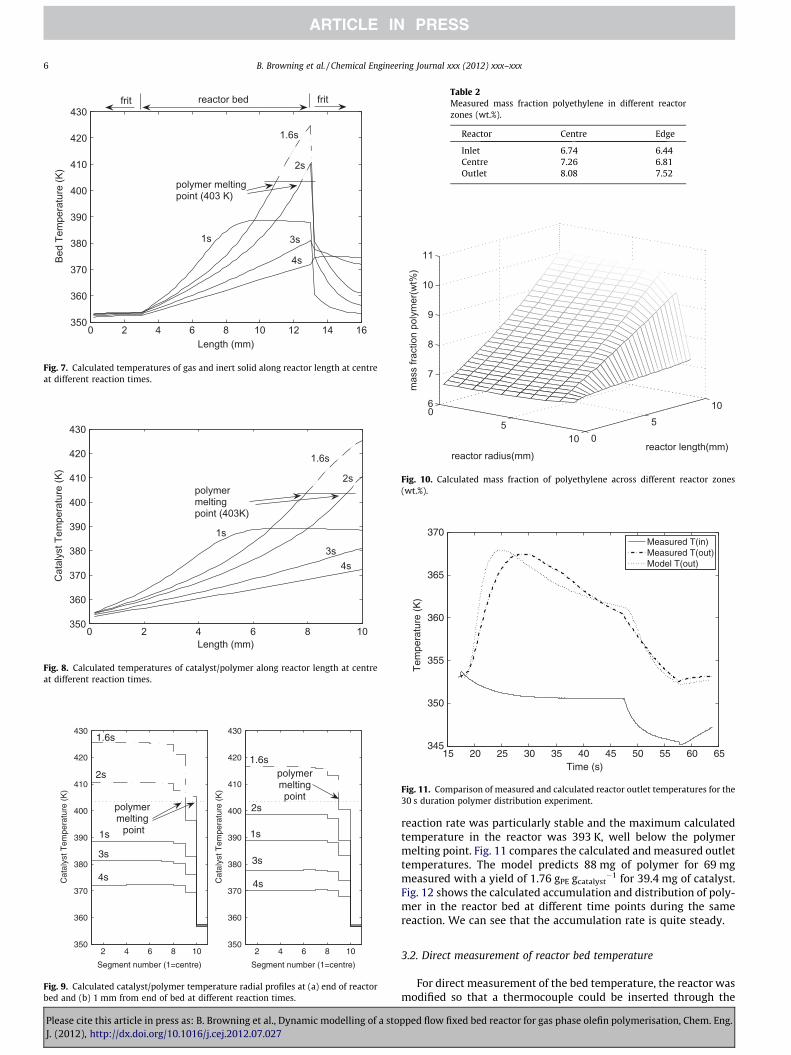
20.9 mg for 21 mg measured. Fig. 6 shows simulated reactor outlettemperatures show a good fit with measured values particularly, formaximum temperature and cooling rate. The fit for the heating rateis less good because it is dependant on the lumped reaction con-stant. Calculated reactor bed temperatures are shown in Fig. 7.The model predicts a steep gradient along the reactor length witha maximum after 1.6 s of reaction. Under the given experimentalconditions the polymerisation rate decreases quickly, and this leadsto a rapid reduction in the bed temperature. It can be seen that, to-wards the end of the bed, the melting point of polyethylene is ex-ceeded and this is discussed in Section 3.3. Fig. 8 shows thecalculated temperatures for the catalyst/polymer which are verysimilar to those found for the gas/inert and Fig. 9 shows the radialtemperature profile for the catalyst/polymer particles at the hotsection, towards the end of the bed, with a fairly flat profile acrossthe centre of the bed and a cool section close to the reactor wall.This flat profile is due to an unusual particle shape (agglomeratedcubes of NaCl) which gives a highly porous bed, inducing highbed conductivity and low heat transfer rates at the reactor wall.
Two different approaches were used to further validate themodel: the distribution of the mass of polymer formed in differentparts of the reactor bed was measured and compared with thatpredicted by the model; the reactor was modified so that a thermo-couple could be inserted into the reactor bed to measure the tem-perature directly.
3.1. Polymer distribution in the reactor bed
To evaluate the distribution of polymer, samples were takenfrom 6 different reactor zones after a polymerisation reactionlasting 30 s. Thermo gravimetric analysis (TGA) was then used toanalyse their composition [30]. The results are given in Table 2and the model predictions are shown in Fig. 10.
The model shows the same trends as found in the measureddata; the local mass fraction of polymer increases along the lengthof the reactor and is higher at the reactor centre than at the wall.The discrepancies between the absolute values of polymer in thebed and the mass fraction predicted by the model can be explainedby the approximate nature of the experimental method (the bedwas fractionated by hand on a small volume).
A factor in the optimisation of the reactor was that sufficientpolymer be produced for analysis. For longer duration reactionsthis was possible with less catalyst. When this was the case, the
pped flow fixed bed reactor for gas phase olefin polymerisation, Chem. Eng.
0 2 4 6 8 10 12 14 16350
360
370
380
390
400
410
420
430
Length (mm)
Bed
Tem
pera
ture
(K)
1s
1.6s
2s
3s
4s
reactor bedfrit frit
polymer meltingpoint (403 K)
Fig. 7. Calculated temperatures of gas and inert solid along reactor length at centreat different reaction times.
0 2 4 6 8 10350
360
370
380
390
400
410
420
430
Length (mm)
Cat
alys
t Tem
pera
ture
(K)
1s
3s4s
polymermeltingpoint (403K)
2s
1.6s
Fig. 8. Calculated temperatures of catalyst/polymer along reactor length at centreat different reaction times.
2 4 6 8 10350
360
370
380
390
400
410
420
430
Segment number (1=centre)
Cat
alys
t Tem
pera
ture
(K
)
2 4 6 8 10350
360
370
380
390
400
410
420
430
Segment number (1=centre)
Cat
alys
t Tem
pera
ture
(K
)
1s 1s
1.6s
1.6s
2s
2s
3s3s
4s4s
polymer melting
point
polymermeltingpoint
Fig. 9. Calculated catalyst/polymer temperature radial profiles at (a) end of reactorbed and (b) 1 mm from end of bed at different reaction times.
Table 2Measured mass fraction polyethylene in different reactorzones (wt.%).
Reactor Centre Edge
Inlet 6.74 6.44Centre 7.26 6.81Outlet 8.08 7.52
05
10 05
106
7
8
9
10
11
reactor length(mm)reactor radius(mm)
mas
s fra
ctio
n po
lym
er(w
t%)
Fig. 10. Calculated mass fraction of polyethylene across different reactor zones(wt.%).
15 20 25 30 35 40 45 50 55 60 65345
350
355
360
365
370
Time (s)
Tem
pera
ture
(K
)
Measured T(in)Measured T(out)Model T(out)
Fig. 11. Comparison of measured and calculated reactor outlet temperatures for the30 s duration polymer distribution experiment.
6 B. Browning et al. / Chemical Engineering Journal xxx (2012) xxx–xxx
Please cite this article in press as: B. Browning et al., Dynamic modelling of a stoJ. (2012), http://dx.doi.org/10.1016/j.cej.2012.07.027
reaction rate was particularly stable and the maximum calculatedtemperature in the reactor was 393 K, well below the polymermelting point. Fig. 11 compares the calculated and measured outlettemperatures. The model predicts 88 mg of polymer for 69 mgmeasured with a yield of 1.76 gPE gcatalyst
�1 for 39.4 mg of catalyst.Fig. 12 shows the calculated accumulation and distribution of poly-mer in the reactor bed at different time points during the samereaction. We can see that the accumulation rate is quite steady.
3.2. Direct measurement of reactor bed temperature
For direct measurement of the bed temperature, the reactor wasmodified so that a thermocouple could be inserted through the
pped flow fixed bed reactor for gas phase olefin polymerisation, Chem. Eng.

0
5
10 05
10
0
5
10
bed length(mm)bed radius(mm)m
ass
poly
mer
(wt%
)
05
10 05
10
0
5
10
bed length(mm)bed radius(mm)
mas
s po
lym
er(w
t%)
05
10 05
10
0
5
10
bed length(mm)bed radius(mm)
mas
s po
lym
er(w
t%)
05
10 05
10
0
5
10
bed length(mm)bed radius(mm)
mas
s po
lym
er(w
t%)
(a) (b)
(c) (d)Fig. 12. Graph showing the calculated distribution of polymer in the reactor bed after (a) 5 s (b) 10 s (c) 20 s and (d) 30 s.
20 40 60 80 100 120350
355
360
365
370
375
Time (s)
Tem
pera
ture
(K)
measured datamodel values
bed
reactor outlet
Fig. 13. Comparison between measured reactor bed and outlet temperatures forthe same experiment.
0 5 10 15 20340
345
350
355
360
365
370
Time (s)
Tem
pera
ture
(K)
no internal TC yield = 0.87g/g
with internal TC yield = 0.57 g/g
Fig. 14. Graph showing the effect on measured outlet temperatures of introducinga thermocouple directly into the reactor bed.
B. Browning et al. / Chemical Engineering Journal xxx (2012) xxx–xxx 7
reactor exit frit. The thermocouple protruded by a short distance(2 mm) into the reactor bed. As predicted by the model, a signifi-cant difference was found between the temperature measured atthe reactor exit and in the reactor bed (Fig. 13).
The introduction of the thermocouple into the reactor bed washowever problematic and led to a loss of yield of about 50%. Theposition of the thermocouple equates to the hottest, most activesection of the bed where it replaces a small bed volume which be-comes inactive but also provides extra heat capacity and causeschannelling of the reaction gases. Both effects reduce bed activity.Fig. 14 shows this, comparing the measured reactor yields and out-let temperatures for two similar experiments of 10 s duration andusing 40 mg of catalyst with and without the internal thermocou-ple. Alternative configurations were also tested, for example,
Please cite this article in press as: B. Browning et al., Dynamic modelling of a stoJ. (2012), http://dx.doi.org/10.1016/j.cej.2012.07.027
inserting the thermocouple via the reactor inlet. Again, channellingoccurred along the length of the thermocouple so the measured in-let and bed temperatures were almost identical. Finally, it was con-cluded that whilst able to show that reactor outlet and bedtemperatures differ significantly, direct measurement could notbe used to investigate bed temperatures without impacting reactorconditions.
3.3. Simulated reactor temperatures
From Fig. 7 we can see that there is a rapid initial temperaturerise in the reactor bed with a gradient along the reactor length anda maximum of 424 K at 1.6 s. After 4 s the temperature has recov-ered to well below the polymer melting point. The relatively high
pped flow fixed bed reactor for gas phase olefin polymerisation, Chem. Eng.

8 B. Browning et al. / Chemical Engineering Journal xxx (2012) xxx–xxx
heat capacity of the stainless steel frit at the reactor exit meansthat, at short time scales, the frit absorbs most of the energy pro-duced in the bed. The effect of this is to mask the effect of the sud-den bed temperature rise to the outlet gas stream. Care musttherefore be taken as reactor bed temperatures can be quite differ-ent to those measured at the reactor outlet.
Simulated reactor bed temperatures include a brief excursionwhich exceeds the melting point of polyethylene. It was not possi-ble to verify whether or not melting had occurred by visual inspec-tion since the yields on this time scale are very low, for thisparticular experiment 0.38 g PE/g catalyst. The reactor zone con-cerned is at the centre and end of the reactor bed (13% of the totalvolume), the area near the reactor wall remains below the meltingpoint.
This is a concern because the physical properties of the polymerchange on melting and there is the associated heat of fusion to takeinto account both of which make modelling more difficult. While itmight be possible that the pores of the particle become blockedwith the melted material, causing the reaction in the particles toshut down (at least locally) [2] we see no evidence of that here.The powder recovered at the end of the bed was essentially free-flowing and visual inspection of the bed revealed no lumps thatwould indicate that the particles had melted and stuck to the saltor each other. However it can be pointed out that the excursionis brief, lasting between 0 s and 1.2 s so polymer would re-crystal-lise as the reactor temperature recovers and allow fragmentationto continue. In addition, at this stage of the polymerisation the porevolume is actually greater than the amount of polymer produced,so it is unlikely that pore blockage could occur to a significantdegree.
The deactivation rate of metallocene catalyst is also known toincrease rapidly with temperature [20,31] and should thereforeact as another brake on rising catalyst temperatures. However,the system is not in steady state, and deactivation of the activesites is a chemical reaction with its own dynamic. So, for shorttime, there is a period of rapid deactivation where a significantnumber of catalyst sites are still active and polymerisation is stilloccurring.
The calculated temperatures for the catalyst/polymer parti-cles, shown in Figs. 8 and 9, are very similar to those foundfor the gas/inert. This is to be expected for the optimised reac-tion conditions which use the highest gas flowrate possible withthe current set-up, and also because the choice of heterogeneousmodel is based on the initial reaction rate which decreases veryquickly.
Fig. 15. (a) Maximum calculated catalyst temperatures along reactor length at centre. (b)experiment of 4 s duration with reaction rate = 0 at and above 413 K.
Please cite this article in press as: B. Browning et al., Dynamic modelling of a stoJ. (2012), http://dx.doi.org/10.1016/j.cej.2012.07.027
3.4. Model with bed temperature limitation
To investigate whether catalyst temperatures are limited closeto the melting point of polyethylene under these conditions themodel was amended to represent this scenario. The calculationwas changed so that if the catalyst temperature is at or above413 K, 10 K above the melting point, the reaction rate term in themodel is set to zero. The results are shown in Fig. 15. The modelhas calculated 22.1 mg of polymer formed for 21 mg measured.Changing the model in this way only makes a slight difference tothe calculated reactor outlet temperatures, and the predictions ofyield are reasonably close. This suggests that the short duration ofthe temperature excursion is of little consequence in terms of yield.
3.5. Modelling low flowrate experiments
Other experiments have been carried out during the optimisa-tion of this reactor with reduced reaction gas flowrate, and henceless cooling in the reactor in order to explore the impact of thischange on the polymerisation. Fig. 16 shows the results of model-ling a reaction of duration 4 s at the lower flowrate (nominal gas/particle velocity = 3 cm/s). Calculated temperatures compare wellwith the measured data but, if no adjustments are made in the sim-ulation to account for the melting of the polymer, the model calcu-lates unrealistically high catalyst temperatures.
Fig. 17 shows the results of modelling the same experimentwith the catalyst temperature limited to 413 K. It is not possibleto fit the measured outlet temperature data or mass of polymer,which is 31.5 mg against 43.4 mg measured. Reactor temperaturesmust therefore exceed 413 K for this lower flowrate. In fact, theminimum bed temperature limitation which allows the model tofit with the measured data for this experiment is 473 K. Fig. 18shows the maximum calculated polymer temperatures and thecomparison between the simulated and measured data for thiscase.
The very high temperatures in the reactor for experiments atthe lower flowrate were also corroborated experimentally by thepolymer formed having a broad molecular weight distributionand polydispersity index (pdi) of around 8. Under the optimisedreactor conditions polyethylene is formed with a pdi of about 4.It seems that under certain reaction conditions very high temper-atures occur in this reactor and, over the short time period consid-ered, deactivation and polymer melting are not sufficient to stopthe reaction.
Comparison of calculated outlet temperatures against measured values for the same
pped flow fixed bed reactor for gas phase olefin polymerisation, Chem. Eng.

Fig. 16. (a) Comparison of calculated outlet temperatures against measured values. (b) Maximum catalyst temperatures along reactor length at centre.
Fig. 17. (a) Maximum calculated catalyst temperatures along reactor length at centre limited to 413 K. (b) Comparison of calculated output temperatures against measuredvalues for same experiment of 4 s duration with low flowrate.
Fig. 18. (a) Maximum calculated catalyst temperatures along reactor length at centre limited to 473 K. (b) Comparison of calculated output temperatures against measuredvalues for same experiment of 4 s duration with low flowrate.
B. Browning et al. / Chemical Engineering Journal xxx (2012) xxx–xxx 9
Please cite this article in press as: B. Browning et al., Dynamic modelling of a stopped flow fixed bed reactor for gas phase olefin polymerisation, Chem. Eng.J. (2012), http://dx.doi.org/10.1016/j.cej.2012.07.027

10 B. Browning et al. / Chemical Engineering Journal xxx (2012) xxx–xxx
4. Conclusions
A dynamic reactor model has been created and validated. Underoptimised reactor conditions a brief temperature excursion abovethe polymer melting point is found for short duration reactionsat the central section of the reactor nearest the exit. This excursionis not thought to be unrealistic as modelling of low flowrate exper-iments shows that very high temperatures can occur in the reactorbed. The model construction is such that it can be easily adapted tofuture experiments in the same reactor, for example with differentgas compositions, and also to potential new reactor designs withdifferent dimensions.
References
[1] Polyethylene Market to 2020, GBI Research, 2011.[2] T.F.L. McKenna, A. Di Martino, G. Weickert, J.P.B. Soares, Particle growth during
the polmerisation of olefins on supported catalysts, 1 – nascent polymerstructures, Macromol. React. Eng. 4 (2010) 40–64.
[3] T.F. McKenna, J.B.P. Soares, Single particle modelling for polyolefins: a review,Chem. Eng. Sci. 56 (13) (2001) 3931–3949.
[4] M. Ferrero, M. Chiovetta, Catalyst fragmentation during polypropylenepolymerization: part 1. The effects of grain size and structure, Polym. Eng.Sci. 27 (19) (1987) 1436–1447.
[5] D. Estenoz, M. Chiovetta, A structural model for the catalytic polymerization ofethylene using chromium catalysts. Part I: Description and solution, Polym.Eng. Sci. 36 (17) (1996) 2208–2228.
[6] D. Estenoz, M. Chiovetta, A structural model for the catalytic polymerization ofethylene using chromium catalysts. Part II: Thermal effects, Polym. Eng. Sci. 36(17) (1996) 2229–2240.
[7] D. Estenoz, M. Chiovetta, Olefin polymerization using supported metallocenecatalysts: process representation scheme and mathematical model, J. App.Polym. Sci. 81 (2001) 285–311.
[8] Z. Grof, J. Kosek, M. Marek, Principles of the morphogenesis of polyolefinparticles, Ind. Eng. Chem. Res. 44 (2005) 2389–2404.
[9] Z. Grof, J. Kosek, M. Marek, Modeling of the morphogenesis of polyolefinparticles, AIChE J. 51 (7) (2005) 2048–2067.
[10] F. Bonini, V. Fraaije, G. Fink, Propylene polymerization through supportedmetallocene/MAO catalysts: kinetic analysis and modelling, Polym. Sci. A:Polym. Chem. 33 (1995) 2393.
[11] T.F.L. McKenna, E. Tioni, M.M. Ranieri, A. Alizadeh, V. Monteil, C. Boisson,Catalytic olefin polymerisation at short times: studies using specially adaptedreactors, Can. J. Chem. Eng, in press, http://dx.doi.org/10.1002/cjce.21684.
[12] B. Olalla, J.P. Broyer, T.F.L. McKenna, Heat transfer and nascent polymerisationof olefins on supported catalysts, Macromol. Symp. 271 (2008) 1–7.
Please cite this article in press as: B. Browning et al., Dynamic modelling of a stoJ. (2012), http://dx.doi.org/10.1016/j.cej.2012.07.027
[13] E. Tioni, R. Spitz, J.P. Broyer, V. Monteil, T.F.L. McKenna, Packed-bed reactor forshort time gas phase olefin polymerisation: heat transfer study and reactoroptimisation, AIChE J. 58 (1) (2012) 256–267.
[14] E. Tioni, J.P. Broyer, V. Monteil, T.F.L. McKenna, Influence of reaction conditionson catalyst behaviour during the early stages of gas phase ethylene homo- andcopolymerisation, submitted for publication.
[15] K.B. McAuley, J.F. MacGregor, A.E. Hamielec, A kinetic model for industrial gas-phase ethylene copolymerization, AIChE J. 36 (6) (1990) 837–850.
[16] J. Kosek, Z. Kosek, A. Novak, F. Stepanek, M. Marek, Dynamics of particlegrowth and overheating in gas-phase polymerization reactors, Chem. Eng. Sci.56 (2001) 3951–3977.
[17] H. Osuna Sanchez, I. Pitault, M. Forissier, Production d’hydrogène par unprocédé catalytique: étude exploratoire, Proceedings of Congrès Français deThermique (2004) 855–860. ISBN:2-905267-40-2.
[18] D. Mears, Tests for transport limitations in experimental catalytic reactors, Ind.Eng. Chem. Proc. Des. Develop. 10 (1971) 541–547.
[19] E. Eriksson, T.F.L. McKenna, Heat-transfer phenomena in gas-phase olefinpolymerisation using computational fluid dynamics, Ind. Eng. Chem. Res. 43(2004) 7251–7260.
[20] P. Roos, G.B. Meier, J.J.C. Samson, G. Weickert, K.L. Westerterp, Gas phasepolymerisation of ethylene with a silica-supported metallocene catalyst:influence of temperature on deactivation, Macromol. Rapid Commun. 18(1997) 319–324.
[21] S. Floyd, K.Y. Choi, T.W. Taylor, W.H. Ray, Polymerisation of olefins throughheterogeneous catalysis IV. Modeling of heat and mass transfer resistance inthe polymer particle boundary layer, J. App. Polym. Sci. 31 (1986).
[22] R.H. Perry, D.W. Green, Perry’s Chemical Engineers’ Handbook, seventh ed.,McGraw Hill, New York, 1997.
[23] D. Schweich, Génie de la réaction chimique, Technique & Documentation,Paris, 2001.
[24] R.C. Reid, J.M. Prausnitz, B.E. Poling, The Properties of Gases & Liquids, fourthed., McGraw Hill, New York, 1987.
[25] R.A. Hutchinson, W.H. Ray, Polymerization of olefins through heterogeneouscatalysis VIII monomer sorption effects, J. App. Polym. Sci. 41 (1990) 51–81.
[26] D.P. Maloney, J.M. Prausnitz, Solubility of ethylene in liquid low-densitypolyethylene at industrial separation pressures, Ind. Eng. Chem. Proc. Des. Dev.15 (1) (1976) 216–220.
[27] S.J. Moore, S.E. Wanke, Solubility of ethylene, 1-butene and 1-hexene inpolyethylenes, Chem. Eng. Sci. 56 (2001) 4121–4129.
[28] T.F. McKenna, Solubility and crystallinity data for ethylene/polyethylenesystems, Eur. Polym. J. 34 (9) (1998) 1255–1260.
[29] J.C. Maxwell, Electricity and Magnetism, Clarendon Press, Oxford UK, 1873.[30] E. Tioni, Optimization of a tool to study the start-up of the gas phase olefin
polymerization, Phd Thesis, UCBL1 (2011).[31] P.A. Charpentier, S. Zhu, A.E. Hamielec, M.A. Brook, Continuous solution
polymerization of ethylene using metallocene catalyst system zirconocenddichloride/methylaluminoxane/trimethylaluminium, Ind. Eng. Chem. Res. 36(1997) 5074–5082.
pped flow fixed bed reactor for gas phase olefin polymerisation, Chem. Eng.