international financial integration and crisis intensity...
TRANSCRIPT

International Financial Integration and Crisis Intensity Andrew K. Rose*
Revised as of: March 28, 2011
Abstract/Executive Summary This paper analyzes the causes of the 2008‐09 financial crisis together with its manifestations, using a Multiple Indicator Multiple Cause (MIMIC) model. The analysis is conducted on a cross‐section of 85 countries; I focus on international financial linkages that may have both allowed the crisis to spread across countries, and/or provided insurance. The model of the cross‐country incidence of the crisis combines 2008‐09 changes in real GDP, the stock market, country credit ratings, and the exchange rate. The key domestic determinants of crisis incidence that I consider are taken from the literature, and are measured in 2006: real GDP per capita; the degree of credit market regulation; and the current account, measured as a fraction of GDP. Above and beyond these three national sources of crisis vulnerability, I add a number of measures of both multilateral and bilateral financial linkages to investigate the effects of international financial integration on crisis incidence. I ask three questions, with a special focus on Asian economies. First, did the degree of a country’s multilateral financial integration help explain its crisis? Second, what about the strength of its bilateral financial ties with the United States and the key Asian economics of China, Japan, and Korea? Third, did the presence of a bilateral swap line with the Federal Reserve affect the intensity of a country’s crisis? I find that neither multilateral financial integration nor the existence of a Fed swapline is correlated with the cross‐country incidence of the crisis. There is mild evidence that countries with stronger bilateral financial ties to the United States (but not the large Asian economies) experienced milder crises. That is, more financially integrated countries do not seem to have suffered more during the most serious macroeconomic crisis in decades. This strengthens the case for international financial integration; if the costs of international financial integration weren’t great during the Great Recession, when could we ever expect them to be larger? Keywords: empirical, data, cross‐section, cause; consequence; country; model; international; MIMIC. JEL Classification Numbers: E65, F30 Contact: Haas School of Business University of California Berkeley, CA USA 94720‐1900 Tel: (510) 642‐6609 Fax: (510) 642‐4700 E‐mail: [email protected] * B.T. Rocca Jr. Professor of International Trade and Economic Analysis and Policy, Associate Dean for Academic Affairs and Chair of the Faculty, Haas School of Business at the University of California, Berkeley, NBER Research Associate and CEPR Research Fellow. This paper draws on earlier and ongoing research with Mark M. Spiegel of the Federal Reserve Bank of San Francisco; I thank him for our collaboration in Rose and Spiegel (2009a, 2009b, 2010). I also thank Josh Felman and Charles Wyplosz for comments. A current version of this paper, key output, and the main STATA data set used in the paper are available at http://faculty.haas.berkeley.edu/arose.

1
1. Introduction
The purpose of this paper is to analyze the causes of the 2008‐09 financial crisis, with a
special focus on the role of international financial integration. In particular, I ask the question
“Did countries with deeper international financial ties experience more (or less) intense crises?”
This is an interesting question to ask, since a number of authors have asserted that crises can
be imported or exacerbated through international financial linkages. A finding that more
integrated countries suffered worse recessions implies that policy makers should think twice
before encouraging deeper financial ties between countries. This topic is of special importance
in Asia, which is slowly continuing its movement towards deeper regional monetary and
financial ties.
I use a number of different of measures of both multilateral and bilateral financial
linkages on a large cross‐section of countries. There is a special focus on Asian economies; I ask
whether countries with stronger financial ties to China, Japan, and Korea were affected more
(or less) than countries with weaker ties. For contrast, I compare the importance of these
linkages to linkages with the United States, both through the private sector (cross‐holdings of
bank‐loans and assets) and through the public sector (access to a Federal Reserve swapline).
This allows me to contrast the importance of intra‐regional linkages with American connections.
Throughout, I control for a number of domestic determinants of crisis intensity using sources of
vulnerability that have worked well in the literature. Methodologically, I treat crisis intensity as
a latent variable that can only be measured with error. Accordingly, I use a Multiple Indicator
Multiple Cause (MIMIC) model to link together the causes and consequences of the crisis.

2
My empirical findings are weak, since it is not easy to model the causes of the 2008‐09
crisis in a way that works well for a large number of countries. Richer countries were harder hit
by the crisis, as were countries with larger current account deficits. There is some evidence
that tighter credit market regulations also moderated crisis intensity. However, none of the
(six) measures of multilateral financial integration I use is significantly correlated with crisis
intensity across countries. I also employ (seventeen) measures of bilateral financial integration,
and find only weak signs of significance. Curiously, countries with stronger bilateral financial
ties to the United States experienced milder crises, though the same is not true of countries
that are more integrated with the large Asian economies. This is interesting both because the
crisis first broke out in the United States, and because of the special financial role that the
United States plays in the World and especially Asia. It also underlines the continuing
importance of the United States in global financial markets.
In the large, I find little evidence that countries which were more deeply financially
integrated experienced substantially worse recessions. This is actually a strong result, since
eminent scholars (like Stiglitz, Rodrik, Bhagwati and others) have criticized financial integration
primarily because it is said to be associated with volatility. However, the absence of any clear
linkage between international financial integration and the most profound business cycle of
generations constitutes a strong counter‐argument.
In the next section I review the data set that I use and discuss my empirical strategy
more broadly. The results of a baseline empirical specification (that includes only domestic
factors) are contained in section three. The next section assesses the empirical importance of

3
international financial linkages in understanding crisis incidence, and constitutes the most
important section of the paper. I find evidence that closer financial linkages with America (but
not Korea, China or Japan) seem to have alleviate the intensity of the 2008‐09 crisis. Section 5
is more speculative and focuses on the special role of the United States. It brings the preceding
analysis to bear on two important policy‐related questions: a) what are the challenges to
American‐lead global financial stability, and how should America view continued East Asian
monetary and financial cooperation? The paper ends with a brief summary and conclusion.
2. Data: Identifying Cross‐Country Differences in Crisis Severity
I am interested in examining a broad cross‐section of countries.1 I wish to include all the
countries that have been dramatically affected by the crisis as well as a number of other
countries that have not been affected as badly (as controls). Since the incidence of the crisis
was notable among high‐income countries, I include all of them as well as a large number of
developing countries. In particular, I examine all countries with real GDP per capita of at least
$10,000 in 2003. To this set of countries, I add those with real GDP per capita of at least $4,000
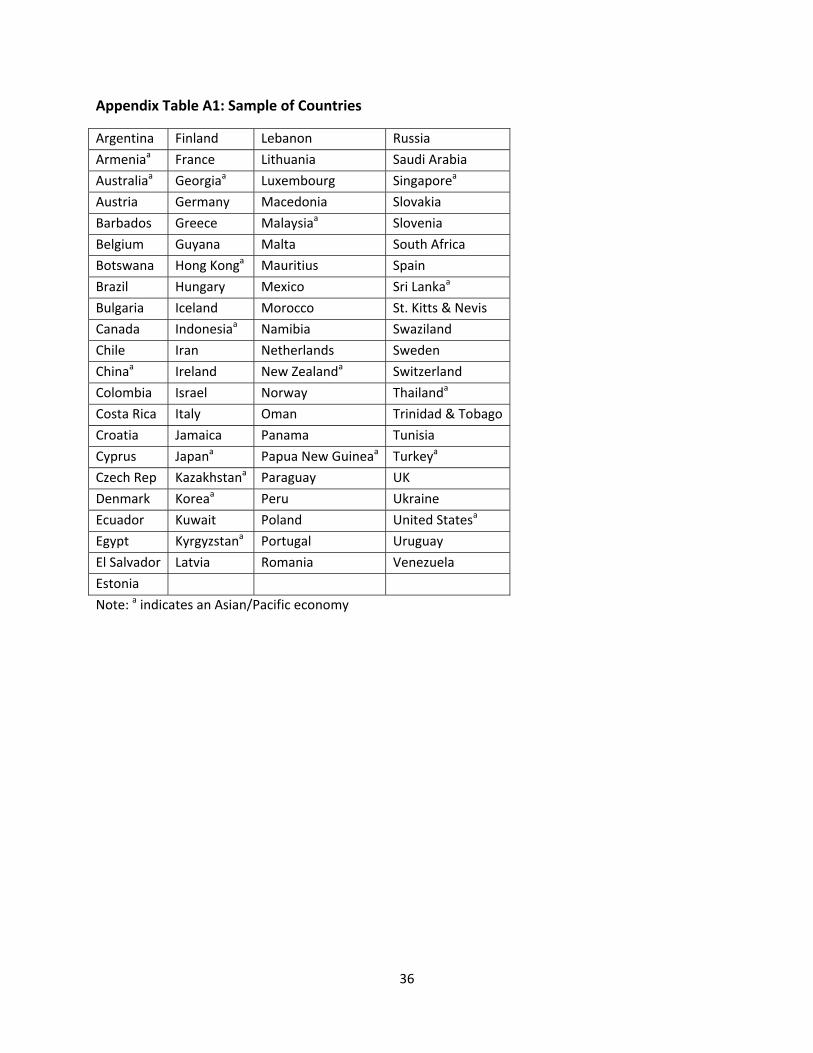
and a population of at least one million.2 After eliminating countries with missing data, I am left
with a sample of 85 countries; their names are tabulated in Appendix Table A1.
Identifying the incidence of any financial crisis (currency, asset, banking, or other) across
countries is no simple matter, let alone determining its severity (e.g. Berg, et al, 2004). Any
reasonable methodology should take into account the fact that potentially serious
measurement error is inherently present.

4
Mine is a non‐structural approach. In particular, I consider four observable indicators of
the crisis, and model the incidence and severity of the crisis as being a latent variable that is
manifest through these variables (though only imperfectly). When measuring these
manifestations of the crisis, I restrict myself insofar as possible to data from 2008‐09.3
Real GDP growth is an obvious indicator of the crisis, and I used the backcasts for 2008‐
09 real GDP growth that were available in late April 2010 from the Economist Intelligence Unit.
Since financial variables are intrinsically forward‐looking and the crisis was financial in nature, I
also use three different manifestations from important financial markets. In particular, I use
2008‐09 changes in: a) the national stock market (measured in local currency, from national
sources); b) the multilateral (SDR) exchange rate (from the IMF’s International Financial
Statistics), measured as the price of a SDR; as well as c) the two‐year difference in country
credit ratings (between March 2008 and March 2010) as measured by Euromoney. The latter
range in principle from 0 to 100; in March 2010, the most highly ranked countries were Norway
(94.1), Luxembourg (92.4), and Switzerland (90.7), while the lowest‐ranked countries were Haiti
(18.4), Swaziland (26.0), and Ecuador (28.0).4 The data set is presented in more detail in
Appendix Table A2.
One could reasonably dispute the relevance of these particular manifestations of the
crisis. Why not de‐mean the 2008‐09 growth rate by subtracting some earlier growth rate? For
that matter, why not use the output gap, or the consumption growth rate instead? Why three
financial indicators instead of more or less, and why those indicators? I employ the MIMIC
methodology precisely to acknowledge such measurement issues.

5
The four measures of the consequences/manifestations of the crisis are presented for
sixty countries in Table 1, sorted by the size of the 2008‐09 stock market decline. These four
variables collectively seem to deliver a reasonable view of the countries most affected by the
crisis. For instance, Iceland appears as a country dramatically affected by the crisis in all four
sectors, as are countries like Ukraine, Estonia, Latvia, Ireland and the UK. One will notice that
Asian economies have not been particularly hard hit; while China experienced the most severe
stock market decline, its bond ratings improved and real GDP growth was phenomenal. Japan,
on the other hand, experienced a large decline in its stock market, a decline in its bond ratings,
and a severe recession (thought its currency appreciated as the “carry trade” ended).
Indonesia, Korea, Malaysia, Taiwan, and Thailand are in the sample but are not even listed in
Table 1 since their stock market declines were relatively mild.
3. Results: A Baseline Domestic Model
In Table 2, I report MIMIC estimates of γ when I include only the three control variables
as potential causes in (2); I use the four default indicators as measures of crisis manifestations.
Standard errors are recorded in parentheses, and coefficients significantly different from zero
at the .05 (.01) level are marked by one (two) asterisk(s). I also provide sensitivity analysis in
Table 2. First, I drop the exchange rate indicator from the four manifestations of the crisis,
since some countries use the exchange rate as a tool of monetary policy (especially in Asia).
Second, I restrict the sample of countries used for the estimation to the 22 countries in Asia or
the Pacific, as well as the United States.

6
The final two columns at the extreme right‐hand side of Table 2 record regression
coefficient estimates from a simple linear model
yi = α + δk xi,k + υi (3)
where α is an intercept and {δk} are the coefficients of interest. There are two columns of
results at the right of Table 2, for two key regressands which I use on the left‐hand side of (3):
a) the 2008‐09 real GDP growth rate; and b) the 2008‐09 growth rate of the stock market.
The results of Table 2 echo those of Rose and Spiegel (2010). Real GDP per capita has a
negative and significant effect since the 2008‐09 financial crisis was progressive; richer
countries were systematically hit more intensely than poorer countries. This negative
relationship can also be seen in Figure 1, which scatters the four different manifestations of the
2008‐09 crisis (on the four y‐axes) against the log of real GDP per capita (on the x‐axis). Figure
1 also demonstrates clearly the variation in the intensity of the crisis across countries. While
many countries experienced stark stock market declines, quite a few national stock markets
actually rose over 2008‐09.5 The same spread is apparent in GDP growth, exchange rate
depreciations, and country credit rating changes.
The degree of credit market regulation (much emphasized by Giannone et al, 2010) also
has a negative effect on crisis intensity, indicating that looser credit market regulation might
have exacerbated the financial crisis. However, this effect is not always statistically significant
at conventional levels.

7
Finally, the coefficient on the current account term is generally significantly positive,
indicating that countries with current account surpluses generally had milder crises than
countries entering with large current account deficits. The positive relationship between the
current account and crisis indicators can also be seen in Figure 2, which is the analogue to
Figure 1 but uses the current account (measured as a percentage of GDP) on the x‐axis in place
of real income.
All these results fall into line with those in the existing literature (discussed in Rose and
Spiegel, 2010). The results seem generally insensitive to the econometric perturbations that I
consider, though (unsurprisingly) nothing is statistically significant when I throw away three‐
quarters of my sample and restrict my attention to the United States and Asian/Pacific
countries. This gives me some confidence that the underlying econometric model of crisis
incidence – the ceteris paribus conditions from a statistical viewpoint – seems reasonable. The
question to which I now turn is whether measures of international financial linkages matter,
above and beyond these underlying domestic factors.
4. Results: How Important are International Financial Linkages?
I now add international financial linkages to the default MIMIC model of Table 2. I begin
with a variety of measures of multilateral integration before proceeding on to consider bilateral
measures.

8
Since there is no single perfect measure of integration, I test a number of that have
been used in the literature. My only requirement is that the measure be quantifiable and
available for a large number of countries in 2006; both stock and flow measures are included.
The measures that I examine include: a) net foreign assets; b) external debt; c) short‐term
external debt; d) financing via international capital markets; and e) international reserves. All
five of these proxies are measured in 2006 as ratios to domestic GDP. I also include a dummy
variable for countries that were part of a monetary union in 2006. I proceed by adding, one by
one, each of these six measures of international financial integration to the default MIMIC
model of Table 2. The coefficient estimates for the different measures of international financial
integration are tabulated in Table 3. Standard errors are recorded parenthetically, and the four
columns to the right of the “MIMIC Default” estimates present sensitivity analysis along the
same lines as Table 2.
The results of Table 3 are generally poor; they provide little indication that standard
measures of multilateral international financial integration affected crisis incidence, at least
after the three national factors of Table 2 are taken into account. Of the thirty estimates, only
one is significantly different from zero at the 1% significance level, and an additional pair at the
5% significance level. The ratio of short‐term external debt to GDP takes a consistently
negative sign (and is large economically and statistically when the sample is restricted to the
Asia/Pacific countries), indicating that countries more exposed to short‐term foreign obligations
experienced more intense crises; these findings echo Blanchard et al (2010). However the
effect of this source of vulnerability is statistically weak, in part because it is only available for
developing countries.
9
Given the weak evidence that indicators of multilateral financial integration affected
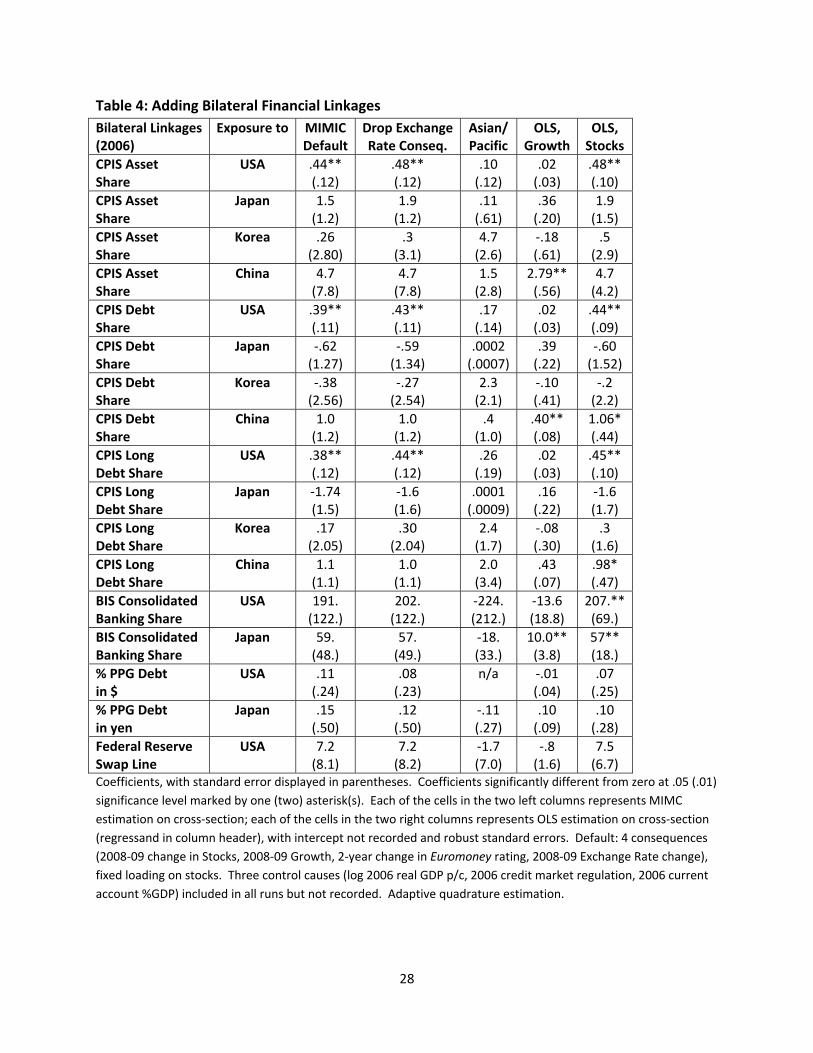
crisis severity, I now turn my attention to bilateral linkages. Those results are presented for
seventeen measures of bilateral linkages in Table 4, which is analogously formatted to Table 3.
I examine all the bilateral financial linkages of relevance that are available, to the best of
my knowledge. There are three basic variables which are available for a large number of
countries in 2006: a) data on international cross‐holdings of assets, taken from the Coordinated
Portfolio Investment Survey collected by the IMF (and others); b) data on consolidated
international banking claims collected by the BIS (and others); c) and the fractions of public and
publicly‐guaranteed debt denominated in different currencies, collected by the World Bank
(and others).
The CPIS data set covers total portfolio assets and assets broken down into various
asset‐classes; accordingly, I examine cross‐holdings of both total and long‐term debt, as well as
total asset cross‐holdings. These are available for four countries of relevance to this study: the
three large regional economies of Japan, Korea, and China, as well as the United States. The
United States remains the anchor of the international financial system in a number of different
metrics (it provides a disproportionate amount of the world’s international reserves), and is the
monetary anchor of choice in much of East Asia. The United States is also of special interest
because the financial crisis first broke out there, in the late summer of 2007, and also because
of the unexpected and dramatic appreciation of the American dollar through the peak of the
crisis in 2008. By examining linkages between Asian countries, the United States and the three

10
most important regional economies, I should be able to pin down more precisely the nature of
the linkage between crisis incidence and financial integration.
The first row of Table 4 adds to the default specification (of Table 2) the share of
external assets (taken from the IMF’s 2006 CPIS data set) that are held in the United States. At
the end of 2006, Canada held a total of US$633.05 externally in total portfolio investments, of
which some US$325.84 billion (or 51.5%) were held in the United States. Canada was thus
more heavily exposed to American financial risk than say the UK, which held only 26.6% of its
external financial assets in America. The top left cell in Table 3 is the (γ) coefficient for the
marginal effect of the share of foreign assets held in the United States on the latent variable of
crisis incidence (ξ).6 The coefficient is positive and significantly different from zero at the .05
level; countries with more exposure to American financial assets seem to have experienced less
intense crises. Dropping the exchange rate manifestation of financial crises does not
substantially change the size or significance of the coefficient, although it fades in both
economic and statistical significance when the sample is restricted to the Asian/Pacific
economies. While the CPIS share of American assets matters in an OLS regression of stock
market growth, it does not when real GDP growth is the regressand.
The next rows of Table 4 sequentially add the remaining measures of bilateral financial
linkages, for different countries and asset classes. In total, there are twelve different measures
of CPIS financial linkages (= four countries x three asset classes). They all tell the same story in
essence. First, there is weak evidence that more exposure to American actually alleviated the
intensity of the financial crisis, as manifest in positive and significant coefficients in Table 4.

11
This result does not depend much on the precise asset class considered. Second, exposure to
either Japanese or Korean assets never has a consistent or significant effect on crisis intensity
across countries. Third, the sample of Asian/Pacific economies never delivers statistically
significant coefficients, possibly because the sample of countries is so small. Finally, there is
weak evidence that countries with greater exposure to Chinese assets experienced higher
growth in both real GDP and stocks, though this finding is sensitive and is driven by a few
outliers.
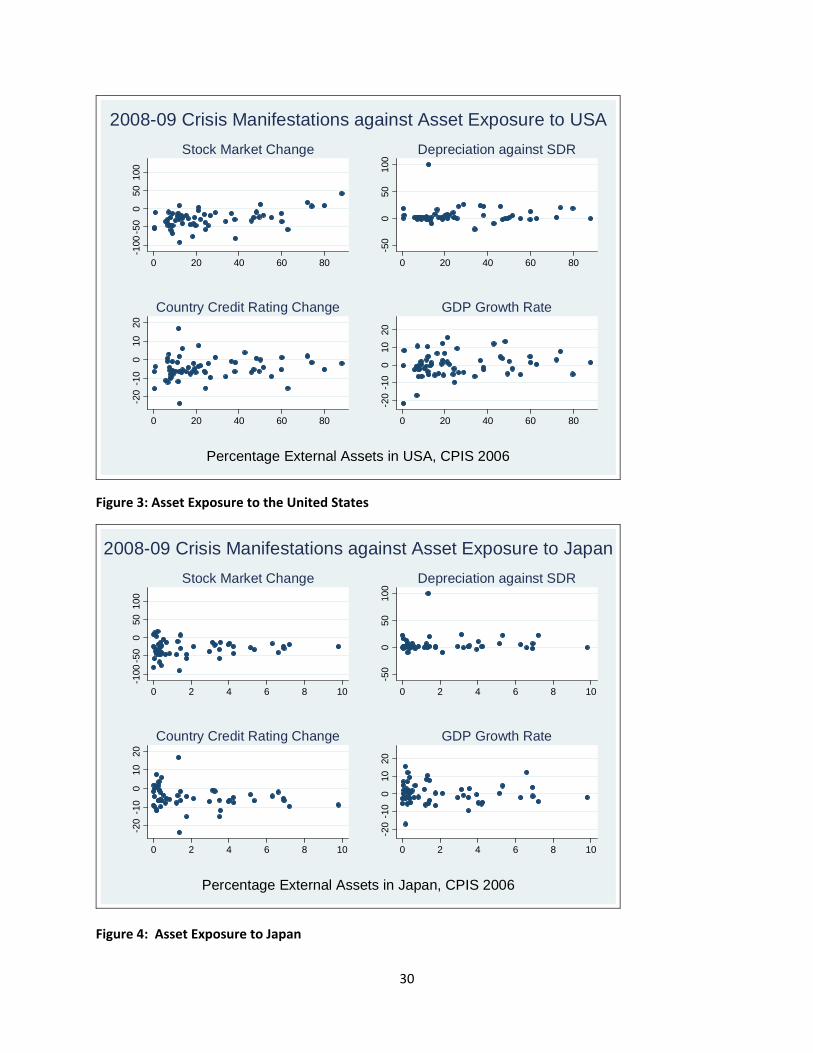
The result that countries with greater exposure to American assets experienced less
severe crises may seem initially surprising, especially given the wide‐spread chatter in the
popular press about toxic American assets. However, it seems to be loosely present in the data
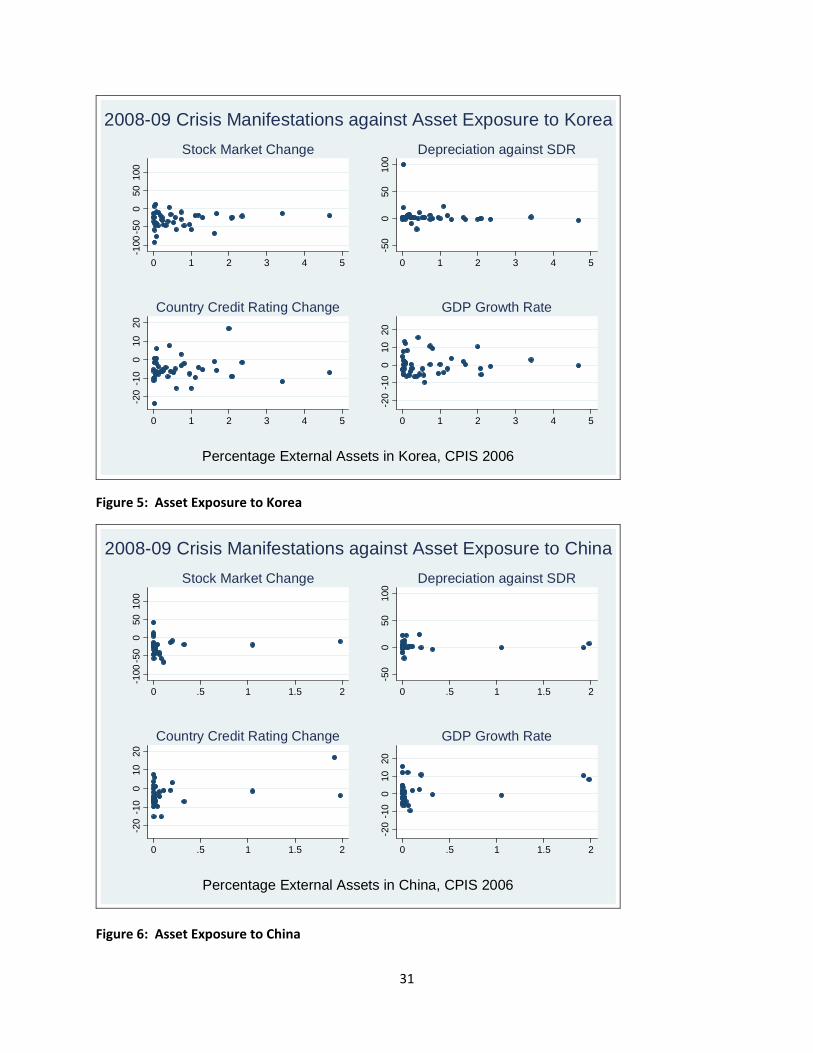
and is not a mere statistical illusion. Figure 3 provides simple scatter‐plots of the four
manifestations of the crisis graphed against the share of external assets held in the United
States. Countries that had larger shares of their 2006 foreign wealth in America seem
systematically to have experienced smaller stock market declines in 2008.7 The relationship is
loose, if also apparently linear. Analogues for the three Asian regional economies of interested
are in Figures 4‐6.
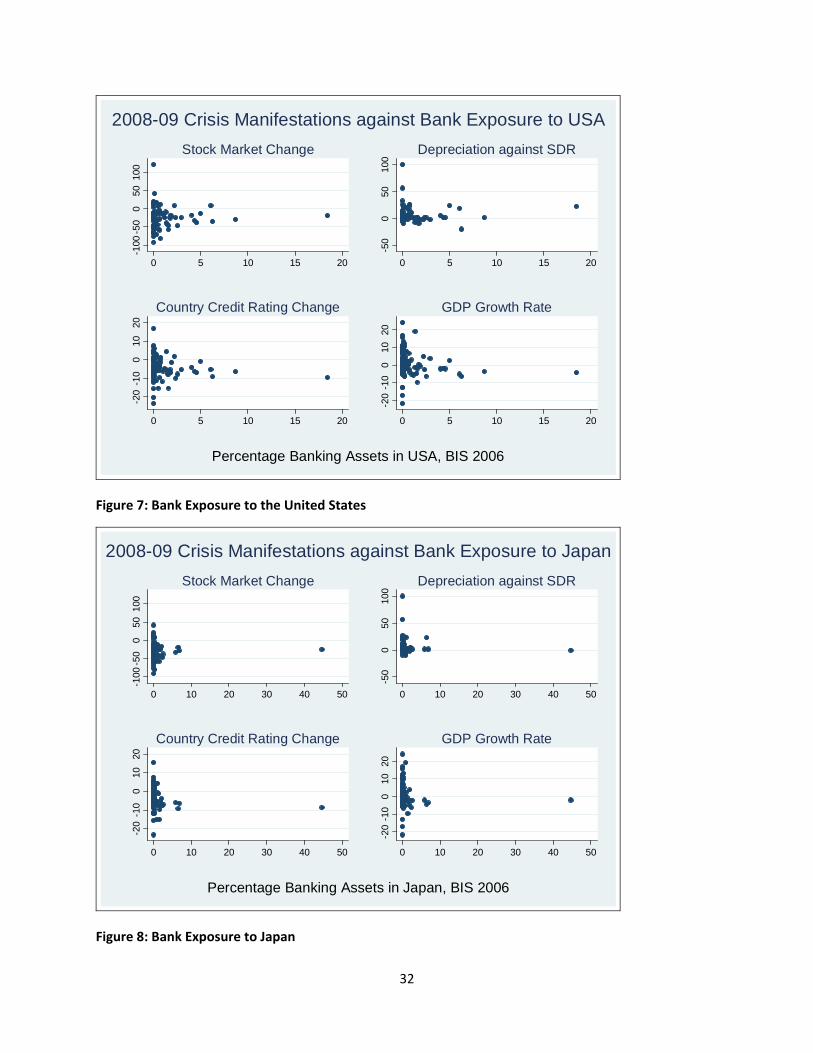
Next, I narrow my interest to the banking sector and take advantage of data on
consolidated banking statistics produced by the BIS. These data cover banks' on‐balance sheet
financial claims on foreign countries, and thereby provide a measure of the exposures of
lenders' national banking systems. The data set I use covers contractual lending by the head
office and all its branches and subsidiaries on a worldwide consolidated basis, so that they are

12
net of inter‐office accounts, and are reported on an ultimate risk basis.8 I average the quarterly
2006 data, and normalized individual countries’ exposure to the United States and Japan by
dividing by total foreign exposure.9 However, I am unable to find consistent effects from
foreign bank exposure to these crisis measures. The measure is significantly positive for
American exposure when OLS is used with stock market growth as the dependent variable, but
it is insignificantly different from zero in the four other perturbations and inconsistent in sign.
The coefficients for Japanese exposure are somewhat stronger and positive for both OLS
regressions, but are insignificantly different for all three MIMIC models. The fragility of these
results is shown in Figures 7 and 8 which show that a few outliers are especially important for
the BIS series in the case of Japan.
My next pair of bilateral financial linkages is taken from the World Bank’s Global
Development Finance data set. Both refer to the currency composition of public and publicly‐
guaranteed (PPG) debt; I have shares of PPG debt denominated in both yen and US$. I add
both of these series to the basic specification of Table 2, and record the estimates in the
penultimate rows of Table 4. There seems to be no strong consistent relationship between
crisis intensity and the share of PPG debt denominated in either dollars or yen.
In the bottom row of Table 4 I add the coefficients for a binary dummy variable which is
one if the Federal Reserve extended a swapline to the country and zero otherwise. These
liquidity swaps were first created by the Federal Reserve in December 2007 and were
eventually extended to a total of fourteen central banks by late October 2008. Since these
bilateral swaps were explicitly created as part of the endogenous policy response to the crisis
13
the coefficients may be seriously affected by simultaneity bias. Thus the reported correlations
reported should be viewed as just that; non‐structural correlations. Perhaps unsurprisingly,
none of them are significantly different from zero at any conventional level of confidence.
Succinctly, while there is some evidence that countries with tighter financial linkages to
the United States experienced milder crises; the same cannot be said of countries more closely
tied to the larger Asian economies. Of course, finding a lack of evidence that financial
integration can be tied to crisis incidence does not mean that no linkage exists.10 Perhaps a
more subtle researcher could find it, perhaps with a different model or data set. Still, the fact
that I have searched unsuccessfully for a linkage in a variety of different ways lends some
validity to the exercise.
5. Policy Implications and Interpretation
In this section, I extrapolate from the results of the previous section and bring their
evidence to bear on a couple of important policy‐relevant issues. I ask two related questions of
policy relevance. First, what are the challenges to American‐lead global financial stability?
Second, what is a reasonable American view of continued East Asian monetary and financial
cooperation?
Challenges to American‐lead Global Financial Stability

14
The results from section 4 offer some evidence that countries with closer ties to the
United States experienced more mild crises, ceteris paribus. There is little comparable evidence
of the importance of linkages to the other countries I examine, the larger East Asian economies.
Does this constitute definitive proof that a financial Pax Americana persists of late?
Certainly it is reasonable to consider challenges to American‐lead global financial
stability. For one thing, a number of the finding in section 4 are of marginal (and sometimes
negligible) statistical significance. It is particularly striking that the existence of Federal Reserve
swap‐lines do not seem to have mattered in a purely statistical sense. Then again, the
coefficients indicate that the existence of swap‐lines seems to have been economically
beneficial to the countries that received them, though the effects were not estimated very
precisely. In any case, it is perhaps more striking that no one else offered them, an implicit but
strong signal of the continuing unique role of the United States in the global financial system.
There are many other such indications. The IMF remains an American creature, with an
American veto, an American senior deputy managing director, and an American mind‐set in
many ways. The United States continues to play a leading role in both the other Bretton Woods
institutions and the new developing institutions (G‐20, FSF).
More generally there are few rivals to the United States. Continuing European and
Japanese fiscal stresses (recently showing up in European bond market spreads) lead one to
believe that no rich country will pose a serious challenge soon to American leadership in the
financial sphere any time soon. Political paralysis in both Japan and Europe deepens this
conviction. Other rich countries which are in better economic shape (such as Canada, Sweden,

15
and Australia) are simply too small to be viable competitors. Many developing countries
weathered the 2008‐09 financial storm better than their richer counter‐parts, most notably
China, India and Brazil. Still, no developing country with a dependent monetary policy,
immature financial system, or significant capital restrictions poses a serious threat to the
United States’ financial leadership any time soon; many emerging markets have all three. So
there do not seem to be obvious foreign competitors to American‐lead Global Financial
Stability.
This broad‐brush picture seems even more plausible when it is examined in even slightly
finer detail. Consider the important sector of banking, and East Asia, the most obvious
potential regional economic rival to the United States. After the 1997‐98 crisis, there was
certainly banking reform in East Asia, though it was limited. This is clearly manifest in the fact
that the world’s largest banks (measured by assets) continue to be dominated by Europeans
and Americans, more than a decade after the Asian crisis. A few Japanese remain in the list of
the world’s biggest banks and Chinese banks have entered of late. This underlines the point
that access to large integrated markets seems to matter a lot. The world’s biggest bank is
French, and the Netherlands, Switzerland, Belgium and Denmark all have top‐50 banks;
countries can be small and host big banks, if they have access to large markets. However, there
is no contender from Korea, Hong Kong or Singapore.11 So the patterns indicate that access to
a large internal or integrated (in the case of the Europeans) seems to matter a lot for banking.
Given the lack of any serious policy moves towards deeper integration in East Asia (about
which, more below), East Asian banks (especially those outside Japan and China) do not seem
to pose any serious threat to the status quo any time soon.
16
The same is true of most capital markets in East Asia, especially outside Japan. Asian
markets have evolved in the past fifteen years, but remain under‐developed compared to the
United States. Governance problems remain generic, especially the rights of creditors and
shareholders. Capital accounts have not been fully liberalized by the policy authorities, in part
to protect exchange rate stability. Since the latter is still widely viewed (though not universally)
seen as a driver of export and overall economic growth, American capital markets seem unlikely
to be challenged by Asians in the short run.
So there is no obvious alternative to American‐lead global financial stability. This does
not mean that no problems exist; there is no guarantee of global financial stability. A different
way to say this is that the biggest possible threat to American‐lead financial supremacy is
probably … the United States. Eichengreen (2011) writes convincingly that America’s primary
fear in this sphere is itself. Continued fiscal stress may slowly be starting to undermine
American financial credibility. The Republican party refuses to raises taxes and has not
specified substantial spending cuts, while the Democratic party remains addicted to
government spending and has never presented a credible alternative. Meanwhile, American
government and external indebtedness have both continued to climb for more than a decade.
This depressing state of affairs reminds one of Kindleberger’s (1973) insight that interwar
financial chaos in the 1930s took place in the policy vacuum between British‐ and American‐
lead global financial leadership.
Continued East Asian Monetary and Financial Cooperation: an American View

17
Americans have little to fear from East Asia (or indeed, the rest of the world) insofar as
rivalry for financial leadership is concerned, at least in the short run. Indeed, it seems safe to
think that the United States welcomes further Asian efforts towards integration. The main
problem is that these efforts seem to be too slow and too shallow.12
Consider efforts aimed at deepening and integrating financial markets in East Asia.
Official policy initiatives in this forum have been among the more successful undertaken since
the 1997‐98 crisis. Most notably, Asian bond markets continue to grow and deepen as a result
of policy. Much effort has gone into creating Asian index bond funds that can be used easily by
the private sector, but these efforts have not yet borne much fruit. The first Asian bond fund
(ABF1) was created in 2003, while another followed in 2005. But while the Asian bond market
initiative is welcome, these markets still have a long way to go before they acquire the depth
and resilience of the American treasury markets. More generally, a number of related
difficulties persist: capital is far from completely mobile in the region, the governance
structures differ a lot across countries, and more generally there is a large national component
associated with capital returns in East Asia.
The other big official success exists on the intra‐regional monetary front. The most
important is a set of international reserve swaps and repurchase agreements for emergency
assistance (initially bilateral, later multilateral). The Chiang Mai Initiative was begun in 2000 by
the ASEAN countries along with their three larger economies to the North (China, Japan, and
Korea, collectively ASAEAN+3). But the CMI hasn’t really been put to the test and can certainly
not be considered a proven success at this point. Much of it is still reliant on the still‐despised
18
IMF; a country that wishes to move beyond an initial tranche must have an IMF program in
place. More importantly, most East Asians now hold so many reserves individually that they
don’t really need access to the resources of the CMI.
In terms of more conventional monetary frameworks, Asia continues to move slowly.
An Asian system of fixed exchange rates, let alone an Asian currency union, Asian currency unit,
or Asian monetary fund still seems far away. ASEAN surveillance, such as it is, has even less
effect on domestic policies than IMF surveillance. This is part of a long tradition of deference to
domestic interests; ASEAN countries are generically touchy about intrusive interventions with
their neighbors.
If anything, East Asian countries have moved away from closer international monetary
ties over the last decade. A number of important East Asian economies (including Indonesia,
Korea, the Philippines, and Thailand) have engaged in domestic inflation targeting; this typically
entails exchange rates that float (albeit not freely). This domestically‐oriented monetary policy
is perhaps the diametric opposite of the European experience of increasingly close monetary
integration, which eventually led to monetary union. IT has proven to be sustainable and
successful in East Asia, as it has elsewhere in the world; no country has switched away from IT
as a result of the 1997‐98 “Great Recession.” Even countries that do not formally practice IT
(such as Japan, Singapore and Taiwan) maintain exchange rate regimes with considerable
flexibility. Official moves towards deeper monetary integration in East Asia seem increasingly
unlikely. It is also notable that where Asians continue to care about their exchange rates, they
19
are often most concerned with the bilateral dollar rates (most overtly in the cases of Hong Kong
and mainland China).
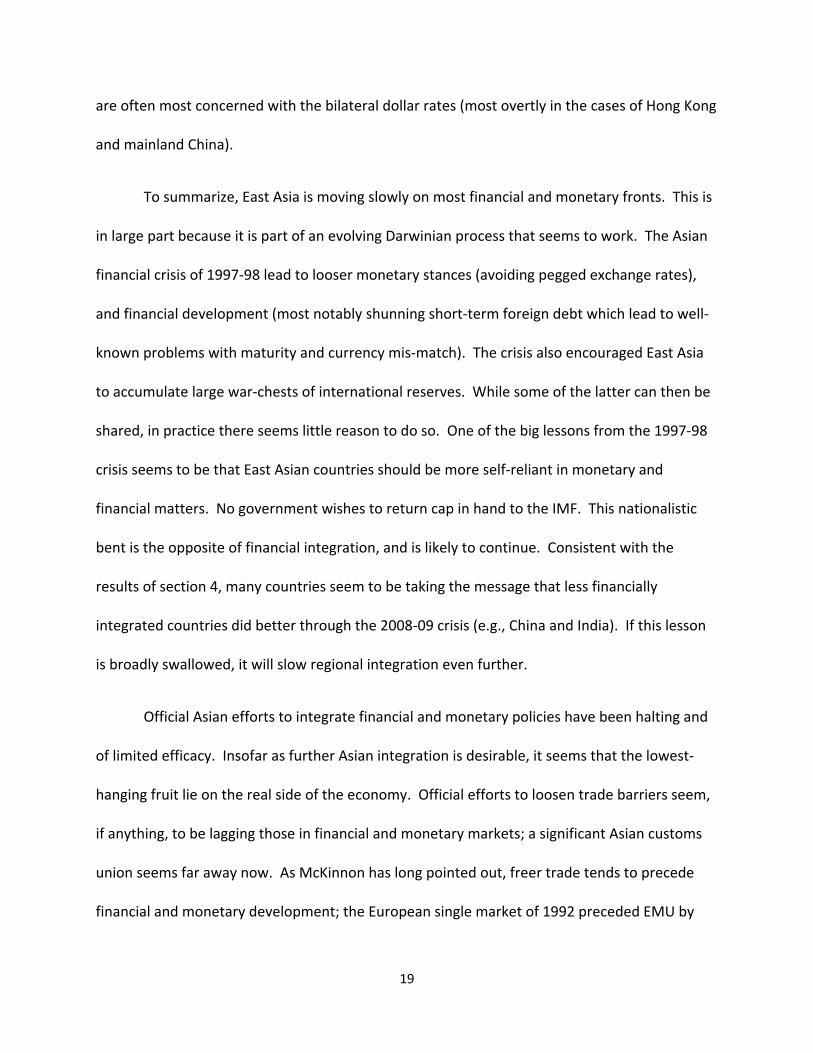
To summarize, East Asia is moving slowly on most financial and monetary fronts. This is
in large part because it is part of an evolving Darwinian process that seems to work. The Asian
financial crisis of 1997‐98 lead to looser monetary stances (avoiding pegged exchange rates),
and financial development (most notably shunning short‐term foreign debt which lead to well‐
known problems with maturity and currency mis‐match). The crisis also encouraged East Asia
to accumulate large war‐chests of international reserves. While some of the latter can then be
shared, in practice there seems little reason to do so. One of the big lessons from the 1997‐98
crisis seems to be that East Asian countries should be more self‐reliant in monetary and
financial matters. No government wishes to return cap in hand to the IMF. This nationalistic
bent is the opposite of financial integration, and is likely to continue. Consistent with the
results of section 4, many countries seem to be taking the message that less financially
integrated countries did better through the 2008‐09 crisis (e.g., China and India). If this lesson
is broadly swallowed, it will slow regional integration even further.
Official Asian efforts to integrate financial and monetary policies have been halting and
of limited efficacy. Insofar as further Asian integration is desirable, it seems that the lowest‐
hanging fruit lie on the real side of the economy. Official efforts to loosen trade barriers seem,
if anything, to be lagging those in financial and monetary markets; a significant Asian customs
union seems far away now. As McKinnon has long pointed out, freer trade tends to precede
financial and monetary development; the European single market of 1992 preceded EMU by

20
years. If one issue tends to unite economists (especially American‐trained economists) it is that
trade barriers are typically harmful and counter‐productive. Insofar as East Asian officials wish
to seize the policy initiatives, regional trade liberalization seems to be a more effective use of
official effort than integration on the financial or monetary fronts. Such a reorientation might
have dramatic effect, as the recent NAFTA example shows. In the case of East Asia, trade is
becoming increasingly tight integrated, but been mostly the result of technological rather than
policy‐driven initiatives. That is, Asian trade integration has been mostly driven by “natural”
rather than “unnatural” causes to use Samuelson’s terminology. If there is a tradeoff between
the two, renewed efforts towards regional trade liberalization seem more likely to enhance
welfare than official efforts to deepen Asian financial or monetary integration.
6. Summary and Conclusion
In this short paper, I model the causes of the international financial crisis that hit much
of the world in 2008‐09. This was the most severe financial crisis and global recession for three
generations, and seems to be a “natural experiment” to deepen our understanding of the
importance of international financial linkages. The fact that the crisis occurred only a couple of
years ago allows us to see if the impact of increasing financial integration is actually visible in
the recent data. I am particularly interested in seeing if countries that were more deeply
integrated in international finance and banking experienced systematically more (or less)
severe financial crises, after taking into account other domestic factors of relevance.

21
I use a flexible econometric methodology that takes into account the facts that the
intensity of the crisis varies across countries, is only imperfectly measured, and may have
multiple causes and manifestations. I rely on my previous work (with Spiegel) and the literature
to model the national causes of the crisis, using data from 2006 and earlier on real GDP per
capita, the tightness of financial market regulation, and the current account. Above and
beyond these national causes, I search for evidence that the incidence and intensity of the
2008‐09 financial crisis across countries was systematically linked to their degree of
international financial integration.
I find little evidence that multilateral financial linkages across countries help explain the
incidence or intensity of the crisis across countries. There is some evidence that countries with
stronger bilateral linkages with the United States weathered the crisis better, though it is by no
means enough to be conclusive. There is no comparable (let alone superior) indication that
countries with closer financial ties to any of the three regional East Asian powers (China, Japan,
and Korea) fared better during the crisis. Thus, even though the financial crisis originated in the
United States in 2007, my results are quite consistent with the enduring financial importance of
America.
Where does one end up as a result of all this? It is often said that financial integration
may have long‐term benefits (in the form of greater risk diversification, a more efficient
allocation of capital, and so forth), but certainly has short‐terms costs in the form of greater
exposure to crises and associated business cycle volatility. In this paper, I have searched for but
found no evidence of the latter; more financially integrated countries do not seem to have
22
suffered more during the most serious macroeconomic crisis in decades. This leads one to
conclude that the costs of international financial integration may have been over‐stated; if they
weren’t great during the Great Recession, when could we ever expect them to be larger? Since
long‐term benefits are often under‐valued by myopic policy‐makers, I conclude that further
steps towards international financial integration continue to seem reasonable (though further
integration may be even more beneficial). Succinctly, one of the minor lessons from the Great
Recession is that continuing international financial integration both within Asia and between
Asia and the United States seems warranted.

23
References
Aigner, Dennis J., Cheng Hsiao, Arie Kapetyn, and Tom Wansbreek (2004) “Latent Variable
Models in Econometrics” in Handbook of Econometrics II (Z. Griliches and M.D. Intriligator, eds)
Elsevier Science, Amsterdam, 1321‐1393.
Berg, Andrew, Eduardo Borensztein, and Catherine Patillo (2004) “Assessing Early Warning
Systems: How Have They Worked in Practice?” IMF Working Paper no. WP/04/52, March.
Blanchard, Olivier, Hamid Faruqee and Mitali Das (2010) “The Initial Impact of the Crisis on
Emerging Market Countries” unpublished.
Eichengreen, Barry (2011) Exorbitant Privilege, Oxford University Press, New York.
Gertler, Paul J. (1988) “A Latent Variable Model of Quality Determination” Journal of Business
and Economic Statistics 6, 97‐107.
Giannone, Domenico, Michele Lenza and Lucrezia Reichlin (2010) “Market Freedom and the
Global Recession” forthcoming IMF Economic Review.
Goldberger, Arthur S. (1972) "Structural Equation Methods in the Social Sciences"
Econometrica, 40, 979‐1001.
Kindleberger, Charles P. (1973) The World in Depression, University of California, Berkeley.
Park, Yung Chul and Charles Wyplosz (2008) “Monetary and Financial Integration in East Asia”
European Economy, Economic Papers 329.
Rabe‐Hesketh, Sophia, Anders Skrondal, and Andrew Pickles (2004a) “Generalized Multilevel
Structural Equation Modeling” Psychometrika 69 (2), 167‐190.

24
Rabe‐Hesketh, Sophia, Anders Skrondal, and Andrew Pickles (2004b) “GLLAMM Manual” UC
Berkeley Biostatistics Working Paper 160.
Rose, Andrew K. and Mark. M. Spiegel (2009a) “Cross‐Country Causes and Consequences of the
2008 Crisis: Early Warning” CEPR Discussion Paper #7354.
Rose, Andrew K. and Mark. M. Spiegel (2009b) “Cross‐Country Causes and Consequences of the
2008 Crisis: International Linkages and American Exposure” CEPR Discussion Paper #7354.
Rose, Andrew K. and Mark. M. Spiegel (2010) “Cross‐Country Causes and Consequences of the
Crisis: An Update” CEPR Discussion Paper #7466.

25
Table 1: Crisis Manifestations (Top 60 economics ranked by equity decline, 2008‐09 changes) 2008‐09 changes in: Stock Market Euromoney Credit Rating SDR Exchange Rate Real GDP
1 Iceland ‐91.4 ‐23.4 100.3 ‐5.6
2 Russia ‐81.2 ‐1.6 22.2 ‐2.7
3 Bulgaria ‐75.8 ‐6.4 1.7 .7
4 United Arab Emirates ‐69.9 ‐4.4 ‐.8 4.5
5 Cyprus ‐66.9 ‐1.0 1.4 1.8
6 Macedonia (FYR) ‐64.3 ‐3.7 1.6 4.1
7 Slovenia ‐64.1 ‐4.0 1.4 ‐4.6
8 Croatia ‐61.7 5.2 1.3 ‐3.5
9 Greece ‐58.3 ‐9.8 1.4 ‐.0
10 Bermuda ‐57.3 ‐15.3 ‐.8 .4
11 Ireland ‐57.1 ‐15.3 1.4 ‐9.8
12 Latvia ‐53.9 ‐15.8 .2 ‐21.8
13 Romania ‐52.3 ‐6.6 18.6 ‐.5
14 Ukraine ‐51.2 ‐8.3 56.9 ‐13.0
15 Lithuania ‐49.1 ‐11.0 1.2 ‐12.6
16 Bahrain ‐47.1 ‐2.1 ‐.8 9.4
17 Italy ‐46.6 ‐7.7 1.4 ‐6.3
18 Finland ‐46.2 ‐4.1 1.4 ‐6.7
19 Kuwait ‐46.0 ‐6.7 4.2 6.7
20 Belgium ‐46.0 ‐7.8 1.4 ‐2.2
21 Estonia ‐45.5 ‐12.1 1.3 ‐17.2
22 Austria ‐44.8 ‐5.8 1.4 ‐1.8
23 Saudi Arabia ‐44.5 ‐3.1 ‐.8 4.6
24 Luxembourg ‐43.3 ‐7.5 1.4 ‐4.8
25 Egypt ‐40.7 ‐1.8 ‐1.1 12.2
26 Slovakia ‐40.1 5.8 1.4 1.2
27 Czech Rep ‐38.4 .6 .8 ‐1.8
28 China ‐38.3 4.3 ‐7.3 19.1
29 Netherlands ‐37.9 ‐7.1 1.4 ‐2.1
30 Portugal ‐35.0 ‐11.2 1.4 ‐2.7
31 Costa Rica ‐34.7 1.1 12.6 1.5
32 Japan ‐34.0 ‐9.2 ‐19.9 ‐6.3
33 Kazakhstan ‐32.9 ‐6.7 22.4 4.5
34 France ‐32.2 ‐6.2 1.4 ‐1.9
35 Malta ‐29.9 ‐.8 1.4 ‐.7
36 Oman ‐29.5 ‐2.4 ‐.8 16.7
37 New Zealand ‐29.4 ‐6.6 6.4 ‐1.2
38 Germany ‐28.6 ‐6.5 1.4 ‐3.8
39 Norway ‐28.4 ‐3.4 6.0 .3
40 Poland ‐27.6 ‐4.2 16.1 6.8
41 Qatar ‐27.4 4.4 ‐.8 24.2
42 United States ‐24.6 ‐9.0 ‐.8 ‐2.0
43 Switzerland ‐24.4 ‐5.6 ‐9.2 .3
44 Bahamas ‐24.3 ‐9.1 ‐.8 ‐5.5
45 Denmark ‐24.1 ‐4.8 1.4 ‐5.8
46 Australia ‐24.0 ‐5.4 ‐2.5 3.7
47 Spain ‐23.5 ‐9.9 1.4 ‐2.7
48 El Salvador ‐23.4 ‐3.4 ‐.8 ‐1.2
49 Barbados ‐22.4 ‐6.2 ‐.8 ‐4.9
50 Ecuador ‐22.2 ‐5.7 ‐.8 6.2
51 Jamaica ‐22.1 ‐3.7 25.5 ‐4.1
52 Trinidad & Tobago ‐22.1 ‐8.5 ‐.3 ‐.1
53 Hong Kong ‐20.0 ‐1.3 ‐1.4 ‐.7
54 Peru ‐19.0 3.1 ‐4.3 10.8
55 UK ‐18.8 ‐9.5 22.7 ‐4.4
56 Singapore ‐18.7 ‐7.0 ‐3.4 ‐.6
57 Hungary ‐17.8 ‐6.6 8.1 ‐5.7
58 Morocco ‐17.7 ‐.7 1.1 11.1
59 Canada ‐17.4 ‐4.1 5.1 ‐2.2
60 Namibia ‐16.9 7.2 7.5 2.3

26
Table 2: MIMIC Model Estimates with only Control Variables
Control MIMIC Default
Drop ExchangeRate Conseq.
Asian/Pacific
OLS, Growth
OLS, Stocks
Log (2006 real GDP p/c) ‐12.6**(4.36)
‐13.5** (4.4)
‐6.0 (3.2)
‐3.0** (.8)
‐13.2** (3.9)
2006 Credit Market Regulation ‐2.5 (3.5)
‐2.0 (3.5)
‐.4 (3.1)
‐2.2** (.7)
‐1.4 (2.8)
2006 Current Account, %GDP .56* (.26)
.53* (.26)
‐.22 (.27)
.21** (.06)
.53* (.25)
Coefficients, with standard error displayed in parentheses. Coefficients significantly different from zero at .05 (.01)
significance level marked by one (two) asterisk(s). Each of the cells in the two left columns represents MIMC
estimation on cross‐section; each of the cells in the two right columns represents OLS estimation on cross‐section
(regressand in column header), with intercept not recorded and robust standard errors. Default: 4 consequences
(2008‐09 change in Stocks, 2008‐09 Growth, 2‐year change in Euromoney rating, 2008‐09 Exchange Rate change),
fixed loading on stocks. Adaptive quadrature estimation; 85 observations.

27
Table 3: Adding Multilateral Financial Linkages
Multilateral Linkages (2006)
MIMIC Default
Drop Exchange Rate Conseq.
Asian/Pacific
OLS, Growth
OLS, Stocks
Net Foreign Assets /GDP
‐8.3 (6.3)
‐8.6 (6.3)
3.9 (4.8)
.29 (1.28)
‐9.0 (8.0)
Debt /GDP
.11 (.31)
.03 (.32)
.05 (.10)
.00 (.04)
.01 (.31)
Short‐Term External Debt /GDP
‐1.0 (.8)
‐1.0 (.8)
‐5.6**(1.4)
‐.36* (.14)
‐.98 (.55)
Financing via International Capital Markets/GDP
‐.9 (1.1)
‐1.0 (1.1)
‐1.8* (.8)
.12 (.18)
‐1.11 (.86)
Reserves /GDP
‐.2 (.2)
‐.2 (.2)
.3 (.2)
‐.00 (.03)
‐.18 (.16)
Currency Union Member
‐3.9 (7.5)
‐4.6 (7.5)
n/a ‐.48 (1.41)
‐4.3 (4.4)
Coefficients, with standard error displayed in parentheses. Coefficients significantly different from zero at .05 (.01)
significance level marked by one (two) asterisk(s). Each of the cells in the two left columns represents MIMC
estimation on cross‐section; each of the cells in the two right columns represents OLS estimation on cross‐section
(regressand in column header), with intercept not recorded and robust standard errors. Default: 4 consequences
(2008‐09 change in Stocks, 2008‐09 Growth, 2‐year change in Euromoney rating, 2008‐09 Exchange Rate change),
fixed loading on stocks. Three control causes (log 2006 real GDP p/c, 2006 credit market regulation, 2006 current
account %GDP) included in all runs but not recorded. Adaptive quadrature estimation.
28
Table 4: Adding Bilateral Financial Linkages
Bilateral Linkages (2006)
Exposure to MIMIC Default
Drop Exchange Rate Conseq.
Asian/Pacific
OLS, Growth
OLS, Stocks
CPIS Asset Share
USA .44** (.12)
.48** (.12)
.10 (.12)
.02 (.03)
.48** (.10)
CPIS Asset Share
Japan 1.5 (1.2)
1.9 (1.2)
.11 (.61)
.36 (.20)
1.9 (1.5)
CPIS Asset Share
Korea .26 (2.80)
.3 (3.1)
4.7 (2.6)
‐.18 (.61)
.5 (2.9)
CPIS Asset Share
China 4.7 (7.8)
4.7 (7.8)
1.5 (2.8)
2.79** (.56)
4.7 (4.2)
CPIS Debt Share
USA .39** (.11)
.43** (.11)
.17 (.14)
.02 (.03)
.44** (.09)
CPIS Debt Share
Japan ‐.62 (1.27)
‐.59 (1.34)
.0002 (.0007)
.39 (.22)
‐.60 (1.52)
CPIS Debt Share
Korea ‐.38 (2.56)
‐.27 (2.54)
2.3 (2.1)
‐.10 (.41)
‐.2 (2.2)
CPIS Debt Share
China 1.0 (1.2)
1.0 (1.2)
.4 (1.0)
.40** (.08)
1.06* (.44)
CPIS Long Debt Share
USA .38** (.12)
.44** (.12)
.26 (.19)
.02 (.03)
.45** (.10)
CPIS Long Debt Share
Japan ‐1.74 (1.5)
‐1.6 (1.6)
.0001 (.0009)
.16 (.22)
‐1.6 (1.7)
CPIS Long Debt Share
Korea .17 (2.05)
.30 (2.04)
2.4 (1.7)
‐.08 (.30)
.3 (1.6)
CPIS Long Debt Share
China 1.1 (1.1)
1.0 (1.1)
2.0 (3.4)
.43 (.07)
.98* (.47)
BIS Consolidated Banking Share
USA 191. (122.)
202. (122.)
‐224. (212.)
‐13.6 (18.8)
207.** (69.)
BIS Consolidated Banking Share
Japan 59. (48.)
57. (49.)
‐18. (33.)
10.0** (3.8)
57** (18.)
% PPG Debt in $
USA .11 (.24)
.08 (.23)
n/a ‐.01 (.04)
.07 (.25)
% PPG Debt in yen
Japan .15 (.50)
.12 (.50)
‐.11 (.27)
.10 (.09)
.10 (.28)
Federal Reserve Swap Line
USA 7.2 (8.1)
7.2 (8.2)
‐1.7 (7.0)
‐.8 (1.6)
7.5 (6.7)
Coefficients, with standard error displayed in parentheses. Coefficients significantly different from zero at .05 (.01)
significance level marked by one (two) asterisk(s). Each of the cells in the two left columns represents MIMC
estimation on cross‐section; each of the cells in the two right columns represents OLS estimation on cross‐section
(regressand in column header), with intercept not recorded and robust standard errors. Default: 4 consequences
(2008‐09 change in Stocks, 2008‐09 Growth, 2‐year change in Euromoney rating, 2008‐09 Exchange Rate change),
fixed loading on stocks. Three control causes (log 2006 real GDP p/c, 2006 credit market regulation, 2006 current
account %GDP) included in all runs but not recorded. Adaptive quadrature estimation.

29
Figure 1: The Progressive Recession
Figure 2: Insulation from the Current Account
-100
-50
050
100
7 8 9 10 11
Stock Market Change
-50
050
100
7 8 9 10 11
Depreciation against SDR-2
0-1
00
1020
7 8 9 10 11
Country Credit Rating Change
-20
-10
010
20
7 8 9 10 11
GDP Growth Rate
Log Real GDP per capita 2006
2008-09 Crisis Manifestations against Real Income-1
00-5
00
5010
0
-40 -20 0 20 40
Stock Market Change
-50
050
100
-40 -20 0 20 40
Depreciation against SDR
-20
-10
010
20
-40 -20 0 20 40
Country Credit Rating Change
-20
-10
010
20
-40 -20 0 20 40
GDP Growth Rate
Current Account % GDP 2006
2008-09 Crisis Manifestations against Current Account
30
Figure 3: Asset Exposure to the United States
Figure 4: Asset Exposure to Japan
-100
-50
050
100
0 20 40 60 80
Stock Market Change
-50
050
100
0 20 40 60 80
Depreciation against SDR-2
0-1
00
1020
0 20 40 60 80
Country Credit Rating Change
-20
-10
010
20
0 20 40 60 80
GDP Growth Rate
Percentage External Assets in USA, CPIS 2006
2008-09 Crisis Manifestations against Asset Exposure to USA-1
00-5
00
5010
0
0 2 4 6 8 10
Stock Market Change
-50
050
100
0 2 4 6 8 10
Depreciation against SDR
-20
-10
010
20
0 2 4 6 8 10
Country Credit Rating Change
-20
-10
010
20
0 2 4 6 8 10
GDP Growth Rate
Percentage External Assets in Japan, CPIS 2006
2008-09 Crisis Manifestations against Asset Exposure to Japan
31
Figure 5: Asset Exposure to Korea
Figure 6: Asset Exposure to China
-100
-50
050
100
0 1 2 3 4 5
Stock Market Change
-50
050
100
0 1 2 3 4 5
Depreciation against SDR-2
0-1
00
1020
0 1 2 3 4 5
Country Credit Rating Change
-20
-10
010
20
0 1 2 3 4 5
GDP Growth Rate
Percentage External Assets in Korea, CPIS 2006
2008-09 Crisis Manifestations against Asset Exposure to Korea-1
00-5
00
5010
0
0 .5 1 1.5 2
Stock Market Change
-50
050
100
0 .5 1 1.5 2
Depreciation against SDR
-20
-10
010
20
0 .5 1 1.5 2
Country Credit Rating Change
-20
-10
010
20
0 .5 1 1.5 2
GDP Growth Rate
Percentage External Assets in China, CPIS 2006
2008-09 Crisis Manifestations against Asset Exposure to China
32
Figure 7: Bank Exposure to the United States
Figure 8: Bank Exposure to Japan
-100
-50
050
100
0 5 10 15 20
Stock Market Change
-50
050
100
0 5 10 15 20
Depreciation against SDR-2
0-1
00
1020
0 5 10 15 20
Country Credit Rating Change
-20
-10
010
20
0 5 10 15 20
GDP Growth Rate
Percentage Banking Assets in USA, BIS 2006
2008-09 Crisis Manifestations against Bank Exposure to USA-1
00-5
00
5010
0
0 10 20 30 40 50
Stock Market Change
-50
050
100
0 10 20 30 40 50
Depreciation against SDR
-20
-10
010
20
0 10 20 30 40 50
Country Credit Rating Change
-20
-10
010
20
0 10 20 30 40 50
GDP Growth Rate
Percentage Banking Assets in Japan, BIS 2006
2008-09 Crisis Manifestations against Bank Exposure to Japan
33
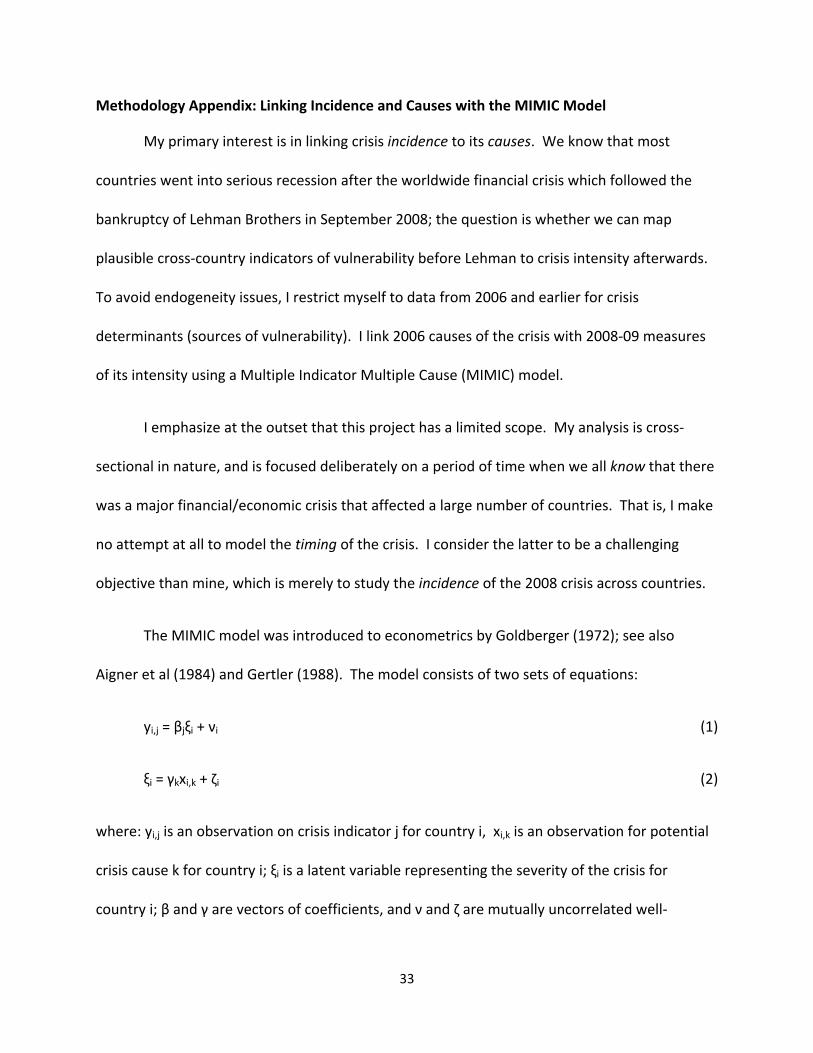
Methodology Appendix: Linking Incidence and Causes with the MIMIC Model
My primary interest is in linking crisis incidence to its causes. We know that most
countries went into serious recession after the worldwide financial crisis which followed the
bankruptcy of Lehman Brothers in September 2008; the question is whether we can map
plausible cross‐country indicators of vulnerability before Lehman to crisis intensity afterwards.
To avoid endogeneity issues, I restrict myself to data from 2006 and earlier for crisis
determinants (sources of vulnerability). I link 2006 causes of the crisis with 2008‐09 measures
of its intensity using a Multiple Indicator Multiple Cause (MIMIC) model.
I emphasize at the outset that this project has a limited scope. My analysis is cross‐
sectional in nature, and is focused deliberately on a period of time when we all know that there
was a major financial/economic crisis that affected a large number of countries. That is, I make
no attempt at all to model the timing of the crisis. I consider the latter to be a challenging
objective than mine, which is merely to study the incidence of the 2008 crisis across countries.
The MIMIC model was introduced to econometrics by Goldberger (1972); see also
Aigner et al (1984) and Gertler (1988). The model consists of two sets of equations:
yi,j = βjξi + νi (1)
ξi = γkxi,k + ζi (2)
where: yi,j is an observation on crisis indicator j for country i, xi,k is an observation for potential
crisis cause k for country i; ξi is a latent variable representing the severity of the crisis for
country i; β and γ are vectors of coefficients, and ν and ζ are mutually uncorrelated well‐

34
behaved disturbances with zero means and constant variances.13 Equation (1) links J
consequences and manifestations of the crisis (denoted by y) to the unobservable measure of
crisis severity. In practice, I model this measurement equation using the ( 4J ) indications of
the crisis (the 2008‐09 national changes in: a) real GDP, b) the stock market, c) the credit rating,
and d) the exchange rate). The second equation models the determination of the crisis as a
function of K causes (x’s, dated 2006 or earlier).
By substituting (2) into (1), one derives a model which is no longer a function of the
latent variable ξ. This MIMIC model is a system of J equations with right‐hand‐sides restricted
to be proportional to each another. These proportionality restrictions constrain the structure
to be a “one‐factor” model of the latent variable; with the addition of normalization, they
achieve identification of the parameters in (1) and (2). One of the features of the MIMIC model
is that it explicitly incorporates measurement error about a key variable – the incidence and
severity of the crisis – in a non‐trivial and plausible way. Indeed, this is one of the attractions of
the MIMIC model.14
I estimate my MIMIC models in STATA with GLLAMM; Rabe‐Hesketh et al (2004a, b)
provide further details. The iterative estimation technique begins with adaptive quadrature
which is followed by Newton‐Raphson.15 I normalize and achieve identification by imposing a
factor loading of unity on the stock market change.16
In Rose and Spiegel (2009a, 200b, 2010), hereafter “RS,” we examined more than 140
possible national determinants of the crisis suggested by the literature and other researchers.17
We found that only three variables worked with any plausible consistency for the 2008‐09

35
crisis; the natural logarithm of 2006 real GDP per capita; the degree to which capital markets
were tightly regulated in 2006 (a variable measured by the Fraser Institute and disseminated by
the Heritage Foundation); and the 2006 current account, measured as a fraction of GDP. I
include all three as controls in the analysis which follows, and thus use them as x’s in equation
(2). Most sources of vulnerability suggested by researchers simply do not line up well in the
data for more than a couple of countries; I ignore such variables in what follows.18
36
Appendix Table A1: Sample of Countries
Argentina Finland Lebanon Russia
Armeniaa France Lithuania Saudi Arabia
Australiaa Georgiaa Luxembourg Singaporea
Austria Germany Macedonia Slovakia
Barbados Greece Malaysiaa Slovenia
Belgium Guyana Malta South Africa
Botswana Hong Konga Mauritius Spain
Brazil Hungary Mexico Sri Lankaa
Bulgaria Iceland Morocco St. Kitts & Nevis
Canada Indonesiaa Namibia Swaziland
Chile Iran Netherlands Sweden
Chinaa Ireland New Zealanda Switzerland
Colombia Israel Norway Thailanda
Costa Rica Italy Oman Trinidad & Tobago
Croatia Jamaica Panama Tunisia
Cyprus Japana Papua New Guineaa Turkeya
Czech Rep Kazakhstana Paraguay UK
Denmark Koreaa Peru Ukraine
Ecuador Kuwait Poland United Statesa
Egypt Kyrgyzstana Portugal Uruguay
El Salvador Latvia Romania Venezuela
Estonia
Note: a indicates an Asian/Pacific economy

37
Appendix Table A2: Key Data Sources Many of the data series were extracted in June 2010 from the World Bank’s World
Development Indicators.19 Other key data sets are listed below. The entire (STATA 10.0) data
set is available at http://faculty.haas.berkeley.edu/arose/MIMIC2Data.zip.
National Sources
Percentage change in 2008, 2009 broad stock market index
International Monetary Fund, International Financial Statistics
Percentage change in 2008, 2009 SDR exchange rates
Euromoney magazine
Country credit ratings
International Monetary Fund, CPIS
Table 8: international cross‐holdings of portfolio assets, debt, long‐term debt
Bank for International Settlements, Consolidated Banking Statistics
2006 ultimate risk basis financial claims
World Bank, Global Development Finance
Percentages of Public and Publicly‐Guaranteed Debt denominated in dollars and yen in
2006
Federal Reserve website
Swapline data available at
http://www.federalreserve.gov/monetarypolicy/bst_liquidityswaps.htm

38
Endnotes 1 I refer below to all these entities as “countries” simply for the sake of convenience even though some are not
(like Hong Kong, a Special Administrative Region of China).
2 I use 2003 since I use the Penn World Table Mark 6.2 which ends in 2004 and has a number of missing values for
that year. The measure of income in the PWT6.2 is “rgdpl”. $4000 is approximately the cutoff for World Bank
“upper middle income” countries.
3 I restrict my attention to crisis causes from 2006 and earlier to avoid any overlap between causes and
consequences of the crisis, with the one exception of the Federal Reserve swaplines.
4 “To obtain the overall country risk score, Euromoney assigns a weighting to seven categories. These are political
risk (30% weighting), economic performance (30%), debt indicators (7.5%), debt in default or rescheduled (5%),
credit ratings (7.5%), access to bank finance/capital markets (10%), discount on forfaiting (10%).” Further details
are available at http://www.euromoney.com/Print.aspx?ArticleID=2404432.
5 The Tunisian stock market rose by over 100% during the period.
6 The number of observations available varies by cause because of data availability.
7 Venezuela, Mexico, Colombia, Bermuda, and Costa Rica all had more than 60% of their foreign assets in the
United States, and had relatively small stock market declines compared with countries with less than 10% of their
foreign wealth invested in America (which include Romania, Latvia, Czech Republic, Estonia, Spain, Austria, and
Cyprus).
8 Further details are available at http://www.bis.org/statistics/consstats.htm.
9 These data are not reported to the BIS for China and Korea.
10 I thank Josh Felman for pointing this out to me forcefully.
11 I draw on data from Global Finance; http://www.gfmag.com/tools/best‐banks/10619‐worlds‐50‐biggest‐
banks.html#axzz1FSdFXUzA.
12 Park and Wyplosz (2008) provide a lucid introduction to recent events.
13 The normalization implies that the latent variable estimate should be interpreted as decreasing in crisis severity.
14 Much of the previous literature on the determinants of financial crises (e.g., Berg et al, 2004) has used discrete
characterizations of economies as being in or out of crisis, either in an ad hoc way or based on some objective
criteria; this variable as then treated as observed without error. In actuality, the severity of a crisis is like to be a
continuous variable, and one that is only observed with error. The MIMIC framework accounts for both
measurement error and continuity.
15 Occasionally I use a different iterative technique to achieve convergence.

39
16 I follow Breusch (2005) in choosing to load first on the stock market because it delivers a better fit in a bivariate
regression than our three other crisis indicators.
17 As well as a large number of financial and macroeconomic features, this work extensively tests a variety of
measures of international trade linkages; they typically have little effect in explaining crisis incidence across
countries.
18 This means in practice that I ignore measures of bank leverage, real estate and other asset prices, measures of
indebtedness, and so forth; the interested reader is referred to Rose and Spiegel (2009a, 2009b, 2010).
19 This includes series on: population; real GDP per capita; current account/GDP; stock market capitalization/GDP.