international financial integration and crisis intensity andrew k. rose uc berkeley, nber and cepr...
Post on 20-Dec-2015
217 views
TRANSCRIPT

International Financial Integration and Crisis Intensity
Andrew K. RoseUC Berkeley, NBER and CEPR
(collaborator with Mark Spiegel)
1ASEAN Presentation, Seoul December 2010

What Caused the 2008-09 Crisis?
• Defining macroeconomic event of generations– A recent “Natural Experiment”
• Did International Financial Integration play any significant role?– If so, multilateral or bilateral ties matter most?– If bilateral, which country matters most for
exposure/insurance?• Big Asian Economies: China; Japan; Korea.• United States
ASEAN Presentation, Seoul December 2010 2

Non-Structural Methodology
• MIMIC (multiple-indicator, multiple cause) model explicitly incorporate difficulties in observing relative crisis severity– Treats crisis as a latent variable– Observed with error as function of observable
manifestations– Also do OLS, graphical analysis
• Sample is cross-section of 85 countries
3ASEAN Presentation, Seoul December 2010

Crisis Performance is Latent Variable Mapping Observable Causes to
Observable Manifestations• 4 Manifestations from 2008-09: equity market
collapse, exchange rate devaluation, economic growth, and change in creditworthiness
• Compare to 2006 vulnerabilities (causes)– National causes– International financial linkages
4ASEAN Presentation, Seoul December 2010

Results, 1
• Plausible estimates of relative severity of crisis– Ex: Iceland and Latvia identified as exceptionally bad– Most Asians have mild crises
• Use literature to find three “national” crisis causes (determinants from 2006)1.Real Income (negative “progressive” effect”)2.Financial Market Regulation (looser → worse crisis)3.Current Account (% GDP) (deficit → worse)
5ASEAN Presentation, Seoul December 2010

Results, 2
• Less success linking crisis to integration variables– No multilateral variables consistently enter at
statistically significant levels– Most bilateral variables irrelevant too
– Little effect of: a) banking exposure; b) debt denomination; c) Fed swap lines
– Asset exposure (CPIS) matters, but not strong– More exposure to US → more mild crisis!
ASEAN Presentation, Seoul December 2010 6

Data
7ASEAN Presentation, Seoul December 2010

Empirical Strategy
• Exploit recent international cross section– “Great Recession” a “natural experiment”
• Don’t have to rely on time-series/panel data
– All information country-specific initially– Then add linkages between countries
– National characteristics may influence vulnerability to foreign shocks
• Medical analogy: common shocks vs. contagion
8ASEAN Presentation, Seoul December 2010

Data Span
• As crisis hit all types of countries, include both developed and EMEs– All countries >$10,000 per capita GDP– All countries >$4,000 per capita GDP, plus
population > 1 million (WB: upper middle income)– Maximum of 85 countries in sample
• Use only publicly-available series available for reasonable span of countries
9ASEAN Presentation, Seoul December 2010

Sample of CountriesArgentina Chinaa Finland Ireland Lithuania Norway Singaporea Trinidad &
TobagoArmeniaa Colombia France Israel Luxembourg Oman Slovakia Tunisia
Australiaa Costa Rica Georgiaa Italy Macedonia Panama Slovenia Turkeya
Austria Croatia Germany Jamaica Malaysiaa Papua New Guineaa
South Africa UK
Barbados Cyprus Greece Japana Malta Paraguay Spain Ukraine
Belgium Czech Rep Guyana Kazakhstana Mauritius Peru Sri Lankaa United Statesa
Botswana Denmark Hong Konga Koreaa Mexico Poland St. Kitts & Nevis
Uruguay
Brazil Ecuador Hungary Kuwait Morocco Portugal Swaziland Venezuela
Bulgaria Egypt Iceland Kyrgyzstana Namibia Romania Sweden
Canada El Salvador Indonesiaa Latvia Netherlands Russia Switzerland
Chile Estonia Iran Lebanon New Zealanda Saudi Arabia Thailanda a = Asian
ASEAN Presentation, Seoul December 2010 10

Differences in Crisis Severity (Manifestations/Consequences)
• Crisis intensity only observed with error [e.g. Berg, et al (2004)]– Abundant measurement error likely
• Initially model severity as a latent variable linked to four observable indicators for 2008-091.GDP growth (%)2.Change in National Equity Markets (stocks, %)3.Change in multilateral SDR exchange rate (%)4.Change in Euromoney country credit rating
• March 2008 - March 2010
11ASEAN Presentation, Seoul December 2010

Table 1: Crisis Manifestations2008-09
changes in:Stock
Market Euromoney
Credit RatingPrice of
SDRReal GDP
1 Iceland -91.4 -23.4 100.3 -5.6
2 Russia -81.2 -1.6 22.2 -2.7
3 Bulgaria -75.8 -6.4 1.7 .7
4 UAE -69.9 -4.4 -.8 4.5
5 Cyprus -66.9 -1.0 1.4 1.8
6 Macedonia -64.3 -3.7 1.6 4.1
7 Slovenia -64.1 -4.0 1.4 -4.6
8 Croatia -61.7 5.2 1.3 -3.5
9 Greece -58.3 -9.8 1.4 -.0
10 Bermuda -57.3 -15.3 -.8 .4
ASEAN Presentation, Seoul December 2010 12

Methodology
13ASEAN Presentation, Seoul December 2010

MIMIC model
• MIMIC model consists of two sets of equations: (1)
(2)
where is crisis indicator, is an observation for potential crisis cause; is latent variable representing severity of the crisis (or lack thereof in our case), and and are well-behaved disturbances
• Equation (1) links observable (2008-09) manifestations of the crisis to latent variable
• Equation (2) links latent variable to (2006) crisis causes
, ii j j iy
,i k i k ix
,i jy ,i kxi
i i
14ASEAN Presentation, Seoul December 2010

Characteristics of MIMIC Model• Substitute (2) into (1), eliminate latent variable• MIMIC model is then a system of J (=4) equations
with right hand sides restricted to be proportional
• With normalization, system is identified– Normalize on equity returns (Breusch)
• Desirable feature of MIMIC model is ability to systematically address measurement error
• Estimate with STATA using GLLAMM model [Rebe-Hesketh, et al (2004)]
15ASEAN Presentation, Seoul December 2010

What Determinants are Associated with Crisis Incidence?
• Survey literature (Rose and Spiegel 2009a, 2009b, 2010), find three determinants
• Use these as national controls throughout1. Real Income (negative effect)2. Credit Market Regulation (looser is worse)3. Current Account, % GDP (higher is better)
ASEAN Presentation, Seoul December 2010 16

Sensitivity Analysis
1. Drop Exchange Rate Consequences2. Restrict to Asian/Pacific Countries (and USA)3. OLS with growth as dependent variable4. OLS with stock market change as regressand
ASEAN Presentation, Seoul December 2010 17

MIMIC Estimates with ControlsControl MIMIC
DefaultDrop
ExchangeRate
Conseq.
Asian/Pacific
OLS, Growth
OLS, Stocks
Log 2006 real GDP pc
-12.6**(4.36)
-13.5**(4.4)
-6.0(3.2)
-3.0**(.8)
-13.2**(3.9)
2006 Credit Market Regulation
-2.5(3.5)
-2.0(3.5)
-.4(3.1)
-2.2**(.7)
-1.4(2.8)
2006 Current Account, %GDP
.56*(.26)
.53*(.26)
-.22(.27)
.21**(.06)
.53*(.25)
ASEAN Presentation, Seoul December 2010 18

Findings consistent with Literature
• Real GDP per capita has negative, significant effect (the “progressive” crisis)
• More Credit Market Regulation associated with milder crisis (Giannone et al), but rarely significant
• Current Account surpluses associated with milder crises
ASEAN Presentation, Seoul December 2010 19

Crisis was Progressive
ASEAN Presentation, Seoul December 2010 20
-10
0-50
050
10
0
7 8 9 10 11
Stock Market Change
-50
050
10
0
7 8 9 10 11
Depreciation against SDR-2
0-1
00
10
20
7 8 9 10 11
Country Credit Rating Change
-20
-10
010
20
7 8 9 10 11
GDP Growth Rate
Log Real GDP per capita 2006
2008-09 Crisis Manifestations against Real Income
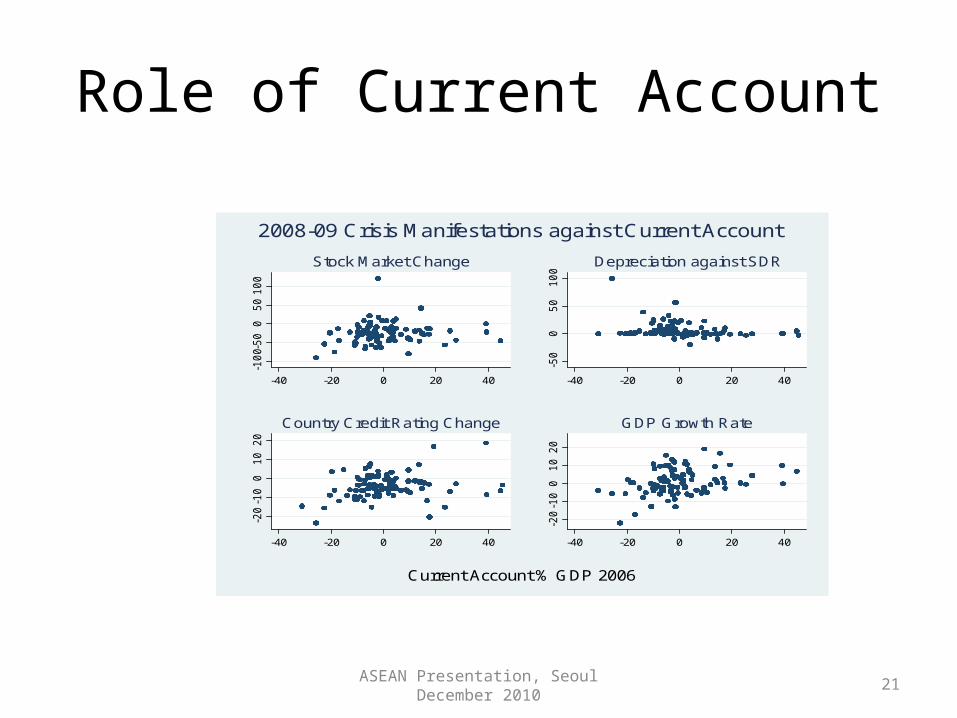
Role of Current Account
ASEAN Presentation, Seoul December 2010 21
-10
0-50
050
10
0
-40 -20 0 20 40
Stock Market Change
-50
050
10
0
-40 -20 0 20 40
Depreciation against SDR-2
0-1
00
10
20
-40 -20 0 20 40
Country Credit Rating Change
-20
-10
010
20
-40 -20 0 20 40
GDP Growth Rate
Current Account % GDP 2006
2008-09 Crisis Manifestations against Current Account

International Financial Integration
22ASEAN Presentation, Seoul December 2010
Multilateral Financial Linkages
• Examine (6) imperfect multilateral proxies for 2006 financial integration, a)-e) as %GDP– a) net foreign assets; – b) external debt; – c) short-term external debt; – d) financing via international capital markets; – e) international reserves. – f) currency union dummy
23ASEAN Presentation, Seoul December 2010

Unchanged Methodology
• Always include (3) national causes• Same sensitivity analysis
ASEAN Presentation, Seoul December 2010 24

Role of MultilateralFinancial Linkages
Multilateral Linkages2006, %GDP
MIMICDefault
Drop Exch.Rate
Conseq.
Asian/Pacific
OLS,Growth
OLS,Stocks
Net Foreign Assets
-8.3(6.3)
-8.6(6.3)
3.9(4.8)
.29(1.28)
-9.0(8.0)
Debt .11(.31)
.03(.32)
.05(.10)
.00(.04)
.01(.31)
Short-Term Ext. Debt
-1.0(.8)
-1.0(.8)
-5.6**(1.4)
-.36*(.14)
-.98(.55)
Fin via Int’lCapital Mkts
-.9(1.1)
-1.0(1.1)
-1.8*(.8)
.12(.18)
-1.11(.86)
Reserves -.2(.2)
-.2(.2)
.3(.2)
-.00(.03)
-.18(.16)
Currency Union
-3.9(7.5)
-4.6(7.5)
n/a -.48(1.41)
-4.3(4.4)
ASEAN Presentation, Seoul December 2010 25

Poor Multilateral Results
• Little effect of international financial integration, after taking into account (3) domestic factors– 30 coefficients; one significantly different from
zero at 1%; two more at 5%.– Short-Term External Debt/GDP consistently
negative effect (Blanchard et al)• Significant 2/5 times
ASEAN Presentation, Seoul December 2010 26

Proceed on to Bilateral Linkages
• Exposure to Individual Countries• Different Sectors:
– All External Assets (CPIS)• Debt, Long-Term Debt as well
– Bank Loans (BIS)– Debt Denomination (WB)– Fed swap-lines
ASEAN Presentation, Seoul December 2010 27

(17) Measures of Bilateral Financial Linkages
• Share of overseas assets held in USA (as proportion of all overseas wealth)– Also consider China, Japan, Korea
• Also consider debt, long-term debt
– BIS Consolidated banking data• Available for Japan, USA
– PPG debt denominated in yen/$– Finally, (endogenous) existence of Fed swapline
28ASEAN Presentation, Seoul December 2010

CPIS: American Exposure Helps!Bilateral Linkages(2006)
Exposure to
MIMICDefault
Drop Exchange
Rate Conseq.
Asian/Pacific
OLS,Growth
OLS,Stocks
CPIS AssetShare
USA .44**(.12)
.48**(.12)
.10(.12)
.02(.03)
.48**(.10)
CPIS AssetShare
Japan 1.5(1.2)
1.9(1.2)
.11(.61)
.36(.20)
1.9(1.5)
CPIS AssetShare
Korea .26(2.80)
.3(3.1)
4.7(2.6)
-.18(.61)
.5(2.9)
CPIS AssetShare
China 4.7(7.8)
4.7(7.8)
1.5(2.8)
2.79**(.56)
4.7(4.2)
29ASEAN Presentation, Seoul December 2010

Special Role of US
• Crisis originated in US• Provider of International Reserves• Monetary Anchor (especially in Asia)• Dollar Appreciation in 2008• But exposure to US assets associated with
more mild crises
ASEAN Presentation, Seoul December 2010 30

Robust to Exact Asset ConsideredBilateral Linkages
Exposure to MIMICDefault
Drop ExchRate
Asian/Pacific
OLS,Growth
OLS,Stocks
CPIS DebtShare
USA .39**(.11)
.43**(.11)
.17(.14)
.02(.03)
.44**(.09)
CPIS DebtShare
Japan -.62(1.27)
-.59(1.34)
.0002(.0007)
.39(.22)
-.60(1.52)
CPIS DebtShare
Korea -.38(2.56)
-.27(2.54)
2.3(2.1)
-.10(.41)
-.2(2.2)
CPIS DebtShare
China 1.0(1.2)
1.0(1.2)
.4(1.0)
.40**(.08)
1.06*(.44)
CPIS LongDebt Share
USA .38**(.12)
.44**(.12)
.26(.19)
.02(.03)
.45**(.10)
CPIS LongDebt Share
Japan -1.74(1.5)
-1.6(1.6)
.0001(.0009)
.16(.22)
-1.6(1.7)
CPIS LongDebt Share
Korea .17(2.05)
.30(2.04)
2.4(1.7)
-.08(.30)
.3(1.6)
CPIS LongDebt Share
China 1.1(1.1)
1.0(1.1)
2.0(3.4)
.43(.07)
.98*(.47) 31ASEAN Presentation, Seoul December 2010
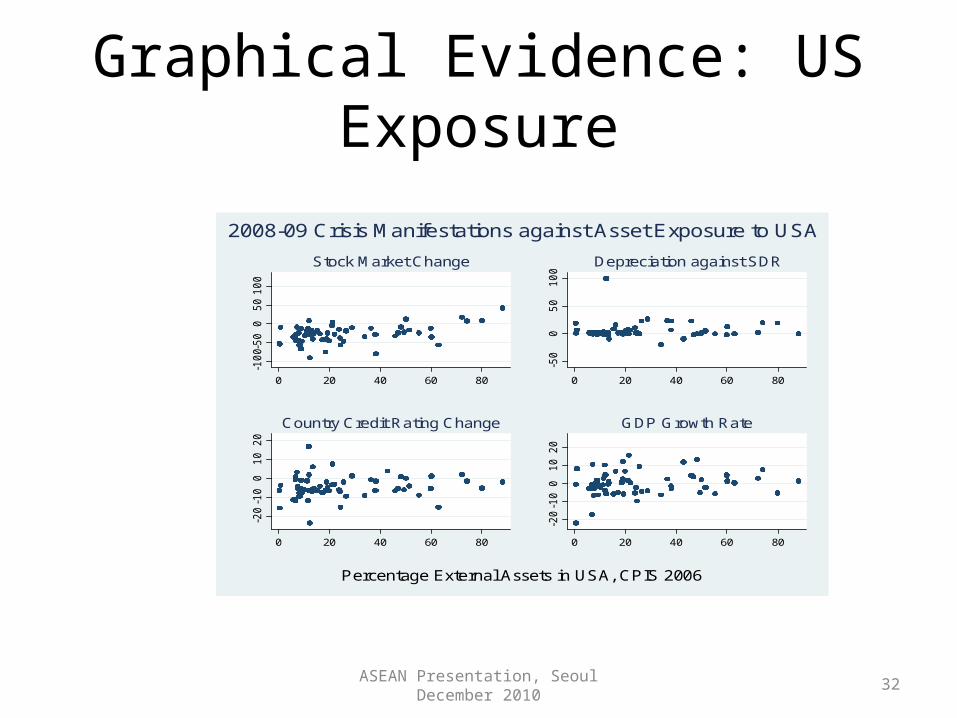
Graphical Evidence: US Exposure
ASEAN Presentation, Seoul December 2010 32
-10
0-50
050
10
0
0 20 40 60 80
Stock Market Change
-50
050
10
0
0 20 40 60 80
Depreciation against SDR-2
0-1
00
10
20
0 20 40 60 80
Country Credit Rating Change
-20
-10
010
20
0 20 40 60 80
GDP Growth Rate
Percentage External Assets in USA, CPIS 2006
2008-09 Crisis Manifestations against Asset Exposure to USA

Japanese Exposure(note x-scales)
ASEAN Presentation, Seoul December 2010 33
-10
0-50
050
10
0
0 2 4 6 8 10
Stock Market Change
-50
050
10
0
0 2 4 6 8 10
Depreciation against SDR-2
0-1
00
10
20
0 2 4 6 8 10
Country Credit Rating Change
-20
-10
010
20
0 2 4 6 8 10
GDP Growth Rate
Percentage External Assets in Japan, CPIS 2006
2008-09 Crisis Manifestations against Asset Exposure to Japan

Korea (note x-scales)
ASEAN Presentation, Seoul December 2010 34
-10
0-50
050
10
0
0 1 2 3 4 5
Stock Market Change
-50
050
10
0
0 1 2 3 4 5
Depreciation against SDR-2
0-1
00
10
20
0 1 2 3 4 5
Country Credit Rating Change
-20
-10
010
20
0 1 2 3 4 5
GDP Growth Rate
Percentage External Assets in Korea, CPIS 2006
2008-09 Crisis Manifestations against Asset Exposure to Korea

China (note x-scales)
ASEAN Presentation, Seoul December 2010 35
-10
0-50
050
10
0
0 .5 1 1.5 2
Stock Market Change
-50
050
10
0
0 .5 1 1.5 2
Depreciation against SDR-2
0-1
00
10
20
0 .5 1 1.5 2
Country Credit Rating Change
-20
-10
010
20
0 .5 1 1.5 2
GDP Growth Rate
Percentage External Assets in China, CPIS 2006
2008-09 Crisis Manifestations against Asset Exposure to China

BIS Consolidated Banking Claims,Debt Denomination, Fed Swaplines
Linkage(2006)
Exposure to Default Drop Exchange Rate
Consequence
Euromoney, not II
Condition on C/acc (%GDP),
not size
Condition on NFA (%GDP), not size
BIS ConsolidatedBanking Share
USA 191.(122.)
202.(122.)
-224.(212.)
-13.6(18.8)
207.**(69.)
BIS ConsolidatedBanking Share
Japan 59.(48.)
57.(49.)
-18.(33.)
10.0**(3.8)
57**(18.)
% PPG Debtin $
USA .11(.24)
.08(.23)
n/a -.01(.04)
.07(.25)
% PPG Debtin yen
Japan .15(.50)
.12(.50)
-.11(.27)
.10(.09)
.10(.28)
Federal ReserveSwap Line
USA 7.2(8.1)
7.2(8.2)
-1.7(7.0)
-.8(1.6)
7.5(6.7)
36ASEAN Presentation, Seoul December 2010

Outliers Important for Japanese BIS consolidated banking data
ASEAN Presentation, Seoul December 2010 37
-10
0-50
050
10
0
0 10 20 30 40 50
Stock Market Change
-50
050
10
0
0 10 20 30 40 50
Depreciation against SDR-2
0-1
00
10
20
0 10 20 30 40 50
Country Credit Rating Change
-20
-10
010
20
0 10 20 30 40 50
GDP Growth Rate
Percentage Banking Assets in Japan, BIS 2006
2008-09 Crisis Manifestations against Bank Exposure to Japan

American Analogue
ASEAN Presentation, Seoul December 2010 38
-10
0-50
050
10
0
0 5 10 15 20
Stock Market Change
-50
050
10
0
0 5 10 15 20
Depreciation against SDR-2
0-1
00
10
20
0 5 10 15 20
Country Credit Rating Change
-20
-10
010
20
0 5 10 15 20
GDP Growth Rate
Percentage Banking Assets in USA, BIS 2006
2008-09 Crisis Manifestations against Bank Exposure to USA

Some Sensitivity, Bigger Mystery
• Why does exposure to America (most likely epi-center of 2008 crisis) seem to help?– Special Advantage of “Exorbitant Privilege”?– Interesting Future Research topic
• Still, results not very strong– Most measures insignificant
• No evidence that Asian links helped in crisis
39ASEAN Presentation, Seoul December 2010

Summary and Conclusion
40ASEAN Presentation, Seoul December 2010

Examine causes and consequences of 2008-09 Financial Crisis
• MIMIC Methodology explicitly confronts fact that “crisis severity” observed with error
• Account for national crisis causes that work in literature
• Cross-sectional focus: only trying to explain relative incidence, not timing
41ASEAN Presentation, Seoul December 2010

Message
• Financial Integration across countries not very important in understanding crisis incidence
• Seems to provide little insurance (though may also limit contagion)
• Multilateral measures especially weak• Bilateral American Financial Influence:
Enduring Impact
ASEAN Presentation, Seoul December 2010 42