international conference on uncertainties in water...
TRANSCRIPT
1
INTERNATIONAL CONFERENCE “UNCERTAINTIES IN WATER RESOURCE
MANAGEMENT: CAUSES, TECHNOLOGIES AND CONSEQUENCES” (WRM-MON2008)
Ulaanbaatar, Mongolia 29th September- 3rd October 2008 PROCEEDINGS Edited by Prof.D.Basandorj, Dr.D.Oyunbaatar IHP Technical Documents in Hydrology No.1 UNESCO Office, Jakarta 2008
2
International conference “Uncertainties in Water Resource Management: causes, technologies and consequences” /WRM-Mon2008
In conjunction with 16
th Regional Steering Committee (RSC) Meeting for the UNESCO
International Hydrological Programme for Southeast Asia and the Pacific (UNESCO-IHP SEAP).
Chinggis Khaan Hotel, Ulaanbaatar city, Mongolia, 29 September – 3 October 2008
Sponsored by UNESCO Office, Jakarta Japanese Ministry of Education, Culture, Sports, Science and Technology (MEXT) Organized by Mongolian National Committee for UNESCO-IHP
3
PREFACE
This International Hydrology Programme (IHP) International Conference on Uncertainties in Water Resource Management: causes, technologies and consequences (WRM) is held in conjunction with the 16th Regional Steering Committee (RSC) Meeting for UNESCO-IHP – Southeast Asia and the Pacific at the Chinggis Khaan Hotel, Ulaanbaatar, Mongolia on 29th September – 3rd October 2008.
The conference being hosted and organized by the Mongolian National Committee for IHP-UNESCO and this scientific conference and meeting is also one important activities within the implementation Seventh phase of the IHP from 2008-2013. The aims of the International Conference on Uncertainties in Water Resource Management: causes, technologies and consequences are to share and disseminate knowledge, information and experiences in water resources and river basin management sciences and to promote cooperative and collaborative activities in several areas supporting the core themes of the IHP-VII.
At the same time, this conference aims to address the regional and global needs for the development and management of sustainable water resources for health, food, economy and environmental enhancement, and the capacity-building of the water stakeholders in their various roles as owners, managers and beneficiaries of the water resources under three main themes as Global changes in arid and semi-arid regions, Water and society, environment and Integrated River Basin Management.
In the conference 21 technical papers were presented and published in this proceedings. The range of topics covered by the papers include climate change impacts, vulnerability, adaptation and economy, sanitation, environmental protection, health, public awareness, education aspects related to water and society and some legislative concerns, methodologies, international and endorheic river basins and aquifers, extreme events which can consider as water resources management issues. The organizers are very thankful to the various organizations and individuals who have greatly contributed and offered their time and effort to this conference and gratefully acknowledge the financial support from several organizations and institutions including UNESCO Office (Jakarta, Indonesia), Japanese Ministry of Education, Culture, Sports, Science and Technology (MEXT), Ministry of Environment and Tourism of Mongolia, the National Geo-Information Centre For Natural Resources Management Project, Research and Training Center for Integrated Water Resource Management, Institute of Meteorology and Hydrology, Water Authority and Integrated Water Resources Management in Central Asia: Model region Mongolia (MoMo) etc.
Prof.D.Basandorj
Dr.D.Oyunbaatar
September 25, 2008
4
Content Technical Papers: Theme 1. Global changes in arid and semi-arid regions: impacts, vulnerability, adaptation Climate Change and Water resources in Mongolia 7 by Batimaa. P, Batnasan.N and Bolormaa. B
Hydrological impact of climate and land-use change - results from the MoMo project
by Menzel Lucas 13
Hydrologic Characterization of the Vembanad Wetlands of Kerala by R. Gopakumar and Kaoru Takara 19 Water Cycle Studies at the Sanzai Site in the Selbe River Basin by Ichirow Kaihotsu, G.Davaa, Dambaravjaa Oyunbaatar and Tsutomu Yamanaka Theme 2. Water and society, environment: economy, sanitation, environmental protection, health, public awareness, education 33 Development of SRR Model for CSO estimation in Urban Area 34 by Seong Su Ryu, Joong Hoon Kim, Hwan Don Jun, Soon-Tak Lee, Hong Kee Jee Ecological Compensation Modes and Policies of Water Source Area 41 by HUANG Chang-shuo, Liu Heng, GENG Lei-hua, WANG Shu-yun Protecting water quality for sustainable livelihood and poverty alleviation in the northeastern India 47 by U.C. Sharma Projection of domestic water use under the spread of water saving appliances in Tokyo by Naoko Nakagawa, Masahiro Otaki, Keitaro Sanada and Toshiya Aramaki 53 Current situation and key problems on water supply and sanitation in Mongolia by D.Basanddorj 58
5
Theme 3. Integrated River Basin Management: legislative concerns, methodologies, international and endorheic river basins and aquifers, extreme events 61 Geomorphological Characterization of Small Hillside River Basins in Semiarid Region of Tunisia for Reducing Uncertainties in Water Resources Management by Akira Kawamura, Achraf Hentati, and Hideo Amaguchi 62 Urban Flood Forecast Uncertainty when Using Raingauge and Radar Data by Richard P. Ibbitt, Martyn P. Clark and Ross A. Woods 69 Urban flooding: case study of Kolkata by Shivashish Bose Optimal Planning and Operation of the drinking water supply system and of the waste water treatment of the city Darkhan, Mongolia by Scharaw Buren and Thomas Westerhoff 76 Water Related Disaster of August 1979 from the fall of Machhu – 2 dam in India by P.R.. Rakhecha 81 Horizontal Wells in Heterogeneous Media by Leonardo Q. Liongson 86 Transboundary Water Pollution in the Lake Baikal Basin: The Role Surface-Ground Water Interactions by Z.Sarantuya and Alice Aureli 94 Uncertainties in Indonesia Water Resources Availability Prof. Hidayat Pawitan, 105
Using of isotope method on study water contamination in Mongolia by L.Janjivdorj, B.Erdenechimeg and D.Unurjargal 113
Preliminary results of study on flat-top glacier at Tsambagarav Mts. Mongolia G.Davaa, T.Kadato, Kh.Purevdagva, D.Baasandorj, 123 Technology of water transmission pipeline on long distance and its application for Gobi and Steppe regions of Mongolia by D.Basandorj, J.Dalai and Sh.Ganzorig 128 Groundwater hydrology and modeling aquifers by M.Alei, Dr.Buynkhishig
6
Theme 1. Global changes in arid and semi-arid regions: impacts, vulnerability,
adaptation
7
CLIMATE CHANGE AND WATER RESOURCES IN MONGOLIA
Batimaa P1., Batnasan N3., Bolormaa B3.
1National team coordinator, Strengthening Integrated Water Resources Management in Mongolia, Water Authority. 2Water resources officer, Mongolia programme office,WWF 3Director, Atvain helhee NGO ABSTRACT: In the Mongolia, surface water is believed to be among those to be adversely affected by climate change. River basins are critical to the economic development and environmental protection and therefore key to the pursuit of sustainable development. Two third of the country’s total land area lies within watersheds. Much of the remaining natural forests that provide a host of environmental services are located in these areas. Also more than … million hectares of agricultural lands presently derive irrigation water from rivers. Observed changes are consistently associated with changes in components of the hydrological cycle and systems such as: changing precipitation patterns, intensity and extremes; widespread melting of snow and ice; increasing evaporation; and changes in soil moisture and runoff. The effect of climate change on groundwater recharge is inadequately known in Mongolia. Many factors affect this phenomenon: alterations in precipitation, evaporation and temperature regimes, soil properties and their changes, urbanization, and changes in forest management and agricultural practices. The paper characterized the recent and future trends in rainfall and temperature and the associated patterns of streamflow. Description of recent trends was made using available records of observed climatic and hydrologic data. To characterize future trends in climate, downscaling of regional GCM results was undertaken. EVIDENCE OF CLIMATE CHANGE IMPACTS ON WATER RESOURCES Changes in river flows due to climate change depend primarily on changes in timing of precipitation particularly in Mongolia depend on whether precipitation falls as snow or rain.
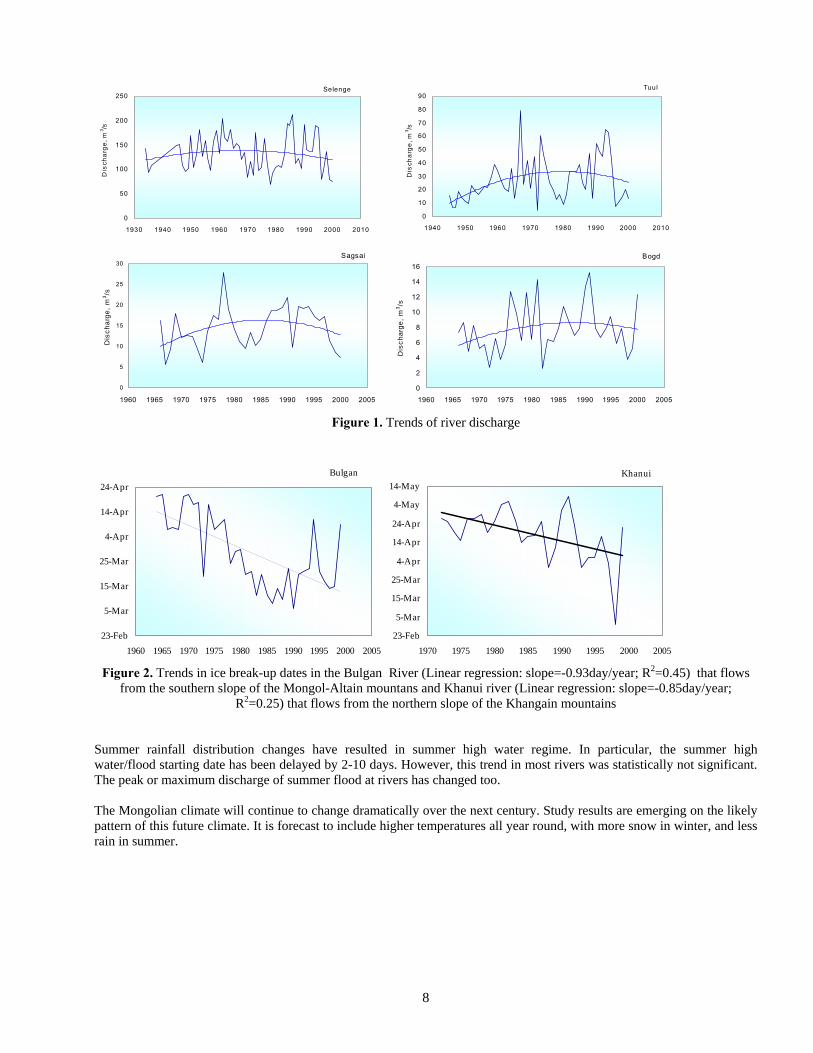
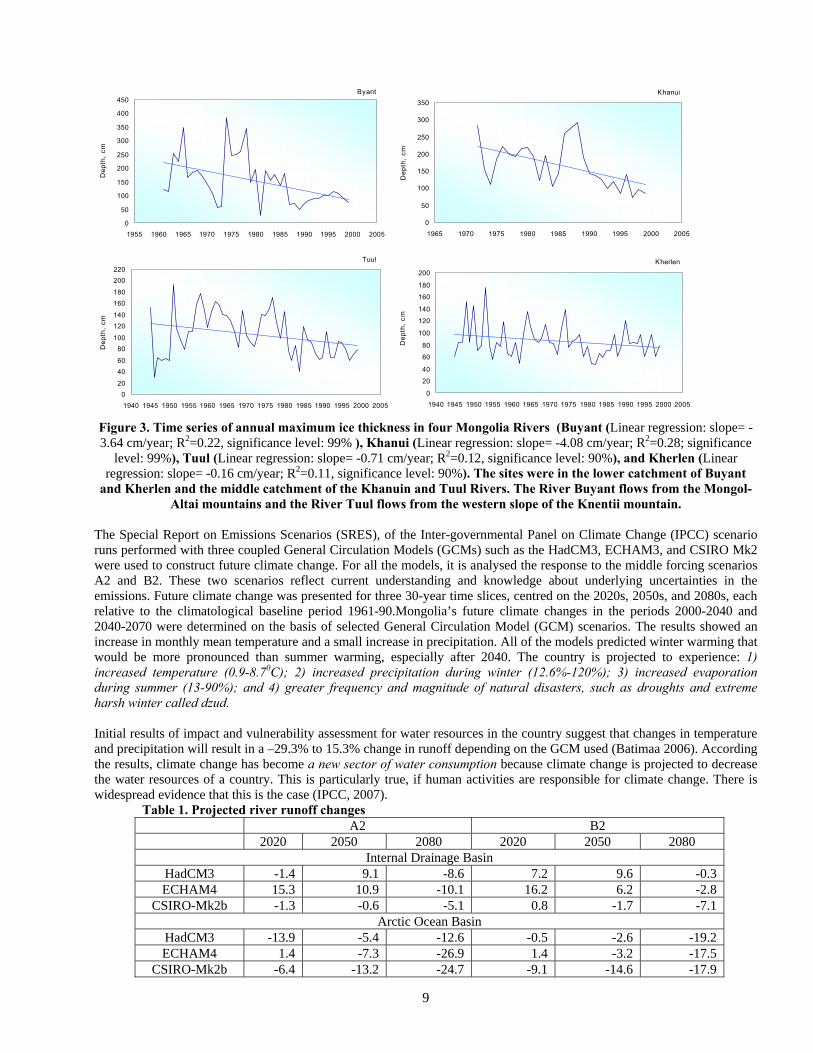
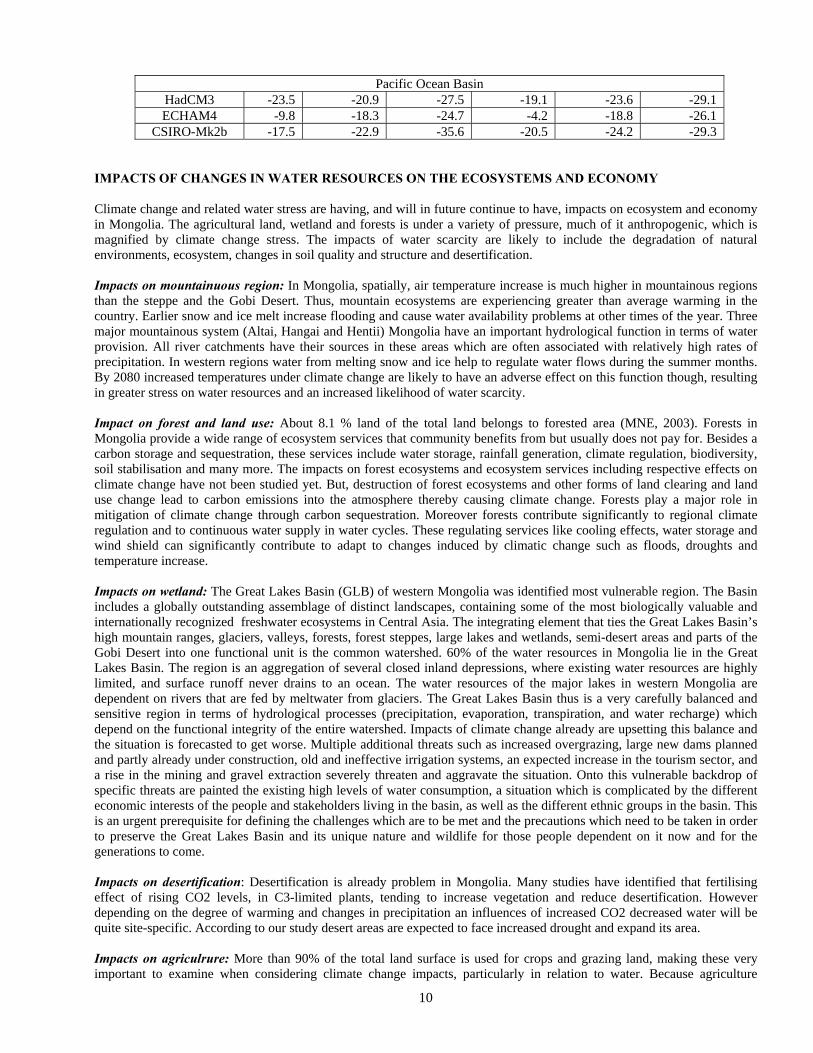
In Mongolia an air temperature has increased by 2.10C between 1940 and 2007 with clear warming in winter of 3.60C (Natsagdorj et al., 2005). The changes of annual precipitation have very localized character i.e. decreasing at one site and increasing at a site nearby. Spatially, annual precipitation decreased by 30-90 mm on the north-eastern slope of the Khangai mountains, in the western slope of the Khentii mountains and downstream of the Orkhon, Selenge rivers basin. Precipitation increased by 2-60 mm in the Mongol Altai, Uvs lakes basin and the western slope of the Khangai mountains and by 30-70 mm in the southern part of the Eastern steppe region. Seasonally, winter and spring precipitation have decreased slightly while there is no changes in summer and autumn precipitation. These changes in climate have resulted in decrease of river discharge in last two decades (Figure 1). An increase in air temperatures of autumn (1.3 0C) and spring (1.80C) have caused to changes in ice phenology dates (Batima, 2003). Freeze-up and break-up dates (Figure 2) have changed from three days to one month. Changes in the timing of the break-up were greater than changes in the freeze-up, perhaps because greater warming has occurred in winter than in other seasons. Also the number of days in the delayed start of the freeze-up and earlier break-up was longer in the western region (in the Mongol Altain mountain rivers) than in the central (Khangai and Khuvsgul mountain rivers) and eastern regions (lower catchments of the Knentii mountain rivers). With a delayed start of autumn ice and an earlier break-up in spring, the duration of ice cover on the rivers has shortened considerably. The annual maximum ice thickness decreased by 40-100 cm from the 1960s to 2000. (Figure 3). Increased air temperatures in winter and earlier snowmelt has influenced in spring river water regime (Batimaa et al, 2005). In Mongolia, river water levels increase due to melting of winter snow cover, glaciers and ice rivers, usually in April-May. Spring high water flows contribute 10-35 per cent to annual water resources from rivers. This event now begins 5-20 days earlier.
8
Selenge
0
50
100
150
200
250
1930 1940 1950 1960 1970 1980 1990 2000 2010
Dis
cha
rge
, m3 /s
Tuul
0
10
20
30
40
50
60
70
80
90
1940 1950 1960 1970 1980 1990 2000 2010
Dis
cha
rge
, m3 /s
Sagsai
0
5
10
15
20
25
30
1960 1965 1970 1975 1980 1985 1990 1995 2000 2005
Dis
ch
arg
e,
m3/s
Bogd
0
2
4
6
8
10
12
14
16
1960 1965 1970 1975 1980 1985 1990 1995 2000 2005D
isc
ha
rge
, m
3/s
Figure 1. Trends of river discharge
Bulgan
23-Feb
5-Mar
15-Mar
25-Mar
4-Apr
14-Apr
24-Apr
1960 1965 1970 1975 1980 1985 1990 1995 2000 2005
Khanui
23-Feb
5-Mar
15-Mar
25-Mar
4-Apr
14-Apr
24-Apr
4-May
14-May
1970 1975 1980 1985 1990 1995 2000 2005
Figure 2. Trends in ice break-up dates in the Bulgan River (Linear regression: slope=-0.93day/year; R2=0.45) that flows from the southern slope of the Mongol-Altain mountans and Khanui river (Linear regression: slope=-0.85day/year;
R2=0.25) that flows from the northern slope of the Khangain mountains Summer rainfall distribution changes have resulted in summer high water regime. In particular, the summer high water/flood starting date has been delayed by 2-10 days. However, this trend in most rivers was statistically not significant. The peak or maximum discharge of summer flood at rivers has changed too. The Mongolian climate will continue to change dramatically over the next century. Study results are emerging on the likely pattern of this future climate. It is forecast to include higher temperatures all year round, with more snow in winter, and less rain in summer.
9
Byant
0
50
100
150
200
250
300
350
400
450
1955 1960 1965 1970 1975 1980 1985 1990 1995 2000 2005
Dep
th,
cmKhanui
0
50
100
150
200
250
300
350
1965 1970 1975 1980 1985 1990 1995 2000 2005
Dep
th,
cm
Tuul
020
4060
80100
120140
160180
200220
1940 1945 1950 1955 1960 1965 1970 1975 1980 1985 1990 1995 2000 2005
Dep
th,
cm
Kherlen
0
20
40
60
80
100
120
140
160
180
200
1940 1945 1950 1955 1960 1965 1970 1975 1980 1985 1990 1995 2000 2005D
epth
, cm
Figure 3. Time series of annual maximum ice thickness in four Mongolia Rivers (Buyant (Linear regression: slope= -3.64 cm/year; R2=0.22, significance level: 99% ), Khanui (Linear regression: slope= -4.08 cm/year; R2=0.28; significance
level: 99%), Tuul (Linear regression: slope= -0.71 cm/year; R2=0.12, significance level: 90%), and Kherlen (Linear regression: slope= -0.16 cm/year; R2=0.11, significance level: 90%). The sites were in the lower catchment of Buyant
and Kherlen and the middle catchment of the Khanuin and Tuul Rivers. The River Buyant flows from the Mongol-Altai mountains and the River Tuul flows from the western slope of the Knentii mountain.
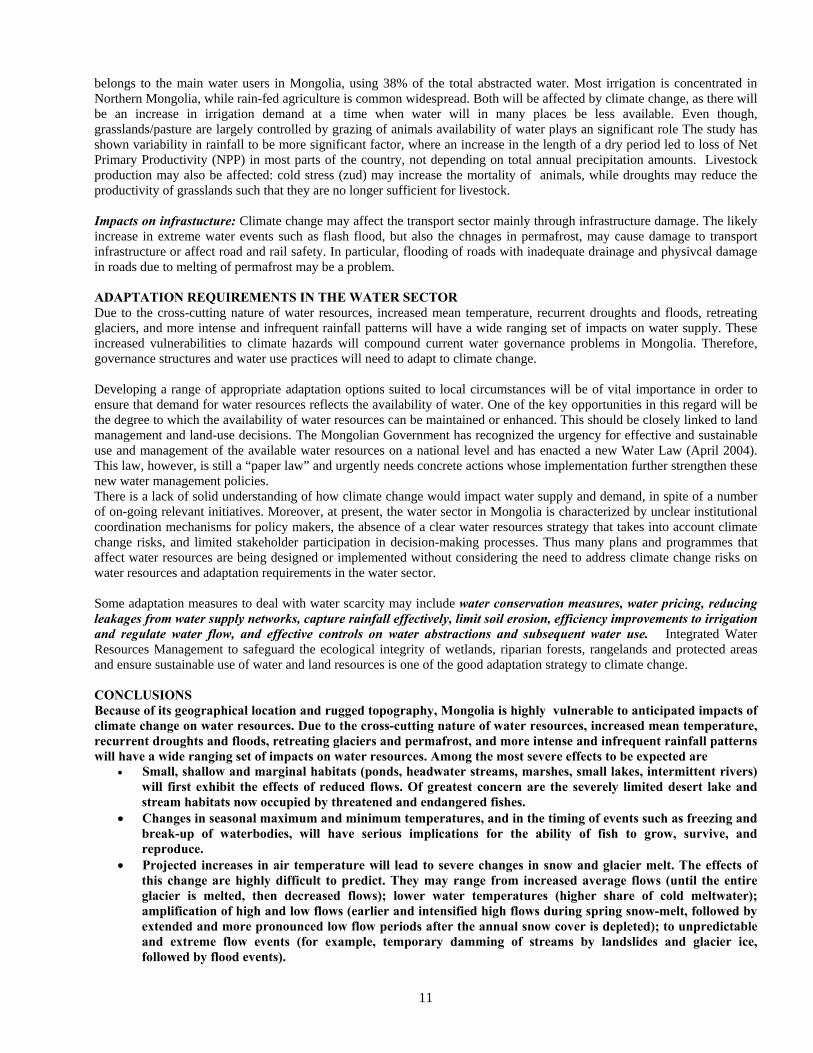
The Special Report on Emissions Scenarios (SRES), of the Inter-governmental Panel on Climate Change (IPCC) scenario runs performed with three coupled General Circulation Models (GCMs) such as the HadCM3, ECHAM3, and CSIRO Mk2 were used to construct future climate change. For all the models, it is analysed the response to the middle forcing scenarios A2 and B2. These two scenarios reflect current understanding and knowledge about underlying uncertainties in the emissions. Future climate change was presented for three 30-year time slices, centred on the 2020s, 2050s, and 2080s, each relative to the climatological baseline period 1961-90.Mongolia’s future climate changes in the periods 2000-2040 and 2040-2070 were determined on the basis of selected General Circulation Model (GCM) scenarios. The results showed an increase in monthly mean temperature and a small increase in precipitation. All of the models predicted winter warming that would be more pronounced than summer warming, especially after 2040. The country is projected to experience: 1) increased temperature (0.9-8.70C); 2) increased precipitation during winter (12.6%-120%); 3) increased evaporation during summer (13-90%); and 4) greater frequency and magnitude of natural disasters, such as droughts and extreme harsh winter called dzud. Initial results of impact and vulnerability assessment for water resources in the country suggest that changes in temperature and precipitation will result in a –29.3% to 15.3% change in runoff depending on the GCM used (Batimaa 2006). According the results, climate change has become a new sector of water consumption because climate change is projected to decrease the water resources of a country. This is particularly true, if human activities are responsible for climate change. There is widespread evidence that this is the case (IPCC, 2007).
Table 1. Projected river runoff changes A2 B2 2020 2050 2080 2020 2050 2080
Internal Drainage Basin HadCM3 -1.4 9.1 -8.6 7.2 9.6 -0.3 ECHAM4 15.3 10.9 -10.1 16.2 6.2 -2.8
CSIRO-Mk2b -1.3 -0.6 -5.1 0.8 -1.7 -7.1 Arctic Ocean Basin
HadCM3 -13.9 -5.4 -12.6 -0.5 -2.6 -19.2 ECHAM4 1.4 -7.3 -26.9 1.4 -3.2 -17.5
CSIRO-Mk2b -6.4 -13.2 -24.7 -9.1 -14.6 -17.9
10
Pacific Ocean Basin HadCM3 -23.5 -20.9 -27.5 -19.1 -23.6 -29.1 ECHAM4 -9.8 -18.3 -24.7 -4.2 -18.8 -26.1
CSIRO-Mk2b -17.5 -22.9 -35.6 -20.5 -24.2 -29.3 IMPACTS OF CHANGES IN WATER RESOURCES ON THE ECOSYSTEMS AND ECONOMY Climate change and related water stress are having, and will in future continue to have, impacts on ecosystem and economy in Mongolia. The agricultural land, wetland and forests is under a variety of pressure, much of it anthropogenic, which is magnified by climate change stress. The impacts of water scarcity are likely to include the degradation of natural environments, ecosystem, changes in soil quality and structure and desertification. Impacts on mountainuous region: In Mongolia, spatially, air temperature increase is much higher in mountainous regions than the steppe and the Gobi Desert. Thus, mountain ecosystems are experiencing greater than average warming in the country. Earlier snow and ice melt increase flooding and cause water availability problems at other times of the year. Three major mountainous system (Altai, Hangai and Hentii) Mongolia have an important hydrological function in terms of water provision. All river catchments have their sources in these areas which are often associated with relatively high rates of precipitation. In western regions water from melting snow and ice help to regulate water flows during the summer months. By 2080 increased temperatures under climate change are likely to have an adverse effect on this function though, resulting in greater stress on water resources and an increased likelihood of water scarcity. Impact on forest and land use: About 8.1 % land of the total land belongs to forested area (MNE, 2003). Forests in Mongolia provide a wide range of ecosystem services that community benefits from but usually does not pay for. Besides a carbon storage and sequestration, these services include water storage, rainfall generation, climate regulation, biodiversity, soil stabilisation and many more. The impacts on forest ecosystems and ecosystem services including respective effects on climate change have not been studied yet. But, destruction of forest ecosystems and other forms of land clearing and land use change lead to carbon emissions into the atmosphere thereby causing climate change. Forests play a major role in mitigation of climate change through carbon sequestration. Moreover forests contribute significantly to regional climate regulation and to continuous water supply in water cycles. These regulating services like cooling effects, water storage and wind shield can significantly contribute to adapt to changes induced by climatic change such as floods, droughts and temperature increase. Impacts on wetland: The Great Lakes Basin (GLB) of western Mongolia was identified most vulnerable region. The Basin includes a globally outstanding assemblage of distinct landscapes, containing some of the most biologically valuable and internationally recognized freshwater ecosystems in Central Asia. The integrating element that ties the Great Lakes Basin’s high mountain ranges, glaciers, valleys, forests, forest steppes, large lakes and wetlands, semi-desert areas and parts of the Gobi Desert into one functional unit is the common watershed. 60% of the water resources in Mongolia lie in the Great Lakes Basin. The region is an aggregation of several closed inland depressions, where existing water resources are highly limited, and surface runoff never drains to an ocean. The water resources of the major lakes in western Mongolia are dependent on rivers that are fed by meltwater from glaciers. The Great Lakes Basin thus is a very carefully balanced and sensitive region in terms of hydrological processes (precipitation, evaporation, transpiration, and water recharge) which depend on the functional integrity of the entire watershed. Impacts of climate change already are upsetting this balance and the situation is forecasted to get worse. Multiple additional threats such as increased overgrazing, large new dams planned and partly already under construction, old and ineffective irrigation systems, an expected increase in the tourism sector, and a rise in the mining and gravel extraction severely threaten and aggravate the situation. Onto this vulnerable backdrop of specific threats are painted the existing high levels of water consumption, a situation which is complicated by the different economic interests of the people and stakeholders living in the basin, as well as the different ethnic groups in the basin. This is an urgent prerequisite for defining the challenges which are to be met and the precautions which need to be taken in order to preserve the Great Lakes Basin and its unique nature and wildlife for those people dependent on it now and for the generations to come. Impacts on desertification: Desertification is already problem in Mongolia. Many studies have identified that fertilising effect of rising CO2 levels, in C3-limited plants, tending to increase vegetation and reduce desertification. However depending on the degree of warming and changes in precipitation an influences of increased CO2 decreased water will be quite site-specific. According to our study desert areas are expected to face increased drought and expand its area. Impacts on agriculrure: More than 90% of the total land surface is used for crops and grazing land, making these very important to examine when considering climate change impacts, particularly in relation to water. Because agriculture
11
belongs to the main water users in Mongolia, using 38% of the total abstracted water. Most irrigation is concentrated in Northern Mongolia, while rain-fed agriculture is common widespread. Both will be affected by climate change, as there will be an increase in irrigation demand at a time when water will in many places be less available. Even though, grasslands/pasture are largely controlled by grazing of animals availability of water plays an significant role The study has shown variability in rainfall to be more significant factor, where an increase in the length of a dry period led to loss of Net Primary Productivity (NPP) in most parts of the country, not depending on total annual precipitation amounts. Livestock production may also be affected: cold stress (zud) may increase the mortality of animals, while droughts may reduce the productivity of grasslands such that they are no longer sufficient for livestock. Impacts on infrastucture: Climate change may affect the transport sector mainly through infrastructure damage. The likely increase in extreme water events such as flash flood, but also the chnages in permafrost, may cause damage to transport infrastructure or affect road and rail safety. In particular, flooding of roads with inadequate drainage and physivcal damage in roads due to melting of permafrost may be a problem. ADAPTATION REQUIREMENTS IN THE WATER SECTOR Due to the cross-cutting nature of water resources, increased mean temperature, recurrent droughts and floods, retreating glaciers, and more intense and infrequent rainfall patterns will have a wide ranging set of impacts on water supply. These increased vulnerabilities to climate hazards will compound current water governance problems in Mongolia. Therefore, governance structures and water use practices will need to adapt to climate change. Developing a range of appropriate adaptation options suited to local circumstances will be of vital importance in order to ensure that demand for water resources reflects the availability of water. One of the key opportunities in this regard will be the degree to which the availability of water resources can be maintained or enhanced. This should be closely linked to land management and land-use decisions. The Mongolian Government has recognized the urgency for effective and sustainable use and management of the available water resources on a national level and has enacted a new Water Law (April 2004). This law, however, is still a “paper law” and urgently needs concrete actions whose implementation further strengthen these new water management policies. There is a lack of solid understanding of how climate change would impact water supply and demand, in spite of a number of on-going relevant initiatives. Moreover, at present, the water sector in Mongolia is characterized by unclear institutional coordination mechanisms for policy makers, the absence of a clear water resources strategy that takes into account climate change risks, and limited stakeholder participation in decision-making processes. Thus many plans and programmes that affect water resources are being designed or implemented without considering the need to address climate change risks on water resources and adaptation requirements in the water sector. Some adaptation measures to deal with water scarcity may include water conservation measures, water pricing, reducing leakages from water supply networks, capture rainfall effectively, limit soil erosion, efficiency improvements to irrigation and regulate water flow, and effective controls on water abstractions and subsequent water use. Integrated Water Resources Management to safeguard the ecological integrity of wetlands, riparian forests, rangelands and protected areas and ensure sustainable use of water and land resources is one of the good adaptation strategy to climate change. CONCLUSIONS Because of its geographical location and rugged topography, Mongolia is highly vulnerable to anticipated impacts of climate change on water resources. Due to the cross-cutting nature of water resources, increased mean temperature, recurrent droughts and floods, retreating glaciers and permafrost, and more intense and infrequent rainfall patterns will have a wide ranging set of impacts on water resources. Among the most severe effects to be expected are
• Small, shallow and marginal habitats (ponds, headwater streams, marshes, small lakes, intermittent rivers) will first exhibit the effects of reduced flows. Of greatest concern are the severely limited desert lake and stream habitats now occupied by threatened and endangered fishes.
• Changes in seasonal maximum and minimum temperatures, and in the timing of events such as freezing and break-up of waterbodies, will have serious implications for the ability of fish to grow, survive, and reproduce.
• Projected increases in air temperature will lead to severe changes in snow and glacier melt. The effects of this change are highly difficult to predict. They may range from increased average flows (until the entire glacier is melted, then decreased flows); lower water temperatures (higher share of cold meltwater); amplification of high and low flows (earlier and intensified high flows during spring snow-melt, followed by extended and more pronounced low flow periods after the annual snow cover is depleted); to unpredictable and extreme flow events (for example, temporary damming of streams by landslides and glacier ice, followed by flood events).
12
• Distributions of aquatic species will change. Following alterations in water temperature, some species may invade habitats at higher or lower altitudes, or may disappear altogether. In general, the warming of freshwater habitats is likely to open them to invasion of non-native species.
• The combination of increased aridity, increased snow and glacier melt, and thawing of permafrost soils may render the flows of many streams unpredictable.
Water is the most likely source of conflict, with different sectors for resources that will in many places become scarcer. These increased vulnerabilities to climate hazards will compound current water governance problems in Mongolia. Therefore, governance structures and water use practices will need to adapt to climate change. Good examples of Integrated River Basin Management should be developed. Batima, P. (2003). Climate change-Pasture and Livestock. Syntheses report 2002. D.Dagvadorj, B.Myagmarjav, L.Natsagdorj and N.Togtokh (eds). IMH. Ulaanbaatar. 120 p. Batima P., T.agnbaatar, D.Tumurbaatar, B.Erdenetsetseg, B.bolortsetseg, B.Gantsetseg, G.Sanjid, S.Hudulmor, (2005). Climate change and Natural resources base. ‘Climate change impacts;, Batima P. and B.Bayasgalan eds. (Mongolian), ADMON. ISBN: 99929-0-614-6. Ulaanbaatar. Mongolia. pp. 3-56. Natsagdorj L., Gomboluudev, P. Batima, P. (2005) Mongolia climate change in Current and Future Climate Change, P.Batima and B.Myagmarjav eds. (Mongolian), ISBN: 99929-0-615-4. Ulaanbaatar. Mongolia. pp.50-86. IPCC (2007) Summary for Policymakers, Climate Change 2007: The Physical Science Basis. Contribution of Working Group I to the Fourth Assessment Report of the Intergovernmental Panel on Climate Change. Cambridge University Press, Cambridge, United Kingdom and New York, NY, USA. Water Law of Mongolia, (2004). Ulaanbaatar. Mongolia.
13
Hydrological impact of climate and land-use change – results from the MoMo
project Lucas Menzel 1, Tim aus der Beek 1, Tobias Tцrnros 1, Florian Wimmer 1, Davaa Gombo 2 1 Center for Environmental Systems Research (CESR), University of Kassel, 34109 Kassel, Germany 2 Institute of Meteorology and Hydrology (IMH), Ulaanbaatar-46, Mongolia, 210646 ABSTRACT Within the German-Mongolian research project MoMo, a suite of modelling tools has been applied to analyze the effects of climate and land-use/land-cover changes on the future hydrological conditions in Central Asia, Mongolia and the meso-scale Kharaa basin located in NE Mongolia. The output of two Global Climate Models (GCM’s), run by the IPCC emission scenarios A1B and B1 was fed into three different hydrological models. The results show that the projected development of the water balance components is very much dependent on the scenario/GCM combination. For the Kharaa basin, a general increase in air temperature and precipitation leads to simulated increases in snow cover, actual evapotranspiration and runoff. The results for the whole of Mongolia are more complex, with a general tendency of reduced water availability in the western parts and increasing runoff in some central and most eastern parts of the country. The simulations show that rising air temperatures will lead to an increase in irrigation water demand for agriculture. A realistic forest reduction scenario demonstrates the strong impact of land-cover on the hydrology in Mongolia. 1. INTRODUCTION Mongolia’s freshwater resources are under increasing pressure. Growth in population, increased economic activity and improved standards of living lead to rising water uses and competition for the limited freshwater resources. Major concerns are – among others – impacts from climate change, over-exploitation of water resources, diffuse pollution, and mining. Current and future climate change with enhanced climate variability will likely increase water resources scarcity in Mongolia. Past and present climate trends are – like in other parts of Asia – characterised by an increase in surface air temperature, with more pronounced temperature rises during winter (Cruz et al., 2007). Observations indicate that over the last 60 years there was a 1.8°C temperature increase in Mongolia (Batima et al., 2005). Inter-seasonal, inter-annual and spatial variability of precipitation has been remarkable in several parts of Mongolia. According to Batima (2005), the last decades showed a clear decrease in summer rainfall and a strong increase in winter precipitation (with low absolute values however).
Economic activities in Mongolia have traditionally been based on herding and agriculture. Although arable land covers only 0.77 % of the country, it has importance in certain regions, such as in the Kharaa basin, one of the focus regions of the MoMo-project. After the political changes in the early 1990ies, many families moved from the urban centres back to the countryside, and livestock density strongly increased, with a total number of livestock of approx. 33 million to date. This has caused rising water demands and overgrazing. Land-use and land-cover changes in Mongolia are also caused by deforestation, forest fires, and mining activities. The frequency and extent of forest fires is likely to increase with climate change.
It is likely that climate change and its impact on many sectors will affect sustainable development in Mongolia.
Shortcomings in the management of natural resources will possibly aggravate the situation. In water resources management, sectoral approaches have dominated in the past and are still prevailing. This leads to fragmented and uncoordinated development and management of water. 2. THE MOMO PROJECT Current concerns about climate variability and climate change as well as land-use change require improved water resource management to cope with an increasing water scarcity and rising competitions for the limited resource. Integrated Water Resource Management (IWRM) is a systematic process for the sustainable development and management of water, land and related resources in the social, economic and environmental context. Integrated management means that all the different
14
uses of water resources are considered together. Water allocation and management decisions take into account the effects of each use on all others. They are able to consider the overall social and economic goals, including the achievement of sustainable development.
A project consortium of Mongolian and German experts selected Mongolia as a model region for the development and implementation of an adapted IWRM. The principal objectives of the MoMo-project (“Integrated Water Resources Management in Central Asia: Model Region Mongolia”) (www.iwrm-momo.de) are an integrated view of the water resources and uses, the improvement of environmental conditions as well as the sustainable supply of drinking water and wastewater treatment in the target region, multilateral and interdisciplinary co-operations between Mongolian and German institutions, transferability to other Central Asian regions and technological and scientific knowledge transfer. The IWRM strategies will be developed on three spatial scales:
1) for a specific river catchment (river Kharaa and the city of Darkhan in NE Mongolia; the target region) with a representative range of water problems (impact of global climate change, over-exploitation of water resources, diffuse pollution, mining, water supply and wastewater treatment in rural and urban areas, protection of ecological functions and nature conservation), which can be addressed in a meaningful way. The watershed area of the Kharaa amounts approx. 15000 km²
2) for other river catchments in Mongolia 3) for other catchments in Central Asia
The MoMo-project has been launched in 2006 and is organized into eight different work packages (for further
information see www.iwrm-momo.de). In work package 1, the potential impact of global change processes on water resources is assessed. This includes the analysis of potential impacts of changes of population, economic growth, land-use and climate on hydrology (e.g., water availability, flow regimes, extreme events) and water use (in different water use sectors), both for the target region (Kharaa catchment) as well as for Mongolia and Central Asia. This requires the development of specific field methods, data retrieval and data analysis techniques as well as the further development and application of a suite of hydrological modelling tools. 3. METHODS Three different hydrological models have been applied to simulate the hydrological dynamics, the water balance and its individual components for Central Asia, Mongolia, the Kharaa catchment and optional subdivisions of the Kharaa. On the large scale, the global water model WaterGAP (Alcamo et al., 2003a, b; Dцll et al., 2003) has been applied to evaluate the current and future water resources of Central Asia and Mongolia on a 50x50 km spatial resolution. On the scale of the Kharaa river basin, the conceptual hydrological model HBV-D has been implemented (Bergstrцm, 1995; Menzel & Bьrger, 2002; Menzel et al., 2006). After the successful calibration of the model, a survey of the water resources and the most important hydrological processes in the Kharaa and its individual subbasins has been carried out for current climate and land-use conditions and for respective scenarios. The highest degree of detail comes from the application of the physically based hydrological model TRAIN (Menzel & Lang, 2005; Menzel, 2007), since it includes the representation of major hydrological processes in a most realistic manner. First areal applications of TRAIN over the whole Kharaa basin on a 1x1 km grid demonstrate the spatial detail of this approach and clearly show the high spatial heterogeneity of hydrological dynamics within the catchment. Data and maps of simulated runoff, potential and actual evapotranspiration, snow cover and snow water equivalent as well as soil moisture for Mongolia (monthly data) and the Kharaa (daily data) have been generated for the current period (1971-2000) as well as for the scenario period (2071-2100).
Within the MoMo project, we analysed the water related questions by considering the IPCC A1B and B1 scenarios for the period 2071-2100. The related scenarios on greenhouse gas emissions were used as input to two Global Climate Models (GCMs) to produce climate scenarios on future global patterns of temperature, precipitation and other climate variables: The ECHAM5 model of the Max Planck Institute of Climatology in Germany and the HadCM3 model of the Hadley Centre in Great Britain. The scenario data are available on a grid covering Mongolia, with grid square sizes in the range of 50x50 km. The data are available at a monthly resolution. The climate scenario data were fed to the different hydrological models applied within MoMo. A more detailed description of the technical aspects regarding the harmonisation of GCM output with WaterGAP data requirements can be found in Alcamo et al (2007). 4. RESULTS 4.1 Climate change scenarios and future hydrological conditions
15
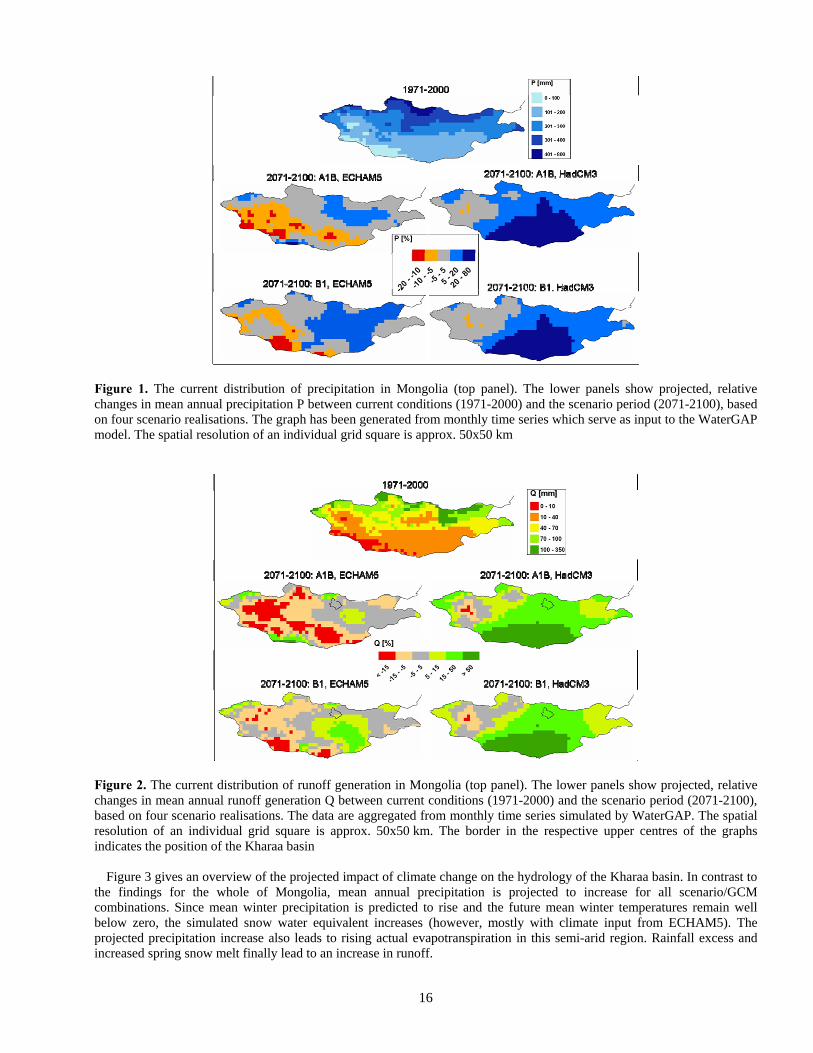
For the scenario period 2071-2100, all scenario/model combinations give a strong increase in mean annual, mean winter and mean summer air temperatures for Mongolia. The highest temperature rises are projected by the A1B scenario, with an increase of mean annual temperature of more than 4°C, in some regions of more than 4.5°C in comparison to the reference period 1971-2000. According to the B1 scenario, mean annual temperature of Mongolia is projected to increase by at least 2°C, in some regions by at least 3°C. Precipitation changes show a more distinct behaviour, with high uncertainties between the different scenario/GCM combinations. Projected precipitation changes between the climate models for the same scenario are often larger than between the two scenarios (Figure 1), and spatial differences are large. Figure 1 shows a tendency of decreasing precipitation in the western parts of Mongolia for both scenarios and the ECHAM5-GCM. According to this scenario/GCM combination, the central and eastern parts of the country (including the Kharaa basin) will experience small changes or an increase in mean annual precipitation by up to 20%. In contrast, the HadCM3-GCM shows increases in precipitation over major parts of the country, with values of up to 80% (Figure 1). Some similarity to the ECHAM5-results can be seen for the western part of Mongolia, where the HadCM3-results show relatively small changes of mean annual precipitation. Regarding winter precipitation, the four scenario/GCM combinations show comparable results, with clear increases in the range of ca. 5-100%.
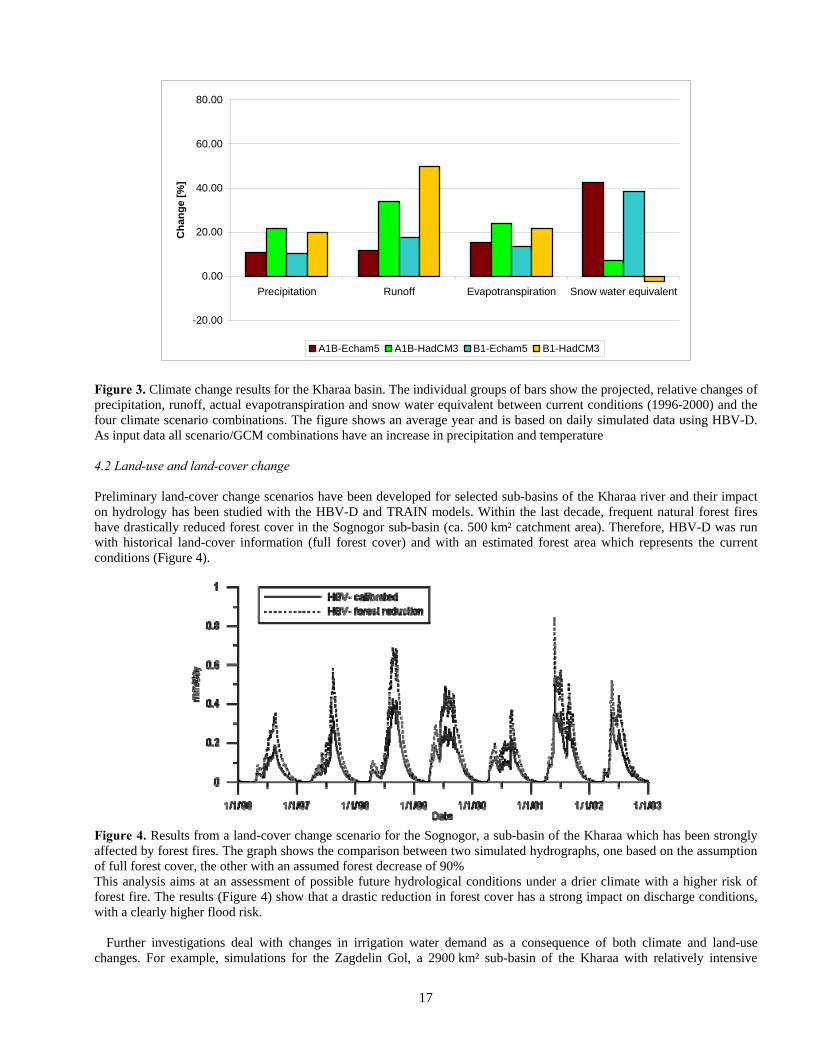
The hydrological simulation of the water balance for the scenario conditions is very much dependent on the input data from the two GCM’s. The high uncertainties in the future development of mean annual precipitation are reflected by the runoff generation as simulated by WaterGAP (Figure 2). With the precipitation scenarios from the ECHAM5 model a clear decrease in projected runoff generation results for large parts in western and central Mongolia. The areal share of the runoff decrease is even higher than those of the precipitation decrease, mostly as a consequence of rising evapotranspiration. In contrast, runoff is projected to increase over most parts of the country when the precipitation scenarios from the HadCM3 model are taken into account (Figure 2). Runoff generation is projected to increase in the Kharaa basin for all possible scenario/GCM combinations.
The WaterGAP-based simulation of the possible future behaviour of potential evapotranspiration PET shows a closer
agreement between the two GCM’s for the same emission scenarios. It is projected to increase strongest for the A1B scenario, with a range in increase between ca. 8% and up to 30%. In contrast, the simulated development of actual evapotranspiration AET is again very much dependent on the precipitation scenario and therefore on the selected scenario/GCM combination. With the ECHAM5-input, WaterGAP simulates a decrease or small changes in AET for most western and central parts of Mongolia (reduced mean annual precipitation leads to less soil moisture and hence reduced AET), and increases of up to 20% in the eastern regions of the country. With the HadCM3 input, both the areal extent of the regions with increasing AET as well as the intensity of the projected increase are larger.
For all scenario/GCM combinations, WaterGAP simulates a general increase of mean annual snow cover (snow water equivalent) for the scenario period. Largest values are projected for the northern parts of Mongolia, with simulated increases of up to 100%. A first assessment of the occurrence of permafrost in Mongolia has also been carried out with WaterGAP. It shows the distribution of discontinuous and continuous permafrost over the country and is in good agreement with existing permafrost maps. These investigations form the base for coming studies on the impact of permafrost and permafrost thawing on hydrological conditions, with special focus on climate change. A first simulation based on the IPCC climate scenarios A1B/B1 and WaterGAP for the scenario period 2071-2100 results in a decrease of permafrost distribution over Mongolia of 54-69% (Aus der Beek & Teichert, 2008).
16
Figure 1. The current distribution of precipitation in Mongolia (top panel). The lower panels show projected, relative changes in mean annual precipitation P between current conditions (1971-2000) and the scenario period (2071-2100), based on four scenario realisations. The graph has been generated from monthly time series which serve as input to the WaterGAP model. The spatial resolution of an individual grid square is approx. 50x50 km
Figure 2. The current distribution of runoff generation in Mongolia (top panel). The lower panels show projected, relative changes in mean annual runoff generation Q between current conditions (1971-2000) and the scenario period (2071-2100), based on four scenario realisations. The data are aggregated from monthly time series simulated by WaterGAP. The spatial resolution of an individual grid square is approx. 50x50 km. The border in the respective upper centres of the graphs indicates the position of the Kharaa basin
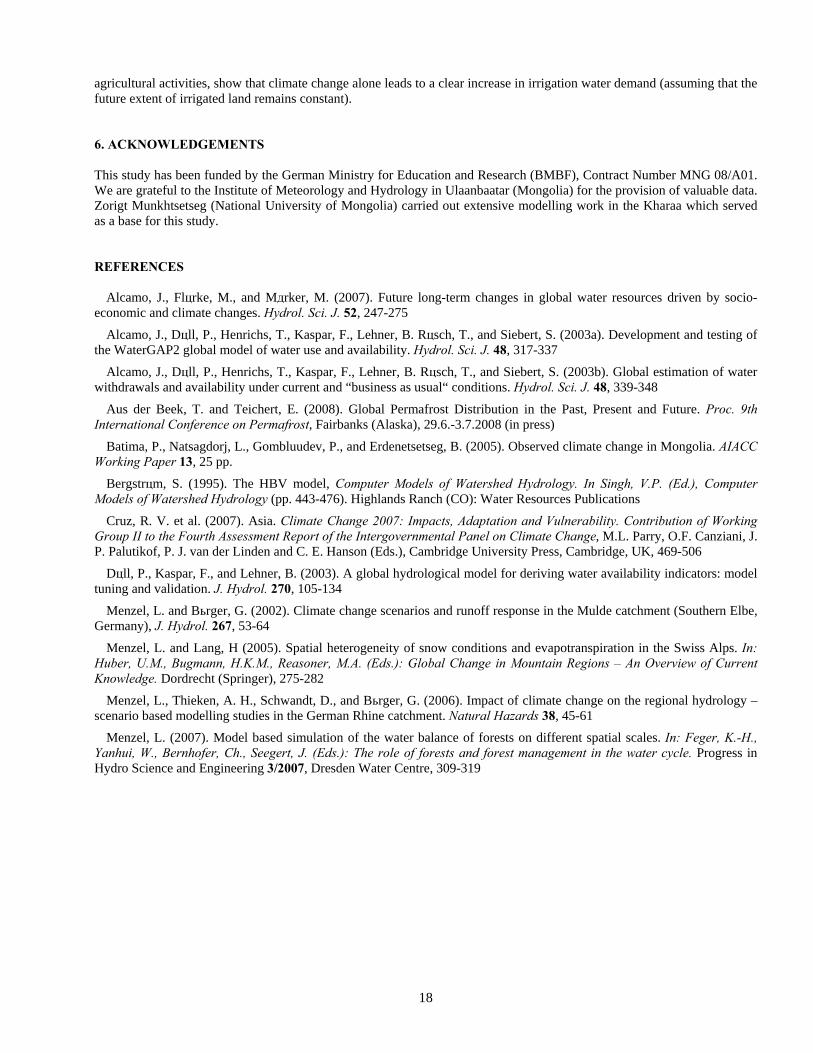
Figure 3 gives an overview of the projected impact of climate change on the hydrology of the Kharaa basin. In contrast to the findings for the whole of Mongolia, mean annual precipitation is projected to increase for all scenario/GCM combinations. Since mean winter precipitation is predicted to rise and the future mean winter temperatures remain well below zero, the simulated snow water equivalent increases (however, mostly with climate input from ECHAM5). The projected precipitation increase also leads to rising actual evapotranspiration in this semi-arid region. Rainfall excess and increased spring snow melt finally lead to an increase in runoff.
17
-20.00
0.00
20.00
40.00
60.00
80.00
Precipitation Runoff Evapotranspiration Snow water equivalent
Ch
ang
e [%
]
A1B-Echam5 A1B-HadCM3 B1-Echam5 B1-HadCM3
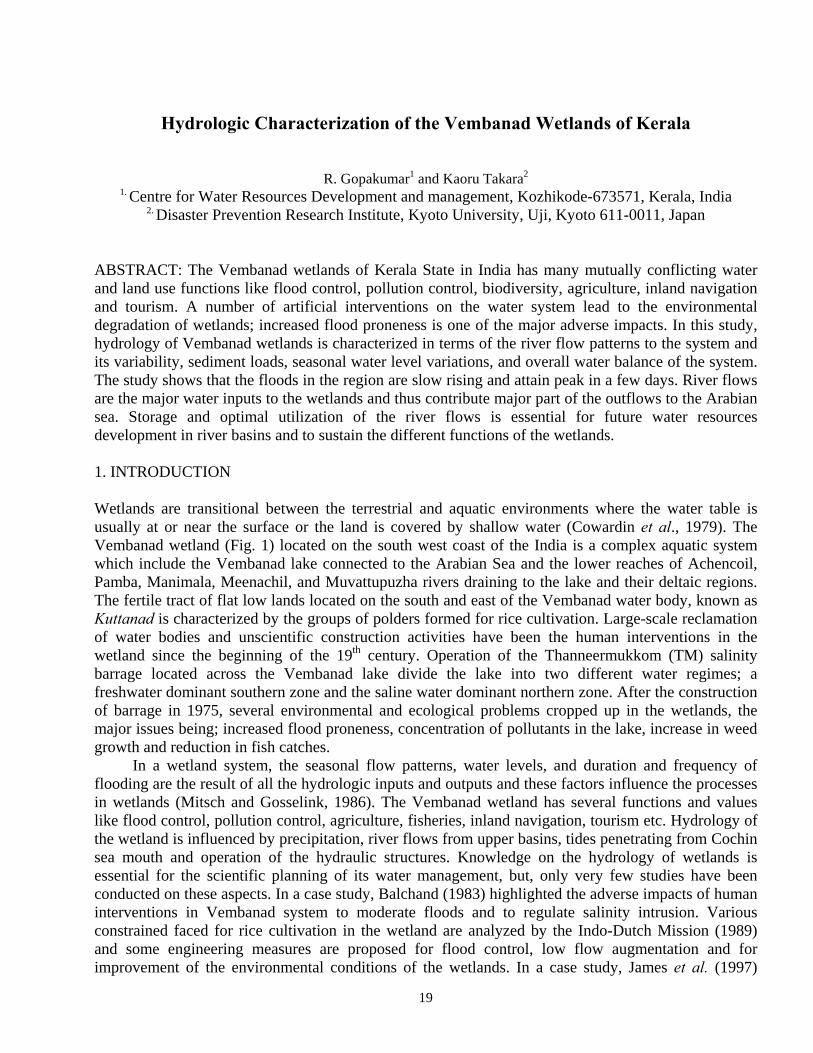
Figure 3. Climate change results for the Kharaa basin. The individual groups of bars show the projected, relative changes of precipitation, runoff, actual evapotranspiration and snow water equivalent between current conditions (1996-2000) and the four climate scenario combinations. The figure shows an average year and is based on daily simulated data using HBV-D. As input data all scenario/GCM combinations have an increase in precipitation and temperature 4.2 Land-use and land-cover change Preliminary land-cover change scenarios have been developed for selected sub-basins of the Kharaa river and their impact on hydrology has been studied with the HBV-D and TRAIN models. Within the last decade, frequent natural forest fires have drastically reduced forest cover in the Sognogor sub-basin (ca. 500 km² catchment area). Therefore, HBV-D was run with historical land-cover information (full forest cover) and with an estimated forest area which represents the current conditions (Figure 4).
Figure 4. Results from a land-cover change scenario for the Sognogor, a sub-basin of the Kharaa which has been strongly affected by forest fires. The graph shows the comparison between two simulated hydrographs, one based on the assumption of full forest cover, the other with an assumed forest decrease of 90% This analysis aims at an assessment of possible future hydrological conditions under a drier climate with a higher risk of forest fire. The results (Figure 4) show that a drastic reduction in forest cover has a strong impact on discharge conditions, with a clearly higher flood risk.
Further investigations deal with changes in irrigation water demand as a consequence of both climate and land-use changes. For example, simulations for the Zagdelin Gol, a 2900 km² sub-basin of the Kharaa with relatively intensive
18
agricultural activities, show that climate change alone leads to a clear increase in irrigation water demand (assuming that the future extent of irrigated land remains constant). 6. ACKNOWLEDGEMENTS This study has been funded by the German Ministry for Education and Research (BMBF), Contract Number MNG 08/A01. We are grateful to the Institute of Meteorology and Hydrology in Ulaanbaatar (Mongolia) for the provision of valuable data. Zorigt Munkhtsetseg (National University of Mongolia) carried out extensive modelling work in the Kharaa which served as a base for this study. REFERENCES
Alcamo, J., Flцrke, M., and Mдrker, M. (2007). Future long-term changes in global water resources driven by socio-economic and climate changes. Hydrol. Sci. J. 52, 247-275
Alcamo, J., Dцll, P., Henrichs, T., Kaspar, F., Lehner, B. Rцsch, T., and Siebert, S. (2003a). Development and testing of the WaterGAP2 global model of water use and availability. Hydrol. Sci. J. 48, 317-337
Alcamo, J., Dцll, P., Henrichs, T., Kaspar, F., Lehner, B. Rцsch, T., and Siebert, S. (2003b). Global estimation of water withdrawals and availability under current and “business as usual“ conditions. Hydrol. Sci. J. 48, 339-348
Aus der Beek, T. and Teichert, E. (2008). Global Permafrost Distribution in the Past, Present and Future. Proc. 9th International Conference on Permafrost, Fairbanks (Alaska), 29.6.-3.7.2008 (in press)
Batima, P., Natsagdorj, L., Gombluudev, P., and Erdenetsetseg, B. (2005). Observed climate change in Mongolia. AIACC Working Paper 13, 25 pp.
Bergstrцm, S. (1995). The HBV model, Computer Models of Watershed Hydrology. In Singh, V.P. (Ed.), Computer Models of Watershed Hydrology (pp. 443-476). Highlands Ranch (CO): Water Resources Publications
Cruz, R. V. et al. (2007). Asia. Climate Change 2007: Impacts, Adaptation and Vulnerability. Contribution of Working Group II to the Fourth Assessment Report of the Intergovernmental Panel on Climate Change, M.L. Parry, O.F. Canziani, J. P. Palutikof, P. J. van der Linden and C. E. Hanson (Eds.), Cambridge University Press, Cambridge, UK, 469-506
Dцll, P., Kaspar, F., and Lehner, B. (2003). A global hydrological model for deriving water availability indicators: model tuning and validation. J. Hydrol. 270, 105-134
Menzel, L. and Bьrger, G. (2002). Climate change scenarios and runoff response in the Mulde catchment (Southern Elbe, Germany), J. Hydrol. 267, 53-64
Menzel, L. and Lang, H (2005). Spatial heterogeneity of snow conditions and evapotranspiration in the Swiss Alps. In: Huber, U.M., Bugmann, H.K.M., Reasoner, M.A. (Eds.): Global Change in Mountain Regions – An Overview of Current Knowledge. Dordrecht (Springer), 275-282
Menzel, L., Thieken, A. H., Schwandt, D., and Bьrger, G. (2006). Impact of climate change on the regional hydrology – scenario based modelling studies in the German Rhine catchment. Natural Hazards 38, 45-61
Menzel, L. (2007). Model based simulation of the water balance of forests on different spatial scales. In: Feger, K.-H., Yanhui, W., Bernhofer, Ch., Seegert, J. (Eds.): The role of forests and forest management in the water cycle. Progress in Hydro Science and Engineering 3/2007, Dresden Water Centre, 309-319
19
Hydrologic Characterization of the Vembanad Wetlands of Kerala
R. Gopakumar1 and Kaoru Takara2 1. Centre for Water Resources Development and management, Kozhikode-673571, Kerala, India
2. Disaster Prevention Research Institute, Kyoto University, Uji, Kyoto 611-0011, Japan
ABSTRACT: The Vembanad wetlands of Kerala State in India has many mutually conflicting water and land use functions like flood control, pollution control, biodiversity, agriculture, inland navigation and tourism. A number of artificial interventions on the water system lead to the environmental degradation of wetlands; increased flood proneness is one of the major adverse impacts. In this study, hydrology of Vembanad wetlands is characterized in terms of the river flow patterns to the system and its variability, sediment loads, seasonal water level variations, and overall water balance of the system. The study shows that the floods in the region are slow rising and attain peak in a few days. River flows are the major water inputs to the wetlands and thus contribute major part of the outflows to the Arabian sea. Storage and optimal utilization of the river flows is essential for future water resources development in river basins and to sustain the different functions of the wetlands. 1. INTRODUCTION Wetlands are transitional between the terrestrial and aquatic environments where the water table is usually at or near the surface or the land is covered by shallow water (Cowardin et al., 1979). The Vembanad wetland (Fig. 1) located on the south west coast of the India is a complex aquatic system which include the Vembanad lake connected to the Arabian Sea and the lower reaches of Achencoil, Pamba, Manimala, Meenachil, and Muvattupuzha rivers draining to the lake and their deltaic regions. The fertile tract of flat low lands located on the south and east of the Vembanad water body, known as Kuttanad is characterized by the groups of polders formed for rice cultivation. Large-scale reclamation of water bodies and unscientific construction activities have been the human interventions in the wetland since the beginning of the 19th century. Operation of the Thanneermukkom (TM) salinity barrage located across the Vembanad lake divide the lake into two different water regimes; a freshwater dominant southern zone and the saline water dominant northern zone. After the construction of barrage in 1975, several environmental and ecological problems cropped up in the wetlands, the major issues being; increased flood proneness, concentration of pollutants in the lake, increase in weed growth and reduction in fish catches.
In a wetland system, the seasonal flow patterns, water levels, and duration and frequency of flooding are the result of all the hydrologic inputs and outputs and these factors influence the processes in wetlands (Mitsch and Gosselink, 1986). The Vembanad wetland has several functions and values like flood control, pollution control, agriculture, fisheries, inland navigation, tourism etc. Hydrology of the wetland is influenced by precipitation, river flows from upper basins, tides penetrating from Cochin sea mouth and operation of the hydraulic structures. Knowledge on the hydrology of wetlands is essential for the scientific planning of its water management, but, only very few studies have been conducted on these aspects. In a case study, Balchand (1983) highlighted the adverse impacts of human interventions in Vembanad system to moderate floods and to regulate salinity intrusion. Various constrained faced for rice cultivation in the wetland are analyzed by the Indo-Dutch Mission (1989) and some engineering measures are proposed for flood control, low flow augmentation and for improvement of the environmental conditions of the wetlands. In a case study, James et al. (1997)
20
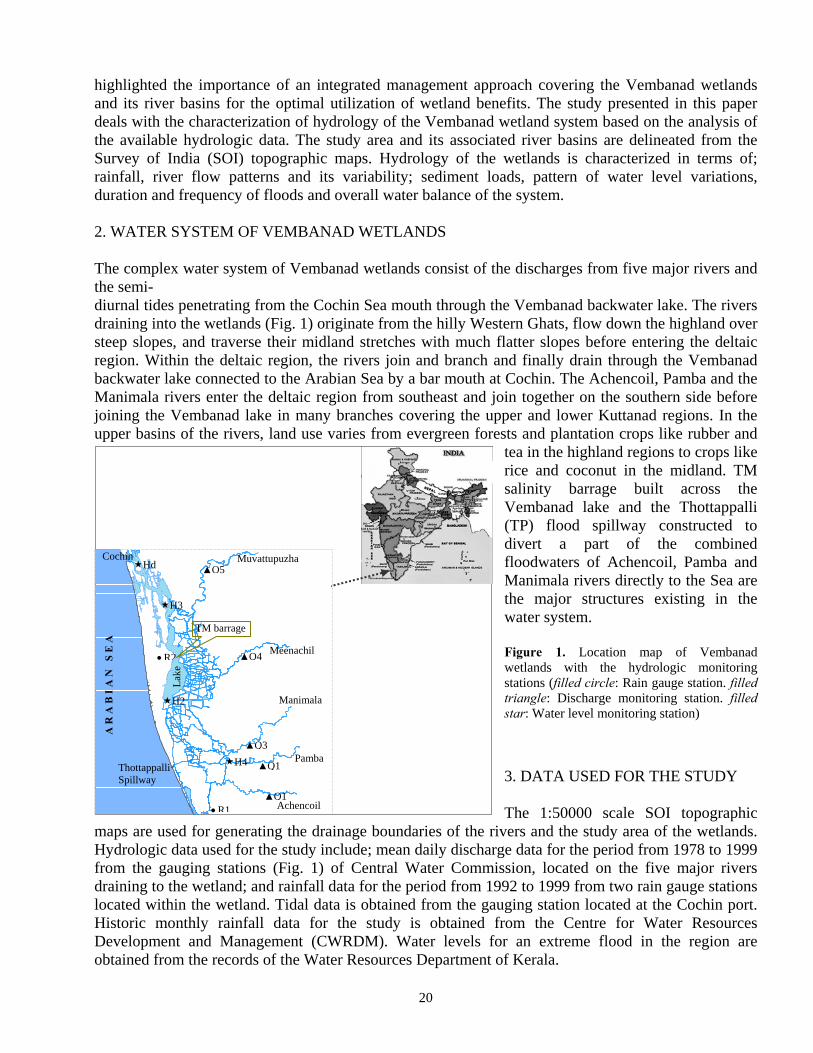
highlighted the importance of an integrated management approach covering the Vembanad wetlands and its river basins for the optimal utilization of wetland benefits. The study presented in this paper deals with the characterization of hydrology of the Vembanad wetland system based on the analysis of the available hydrologic data. The study area and its associated river basins are delineated from the Survey of India (SOI) topographic maps. Hydrology of the wetlands is characterized in terms of; rainfall, river flow patterns and its variability; sediment loads, pattern of water level variations, duration and frequency of floods and overall water balance of the system. 2. WATER SYSTEM OF VEMBANAD WETLANDS The complex water system of Vembanad wetlands consist of the discharges from five major rivers and the semi- diurnal tides penetrating from the Cochin Sea mouth through the Vembanad backwater lake. The rivers draining into the wetlands (Fig. 1) originate from the hilly Western Ghats, flow down the highland over steep slopes, and traverse their midland stretches with much flatter slopes before entering the deltaic region. Within the deltaic region, the rivers join and branch and finally drain through the Vembanad backwater lake connected to the Arabian Sea by a bar mouth at Cochin. The Achencoil, Pamba and the Manimala rivers enter the deltaic region from southeast and join together on the southern side before joining the Vembanad lake in many branches covering the upper and lower Kuttanad regions. In the upper basins of the rivers, land use varies from evergreen forests and plantation crops like rubber and
tea in the highland regions to crops like rice and coconut in the midland. TM salinity barrage built across the Vembanad lake and the Thottappalli (TP) flood spillway constructed to divert a part of the combined floodwaters of Achencoil, Pamba and Manimala rivers directly to the Sea are the major structures existing in the water system. Figure 1. Location map of Vembanad wetlands with the hydrologic monitoring stations (filled circle: Rain gauge station. filled triangle: Discharge monitoring station. filled star: Water level monitoring station) 3. DATA USED FOR THE STUDY The 1:50000 scale SOI topographic
maps are used for generating the drainage boundaries of the rivers and the study area of the wetlands. Hydrologic data used for the study include; mean daily discharge data for the period from 1978 to 1999 from the gauging stations (Fig. 1) of Central Water Commission, located on the five major rivers draining to the wetland; and rainfall data for the period from 1992 to 1999 from two rain gauge stations located within the wetland. Tidal data is obtained from the gauging station located at the Cochin port. Historic monthly rainfall data for the study is obtained from the Centre for Water Resources Development and Management (CWRDM). Water levels for an extreme flood in the region are obtained from the records of the Water Resources Department of Kerala.
Cochin Muvattupuzha
Meenachil
Manimala
Pamba
Achencoil
Lak
e
A R
A B
I A
N
S E
A
Thottappalli Spillway
TM barrage
Hd
H3
H2
•R1
•R2
▲Q1
▲Q1
▲Q3
▲Q4
▲Q5
H4
21
4. STUDY AREA AND ITS LAND USE Drainage areas of the Achencoil, Pamba, Manimala, Meenachil and Muvattupuzha rivers and a stream named Kariar that could be delineated based on the drainage pattern and topographic contours in the 1:50000 scale SOI topographic maps are digitized as vector datasets in GIS. The drainage areas of the rivers defined by the digitized boundaries are referred to as the upper basins. The lower deltaic region of the rivers, where individual catchments can not be distinguished is delineated into one single non basin unit for this study titled as the “Vembanad wetland”. Western boundary of the wetland is defined by the shoreline of Arabian Sea. Northern boundary is extended up to the Cochin estuary and the southern boundary to 25 km south of the TP flood spillway. The upper basins of the five major rivers cover a total area of 6031.74 km2 and the drainage basin of Kariar covers an area of 94.74 km2 (Table 1). The non-basin unit delineated as the Vembanad wetlands covers an area of 2033.02 km2.
Table 1. Area of the river basins and drainage unit delineated as Vembanad wetlands
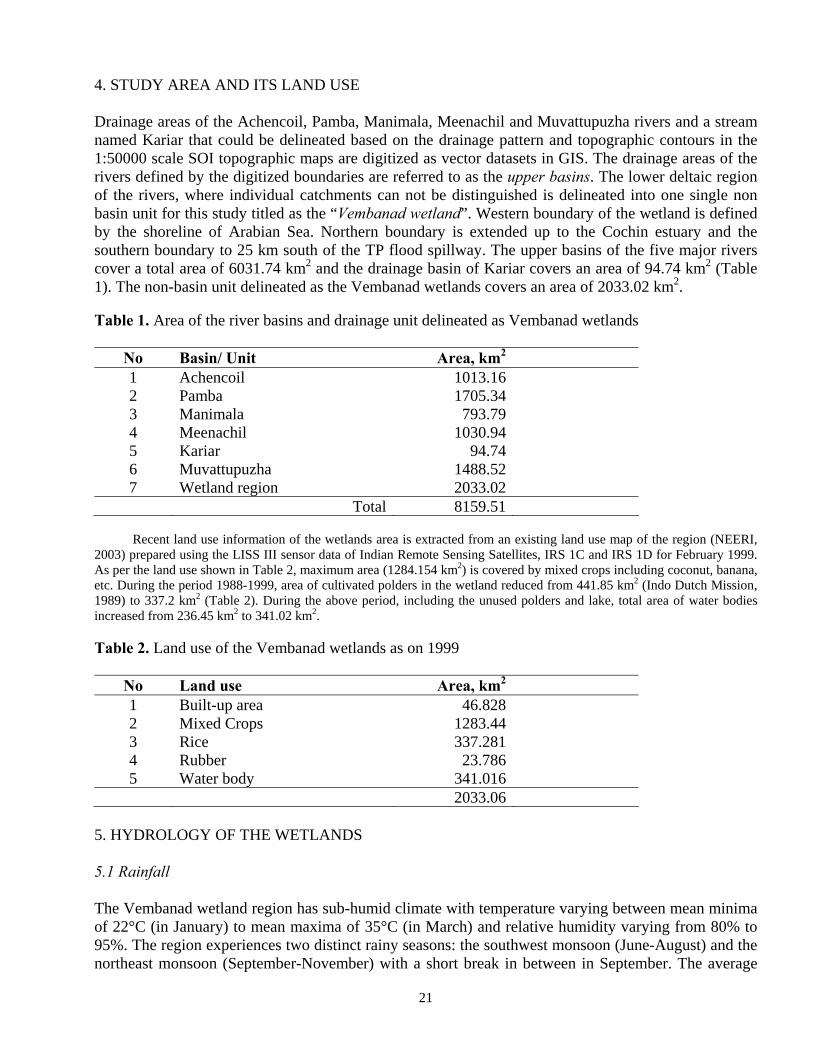
No Basin/ Unit Area, km2 1 Achencoil 1013.16 2 Pamba 1705.34 3 Manimala 793.79 4 Meenachil 1030.94 5 Kariar 94.74 6 Muvattupuzha 1488.52 7 Wetland region 2033.02 Total 8159.51 Recent land use information of the wetlands area is extracted from an existing land use map of the region (NEERI,
2003) prepared using the LISS III sensor data of Indian Remote Sensing Satellites, IRS 1C and IRS 1D for February 1999. As per the land use shown in Table 2, maximum area (1284.154 km2) is covered by mixed crops including coconut, banana, etc. During the period 1988-1999, area of cultivated polders in the wetland reduced from 441.85 km2 (Indo Dutch Mission, 1989) to 337.2 km2 (Table 2). During the above period, including the unused polders and lake, total area of water bodies increased from 236.45 km2 to 341.02 km2. Table 2. Land use of the Vembanad wetlands as on 1999
No Land use Area, km2 1 Built-up area 46.828 2 Mixed Crops 1283.44 3 Rice 337.281 4 Rubber 23.786 5 Water body 341.016 2033.06
5. HYDROLOGY OF THE WETLANDS 5.1 Rainfall The Vembanad wetland region has sub-humid climate with temperature varying between mean minima of 22°C (in January) to mean maxima of 35°C (in March) and relative humidity varying from 80% to 95%. The region experiences two distinct rainy seasons: the southwest monsoon (June-August) and the northeast monsoon (September-November) with a short break in between in September. The average
22
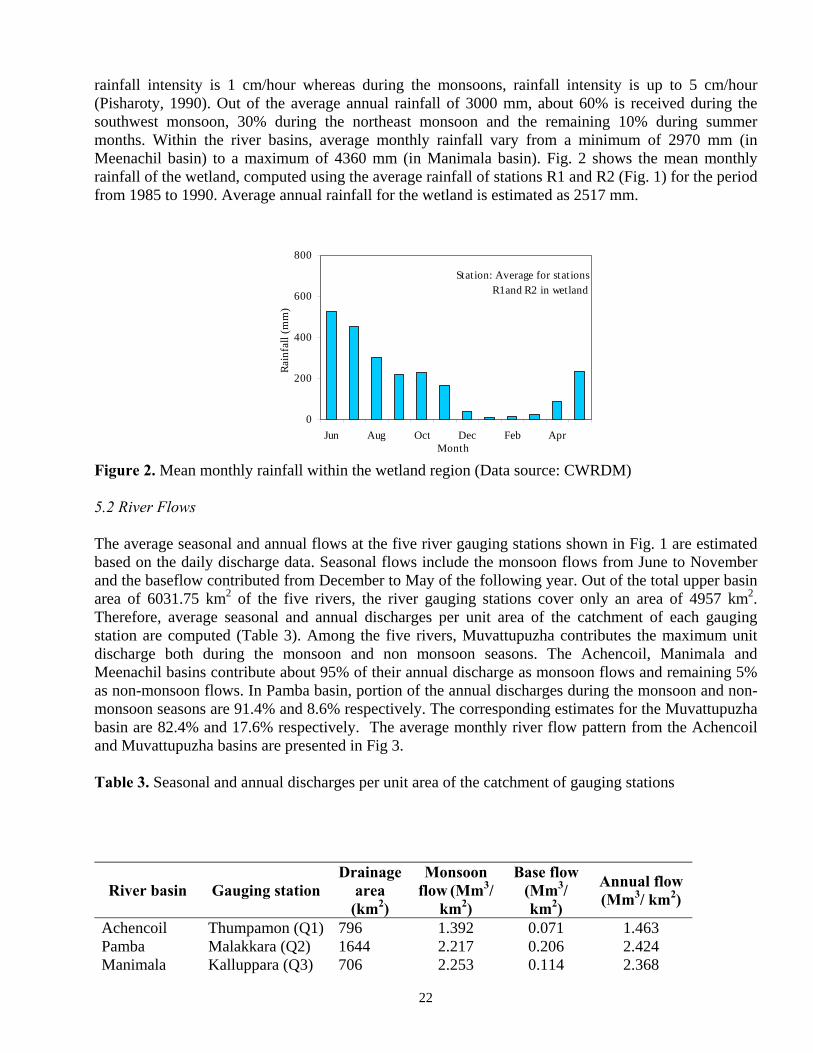
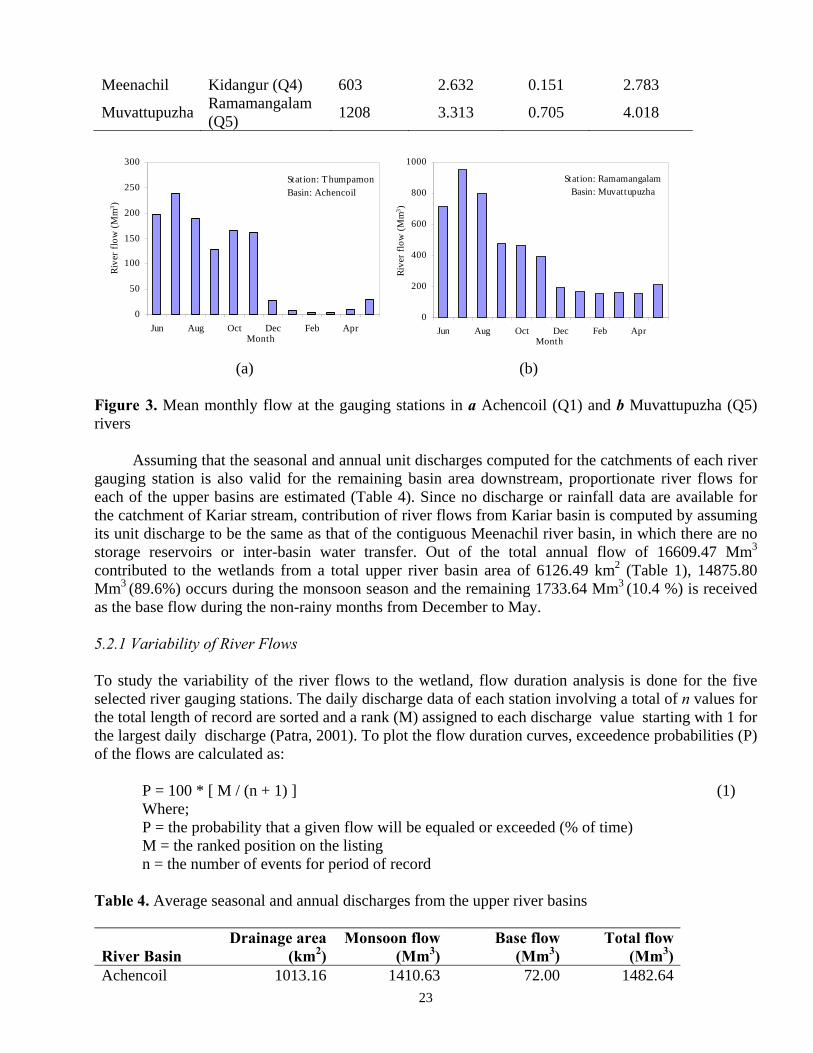
rainfall intensity is 1 cm/hour whereas during the monsoons, rainfall intensity is up to 5 cm/hour (Pisharoty, 1990). Out of the average annual rainfall of 3000 mm, about 60% is received during the southwest monsoon, 30% during the northeast monsoon and the remaining 10% during summer months. Within the river basins, average monthly rainfall vary from a minimum of 2970 mm (in Meenachil basin) to a maximum of 4360 mm (in Manimala basin). Fig. 2 shows the mean monthly rainfall of the wetland, computed using the average rainfall of stations R1 and R2 (Fig. 1) for the period from 1985 to 1990. Average annual rainfall for the wetland is estimated as 2517 mm. Figure 2. Mean monthly rainfall within the wetland region (Data source: CWRDM) 5.2 River Flows The average seasonal and annual flows at the five river gauging stations shown in Fig. 1 are estimated based on the daily discharge data. Seasonal flows include the monsoon flows from June to November and the baseflow contributed from December to May of the following year. Out of the total upper basin area of 6031.75 km2 of the five rivers, the river gauging stations cover only an area of 4957 km2. Therefore, average seasonal and annual discharges per unit area of the catchment of each gauging station are computed (Table 3). Among the five rivers, Muvattupuzha contributes the maximum unit discharge both during the monsoon and non monsoon seasons. The Achencoil, Manimala and Meenachil basins contribute about 95% of their annual discharge as monsoon flows and remaining 5% as non-monsoon flows. In Pamba basin, portion of the annual discharges during the monsoon and non-monsoon seasons are 91.4% and 8.6% respectively. The corresponding estimates for the Muvattupuzha basin are 82.4% and 17.6% respectively. The average monthly river flow pattern from the Achencoil and Muvattupuzha basins are presented in Fig 3. Table 3. Seasonal and annual discharges per unit area of the catchment of gauging stations
River basin Gauging station Drainage
area (km2)
Monsoon flow (Mm3/
km2)
Base flow (Mm3/ km2)
Annual flow (Mm3/ km2)
Achencoil Thumpamon (Q1) 796 1.392 0.071 1.463 Pamba Malakkara (Q2) 1644 2.217 0.206 2.424 Manimala Kalluppara (Q3) 706 2.253 0.114 2.368
Station: Average for stat ions R1and R2 in wetland
0
200
400
600
800
Jun Aug Oct Dec Feb AprMonth
Rai
nfal
l (m
m)
23
Meenachil Kidangur (Q4) 603 2.632 0.151 2.783
Muvattupuzha Ramamangalam (Q5)
1208 3.313 0.705 4.018
Station: Thumpamon Basin: Achencoil
0
50
100
150
200
250
300
Jun Aug Oct Dec Feb AprMonth
Riv
er f
low
(M
m3)
Stat ion: RamamangalamBasin: Muvattupuzha
0
200
400
600
800
1000
Jun Aug Oct Dec Feb AprMonth
Riv
er f
low
(M
m3)
(a) (b) Figure 3. Mean monthly flow at the gauging stations in a Achencoil (Q1) and b Muvattupuzha (Q5) rivers
Assuming that the seasonal and annual unit discharges computed for the catchments of each river gauging station is also valid for the remaining basin area downstream, proportionate river flows for each of the upper basins are estimated (Table 4). Since no discharge or rainfall data are available for the catchment of Kariar stream, contribution of river flows from Kariar basin is computed by assuming its unit discharge to be the same as that of the contiguous Meenachil river basin, in which there are no storage reservoirs or inter-basin water transfer. Out of the total annual flow of 16609.47 Mm3
contributed to the wetlands from a total upper river basin area of 6126.49 km2 (Table 1), 14875.80 Mm3 (89.6%) occurs during the monsoon season and the remaining 1733.64 Mm3 (10.4 %) is received as the base flow during the non-rainy months from December to May. 5.2.1 Variability of River Flows To study the variability of the river flows to the wetland, flow duration analysis is done for the five selected river gauging stations. The daily discharge data of each station involving a total of n values for the total length of record are sorted and a rank (M) assigned to each discharge value starting with 1 for the largest daily discharge (Patra, 2001). To plot the flow duration curves, exceedence probabilities (P) of the flows are calculated as:
P = 100 * [ M / (n + 1) ] (1) Where; P = the probability that a given flow will be equaled or exceeded (% of time) M = the ranked position on the listing n = the number of events for period of record
Table 4. Average seasonal and annual discharges from the upper river basins
River Basin Drainage area
(km2) Monsoon flow
(Mm3)Base flow
(Mm3)Total flow
(Mm3)Achencoil 1013.16 1410.63 72.00 1482.64
24
Pamba 1705.34 3781.50 351.94 4133.44Manimala 793.79 1788.76 90.60 1879.37Meenachil 1030.94 2713.78 155.24 2869.02Muvattupuzha 1488.52 4931.77 1049.55 5981.34Kariar 94.74 249.36 14.31 263.66Total 6126.49 14875.80 1733.64 16609.47
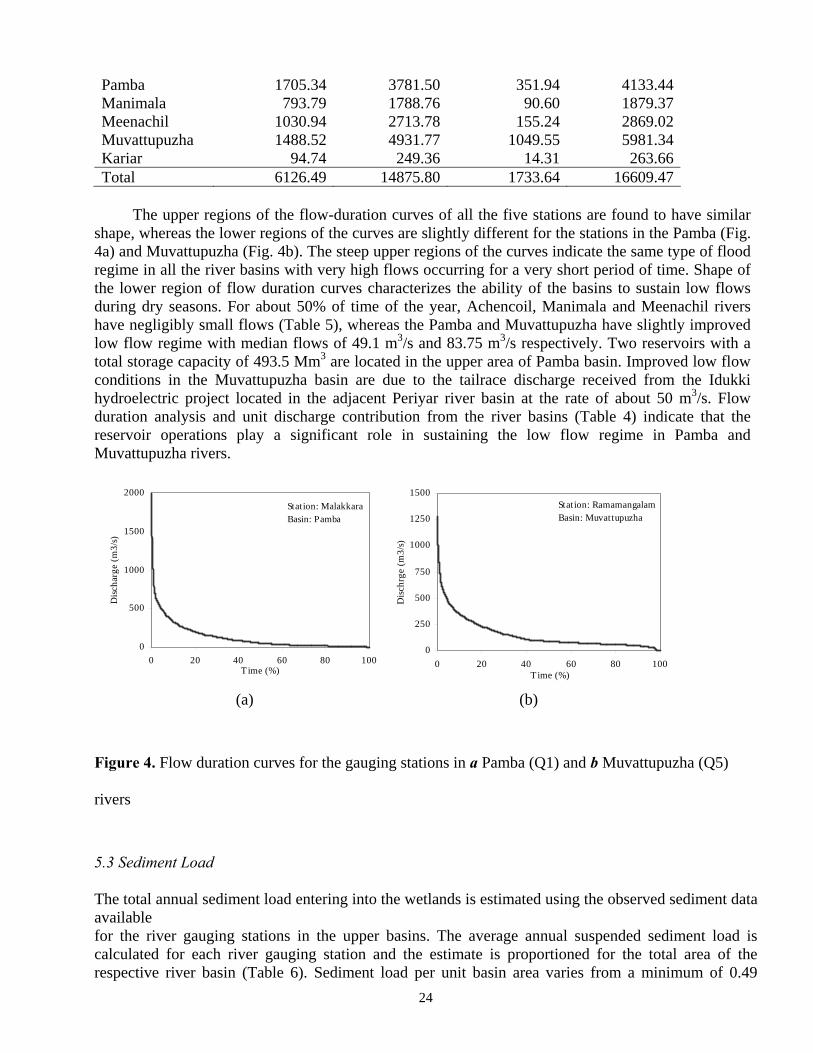
The upper regions of the flow-duration curves of all the five stations are found to have similar
shape, whereas the lower regions of the curves are slightly different for the stations in the Pamba (Fig. 4a) and Muvattupuzha (Fig. 4b). The steep upper regions of the curves indicate the same type of flood regime in all the river basins with very high flows occurring for a very short period of time. Shape of the lower region of flow duration curves characterizes the ability of the basins to sustain low flows during dry seasons. For about 50% of time of the year, Achencoil, Manimala and Meenachil rivers have negligibly small flows (Table 5), whereas the Pamba and Muvattupuzha have slightly improved low flow regime with median flows of 49.1 m3/s and 83.75 m3/s respectively. Two reservoirs with a total storage capacity of 493.5 Mm3 are located in the upper area of Pamba basin. Improved low flow conditions in the Muvattupuzha basin are due to the tailrace discharge received from the Idukki hydroelectric project located in the adjacent Periyar river basin at the rate of about 50 m3/s. Flow duration analysis and unit discharge contribution from the river basins (Table 4) indicate that the reservoir operations play a significant role in sustaining the low flow regime in Pamba and Muvattupuzha rivers.
Station: MalakkaraBasin: Pamba
0
500
1000
1500
2000
0 20 40 60 80 100Time (%)
Dis
char
ge (
m3/
s)
Stat ion: RamamangalamBasin: Muvattupuzha
0
250
500
750
1000
1250
1500
0 20 40 60 80 100Time (%)
Dis
chrg
e (m
3/s)
(a) (b)
Figure 4. Flow duration curves for the gauging stations in a Pamba (Q1) and b Muvattupuzha (Q5)
rivers
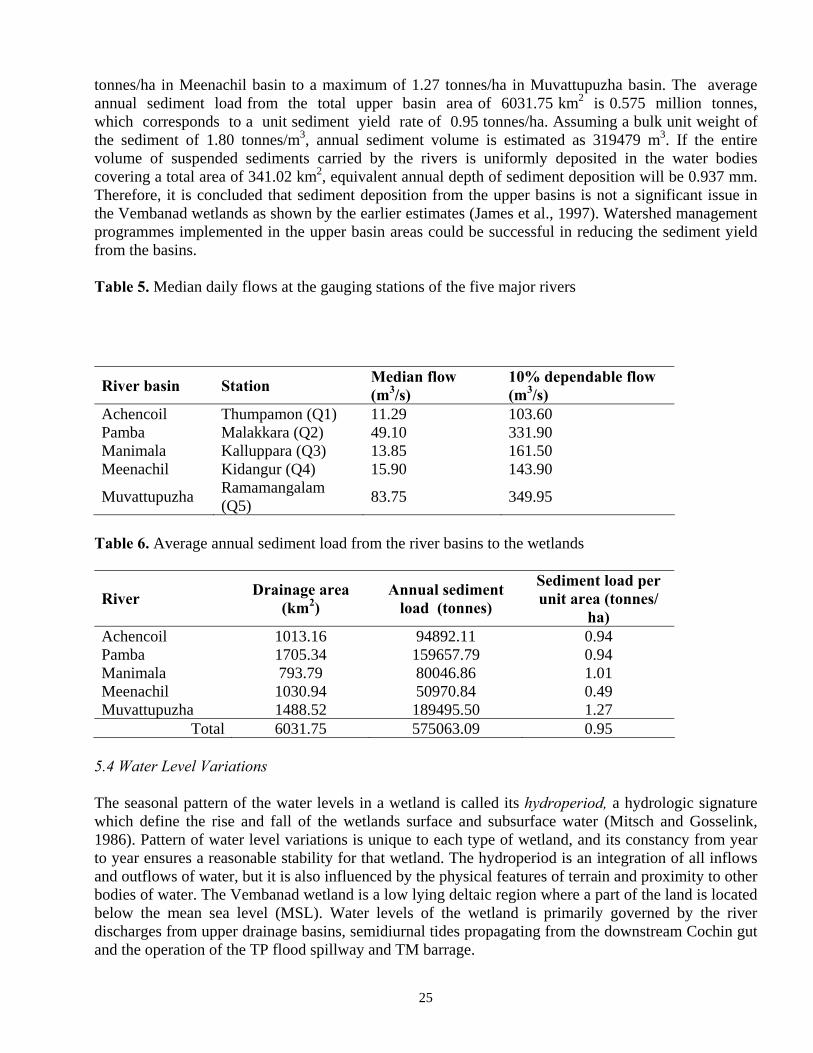
5.3 Sediment Load The total annual sediment load entering into the wetlands is estimated using the observed sediment data available for the river gauging stations in the upper basins. The average annual suspended sediment load is calculated for each river gauging station and the estimate is proportioned for the total area of the respective river basin (Table 6). Sediment load per unit basin area varies from a minimum of 0.49
25
tonnes/ha in Meenachil basin to a maximum of 1.27 tonnes/ha in Muvattupuzha basin. The average annual sediment load from the total upper basin area of 6031.75 km2 is 0.575 million tonnes, which corresponds to a unit sediment yield rate of 0.95 tonnes/ha. Assuming a bulk unit weight of the sediment of 1.80 tonnes/m3, annual sediment volume is estimated as 319479 m3. If the entire volume of suspended sediments carried by the rivers is uniformly deposited in the water bodies covering a total area of 341.02 km2, equivalent annual depth of sediment deposition will be 0.937 mm. Therefore, it is concluded that sediment deposition from the upper basins is not a significant issue in the Vembanad wetlands as shown by the earlier estimates (James et al., 1997). Watershed management programmes implemented in the upper basin areas could be successful in reducing the sediment yield from the basins. Table 5. Median daily flows at the gauging stations of the five major rivers
River basin Station Median flow (m3/s)
10% dependable flow (m3/s)
Achencoil Thumpamon (Q1) 11.29 103.60 Pamba Malakkara (Q2) 49.10 331.90 Manimala Kalluppara (Q3) 13.85 161.50 Meenachil Kidangur (Q4) 15.90 143.90
Muvattupuzha Ramamangalam (Q5)
83.75 349.95
Table 6. Average annual sediment load from the river basins to the wetlands
River Drainage area (km2)
Annual sediment load (tonnes)
Sediment load per unit area (tonnes/
ha) Achencoil 1013.16 94892.11 0.94 Pamba 1705.34 159657.79 0.94 Manimala 793.79 80046.86 1.01 Meenachil 1030.94 50970.84 0.49 Muvattupuzha 1488.52 189495.50 1.27
Total 6031.75 575063.09 0.95 5.4 Water Level Variations The seasonal pattern of the water levels in a wetland is called its hydroperiod, a hydrologic signature which define the rise and fall of the wetlands surface and subsurface water (Mitsch and Gosselink, 1986). Pattern of water level variations is unique to each type of wetland, and its constancy from year to year ensures a reasonable stability for that wetland. The hydroperiod is an integration of all inflows and outflows of water, but it is also influenced by the physical features of terrain and proximity to other bodies of water. The Vembanad wetland is a low lying deltaic region where a part of the land is located below the mean sea level (MSL). Water levels of the wetland is primarily governed by the river discharges from upper drainage basins, semidiurnal tides propagating from the downstream Cochin gut and the operation of the TP flood spillway and TM barrage.
26
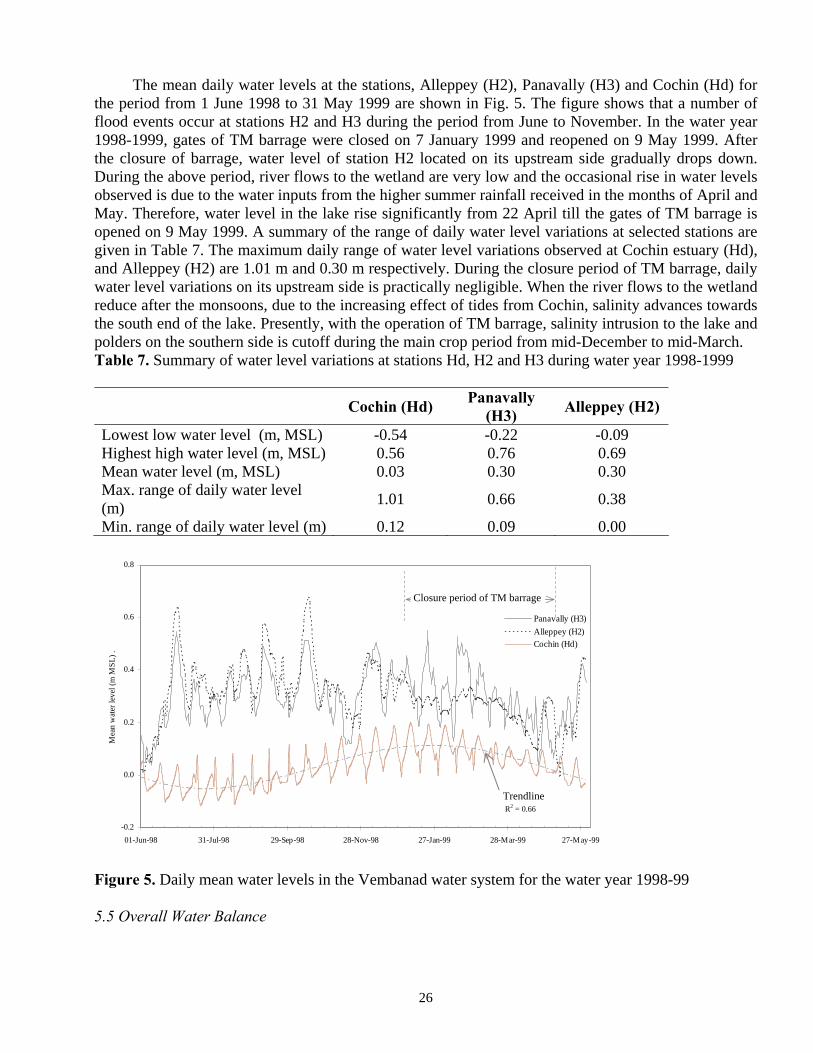
The mean daily water levels at the stations, Alleppey (H2), Panavally (H3) and Cochin (Hd) for the period from 1 June 1998 to 31 May 1999 are shown in Fig. 5. The figure shows that a number of flood events occur at stations H2 and H3 during the period from June to November. In the water year 1998-1999, gates of TM barrage were closed on 7 January 1999 and reopened on 9 May 1999. After the closure of barrage, water level of station H2 located on its upstream side gradually drops down. During the above period, river flows to the wetland are very low and the occasional rise in water levels observed is due to the water inputs from the higher summer rainfall received in the months of April and May. Therefore, water level in the lake rise significantly from 22 April till the gates of TM barrage is opened on 9 May 1999. A summary of the range of daily water level variations at selected stations are given in Table 7. The maximum daily range of water level variations observed at Cochin estuary (Hd), and Alleppey (H2) are 1.01 m and 0.30 m respectively. During the closure period of TM barrage, daily water level variations on its upstream side is practically negligible. When the river flows to the wetland reduce after the monsoons, due to the increasing effect of tides from Cochin, salinity advances towards the south end of the lake. Presently, with the operation of TM barrage, salinity intrusion to the lake and polders on the southern side is cutoff during the main crop period from mid-December to mid-March. Table 7. Summary of water level variations at stations Hd, H2 and H3 during water year 1998-1999
Cochin (Hd) Panavally (H3) Alleppey (H2)
Lowest low water level (m, MSL) -0.54 -0.22 -0.09 Highest high water level (m, MSL) 0.56 0.76 0.69 Mean water level (m, MSL) 0.03 0.30 0.30 Max. range of daily water level (m)
1.01 0.66 0.38
Min. range of daily water level (m) 0.12 0.09 0.00
Figure 5. Daily mean water levels in the Vembanad water system for the water year 1998-99 5.5 Overall Water Balance
R2 = 0.66
-0.2
0.0
0.2
0.4
0.6
0.8
01-Jun-98 31-Jul-98 29-Sep-98 28-Nov-98 27-Jan-99 28-Mar-99 27-May-99
Mea
n w
ater
leve
l (m
MS
L)
.
Panavally (H3)
Alleppey (H2)Cochin (Hd)
Trendline
Closure period of TM barrage
27
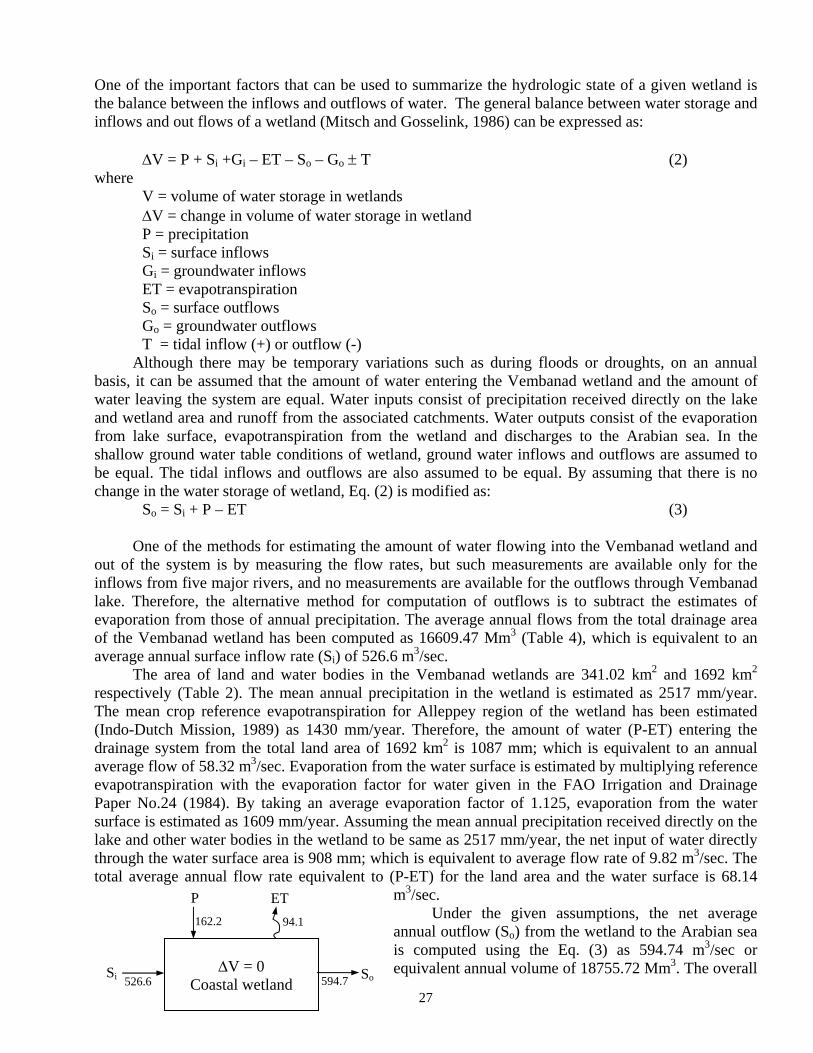
One of the important factors that can be used to summarize the hydrologic state of a given wetland is the balance between the inflows and outflows of water. The general balance between water storage and inflows and out flows of a wetland (Mitsch and Gosselink, 1986) can be expressed as:
ΔV = P + Si +Gi – ET – So – Go ± T (2) where
V = volume of water storage in wetlands ΔV = change in volume of water storage in wetland P = precipitation
Si = surface inflows Gi = groundwater inflows ET = evapotranspiration So = surface outflows Go = groundwater outflows T = tidal inflow (+) or outflow (-)
Although there may be temporary variations such as during floods or droughts, on an annual basis, it can be assumed that the amount of water entering the Vembanad wetland and the amount of water leaving the system are equal. Water inputs consist of precipitation received directly on the lake and wetland area and runoff from the associated catchments. Water outputs consist of the evaporation from lake surface, evapotranspiration from the wetland and discharges to the Arabian sea. In the shallow ground water table conditions of wetland, ground water inflows and outflows are assumed to be equal. The tidal inflows and outflows are also assumed to be equal. By assuming that there is no change in the water storage of wetland, Eq. (2) is modified as:
So = Si + P – ET (3)
One of the methods for estimating the amount of water flowing into the Vembanad wetland and out of the system is by measuring the flow rates, but such measurements are available only for the inflows from five major rivers, and no measurements are available for the outflows through Vembanad lake. Therefore, the alternative method for computation of outflows is to subtract the estimates of evaporation from those of annual precipitation. The average annual flows from the total drainage area of the Vembanad wetland has been computed as 16609.47 Mm3 (Table 4), which is equivalent to an average annual surface inflow rate (Si) of 526.6 m3/sec.
The area of land and water bodies in the Vembanad wetlands are 341.02 km2 and 1692 km2 respectively (Table 2). The mean annual precipitation in the wetland is estimated as 2517 mm/year. The mean crop reference evapotranspiration for Alleppey region of the wetland has been estimated (Indo-Dutch Mission, 1989) as 1430 mm/year. Therefore, the amount of water (P-ET) entering the drainage system from the total land area of 1692 km2 is 1087 mm; which is equivalent to an annual average flow of 58.32 m3/sec. Evaporation from the water surface is estimated by multiplying reference evapotranspiration with the evaporation factor for water given in the FAO Irrigation and Drainage Paper No.24 (1984). By taking an average evaporation factor of 1.125, evaporation from the water surface is estimated as 1609 mm/year. Assuming the mean annual precipitation received directly on the lake and other water bodies in the wetland to be same as 2517 mm/year, the net input of water directly through the water surface area is 908 mm; which is equivalent to average flow rate of 9.82 m3/sec. The total average annual flow rate equivalent to (P-ET) for the land area and the water surface is 68.14
m3/sec. Under the given assumptions, the net average
annual outflow (So) from the wetland to the Arabian sea is computed using the Eq. (3) as 594.74 m3/sec or equivalent annual volume of 18755.72 Mm3. The overall
ΔV = 0
Coastal wetland Si So
P ET
526.6 594.7
162.2 94.1
28
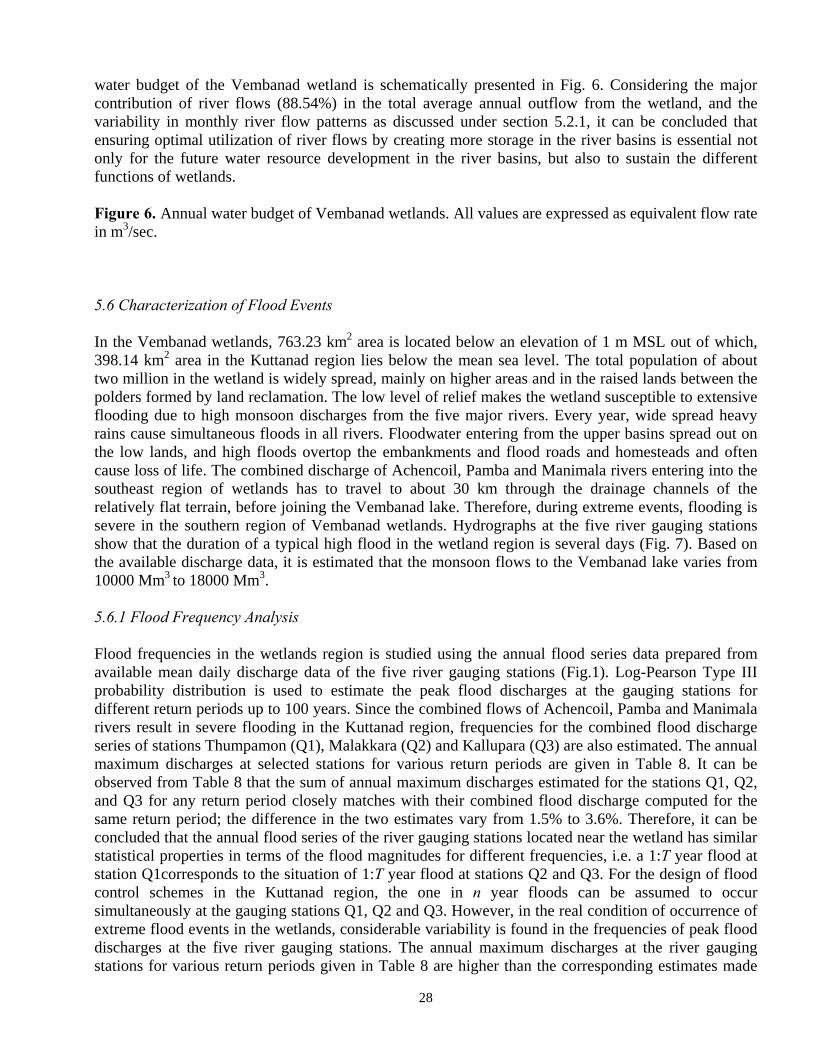
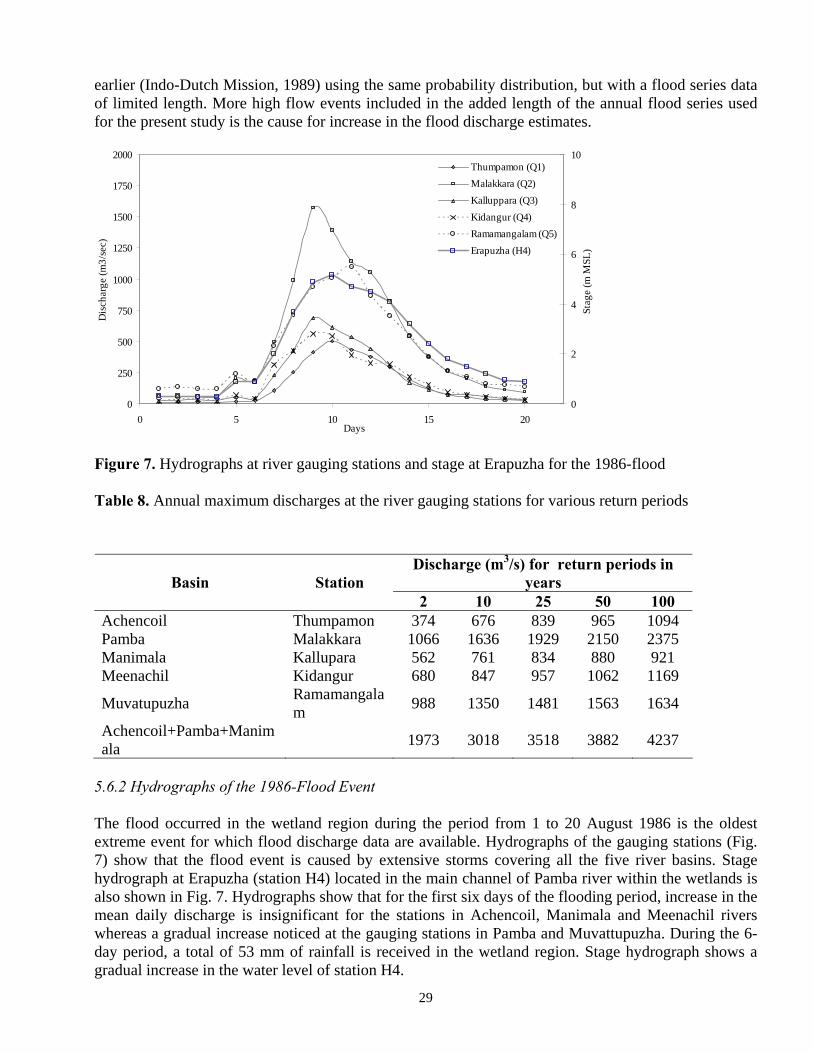
water budget of the Vembanad wetland is schematically presented in Fig. 6. Considering the major contribution of river flows (88.54%) in the total average annual outflow from the wetland, and the variability in monthly river flow patterns as discussed under section 5.2.1, it can be concluded that ensuring optimal utilization of river flows by creating more storage in the river basins is essential not only for the future water resource development in the river basins, but also to sustain the different functions of wetlands. Figure 6. Annual water budget of Vembanad wetlands. All values are expressed as equivalent flow rate in m3/sec. 5.6 Characterization of Flood Events In the Vembanad wetlands, 763.23 km2 area is located below an elevation of 1 m MSL out of which, 398.14 km2 area in the Kuttanad region lies below the mean sea level. The total population of about two million in the wetland is widely spread, mainly on higher areas and in the raised lands between the polders formed by land reclamation. The low level of relief makes the wetland susceptible to extensive flooding due to high monsoon discharges from the five major rivers. Every year, wide spread heavy rains cause simultaneous floods in all rivers. Floodwater entering from the upper basins spread out on the low lands, and high floods overtop the embankments and flood roads and homesteads and often cause loss of life. The combined discharge of Achencoil, Pamba and Manimala rivers entering into the southeast region of wetlands has to travel to about 30 km through the drainage channels of the relatively flat terrain, before joining the Vembanad lake. Therefore, during extreme events, flooding is severe in the southern region of Vembanad wetlands. Hydrographs at the five river gauging stations show that the duration of a typical high flood in the wetland region is several days (Fig. 7). Based on the available discharge data, it is estimated that the monsoon flows to the Vembanad lake varies from 10000 Mm3 to 18000 Mm3. 5.6.1 Flood Frequency Analysis Flood frequencies in the wetlands region is studied using the annual flood series data prepared from available mean daily discharge data of the five river gauging stations (Fig.1). Log-Pearson Type III probability distribution is used to estimate the peak flood discharges at the gauging stations for different return periods up to 100 years. Since the combined flows of Achencoil, Pamba and Manimala rivers result in severe flooding in the Kuttanad region, frequencies for the combined flood discharge series of stations Thumpamon (Q1), Malakkara (Q2) and Kallupara (Q3) are also estimated. The annual maximum discharges at selected stations for various return periods are given in Table 8. It can be observed from Table 8 that the sum of annual maximum discharges estimated for the stations Q1, Q2, and Q3 for any return period closely matches with their combined flood discharge computed for the same return period; the difference in the two estimates vary from 1.5% to 3.6%. Therefore, it can be concluded that the annual flood series of the river gauging stations located near the wetland has similar statistical properties in terms of the flood magnitudes for different frequencies, i.e. a 1:T year flood at station Q1corresponds to the situation of 1:T year flood at stations Q2 and Q3. For the design of flood control schemes in the Kuttanad region, the one in n year floods can be assumed to occur simultaneously at the gauging stations Q1, Q2 and Q3. However, in the real condition of occurrence of extreme flood events in the wetlands, considerable variability is found in the frequencies of peak flood discharges at the five river gauging stations. The annual maximum discharges at the river gauging stations for various return periods given in Table 8 are higher than the corresponding estimates made
29
earlier (Indo-Dutch Mission, 1989) using the same probability distribution, but with a flood series data of limited length. More high flow events included in the added length of the annual flood series used for the present study is the cause for increase in the flood discharge estimates.
0
250
500
750
1000
1250
1500
1750
2000
0 5 10 15 20Days
Dis
char
ge (m
3/se
c)...
0
2
4
6
8
10
Stag
e (m
MSL
)
Thumpamon (Q1)
Malakkara (Q2)
Kalluppara (Q3)
Kidangur (Q4)
Ramamangalam (Q5)
Erapuzha (H4)
Figure 7. Hydrographs at river gauging stations and stage at Erapuzha for the 1986-flood Table 8. Annual maximum discharges at the river gauging stations for various return periods
Discharge (m3/s) for return periods in
years Basin Station 2 10 25 50 100
Achencoil Thumpamon 374 676 839 965 1094 Pamba Malakkara 1066 1636 1929 2150 2375 Manimala Kallupara 562 761 834 880 921 Meenachil Kidangur 680 847 957 1062 1169
Muvatupuzha Ramamangalam
988 1350 1481 1563 1634
Achencoil+Pamba+Manimala
1973 3018 3518 3882 4237
5.6.2 Hydrographs of the 1986-Flood Event The flood occurred in the wetland region during the period from 1 to 20 August 1986 is the oldest extreme event for which flood discharge data are available. Hydrographs of the gauging stations (Fig. 7) show that the flood event is caused by extensive storms covering all the five river basins. Stage hydrograph at Erapuzha (station H4) located in the main channel of Pamba river within the wetlands is also shown in Fig. 7. Hydrographs show that for the first six days of the flooding period, increase in the mean daily discharge is insignificant for the stations in Achencoil, Manimala and Meenachil rivers whereas a gradual increase noticed at the gauging stations in Pamba and Muvattupuzha. During the 6-day period, a total of 53 mm of rainfall is received in the wetland region. Stage hydrograph shows a gradual increase in the water level of station H4.

30
From 7 August, flows increased in all the rivers and the flood peak is reached at Malakkara (Q2), Kalluppara (Q3) and Kidangoor (Q4) on 9 August. The flood peak at Thumpamon (Q1) is found to occur with a lag of one day, compared to the stations Q2, Q3 and Q4; whereas the lag is two days at Ramamangalam (Q5). Elongated shape of the Achencoil basin and larger extent of flat area in Muvattupuzha basin are the probable reasons for the delayed flood peak in these basins. Water level at station H4 also increased significantly from 7 August and a peak level of 5.17 m is reached on 10 August, one day later compared to the occurrence of peak discharge at upstream station Q2 on the same river. Shape and daily rate of rise and recession of hydrographs at stations Q2 and H4 show that the flood in Pamba river is attenuated within the wetlands.
Peak flood discharges and their dates of occurrence at the river gauging stations are given in Table 9. The combined peak flood discharge of stations Q1, Q2 and Q3 for the extreme event is 2854 m3/s, and the combined discharge of the five river gauging stations is 4520 m3/s. The 1986 flood is rated as a 1:4 year flood at station Q1 in Achencoil, a 1:9 year flood at Q2 in Pamba, 1:6 year flood at Q3 in Manimala, a 1-year event at Q4 in Meenachil and a 1:3 year flood at Q5 in Muvattupuzha river. The combined flood discharge of the stations in Achencoil, Pamba and Manimala has a return period of 7 years. Above discussion on the flood hydrographs at the gauging stations located in and around the wetlands for the extreme event in 1986 indicates that, due to the storage availability in the floodplains and the wetlands, river floods in the region are slow rising, and attain peak in a duration of a few days. The wetlands helps to attenuate the flood peaks, but, the very high volume of the river flows received for extended period results in severe inundation in the region depending on the storage conditions and discharge capacity of the lake drainage system.
Table 9. Peak discharges and their dates of occurrence during the flood in 1986
River Basin Station Discharge, m3/sec Date of
occurrence
Achencoil Thumpamon 504.60 August 10, 1986
Pamba Malakkara 1570.20 August 9, 1986
Manimala Kallupara 692.80 August 9, 1986
Meenachil Kidangur 565.00 August 9, 1986
Muvattupuzha Ramamangalam 1101.70 August 11, 1986
31
6. CONCLUSIONS 1. Out of a total average annual river flow of 16609 Mm3 contributed to the Vembanad wetlands,
89.6% of the flows are received during the monsoon season and the remaining 10.4% occurs as base flow during the period from December to May. Among the five major rivers, Achencoil and Muvattupuzha contribute the lowest and highest discharge respectively per unit area of the basins, both during the monsoon and non-monsoon periods. The non-monsoon flows from the Achencoil, Manimala and Meenachil rivers are only 5% of the annual discharges, whereas the corresponding flows from the Pamba and Muvattupuzha rivers are 8.6% and 17.6% respectively.
2. High flow regimes in all the five major rivers are very similar with the higher flows occurring for only a very short period of the year. Low-flow regions of the flow-duration curves characterize the poor ability of Achencoil, Manimala and Meenachil river basins to sustain low flows during the non-monsoon season. Operation of reservoirs existing in the upper area of Pamba and tailrace discharge received by the Muvattupuzha from the Idukki hydroelectric project are the primary reasons for the slightly better low flow regime in these rivers as observed in their flow duration curves and in the unit discharge. Therefore, increasing of reservoir storages in the river basins would be the only sustainable solution to ensure optimal utilization of the river flows draining to the wetlands by bridging the wide seasonal flow variations.
3. Contrary to the earlier reports on excessive sedimentation, the total average annual sediment load entering to the wetland from the upper basins is found to be 0.575 million tonnes, which is equivalent to a unit rate of 0.95 tonnes/ha. The annual sediment load vary from a minimum of 0.49 tonnes/ha for Meenachil basin to a maximum of 1.27 tonnes/ha for the Muvattupuzha basin. Even if the entire volume of the sediments from the rivers are deposited in water bodies of wetlands, annual rate of sediment deposition would be 16.8 tonnes/ha, with an equivalent depth of 0.937 mm. Therefore, sediment deposition from the upper basins is not a significant issue in the wetlands; possibly the positive impact of the watershed management programmes implemented in upper basins.
4. In the Vembanad lake, the maximum daily range of water level variations in a year vary from 1.01 m at Cochin estuary to 0.30 m at Alleppey on the southern end. After the closure of TM barrage, daily range of water level variation is practically negligible on its upstream side and the water level gradually drop down until the barrage is opened again, except for the occasional rise in level due the to the water inputs from summer rainfall.
5. With the assumption that the amount of water entering the wetlands is equal to the amount of water leaving the system, net average annual outflow to the Arabian sea is computed as 594.74 m3/sec. Considering the major contribution (88.54%) of river flows in the net annual outflow from the wetland, and the large seasonal variations in river flows, it is concluded that ensuring optimal utilization of the river flows by creating more storage in the basins is essential not only for the future water resources development in the river basins, but also to sustain the different functions of wetlands.
6. For the gauging stations in all the five rivers draining to the Vembanad wetlands, the annual maximum discharges estimated for various return periods are higher than the estimates made earlier during the KWB Study (1989) with annual flood series of limited length. The flood series of gauging stations in Achencoil, Pamba and Manimala rivers are found to have similar statistical properties in terms of their flood magnitudes for different frequencies, thus indicating that the one in n year floods can be assumed to occur simultaneously at the gauging stations of these rivers for the design of flood control schemes in the upper and lower Kuttanad region. However, in the real situation of occurrence of extreme flood events, considerable variability is observed in the frequencies of the peak flood discharges at the river gauging stations.
32
7. Hydrographs of the river gauging stations for the flood event in August 1986 show that this extreme event is caused by extensive storms covering all the five river basins and the flood peak occurred in duration of about one week. Elongated shape of Achencoil basin and large extent of flat area in Muvattupuzha basin are the probable reasons for the delayed flood peak in these basins compared to the Pamba, Manimala and Meenachil basins. Due to the storage availability in the floodplains and wetlands, river floods in the region are slow rising, and thus allow sufficient time for flood warning and emergency management. The wetlands help to attenuate the floods, but, during extreme events, severity of inundation is decided primarily by the storage availability in the wetland and the conveyance capacity of drainage system.
REFERENCES Balchand, A.N. (1983). Kuttanad: A Case study on environmental consequences of water resources
mismanagement. Water International 8: 35 – 41 Cowardin, L.M., Carter, V., Golet, E.C. and Roe, E.T.H. (1979). Classification of wetlands and deepwater habitats of the
United States, US Fish & Wildlife Service, Pub FWS/OBS-79/31, Washington. FAO (1984). Guidelines for predicting crop water requirements. Irrigation and drainage paper 24,
Food and Agriculture Organization, Rome. Indo-Dutch Mission (1989). Kuttanad water balance study (draft final report), Vol. IV, Government of
Kerala, India. James, E.J., Anitha, A.B., Joseph, E.J., Nandeshwar, M.D., Nirmala, E., Padmini, V., and Unni, P.N.
(1997). Case Study – I Vembanad Kol Wetland system in relation to drainage basin management. In Wetlands and Integrated River Basin Management: Experiences in Asia and Pacific. UNEP/Wetlands International-Asia Pacific, Kuala Lumpur.
Mitsch, W.J., Gosselink, J. (1986). Wetlands, Van Nostrand Reinhold, New York. NEERI (2003). Carrying capacity based developmental planning for Greater Kochi Region. National
Environmental Engineering Research Institute, Nagpur. Patra, K.C (2001). Hydrology and water resources engineering. Narosa Publishing House, New Delhi. Pisharoty, P.R. (1990). Characteristics of Indian rainfall. Monograph, Physical Research Laboratories,
Ahmedabad, India.
33
Theme 2. Water and society, environment: economy, sanitation,
environmental protection, health, public awareness, education
34
Development of SRR Model for CSO estimation in Urban Area
Seong Su Ryu1, Joong Hoon Kim2, Hwan Don Jun3, Soon-Tak Lee 4, Hong Kee Jee 4 1 Department of Environmental System, Korea University, Seoul, Korea 136-713 2 Department of Civil, Environmental and Architectural Engineering, Korea University, Seoul, Korea 136-713 3 Department of Civil Engineering, Hanbat University, Daejeon, Korea 305-719 4 Department of Civil Engineering, Yeungnam University, Gyeungsan-si, Gyeungsangbuk-do, Korea 712-749 ABSTRACT: The long-term outflow simulation method for the estimation of CSOs uses various rainfall-runoff models with observed rainfall data. The most important inputs for the method are rainfall data with a long period. Usually a longer period of rainfall data improves the accuracy of the estimation. However, as the characteristics of rainfall change due to urbanization and climate change, using all the rainfall data including old ones may not reflect the effect of the climate change. On the other hand, using recent data only would increase the level of uncertainty in the results. A Simulated Rainfall-Runoff (SRR) model was developed in this study to solve the problems. This model is consisted of two modules. A rainfall generation module was developed to prepare long-term precipitation data which reflects the recent rainfall characteristics. The other module performs the long-term outflow simulation using the data prepared by the other module. The developed model was applied to a drainage district in Seoul with observed rainfall data of 46 years. Runoff simulations with the data of recent 17 years proved the problem of applying all the data of 46 years. Rainfall data of 100 years were generated based on the data of recent 17 years. The results of this study show that the SRR model can estimate the CSOs considering the effect of the recent climate change while overcoming the uncertainty incurred by using the recent rainfall data only.
INTRODUCTION Combined sewer overflow (CSO) is a main water pollution source in urban area. Therefore, CSO estimation is very important for the design of CSO storage/treatment facilities. Three methods are most frequently used for the determination of design capacity of the facilities. Probabilistic rainfall analysis is used for the design of most hydraulic structures. But, since this method is based on rainfall data of annual maximum series, it is not adequate for the nonpoint source pollutant management. Standard rainfall analysis was proposed to overcome the problem by introducing the inter-event time definition (IETD) concept. This method can estimate the CSO volume per rainfall event in an average value. This method either is not satisfactory since it does not consider the antecedent dry period and it is difficult to represent the various rainfall characteristics with an average event in a country where there are severe seasonal variation in the rainfall characteristics. Long-term outflow simulation method is for a rainfall-runoff analysis for a long period using the observed rainfall data as input. This method uses various programs like SWMM and SWAT, and is known to be accurate and efficient in the estimation of annual runoff and annual pollutant loads.
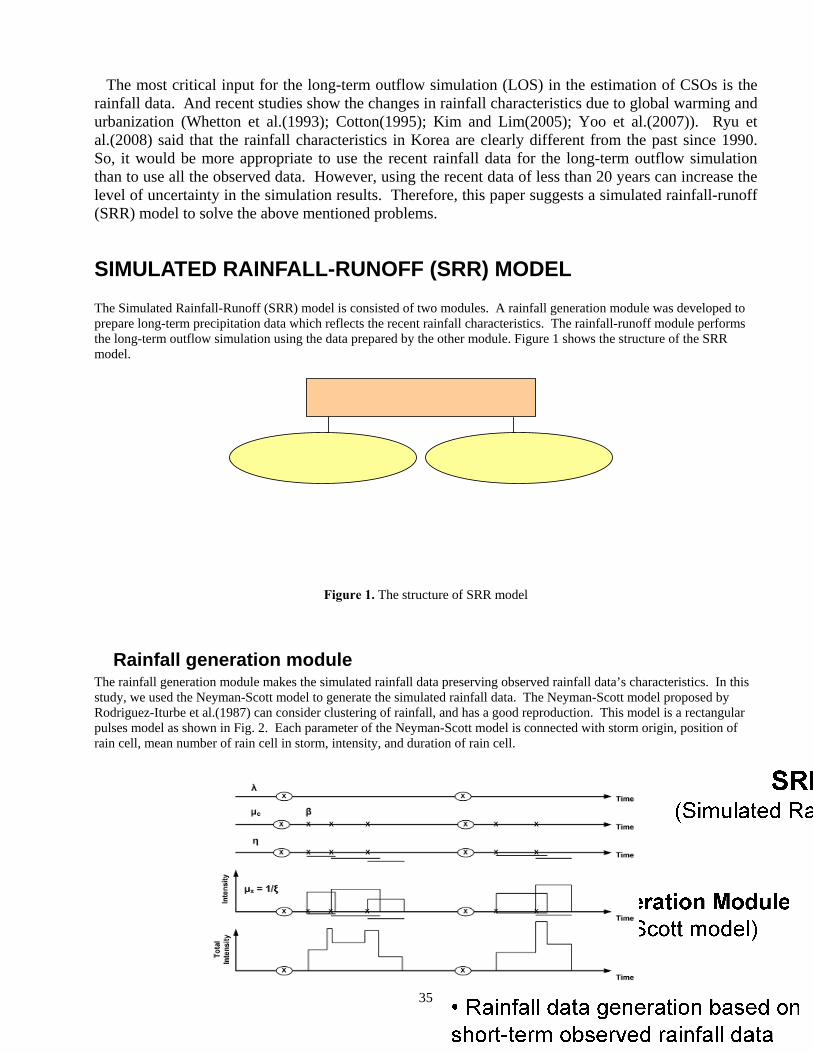
35
The most critical input for the long-term outflow simulation (LOS) in the estimation of CSOs is the rainfall data. And recent studies show the changes in rainfall characteristics due to global warming and urbanization (Whetton et al.(1993); Cotton(1995); Kim and Lim(2005); Yoo et al.(2007)). Ryu et al.(2008) said that the rainfall characteristics in Korea are clearly different from the past since 1990. So, it would be more appropriate to use the recent rainfall data for the long-term outflow simulation than to use all the observed data. However, using the recent data of less than 20 years can increase the level of uncertainty in the simulation results. Therefore, this paper suggests a simulated rainfall-runoff (SRR) model to solve the above mentioned problems.
SIMULATED RAINFALL-RUNOFF (SRR) MODEL The Simulated Rainfall-Runoff (SRR) model is consisted of two modules. A rainfall generation module was developed to prepare long-term precipitation data which reflects the recent rainfall characteristics. The rainfall-runoff module performs the long-term outflow simulation using the data prepared by the other module. Figure 1 shows the structure of the SRR model.
Figure 1. The structure of SRR model
Rainfall generation module The rainfall generation module makes the simulated rainfall data preserving observed rainfall data’s characteristics. In this study, we used the Neyman-Scott model to generate the simulated rainfall data. The Neyman-Scott model proposed by Rodriguez-Iturbe et al.(1987) can consider clustering of rainfall, and has a good reproduction. This model is a rectangular pulses model as shown in Fig. 2. Each parameter of the Neyman-Scott model is connected with storm origin, position of rain cell, mean number of rain cell in storm, intensity, and duration of rain cell.
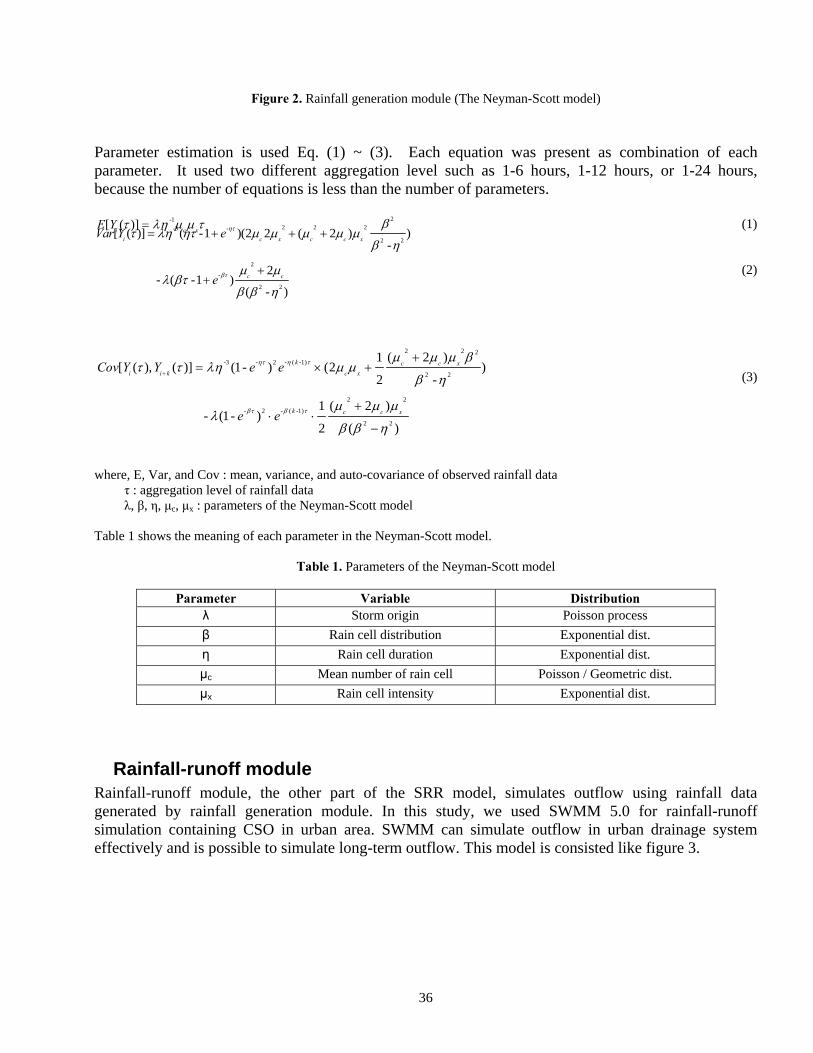
36
Figure 2. Rainfall generation module (The Neyman-Scott model)
Parameter estimation is used Eq. (1) ~ (3). Each equation was present as combination of each parameter. It used two different aggregation level such as 1-6 hours, 1-12 hours, or 1-24 hours, because the number of equations is less than the number of parameters.
(1)
(2)
(3)
where, E, Var, and Cov : mean, variance, and auto-covariance of observed rainfall data
τ : aggregation level of rainfall data λ, β, η, μc, μx : parameters of the Neyman-Scott model
Table 1 shows the meaning of each parameter in the Neyman-Scott model.
Table 1. Parameters of the Neyman-Scott model
Parameter Variable Distribution λ Storm origin Poisson process
β Rain cell distribution Exponential dist.
η Rain cell duration Exponential dist.
μc Mean number of rain cell Poisson / Geometric dist.
μx Rain cell intensity Exponential dist.
Rainfall-runoff module Rainfall-runoff module, the other part of the SRR model, simulates outflow using rainfall data generated by rainfall generation module. In this study, we used SWMM 5.0 for rainfall-runoff simulation containing CSO in urban area. SWMM can simulate outflow in urban drainage system effectively and is possible to simulate long-term outflow. This model is consisted like figure 3.
-1[ ( )]i c xE Y τ λη μ μ τ= 22 2 2-3 -
2 2
2
-
2 2
[ ( )] ( -1 )(2 2 ( 2 ) ) -
2 - ( -1 )
( - )
i c x c c x
c c
Var Y e
e
ητ
βτ
βτ λη ητ μ μ μ μ μ
β η
μ μλ βτ
β β η
= + + +
++
2 2 2
-3 - 2 - ( -1)
2 2
2 2
- 2 - ( -1)
2 2
1 ( 2 )[ ( ), ( )] (1- ) (2 )
2 -
1 ( 2 ) - (1- )
2 ( )
k c c xi i k c x
k c c x
Cov Y Y e e
e e
ητ η τ
βτ β τ
μ μ μ βτ τ λη μ μ
β η
μ μ μλ
β β η
+
+= × +
+⋅ ⋅
−

37
Figure 3. Structure of SWMM
APPLICATION The existing LOS method using observed rainfall data and the SRR model proposed by this research were applied to a drainage area, and the results using the SRR model were compared with results using LOS method.
Target area H drainage district, in northeastern region of Seoul, is a high density residential area that is consisted of apartments and stores as seen in left side of Fig. 4. Area of H drainage district is 161ha. The right side of Fig. 4 presents a schematic diagram of the pipe network in the area.
Figure 4. The target area
Rainfall data There are two kinds of rainfall data to simulate outflow. First one is long-term and short-term observed rainfall data as input for the existing LOS method. The observed rainfall data was separated by the year 1990 like in Ryu et al.(2008). Therefore, the long-term rainfall data is for 46 years (1961-2006), and the short-term rainfall data is for 17 years (1990-2006). The mean rainfall depth of the short-term data is bigger than the long-term data by about 120 mm. Table 2 shows the rainfall data applied in this study.
Table 2. Applied rainfall data
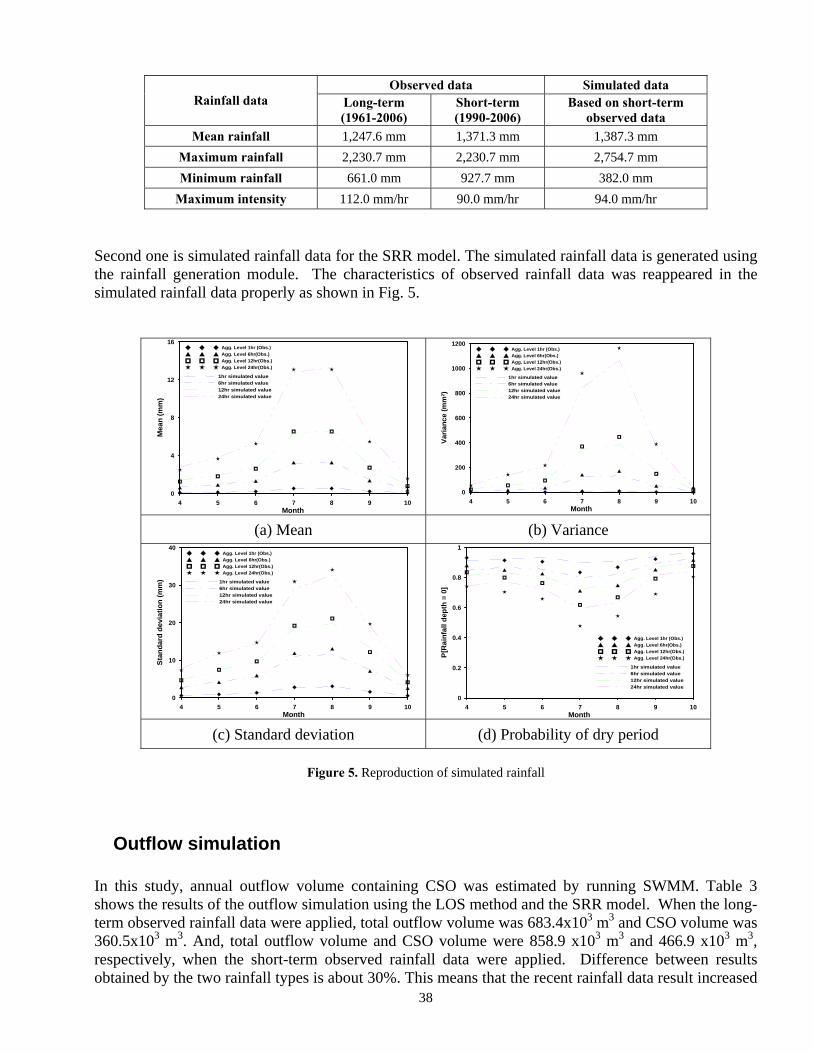
38
Observed data Simulated data Rainfall data Long-term
(1961-2006) Short-term (1990-2006)
Based on short-term observed data
Mean rainfall 1,247.6 mm 1,371.3 mm 1,387.3 mm
Maximum rainfall 2,230.7 mm 2,230.7 mm 2,754.7 mm
Minimum rainfall 661.0 mm 927.7 mm 382.0 mm
Maximum intensity 112.0 mm/hr 90.0 mm/hr 94.0 mm/hr
Second one is simulated rainfall data for the SRR model. The simulated rainfall data is generated using the rainfall generation module. The characteristics of observed rainfall data was reappeared in the simulated rainfall data properly as shown in Fig. 5.
4 5 6 7 8 9 10Month
0
4
8
12
16
Mea
n (
mm
)
Agg. Level 1hr (Obs.)Agg. Level 6hr(Obs.)Agg. Level 12hr(Obs.)Agg. Level 24hr(Obs.)
1hr simulated value6hr simulated value12hr simulated value24hr simulated value
4 5 6 7 8 9 10
Month
0
200
400
600
800
1000
1200
Var
ian
ce (
mm
2 )
Agg. Level 1hr (Obs.)Agg. Level 6hr(Obs.)Agg. Level 12hr(Obs.)Agg. Level 24hr(Obs.)
1hr simulated value6hr simulated value12hr simulated value24hr simulated value
(a) Mean (b) Variance
4 5 6 7 8 9 10Month
0
10
20
30
40
Sta
nd
ard
dev
iati
on
(m
m)
Agg. Level 1hr (Obs.)Agg. Level 6hr(Obs.)Agg. Level 12hr(Obs.)Agg. Level 24hr(Obs.)
1hr simulated value6hr simulated value12hr simulated value24hr simulated value
4 5 6 7 8 9 10
Month
0
0.2
0.4
0.6
0.8
1
P[R
ain
fall
dep
th =
0]
Agg. Level 1hr (Obs.)Agg. Level 6hr(Obs.)Agg. Level 12hr(Obs.)Agg. Level 24hr(Obs.)
1hr simulated value6hr simulated value12hr simulated value24hr simulated value
(c) Standard deviation (d) Probability of dry period
Figure 5. Reproduction of simulated rainfall
Outflow simulation In this study, annual outflow volume containing CSO was estimated by running SWMM. Table 3 shows the results of the outflow simulation using the LOS method and the SRR model. When the long-term observed rainfall data were applied, total outflow volume was 683.4x10³ m3 and CSO volume was 360.5x10³ m3. And, total outflow volume and CSO volume were 858.9 x10³ m3 and 466.9 x10³ m3, respectively, when the short-term observed rainfall data were applied. Difference between results obtained by the two rainfall types is about 30%. This means that the recent rainfall data result increased
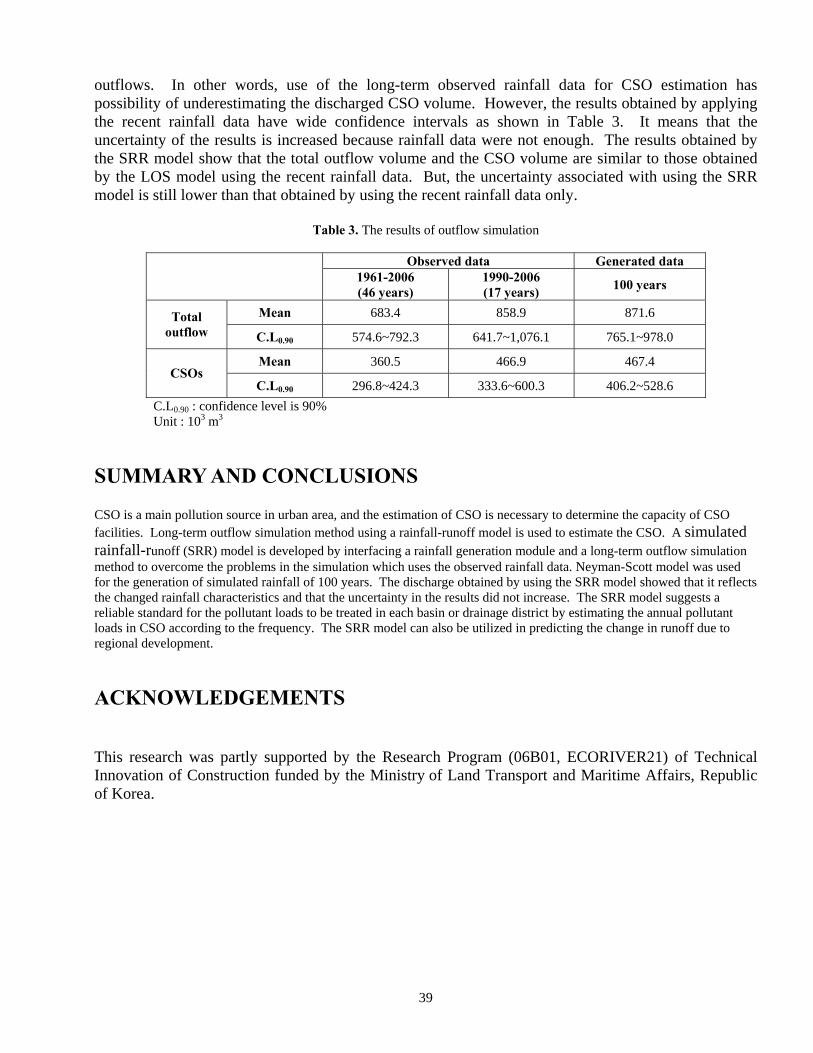
39
outflows. In other words, use of the long-term observed rainfall data for CSO estimation has possibility of underestimating the discharged CSO volume. However, the results obtained by applying the recent rainfall data have wide confidence intervals as shown in Table 3. It means that the uncertainty of the results is increased because rainfall data were not enough. The results obtained by the SRR model show that the total outflow volume and the CSO volume are similar to those obtained by the LOS model using the recent rainfall data. But, the uncertainty associated with using the SRR model is still lower than that obtained by using the recent rainfall data only.
Table 3. The results of outflow simulation
Observed data Generated data 1961-2006
(46 years) 1990-2006 (17 years) 100 years
Mean 683.4 858.9 871.6 Total outflow C.L0.90 574.6~792.3 641.7~1,076.1 765.1~978.0
Mean 360.5 466.9 467.4 CSOs
C.L0.90 296.8~424.3 333.6~600.3 406.2~528.6
C.L0.90 : confidence level is 90% Unit : 103 m3
SUMMARY AND CONCLUSIONS CSO is a main pollution source in urban area, and the estimation of CSO is necessary to determine the capacity of CSO facilities. Long-term outflow simulation method using a rainfall-runoff model is used to estimate the CSO. A simulated rainfall-runoff (SRR) model is developed by interfacing a rainfall generation module and a long-term outflow simulation method to overcome the problems in the simulation which uses the observed rainfall data. Neyman-Scott model was used for the generation of simulated rainfall of 100 years. The discharge obtained by using the SRR model showed that it reflects the changed rainfall characteristics and that the uncertainty in the results did not increase. The SRR model suggests a reliable standard for the pollutant loads to be treated in each basin or drainage district by estimating the annual pollutant loads in CSO according to the frequency. The SRR model can also be utilized in predicting the change in runoff due to regional development.
ACKNOWLEDGEMENTS
This research was partly supported by the Research Program (06B01, ECORIVER21) of Technical Innovation of Construction funded by the Ministry of Land Transport and Maritime Affairs, Republic of Korea.
40
REFERENCES Cotton, W. R. (1995). Human impacts on weather and climate, Cambridge University Press Rodriguez-Iturbe, I., Cox, D. R., and Isham, V. (1987). Some models for rainfall based on stochastic point processes, Proc.
R. Soc. Lond. A, 410(1839), pp.269-288 Whetton, P. H., Fowler, A. M., Haylock, M. R., and Pittock, A. B. (1993). Implications of climate change due to the
enhanced greenhouse effect of floods and droughts in Australia, Climate Change, 25, pp.289-317 Kim, G. S. and Lim, T. G. (2005). Assessment of characteristics of regional climate change : Urban effect or environmental
change, 2005 Annual proceeding of KWRA, KWRA, pp.912-915 Yoo, C. S., Kim, D. H., Park, S. H., Kim, B. S., and Park, C. Y. (2007). Intervention analysis of urbanization effect on
rainfall data at the Seoul rain gauge station, KWRA, 40(8), pp.629-641 Ryu, S. S., Jun, H. D., Ryu, G. H., Oh, J. A., and Kim, J. H. (2008). A study of the change of rainfall characteristics according to climate change and urbanization, 2008 Annual proceeding of KWRA, KWRA, pp.
41
Ecological Compensation Modes and Policies of Water Source Area HUANG Chang-shuo, Liu Heng, GENG Lei-hua, WANG Shu-yun
(State Key Laboratory of Hydrology Water Resources and Hydraulic Engineering, Nanjing Hydraulic Research Institute,
Nanjing 210029, China)
Abstract: In order to protect the eco-environment of water source area and prompt the sustainable development of regional economic and society, ecological compensation system is one of important policies and measures. The connotation of ecological compensation is defined. The relationship of ecological profit and loss in water source area is analyzed from the aspects of ecological cost and benefit. According to the practical situation of water source area, ecological compensation modes and measures are proposed. The collection of compensation funds in China at present is discussed. The policy suggestions of ecological compensation are put forward in the respects of finance, tax, industry, management, awareness and technology. Key word: water source area, ecological compensation, mode, policy
At present, the problem of water resources shortage and source water quality degradation in the global range is becoming more and more serious. The exploitation and utilization of water resources in the water source area (WSA), affect the social economic development of the whole basin. The influence scope can be more extensive and far-reaching. The lasting impact of the economic activities of human beings has changed the dynamic equilibrium of WSA, making its normal ecological service function reducing even losing. Therefore, feasible and effective ecological compensation mechanism of WSA needs to be established urgently, so as to comprehensively ensure the security of ecological environment and natural resources in WSA from the respects of legislation, policy and technology.
1 CONNATION OF ECOLOGICAL COMPENSATION OF WSA
WSA is one of the important areas that are responsible for ecological security. Water source protection zone system is set up in Water Law and its legal obligation is defined (prohibitive regulations to prevent the water source from pollution). To a certain extent, this reflects the “agreement justice” relationship between human beings and ecosystem and can be interpreted as the meaning of “ecological compensation” (Wu, 2007). The analysis of ecological compensation connation is far above the level of ecosystem recovery or rehabilitation. The benefits compensation to the interests’ sufferers should be more emphasized, which facilitates arousing the enthusiasm of ecological environmentalists in WSA and promotes the protection of water source.
The connation of ecological compensation in WSA can be summarized as following: Through the implementation of certain policy or legal means, internalized the externality of the ecological protection in WSA, make the “beneficiaries” of the ecological protection achievement pay the corresponding expenses� solve the “hitchhike” phenomenon by mechanism design when consuming the special public article --- ecological environment, encourage the enough offering of this “public article”, strive for rational repayment to ecological investors by system innovation, motivate people inside and outside the WSA to be engaged in the ecological protection and increase the value of ecological capital.
Two levels of meaning in details: First, protection compensation, that is to set up the protection zone including the water area and the surrounding land area where the water source locates, carry on the protective and restoring input to the eco-environment in the protection zone, such as the input of sewage treatment facilities and clean sanitary facilities. Second, development compensation, refers to the compensation to the scarified development rights of the protection zone, including the compensation to the reducing local financial revenue, the producing loss of enterprises and peasants and the loss of immigrants, etc (Lang, 2008).
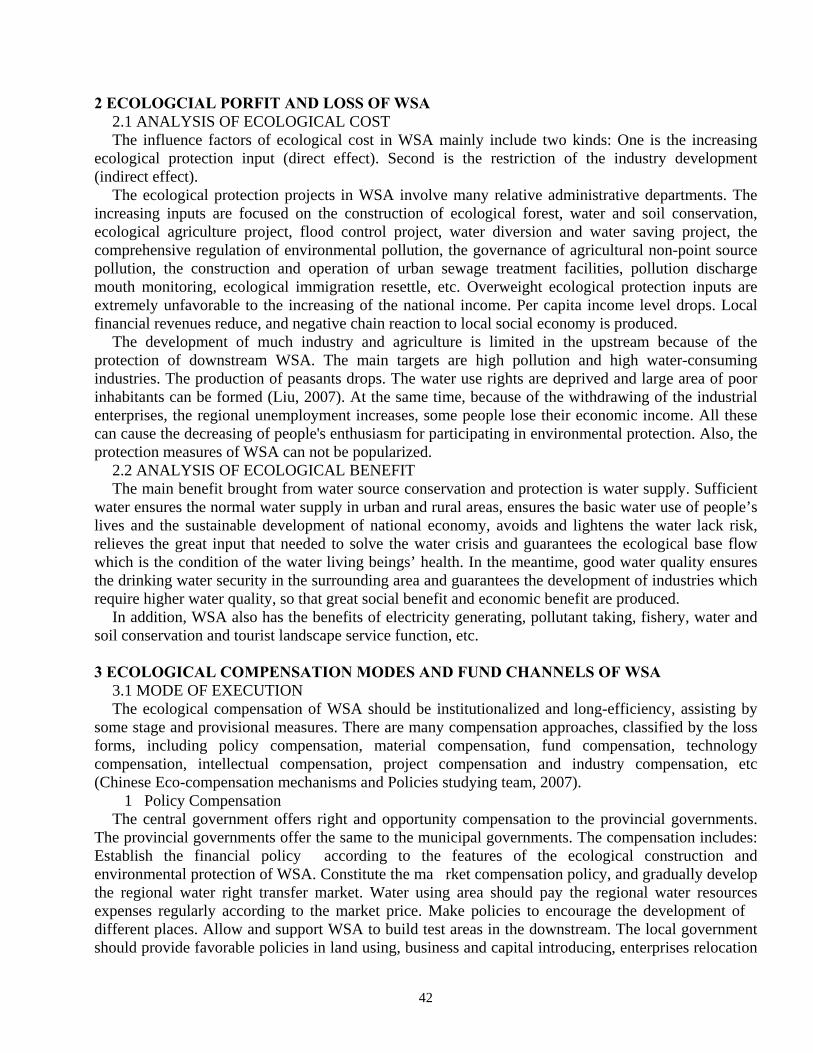
42
2 ECOLOGCIAL PORFIT AND LOSS OF WSA
2.1 ANALYSIS OF ECOLOGICAL COST The influence factors of ecological cost in WSA mainly include two kinds: One is the increasing
ecological protection input (direct effect). Second is the restriction of the industry development (indirect effect).
The ecological protection projects in WSA involve many relative administrative departments. The increasing inputs are focused on the construction of ecological forest, water and soil conservation, ecological agriculture project, flood control project, water diversion and water saving project, the comprehensive regulation of environmental pollution, the governance of agricultural non-point source pollution, the construction and operation of urban sewage treatment facilities, pollution discharge mouth monitoring, ecological immigration resettle, etc. Overweight ecological protection inputs are extremely unfavorable to the increasing of the national income. Per capita income level drops. Local financial revenues reduce, and negative chain reaction to local social economy is produced.
The development of much industry and agriculture is limited in the upstream because of the protection of downstream WSA. The main targets are high pollution and high water-consuming industries. The production of peasants drops. The water use rights are deprived and large area of poor inhabitants can be formed (Liu, 2007). At the same time, because of the withdrawing of the industrial enterprises, the regional unemployment increases, some people lose their economic income. All these can cause the decreasing of people's enthusiasm for participating in environmental protection. Also, the protection measures of WSA can not be popularized.
2.2 ANALYSIS OF ECOLOGICAL BENEFIT The main benefit brought from water source conservation and protection is water supply. Sufficient
water ensures the normal water supply in urban and rural areas, ensures the basic water use of people’s lives and the sustainable development of national economy, avoids and lightens the water lack risk, relieves the great input that needed to solve the water crisis and guarantees the ecological base flow which is the condition of the water living beings’ health. In the meantime, good water quality ensures the drinking water security in the surrounding area and guarantees the development of industries which require higher water quality, so that great social benefit and economic benefit are produced.
In addition, WSA also has the benefits of electricity generating, pollutant taking, fishery, water and soil conservation and tourist landscape service function, etc.
3 ECOLOGICAL COMPENSATION MODES AND FUND CHANNELS OF WSA
3.1 MODE OF EXECUTION The ecological compensation of WSA should be institutionalized and long-efficiency, assisting by
some stage and provisional measures. There are many compensation approaches, classified by the loss forms, including policy compensation, material compensation, fund compensation, technology compensation, intellectual compensation, project compensation and industry compensation, etc (Chinese Eco-compensation mechanisms and Policies studying team, 2007).
� 1� Policy Compensation The central government offers right and opportunity compensation to the provincial governments.
The provincial governments offer the same to the municipal governments. The compensation includes: �Establish the financial policy according to the features of the ecological construction and environmental protection of WSA. �Constitute the ma rket compensation policy, and gradually develop the regional water right transfer market. Water using area should pay the regional water resources expenses regularly according to the market price. �Make policies to encourage the development of different places. Allow and support WSA to build test areas in the downstream. The local government should provide favorable policies in land using, business and capital introducing, enterprises relocation
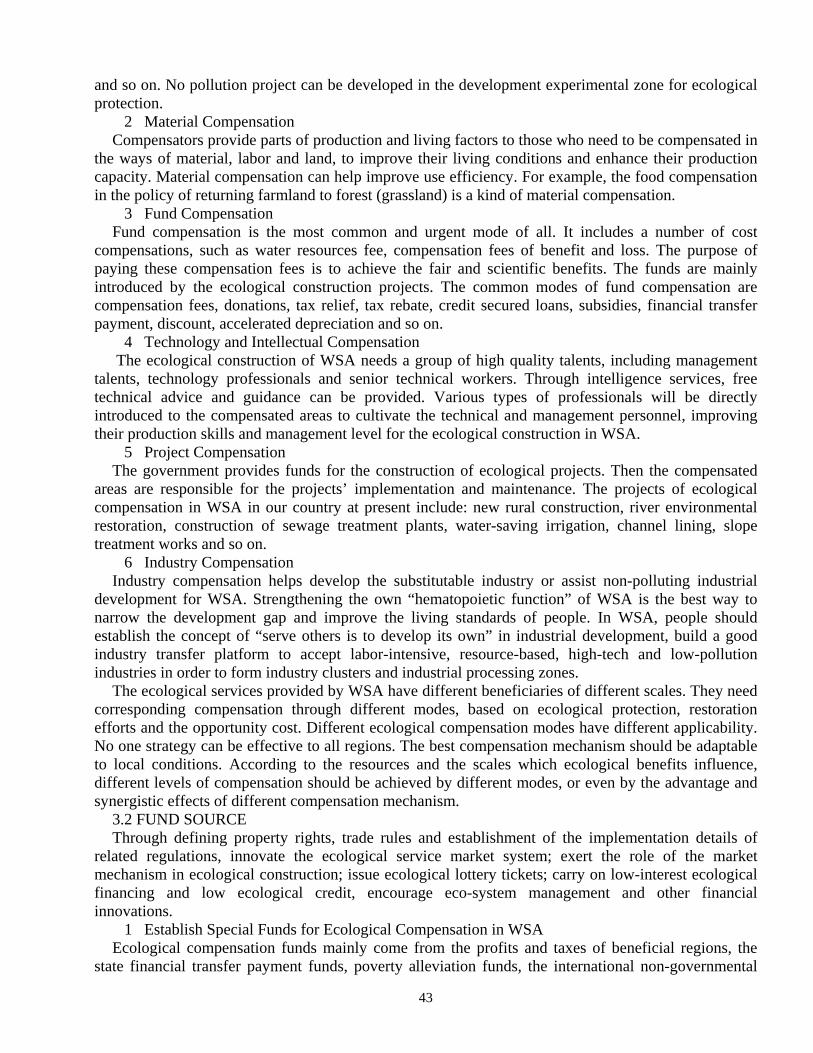
43
and so on. No pollution project can be developed in the development experimental zone for ecological protection.
� 2� Material Compensation Compensators provide parts of production and living factors to those who need to be compensated in
the ways of material, labor and land, to improve their living conditions and enhance their production capacity. Material compensation can help improve use efficiency. For example, the food compensation in the policy of returning farmland to forest (grassland) is a kind of material compensation.
� 3� Fund Compensation Fund compensation is the most common and urgent mode of all. It includes a number of cost
compensations, such as water resources fee, compensation fees of benefit and loss. The purpose of paying these compensation fees is to achieve the fair and scientific benefits. The funds are mainly introduced by the ecological construction projects. The common modes of fund compensation are compensation fees, donations, tax relief, tax rebate, credit secured loans, subsidies, financial transfer payment, discount, accelerated depreciation and so on.
� 4� Technology and Intellectual Compensation The ecological construction of WSA needs a group of high quality talents, including management
talents, technology professionals and senior technical workers. Through intelligence services, free technical advice and guidance can be provided. Various types of professionals will be directly introduced to the compensated areas to cultivate the technical and management personnel, improving their production skills and management level for the ecological construction in WSA.
� 5� Project Compensation The government provides funds for the construction of ecological projects. Then the compensated
areas are responsible for the projects’ implementation and maintenance. The projects of ecological compensation in WSA in our country at present include: new rural construction, river environmental restoration, construction of sewage treatment plants, water-saving irrigation, channel lining, slope treatment works and so on.
� 6� Industry Compensation Industry compensation helps develop the substitutable industry or assist non-polluting industrial
development for WSA. Strengthening the own “hematopoietic function” of WSA is the best way to narrow the development gap and improve the living standards of people. In WSA, people should establish the concept of “serve others is to develop its own” in industrial development, build a good industry transfer platform to accept labor-intensive, resource-based, high-tech and low-pollution industries in order to form industry clusters and industrial processing zones.
The ecological services provided by WSA have different beneficiaries of different scales. They need corresponding compensation through different modes, based on ecological protection, restoration efforts and the opportunity cost. Different ecological compensation modes have different applicability. No one strategy can be effective to all regions. The best compensation mechanism should be adaptable to local conditions. According to the resources and the scales which ecological benefits influence, different levels of compensation should be achieved by different modes, or even by the advantage and synergistic effects of different compensation mechanism.
3.2 FUND SOURCE Through defining property rights, trade rules and establishment of the implementation details of
related regulations, innovate the ecological service market system; exert the role of the market mechanism in ecological construction; issue ecological lottery tickets; carry on low-interest ecological financing and low ecological credit, encourage eco-system management and other financial innovations.
� 1� Establish Special Funds for Ecological Compensation in WSA Ecological compensation funds mainly come from the profits and taxes of beneficial regions, the
state financial transfer payment funds, poverty alleviation funds, the international non-governmental
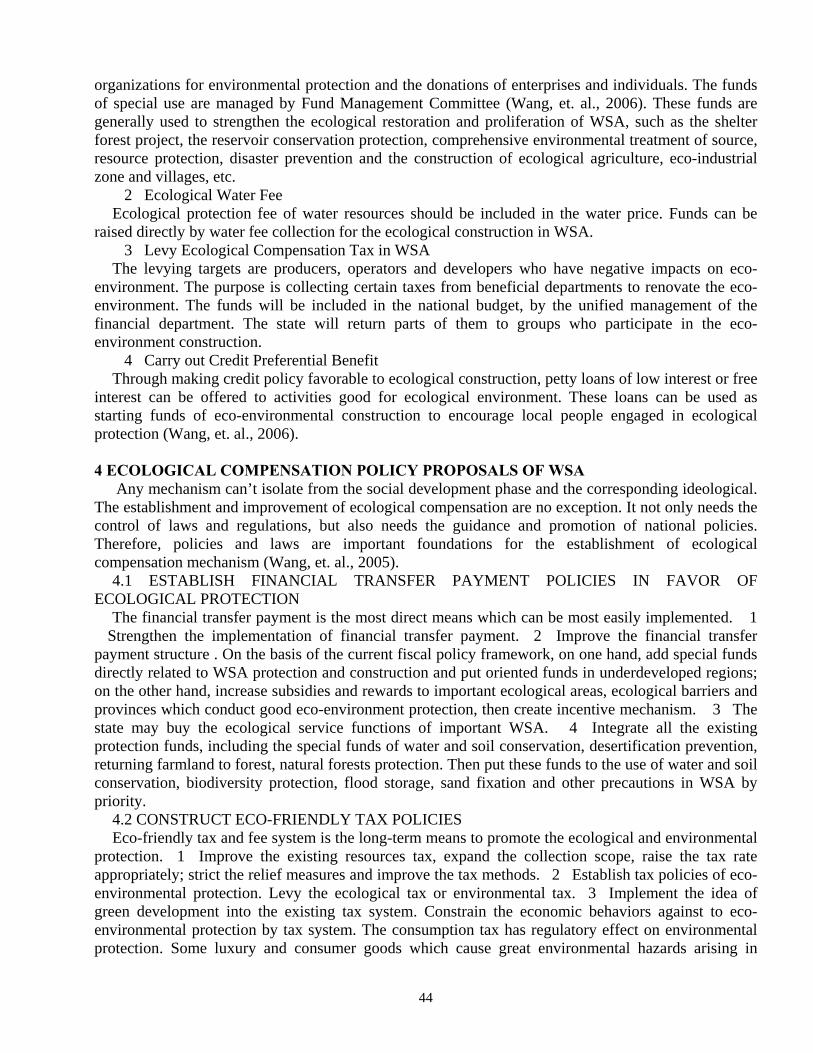
44
organizations for environmental protection and the donations of enterprises and individuals. The funds of special use are managed by Fund Management Committee (Wang, et. al., 2006). These funds are generally used to strengthen the ecological restoration and proliferation of WSA, such as the shelter forest project, the reservoir conservation protection, comprehensive environmental treatment of source, resource protection, disaster prevention and the construction of ecological agriculture, eco-industrial zone and villages, etc.
� 2� Ecological Water Fee Ecological protection fee of water resources should be included in the water price. Funds can be
raised directly by water fee collection for the ecological construction in WSA. � 3� Levy Ecological Compensation Tax in WSA The levying targets are producers, operators and developers who have negative impacts on eco-
environment. The purpose is collecting certain taxes from beneficial departments to renovate the eco-environment. The funds will be included in the national budget, by the unified management of the financial department. The state will return parts of them to groups who participate in the eco-environment construction.
� 4� Carry out Credit Preferential Benefit Through making credit policy favorable to ecological construction, petty loans of low interest or free
interest can be offered to activities good for ecological environment. These loans can be used as starting funds of eco-environmental construction to encourage local people engaged in ecological protection (Wang, et. al., 2006).
4 ECOLOGICAL COMPENSATION POLICY PROPOSALS OF WSA
Any mechanism can’t isolate from the social development phase and the corresponding ideological. The establishment and improvement of ecological compensation are no exception. It not only needs the control of laws and regulations, but also needs the guidance and promotion of national policies. Therefore, policies and laws are important foundations for the establishment of ecological compensation mechanism (Wang, et. al., 2005).
4.1 ESTABLISH FINANCIAL TRANSFER PAYMENT POLICIES IN FAVOR OF ECOLOGICAL PROTECTION
The financial transfer payment is the most direct means which can be most easily implemented. � 1� Strengthen the implementation of financial transfer payment.� 2 � Improve the financial transfer payment structure . On the basis of the current fiscal policy framework, on one hand, add special funds directly related to WSA protection and construction and put oriented funds in underdeveloped regions; on the other hand, increase subsidies and rewards to important ecological areas, ecological barriers and provinces which conduct good eco-environment protection, then create incentive mechanism. � 3� The state may buy the ecological service functions of important WSA. � 4 � Integrate all the existing protection funds, including the special funds of water and soil conservation, desertification prevention, returning farmland to forest, natural forests protection. Then put these funds to the use of water and soil conservation, biodiversity protection, flood storage, sand fixation and other precautions in WSA by priority.
4.2 CONSTRUCT ECO-FRIENDLY TAX POLICIES Eco-friendly tax and fee system is the long-term means to promote the ecological and environmental
protection.� 1� Improve the existing resources tax, expand the collection scope, raise the tax rate appropriately; strict the relief measures and improve the tax methods.� 2� Establish tax policies of eco-environmental protection. Levy the ecological tax or environmental tax.� 3� Implement the idea of green development into the existing tax system. Constrain the economic behaviors against to eco-environmental protection by tax system. The consumption tax has regulatory effect on environmental protection. Some luxury and consumer goods which cause great environmental hazards arising in
45
recent years will be included in the taxes scope (Chinese Eco-compensation mechanisms and Policies studying team, 2007).
4.3 SET UP RELEVANT INDUSTRIES SUPPORTING POLICIES In most cases, developed areas compensate to the less developed areas in order to put an end to the
economic developing mode at the cost of the ecological destruction of WSA and to achieve the optimization of the overall eco-environment (Ge, et. al., 2006). Therefore, supporting policies of related industries should be set up so as to help the less developed regions jump out of the vicious cycle. Analyzing the financial situation of WSA, strengthening the capacity of local development, cultivating eco-industrial system and healthy industry-basin chain, clearing the obligations and rights are all useful to the funds raising of ecological construction.
4.4 ESTABLISH FAVORABLE IMMIGRATION AND EMPLOYMENT POLICIES In order to protect the eco-environment of WSA, the state carries out eco-migration in economic
ways. The people in protected areas are sent to other places and their origin life is broken. The state should implement poverty alleviation and remote places development. Conducive immigration and employment policies should be established. In the process of economic system transformation, the state should strengthen anti-poverty policies and increase employment opportunities for immigrants. As to some of the immigrants whose financial foundation are weak and self-sufficiency capacities are not enough, the state should increase subsidies to create more convenient conditions.
4.5 CONSTRUCT HIGH-EFFICIENT MANAGEMENT ORGANIZATIONS Encourage constructing cross-branch and inter-regional water management framework. Management
committee is suggested to be composed by the departments of water resources, land management, fisheries, agriculture and forestry, environmental protection, urban development and communications. But the responsibility, power and interests of all departments must be clear. Then establish integrated management system which contains industrial development, ecological management, shipping, flood control, power generation, regional planning and compensation. The system can conduct micro control to eco-management and ecological compensation in WSA. The department should cooperate and coordinate between each other. Provinces and regions should have dialogue with each other to increase the intensity, transparency and fairness of management.
4.6 STRENGTHEN COORDINATION AND INCREASE AWARENESS � 1� Enhance People's Awareness of Participating in Eco-compensation Ecological compensation should be supported and cared by the whole society. Society must pay
attention to popular science education and public education to improve people's awareness of ecological compensation, and establish the concept of “to protect ecology is to develop productive forces”. The ecological compensation policies and the distribution of responsibilities, power and profits should be clearly understood, so that the public will participate in the ecological protection and construction actively. Meanwhile, special training should be given to the administrative staff in order to improve the efficiency and capacity of protection.
� 2� Establish Ecological Compensation Incentive Mechanism to Encourage Private Capital to Participate in the Ecological Construction of WSA
The enterprises’ existing is to make profit. The behaviors to protect and restore eco-environment will become more active and positive under benefit driven. Therefore, the rights of using water resources can be given priority to those enterprises which are devoted to ecological restoration. Encourage enterprises or individuals to actively participate in water source protection in order to broaden the market financing channel of ecological compensation.
4.7 TECHNOLIGY POLICIES Technology policy contains five aspects for preliminary consideration:� 1� Establish support policy
aiming at water function area and specific major function area;� 2� Set up inter-regional coordination mechanism to achieve co-construction and sharing;� 3� Develop the scheme of water allocation rights and emission permits allocation rights;� 4� Construct trinity assessment mechanism of water, water
46
quality and sediment;� 5� perfect the auxiliary system including the water resource fee, pollution discharge fee, water and soil conservation compensation expenses; Improve the water price mechanism.
5 CONCLUSIONS AND PROSPECT
� 1� Ecological compensation is the compensable use of eco-environmental resources. Ecological compensation can effectively improve the use value of ecological resources, promote people to reduce the ecological cost in production and life and solve the fund shortage problem in eco-environmental protection activities at present. In the security guarantee work of WSA, in order to avoid the unfair allocation of ecological benefits and relatively economic benefits among protectors and beneficiaries, destroyers and victims, ecological compensation system should be established, so as to maintain the social justice, coordinate regional development and promote the sustainable development of economic, society and environment in the compensated area.
� 2 � The paper only focused on the ecological compensation connation, modes and policy suggestions of WSA. The future direction of research is to quantitively calculate the ecological value amount and ecological service cost, propose the methods and principles of ecological compensation standard� establish the calculation model of compensation standard and form a whole set of ecological compensation system of WSA, which can provide decision basis for relative administrative departments.
REFERENCES: Wu Liqiang(2007). The Research on Ecological Compensation in Water Source Conservation Area---Taking
Dahuofang Reservoir in Suzihe Basin as an Example. Thesis of Master’s Degree of Shenyang agriculture University.
Lang Lixian (2008). The Legal Research on Eco-compensation in Areas of Drinking Water Sources --- Taking the Reservoir in Miyun County of Beijing for Example. Thesis of Master’s Degree of Hohai University.
Liu Yulong(2007). Eco-compensation and rehabilitation-cost burdening with conservation-benefit sharing to achieve harmony watershed ecosystem. Chinese Hydrology and Hydropower Press, Beijing.
Chinese Eco-compensation mechanisms and Policies studying team (2007). Eco-compensation mechanisms and Policies in China. Science Press, Beijing.
Wang Jingnan, Zhang Guotai(2006). Eco-compensation mechanisms and Policies Design. Chinese environmental Science Press, Beijing.
Wan Jun, Zhang Huiyuan, et.al.(2005). Policy Evaluation and Framework Discussion of Ecological Compensation Mechanism in China. Environmental science study. Vol. 18(2), pp.1-8. (In Chinese).
Ge Yanxiang, Liang Lijuan, et.al.(2006). Building up a Mechanism of Ecological Compensation for the Waterhead Region and Its Operation. Agricultural economic problem. Vol. 9, pp.22-27. (In Chinese).
47
Protecting water quality for sustainable livelihood and poverty alleviation in the northeastern India
U.C. Sharma Centre for Natural Resources Management, V. P. O. Tarore, district Jammu – 181133, J&K, India. E-mail: [email protected] ABSTRACT: Though endowed with abundant water resources, the northeastern region of India has remained economically backward due to their indiscriminate use and mismanagement. Socio-economic constraints viz. shifting cultivation, land tenure system, small size of land holdings, unabated deforestation, free range grazing, inaccessible terrain, lack of marketing facilities and finance have remained major constraints in achieving sustainability in foodgrains production for livelihood, quality of life and poverty alleviation as well as put whole ecology of the region in peril. Shifting cultivation is practised in 3869 km2 area, annually in the region; however, total affected area is 14660 km2. It is an uneconomical practice but the farmers are socio-culturally attached with it, because most of the festivals and rituals are associated with this. In most of the states of the region, the farmers have only usufructuary rights over land as the land belongs either to village chief or community as a whole. They do not feel a sense of belonging and are not interested in water resources management; resulting in huge runoff of rain water, displacing about 601 million tonnes of soil, annually. About 316 km2 of forest area is deforested every year causing soil erosion and, land environmental degradation. The region has still a foodgrains deficit of about 2.5 million tonnes, which s increasing year after year because annual compound growth rate in population is 2.43% as against only 2.17% in foodgrains production. Besides other factors, mismanagement of water resources and water quality have been the major cause of low productivity. Key words: Protecting water quality, sustainable livelihood, poverty alleviation, shifting cultivation, northeast India
1. INTRODUCTION Water quality is an important aspect of this precious resource. Long-term development of freshwater needs holistic management of resources and a recognition of the interconnectedness of the elements related to freshwater quality. Major problems affecting the water quality arise in variable order of importance depending upon situation, from ill treated domestic sewage, inadequate control on the discharges of industrial waste waters, destruction of catchment area, deforestation, shifting cultivation and poor agricultural practices. The complex interconnectedness of freshwater systems demands that freshwater management should be done and based on the balanced consideration of the needs of the people and the environment. Safe water supplies and the environmental sanitation are important for protecting environment, improving health and alleviating poverty. Sustainability of food production increasingly depends on efficient water use and conservation practices, including water management in rainfed areas, livestock water supply, inland fisheries and agro-forestry. The northeastern region of India, with an area of 255,090 km2, is predominantly hilly. The region is endowed with rich natural water resources but their indiscriminate use and mismanagement have caused resource degradation to the extent that quality and quantity of available water has been affected (Sharma, 1998, 2003). The fast growing population has pressurized the food production base (Fig. 1) and to satisfy their needs, the people have misused the water resources. The region has still a foodgrains deficit of about 2.5 million tonnes (Sharma, 1999). Besides other factors, mismanagement of water resources has been the major cause of low productivity. There is an annual loss of 601 million tonnes of soil with runoff, out of which shifting cultivation alone is responsible for 88.3 million tonnes (Sharma & Prasad, 1995). The region receives about 510 km3 of rain water, annually at an annual average of 2450 mm. There are two major rivers viz. Brahmaputra and Barak, draining an area of 194.4 and 78.1 thousand km2 with an annual runoff of 537.2 and 59.8 km3 of water, respectively. Prevalence of faulty land use systems in the region are responsible for mismanagement and degradation of water resources to a large extent. Judicious management of water resources will not only reduce the heavy loss of soil and nutrients but also reduce the flood events in the region. Water is an essence of life and its conservation, development and planned utilization is of prime concern for resource conservation and food security (Sharma, 2001). A multi-
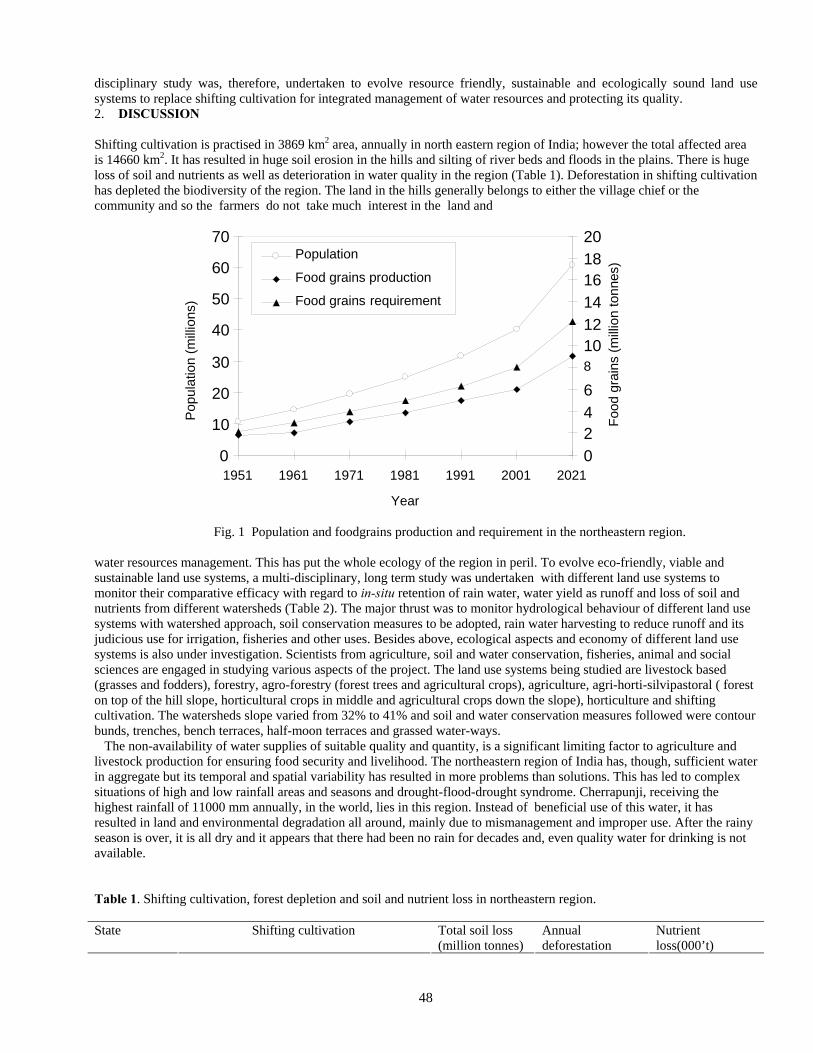
48
disciplinary study was, therefore, undertaken to evolve resource friendly, sustainable and ecologically sound land use systems to replace shifting cultivation for integrated management of water resources and protecting its quality. 2. DISCUSSION Shifting cultivation is practised in 3869 km2 area, annually in north eastern region of India; however the total affected area is 14660 km2. It has resulted in huge soil erosion in the hills and silting of river beds and floods in the plains. There is huge loss of soil and nutrients as well as deterioration in water quality in the region (Table 1). Deforestation in shifting cultivation has depleted the biodiversity of the region. The land in the hills generally belongs to either the village chief or the community and so the farmers do not take much interest in the land and
Fig. 1 Population and foodgrains production and requirement in the northeastern region.
water resources management. This has put the whole ecology of the region in peril. To evolve eco-friendly, viable and sustainable land use systems, a multi-disciplinary, long term study was undertaken with different land use systems to monitor their comparative efficacy with regard to in-situ retention of rain water, water yield as runoff and loss of soil and nutrients from different watersheds (Table 2). The major thrust was to monitor hydrological behaviour of different land use systems with watershed approach, soil conservation measures to be adopted, rain water harvesting to reduce runoff and its judicious use for irrigation, fisheries and other uses. Besides above, ecological aspects and economy of different land use systems is also under investigation. Scientists from agriculture, soil and water conservation, fisheries, animal and social sciences are engaged in studying various aspects of the project. The land use systems being studied are livestock based (grasses and fodders), forestry, agro-forestry (forest trees and agricultural crops), agriculture, agri-horti-silvipastoral ( forest on top of the hill slope, horticultural crops in middle and agricultural crops down the slope), horticulture and shifting cultivation. The watersheds slope varied from 32% to 41% and soil and water conservation measures followed were contour bunds, trenches, bench terraces, half-moon terraces and grassed water-ways. The non-availability of water supplies of suitable quality and quantity, is a significant limiting factor to agriculture and livestock production for ensuring food security and livelihood. The northeastern region of India has, though, sufficient water in aggregate but its temporal and spatial variability has resulted in more problems than solutions. This has led to complex situations of high and low rainfall areas and seasons and drought-flood-drought syndrome. Cherrapunji, receiving the highest rainfall of 11000 mm annually, in the world, lies in this region. Instead of beneficial use of this water, it has resulted in land and environmental degradation all around, mainly due to mismanagement and improper use. After the rainy season is over, it is all dry and it appears that there had been no rain for decades and, even quality water for drinking is not available. Table 1. Shifting cultivation, forest depletion and soil and nutrient loss in northeastern region. State Shifting cultivation Total soil loss
(million tonnes) Annual deforestation
Nutrient loss(000’t)
0
10
20
30
40
50
60
70
1951 1961 1971 1981 1991 2001 2021
Year
Pop
ulat
ion
(mill
ions
)
0 2 4 6
8
10 12 14 16 18 20
Foo
d gr
ains
(m
illio
n to
nnes
)
Population
Food grains production
Food grains requirement
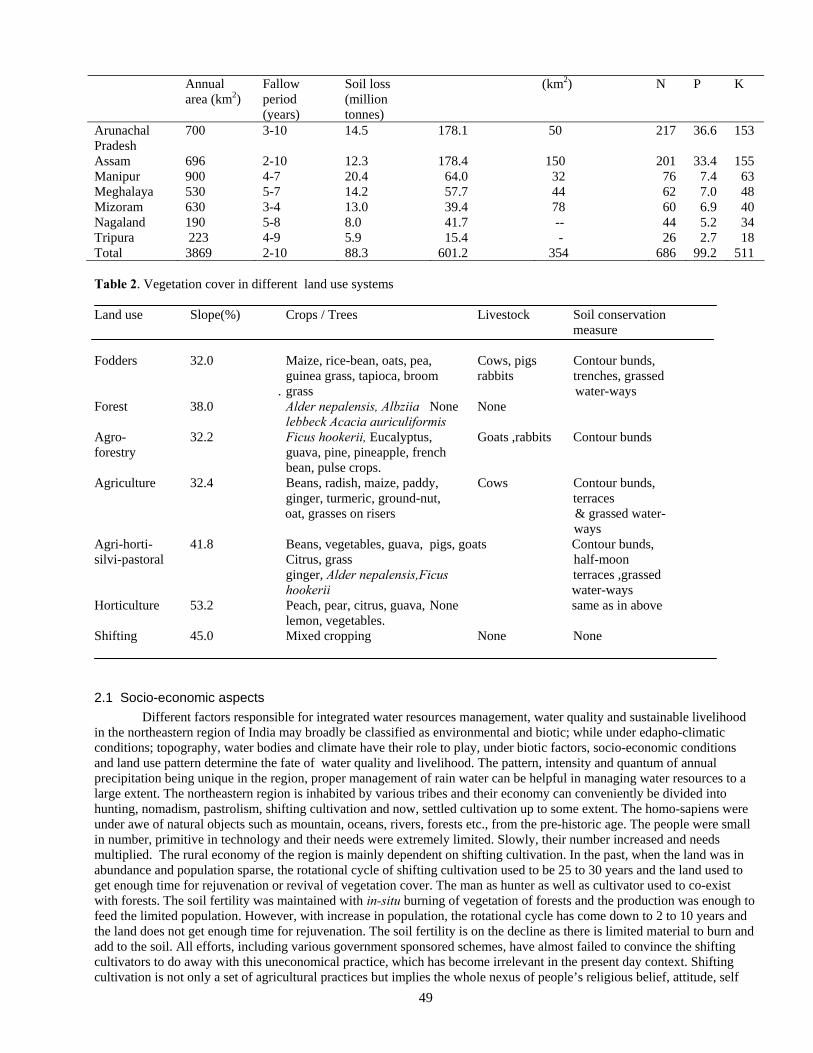
49
Annual area (km2)
Fallow period (years)
Soil loss (million tonnes)
(km2) N P K
Arunachal Pradesh
700 3-10 14.5 178.1 50 217 36.6 153
Assam Manipur
696 900
2-10 4-7
12.3 20.4
178.4 64.0
150 32
201 76
33.4 7.4
155 63
Meghalaya 530 5-7 14.2 57.7 44 62 7.0 48 Mizoram Nagaland Tripura
630 190 223
3-4 5-8 4-9
13.0 8.0 5.9
39.4 41.7 15.4
78 -- -
60 44 26
6.9 5.2 2.7
40 34 18
Total 3869 2-10 88.3 601.2 354 686 99.2 511 Table 2. Vegetation cover in different land use systems Land use Slope(%) Crops / Trees Livestock Soil conservation measure Fodders 32.0 Maize, rice-bean, oats, pea, Cows, pigs Contour bunds, guinea grass, tapioca, broom rabbits trenches, grassed . grass water-ways Forest 38.0 Alder nepalensis, Albziia None None lebbeck Acacia auriculiformis Agro- 32.2 Ficus hookerii, Eucalyptus, Goats ,rabbits Contour bunds forestry guava, pine, pineapple, french bean, pulse crops. Agriculture 32.4 Beans, radish, maize, paddy, Cows Contour bunds, ginger, turmeric, ground-nut, terraces oat, grasses on risers & grassed water- ways Agri-horti- 41.8 Beans, vegetables, guava, pigs, goats Contour bunds, silvi-pastoral Citrus, grass half-moon ginger, Alder nepalensis,Ficus terraces ,grassed hookerii water-ways Horticulture 53.2 Peach, pear, citrus, guava, None same as in above lemon, vegetables. Shifting 45.0 Mixed cropping None None
2.1 Socio-economic aspects Different factors responsible for integrated water resources management, water quality and sustainable livelihood in the northeastern region of India may broadly be classified as environmental and biotic; while under edapho-climatic conditions; topography, water bodies and climate have their role to play, under biotic factors, socio-economic conditions and land use pattern determine the fate of water quality and livelihood. The pattern, intensity and quantum of annual precipitation being unique in the region, proper management of rain water can be helpful in managing water resources to a large extent. The northeastern region is inhabited by various tribes and their economy can conveniently be divided into hunting, nomadism, pastrolism, shifting cultivation and now, settled cultivation up to some extent. The homo-sapiens were under awe of natural objects such as mountain, oceans, rivers, forests etc., from the pre-historic age. The people were small in number, primitive in technology and their needs were extremely limited. Slowly, their number increased and needs multiplied. The rural economy of the region is mainly dependent on shifting cultivation. In the past, when the land was in abundance and population sparse, the rotational cycle of shifting cultivation used to be 25 to 30 years and the land used to get enough time for rejuvenation or revival of vegetation cover. The man as hunter as well as cultivator used to co-exist with forests. The soil fertility was maintained with in-situ burning of vegetation of forests and the production was enough to feed the limited population. However, with increase in population, the rotational cycle has come down to 2 to 10 years and the land does not get enough time for rejuvenation. The soil fertility is on the decline as there is limited material to burn and add to the soil. All efforts, including various government sponsored schemes, have almost failed to convince the shifting cultivators to do away with this uneconomical practice, which has become irrelevant in the present day context. Shifting cultivation is not only a set of agricultural practices but implies the whole nexus of people’s religious belief, attitude, self
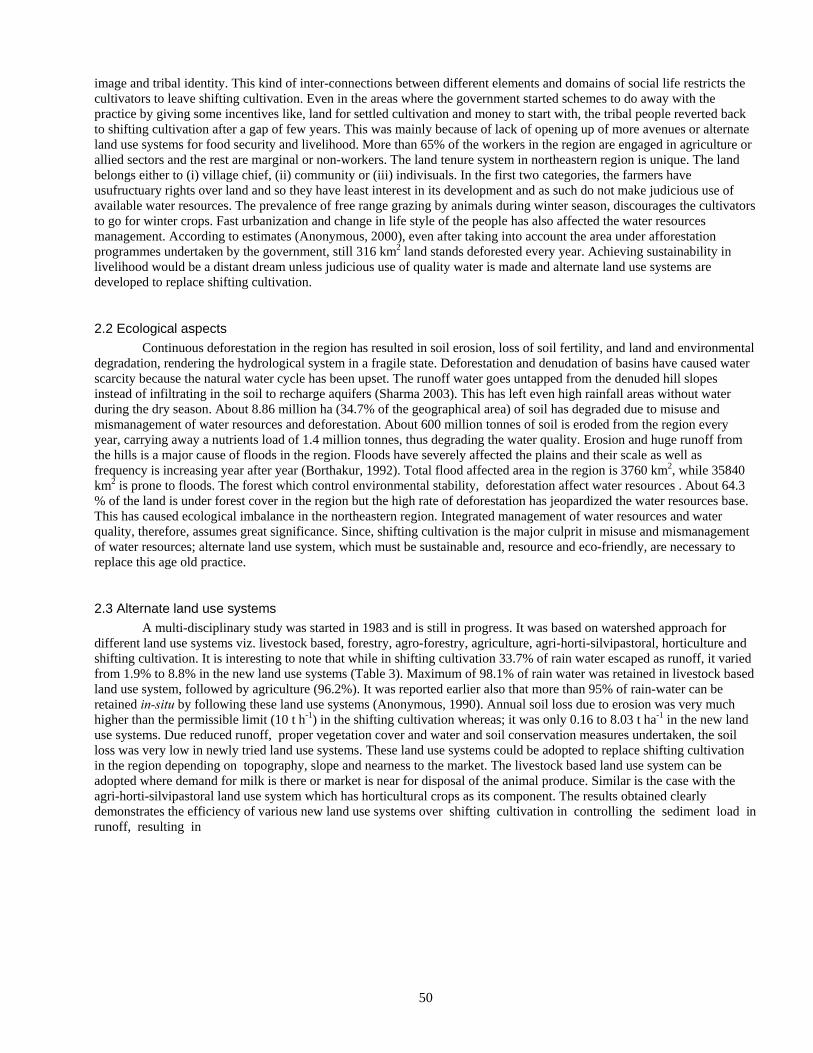
50
image and tribal identity. This kind of inter-connections between different elements and domains of social life restricts the cultivators to leave shifting cultivation. Even in the areas where the government started schemes to do away with the practice by giving some incentives like, land for settled cultivation and money to start with, the tribal people reverted back to shifting cultivation after a gap of few years. This was mainly because of lack of opening up of more avenues or alternate land use systems for food security and livelihood. More than 65% of the workers in the region are engaged in agriculture or allied sectors and the rest are marginal or non-workers. The land tenure system in northeastern region is unique. The land belongs either to (i) village chief, (ii) community or (iii) indivisuals. In the first two categories, the farmers have usufructuary rights over land and so they have least interest in its development and as such do not make judicious use of available water resources. The prevalence of free range grazing by animals during winter season, discourages the cultivators to go for winter crops. Fast urbanization and change in life style of the people has also affected the water resources management. According to estimates (Anonymous, 2000), even after taking into account the area under afforestation programmes undertaken by the government, still 316 km2 land stands deforested every year. Achieving sustainability in livelihood would be a distant dream unless judicious use of quality water is made and alternate land use systems are developed to replace shifting cultivation.
2.2 Ecological aspects Continuous deforestation in the region has resulted in soil erosion, loss of soil fertility, and land and environmental degradation, rendering the hydrological system in a fragile state. Deforestation and denudation of basins have caused water scarcity because the natural water cycle has been upset. The runoff water goes untapped from the denuded hill slopes instead of infiltrating in the soil to recharge aquifers (Sharma 2003). This has left even high rainfall areas without water during the dry season. About 8.86 million ha (34.7% of the geographical area) of soil has degraded due to misuse and mismanagement of water resources and deforestation. About 600 million tonnes of soil is eroded from the region every year, carrying away a nutrients load of 1.4 million tonnes, thus degrading the water quality. Erosion and huge runoff from the hills is a major cause of floods in the region. Floods have severely affected the plains and their scale as well as frequency is increasing year after year (Borthakur, 1992). Total flood affected area in the region is 3760 km2, while 35840 km2 is prone to floods. The forest which control environmental stability, deforestation affect water resources . About 64.3 % of the land is under forest cover in the region but the high rate of deforestation has jeopardized the water resources base. This has caused ecological imbalance in the northeastern region. Integrated management of water resources and water quality, therefore, assumes great significance. Since, shifting cultivation is the major culprit in misuse and mismanagement of water resources; alternate land use system, which must be sustainable and, resource and eco-friendly, are necessary to replace this age old practice.
2.3 Alternate land use systems A multi-disciplinary study was started in 1983 and is still in progress. It was based on watershed approach for different land use systems viz. livestock based, forestry, agro-forestry, agriculture, agri-horti-silvipastoral, horticulture and shifting cultivation. It is interesting to note that while in shifting cultivation 33.7% of rain water escaped as runoff, it varied from 1.9% to 8.8% in the new land use systems (Table 3). Maximum of 98.1% of rain water was retained in livestock based land use system, followed by agriculture (96.2%). It was reported earlier also that more than 95% of rain-water can be retained in-situ by following these land use systems (Anonymous, 1990). Annual soil loss due to erosion was very much higher than the permissible limit (10 t h-1) in the shifting cultivation whereas; it was only 0.16 to 8.03 t ha-1 in the new land use systems. Due reduced runoff, proper vegetation cover and water and soil conservation measures undertaken, the soil loss was very low in newly tried land use systems. These land use systems could be adopted to replace shifting cultivation in the region depending on topography, slope and nearness to the market. The livestock based land use system can be adopted where demand for milk is there or market is near for disposal of the animal produce. Similar is the case with the agri-horti-silvipastoral land use system which has horticultural crops as its component. The results obtained clearly demonstrates the efficiency of various new land use systems over shifting cultivation in controlling the sediment load in runoff, resulting in
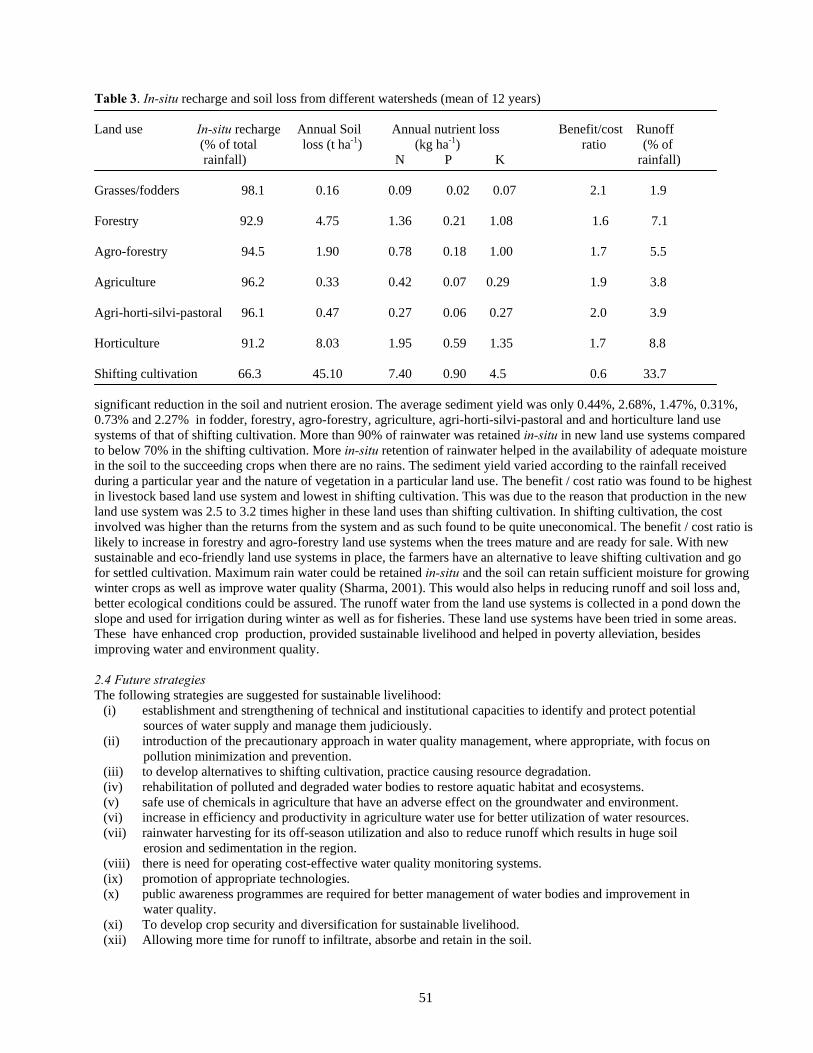
51
Table 3. In-situ recharge and soil loss from different watersheds (mean of 12 years) Land use In-situ recharge Annual Soil Annual nutrient loss Benefit/cost Runoff (% of total loss (t ha-1) (kg ha-1) ratio (% of rainfall) N P K rainfall) Grasses/fodders 98.1 0.16 0.09 0.02 0.07 2.1 1.9 Forestry 92.9 4.75 1.36 0.21 1.08 1.6 7.1 Agro-forestry 94.5 1.90 0.78 0.18 1.00 1.7 5.5 Agriculture 96.2 0.33 0.42 0.07 0.29 1.9 3.8 Agri-horti-silvi-pastoral 96.1 0.47 0.27 0.06 0.27 2.0 3.9
Horticulture 91.2 8.03 1.95 0.59 1.35 1.7 8.8 Shifting cultivation 66.3 45.10 7.40 0.90 4.5 0.6 33.7 significant reduction in the soil and nutrient erosion. The average sediment yield was only 0.44%, 2.68%, 1.47%, 0.31%, 0.73% and 2.27% in fodder, forestry, agro-forestry, agriculture, agri-horti-silvi-pastoral and and horticulture land use systems of that of shifting cultivation. More than 90% of rainwater was retained in-situ in new land use systems compared to below 70% in the shifting cultivation. More in-situ retention of rainwater helped in the availability of adequate moisture in the soil to the succeeding crops when there are no rains. The sediment yield varied according to the rainfall received during a particular year and the nature of vegetation in a particular land use. The benefit / cost ratio was found to be highest in livestock based land use system and lowest in shifting cultivation. This was due to the reason that production in the new land use system was 2.5 to 3.2 times higher in these land uses than shifting cultivation. In shifting cultivation, the cost involved was higher than the returns from the system and as such found to be quite uneconomical. The benefit / cost ratio is likely to increase in forestry and agro-forestry land use systems when the trees mature and are ready for sale. With new sustainable and eco-friendly land use systems in place, the farmers have an alternative to leave shifting cultivation and go for settled cultivation. Maximum rain water could be retained in-situ and the soil can retain sufficient moisture for growing winter crops as well as improve water quality (Sharma, 2001). This would also helps in reducing runoff and soil loss and, better ecological conditions could be assured. The runoff water from the land use systems is collected in a pond down the slope and used for irrigation during winter as well as for fisheries. These land use systems have been tried in some areas. These have enhanced crop production, provided sustainable livelihood and helped in poverty alleviation, besides improving water and environment quality. 2.4 Future strategies The following strategies are suggested for sustainable livelihood:
(i) establishment and strengthening of technical and institutional capacities to identify and protect potential sources of water supply and manage them judiciously. (ii) introduction of the precautionary approach in water quality management, where appropriate, with focus on pollution minimization and prevention. (iii) to develop alternatives to shifting cultivation, practice causing resource degradation. (iv) rehabilitation of polluted and degraded water bodies to restore aquatic habitat and ecosystems. (v) safe use of chemicals in agriculture that have an adverse effect on the groundwater and environment. (vi) increase in efficiency and productivity in agriculture water use for better utilization of water resources. (vii) rainwater harvesting for its off-season utilization and also to reduce runoff which results in huge soil erosion and sedimentation in the region. (viii) there is need for operating cost-effective water quality monitoring systems. (ix) promotion of appropriate technologies. (x) public awareness programmes are required for better management of water bodies and improvement in water quality. (xi) To develop crop security and diversification for sustainable livelihood. (xii) Allowing more time for runoff to infiltrate, absorbe and retain in the soil.

52
3. CONCLUSIONS
For sustainable livelihood in the northeast region of India, there is strong need for increasing agricultural production, livestock management and development of good aquacultural practices. To achieve this, integrated water resources management and protection of water quality is of great significance. It would be necessary to manage the rain water for its efficient use. The shifting cultivation prevalent in the region, is a big constraint in the water resources management and achieving sustainable livelihood.. The farmers of the region are not in mood, in general, to leave the practice since they are socio-culturally attached with it and secondly there are no alternate options to replace shifting cultivation. There is urgent need to develop ecologically sound, sustainable and productive land use system which may ensure maximum in-situ retention of rain water, reduce runoff as well as minimize soil and nutrient loss for ensuring water quality. The results of the present study show that better options are available in the form of new land use systems studied, which are highly productive and fulfill above conditions. There is need to popularize these land use systems under iso-agro-climatic conditions to ensure sustainable livelihood for the people of the region. 4. REFERENCES Anonymous (1990) Annual Report, ICAR Research Complex for Northeastern Region, Barapani, Meghalaya, India, pp 205-222. Anonymous (2000). Basic Statistics of the Northeastern Region. North Eastern Council, Shillong, Meghalaya, India (2000), p-271. Borthakur, D. N.1992) Agriculture in the Northeastern Region. Bee Cee Publishers, Guwahati, Assam, India, p-263. Sharma, U.C. (1998) Water Management by the tribes of northeastern region: The traditional wisdom and future strategies. Fertilizer News: 43 pp 43-49. Sharma, U. C. (1999)Food Security in the northeast : new paradigms. In : Persrpective for Planning and Development in North Eastern India (ed. by R. C. Sundariyal, Uma Shankar & T. C. Upreti), G.B. Pant Institute of Himalayan Environmental and Development, Almorah, India, pp 197-212. Sharma, U. C. (2001)Effect of farming system type on in-situ ground water recharge and quality in northeast India. In: Impact of human Activity on Groundwater Dynamics (ed. by H. Gehrels, N.E. Peters, E. Hoehn, K. Jenson, C. Leibundgut, J. Griffioen, B. Webb & W. J. Zaadnoordijk), IAHS Publ. no.269, pp 167-169. Sharma, U. C. (2003) Impact of population growth and climate change on the quantity and quality of water resources in the northeast region of India. In: Water Resources System - Hydrological Risks, Management and Development. (ed. by G. Bloschl, S. Franks, M. Kumagia, K. Musiake & D. Rosbjerg), IAHS Publ. no. 281, pp 349-357. Sharma, U. C. & Prasad, R.N. (1995) Socio-economic aspects of acid soil management and alternate land use systems for northeastern states of India. In: Plant-soil Internations at Low pH, Principles and Management (ed. by R. A. Date, N. J. Grundon, G. E. Rayment & M.E. Probert) Kluwer Academic Press, The Netherlands, pp 689-696.

53
Projection of domestic water use under the spread of water saving appliances in Tokyo
Naoko Nakagawa1*, Masahiro Otaki1, Keitaro Sanada2, Toshiya Aramaki3 1Dept. of Human Environmental Sciences, Ochanomizu Unviersity.,2-1-1, Otsuka, Bunkyo-ku, Tokyo, 112-8610, Japan 2Dept. of Urban Engineering, Faculty of Engineering, The University of Tokyo, 7-3-1 Hongo, Bunkyo-ku, Tokyo, 113-8656, Japan 3 Dept. of Regional Development Studies, Toyo University, ABSTRACT: In this study, the amount of the domestic water use was quantified by estimating the usage rates of the water related appliances. Tokyo was selected as a case study. In addition, the replacement of a conventional toilet with water-saving-type for reducing water use was investigated from both respects of energy and cost. From a result, the calculated amount of domestic water use corresponded to the actual amount of that in this decades and it was considered that the use of water by reducing water use for toilet would contribute in the future. From the results of the investigation regarding the installation of water-saving-type toilet, the payback period by introducing 6L-type flushing toilet instead of 13L-type was 23,12,8,6,5 years regarding the burden of the energy, and 42,21,14,11,9 years regarding the cost for household sizes of 1,2,3,4,5 family members, respectively. Although the payback period regarding the cost is taking much time, it was considered that the replacement of a conventional toilet with a water-saving-type toilet was one of the effective solutions for reducing the domestic water use. 1 INTRODUCTION The amount of the domestic water use in Japan had increased with economic growth after 1970, but, in the 1990's, the increase of domestic water use reached a plateau, and it decreases in these 4-5 years (Ministry of Land, Infrastructure, Transport and Tourism, 2008) The amount of the domestic water use in Tokyo also tends to the gradual decrease in recent 6-7 years as shown in Fig.1. One reason of this trend is that the usage rates of the basic water related appliances such as flushing toilet and private bath were approaching to the saturated condition, and the drastic change in living environment and the life styles is no more expected recently. Another reason is that commodities to reduce water use such as dishwashers and the water saving type washing machines were turned on to the market by the advancement of the water saving technology.
The domestic water use per capita was considered to be influenced by the various factors, such as household income, household size, density of houses, maximum temperature, precipitation, and the water saving consciousness etc.(Aramaki,T., et al.,2004). It is considered that the use of the water related appliance greatly influences the amount of the domestic water use per capita in recent years because the effect achieved by the performance of water related appliances is large. The aim of this paper was to make a projection of
domestic water use under the spread of water saving appliances for household water use in Tokyo. In this case, the increase of the domestic water use per capita by decrease of the household size was also taken into the consideration.
Figure 1 The change of the domestic water use per capita in Tokyo
0
50
100
150
200
250
300
1980 1985 1990 1995 2000 2005
Year
Domestic Water Use (L/cap/day)
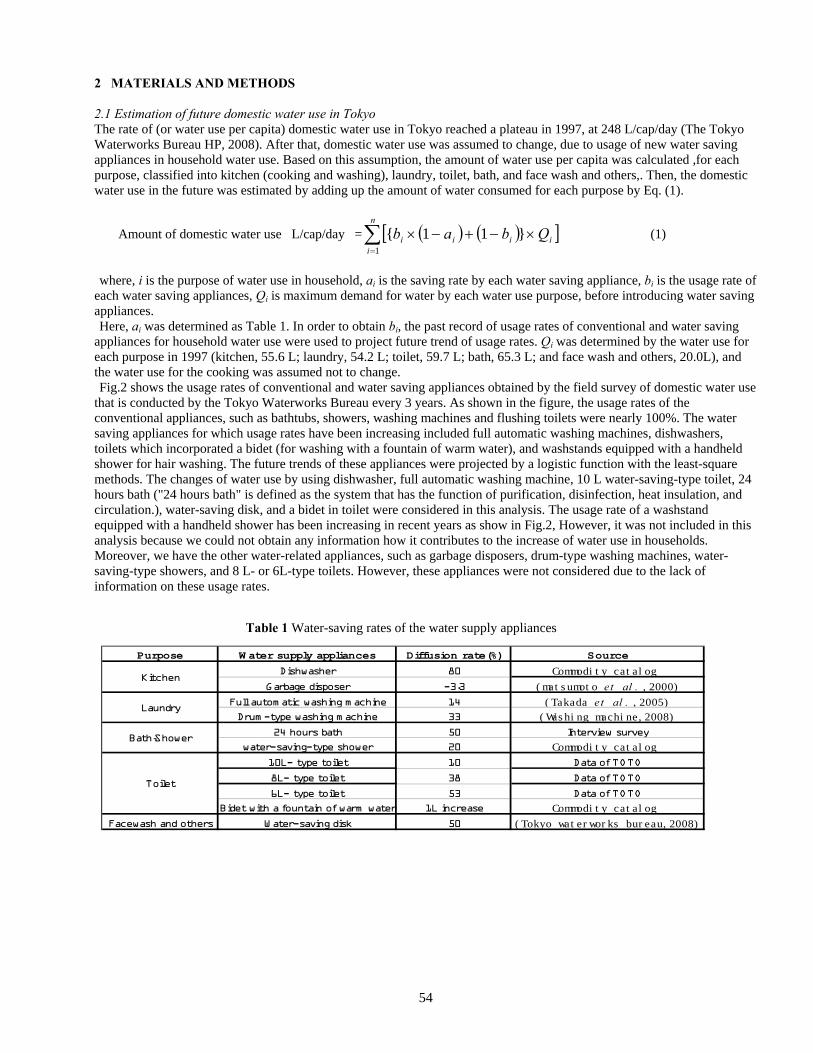
54
2 MATERIALS AND METHODS
2.1 Estimation of future domestic water use in Tokyo The rate of (or water use per capita) domestic water use in Tokyo reached a plateau in 1997, at 248 L/cap/day (The Tokyo Waterworks Bureau HP, 2008). After that, domestic water use was assumed to change, due to usage of new water saving appliances in household water use. Based on this assumption, the amount of water use per capita was calculated ,for each purpose, classified into kitchen (cooking and washing), laundry, toilet, bath, and face wash and others,. Then, the domestic water use in the future was estimated by adding up the amount of water consumed for each purpose by Eq. (1).
Amount of domestic water use� L/cap/day� = ( ) ( )[ ]∑=
×−+−×n
iiiii Qbab
1
}11{ (1)
where, i is the purpose of water use in household, ai is the saving rate by each water saving appliance, bi is the usage rate of
each water saving appliances, Qi is maximum demand for water by each water use purpose, before introducing water saving appliances. Here, ai was determined as Table 1. In order to obtain bi, the past record of usage rates of conventional and water saving
appliances for household water use were used to project future trend of usage rates. Qi was determined by the water use for each purpose in 1997 (kitchen, 55.6 L; laundry, 54.2 L; toilet, 59.7 L; bath, 65.3 L; and face wash and others, 20.0L), and the water use for the cooking was assumed not to change. Fig.2 shows the usage rates of conventional and water saving appliances obtained by the field survey of domestic water use
that is conducted by the Tokyo Waterworks Bureau every 3 years. As shown in the figure, the usage rates of the conventional appliances, such as bathtubs, showers, washing machines and flushing toilets were nearly 100%. The water saving appliances for which usage rates have been increasing included full automatic washing machines, dishwashers, toilets which incorporated a bidet (for washing with a fountain of warm water), and washstands equipped with a handheld shower for hair washing. The future trends of these appliances were projected by a logistic function with the least-square methods. The changes of water use by using dishwasher, full automatic washing machine, 10 L water-saving-type toilet, 24 hours bath ("24 hours bath" is defined as the system that has the function of purification, disinfection, heat insulation, and circulation.), water-saving disk, and a bidet in toilet were considered in this analysis. The usage rate of a washstand equipped with a handheld shower has been increasing in recent years as show in Fig.2, However, it was not included in this analysis because we could not obtain any information how it contributes to the increase of water use in households. Moreover, we have the other water-related appliances, such as garbage disposers, drum-type washing machines, water-saving-type showers, and 8 L- or 6L-type toilets. However, these appliances were not considered due to the lack of information on these usage rates.
Table 1 Water-saving rates of the water supply appliances
Purpose W ater supply appliances Diffusion rate(%) Source
Dishwasher 80 Commodi t y cat al og
Garbage disposer -3.3 ( mat s umot o et al . , 2000)
Full automatic washing machine 14 ( Takada e t al . , 2005)Drum-type washing machine 33 ( Was hi ng machi ne, 2008)
24 hours bath 50 Interview survey
water-saving-type shower 20 Commodi t y cat al og
10L- type toilet 10 Data of TOTO
8L- type toilet 38 Data of TOTO
6L- type toilet 53 Data of TOTO
Bidet with a fountain of warm water 1L increase Commodi t y cat al og
Facewash and others Water-saving disk 50 ( Tokyo wat er wor ks bur eau, 2008)
Kitchen
Laundry
Bath,Shower
Toilet
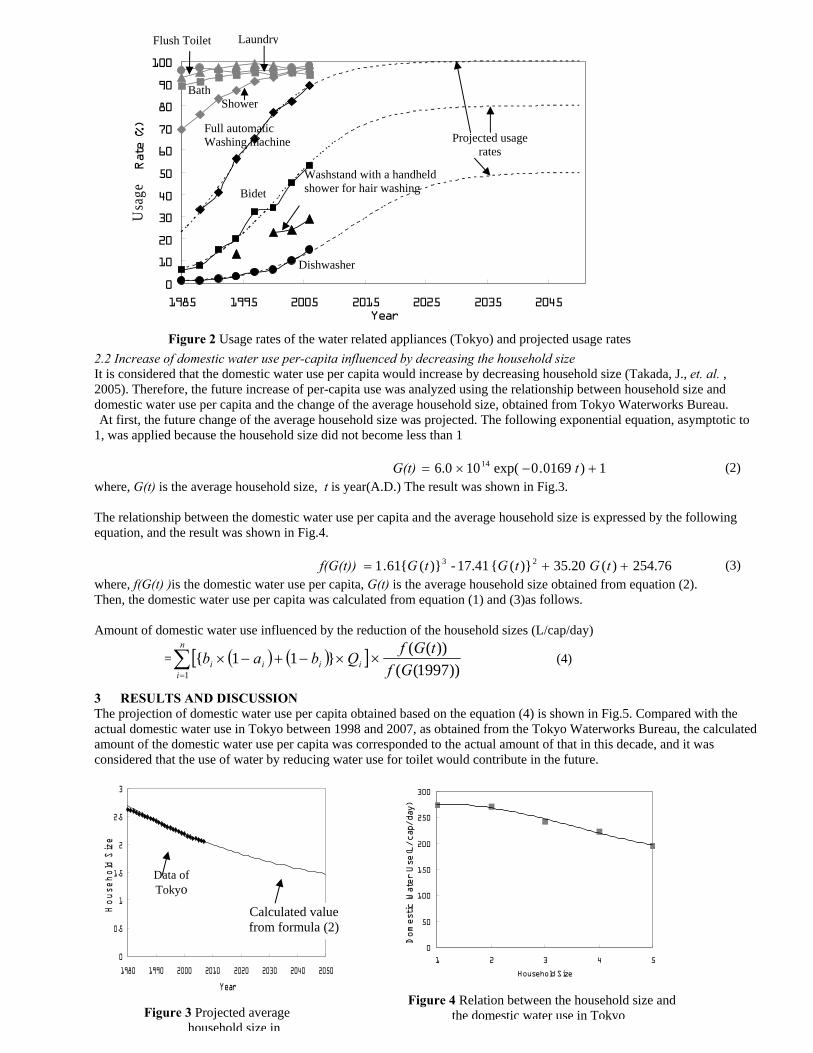
55
2.2 Increase of domestic water use per-capita influenced by decreasing the household size It is considered that the domestic water use per capita would increase by decreasing household size (Takada, J., et. al. , 2005). Therefore, the future increase of per-capita use was analyzed using the relationship between household size and domestic water use per capita and the change of the average household size, obtained from Tokyo Waterworks Bureau. At first, the future change of the average household size was projected. The following exponential equation, asymptotic to
1, was applied because the household size did not become less than 1
1)0169.0exp(106.0 14 +−×= tG(t) (2)
where, G(t) is the average household size, t is year(A.D.) The result was shown in Fig.3. The relationship between the domestic water use per capita and the average household size is expressed by the following equation, and the result was shown in Fig.4.
254.76)(35.20)}({17.41-)}({61.1 23 ++= tGtGtGf(G(t)) (3)
where, f(G(t) )is the domestic water use per capita, G(t) is the average household size obtained from equation (2). Then, the domestic water use per capita was calculated from equation (1) and (3)as follows. Amount of domestic water use influenced by the reduction of the household sizes (L/cap/day)
= ( ) ( )[ ]∑=
×−+−×n
iiiii Qbab
1
}11{))1997((
))((Gf
tGf× (4)
3 RESULTS AND DISCUSSION The projection of domestic water use per capita obtained based on the equation (4) is shown in Fig.5. Compared with the actual domestic water use in Tokyo between 1998 and 2007, as obtained from the Tokyo Waterworks Bureau, the calculated amount of the domestic water use per capita was corresponded to the actual amount of that in this decade, and it was considered that the use of water by reducing water use for toilet would contribute in the future.
Figure 3 Projected average household size in
0
0.5
1
1.5
2
2.5
3
1980 1990 2000 2010 2020 2030 2040 2050
Year
House
hold S
ize
Calculated value from formula (2)
Data of Tokyo
Figure 4 Relation between the household size and the domestic water use in Tokyo
0
50
100
150
200
250
300
1 2 3 4 5
Household Size
Domestic W
ater Use(L/cap/day)
0
10
20
30
40
50
60
70
80
90
100
1985 1995 2005 2015 2025 2035 2045Year
Diffusion Rate (%)
Figure 2 Usage rates of the water related appliances (Tokyo) and projected usage rates
Flush Toilet
Full automatic Washing machine
Shower Bath
Laundry
Bidet
Washstand with a handheld shower for hair washing
Dishwasher
Projected usage rates
Usa
ge
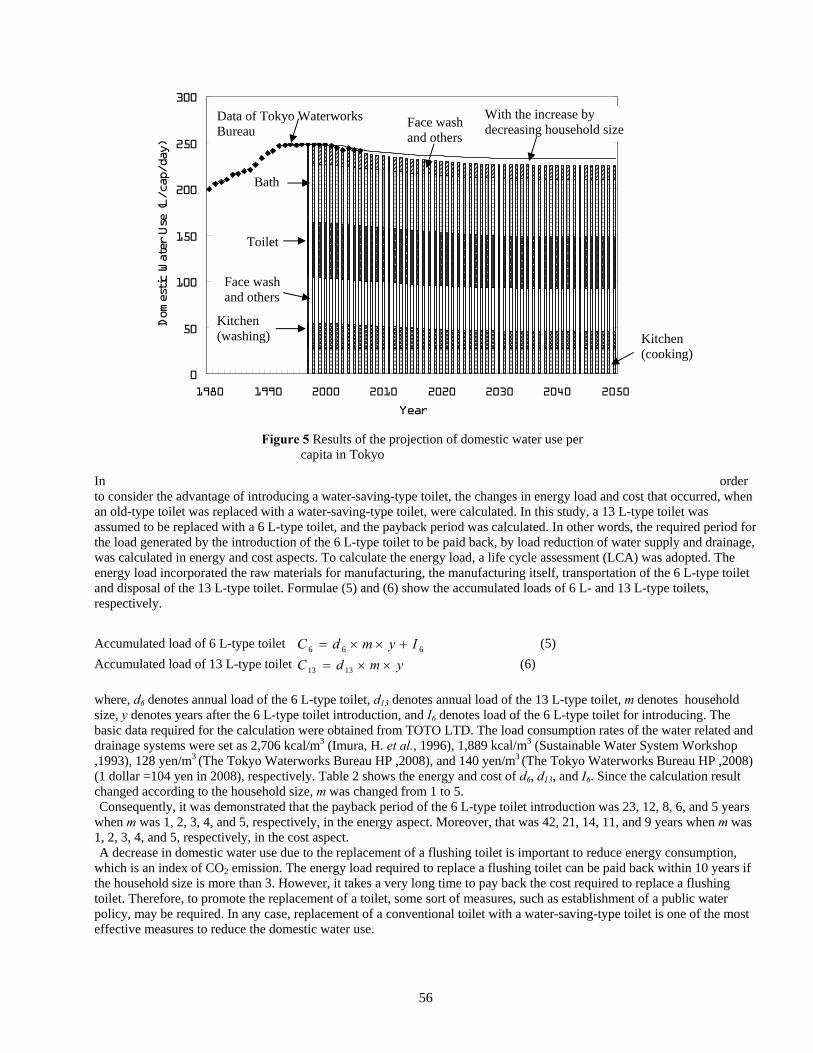
56
In order to consider the advantage of introducing a water-saving-type toilet, the changes in energy load and cost that occurred, when an old-type toilet was replaced with a water-saving-type toilet, were calculated. In this study, a 13 L-type toilet was assumed to be replaced with a 6 L-type toilet, and the payback period was calculated. In other words, the required period for the load generated by the introduction of the 6 L-type toilet to be paid back, by load reduction of water supply and drainage, was calculated in energy and cost aspects. To calculate the energy load, a life cycle assessment (LCA) was adopted. The energy load incorporated the raw materials for manufacturing, the manufacturing itself, transportation of the 6 L-type toilet and disposal of the 13 L-type toilet. Formulae (5) and (6) show the accumulated loads of 6 L- and 13 L-type toilets, respectively.
Accumulated load of 6 L-type toilet 666 IymdC +××= (5)
Accumulated load of 13 L-type toilet ymdC ××= 1313 (6)
where, d6 denotes annual load of the 6 L-type toilet, d13 denotes annual load of the 13 L-type toilet, m denotes household size, y denotes years after the 6 L-type toilet introduction, and I6 denotes load of the 6 L-type toilet for introducing. The basic data required for the calculation were obtained from TOTO LTD. The load consumption rates of the water related and drainage systems were set as 2,706 kcal/m3 (Imura, H. et al., 1996), 1,889 kcal/m3 (Sustainable Water System Workshop ,1993), 128 yen/m3 (The Tokyo Waterworks Bureau HP ,2008), and 140 yen/m3 (The Tokyo Waterworks Bureau HP ,2008) (1 dollar =104 yen in 2008), respectively. Table 2 shows the energy and cost of d6, d13, and I6. Since the calculation result changed according to the household size, m was changed from 1 to 5. Consequently, it was demonstrated that the payback period of the 6 L-type toilet introduction was 23, 12, 8, 6, and 5 years
when m was 1, 2, 3, 4, and 5, respectively, in the energy aspect. Moreover, that was 42, 21, 14, 11, and 9 years when m was 1, 2, 3, 4, and 5, respectively, in the cost aspect. A decrease in domestic water use due to the replacement of a flushing toilet is important to reduce energy consumption,
which is an index of CO2 emission. The energy load required to replace a flushing toilet can be paid back within 10 years if the household size is more than 3. However, it takes a very long time to pay back the cost required to replace a flushing toilet. Therefore, to promote the replacement of a toilet, some sort of measures, such as establishment of a public water policy, may be required. In any case, replacement of a conventional toilet with a water-saving-type toilet is one of the most effective measures to reduce the domestic water use.
Figure 5 Results of the projection of domestic water use per capita in Tokyo
0
50
100
150
200
250
300
1980 1990 2000 2010 2020 2030 2040 2050
Year
Domestic Water Use (L/cap/day)
0
50
100
150
200
250
300
Data of Tokyo Waterworks Bureau
Face wash and others
With the increase by decreasing household size
Bath
Toilet
Face wash and others
Kitchen (washing) Kitchen
(cooking)
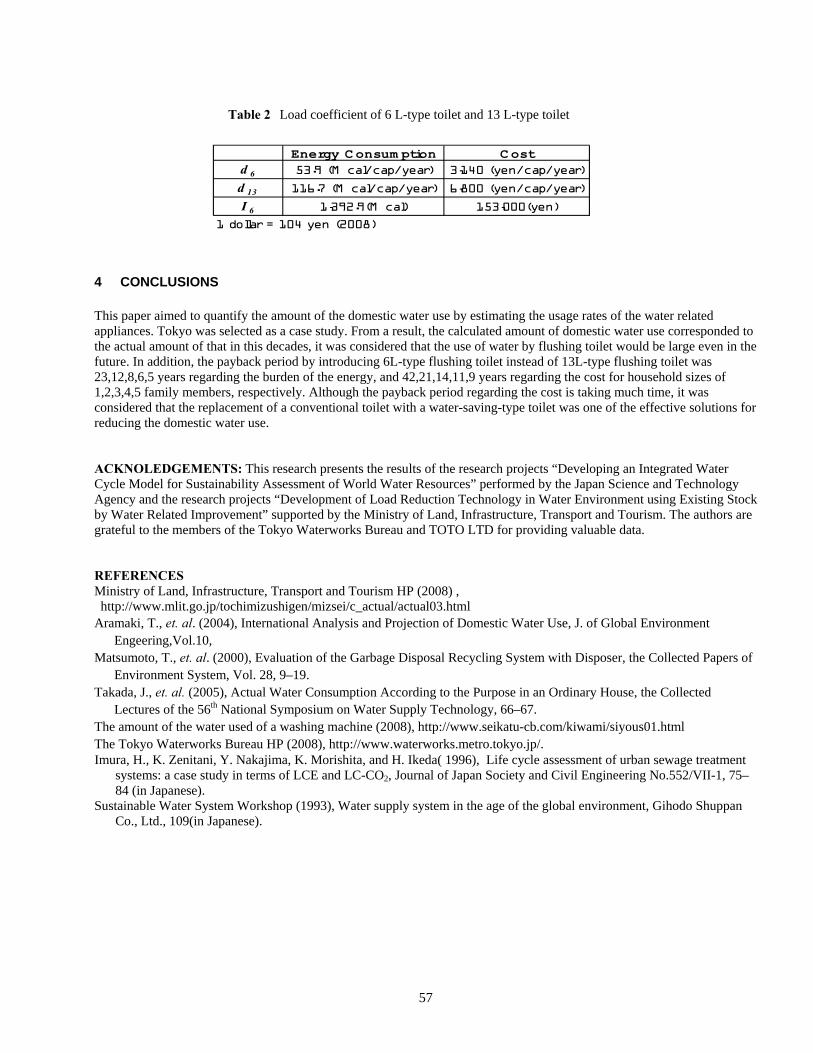
57
4 CONCLUSIONS This paper aimed to quantify the amount of the domestic water use by estimating the usage rates of the water related appliances. Tokyo was selected as a case study. From a result, the calculated amount of domestic water use corresponded to the actual amount of that in this decades, it was considered that the use of water by flushing toilet would be large even in the future. In addition, the payback period by introducing 6L-type flushing toilet instead of 13L-type flushing toilet was 23,12,8,6,5 years regarding the burden of the energy, and 42,21,14,11,9 years regarding the cost for household sizes of 1,2,3,4,5 family members, respectively. Although the payback period regarding the cost is taking much time, it was considered that the replacement of a conventional toilet with a water-saving-type toilet was one of the effective solutions for reducing the domestic water use. ACKNOLEDGEMENTS: This research presents the results of the research projects “Developing an Integrated Water Cycle Model for Sustainability Assessment of World Water Resources” performed by the Japan Science and Technology Agency and the research projects “Development of Load Reduction Technology in Water Environment using Existing Stock by Water Related Improvement” supported by the Ministry of Land, Infrastructure, Transport and Tourism. The authors are grateful to the members of the Tokyo Waterworks Bureau and TOTO LTD for providing valuable data. REFERENCES Ministry of Land, Infrastructure, Transport and Tourism HP (2008) , http://www.mlit.go.jp/tochimizushigen/mizsei/c_actual/actual03.html
Aramaki, T., et. al. (2004), International Analysis and Projection of Domestic Water Use, J. of Global Environment Engeering,Vol.10,
Matsumoto, T., et. al. (2000), Evaluation of the Garbage Disposal Recycling System with Disposer, the Collected Papers of Environment System, Vol. 28, 9–19.
Takada, J., et. al. (2005), Actual Water Consumption According to the Purpose in an Ordinary House, the Collected Lectures of the 56th National Symposium on Water Supply Technology, 66–67.
The amount of the water used of a washing machine (2008), http://www.seikatu-cb.com/kiwami/siyous01.html The Tokyo Waterworks Bureau HP (2008), http://www.waterworks.metro.tokyo.jp/. Imura, H., K. Zenitani, Y. Nakajima, K. Morishita, and H. Ikeda( 1996), Life cycle assessment of urban sewage treatment
systems: a case study in terms of LCE and LC-CO2, Journal of Japan Society and Civil Engineering No.552/VII-1, 75–84 (in Japanese).
Sustainable Water System Workshop (1993), Water supply system in the age of the global environment, Gihodo Shuppan Co., Ltd., 109(in Japanese).
Table 2 Load coefficient of 6 L-type toilet and 13 L-type toilet
Energy C onsum ption C ostd 6 53.9 (M cal/cap/year) 3,140 (yen/cap/year)
d 13 116.7 (M cal/cap/year) 6,800 (yen/cap/year)
I 6 1,392.9(M cal) 153,000(yen)
1 dollar = 104 yen (2008)
58
Current situation and key problems on water supply and sanitation in Mongolia
Prof. D.Basandorj1, B.Altanzagas2, MPH 1 MUST, Research and Training center in IWRM
2School of Public Health, HSUM
1.1 Water resources and water consumption The total surface water resource of Mongolia is estimated as 599 km3/year, and it is composed mainly from water stored in lakes (500 km3/year), glaciers (62.9 km3/year) and rivers 34.6 km3/year and others (Myagmarjav, Davaa, 1999). The amount of renewable groundwater resources has been estimated as 10.8 km3/ year (Jadambaa, 2002).
Twenty percent of Mongolian water consumption is originated from surface water sources, while eighty percent from ground water2,10. Water resource is widely used for drinking and domestic, industrial and agricultural purpose. By assessment of type of water usage is 18.1% for drinking and domestic use, 39.3% for industry, 24.0% for animal husbandry, 17.4% for irrigation and 1.2% for other purpose2.
Water consumption has been increasing last years in Mongolia due to a rise in the urban population and development of society and economy. Impacts of climate change and human activities have resulted in increased water scarcity, pollution level of groundwater and surface water and changing water regime. This situation will deteriorate in the future if no appropriate actions will taken, especially since Mongolia has scattered and limited water resources for supply. It was evident from the results of a water census conducted by the Ministry of Nature and Environment how much Mongolia's water reserves have decreased. 683 rivers, 1484 ponds and springs, and 760 lakes have dried up over the last five years (MNE, 2002).
Data updated for 2003, shows there were 39843 engineer designed and simple dug wells registered and out of which, 51.8% /20654/ were dug wells in Mongolia for livestock watering points for herders. Moreover those wells get used as drinking water sources for nomadic people, therefore laboratory test should be done to check water quality (MOFA, 2003).
The national Human development Report from 2003 provided water consumption estimations for apartment dwellers in Ulaanbaatar, averaging 240-450 liters of water daily compared to 8 to 10 liters in Ger (traditional nomadic house) districts. In addition there are a number of considerable disparities in water consumption. Apartment dwellers use safe water use a daily for their drinking and domestic need. But Ger dwellers have many disadvantages in consumption of water such as they use unsafe water from dug well, river and spring, spend a long hours staying in a long order during cold winter for collecting water, spend electricity and time for heating and boiling water, mostly women and children handle water, schoolchildren miss school and pay 84 times higher than the industries and mining companies for 1000 liters of water used
1.2 Access to water supply and sanitation facilities and human right
Recent report of MCUD /2006/ shows only 39.2 percent of total population use improved drinking water sources, which is by 20 percent lower than global average. As assessment type of improved drinking water sources 22 percent have household connection as shown in the table 1.2
Table 1.2 Current situation and future trends on access to improved drinking water sources, Mongolia (percentage)
Type of improved drinking water sources 2005 2015 Household connection Public standpipe Borehole and protected dug well Protected spring
22 8.5 8.6 0.1
36.6 13.6 29.3 69.6
Source: Government of Mongolia 2006, Programme of improvement sanitation facilities, MCUD 2007, MDG report 2006. MCUD report (2005) also determines that 26.6 percent of total population have access to improved sanitation facilities.
Joint household pilot survey (UNDP, WHO and UNICEF, 2004) involved total 1500 households as a target population showed existing disparities in urban and rural areas on access to safe water and appropriate sanitation facilities. That study was first time there has been an attempt to address the gaps in terms of data on safe water and sanitation coverage for the poor and marginalized group through application of the UN mandated Joint Monitoring Program (JMP) definitions and indicators. Of the urban households, 62.1 and 42.6 percent have access to improved drinking water sources and sanitation facilities, while only 17.3 and 4.8 percent of rural households have such access as determined by this survey2.
Mongolia is one of 189 nations who adopted MDG targets as the Government’s mid-strategic goal of increasing the coverage of improved water sources to 70%, and improved sanitation services to 50% of the population by 2015, against the 1990 baseline average.
Clean water and sanitation can make or break human development. They are fundamental to what people can do and what they can become—to their capabilities. Access to water is not just a fundamental human right and an intrinsically important indicator for human progress. It also gives substance to other human rights and is a condition for attaining wider human development goals (Human Development report, 2006).
59
The study carried out by Public Health Institute in 2001-2002 determined that 15 percent of the surveyed 120 households in Ulaanbaatar use only spring water for their drinking and domestic purposes, 45 percent of them use both spring and water distribution kiosk’s water 6. According to the assessment completed by State Inspectorate Agency in 2003 that 59 percent of total pit latrine, 54 percent of soak pit did not meet hygienic requirement in Ger district. 14 and 34 percent of total households in Ger district, respectively, do not have any pit latrine and soak pit. As result of this situation soil contamination has been increasing progressively during the last years. For instance, soil contamination with bacteriological parameter was assessed as the low polluted level in 1990-1995, but 64.9 and 17 percent of soil sample /370/ was assessed, respectively, as the polluted and high polluted level in 2001-2004. Ministry of Health reports soil contamination contributes to increase risk of infectious diseases such as diarrheal diseases and Hepatitis A in 20-30 percent4. In 2005 a WHO/MOH survey showed more than 75% of soum hospitals and schools do not have safe and adequate water and sanitation facilities. This makes it difficult for health facilities to provide essential health and act as models for the community19. Only 9.2-9.9 percent of soum and town hospital and school have been connected to central water supply and sewage (MCUD, 2006).
As analyzing existing data on water and sanitation provision the information rests with each ministry and agency and is treated as individual private priority. Therefore there are need for extended nationwide survey on access to improved drinking water sources and sanitation facilities to build consolidated national data base with using standardized definitions of indicators of Joint Monitoring Programme of WHO/UNICEF, 2004.
1.3 Operation of wastewater treatment plant According to the 2001 National Survey on Operation and Facility Functioning of Wastewater Treatment Plants, there are 103 wastewater treatment plants countrywide, out of which, 41 /39.8%/ are operational, 27 /26.2%/ are partially operational and 35 /34%/ are non operational. Among the all wastewater plants there are 30 biological, 5 ordinary natural biological, 61 mechanical and 7 mechanical-chemical plants2. Over 200 million cubic meters wastewater is transported by public sewage a year in Mongolia. Of which 60 percent of wastewater is treated by the wastewater treatment facilities and while every year 50 million cubic meters untreated of wastewater is dumped into the environment that pollutes surface and ground water sources. For instance, treated wastewater from central wastewater treatment plant of Ulaanbaatar city is released to the Tuul river. In 1997, a surface water clearness index around the Tuul-Songino area was 4.2, while index was 8.42 in 2004, which showed river water pollution increased due to poor operation of wastewater treatment plant. One of cause for default in technological regime of wastewater treatment plant is untreated or semi treated wastewater from leader processing factories. Their wastewater contains biological oxygen demand and particulate matter exceeding 5-20 times required standard level2.
1.4 Health outcomes related to poor water supply, sanitation and hygiene
Water, sanitation, hygiene and health are interrelated. Inadequate quantities and poor quality of drinking water, lack of sanitation facilities, and poor hygiene cause millions of the world’s poorest people to die from preventable diseases each year. Water, sanitation and hygiene are health risk factors that present different types of hazards including chemical and microbiological hazards, vectors, and injuries 3.
Ensuring safe drinking water is one of the high priorities in Mongolia. Public Health Institute conducted a study identifying the amount of minerals and microelements in ground water between 1993 and 2000 for all soums, aimags and regions. It was determined by the research that unacceptable contents of minerals and microelements in drinking water cause illness of digestive, cardiovascular and urine – genital organs. The survey also defined high cases of dental fluorosis among dwellers of Dornogobi and Sukhbaatar aimags due to high concentration of fluoride in groundwater used for drinking purposes, and high prevalence of iodine deficiency disorder among people of Bulgan, Uvurkhangai, Khovd and Uvs aimags caused by a low content of iodine in drinking water2.
Moreover above the mentioned study showed 13.4 percent of rural population use water that contains a high degree of minerals. Hardness level was assessed in range of 3 to 34 mg-eqi/liter in water of Gobi region, which showed that water in the region contains high amount of hardness2. As shown data of MOFA 110 soum’s (33 percent of all soum) water contains high degree of hardness. High hardness causes increase of risk of chronic diseases of kidney and urine tract. An assessment of spring water quality and hygienic conditions was undertaken by School of Public Health in Mongolia in 2004 with financial and technical support from AGFUND through WHO. This study showed that 78 percent of the total studied springs (127) are observed not to have any protection and upgrade at their surrounding area. From forty to eighty percent of the spring water are evaluated as 4 and 5th degree of cleanliness of surface water in most of studied areas, which do not meet adequate drinking water quality11.
Drinking water sources contain some arsenic and excessive concentrations are known to naturally occur in some areas. Study with support from UNICEF conducted in 2003 -2004 showed arsenic was detected in 10 percent of water samples of all 1023 wells, the concentration of arsenic was higher than acceptable level in water of Gobi-Sumber, Dornod, Gobi-Altai and Dornogobi aimags and any initial health symptoms of chronic effect of arsenic were observed among surveyed population in the aforementioned aimags2.
Water and Sanitation is one of the primary drivers of public health. I often refer to it as “Health 101”, which means that once we can secure access to clean water and to adequate sanitation facilities for all people, irrespective of the difference in their living conditions, a huge battle against all kinds of diseases will be won." (Dr LEE Jong-wook, Director-General, World Health Organization).

60
Since 1990, mining activities have been increased in Mongolia, which leads environmental pollution including mercury contamination of water, soil and air. Study (2004) showed that concentration of mercury in river water of Boroo near the gold mining gold was six times higher than acceptable level. That study also revealed 24.5 percent of studied informal gold miners had symptoms of chronic effect of mercury namely high concentrations of mercury in blood and urine, and symptoms of nervous system5. Nowadays, diarrheal diseases related to poor water, sanitation and hygiene practice are remained still main issue of public health in Mongolia. Diarrheal diseases, including dysenteria, typhoid and Hepatitis A, are one of the major causes of morbidity and mortality under five years1. Study conducted by PHI in 2001-2002 determined the households without pit latrine had more cases of diarrhea (65.2%) to compare to households with pit latrine (P< 0.05, OR=1.8). The households have access to water distribution kiosk had 1.6 times lower cases of diarrhea compared to the households use spring water (P< 0.05, OR=1.6). Moreover the households use raw water had by 20 percent more cases of diarrhea than households do not use raw water (P< 0.05, OR=1.64)6.
1.5 Overview key problems and issues
• Lack of legal framework and institutional structure on water governance and sanitation sector. • Need of Integrated Water Resource Management namely Integrated River Basin management. • No consolidated national data base for water and sanitation provision. • Disparities access to water and sanitation provision in urban and rural areas. • Water and soil contamination are caused by inappropriate waste management. • Health outcomes including morbidity, disability, mortality and well-being caused by communicable and non communicable diseases
related to poor water supply, sanitation and hygiene practice are still main issues of Public Health. • Lack of education and traditional customs on protection of water resources and appropriate use water and sanitation facilities and
hygienic behaviour. • Low public participation on sustainable use of water sources.
REFERENCES
1. Annual health indicators, MOH, 2006, Ulaanbaatar 2. Access to water and sanitation services in Mongolia, UNDP, UNICEF, WHO, Government of Mongolia, 2004 3. Application of methodologies for analysing health outcomes related to unsafe water, sanitation, and hygiene in national studies, Practical
manual for national researchers, WHO, 2006 4. Assessment of contamination of bacteria of soil in Ulaanbaatar city, IAC, PHI, MOH, Ulaanbaatar, 2003 5. Book of Science and research work - V, Public Health Institute, 2006, Ulaanbaatar, page 45-78 6. Book of Science and research work -I V, Public Health Institute, 2005, Ulaanbaatar, page 97-134 7. Inventory data on wells provided by the Ministry of Food and Agriculture, 2003 8. Mongolia Common Country Assessment, United Nations Country Team, Ulaanbaatar, Mongolia, November, 2005 9. Programme for sanitation facilities, Government of Mongolia, 2006 10. Rural water supply, sanitation and hygiene, WHO, AGFUND, UNDP, UNICEF, Government of Mongolia, Ulaanbaatar, 2007 11. Report of the project ‘Healthy springs in Mongolia’, WHO, AGFUND, MOH, SPH, Ulaanbaatar, 2006 12. Report on ‘Survey on soum hospital water, sanitation and hygiene status in Mongolia’, 2006, Ministry of Health, WHO 13. Human development report 2006, Beyond scarcity: Power, poverty and the global water crisis
61
Session 3. Integrated River Basin Management: legislative concerns, methodologies, international and
endorheic river basins and aquifers, extreme events
62
Geomorphological Characterization of Small Hillside River Basins in Semiarid Region of Tunisia for Reducing Uncertainties in Water Resources Management Akira Kawamura1, Achraf Hentati1 and Hideo Amaguchi1 1Department of Civil and Environmental Engineering, Graduate School of Urban Environmental Sciences, Tokyo Metropolitan
University, Minami-Ohsawa, Hachioji, Tokyo 192-0397, Japan ABSTRACT: The small hillside river basins in the semiarid region of Tunisia are very crucial for the sustainability of the water resources, especially for agricultural irrigation water. Tunisian government has introduced a political water resources plan constructing small hillside reservoirs since 1990. Since then, quite a few small hillside reservoirs have constructed. However, flash floods and severe soil loss which jeopardized the function of those small hillside reservoirs are reported. In order to reduce the uncertainties in water resources management of the small hillside river basins in semiarid region, studying the basic information of the river basins which prescribes the fundamental behavior of the basins has a very important role. In this paper, as the first stage of such basic information before analyzing hydro-metrological variables, we focused on the geomorphological characteristics of fifteen small hillside river basins in the semiarid region of Tunisia. The hypsometric curve and topographic index were used as geomorphological indicators. Hypsometric attributes and topographic index statistics were calculated to compare watersheds morphology and to interpret the effect of hypsometric curve shape on the topographic index distribution. The results show that he hypsometric curves of those watersheds can be classified in three groups and the concavity of the hypsometric curve affects the peakedness of the topographic index distribution.
1 INTRODUCTION Water shortage is a major concern in Tunisia as well as in most of the Mediterranean countries which are situated in the arid and semiarid climatic zone where the mean annual rainfall does not exceed 450 mm. Furthermore, this climate is characterized by irregular rainfall, drought, poor vegetation cover, severe soil loss and violent erosion during the flood season (Xiao, 1991). In the beginnings of the 1990s, the Tunisian government launched an ambitious program for constructing small hillside
reservoirs in the northern and central semiarid region of the country. The basic idea is to stimulate the local agriculture producing agricultural irrigation water (Nasri et al., 2004). However, with both the intensive irregular rainfall and severe soil erosion, the lifetime of these reservoirs is in jeopardy. The accumulation of sediment in reservoirs reduces their storage capacity and causes the degradation of water quality. Flash floods with high sediment load are threatening many of these reservoirs and some of them have already been filled up with sediment in less than 10 years (after construction). For example, the Sadine reservoir (volume of 34,380 m3) in central Tunisia was entirely silted up with sediments from two floods in August 1995 and in September 1995. Consequently there is an urgent need to predict flood volume and maximum runoff as well as the hydrograph shape. This is especially important in semiarid regions where flash floods are very frequent. These floods happen very suddenly and are usually difficult to forecast because the time to hydrograph peak is very short, less than six hours (Xiao, 1991). Damages caused by such floods are often serious.
In order to reduce the uncertainties in water resources management of the small hillside river basins in semiarid region, studying the basic information of the river basins which prescribes the fundamental behavior of the basins has a very important role. Investigations have shown that the geomorphology of a river basin has fundamental effects on its hydrologic response (Luo et al., 2003). Consequently, in this work, as the first stage of basic information before analyzing hydro-metrological variables themselves, we focused more on the geomorphological aspect to understand the semiarid watershed characteristics and to bypass the lack of hydrological data on those countries. Both hypsometric curve and topographic index are valuable geomorphological indicators. The river basin area and landform are accurately represented by the hypsometric curve. At the same time it includes a lot of topographical features and provides a visual representation of the watershed’s profile (Luo, 1998; Hancock, 2005). The topographic index is a suitable parameter for indicating the geomorphic control on the generation of the excess-saturation runoff and on the creation of flash floods.
There are no detailed studies on the geomorphological characterization of semiarid river basins in Tunisia. Therefore, the aim of this paper is to represent the geomorphological characteristics of small hillside river basins in semiarid region of Tunisia. Fifteen small hillside river basins were chosen for this study because other data were not available. Their digital elevation models and stream networks were prepared. The hypsometric curves and topographic index distributions were obtained for all basins. Hypsometric attributes and topographic index statistics were calculated to compare watersheds morphology and to interpret the effect of hypsometric curve shape on the topographic index distribution.
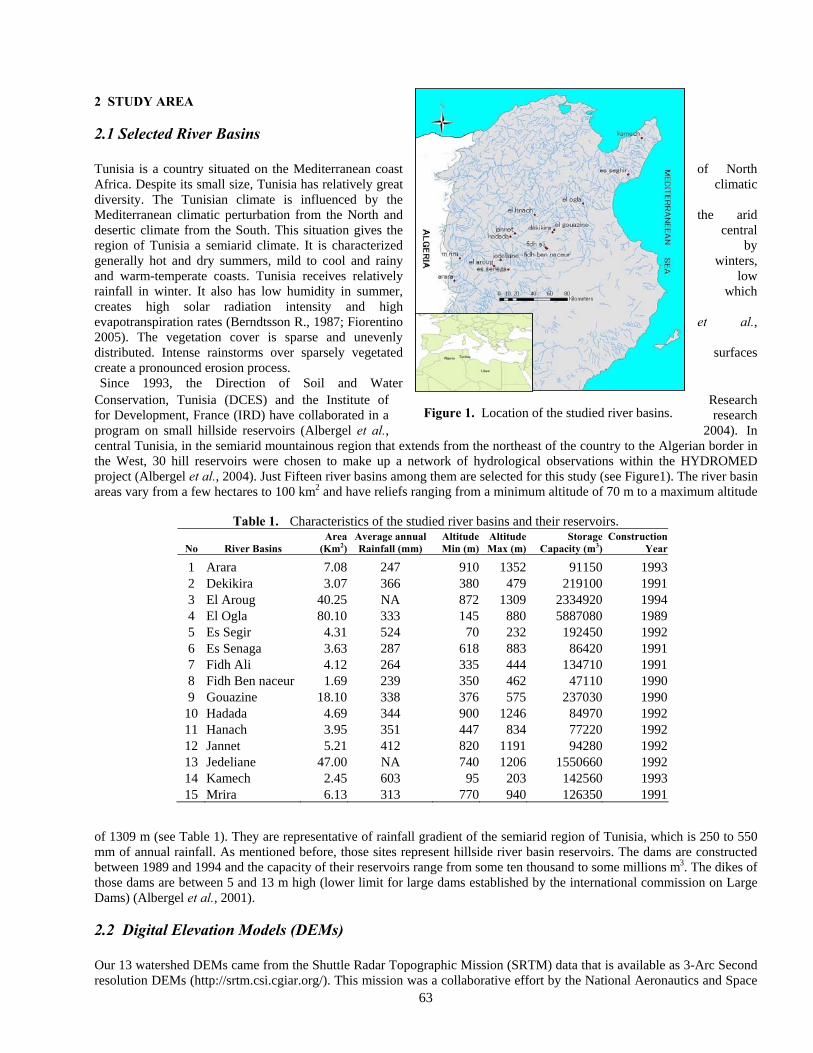
63
2 STUDY AREA
2.1 Selected River Basins Tunisia is a country situated on the Mediterranean coast of North Africa. Despite its small size, Tunisia has relatively great climatic diversity. The Tunisian climate is influenced by the Mediterranean climatic perturbation from the North and the arid desertic climate from the South. This situation gives the central region of Tunisia a semiarid climate. It is characterized by generally hot and dry summers, mild to cool and rainy winters, and warm-temperate coasts. Tunisia receives relatively low rainfall in winter. It also has low humidity in summer, which creates high solar radiation intensity and high evapotranspiration rates (Berndtsson R., 1987; Fiorentino et al., 2005). The vegetation cover is sparse and unevenly distributed. Intense rainstorms over sparsely vegetated surfaces create a pronounced erosion process. Since 1993, the Direction of Soil and Water
Conservation, Tunisia (DCES) and the Institute of Research for Development, France (IRD) have collaborated in a research program on small hillside reservoirs (Albergel et al., 2004). In central Tunisia, in the semiarid mountainous region that extends from the northeast of the country to the Algerian border in the West, 30 hill reservoirs were chosen to make up a network of hydrological observations within the HYDROMED project (Albergel et al., 2004). Just Fifteen river basins among them are selected for this study (see Figure1). The river basin areas vary from a few hectares to 100 km2 and have reliefs ranging from a minimum altitude of 70 m to a maximum altitude
of 1309 m (see Table 1). They are representative of rainfall gradient of the semiarid region of Tunisia, which is 250 to 550 mm of annual rainfall. As mentioned before, those sites represent hillside river basin reservoirs. The dams are constructed between 1989 and 1994 and the capacity of their reservoirs range from some ten thousand to some millions m3. The dikes of those dams are between 5 and 13 m high (lower limit for large dams established by the international commission on Large Dams) (Albergel et al., 2001).
2.2 Digital Elevation Models (DEMs) Our 13 watershed DEMs came from the Shuttle Radar Topographic Mission (SRTM) data that is available as 3-Arc Second resolution DEMs (http://srtm.csi.cgiar.org/). This mission was a collaborative effort by the National Aeronautics and Space
Figure 1. Location of the studied river basins.
Table 1. Characteristics of the studied river basins and their reservoirs.
No River Basins Area
(Km2)Average annual Rainfall (mm)
AltitudeMin (m)
AltitudeMax (m)
StorageCapacity (m3)
ConstructionYear
1 Arara 7.08 247 910 1352 91150 19932 Dekikira 3.07 366 380 479 219100 19913 El Aroug 40.25 NA 872 1309 2334920 19944 El Ogla 80.10 333 145 880 5887080 19895 Es Segir 4.31 524 70 232 192450 19926 Es Senaga 3.63 287 618 883 86420 19917 Fidh Ali 4.12 264 335 444 134710 19918 Fidh Ben naceur 1.69 239 350 462 47110 19909 Gouazine 18.10 338 376 575 237030 1990
10 Hadada 4.69 344 900 1246 84970 199211 Hanach 3.95 351 447 834 77220 199212 Jannet 5.21 412 820 1191 94280 199213 Jedeliane 47.00 NA 740 1206 1550660 199214 Kamech 2.45 603 95 203 142560 199315 Mrira 6.13 313 770 940 126350 1991
64
Administration (NASA), the National Imagery and Mapping Agency (NIMA) and Italian space agency. The mission was launched February 11 2000. It is an example of such a data set, providing an almost complete global coverage of the earth’s land surface at a resolution of 90 m horizontal grid scale (Martinez et al., 2005). The DEMs were converted to the GRID format of Arc/info GIS software. Once in grid format, adjacent DEMs were mosaicked together into a DEM mosaic to cover Tunisia. This mosaic DEM is projected into the coordinate system Carthage-UTM-Zone 32N and then resampled to 100 m resolution. The DEMs of the studied watersheds were clipped out from the mosaic DEM.
3 METHODOLOGY
3.1 Hypsometric Analysis The hypsometric curve represents the relative proportion of basin area that lies below a given height. For a selected basin, the range of elevations is divided into equal elevation intervals. For each interval the proportion of basin area a(z) is calculated. Elevations and areas are respectively normalized by the relief (elevation difference between summit and outlet) and the total area of the river basin as shown in the following equations:
(1)
(2)
where f(z) is the normalized relative frequency of area change with the elevation Z, A is the total area of the watershed and Z is the normalized elevation. Quantitative description of the curve becomes important in hypsometric analysis. Hypsometric
integral (the area under the curve) is the most often used quantitative measure. While this is a useful parameter, it has its limitation as different hypsometric curves may have the same integral. Harlin (1978) developed a technique that is able to quantitatively describe subtle differences of the shape of the curve with statistical skewness and kurtosis by treating the hypsometric curve as a cumulative probability distribution function (Harlin, 1978; Luo, 1998) as shown in the following equation:
(3) where F is the cumulative probability distribution of finding a normalized river basin area at or above a normalized altitude Z and f is the probability density function or the relative frequency of area change with altitude. The hypsometric curves of the studied watersheds are obtained by using DEM to determine the point-
pairs (area, height) and the hypsometric integral, and finally the skewness and kurtosis are calculated. 3.2 Topographic index (TI) The topographic index represents the propensity of a point within a watershed to generate saturation excess overland flow. This kind of hydrological process is due to a topographic control of surface and subsurface flow. In 1979, Beven and Kirkby (1979) defined the topographic index as follows:
(4)
( ) ( )Azazf =
minmax
min
zzzzZ−
−=
10;1)(0
)()(0
≤≤≤≤
= ∫ZZF
dZZfZFZ
⎟⎟⎠
⎞⎜⎜⎝
⎛=
βtanln
aTI
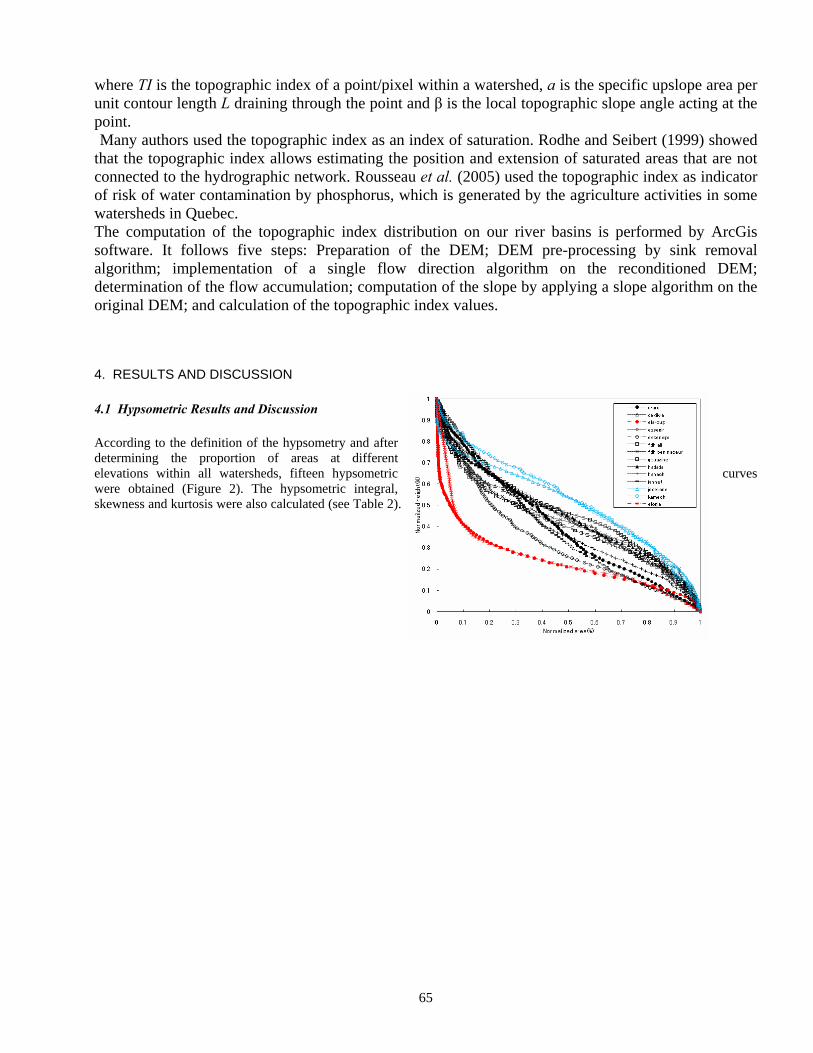
65
where TI is the topographic index of a point/pixel within a watershed, a is the specific upslope area per unit contour length L draining through the point and β is the local topographic slope angle acting at the point. Many authors used the topographic index as an index of saturation. Rodhe and Seibert (1999) showed
that the topographic index allows estimating the position and extension of saturated areas that are not connected to the hydrographic network. Rousseau et al. (2005) used the topographic index as indicator of risk of water contamination by phosphorus, which is generated by the agriculture activities in some watersheds in Quebec. The computation of the topographic index distribution on our river basins is performed by ArcGis software. It follows five steps: Preparation of the DEM; DEM pre-processing by sink removal algorithm; implementation of a single flow direction algorithm on the reconditioned DEM; determination of the flow accumulation; computation of the slope by applying a slope algorithm on the original DEM; and calculation of the topographic index values.
4. RESULTS AND DISCUSSION 4.1 Hypsometric Results and Discussion According to the definition of the hypsometry and after determining the proportion of areas at different elevations within all watersheds, fifteen hypsometric curves were obtained (Figure 2). The hypsometric integral, skewness and kurtosis were also calculated (see Table 2).
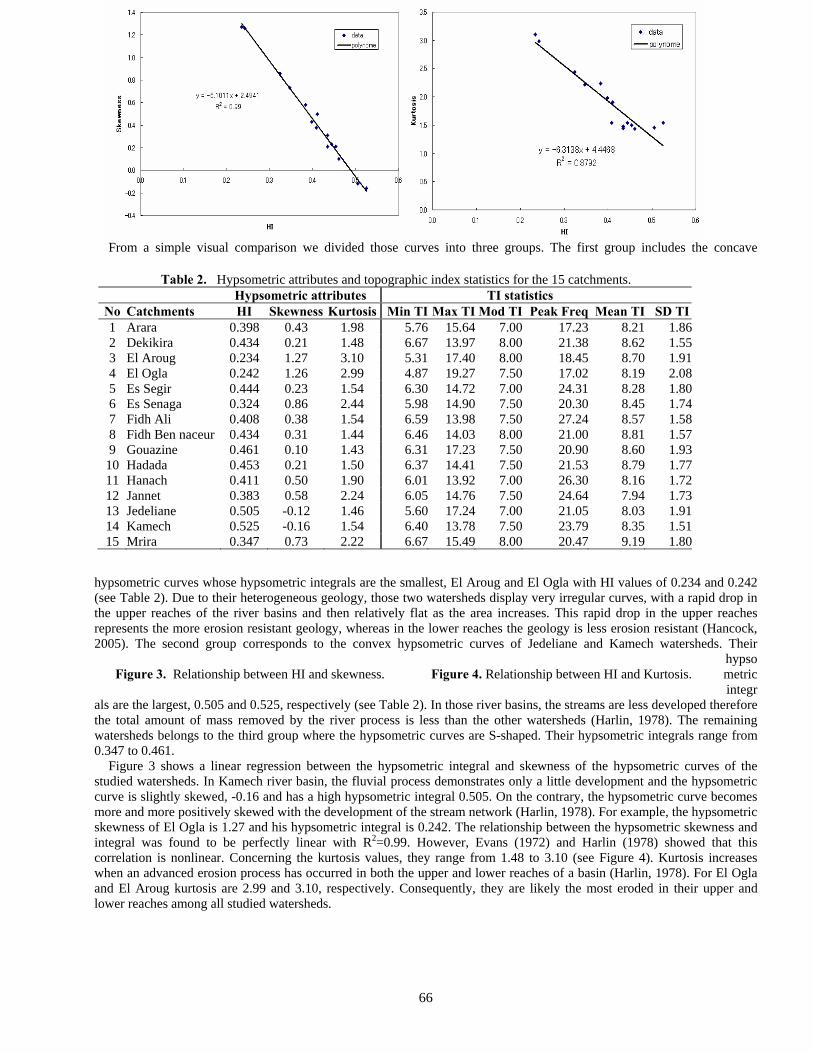
66
From a simple visual comparison we divided those curves into three groups. The first group includes the concave
hypsometric curves whose hypsometric integrals are the smallest, El Aroug and El Ogla with HI values of 0.234 and 0.242 (see Table 2). Due to their heterogeneous geology, those two watersheds display very irregular curves, with a rapid drop in the upper reaches of the river basins and then relatively flat as the area increases. This rapid drop in the upper reaches represents the more erosion resistant geology, whereas in the lower reaches the geology is less erosion resistant (Hancock, 2005). The second group corresponds to the convex hypsometric curves of Jedeliane and Kamech watersheds. Their
hypsometric integr
als are the largest, 0.505 and 0.525, respectively (see Table 2). In those river basins, the streams are less developed therefore the total amount of mass removed by the river process is less than the other watersheds (Harlin, 1978). The remaining watersheds belongs to the third group where the hypsometric curves are S-shaped. Their hypsometric integrals range from 0.347 to 0.461.
Figure 3 shows a linear regression between the hypsometric integral and skewness of the hypsometric curves of the studied watersheds. In Kamech river basin, the fluvial process demonstrates only a little development and the hypsometric curve is slightly skewed, -0.16 and has a high hypsometric integral 0.505. On the contrary, the hypsometric curve becomes more and more positively skewed with the development of the stream network (Harlin, 1978). For example, the hypsometric skewness of El Ogla is 1.27 and his hypsometric integral is 0.242. The relationship between the hypsometric skewness and integral was found to be perfectly linear with R2=0.99. However, Evans (1972) and Harlin (1978) showed that this correlation is nonlinear. Concerning the kurtosis values, they range from 1.48 to 3.10 (see Figure 4). Kurtosis increases when an advanced erosion process has occurred in both the upper and lower reaches of a basin (Harlin, 1978). For El Ogla and El Aroug kurtosis are 2.99 and 3.10, respectively. Consequently, they are likely the most eroded in their upper and lower reaches among all studied watersheds.
Figure 2. Hypsometric curves for 15 catchments.
Figure 3. Relationship between HI and skewness. Figure 4. Relationship between HI and Kurtosis.
Table 2. Hypsometric attributes and topographic index statistics for the 15 catchments. Hypsometric attributes TI statistics No Catchments HI Skewness Kurtosis Min TI Max TI Mod TI Peak Freq Mean TI SD TI1 Arara 0.398 0.43 1.98 5.76 15.64 7.00 17.23 8.21 1.862 Dekikira 0.434 0.21 1.48 6.67 13.97 8.00 21.38 8.62 1.553 El Aroug 0.234 1.27 3.10 5.31 17.40 8.00 18.45 8.70 1.914 El Ogla 0.242 1.26 2.99 4.87 19.27 7.50 17.02 8.19 2.085 Es Segir 0.444 0.23 1.54 6.30 14.72 7.00 24.31 8.28 1.806 Es Senaga 0.324 0.86 2.44 5.98 14.90 7.50 20.30 8.45 1.747 Fidh Ali 0.408 0.38 1.54 6.59 13.98 7.50 27.24 8.57 1.588 Fidh Ben naceur 0.434 0.31 1.44 6.46 14.03 8.00 21.00 8.81 1.579 Gouazine 0.461 0.10 1.43 6.31 17.23 7.50 20.90 8.60 1.93
10 Hadada 0.453 0.21 1.50 6.37 14.41 7.50 21.53 8.79 1.7711 Hanach 0.411 0.50 1.90 6.01 13.92 7.00 26.30 8.16 1.7212 Jannet 0.383 0.58 2.24 6.05 14.76 7.50 24.64 7.94 1.7313 Jedeliane 0.505 -0.12 1.46 5.60 17.24 7.00 21.05 8.03 1.9114 Kamech 0.525 -0.16 1.54 6.40 13.78 7.50 23.79 8.35 1.5115 Mrira 0.347 0.73 2.22 6.67 15.49 8.00 20.47 9.19 1.80

67
4.2 Topographic Index (TI) and Discussion
Fifteen TI maps were generated from the application of a simple flow direction algorithm to the digital elevation models of the studied river basins. High TI values indicate areas characterized by large areas contributing to excess saturation runoff and relatively flat slopes, typically at the base of hill slopes, in valleys and riparian zones. Low TI values are found at the top of hill slopes, where there is relatively little upslope contributing areas and steep slopes. Figure 5 shows that in all cases the TI distributions are unimodal and positively skewed. All statistical values are homogeneous for all the 15 watersheds (see Table 2).
We studied whether there is a relation between the hypsometric curves and TI distributions relatively in the region of study. As a result, we found that both the shape of the hypsometric curve and its relative position on the plot x-y affect the TI distribution. First, the more elevated the hypsometric curve is, the more shifted to the right is the TI distribution. The highest curve corresponds to the least eroded watershed. The slope of Jedeliane watershed is the steepest. Consequently, the TI values are lower than in the other watersheds. On the contrary, the TI values will be the highest for Mrira watershed, which has the lowest hypsometric curve, and thus is the most eroded. The slopes are gentler in Mrira watershed and therefore the TI values low. Second, findings also showed that the concavity of the hypsometric curve affects the peakedness of the TI distribution. The hypsometric curve of El Ogla watershed is more concave and we can clearly distinguish the rapid decrease of the elevations. This shape leads to a lowering effect of the TI values near the peak.
5. CONCLUSIONS
In this paper, we have characterized the geomorphology of small hillside river basins in the semiarid region of Tunisia by the use of the hypsometric curve and the topographic index as geomorphic indicators. The results have shown that the hypsometric curves of those watersheds can be classified in three groups. The most eroded watersheds have concave hypsometric curves with the smallest hypsometric integral and as expected, a higher frequency of topographic index values showing more contributing areas to excess-saturation runoff. On the contrary, the second group of river basins has convex hypsometric curves and higher hypsometric integrals. They have steeper slopes and smaller contributing upslope areas. In this case, lower topographic index values are more frequent. The third group is intermediate. Further, this study suggests that the hypsometric curve shape affects the topographic index distribution. This finding will be the subject of further investigation. The obtained morphological characteristics of small hillside river basins in semiarid region of Tunisia will provide effective and useful information for the next stage of reducing uncertainties in water resources management by analyzing hydro-metrological variables of the river basins.
Figure 5. TI distributions for 15 catchments.
68
6. REFERENCES
Albergel, J. and Nasri, S. (2001). ”HYDROMED: Rapport final du programme de recherche sur les lacs collinaires dans les
zones semi-arides du pourtour mediterraneen.” Contrat europeen, INCO DC ERBIC 18 CT 960091- STD4. IRD/INRGREF, Tunis, p. 120.
Albergel, J., Nasri, S., Boufaroua, M., Droubi, A., Merzouk, A. A. (2004). “Rain water harvesting and management of small dams in Mediterranean areas (North Africa and Middle East).” Proc. of Conference in Ohrid, FY Republic of Macedonia, pp.1-12.
Berndtsson, R. (1987), “Spatial and temporal variability of rainfall and potential evaporation in Tunisia.” IAHS Publ. No. 168, pp.91-100.
Beven, K. J. and Kirkby, M .J. (1979). “A physically-based,variable contributing area model of basin hydrology.“ Hydrological Sciences Bulletin, No. 24, pp.43-69.
Evans, I.S. (1972), “General gomorphometry, derivatives of altitude, and descriptive statistics.” Proc. of Symp. on Spatial Analysis in geomorphology, Cambridge, England.
Fiorentino, M., Carriero, D., Iacobellis, V., Manfreda, S. and Portoghese, I. (2005). “Medclub-starting line and first activities.” IAHS Publ, pp.1-14.
Hancock, G. R. (2005). “The use of digital elevation models in the identification and characterization of catchments over different grid scales.” Hydrological Processes Vol.19, No.9, pp.1727-174.
Harlin, J. (1978). “Statistical moments of the hypsometric curve and its density function.” Mathematical Geology Vol.10, No.1, pp.59-72.
Luo, W. (1998). “Hypsometric analysis with a geographic information system.” Computers and Geosciences Vol.24, No.8, pp.815-821.
Luo, W. and Harlin, J.M. (2003). “A theoretical travel time based on watershed hypsometry.” Journal of the American Water Resources Association, Vol.39, No.4, pp.785-792.
Nasri, S., Cudennec C., Albergel, J. and Berndtsson, R. (2004), “Use of a geomorphoplogical transfer function to model design floods in small hillside catchments in semiarid Tunisia.” Journal of Hydrology, No.287, pp.197-213.
Martinez C., Hancock G. R., Evans K. G. and Moliere D. R. (2005). “A catchment based assessment of the 3-Arc Second SRTM Digital Elevation Data set.” Proc. of MODSIM 2005, pp. 409-1415.
Rhode A. and Seibert J. (1999). “Wetland occurrence in relation to topography: a test of topography indices as moisture indicators.” Agric. For Meteorol. No.98/99, pp.325-340.
Rousseau, A. N., Hentati A., Tremblay S., Quilbй R. and Villeneuve, J. P. (2005). “Computation of the topographic index on 16 watersheds in Quebec.” Report No.R800-f, INRS-ETE, La Couronne, Quebec , Canada.
Xiao, L. (1991). “Flash floods in arid and semiarid zones.” IHP-V Technical Documents in Hydrology, No.23, UNESCO, France.
69
Urban Flood Forecast Uncertainty when Using Raingauge and Radar Data
Richard P. Ibbitt1, Martyn P. Clark1, and Ross A. Woods1
1 National Institute of Water and Atmospheric Research (NIWA), P.O. Box 8602, Christchurch, New Zealand
ABSTRACT: A spatially distributed rainfall-to-runoff model has been fitted to an urban catchment in New Zealand using measured flow and rainfall data. Check results using rainfall data not used to fit the model show a better level of simulation accuracy than the results obtained in the model fitting (R2
fitting=61%, R2checking=83%). The fitting was carried out using a
stochastic global fitting procedure and “behavioural” model parameter sets obtained after convergence of the fitting procedure have been used to generate confidence intervals for simulated results. The model was then given radar estimates of the rainfall and a new set of confidence intervals were generated. The radar-based confidence intervals are much wider than the raingauge based estimates. Explanations for results are offered based on comments in the literature.
INTRODUCTION Flood forecasting is an uncertain business, especially in urban areas where catchments are small and runoff is rapid. For forecasts to be of value the uncertainty in them needs to be quantified. Then forecasters can assess just how reliable a forecast is. Flood forecasts contain uncertainty, partly because they are based on models that are approximate representations of catchment dynamics, and partly because they rely on data that is only a sample of what actually occurs. Initially, the main source of uncertainty was considered to be caused by not knowing the correct values for the parametric values that control the behaviour of the model used to convert rainfall into flow. Duan et al. (1992), Vrugt et al (2003), Tolson and Shoemaker (2007) have effectively solved this problem. As part of their solution these methods identify many equally likely solutions. These solutions, called “behavioural” solutions by Beven and Freer (2001), can be used to define the uncertainty likely in a forecast caused by the uncertainty in a model’s parameter values. Quantification of parameter uncertainty has enabled attention to be focused on other sources of uncertainty. Kavetski et al. (2006a, 2006b), Vrugt et al. (2003) have looked into the issue of uncertainty in the data used as input to a catchment model. These data are typically, but not always, rainfall depths over fixed intervals. They introduce uncertainty into a forecast as they represent a very small sample of rainfall over a catchment and may not be spatially representative of what is actually occurring. Data from weather radar scans have the potential to overcome this problem. These data show detailed spatial resolution, typically down to 1 km2, and are available at a temporal resolution consistent with the time of concentration of small urban basins. Use of either raingauge data, or radar data, for forecasts have the same limitation since they are based on measured data up to the forecast time and do not contain any information on the future rainfall. In addition, radar images are not direct measurements of rainfall but are measurements of the reflection of electro-magnetic radiation off water droplets in the atmosphere. Despite their apparent limitations, the high spatial resolution of radar-based rainfall, and their rate of measurement, at least every 15 minutes, mean that it is possible to build up a picture of which way a storm is moving, whether it is intensifying or decaying, and where the patches of heaviest rainfall are. Pattern recognition software can then be used to project what might happen over future time horizons, perhaps out to 1.5 hours. The question then becomes: how good will be the streamflow forecasts from such rainfall forecasts since Seed (2006) indicated that “hydrological applications based on ensemble forecasts are a long way from being operational”. This paper seeks to provide an indication of what is now possible in a research environment and what could become the norm for flood forecasting in urban areas.
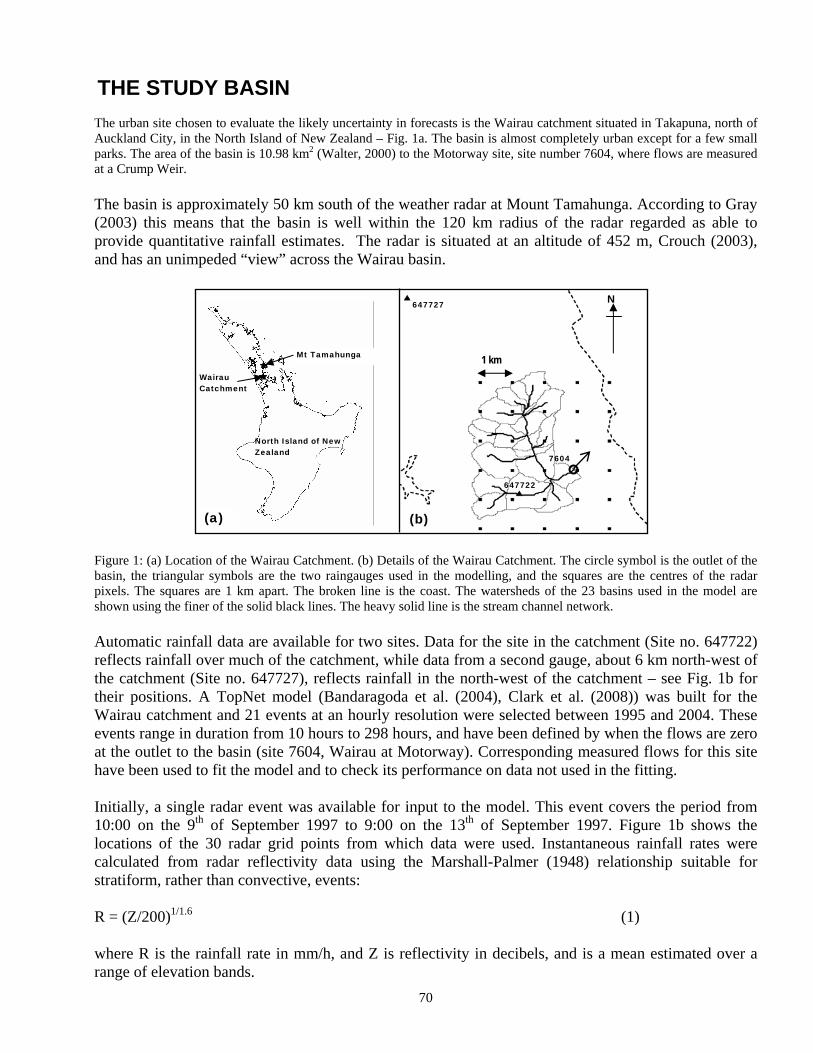
70
THE STUDY BASIN The urban site chosen to evaluate the likely uncertainty in forecasts is the Wairau catchment situated in Takapuna, north of Auckland City, in the North Island of New Zealand – Fig. 1a. The basin is almost completely urban except for a few small parks. The area of the basin is 10.98 km2 (Walter, 2000) to the Motorway site, site number 7604, where flows are measured at a Crump Weir. The basin is approximately 50 km south of the weather radar at Mount Tamahunga. According to Gray (2003) this means that the basin is well within the 120 km radius of the radar regarded as able to provide quantitative rainfall estimates. The radar is situated at an altitude of 452 m, Crouch (2003), and has an unimpeded “view” across the Wairau basin.
Figure 1: (a) Location of the Wairau Catchment. (b) Details of the Wairau Catchment. The circle symbol is the outlet of the basin, the triangular symbols are the two raingauges used in the modelling, and the squares are the centres of the radar pixels. The squares are 1 km apart. The broken line is the coast. The watersheds of the 23 basins used in the model are shown using the finer of the solid black lines. The heavy solid line is the stream channel network. Automatic rainfall data are available for two sites. Data for the site in the catchment (Site no. 647722) reflects rainfall over much of the catchment, while data from a second gauge, about 6 km north-west of the catchment (Site no. 647727), reflects rainfall in the north-west of the catchment – see Fig. 1b for their positions. A TopNet model (Bandaragoda et al. (2004), Clark et al. (2008)) was built for the Wairau catchment and 21 events at an hourly resolution were selected between 1995 and 2004. These events range in duration from 10 hours to 298 hours, and have been defined by when the flows are zero at the outlet to the basin (site 7604, Wairau at Motorway). Corresponding measured flows for this site have been used to fit the model and to check its performance on data not used in the fitting. Initially, a single radar event was available for input to the model. This event covers the period from 10:00 on the 9th of September 1997 to 9:00 on the 13th of September 1997. Figure 1b shows the locations of the 30 radar grid points from which data were used. Instantaneous rainfall rates were calculated from radar reflectivity data using the Marshall-Palmer (1948) relationship suitable for stratiform, rather than convective, events: R = (Z/200)1/1.6 (1) where R is the rainfall rate in mm/h, and Z is reflectivity in decibels, and is a mean estimated over a range of elevation bands.
647727
647722
7604
1 km Mt Tamahunga
Wairau Catchment
North Island of New Zealand
(a) (b)
N

71
MODEL PROCEDURES Figure 1b shows the spatial subdivision of the Wairau catchment used in the TopNet model. The basin was modelled at the Strahler 1 level of resolution so as to extract the maximum information from the various sets of spatial data used to build the model’s spatial structure. The model was fitted to the basin (calibration) and shown to produce realistic results for data not used in the fitting process (validation). Once there was demonstrable confidence in the model it was used to investigate how well it performed on radar-based rainfall data since it is these data that will form the likely input to forecasting systems over small urban basins. The first step in the experimental procedure was to identify a number of events when there was substantial outflow from the catchment. For much of the time the flow recorder at the outlet records zero or near zero flows. The fitting procedure adopted was to combine the goodness of fitting criterion for 11 of the 21 events identified as large enough to justify a potential flood forecast run. This led to the chosen goodness of fit criterion, minimization of the sum of squares between the measured and modelled hourly flows, being summed over all the flows in all 11 events. Model fitting was done using the Shuffled Complex Evolution Metropolis (SCEM) algorithm of Vrugt et al. (2003). As the algorithm approaches a converged state, it generates multiple sets of model control parameters that can be regarded as equally likely contenders for the “best” set. Each parameter set can be used to generate a different set of flow outcomes, and the flows for each individual time step can be analysed to derive the probability density function for that time step. The emphasis in the results below is on the flow outcomes rather than the distribution of model parameters. A total of 500 equally likely, or behavioural, sets of parameters were generated during the fitting process. These were then used with the 10 events not used for fitting the model to generate validation results for model runs based on measured raingauge data. Finally, the raingauge and radar-based data were separately used as input to generate flows for the period 9/9/1997 to 13/9/1997.
RESULTS The results presented refer mainly to the model validation runs as these are the results that best show the performance of the model. Figure 2 shows the uncertainty limits for a selection of the events used for checking the model. The quality of the simulated peaks is better than that from the model fitting (The Nash-Sutcliffe efficiency coefficient, R2, (Nash et al., 1970) for the validation run was 83% compared to a value of 61% for the calibration.) and suggests that the model has been adequately fitted. The solid line hydrograph in Fig. 2 is the one generated by the model using the set of parameters that generated the best value of the fitting criterion. The narrow dark grey bands plotted around the solid line are the uncertainty arising solely from parameter uncertainty. They are derived by calculating the spread of the modelled flows at a particular time around the “best” modelled flow for that time. The outer, lighter grey bands are the overall uncertainty from all sources and are computed using the differences between all the modelled flows at a particular time and the corresponding measured flow. The level of uncertainty chosen for the two bands is 95%, and both bands are plotted around the “best” modelled flow for each time interval. The results show that 95% of the parameter sets generate very similar modelled hydrographs, that is the dark grey band is narrow compared to the light grey band. The much greater width of the light grey
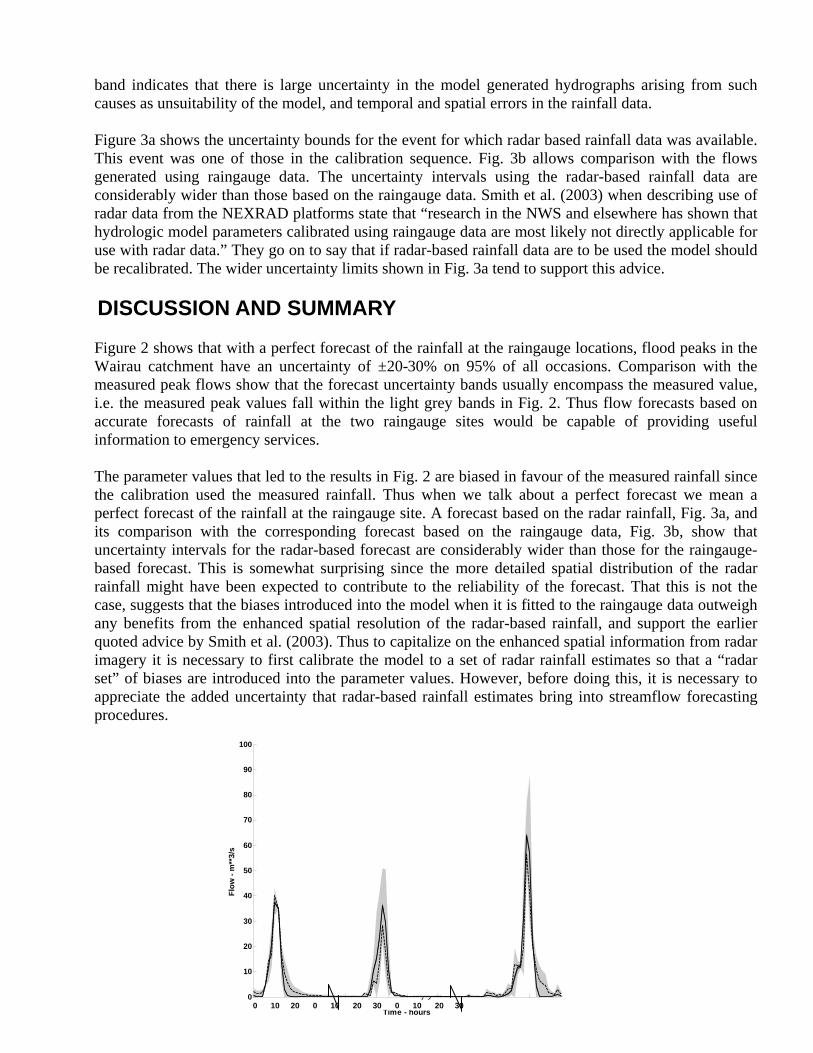
72
band indicates that there is large uncertainty in the model generated hydrographs arising from such causes as unsuitability of the model, and temporal and spatial errors in the rainfall data. Figure 3a shows the uncertainty bounds for the event for which radar based rainfall data was available. This event was one of those in the calibration sequence. Fig. 3b allows comparison with the flows generated using raingauge data. The uncertainty intervals using the radar-based rainfall data are considerably wider than those based on the raingauge data. Smith et al. (2003) when describing use of radar data from the NEXRAD platforms state that “research in the NWS and elsewhere has shown that hydrologic model parameters calibrated using raingauge data are most likely not directly applicable for use with radar data.” They go on to say that if radar-based rainfall data are to be used the model should be recalibrated. The wider uncertainty limits shown in Fig. 3a tend to support this advice.
DISCUSSION AND SUMMARY Figure 2 shows that with a perfect forecast of the rainfall at the raingauge locations, flood peaks in the Wairau catchment have an uncertainty of ±20-30% on 95% of all occasions. Comparison with the measured peak flows show that the forecast uncertainty bands usually encompass the measured value, i.e. the measured peak values fall within the light grey bands in Fig. 2. Thus flow forecasts based on accurate forecasts of rainfall at the two raingauge sites would be capable of providing useful information to emergency services. The parameter values that led to the results in Fig. 2 are biased in favour of the measured rainfall since the calibration used the measured rainfall. Thus when we talk about a perfect forecast we mean a perfect forecast of the rainfall at the raingauge site. A forecast based on the radar rainfall, Fig. 3a, and its comparison with the corresponding forecast based on the raingauge data, Fig. 3b, show that uncertainty intervals for the radar-based forecast are considerably wider than those for the raingauge-based forecast. This is somewhat surprising since the more detailed spatial distribution of the radar rainfall might have been expected to contribute to the reliability of the forecast. That this is not the case, suggests that the biases introduced into the model when it is fitted to the raingauge data outweigh any benefits from the enhanced spatial resolution of the radar-based rainfall, and support the earlier quoted advice by Smith et al. (2003). Thus to capitalize on the enhanced spatial information from radar imagery it is necessary to first calibrate the model to a set of radar rainfall estimates so that a “radar set” of biases are introduced into the parameter values. However, before doing this, it is necessary to appreciate the added uncertainty that radar-based rainfall estimates bring into streamflow forecasting procedures.
550 560 570 580 590 600 610 620 630 640 6500
10
20
30
40
50
60
70
80
90
100
Time - hours
Flo
w -
m**
3/s
0 10 20 0 10 20 30 0 10 20 30
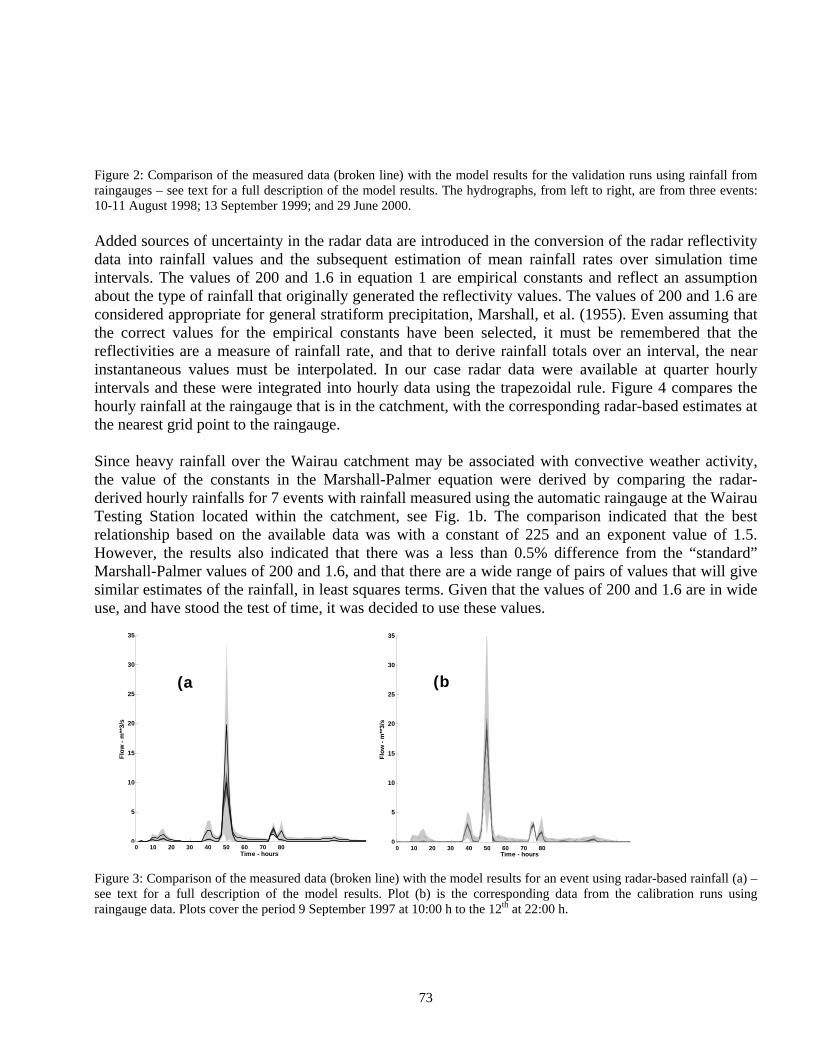
73
Figure 2: Comparison of the measured data (broken line) with the model results for the validation runs using rainfall from raingauges – see text for a full description of the model results. The hydrographs, from left to right, are from three events: 10-11 August 1998; 13 September 1999; and 29 June 2000. Added sources of uncertainty in the radar data are introduced in the conversion of the radar reflectivity data into rainfall values and the subsequent estimation of mean rainfall rates over simulation time intervals. The values of 200 and 1.6 in equation 1 are empirical constants and reflect an assumption about the type of rainfall that originally generated the reflectivity values. The values of 200 and 1.6 are considered appropriate for general stratiform precipitation, Marshall, et al. (1955). Even assuming that the correct values for the empirical constants have been selected, it must be remembered that the reflectivities are a measure of rainfall rate, and that to derive rainfall totals over an interval, the near instantaneous values must be interpolated. In our case radar data were available at quarter hourly intervals and these were integrated into hourly data using the trapezoidal rule. Figure 4 compares the hourly rainfall at the raingauge that is in the catchment, with the corresponding radar-based estimates at the nearest grid point to the raingauge. Since heavy rainfall over the Wairau catchment may be associated with convective weather activity, the value of the constants in the Marshall-Palmer equation were derived by comparing the radar-derived hourly rainfalls for 7 events with rainfall measured using the automatic raingauge at the Wairau Testing Station located within the catchment, see Fig. 1b. The comparison indicated that the best relationship based on the available data was with a constant of 225 and an exponent value of 1.5. However, the results also indicated that there was a less than 0.5% difference from the “standard” Marshall-Palmer values of 200 and 1.6, and that there are a wide range of pairs of values that will give similar estimates of the rainfall, in least squares terms. Given that the values of 200 and 1.6 are in wide use, and have stood the test of time, it was decided to use these values.
Figure 3: Comparison of the measured data (broken line) with the model results for an event using radar-based rainfall (a) – see text for a full description of the model results. Plot (b) is the corresponding data from the calibration runs using raingauge data. Plots cover the period 9 September 1997 at 10:00 h to the 12th at 22:00 h.
0 10 20 30 40 50 60 70 80 900
5
10
15
20
25
30
35
Time - hours
Flo
w -
m**
3/s
190 200 210 220 230 240 250 260 270 2800
5
10
15
20
25
30
35
Time - hours
Flo
w -
m**
3/s
(a (b
0 10 20 30 40 50 60 70 80 0 10 20 30 40 50 60 70 80
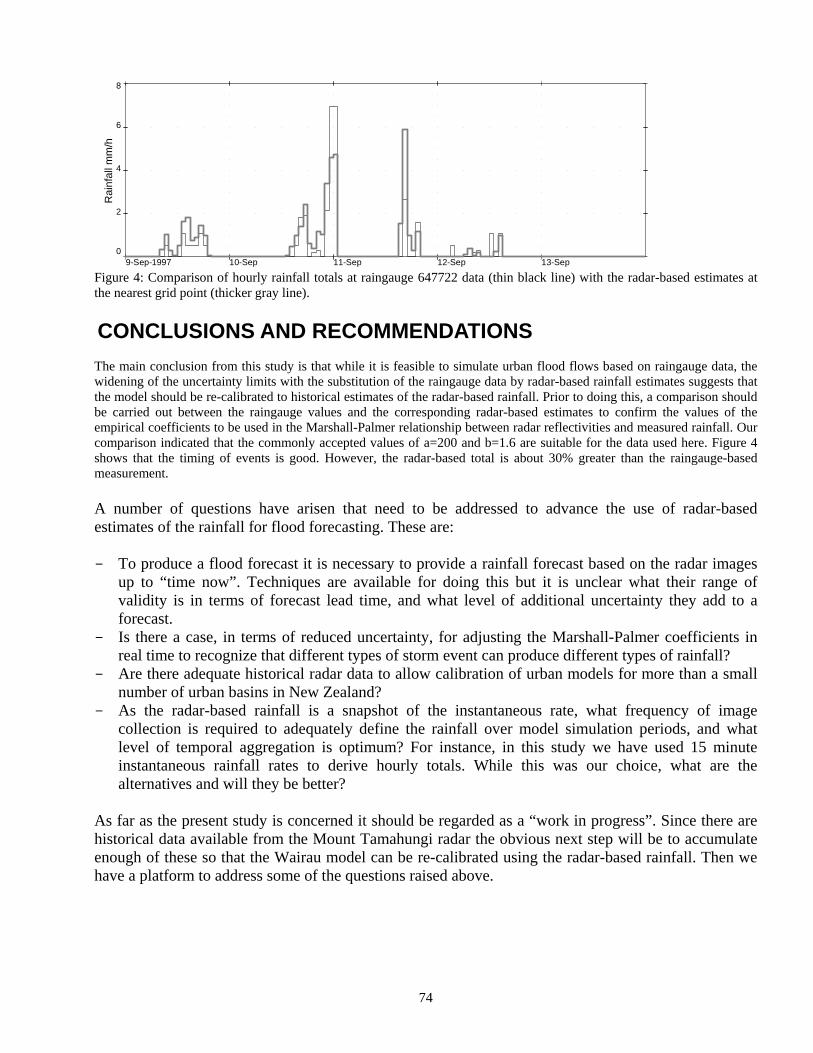
74
Figure 4: Comparison of hourly rainfall totals at raingauge 647722 data (thin black line) with the radar-based estimates at the nearest grid point (thicker gray line).
CONCLUSIONS AND RECOMMENDATIONS The main conclusion from this study is that while it is feasible to simulate urban flood flows based on raingauge data, the widening of the uncertainty limits with the substitution of the raingauge data by radar-based rainfall estimates suggests that the model should be re-calibrated to historical estimates of the radar-based rainfall. Prior to doing this, a comparison should be carried out between the raingauge values and the corresponding radar-based estimates to confirm the values of the empirical coefficients to be used in the Marshall-Palmer relationship between radar reflectivities and measured rainfall. Our comparison indicated that the commonly accepted values of a=200 and b=1.6 are suitable for the data used here. Figure 4 shows that the timing of events is good. However, the radar-based total is about 30% greater than the raingauge-based measurement. A number of questions have arisen that need to be addressed to advance the use of radar-based estimates of the rainfall for flood forecasting. These are: - To produce a flood forecast it is necessary to provide a rainfall forecast based on the radar images
up to “time now”. Techniques are available for doing this but it is unclear what their range of validity is in terms of forecast lead time, and what level of additional uncertainty they add to a forecast.
- Is there a case, in terms of reduced uncertainty, for adjusting the Marshall-Palmer coefficients in real time to recognize that different types of storm event can produce different types of rainfall?
- Are there adequate historical radar data to allow calibration of urban models for more than a small number of urban basins in New Zealand?
- As the radar-based rainfall is a snapshot of the instantaneous rate, what frequency of image collection is required to adequately define the rainfall over model simulation periods, and what level of temporal aggregation is optimum? For instance, in this study we have used 15 minute instantaneous rainfall rates to derive hourly totals. While this was our choice, what are the alternatives and will they be better?
As far as the present study is concerned it should be regarded as a “work in progress”. Since there are historical data available from the Mount Tamahungi radar the obvious next step will be to accumulate enough of these so that the Wairau model can be re-calibrated using the radar-based rainfall. Then we have a platform to address some of the questions raised above.
Rai
nfal
l mm
/h
0
2
4
6
8
9-Sep-1997 10-Sep 11-Sep 12-Sep 13-Sep
75
ACKNOWLEDGEMENTS The authors would like to thank the Auckland Regional Council for making the rainfall and flow data available, and Dr Warren Gray (Ministry for the Environment) for getting the radar data into a form that was usable by the project and for advancing our understanding of the radar data. NIWA and UNESCO (Wellington) jointly funded attendance at the “Uncertainties in Water Resources Management: causes, technologies and consequences” conference. The project work was funded through the New Zealand Foundation of Research Science and Technology Reducing the Impacts of Weather Related Hazards Programme (Contract C01X0401).
REFERENCES Bandaragoda C., Tarboton D.G., and Woods R. (2004). “Application of Topnet in the Distributed Model Intercomparison
Project.” J. of Hydrol., 298:178–201. Beven, K., and Freer, J. (2001). “Equifinality, data assimilation, and uncertainty estimation in mechanistic modelling of
complex environmental systems using the GLUE methodology.” J. of Hydrol., 249:11-29. Clark, M.P., Rupp, D.E., Woods, R.A., Xiaogu Zheng, Ibbitt, R.P., Slater, A.G., Schmidt, J., and Uddstrom, M.J. (2008).
“Hydrological data assimilation with the ensemble Kalman filter: Use of streamflow observations to update states in a distributed hydrological model”, accepted for publication in Advances in Water Resourc.
Crouch, J. (2003). “Using radar to diagnose weather systems.” Tephra 20: 46-48. Duan, Q., Sorooshian, S., and Gupta, V.K. (1992). “Effective and efficient global optimization for conceptual rainfall-runoff
models.” Water Resourc. Res., 28:1015-1031. Gray, W. (2003). “Overview of weather and coastal hazards in the Northland region: Part 1 Weather hazards.” NIWA Client
Report WLG2003-57, 26p. Kavetski, D., Kuczera, G., and Franks, S.W. (2006a). “Bayesian analysis of input uncertainty in hydrological modelling. I.
Theory.” Water Resourc. Res. 42, W03407 doi:10.1029/2005WR004368. Kavetski, D., Kuczera, G., and Franks, S.W. (2006b). “Bayesian analysis of input uncertainty in hydrological modelling. II.
Application.” Water Resourc. Res. 42, W03408, doi:10.1029/2005WR004376. Marshall, J.S., and Palmer, W. McK., (1948). “The distribution of raindrops with size.” J of Meteorology, 5,165-166. Marshall, J. S., W. Hitschfeld, and K. L. S. Gunn. (1955). “Advances in radar weather.” Adv. Geophys. 2, 1-56. Nash, J. E., and Sutcliffe J. V., (1970). River flow forecasting through conceptual models part I — A discussion of
principles, Journal of Hydrology, 10 (3), 282–290. Seed, A. (2006). “Forecasting rainfall at short time and space scales.” Presentation to the 2nd Intl. Symp. On Quantitative
Precipitation forecasting and Hydrology, 4-8 June 2006, Boulder, Colorado, USA. Smith, M.B., Laurine, D.P., Koren, V.I., Reed, S.M., and Ziya Zhang. (2003). “Hydrologic model calibration in the National
Weather Service.” In “Calibration of watershed models”, Eds. Duan Q., Gupta, H.V., Sorooshian, S., Rousseau, A.N., Turcotte, R., Publ. American Geophysical Union, Washington, D.C., USA, pp 133-152.
Tolson, B. A., and Shoemaker C. A. (2007). “Dynamically dimensioned search algorithm for computationally efficient watershed model calibration.” Water Resourc. Res., 43, W01413, doi:10.1029/2005WR004723.
Walter, K.M. (2000). Index to hydrological recording sites in New Zealand, NIWA Technical Report 73, 216p. Vrugt, J.A., Gupta, H.V., Bouten, W., and Sorooshian, S. (2003). “A shuffled complex evolution
metropolis algorithm for optimization and uncertainty assessment of hydrological model parameters.” Water Resourc. Res., 39(8), 1201, doi:10.1029/2002WR001642.
76
Optimal planning and operation of the drinking water supply system of the city Darkhan in Mongolia
Buren Scharaw, Thomas Westerhoff
Dr. Buren Scharaw Fraunhofer Anwendungszentrum Systemtechnik Am Vogelherd 50, 98693
Ilmenau, Germany Telefon: +49 (0) 3677 / 461-121,
mailto: [email protected] http://www.ast.iitb.fraunhofer.de
Dipl.-Ing. Thomas Westerhoff
Fraunhofer Anwendungszentrum Systemtechnik Am Vogelherd 50, 98693 Ilmenau, Germany
Telefon: +49 (0) 3677 / 461-107, mailto: [email protected]
1. Abstract
Within the framework of realizing the German BMBF-program objectives, Mongolia is proposed as a model region
(MoMo) for the development, solution and implementation of integrated water resources management (IWRM). The
working package 5 (WP) of MoMo project is dealing with the management of drinking water supply system of city
Darkhan. The management of the water supply system is considered as three general working steps: modelling of the
drinking water supply system (DWSS) calibration of the model and system parameters and management of the daily
operating strategies as a decision support system.
2. Introduction
The purpose of the water supply plan of Darkhan with a population of around 120,000 inhabitants is to define the
development and management policy of the water supply facilities of the city in order to meet the expected requirements
until 2020, including those likely to arise from the progressive urbanisation of the ger (or yurts) areas. One specificity of
city Darkhan is the existence, beside a conventional urban area commonly referred to as the core area and equipped with all
the facilities of modern cities, of large informal housing areas combining small houses and ger (Mongolian name for yurt).
These ger areas regroup more than one half of the population of Darkhan, mainly the traditional and newly settled families
and are not connected to DWSS. The DWSS structure in Darkhan is compared to other cities relatively simple. The tank
area is located between the pump field and the city on a hill and the city on the opposite side of this hill is supplied by the
tanks without any additional pump in free fall.
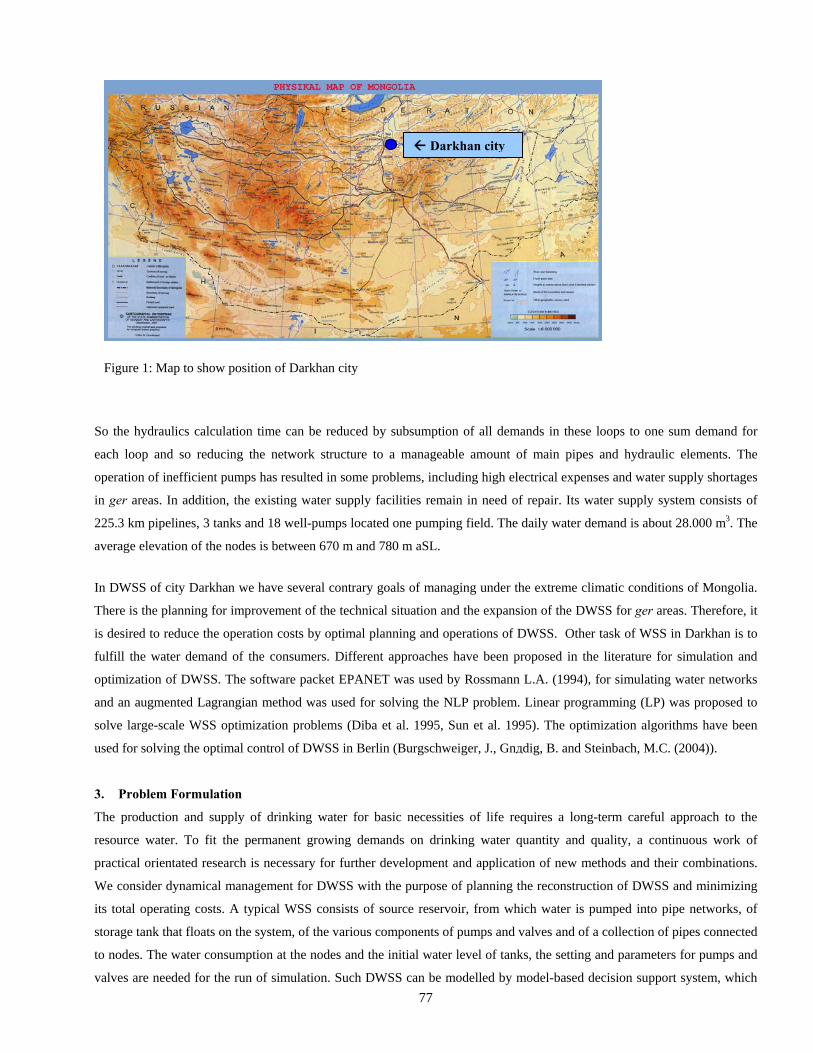
77
So the hydraulics calculation time can be reduced by subsumption of all demands in these loops to one sum demand for
each loop and so reducing the network structure to a manageable amount of main pipes and hydraulic elements. The
operation of inefficient pumps has resulted in some problems, including high electrical expenses and water supply shortages
in ger areas. In addition, the existing water supply facilities remain in need of repair. Its water supply system consists of
225.3 km pipelines, 3 tanks and 18 well-pumps located one pumping field. The daily water demand is about 28.000 m3. The
average elevation of the nodes is between 670 m and 780 m aSL.
In DWSS of city Darkhan we have several contrary goals of managing under the extreme climatic conditions of Mongolia.
There is the planning for improvement of the technical situation and the expansion of the DWSS for ger areas. Therefore, it
is desired to reduce the operation costs by optimal planning and operations of DWSS. Other task of WSS in Darkhan is to
fulfill the water demand of the consumers. Different approaches have been proposed in the literature for simulation and
optimization of DWSS. The software packet EPANET was used by Rossmann L.A. (1994), for simulating water networks
and an augmented Lagrangian method was used for solving the NLP problem. Linear programming (LP) was proposed to
solve large-scale WSS optimization problems (Diba et al. 1995, Sun et al. 1995). The optimization algorithms have been
used for solving the optimal control of DWSS in Berlin (Burgschweiger, J., Gnдdig, B. and Steinbach, M.C. (2004)).
3. Problem Formulation
The production and supply of drinking water for basic necessities of life requires a long-term careful approach to the
resource water. To fit the permanent growing demands on drinking water quantity and quality, a continuous work of
practical orientated research is necessary for further development and application of new methods and their combinations.
We consider dynamical management for DWSS with the purpose of planning the reconstruction of DWSS and minimizing
its total operating costs. A typical WSS consists of source reservoir, from which water is pumped into pipe networks, of
storage tank that floats on the system, of the various components of pumps and valves and of a collection of pipes connected
to nodes. The water consumption at the nodes and the initial water level of tanks, the setting and parameters for pumps and
valves are needed for the run of simulation. Such DWSS can be modelled by model-based decision support system, which
Figure 1: Map to show position of Darkhan city
Darkhan city
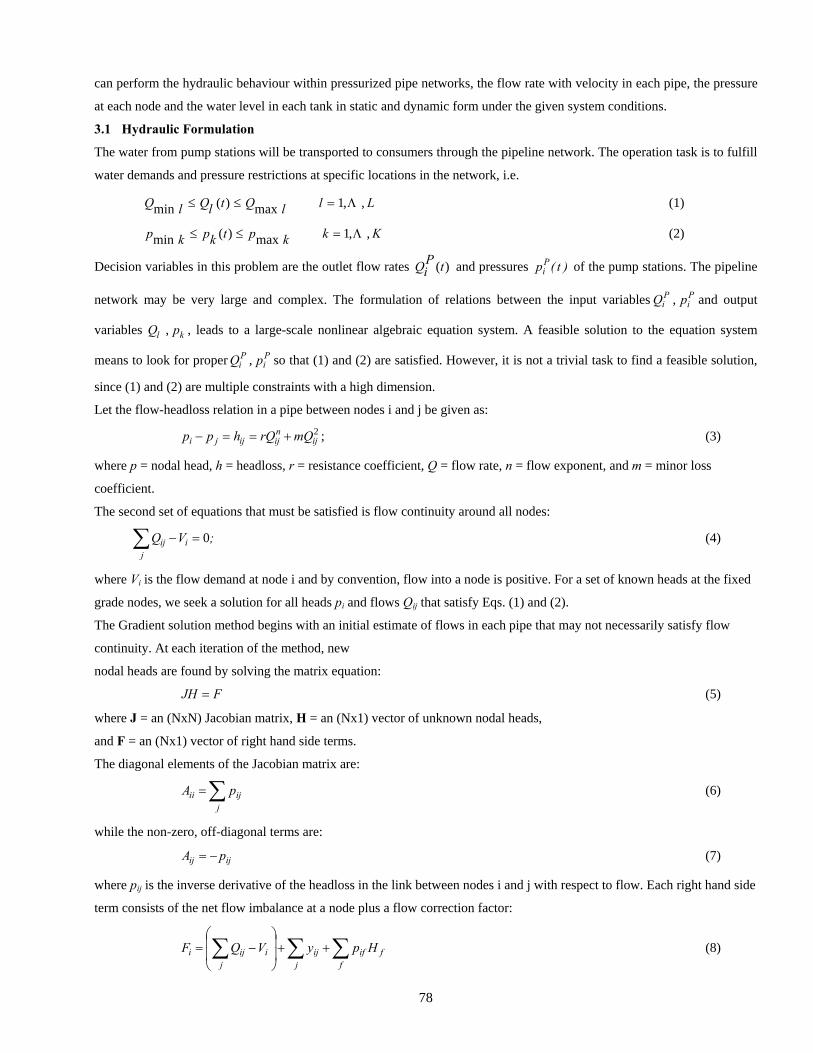
78
can perform the hydraulic behaviour within pressurized pipe networks, the flow rate with velocity in each pipe, the pressure
at each node and the water level in each tank in static and dynamic form under the given system conditions.
3.1 Hydraulic Formulation
The water from pump stations will be transported to consumers through the pipeline network. The operation task is to fulfill
water demands and pressure restrictions at specific locations in the network, i.e.
LllQtlQlQ ,,1max)(min Λ=≤≤ (1)
Kkkptkpkp ,,1max)(min Λ=≤≤ (2)
Decision variables in this problem are the outlet flow rates )(tPiQ and pressures )t(pP
i of the pump stations. The pipeline
network may be very large and complex. The formulation of relations between the input variables PiQ , P
ip and output
variables lQ , kp , leads to a large-scale nonlinear algebraic equation system. A feasible solution to the equation system
means to look for proper PiQ , P
ip so that (1) and (2) are satisfied. However, it is not a trivial task to find a feasible solution,
since (1) and (2) are multiple constraints with a high dimension.
Let the flow-headloss relation in a pipe between nodes i and j be given as:
2ij
nijijji mQrQhpp +==− ; (3)
where p = nodal head, h = headloss, r = resistance coefficient, Q = flow rate, n = flow exponent, and m = minor loss
coefficient.
The second set of equations that must be satisfied is flow continuity around all nodes:
;VQj
iij∑ =− 0 (4)
where Vi is the flow demand at node i and by convention, flow into a node is positive. For a set of known heads at the fixed
grade nodes, we seek a solution for all heads pi and flows Qij that satisfy Eqs. (1) and (2).
The Gradient solution method begins with an initial estimate of flows in each pipe that may not necessarily satisfy flow
continuity. At each iteration of the method, new
nodal heads are found by solving the matrix equation:
FJH = (5)
where J = an (NxN) Jacobian matrix, H = an (Nx1) vector of unknown nodal heads,
and F = an (Nx1) vector of right hand side terms.
The diagonal elements of the Jacobian matrix are:
∑=j
ijii pA (6)
while the non-zero, off-diagonal terms are:
ijij pA −= (7)
where pij is the inverse derivative of the headloss in the link between nodes i and j with respect to flow. Each right hand side
term consists of the net flow imbalance at a node plus a flow correction factor:
∑ ∑∑ ++⎟⎟
⎠
⎞
⎜⎜
⎝
⎛−=
j ffifiji
jiji HpyVQF (8)
79
where the last term applies to any links connecting node i to a fixed grade node j and
the flow correction factor yij is:
)Qsgn(QmQrpy ijijijijij ⎟⎠⎞⎜
⎝⎛ +=
22 (9)
After new heads are computed by solving Eq. (5), new flows are found from:
))HH(py(QQ jiijijijij −−−= (10)
If the sum of absolute flow changes relative to the total flow in all links is larger than
some tolerance (e.g., 0.001), then Eqs. (5) and (10) are solved once again. The flow update formula (10) always results in
flow continuity around each node after the first iteration.
3.2 Pumping operation
The task of a pump station is to supply a given flow rate with a required pressure to the water network. We consider
frequency-controlled pumps in parallel operation in a pump station. The time-dependent operating cost of pump j
( J,,i Λ1= ) in station i can be expressed as
3
⎟⎟
⎠
⎞
⎜⎜
⎝
⎛
⎟⎟
⎠
⎞
⎜⎜
⎝
⎛+= S
j,i
j,i
j,i
Sj,iP
j,ij,ij,iP
j,i n
)t(n)t(n
n)t(Qba)t(C (11)
Minimization the total operating costs of the pump station means to search for an optimal selection of pumps and optimal
flow rates to be distributed on each individual pump. The total flow will be
∑=
=J
j
Pj,i
Pi )t(Q)t(Q
1
(12)
The flow rate of a single pump is a function of its pressure drop jip ,Δ and operating frequency jin , that can be described
as
Sj,i
j,i
j,i
Sj,i
Sj,i
j,i
j,ij,iS
j,i
j,iPj,i Q
nn
p
p
n
nQ
γ
αβ
12
11
1
⎟⎟⎟
⎠
⎞
⎜⎜⎜
⎝
⎛
⎟⎟⎟
⎠
⎞
⎜⎜⎜
⎝
⎛
⎟⎟
⎠
⎞
⎜⎜
⎝
⎛
Δ
Δ−= (13)
The parameters j,ij,ij,i ,, γβα and standard operation values Sj,i
Sj,i
Sj,i p,n,Q Δ in (10) can be obtained from the characteristic
lines provided by pump manufacturers. The constraints in the operation of a pump include limitations of its flow rate,
pressure drop and motor rotary frequency, i.e.
Pj,imax
Pj,i
Pj,imin Q)t(QQ ≤≤ (14)
j,imaxj,ij,imin p)t(pp Δ≤Δ≤Δ (15)
j,imaxj,ij,imin n)t(nn ≤≤ (16)
It should noted that constraint (16) is usually strict, since in practice the operating frequency is desired to be set near its standard value. It means the frequency ratio in (13) is often restricted by
j,imaxSj,i
j,ij,imin u
n
nu ≤≤ (17)
During operation some pumps may be switched off, due to the varying total flow rate requirement. Thus, the flow rate of a pump should be zero, if it is not selected. To deal with this problem, an integer variable { }10,y j,i ∈ for each pump has to be
introduced ( 0=j,iy denotes the pump is off and 1=j,iy it is on), such that
80
j,iS
j,i
j,i
j,i
Sj,i
Sj,i
j,i
j,ij,iS
j,i
j,iPj,i yQ
nn
p
p
n
nQ
γ
αβ
12
11
1
⎟⎟⎟
⎠
⎞
⎜⎜⎜
⎝
⎛
⎟⎟⎟
⎠
⎞
⎜⎜⎜
⎝
⎛
⎟⎟
⎠
⎞
⎜⎜
⎝
⎛
Δ
Δ−= (18)
This leads to a problem with (12) and (18) as equality and (14) and (17) inequality constraints. The objective function of this optimization problem is defined as the minimization of the total energy consumption of the pump station during the time period considered
)t(yn
)t(n)t(n
n)t(Qbafmin j,i
t
J
jS
j,i
j,i
j,i
Sj,iP
j,ij,ij,ii ∑∑= =
⎟⎟
⎠
⎞
⎜⎜
⎝
⎛
⎟⎟
⎠
⎞
⎜⎜
⎝
⎛+=
24
1 1
3
(19)
where j,ij,i b,a are parameters in the correlation of power consumption of a pump. Decision variables are the flow rate and
operating frequency of each pump. The pressure drop and total flow of the pump station are defined by solving the
optimization problem of the water network. Another important issue to be considered is that frequent on-and-off of pumps
sometimes is not allowed. This problem can be addressed by adding extra constraints or a penalty term in the objective
function (19).
4 Conclusions
To solve such problems, a model based computer program HydroDyn is developing. DWSS of the city Darkhan is modelled
and calibrated in HydroDyn. HydroDyn allows the calculation of management strategies for pumps and valves while
regarding the mechanical parameters, the behaviour of the consumers and the energy costs. Furthermore HydroDyn can be
used for tracking the water network status (design of networks, calculation of hydraulic and quality in pressurized pipe
networks and distribution system. We will apply the proposed approach to the management of reconstruction planning of
the drinking water supply system of Darkhan city and to minimize the operation costs of large-scale water supply networks.
Operating policies of water processing plants and pump stations can be developed by the proposed approach.
References Burgschweiger, J., Gnдdig, B. and Steinbach, M.C. (2004), Optimization models for operative planning in drinking water
networks, ZIB Report ZR-04-48, Zuse-Institut Berlin Diba A., Louie P.W.F. and Yeh W. W-G. (1995), Planned operation of large-scale water distribution system, J. Water
Resour. Plng. Mgmt. ASCE, 121, 260-269. Puta, H., Scharaw, B. and Planke, H., (2001), Management of reservoir systems under quality requirements, Sixth
international conference on computing and control for the water industry, pp. 479-489. Rossmann L.A. (1994), EPANET Users Guide, US Environmental Protection Agency, Cincinnati. Sakarya A.B.A. and Mays L.W. (2000), Optimal operation of water distribution pumps considering water quality, J. Water
Resour. Plng. Mgmt. ASCE, 126, 210-220. Scharaw, B., (2005): Aufbau einer modellgestьtzten Bewirtschaftung der Trinkwasser- und Gasversorgung der HEW
HofEnergie+Wasser GmbH, Jahresbericht 2005 Fraunhofer IITB, S: 48-49 Scharaw, B., Westerhoff, Th., Puta, H. and Wernstedt, J., (2000), Model based management of a reservoir system, River
Flood Defence, Volume 2, Kassel Reports of Hydraulic Engineering, pp. G-211-G216. Scharaw, B., and Li, P. (2006): A Decomposed Approach to Optimal Planning and Operation of Water Supply Networks, Hydrological Sciences for Managing Water Resources in the Asian Developing World, Guangzhou, China
81
Water Related Disaster of August 1979 from the fall of Machhu – 2 dam in India
P.R.. Rakhecha * D – 82, Shastrinagar, Jodhpur - 342003, India
ABSTRACT: The water related disaster from the fall of Machhu – 2 dam in the state of Gujarat in India occurred on 11 August 1979. The flood wave from the failure of the dam caused the death of about 2000 people and the destruction of property worth millions of US dollars. The causes of failure of the dam were on the one hand, the generation of an abnormal and unprecedented volume of water caused by long lasting heavy rainfall in the catchment area of the dam during the period 1 – 12 August 1979 and on the other hand, an underestimate of design flood capacity for the spillway to pass the flood discharge. 1. INTRODUCTION The water related disasters from the fall of dams are rare but communities can suffer enormous damage if they are hit by such events. Some overtopping and breaching of dams in various parts of the world have happened. Examples are the Briseis dam on the Cascade River in Australia, the Gibson dam on the Sun River in the USA, the Banqiao and Shimantan dams in China and the Noppikoski dam in Sweden. Due to the monsoon circulation most of the annual rainfall in India occurs during the summer monsoon season from June to September. As such many large dams have been constructed to store water for distribution throughout the year. The important dams in the State of Gujarat in India are the Machhu – 1 and Machhu – 2 dams located on the Machhu River at a distance of about 30 km from each other (Fig.1). The dams supply water for domestic, industrial and agricultural purposes. During rainy season cyclonic disturbances from the Bay of Bengal and the Arabian Sea produce widespread and heavy rainfalls which often cause severe floods in the rivers. In order that large floods do not endanger the dams, spillways of sufficient capacity are designed. The Spillways of the Machhu – 1 and Machhu, -2 dams were accordingly designed to discharge 3310 m3 /s and 5700 m3 /s respectively (Purohit et al. 1993). The Machhu river basin recorded the great amount of rainfalls from 1 to 12 August 1979. Rainfall in excess of 550 mm in 3 days fell along the escarpment to the west of the basin. The heaviest point rainfall recorded was 350 mm in one day at Rajkot located close to the basin. The rainstorm caused huge inflows of water into the two reservoirs. The magnitude of the flood generated was of the order of 16300 m3/s that it ultimately destroyed the Machhu – 2 dam on the 11 August 1979. The flash flood from the broken dam killed as many as 2000 people and destroyed about 12700 houses and huts down stream of the dam. The Machhu – 2 dam failures was evidently due to insufficient spillway capacity. Fortunately, the Machhu – 1 dam remained safe. It may be mentioned that this flood held the world record (Rakhecha, 2002) In this paper, a study of meteorological situations that caused extreme rainfalls, the spatial and temporal distribution of the rainfall over the Machhu river basin and the estimation of the peak flood on the day of the dam disaster have been presented. 2. THE MACHHU RIVER BASIN The Machhu River rises in the hills of northern Saurashtra in the State of Gujarat and flows a distance of about 140 km into the Rann of Kutch. Figure 1 shows the Machhu river basin and the locations of the Machhu – 1 and Machhu – 2 dams. The drainage areas of the Machhu – 1 and Machhu – 2 dams are about 735 km2 and 1900 km2. The climate of the Machhu river basin is determined by the southwest monsoon. The average annual rainfall in the basin amounts to about 570 mm which is half the national average. Apparently, the drainage basin of the Machhu River is a water poor area. About 95 % of the annual rainfall occurs between June and September. The annual average water *Former Dy. Director, Indian Institute of Tropical Meteorology, Pune, India surface evaporation is about 2600 mm/year; five times the rainfall .The stream flow as such is nearly nil for the most of the time. Table 1 summarizes some of the important parameters of the two dams.
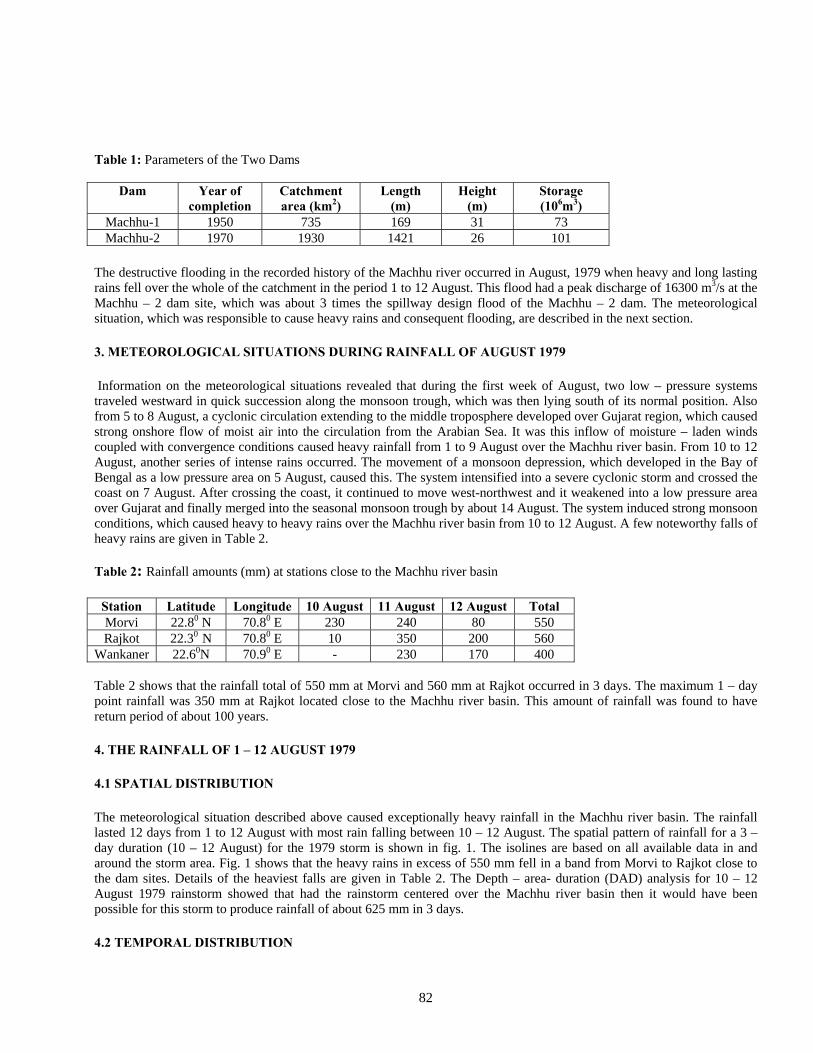
82
Table 1: Parameters of the Two Dams
Dam Year of completion
Catchment area (km2)
Length (m)
Height (m)
Storage (106m3)
Machhu-1 1950 735 169 31 73 Machhu-2 1970 1930 1421 26 101
The destructive flooding in the recorded history of the Machhu river occurred in August, 1979 when heavy and long lasting rains fell over the whole of the catchment in the period 1 to 12 August. This flood had a peak discharge of 16300 m3/s at the Machhu – 2 dam site, which was about 3 times the spillway design flood of the Machhu – 2 dam. The meteorological situation, which was responsible to cause heavy rains and consequent flooding, are described in the next section. 3. METEOROLOGICAL SITUATIONS DURING RAINFALL OF AUGUST 1979 Information on the meteorological situations revealed that during the first week of August, two low – pressure systems traveled westward in quick succession along the monsoon trough, which was then lying south of its normal position. Also from 5 to 8 August, a cyclonic circulation extending to the middle troposphere developed over Gujarat region, which caused strong onshore flow of moist air into the circulation from the Arabian Sea. It was this inflow of moisture – laden winds coupled with convergence conditions caused heavy rainfall from 1 to 9 August over the Machhu river basin. From 10 to 12 August, another series of intense rains occurred. The movement of a monsoon depression, which developed in the Bay of Bengal as a low pressure area on 5 August, caused this. The system intensified into a severe cyclonic storm and crossed the coast on 7 August. After crossing the coast, it continued to move west-northwest and it weakened into a low pressure area over Gujarat and finally merged into the seasonal monsoon trough by about 14 August. The system induced strong monsoon conditions, which caused heavy to heavy rains over the Machhu river basin from 10 to 12 August. A few noteworthy falls of heavy rains are given in Table 2. Table 2: Rainfall amounts (mm) at stations close to the Machhu river basin
Station Latitude Longitude 10 August 11 August 12 August Total Morvi 22.80 N 70.80 E 230 240 80 550 Rajkot 22.30 N 70.80 E 10 350 200 560
Wankaner 22.60N 70.90 E - 230 170 400 Table 2 shows that the rainfall total of 550 mm at Morvi and 560 mm at Rajkot occurred in 3 days. The maximum 1 – day point rainfall was 350 mm at Rajkot located close to the Machhu river basin. This amount of rainfall was found to have return period of about 100 years. 4. THE RAINFALL OF 1 – 12 AUGUST 1979 4.1 SPATIAL DISTRIBUTION The meteorological situation described above caused exceptionally heavy rainfall in the Machhu river basin. The rainfall lasted 12 days from 1 to 12 August with most rain falling between 10 – 12 August. The spatial pattern of rainfall for a 3 – day duration (10 – 12 August) for the 1979 storm is shown in fig. 1. The isolines are based on all available data in and around the storm area. Fig. 1 shows that the heavy rains in excess of 550 mm fell in a band from Morvi to Rajkot close to the dam sites. Details of the heaviest falls are given in Table 2. The Depth – area- duration (DAD) analysis for 10 – 12 August 1979 rainstorm showed that had the rainstorm centered over the Machhu river basin then it would have been possible for this storm to produce rainfall of about 625 mm in 3 days. 4.2 TEMPORAL DISTRIBUTION
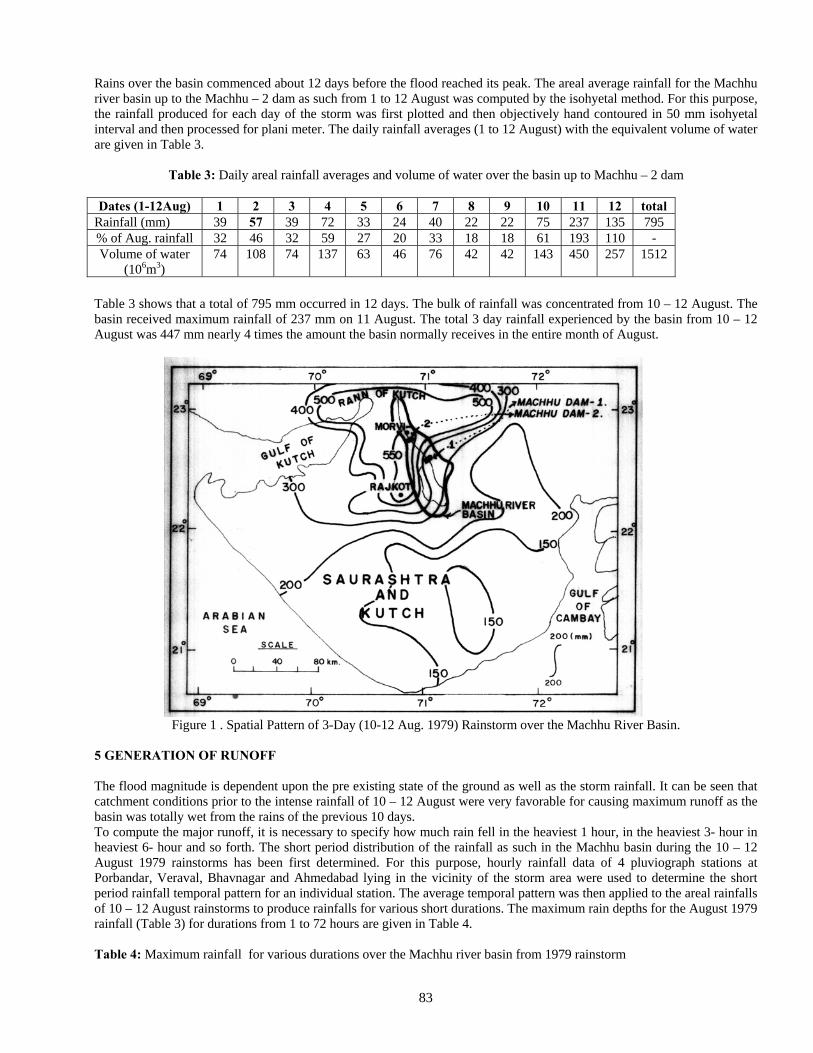
83
Rains over the basin commenced about 12 days before the flood reached its peak. The areal average rainfall for the Machhu river basin up to the Machhu – 2 dam as such from 1 to 12 August was computed by the isohyetal method. For this purpose, the rainfall produced for each day of the storm was first plotted and then objectively hand contoured in 50 mm isohyetal interval and then processed for plani meter. The daily rainfall averages (1 to 12 August) with the equivalent volume of water are given in Table 3.
Table 3: Daily areal rainfall averages and volume of water over the basin up to Machhu – 2 dam
Dates (1-12Aug) 1 2 3 4 5 6 7 8 9 10 11 12 total Rainfall (mm) 39 57 39 72 33 24 40 22 22 75 237 135 795 % of Aug. rainfall 32 46 32 59 27 20 33 18 18 61 193 110 - Volume of water
(106m3) 74 108 74 137 63 46 76 42 42 143 450 257 1512
Table 3 shows that a total of 795 mm occurred in 12 days. The bulk of rainfall was concentrated from 10 – 12 August. The basin received maximum rainfall of 237 mm on 11 August. The total 3 day rainfall experienced by the basin from 10 – 12 August was 447 mm nearly 4 times the amount the basin normally receives in the entire month of August.
Figure 1 . Spatial Pattern of 3-Day (10-12 Aug. 1979) Rainstorm over the Machhu River Basin.
5 GENERATION OF RUNOFF The flood magnitude is dependent upon the pre existing state of the ground as well as the storm rainfall. It can be seen that catchment conditions prior to the intense rainfall of 10 – 12 August were very favorable for causing maximum runoff as the basin was totally wet from the rains of the previous 10 days. To compute the major runoff, it is necessary to specify how much rain fell in the heaviest 1 hour, in the heaviest 3- hour in heaviest 6- hour and so forth. The short period distribution of the rainfall as such in the Machhu basin during the 10 – 12 August 1979 rainstorms has been first determined. For this purpose, hourly rainfall data of 4 pluviograph stations at Porbandar, Veraval, Bhavnagar and Ahmedabad lying in the vicinity of the storm area were used to determine the short period rainfall temporal pattern for an individual station. The average temporal pattern was then applied to the areal rainfalls of 10 – 12 August rainstorms to produce rainfalls for various short durations. The maximum rain depths for the August 1979 rainfall (Table 3) for durations from 1 to 72 hours are given in Table 4. Table 4: Maximum rainfall for various durations over the Machhu river basin from 1979 rainstorm
84
Hours 1 3 6 12 18 24 36 48 72 Rainfall (mm) 141 167 208 268 312 342 364 372 447 Table 4 shows that rainfall over 1930 km2 area of the Machhu basin ranged from 141 mm in 1 hour to 447 in 72 hours. The estimation of the peak flood in the Machhu river basin has been calculated by applying the rational formula. This is the best – known formula and is extensively used for the design flood computations. The rational formula is expressed as
Q = 0.278 C I A (1) Where Q = flood in cubic meters per second (cumecs) C = percentage of rainfall that becomes surface runoff I = rainfall intensity in mm/hr during the time of concentration A= catchment area in km2 The time of concentration is defined as the time, which would be required for the surface runoff from the remote part of the basin to reach the outlet or point of the interest on the water course. This time will vary, generally depending on the slope and character of surfaces. An empirical formula for estimating the time of concentration and thus the duration for which rainfall intensity (I) is selected was given by Hathaway (1945) as
(T)2.14 = S3
n L 2 (2)
Where T = the time of concentration in minutes L = the maximum length of travel in feet from the remote part of the basin to the outlet S = the mean slope of the drainage basin and n = the roughness factor The parameters of the Machhu river basin up to Machhu – 2 dam are as follows: Area (A) = 1930 km2 L = 80 km S = 1.8 m/km n = 0.10 for smooth bare packed soil Using the above data, the time of concentration for the Machhu river basin has been worked out to be 7 hours. The flood peak during any storm covering the entire rainfall will therefore be decided by the maximum 7 hours rainfall that occurs in the basin during the storm. The maximum rainfall experienced by the basin for 7 hours worked out to be 240 mm, (Table 4). The average rainfall intensity per hour during a seven hour period which could cause a peak flood of 16300 m3 for the Machhu basin worked out to be 35 mm. Thus the amount of 35 mm per hour is maintained for a time equal to the period of concentration of flow at the dam site. Because of the saturated soil conditions prevailing at the time of intense rainfall on 11 August, the percentage runoff from rainfall can be higher. As such a conservative value of this ratio of 80% has been assumed for the conversion of rainfall to runoff water. The peak flood from the rational formula is
Q = 0.278 ×0.80×35×1930 = 15050 m3/s The estimated peak flood from the rational formula is therefore around 15050 m3 /s, which is in close agreement with the observed peak flood of 16300 m3/s on the day of 11 August 1979. This flood was found to be record breaking event in the world from a drainage area of 1930 km2 . 6. CONCLUSION Heavy rainfall was observed over the Machhu river basin upstream from the Machhu – 2 dam during 1 to 12 August, 1979. From 1 to 10 August the daily rainfall on the basin varied from 22 to 75 mm. The peak period of heavy rainfall was from 10 to 12 August. A rainfall of 237 mm occurred on 11 August. The heavy rainfall and the previous saturation of the basin induced a peak flood of 16300 m3/s, when the capacity of the spillway at Machhu – 2 dam was only 5700 m3/s. The magnitude of the generated flood was so large that it ultimately destroyed the Machhu – 2 dam on 11 August 1979. The peak flood of 16300 m3/s recorded on the day of disaster when estimated by the rational runoff method showed that with the
85
occurrence of the rainfall of 35 mm/hr for a period of 7 hours, a maximum instantaneous flood of 15050 m3/s is possible at the dam site. REFERENCES Hathaway, G. A. (1945). Design of Drainage facilities, Trans. Amer. Soc, Civ. Eng., 110. Purohit, M. U. et al. (1993). Unusual storms in Gujarat, characteristics of the storm of August, 1979 over Machhu basin of Saurashtra Region. CBIP Publ. No. 234 Conference on unusual storm Events and their Relevance to Dam safety and snow Hydrology, New Delhi, 243 – 246. Rakhecha. P.R. (2002). Highest floods in India. The Extremes of the Extremes: Extraordinary floods. IAHS Publ. no. 271 , 167-172.
86
Horizontal Wells in Heterogeneous Media
Leonardo Q. Liongson National Hydraulic Research Center and Department of Civil Engineering, College of Engineering, University of the Philippines,
Diliman, Quezon City 1101, Philippines ABSTRACT: The use of horizontal infiltration gallery systems or horizontal wells as water-supply sources offers advantages over vertical wells such as the avoidance of excessive drawdown of the piezometric heads which are otherwise localized near few vertical well locations, and the natural filtration of suspended solids from the river water which seeps through the riverbank soil towards the infiltration gallery. This paper derives the analytical steady-flow solution for seepage rate into horizontal wells (infiltration gallery systems) in heterogeneous media, installed in a fully-saturated isotropic aquifer lying beneath an aquitard layer or else a clay lens, using potential flow theory and source-sink pair, doublet and vortex pair elements.
INTRODUCTION The use of horizontal infiltration gallery systems (horizontal wells or radial collector wells) as water-supply sources is an attractive and feasible alternative to vertical groundwater wells and open-surface flow diversions in the Philippines and other countries. One advantage of horizontal infiltration galleries over vertical wells is the avoidance of excessive drawdown of the piezometric heads which are otherwise localized near few vertical well locations. The lower drawdown helps to avoid the upconing of saline groundwater in coastal or island aquifers. Another advantage is the fact that water from open-surface sources such as rivers can be induced to seep and undergo natural filtration through the stream bed deposit and riverbank soil surrounding the infiltration gallery, thereby attaining a much reduced level of suspended solids in the raw filtered water inside the wells. A fast method of preliminary estimation of the inflow yield and sizing of an infiltration gallery can be developed from analytical models of steady groundwater flows in a fully-saturated isotropic homogeneous aquifer where the infiltration gallery is installed. Two-dimensional potential flow theory and complex analysis with conformal mapping, combined with Darcy’s Law, is applicable in this case: Darcy’s Law: V = ∇ϕ (1) where ϕ = - K h = potential function; K = permeability or hydraulic conductivity of the aquifer medium; h = hydraulic or piezometric head = pressure head + elevation head; V = bulk seepage velocity, equal to the gradient of the potential function. In general, a complex potential is defined by analytic functions: w(z) = ϕ(x,y) + i ψ(x,y) (2) where z = x + i y = the complex variable for position coordinates (x,y); ϕ(x,y) = potential function; ψ(x,y) = stream function.
87
The Cauchy-Riemann Conditions are automatically satisfied when w(z) is analytic: V = (u,v) = (∂ϕ/∂x, ∂ϕ/∂y) = (∂ψ/∂y, -∂ψ/∂x) (3) which implies the following properties: Both ϕ and ψ satisfy Laplace Equation: ∇2ϕ = 0 (4) ∇2ψ = 0, (5) the two families of curves are orthogonal: potential lines: ϕ(x,y) = constant, c1 (6) streamlines: ψ(x,y) = constant, c2 (7) and the complex velocity is given by: u + i v = complex conjugate of w’(z) (8) where w’(z) = dw/dz = ∂ϕ/∂x + i ∂ψ/∂x = ∂ψ/∂y - i ∂ϕ/∂y = u – i v (9)
PREVIOUS RELATED WORK An early application of complex analysis with conformal mapping using image wells in two-dimensional flow theory was done by List (1964) for the problem of the steady flow of precipitation (percolating recharge) to an infinite series of horizontal tile drains above an impervious layer. The free surface boundary conditions are exactly satisfied, but the shape of the impervious layer is approximated. Involving computations with trigonometric and hyperbolic functions, the analytical results can be applied to a series of horizontal wells which lie above an impervious layer and receive inflows from vertical recharge. Ilyinsky and Kacimov (1992) made a study of seepage to a system of empty horizontal drains for one of three possible patterns of water tables and flow regimes: (1) an empty drain (an isobar), (2) a drain partially filled with water, and (3) a drain completely filled with water (an equipotential line). In a more recent work by Kolymbas and Wagner (2006) an analytical expression for the estimation of the steady inflow into a drained tunnel of circular cross section under a constant head line was derived on the basis of conformal mapping for a source-sink pair. Haitjema (2006), who is an noted proponent of the analytic element method in groundwater flow modeling (the use of several analytic computational elements such as sources, sinks, and doublets in groundwater flow models) analyzed by conformal mapping the seepage flow problem near a horizontal well modeled as a line sink within a Dupuit-Forchheimer model of a confined aquifer. He derived the approximate resistance in the three-dimensional flow around the horizontal well. In the same paper, Haitjema derived by conformal mapping with two source-sink pairs the effective resistance to converging flow to a horizontal well underneath a recharging stream and above an impermeable bottom. In the paper by Liongson (2006), the concern was the vertical two-dimensional steady-flow model provided by the classical vertically aligned source-sink pair, wherein the steady recharge line with constant head is represented by the symmetry line between the hypothetical source and sink, while the outer circumference of the gallery or horizontal well coincides with a circular potential line which circumscribes eccentrically the hypothetical sink located inside the gallery. By the direct use of analytic geometry of circles and the algebraic manipulation of the potential function, and without the need to perform conformal analysis, the same results are obtained as those by Kolymbas and Wagner (2006). Variations of the source-sink pair model were also developed using image-well superposition for modeling the effects of an impervious bottom boundary and either recharging or impermeable lateral boundaries. The considered basic case and its variations are listed as follows:
a. A horizontal well below a horizontal recharge boundary in a semi-infinite aquifer (exact solution).
b. A horizontal well near a vertical impermeable boundary below a horizontal recharge boundary in a quarter-infinite aquifer (approximate solution).

88
c. A horizontal well below a horizontal recharge boundary and above a horizontal impermeable boundary in an infinite strip of aquifer (approximate solution).
d. A horizontal well below a horizontal recharge boundary and above a horizontal impermeable boundary in an infinite strip of aquifer (exact solution).
This paper derives the analytical steady-flow solution for seepage rate into horizontal wells (infiltration gallery systems) installed in heterogeneous media, installed in a fully-saturated isotropic aquifer lying beneath an aquitard layer or else a clay lens, using doublet or vortex pair elements.
THE SOUR-SINK PAIR MODEL
Let ϕ include the sum of two potential functions: an image source at location (x,y) = (0,b) and a real sink at location (x,y) = (0.-b), which specifies a line of symmetry, y = 0, which is a horizontal recharge line with an assigned potential value, ϕ = - K H. Defining the complex potential, w(z):
( )( )
22
22
q qw(z) -KH ln(z - ib) - ln(z ib)
2 2q z - ib
-KH ln2 z ib
x + y - bq q y b y bKH ln i arctan - arctan
4 2 x xx + y b
= + +π π
⎡ ⎤= + ⎢ ⎥π +⎣ ⎦⎡ ⎤ ⎧ − + ⎫⎡ ⎤ ⎡ ⎤= − + +⎢ ⎥ ⎨ ⎬⎢ ⎥ ⎢ ⎥π π ⎣ ⎦ ⎣ ⎦+ ⎩ ⎭⎢ ⎥⎣ ⎦
(10)
where K = permeability of the aquifer medium; H = head difference between the horizontal recharge line, y = 0, and the outer circular wall of the gallery q = specific discharge (discharge per unit gallery length or horizontal well); b = depth of sink centerline below the horizontal recharge line, y=0. It follows that the potential function is equal to:
( ) ( )2 22 2q q-KH+ ln x + y - b ln x + y b
4 4⎡ ⎤ ⎡ ⎤ϕ = − +⎣ ⎦ ⎣ ⎦π π
(11)
= (recharge head term) + (source term) + (sink term) Along the recharge line, y = 0, the value, ϕ = -K H, applies at any x. Also, let F be defined as follows:
4 KHF exp
q
⎡ ⎤π= ⎢ ⎥
⎣ ⎦ (12)
Deriving the equation of the curve corresponding to the exit potential, ϕ=0, on the gallery wall, then Equation (15) is converted to the equation of a circle:
2 2 2 2x (y b) F x (y b)⎡ ⎤+ − = + +⎣ ⎦
which is rearranged into the standard form: 2 2
22
F 1 4b Fx y b
F 1 (F 1)
+⎡ ⎤+ + =⎢ ⎥− −⎣ ⎦ (13)
which are circular potential lines with the following properties: F+1
depth of centerline: d = b bF-1
(being offset or eccentric relative to b)
2b Fradius: r ,
F-1
r 2 Fso that
d F+1
≥
=
=
(14)
Solving for F and finally for the desired inflow value, q:
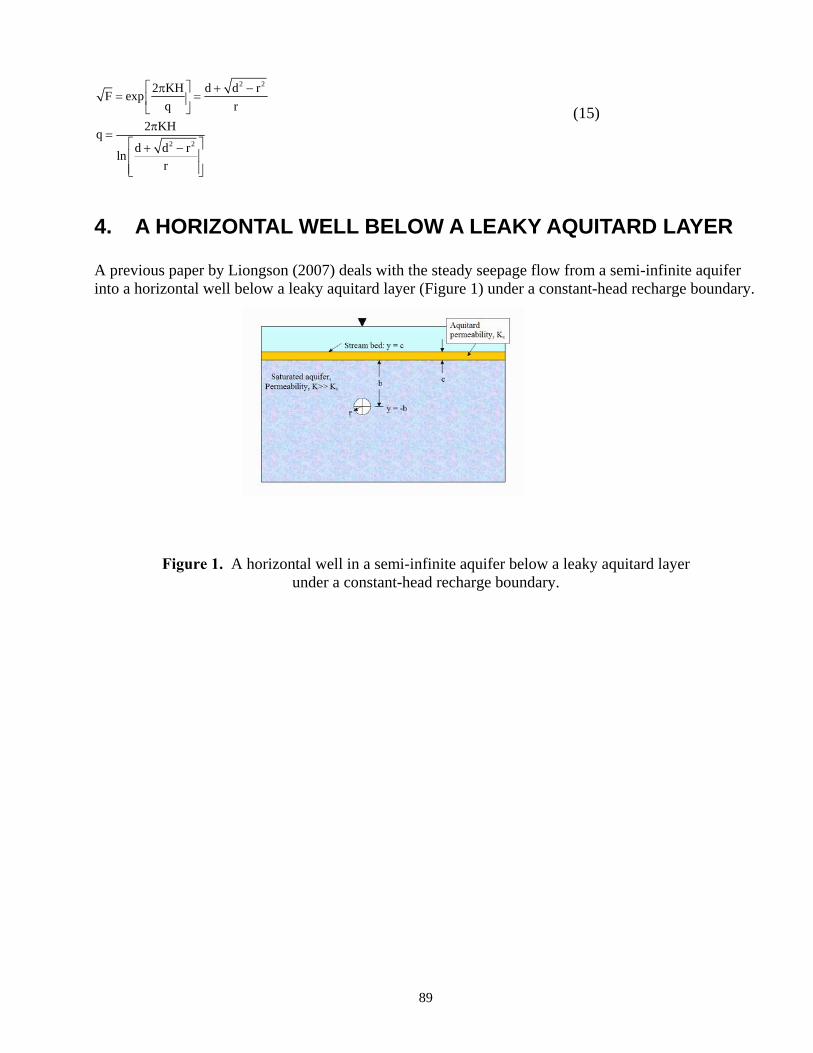
89
2 2
2 2
2 KH d d rF exp
q r
2 KHq
d d rln
r
⎡ ⎤π + −= =⎢ ⎥
⎣ ⎦π
=⎡ ⎤+ −⎢ ⎥⎢ ⎥⎣ ⎦
(15)
4. A HORIZONTAL WELL BELOW A LEAKY AQUITARD LAYER A previous paper by Liongson (2007) deals with the steady seepage flow from a semi-infinite aquifer into a horizontal well below a leaky aquitard layer (Figure 1) under a constant-head recharge boundary.
Figure 1. A horizontal well in a semi-infinite aquifer below a leaky aquitard layer under a constant-head recharge boundary.

90
The method of Fourier integral is utilized to obtain a solution. Let the following symbols be defined:
h (x, y) = aquitard head, on the domain of the infinite strip: 0 y c, - x .c
h(x,y) = aquifer hea
≤ ≤ ∞ ≤ ≤ ∞
d, on the domain of the semi-infinite plane: - y 0, - x .
H = constant head at recharge boundary (a stream bed) along the line, y=c.
= wave number in the Fourier integral formulation.
For 0 y c,
∞ ≤ ≤ ∞ ≤ ≤ ∞
ν
≤ ≤ −∞
[ ] ( )0
2 2
2 2
c
c c
x ,using Fourier integral with separation of variables,
2h (x, y) H a sinh (c y) cos x d .
c
h (x,y), as expressed above, satisfies Laplace Equation:
h h0.
x y
Subject to the following con
∞
< < ∞
⎡ ⎤= + ν − ν νν⎣ ⎦π
∂ ∂+ =
∂ ∂
∫
( )o 0c
ditions:
BC1 at y = 0 (unknown aquitard head at interface with aquifer):
2h (x,0) = h (x) = H + a sinh( c)cos x d .
BC2 at y = c (available aquitard head on the river bed):
h (x,c) = H. c
For y 0,
∞ ⎡ ⎤ν ν νν⎣ ⎦π
≤ −∞
∫
( )2 2
2 20
2 2
2 2
x ,using the method of separation of variables,
2 q x (y b)h(x, y) H b exp( y)cos x d - ln .
4 K x (y b)
h(x,y), as expressed above, satisfies Laplace Equation:
h h0.
x y
BC3 at y
∞
< < ∞
⎡ ⎤+ −⎡ ⎤= + ν ν ν ⎢ ⎥ν⎣ ⎦π π + +⎣ ⎦
∂ ∂+ =
∂ ∂
∫
( )o 0
cy 0 y 0
= 0 (equality of aquifer and aquitard heads at interface):
2h(x,0) = h (x) = H + b cos x d .
BC4 at y = 0 (equality of aquifer and aquitard fluxes at interface):
K h (x, y) K h(x, y) .c y y
The
∞
= =
⎡ ⎤ν νν⎣ ⎦π
∂ ∂=
∂ ∂
∫
0
application of the above conditions leads to the following solution for the head-discharge relation:
2 KH 2Ksinh( c) I(b ) exp( b) d 2b + ln
q rK K sinh( c)c
∞⎡ ⎤
π ν ν −ν ν ⎡ ⎤⎢ ⎥= ⎢ ⎥⎢ ⎥⎡ ⎤ ⎣ ⎦+ ν ν⎢ ⎥⎣ ⎦⎣ ⎦∫ (16)

91
5. A HORIZONTAL WELL BELOW A CLAY LENS The next cases are that of a horizontal well lying below a finite silt or clay lens, represented by a doublet or a pair of counter-rotating vortices, under a horizontal recharge boundary in a semi-infinite aquifer (approx. r<<b). The potential functions, stream function and the velocity components for the doublet case, with strength S, (Figure 2) are given below:
Figure 2. A horizontal well lying below a finite silt or clay lens, represented by a doublet, under a horizontal recharge boundary in a semi-infinite aquifer (approx. r<<b).
( )
2 2
2 2 2 2
2 2 2 2 2 2
2 2 22 2
S q z ibw(z) KH ln
iz 2 z ib
x (y b)Sy q(x, y) KH ln
x y 2 x (y b)
Sx q y b y b(x, y) arctan arctan
x y 2 x (y b) x (y b)
2Sxy q x xu(x, y)
x 2 x (y b)x y
−⎡ ⎤= − + + ⎢ ⎥π +⎣ ⎦⎡ ⎤+ −
φ = − − + ⎢ ⎥+ π ⎢ + + ⎥⎣ ⎦
⎡ ⎤⎛ ⎞ ⎛ ⎞− +⎢ ⎥⎜ ⎟ ⎜ ⎟ψ = − + −⎜ ⎟ ⎜ ⎟+ π ⎢ ⎥+ − + +⎝ ⎠ ⎝ ⎠⎣ ⎦
∂φ= = + −∂ π + −+
( )
2 2
2
22 2 2 2 2 22 2
x (y b)
S 2Sy q y b y bv(x, y)
y x y 2 x (y b) x (y b)x y
⎡ ⎤⎢ ⎥+ +⎣ ⎦
⎡ ⎤∂φ − += = − + + −⎢ ⎥∂ + π + − + +⎣ ⎦+
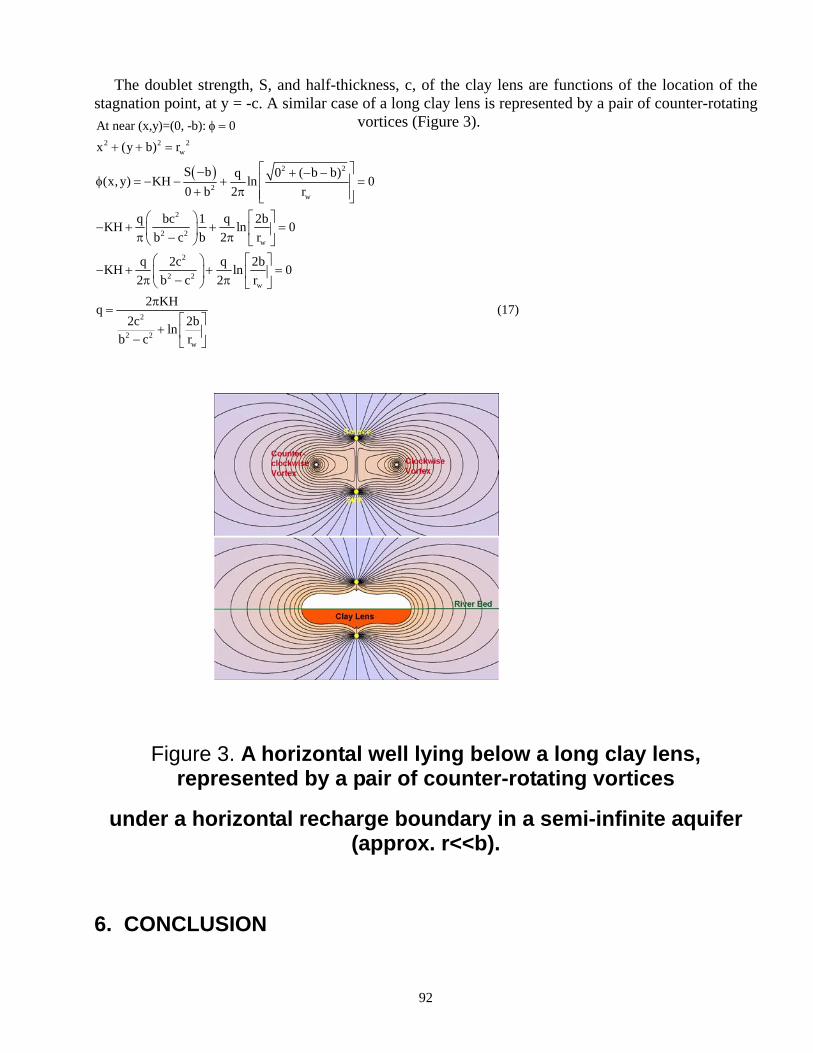
92
The doublet strength, S, and half-thickness, c, of the clay lens are functions of the location of the stagnation point, at y = -c. A similar case of a long clay lens is represented by a pair of counter-rotating
vortices (Figure 3).
Figure 3. A horizontal well lying below a long clay lens, represented by a pair of counter-rotating vortices
under a horizontal recharge boundary in a semi-infinite aquifer (approx. r<<b).
6. CONCLUSION
( )
2 2 2w
2 2
2w
2
2 2w
2
2 2w
2
2 2w
At near (x,y)=(0, -b): 0
x (y b) r
S b 0 ( b b)q(x, y) KH ln 0
0 b 2 r
q bc 1 q 2bKH ln 0
b c b 2 r
q 2c q 2bKH ln 0
2 b c 2 r
2 KHq
2c 2bln
b c r
φ =
+ + =
⎡ ⎤− + − −φ = − − + =⎢ ⎥
+ π ⎢ ⎥⎣ ⎦⎡ ⎤⎛ ⎞
− + + =⎜ ⎟ ⎢ ⎥π − π⎝ ⎠ ⎣ ⎦⎡ ⎤⎛ ⎞
− + + =⎜ ⎟ ⎢ ⎥π − π⎝ ⎠ ⎣ ⎦π
=⎡ ⎤
+ ⎢ ⎥− ⎣ ⎦
(17)
93
This paper has derived the analytical steady-flow solution for seepage rate into horizontal wells (infiltration gallery systems) in heterogeneous media, installed in a fully-saturated isotropic aquifer lying beneath an aquitard layer or else a clay lens, using potential flow theory and source-sink pair, doublet and vortex pair elements.
7. REFERENCES Haitjema, H.M. (2006). “Accounting for resistance to 3D flow near horizontal wells or galleries in a Dupuit-Forchheimer model”,
http://www.haitjema.com/documents/. Ilyinsky, N.B. and A. R. Kacimov (1992). “Problems of seepage to empty ditch and drain”, Water Resources Research, 28(3), pp 871-
877. Kolymbas, D. and Wagner, P. (2006). “Groundwater ingress to tunnels”, Tunneling and Underground Space Technology, 12 pp. Liongson, L.Q. (2006). “Exact and approximate analytical solutions for steady seepage inflows to horizontal wells”, Proceedings of the
International Symposium on Managing Water Supply for Growing Demand, Bangkok, Thailand, 16-20 October 2006, UNESCO-IHP Technical Document in Hydrology No. 6.
Liongson, L. Q. (2007), “Steady Flow into a Horizontal Well from a Semi-infinite Aquifer with an Intervening Aquitard Layer under a Constant-Head Recharge Boundary”, Proceedings of the International Conference on Hydrology and Water Resources Management for Hazard Reduction and Sustainable Development (HRSD 2007), Makati City, Philippines, 19-23 Novemebr 2007, UNESCO-IHP Technical Document in Hydrology No. 7.
List, E. J. (1964). “The steady flow of precipitation to an infinite series of tile drains above an impervious layer”, Journal of Geophysical Research, 69(16), pp 36-46.
94
Transboundary Water Pollution in Baikal Lake Basin: The Role of Surface-Ground Water Interactions and Groundwater
Sarantuyaa Zandaryaa1, Alice Aureli1, Andrea Merla2 and Lunten Janchivdorj3 1) UNESCO International Hydrology Programme, 1 rue Miollis, 75732 Paris cedex 15, France
2) UNESCO Consultant, USA 3) Institute of Geo-ecology, Mongolian Academy of Sciences, Mongolia
ABSTRACT: The paper presents a preliminary review of the role of groundwater and surface-ground water interactions in transboundary water pollution in the Lake Baikal Basin and the role of groundwater in transboundary water resources management in the basin. The existence of extensive alluvial unconfined aquifers in the major river valleys suggest strong interactions between surface and ground water in the Baikal Lake Basin and an important role that groundwater plays in the quantity and quality of water discharging into Lake Baikal. Groundwater appears to be an important source of water for drinking and other uses in the basin, although there is a gap in data and research on the estimation of the availability and use of groundwater resources in the Baikal Lake Basin. Groundwater use is mainly, if not exclusively, targeted to the shallow unconfined alluvial aquifers located along the major valleys, which are highly vulnerable to many forms of pollution. Major sources of groundwater pollution include the lack of sanitation, wastewater treatment and solid waste disposal facilities in urban settlements. The mining industry represents an important source of pollution in both surface and groundwater in the basin posing particular environmental and human health risks. The potentially serious impacts of groundwater pollution in the basin indicate an urgent need to adopt measures for controlling pollution from various sources. Little is known about the existence of transboundary aquifers in the basin. The main transboundary issue of concern in the Baikal Lake Basin appears to be groundwater pollution in upstream Mongolia, which eventually discharges into Lake Baikal. There appears to be a lack of a policy framework for sustainable use and management of groundwater resources in the basin. Finally, the protection of groundwater resources in the Baikal Lake Basin is of crucial importance due to its important role in maintaining surface waters and aquatic ecosystems in the basin, as well as due to its strategic value for adaptation to climate change. 1. INTRODUCTION The crucial role of surface-ground water interactions in contaminant transport, fate and concentration distributions in streams and ground water has only recently been recognized. Surface and ground water are fundamentally interconnected through the natural hydrological cycle and need to be considered as one hydrological system. Unconfined aquifers are recharged mainly by infiltration of rainwater and by seepage from rivers, streams and lakes. Conversely, in some conditions, groundwater flows (discharges) into lakes, streams and wetlands. In many rivers and streams, surface and ground water interactions occur in both directions; groundwater is recharged by surface water in some reaches of the river, whereas groundwater provides the base flow of the river in other reaches. Furthermore, the direction of flow between surface and ground water may alter (invert) seasonally depending on rainfall levels. Thus, even in conditions where rivers primarily recharge groundwater, certain reaches may receive groundwater inflow during some seasons.
In addition, groundwater is an important part of the hydrologic cycle. The largest source of readily accessible freshwater is stored under the ground in aquifers. Groundwater resources constitute a significant part of the world's freshwater supply, especially in areas with limited surface water resources. In many parts of the world, groundwater is a primary source of drinking water. Over-exploitation of groundwater may affect the direction of flow between surface waters and groundwater. Excessive use of groundwater over a long period of time frequently causes lowering of groundwater levels and, consequently, the alteration of groundwater flow direction in a stream-aquifer system with a relatively shallow water table. The alteration of groundwater flow direction in an aquifer system, in turn, may cause reduced flows of rivers and streams, drying of rivers, streams and lakes, salt water intrusion in coastal aquifers, as well as land subsidence and localized flooding, with consequent damage to buildings and structures in urban areas.

95
Interactions between groundwater and surface water play a fundamental role in the functioning of riparian ecosystems. Groundwater is crucial for maintaining the hydrologic balance of rivers, lakes and wetlands. A drawdown of the groundwater level by only a few meters leads to reduced flows in rivers and streams and, thereby, adversely affects the flow requirements for aquatic habitats and other environmental needs, having a negative impact on vegetation and ecosystems in the riparian zone (especially, wetlands) that play critical role in maintaining wildlife habitat and biodiversity. Groundwater drawdown may also result in reduced environmental flows into lakes, lowering of lake levels and often irreversible changes in lake ecosystems.
The conditions under which surface and ground water interact have a strong effect on water quality, in particular on the transport, fate and concentration distribution of contaminants in rivers and aquifers. As water is an excellent solvent, groundwater can contain a wide variety of dissolved substances. Groundwater usually have more dissolved substances compared to surface water because it dissolves substances as it moves thought rocks and subsurface soil. Mineral colloids, gases, dissolved substances, and pollutants are transported by groundwater flow, affecting the quality, temperature, oxygen levels and composition of water. Pollutants such as nutrients, toxic chemicals (including persistent toxic substances), heavy metals and dissolved organic substances in surface water are often pollute also groundwater in shallow aquifers.
Sustainable use and management of groundwater should be an integral part of integrated river basin management due to: • fundamental role of complex interactions between surface-ground water in contaminant transport and fate in rivers
and aquifers; • important role that groundwater plays in maintaining the hydrological cycle and aquatic ecosystems.
This is of crucial importance for transboundary water resources management. 2. THE BAIKAL LAKE BASIN: HYDROGEOLOGY AND GROUNDWATER RESOURCES Lake Baikal is the world’s oldest (more than 25 million years old) and deepest lake (1,637 m). It is located in eastern Siberia in Russia near the border with Mongolia. Lake Baikal contains about 20 percent of the world’s freshwater surface resources. The Baikal Lake Basin has very rich biological diversity with many endemic species.
The Baikal Lake Basin is a transboundary basin shared by Mongolia and Russia, extending over a 500,000 km2 (Figure 1). It includes over 300 rivers and streams and major freshwater lakes, in particular:
• Transboundary watershed of the Selenge River Basin, with the upstream part of the Selenge River and its main tributaries found in north Mongolia.
• Lake Khuvsgul – one of the world's most pristine ancient lakes located in Mongolia. • Lake Baikal – the world's oldest and biggest lake located in Russia.
2.1 Selenge River Basin (Mongolia) Occupying over 300,000 km2, the Selenge River Basin lies in north Mongolia and connects Lake Khovsgol (Mongolia) with Lake Baikal (Russia).
The Selenge River Basin is located in an active geologic zone. The hydrogeology of the Selenge River Basin is varied and consists of a combination of alluvial deposits, Cambrian and Precambrian limestones, granites of varying ages, sedimentary deposits (including sandstones, siltstones and conglomerates) and metamorphic rocks. Granitic formations, pre-Cambrian metamorphics, pre-Cambrian and Palaeozoic carbonate rocks, and Palaeozoic sediments, metamorphic sands and shales are widespread in the Northern Mongolia, where the Selenge River Basin is found. Igneous pre-Cainozoic and Mesozoic to Quarternary continental formations also occur throughout Mongolia. There is a wide variety of deposits and rock formations distributed throughout the basin of the Selenge River which contain significant amount of groundwater. Conversely, there are zones in the basin where groundwater is not present.
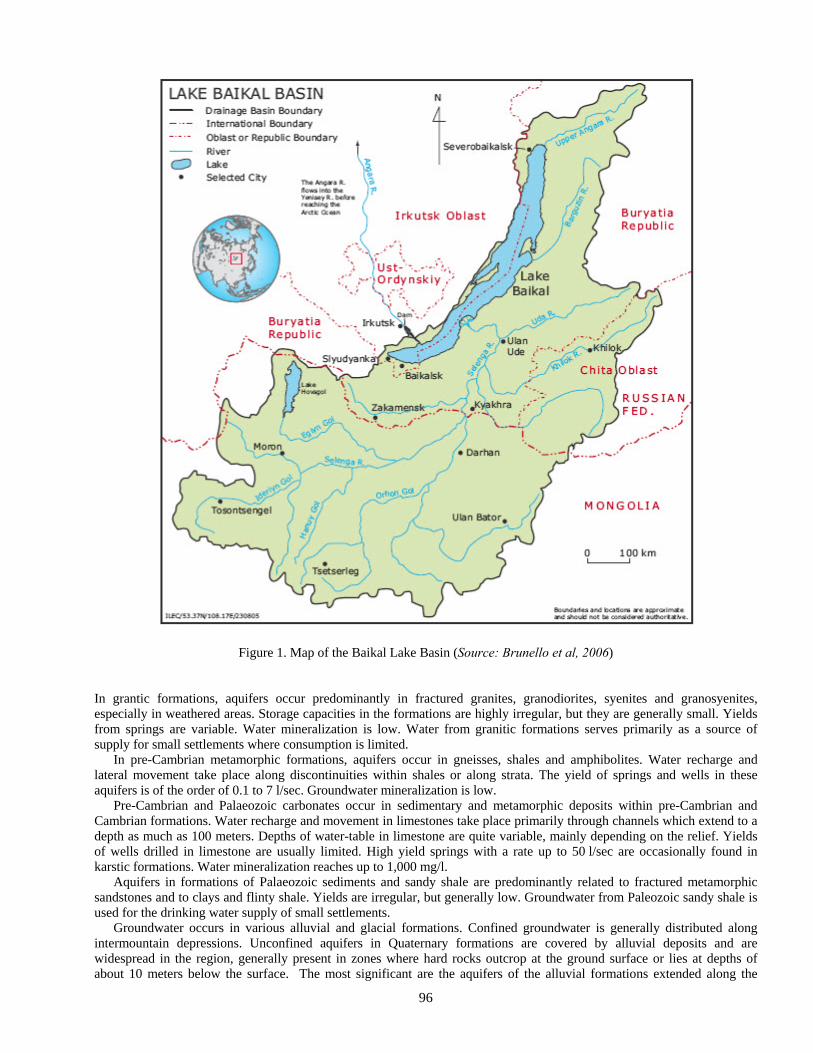
96
Figure 1. Map of the Baikal Lake Basin (Source: Brunello et al, 2006) In grantic formations, aquifers occur predominantly in fractured granites, granodiorites, syenites and granosyenites, especially in weathered areas. Storage capacities in the formations are highly irregular, but they are generally small. Yields from springs are variable. Water mineralization is low. Water from granitic formations serves primarily as a source of supply for small settlements where consumption is limited.
In pre-Cambrian metamorphic formations, aquifers occur in gneisses, shales and amphibolites. Water recharge and lateral movement take place along discontinuities within shales or along strata. The yield of springs and wells in these aquifers is of the order of 0.1 to 7 l/sec. Groundwater mineralization is low.
Pre-Cambrian and Palaeozoic carbonates occur in sedimentary and metamorphic deposits within pre-Cambrian and Cambrian formations. Water recharge and movement in limestones take place primarily through channels which extend to a depth as much as 100 meters. Depths of water-table in limestone are quite variable, mainly depending on the relief. Yields of wells drilled in limestone are usually limited. High yield springs with a rate up to 50 l/sec are occasionally found in karstic formations. Water mineralization reaches up to 1,000 mg/l.
Aquifers in formations of Palaeozoic sediments and sandy shale are predominantly related to fractured metamorphic sandstones and to clays and flinty shale. Yields are irregular, but generally low. Groundwater from Paleozoic sandy shale is used for the drinking water supply of small settlements.
Groundwater occurs in various alluvial and glacial formations. Confined groundwater is generally distributed along intermountain depressions. Unconfined aquifers in Quaternary formations are covered by alluvial deposits and are widespread in the region, generally present in zones where hard rocks outcrop at the ground surface or lies at depths of about 10 meters below the surface. The most significant are the aquifers of the alluvial formations extended along the
97
valley floors and are utilized for drinking water supply of large cities and industrial installations. Water-bearing strata include variously graded sands, which sometimes contain large amounts of medium and fine gravels and result in a porous structure. Well yields reach several tens of litres per second without significant drawdown. Mineralization of water is generally low, ranging between 200 to 300 mg/l.
Alluvial (unconfined) aquifers tend to contain groundwater at the shallowest depths. The ease of access to these resources, coupled with their often high quality, means they are widely used as sources for urban and industrial centres and for agricultural purposes. Shallow alluvial deposits along the river basins are the main source of drinking water for the major cities located in the basin such as Ulaanbaatar (the capital city of Mongolia), Erdenet, Darkhan, Murun, Sukhbaatar, Tsetserleg and Zuunkharaa.
The depth to the groundwater table, although largely undetermined in many regions, commonly ranges from 0-2 meters in the vicinity of the major drainage lines (rivers, streams, etc) to greater than 20 meters. The depth of water table generally increases with increasing distance from the major drainage lines.
The Selenge River Basin includes 14 sub-basins containing frequently unconfined groundwater as shown in Table 1. These groundwater sub-basins roughly correspond to the 14 surface water sub-basins identified in the basin. Table 1. Groundwater Sub-basins in the Selenge River Basin
Groundwater Sub-basin Area of the basin, km2
1 Minjiin (#3) 4,916
2 Huderiin (#4) 5,664
3 Eruugiin (#5) 9,791
4 Shargoliin (#6) 3,738
5 Haraagiin (#7) 12,818
6 Tuuliin (#8) 44,023
7 Orhonii (#10) 34,329
8 Tamiriin (#11) 11,389
9 Ider-Delger-huluutiin (#13) 56,859
10 Hanuyn (#12) 13,252
11 Selengiin (#14) 22,642
12 Huvsgul and Eg-Uuriin (#15 & 16) 37,201
13 Zelteriin (#17) 4,874
14 Shishkhidiin (#18) 18,338
Source: Institute of Geo-Ecology, Mongolian Academy of Sciences, 2008 The groundwater resource of the basin has not been estimated as thicknesses of aquifers are unknown. The groundwater recharge in the basin is estimated to be 5.40x10⁹ m3/year (equal to 14.8x10⁶ m3/day), based on assumptions of soil permeability, rainfall, plant uptake and other factors (Institute of Geo-ecology of the Mongolian Academy of Sciences, 2008).
The major chemical species in the groundwater in the Selenge River Basin are calcium bicarbonate (CaHCO3) or magnesium bicarbonate (MgHCO3) in concentrations ranging between less than 0.1 up to 0.5 kg/m3 (Ministry of Water Economy of Mongolia, 1986). Significant areas in the central regions contain sodium-bicarbonate (NaHCO3) concentrations ranging from less than 0.1 to 1.0 kg/m3. Some selected areas in the southern regions contain high concentrations of CaCl, MgCl and NaCl, usually from 0.5 to more than1 kg/m3.
It has to be noted that the Selenge River Basin includes Lake Khuvsgul, located in Mongolia, an important monitoring site for the impacts of global climate change on forest and steppe. The Khuvsgul region represents the southern boundary of continuous permafrost and therefore it is an international monitoring site for the study of changes in permafrost temperature and change in active layer depths1.
1 The lake is the site of a Global Environment Facility study of Climate Change and Nomadic Pastoral use impacts on the regional biodiversity and on permafrost thaw.
98
2.2 Baikal Lake area (Russia) The Russian part of Lake Baikal watershed is located in the East-Siberian pre-Palaeozoic folded area, which includes several sub-areas of various sizes corresponding to the shields of pre-Cambrian basement of the East-Siberian platform which outcrop owing either to the erosional processes or to tectonic movements or because they are influenced by both natural factors (United Nations, 1986).
The East Siberian hydrogeolocial folded region includes the mountain formations and intermountain depressions of pre-Baikal Upland, Transbaikal, Baikal-Patol plateau of Stanovoy ridge and the Aldan Shield. Six large hydrogeological folded areas of first order, each including several basins of fracture water and artesian basins of groundwater in the intermountain depressions, are found within the boundaries of the East Siberian folded region. The East Siberian folded hydrogeological region is characterized by frequent occurrences of permafrost. The reduction in thickness and increased interruption of frozen rocks in the north to south direction were observed. However, the frosted rocks of thickness of several hundred meters in were found in mountain ranges.
The Baikal Lake sub-basin coincides with the rift zone of the same name extending for almost 2,500 km and bordering the south-eastern side of the Irkutsk platform shield by the double south-convex arc. The ranges are composed of Archean, Proterozoic, Cambrian rocks, pre-Cambrian and Palaeozoic intrusions. Pre-Cambrian and Palaeozoic rocks comprise gneiss, quartzite, marble, limestone, dolomite, sandstone, shale, meta-effusive, granite, grandiorite and gabbro-diorite. Groundwater in these rocks is accumulated in the fractures resulting from tectonic movements and weathering. The fracture zone thickness, due to higher seismicity, is estimated to be several hundreds of metres.
In the East Siberian folded region, fracture water from metamorphic and magmatic associations of Paleozoic and earlier origin is predominant, but the main resources of groundwater are accumulated in the Mesozoic and Cainozoic sediments in the intermountain artesian basins. The predicted groundwater yield is about 125 mln m3/day, of which more than 20 mln m3/day are related to waterside (infiltration) take-offs.
The yields of springs emerging from Proterozoic karsted limestone are as high as 200 l/sec, whereas from other rocks they do not exceed several litres per second. The water composition is of hydrocarbonate calcium and calcium-magnesium type. The mineralization varies from 300 mg/l in mountains to between 200 and 300 mg/l in the foothills.
The yields of springs emerging from Cambrian sandstone and shale range between 0.15 and 10 l/sec and those from granite 0.5 to 3 l/sec. Water is of magnesium-calcium hydrocarbonate and calcium-sodium and calcium hydrocarbonate sulphate type, with mineralization ranging from 300 to 2,000 mg/l.
Springs emerging from fault zones yield up to 30 l/sec, sometimes increasing up to 50 to 60 l/sec; the amount of total dissolved solids varies from 50 to 650 mg/l.
Depressions present one-sided grabens, of which downthrown limbs are most often northern or north-western. Their deposits comprise Oligocene, Neogene and Quaternary continental sediments, consisting of sandstone, aleurolite, clay, marl and brown coal. The maximum thickness of the deposits in the Baikal depression may be as high as 5,000 meters; in the Tunkin depression, it exceeds 2,000 meters and in the Barguzin depression, 1,400 m.
Hydrogeologically, depressions contain intermontane artesian basins with their peculiar features of groundwater formation and distribution. As these depressions lie within the zone of high and moderate rainfall, the largest freshwater-bearing strata occurs in this area.
In Baikal Lake area, the groundwater mineralization varies. The mineralization is less than 100 mg/l on average and around 50 mg/l in the highlands. The chemical composition of groundwater varies quite significantly in different basins and in relation to certain geochemical zones. Higher concentration of silicon is noted in some areas. In artesian basins of the Baikal type (the Ust-Selenginsk, the Barguzin, and the Upper Angara basins), the mineralization in deep aquifers in the depth up to 2,000 meters does not exceed 500-1,000 mg/l with a predominance of sodium bicarbonate (NaHCO3). Although groundwater mineralization has been poorly investigated in the Baikal Lake area, it has been determined that groundwater chemical composition had both horizontal and vertical zonality. The horizontal zonality implies a regular increase in water mineralization from rimming mountains towards the centre of the basins, and groundwater quality ranges from ultra-fresh with negligible total dissolved solids to mineralization of 200 to 300 mg/l. The vertical zonality shows itself in an increase in mineralization with depth. Shallow groundwater confined to Quaternary deposits has mineralization of 80 to 340 mg/l. The mineralization of groundwater of Miocene deposits occurring at a depth of over 2,000 meters is about 3,000 mg/l.
Another distinctive feature of artesian basins in the Baikal Lake area lies in the abundance of thermal water discharges associated with active faults rupture dislocations. Natural supplies of such waters are tentatively estimated by the yields of springs to be over 450 l/sec. The total yield of all springs and wells tapping thermal groundwater of the basin amounts to 1 m3/sec.
The chemical composition of groundwater is also influenced by the leaching and dissolution of rocks, as well as by inflows of overheated halogen alkaline solutions from the deep parts of the earth’s crust, or, as is likely, from the upper earth’s mantle occurring along fracture zones. These solutions – rich in silicic acid, metallogenic elements and gases – mix with fresh cold water at different levels and in different proportions.
99
Precipitation is the major source of groundwater recharge and replenishment in the Baikal Lake area. The inflow of groundwater from the side of rimming mountains and small amounts of juvenile water into sedimentary strata of the basins along fractures, as well as condensation of moisture out of the air also contribute to the groundwater recharge. Shallow groundwater discharges mainly through evapotranspiration, whereas groundwater in the active exchange zone discharges via river and lake networks.
The Baikal Lake area is located in the East Siberian folded region, which is characterized by difficult occurrence of permafrost rocks (Zekster and Everett, 2004). 3. SURFACE-GROUND WATER INTERACTIONS IN THE BAIKAL LAKE BASIN Recent development trends in the Baikal Lake Basin have resulted in growing water demand, increasing anthropogenic pressures on water resources from various land-based activities and land use change, and intensive groundwater development. These impacts, together with impacts of climate change, may modify the natural state in which the surface-ground water interactions occur. In both situations (natural and modified), the surface-ground water interactions are critical to the sustainable use and management of water resources, as well as to maintaining ecosystems in the basin.
The interactions between surface and ground water in the Baikal Lake Basin are of particular importance with regard to: • Water quantity – in particular, in relation to groundwater table and flow in the basin, water balance of the basin,
control of evaporation losses, mitigation of extreme climatic events such as droughts and floods, maintenance of the water-dependent ecosystems of the Baikal Lake and of the basin.
• Water quality, especially, transportation of pollutants and nutrients from land-based sources (such as urban wastewater, solid waste disposal, industry, agriculture and mining), soil erosion and sedimentation.
• Sustainable use and management of groundwater as a strategy for mitigation and adaptation to impacts of climate change and climate variability, including regional droughts and flooding.
• Social and economic development in the basin based on groundwater as the predominant source available for drinking water supply in the basin.
Based on the geology of the area, two types of groundwater circulation may predominate in the Baikal Lake Basin: • deep groundwater circulation • shallow groundwater circulation.
In addition to the surface and ground water interaction in the entire basin area and main tributaries to the lakes, interactions between the lake and groundwater need to be carefully considered, which take place in three ways: groundwater inflow to the lake throughout their entire bed; lake water seeps to groundwater throughout their entire bed; and both processes occurring in localized parts of the lake bed. This is of particular importance as two interconnected large freshwater lakes – namely, Khuvsgul Lake (Mongolia) and Baikal Lake (Russia) – are located in the Basin. 3.1 Deep groundwater circulation Lake Baikal is part of one of the world’s largest active continental rifts. The rift is emplaced in extremely ancient rock complexes of crystalline, volcanic and metamorphic nature, which are generally impervious. In such geological environment rainwater infiltrates preferentially along the vertical permeability pathways represented by the many active faults that characterize the rifting process (frequent powerful earthquakes are typical of the Baikal region).
The bulk of this water reaches great depths, increasing its heat content, and feeds the active geothermal systems that since the beginning of the rifting process and of the lake itself have affected water circulation patterns, including within the lake.
The heat pulses due to the uprising of hot fluids along faults within the lake sediments cause dissociation of gas hydrates (CH4 – the largest continental deposits of hydrates are those of contained in Lake Baikal sediments) within the lake sediments column, and originate hot gas seepages on the bottom of the lake, and associated localized heat flow anomalies. These thermal disturbances within the water column are at the origin of convective circulation, and hence of the total lack of stratification in the lakes water, and possibly of the high transparency of its waters. They control the overall characteristics of the Baikal ecosystem.
Because of these unique characteristics Lake Baikal is the object of intense international research efforts related to plate tectonics, climate change, and gas hydrates thermodynamics, and also of global ecological interest. 3.2 Shallow groundwater circulation A large part of the meteoric groundwater recharge however circulates through shallower horizons within the alluvial sediments of the many rivers draining into the lake, and of the limited aquifers represented by sedimentary formations bordering the lake in some sectors. One of them is the Maloye More Strait where karst formations constitute an important aquifer draining into the lake.
100
3.3 Groundwater discharge to Lake Baikal The groundwater discharge to Lake Baikal occurs in complicated geologic-geomorphological conditions, both along the perimeter of the shoreline and at the bottom of the Baikal depression (Zektser, 2006). Depending on the conditions of recharge, transient flow and discharge, the groundwater discharge to the lake may occur in the following forms:
• spring discharge • sub-channel discharge • interfluves discharge from the coastal zone in the interfluves • artesian discharge • deep discharge
4. TRANSBOUNDARY AQUIFERS IN THE LAKE BAIKAL BASIN As the Baikal Lake Basin is a transboundary watershed, special emphasis should be placed on transboundary groundwater basins, including aquifers, due to the crucial importance of groundwater in the water balance of the basin and the transportation of pollutants in the hydrological cycle.
Little is known about transboundary aquifers shared by Russia and Mongolia, clearly indicating a need for studies on identifying transboundary aquifers and for establishing cooperation between the two countries on transboundary groundwater resources management. In both Russia and Mongolia, there are not sufficient data and information available on transboundary groundwater basins in the Baikal Lake Basin. It is, however, clear that the Selenge alluvial aquifer should be considered, likewise the river itself, as a shared water resource. In general, transboundary groundwater systems often have considerable horizontal extension and can be of various types such as shallow sedimentary aquifers (unconfined aquifers with close links with river basin systems, lake basins and freshwater ecosystems), deeper sedimentary aquifers (confined independent aquifers sometimes linked with freshwater ecosystems like oasis, deep tectonic lakes) and karst aquifers (unconfined aquifers with strong links with ecosystems). Localized fractured aquifers in the crystalline basement do not normally cross borders.
One of the main transboundary issues of concern in the Baikal Lake Basin is groundwater pollution in the upstream part of the basin in Mongolia, which slowly flows towards the downstream Russian section of the Selenge River Basin through alluvial deposits to eventually discharge its loads into Baikal Lake through the delta area. 5. GROUNDWATER USE AND POLLUTION: ISSUES AND PROBLEMS 5.1 Groundwater use Groundwater plays a very important socio-economic role in the Baikal Basin, both in Mongolia and in the Russian Federation. It represents the primary source of drinking water for the population of the Basin, and is also widely used for agricultural and industrial purposes.
Groundwater is an important source of drinking water in Mongolia. Shallow, unconfined aquifers along major river valleys provide high quality freshwater, suitable for human consumption. According to the estimation by the Institute of Geo-ecology of the Mongolian Academy of Sciences, the average groundwater abstraction rate in the Selenge River Basin is estimated to be 2.55x10⁸ m3/yr (about 700,000 m3/day), which is about 5% of the total recharge volume. Although groundwater abstraction rate seems to be very low on average, local aquifer systems in many urban and industrial areas may be affected by intensive groundwater use.
Groundwater exploitation, particularly in Mongolia, is mainly, if not exclusively, targeted to the shallow (from few meters to up to 100 meters) unconfined alluvial aquifers located along all the major valley floors. These aquifers provide high quality freshwater, suitable for human consumption. They are however highly vulnerable to pollution because of their unconfined nature and to over-exploitation due to their shallow depth which translates in low exploration and drilling costs.
The Baikal basin, particularly in the vicinity of the lake, is the site of geological processes such as seismic activity, extensional faulting, and hydrothermal circulation, all of them related to the active rifting process that originated the lake itself. Numerous important thermal springs with temperatures of over 90 degrees characterize the region, and many of them discharge into the lake above and below the lake’s surface, representing an interesting geothermal potential. The high heat content of this deep originated and fault controlled groundwater may partly be responsible for some of the peculiar characteristics of the lake such as lack of stratification. 5.2 Groundwater pollution
101
In recent years, groundwater pollution in the Baikal Lake Basin has become a serious problem due to many forms of pollution from land-based sources. The growing human and land-based activities in the basin has caused widespread contamination of soils and unconfined alluvial aquifers of the many rivers constituting the transboundary Selenge River Basin, which is the main tributary of Lake Baikal. These aquifers are highly vulnerable to many forms of pollution because of their unconfined nature.
Groundwater within the Lake Baikal Basin is likely to be polluted from numerous point and non-point sources. The main sources of pollution include: urban settlements, industrial centres, agriculture and mining. Air pollution is also a major source of water pollution, mainly in surface water. Major pollutants are nutrients, pathogens and toxic pollutants, including heavy metals and persistent toxic substances.
Urban areas are the primary sources of both surface and groundwater pollution as most cities have inadequate sewage and solid waste disposal facilities. Major cities such as Ulaanbaatar (one million inhabitants, Mongolia) and Ulan-Ude (300,000 inhabitants, Russia) and several small-scale settlements and industrial towns are located in both Russian and Mongolian parts of the basin Small settlements often do not have adequate sanitation facilities and wastewater treatment plants, suggesting that untreated raw wastewater is directly discharged into rivers and groundwater. The lack of sanitation facilities in urban areas is the major source of water pollution by human excreta, posing serious health risks due to water-related infectious diseases. In most urban areas, the solid waste disposal is mainly by open dumping. Tuul River – a main tributary of Selenge River – flows through Ulaanbaatar, which is a densely populated area with various industrial activities, is heavily polluted in some sections.
Numerous industrial facilities found in Russia, including the Baikalsk pulp and paper mill, and energy production plants, are likely major sources of groundwater pollution. Two of the largest pulp and paper plants are located in the southern Baikal cities of Baikalsk (on the lake shore) and Selenginsk (40 km south of the lake). Both plants use a sulfate processing technique and the Baikalsk plant has an additional bleaching process that uses chlorine dioxide. The Baikalsk Pulp and Paper Mill, which is located on the lake, is known to be one of the major air and water pollution source at Lake Baikal. This factory produces over 50,000 m3 of effluents and 20,000 tons of air pollution each year (Brunello et al, 2006). Although effluents pass through mechanical, biological and chemical treatment, as well as sedimentation and aeration ponds at the final stage, large amounts of toxic elements such as the chlorine are discharged into Lake Baikal. International and Russian studies (Stepanova et al, 1999) on ecotoxicology and mutagenic xenobiotics in Lake Baikal report that mutagens were found in nearly all water samples released after the pulp chlorination and that the wastewater treatment facility did not totally eliminate the potential toxicity and/or mutagenicity of the effluents of the mill. A biomarker-based study in Lake Baika (Schrцder et al, 2006) suggests that aquatic ecosystems of the lake have been exposed to pollution by organochlorines (released by pulp bleaching) and heavy metals. Attempts to close down the plant have failed due to the local communities’ dependence on the factory for jobs.
Several coal and diesel electric plants are found near major cities such as Ulaanbaatar, Irkutsk and Ulan-Ude. Air pollution from these plants may cause soil and surface water acidification, with potential negative impacts on groundwater resources. In addition, the transport of gas around the southwestern shores of Lake Baikal may have serious environmental impacts in the future.
Agricultural pollution in the Baikal Lake Basin is assumed to be significant. Pollutants such as nutrients, pesticides and pathogens are known to result from agricultural and livestock breeding activities. However, data on the pollution levels is sparse.
Intensive mining activities in Mongolia have caused soil and groundwater pollution in widespread areas as numerous gold mines are located in the Mongolian part of the basin. The gigantic copper and molybdenum mining complex of Erdenet lies in a valley between the Selenge and Orhon rivers, the main tributaries of the Selenge River Basin. Uranium mining is also present in the region. These numerous mining activities in the Mongolian part of the basin contribute to pollution of soil, surface waters and groundwater. The pollution results mainly from inadequate management of tailings and the use of mercury and other highly toxic chemicals. Most large mining operations have tailings ponds that allow the recycling of water for ore processing and reduces the discharge of sediment-laden water into rivers; however, there is little evidence that the mining operations have plans for stabilizing and reclining the tailings and settling ponds. In most cases, tailings and settling ponds dry out. Uncontrolled discharge of effluents from mining operation without tailings ponds of open-pit mines cause the deterioration of water quality in downstream rivers, especially the turbidity and sedimentation. The deviation of river flows into artificial new water cources to some large-scale placer mines appears to be a major source of sediment transportation in rivers.
The use of mercury and other toxic chemicals in artisanal and small-scale gold mining is a serious threat to the ecosystem and human health and is considered to be the main cause of substantial deterioration in water quality in several major rivers across Mongolia. Pollution from mercury due to the use of mercury in gold washing practices is a serious problem in the Boroo River, one of the major tributaries in the Selenge River (World Bank, 2006). The health impacts are believed to be serious; for example, incidents of possible human and animal poisoning due to exposure to mercury through soil and water contamination have been reported in Khongor village (Mongolia), a settlement downstream from a gold mining operation. However, no systematic testing and environmental impact assessment have been carried out to assess the health and environmental impacts of existing mining operations.
102
Not only is mercury polluting rivers, but it is also found in high quantity in the soil, which indicates that groundwater is very likely to be contaminated by mercury. A 2002 study by JICA documented high mercury levels in contaminated soils at the site of the disused Boroo gold recovery factory (World Bank, 2006). This study also reported that areas with mercury-contaminated soil were used for livestock grazing and agricultural production such as vegetables and cereal crops, suggesting a potential threat of the mercury entering the food chain. Hence, soil mercury pollution represents a real threat to both surface and groundwater pollution, with serious threats to human health. It is likely that burning of wood and rubber tires in order to melt the permafrost in artisinal small-scale miners also pollutes soil, surface and groundwater.
The pollution at artisinal and small-scale placer mining sites by rivers and streams appear to be further aggravated by pollution from urban areas.
The growing pollution of groundwater poses serious threats to human health, since groundwater is the main source of drinking water, and contributes together with surface runoff, to localized pollution of the lake in areas near the Selenge delta. Special attention should be given to groundwater pollution because pollution of aquifers is often irreversible due to very slow recharge rates. Once an aquifer is contaminated, it becomes unusable for decades because groundwater residence times can vary from few weeks to thousands of years. In many cases, contamination is recognized only after groundwater users have been exposed to potential health risks. The cost of reclamation of contaminated groundwater is extremely costly. 5.3 Climate change impacts on groundwater resources
Climatic change and climate variability are affecting the region, with floods of increasing frequency and intensity being reported. In this scenario of growingly unpredictable climatic events, groundwater resources might become even more valuable in view of climate change adaptation due to their slower response to climatic changes. Hence, groundwater resources in the region may soon come to represent resources of strategic value, to be managed within the context of an overall strategy of climate change adaptation, including for example investments in managed aquifer recharge to capture floodwater, filter wastewater and increase strategic reserves. 5.4 Major issues relating to groundwater management The groundwater quality and quantity issues are directly linked with surface water, land use, environmental degradation, as well as issues of transboundary concern. Main problems relating to groundwater, as well as major transboundary threats to the Baikal Lake Basin include:
• water quality degradation due to pollution from land-based sources such as urban areas and agriculture, as well as land-based and industrial activities (mining, paper mills, etc.)
• lowering of the groundwater table due to over exploitation, impacting low flows of rivers and groundwater dependent ecosystems
• variations in groundwater recharge due to land degradation, change in land use patterns, and climate change • land and ecosystem degradation causing the modification of critical riparian watershed habitats and ecosystems,
including surface waters (rivers, streams, lakes and wetlands). These problems are deep rooted in inefficient technical and institutional capacity for water resources management and are often caused by:
• limited awareness and understanding of groundwater systems and the role and impact of groundwater for the major transboundary problems and concerns,
• lack of integrated regional strategic planning for conjunctive surface and ground water management and use, for the mitigation of transboundary concerns,
• lack of institutional capacity in existing or future regional coordination mechanisms and management frameworks for the mitigation of transboundary concerns,
• limited regional and national capacity for integrated surface and groundwater and land ecosystem planning and management frameworks,
• lack of sustainability mechanisms for groundwater in Baikal Lake Basin (financing arrangements for institutions, cost-effective sound technology, private sector involvement).
• limited involvement of public and stakeholder participation in water resources management and use. 6. CONCLUSIONS The paper presents a preliminary review of the role of groundwater and surface-ground water interactions in transboundary water pollution in the Lake Baikal Basin and the role of groundwater in transboundary water resources management in the basin, based on available published information. The extensive alluvial unconfined aquifers in the major river valleys suggest strong interactions between surface and ground water in the Baikal Lake Basin and an important role of groundwater in the quantity and quality of water discharging into Lake Baikal.
103
Groundwater appears to be an important source of water for drinking and other uses in the basin although there is a gap in data and research on the estimation of the availability and use of groundwater resources in the Baikal Lake Basin. Groundwater exploitation, particularly in Mongolia, is mainly, if not exclusively targeted to the shallow unconfined alluvial aquifers located along the major valley floors. These aquifers provide high quality freshwater, suitable for human consumption. They are, however, highly vulnerable to many forms of pollution because of their unconfined nature and to over-exploitation due to their shallow depth which translates in low exploration and drilling costs.
Major sources of groundwater pollution include lack of sanitation, wastewater treatment and solid waste disposal facilities in urban settlements. The mining industry (essentially gold mines) represents an important source of pollution in both surface and groundwater in the basin posing particular environmental and human health risks, due to its releases of persistent and bio-accumulative toxic substances such as mercury. This may also contribute to the degradation of Lake Baikal ecosystems.
The Baikal basin, particularly in the vicinity of the lake, is the site of geological processes such as seismic activity, extensional faulting, and hydrothermal circulation, all of them related to the active rifting process that originated the lake itself. Numerous important thermal springs with temperatures of over 90 degrees characterize the region, and many of them discharge into the lake above and below the lake’s surface, representing an interesting geothermal potential. The high heat content of this deep originated and fault controlled groundwater may partly be responsible for some of the peculiar characteristics of the lake such as lack of stratification.
Little is known on the existence of specific transboundary aquifers within the context of the transboundary Baikal basin. It is, however, clear that the Selenge alluvial aquifer should be considered, likewise the river itself, as a shared water resource. The main transboundary issue of concern in the Baikal Lake Basin appears to be groundwater pollution in upstream Mongolia, which eventually discharges into Lake Baikal.
With floods of increasing frequency and intensity being reported, groundwater resources in the basin appear to be resources of strategic value in view of climate change adaptation due to their slower response to climatic changes.
The lack of data of groundwater resources estimation and use suggests that further research and data collection is required in this area. The potentially serious impacts of groundwater pollution in the basin indicate an urgent need to adopt measures for controlling pollution from various sources. There appears to be a lack of a policy framework for sustainable use and management of groundwater resources in the basin. The lack of institutional capacity at the local level that might also hinder efforts to introduce the integrated and conjunctive surface and groundwater management, upon which the effectiveness of future policies and measures aimed at the sustainable use of the water resources of the basin and the protection of the unique ecosystems and biodiversity of Lake Khuvsgul and Lake Baikal will largely depend. Finally, the protection of groundwater resources in the Baikal Lake Basin is of crucial importance due to its important role in maintaining surface waters and aquatic ecosystems in the basin, as well as due to its strategic value for adaptation to climate change. REFERENCES
Brunello A. J., Molotov, V. C., Dugherkhuu, B., Goldman, C., Khamaganova, E., Strijhova, T., and Sigman, R. (2006). Lake Baikal: Experience and Lessons Learned Brief. GEF International Waters Learning Exchange and Resource Network. http://www.iwlearn.net/publications/ll/lakebaikal_2005.pdf
Schrцder H. C., Efremova, S. M., Margulis, B. A., Guzhova, I. V., Itskovich, V. B., and Mьller, W. E. G. (2006). Stress response in Baikalian sponges exposed to pollutants, Hydrobiologia, 568, Supplement 1: 277-287.
Stepanova, L,. Glaser, V., Savinova, T. Kotelevtsev, S., Savva, D. (1999). Accumulation of Mutagenic Xenobiotics in Fresh Water (Lake Baikal) and Marine (Hornoya Island) Ecosystems. Ecotoxicology 8 (2):83-96.
United Nations. (1986). Ground Water in Continental Asia (Central, Eastern, Southern, South-Eastern Asia). Natural Resources/Water Series No. 15, United Nations Department of Technical Co-operation for Development, United Nations, New York.
World Bank. (2006). Mongolia: A Review of Environmental and Social Impacts in the Mining Sector. World Bank. www.worldbank.org/eapenvironment
Zektser, I., and Everett, L. G. (2004). Groundwater Resources of the World and Their Use. UNESCO International Hydrological Programme, IHP-VI, Series on Groundwater No. 6, UNESCO.
Zektser I., Dzhamalov, R.G., and Everett, L. G. (2006). Submarine Groundwater. CRC Press/Taylor & Francis Group. ACKNOWLEDGEMENTS: This preliminary review of surface-ground water interactions in the Baikal Lake Basin was conducted by the UNESCO International Hydrological Programme, in cooperation with UNESCO Chair on Sustainable Groundwater Management at Institute of Geo-ecology in Mongolia and UNESCO Chair on Water Resources at Irkutsk State University in Russia. Contributions of: Prof. Tadashi Tanaka (University of Tsukuba, Japan/Co-Chairholder of UNESCO Chair on Sustainable Groundwater Management in Mongolia); Dr. Erdenechimeg Badamgarav (Institute of Geo-ecology, Mongolian Academy of Sciences); Dr. Bo Appelgren (UNESCO Consultant); Prof. Igor S. Zektser (Water Institute, Moscow, Russia); Dr. Maki Tsujimura (University of Tsukuba, Japan); Prof. Alexander I. Smirnov, (Irkutsk State University, Organic Chemistry); Prof. Gregory M. Speizer (Irkutsk State University/Executive

104
Director of the UNESCO Chair on Water Resources in Irkutsk, Russia); and Dr. Eugene A. Silow (Irkutsk State University, Russia) are gratefully acknowledged.
105
Uncertainties in Indonesia Water Resources Availability2
Hidayat Pawitan Hydrometeorology Lab - IPB Bogor 16680, INDONESIA
Abstract
Status of Indonesia water resources can be examined from primary water availability by major islands with an estimated total of water available at 2110 mm/year or 127 775 m3/s which is equivalent to four million MCM/year (MCM= mega cubic meter). Dividing this regional water availability by population of the region give water availability index that ranges from 0.15 m3/cap./day for metropolitan areas like Jakarta to 1480 m3/cap./day for West Papua or approximately 50 m3/cap./day for a national average. This water availability which is relatively abundance, however with un-equal distribution in time and space in many cases has caused great uncertainties to the environment and society. Monsoon rains contribute 80% of the annual total during six month rainy season, and severe droughts with serious impacts occur almost periodically. In the past century land use changes from forest cover to agricultural uses, but in the last few decades land use conversion in Java is from agricultural to human settlements and industrial uses. Population pressure with land hungry and rapid industrial development have implied extensive land use changes and increased water demand, and apparently to cause uncertainties in water resources availability, in addition to global climatic change. The present paper would try to discuss and identify the factors that influence these uncertainties. Keywords: Indonesia water resources, land use changes, water availability, uncertainties INTRODUCTION AND BACKGROUND Early interest in uncertainties in hydrology had been expressed by Amorocho (1970) who complement it with determinism that has become the aims of objective sciences to provide necessary hydrologic predictions, while recent discussions in literature were triggered by Beven (2006) who questions the confidence in science of stakeholders and end users with uncertainties of estimation. One of the responses to Beven appeal was given by Montanari (2007) who commented the lack of precise scientific definition of ‘uncertainty’, which created difficulties to assess limitations of individual methods to quantify the reliability of hydrologic simulation, design variables and forecasts. In a broad sense, Montanari referred to Zadeh’s definition of uncertainty as an attribute of information, applicable to hydrology where uncertainty was dealt using probability theory, however, he also stressed to non-statistical approaches based on im-precise probability, and classify uncertainty assessment methods of hydrologic model outputs into four types. Todini and Mantovan (2007) joined the discussion of uncertainty in hydrologic model predictions where it was stated that in practice there is a lack of
2 International conference “Uncertainties in Water Resource Management: causes, technologies and consequences”/WRM-Mon2008 in conjunction with the 16th Regional Steering Committee (RSC) Meeting for the UNESCO International Hydrological Programme for Southeast Asia and the Pacific (UNESCO-IHP SEAP). Ulaanbaatar City, Mongolia, 29 September – 3 October 2008.
106
demand from end users on information about uncertainties, but they raised a question on a decision to take related to implied consequences in relation to a future or in relation to model forecast?. The obvious answer to this simple question certainly reminds us to be aware of the essence of science with its predictive power to future events. Therefore, for discussion purposes, in the present paper, preliminary discussion of uncertainty assessment will follow a rather qualitative approach to the intrinsic nature of the hydrologic systems that consist of input, system, and output which were much influenced by time variability, the complex nature of the hydrologic system, dynamic nature of human interventions, climate variability and changes. Understanding nature of the system involves description of the water resources system and its dynamic changes which is crucial in assessing the uncertainty and accuracy of estimation of hydrologic information. Water Resources systems: Recent development in Indonesia is characterized by rapid land use and land cover changes with deforestation, land clearing, overgrazing and other intensive farming practices, and with intense rainfall considerably increases soil erosion and nutrient wash out. Soil erosion is one of the nation’s most serious environmental degradation problems. In some cases, the effects are catastrophic (e.g. flash-mud floods and land slides) that occurred quite extensive following the rainy seasons. These poor land management practices have increased the sediment loads carried by rivers many times higher than the natural backgrounds, except possibly when dams are present and captured the sediment, the future of tropical estuaries and coastal zones will have increased muddiness and increased sedimentation and flooding. Development of water resources systems was necessary to cope with increasing population coupled with increased demand for water, food and energy. Zehnder et al. (2003) raised the need for action on water issues at different levels, where water uses were divided into four sectors: (i) water for people, services and industries; (ii) water for agriculture; (iii) water for nature; and (4) water for energy production. The resulting environmental impact involves increased sedimentation and flooding, increased turbidity which resulted in decreased primary productivity and loss of aesthetics, further resulting in economic loss from fisheries and the tourism industry. Chen et al. (2004) indicated the Taiwan example of island-based catchment where population pressure pushed the people further inland to upper catchment areas causing denudation of topsoil. Anthropogenic influences: in the past century land use changes from forest cover to agricultural uses, but in the last few decades land use conversion in Java is from agricultural to non-agricultural uses. Population pressure with intensive agriculture and rapid recent industrial development implied extensive land use changes and increased water demand, and suspected to cause this long term changes, in addition to global climatic change. Pawitan (2002) noted the Boeke report (1941) with title From four million to forty million people in Java and Madura indicating the population increase from 1800 to 1930, when the first Sensus was conducted. It was reported that since old days, population density in Java had been very diverse, from 9 persons/km2 to 880 person/km2 in 1815 with average 35 person/km2, and this average increased to 330 (1930) and 1000 (2000). This increase of population has severely affected the land uses and continuous changes in vegetation covers, with consequences in land degradation, soil erosion, and uncertainties to future changes in hydrologic regimes and environmental qualities. Pawitan (2000) concluded that land use changes in Java Island have altered hydrologic regimes with significant reduction of annual rainfall and the associated river discharge, which also were strongly influenced by ENSO events. Trenberth (2004) and Vose et al. (2004) discussed the impact of land-use change on climate based on NCEP/NCAR 50-year reanalyses (NNR) and realized certain uncertainties in the use of types of observed data.

107
INDONESIA WATER RESOURCES Recent hydrologic and water resources events in Java Island were characterized by occurrences of extreme floods and droughts with high sediment/pollutant contents in the water bodies, and water crisis is anticipated as real threat to satisfy Java increasing water demands due to increase population pressures (121 millions people in 2000) and extensive land conversion activities. Conversion of paddy fields alone in Java was estimated at 26 thousand hectares per year, but some believe this figure could be a few times larger, indicating obvious uncertainties. Significant impacts of these land use changes and environmental degradation are now believed to have changed the natural carbon, nutrient and water cycles, i.e. the ecological hazards (Pawitan et al., 2007). Depletion of forest resources also has threatened Indonesia water resources due to significant decline of rainfall (Aldrian, 2006). Pawitan et al. (2006) indicated changes to watershed functions due to intense agricultural practices and industrial development. Status of Indonesia water resources can be examined from primary water availability by major islands as given on Table 1 indicating a total water available of 2110 mm/year or 127 775 m3/s which is equivalent to four million MCM/year (MCM= mega cubic meter). Dividing this regional water availability by population of the region give water availability index that ranges from 0.15 m3/cap./day for metropolitan areas like Jakarta to 1480 m3/cap./day for West Papua or approximately 50 m3/cap./day for a national average. This water availability is relatively abundant, however un-equal distribution in time and space in many cases has caused serious problems to the environment and society. Monsoon rains drop 80% of the annual total during rainy season, and severe droughts with wide spread impacts occur almost periodically. Figure 1 illustrates the typical seasonal pattern of rainfall in Indonesia that is recognized of three types and the characteristics of Java major river basins and their stream flows are as given on Tables 2 and 3 below with the average minimum and maximum discharges indicating extreme conditions. Table 1. Water resources availability in Indonesia by major islands.
Runoff Groundwater Total Water Available Island
Area [103 km2]
Rainfall [mm/yr]
[mm/yr] [m3/s] [mm/yr] [m3/s] [mm/yr] [m3/s] Sumatra 477.4 2801 1848 27 962 280 4 236 2 128 32 198 Java 121.3 2555 1658 6 378 255 982 1 915 7 360 Bali&NT 87.9 1695 997 2 779 170 472 1 167 3 251 Kalimantan 534.8 2956 1968 33 359 296 5 010 2 264 28 369 Sulawesi 190.4 2156 1352 8 157 216 1 301 1 564 9 458 Maluku 85.4 2218 1400 3 785 222 600 1 621 4 385 W.Papua 413.9 3224 2175 28 524 322 4 229 2 497 32 754 Indonesia 1911.1 2779 1832 110 944 278 16 831 2 110 127 775 Source: Pawitan (1999)
Hydrologic characteristics of these major rivers, as presented on Table 3, show strong seasonal variations with ratios of maximum discharge to minimum discharge 20 to well over 100, and it is recognized that these ratios are increasing almost for all rivers in Java. These increasing trends are characterized by increased maximum discharges and lowered minimum discharges. Therefore, indicated the deterioration of water storage capacity of the basins, naturally on the natural water bodies, as well as on reservoirs and dams. Regional characteristics of Java water resources can be shown from values of specific discharge of the rivers, ranging from 15 m3/s/100km2 to 80 m3/s/100km2, but mostly under 30 m3/s/100km2 except for Serayu and Ciujung. It is believed that at present conditions, these specific discharges of Java’s major rivers are somewhat lower than those historical conditions, while seasonal flow patterns
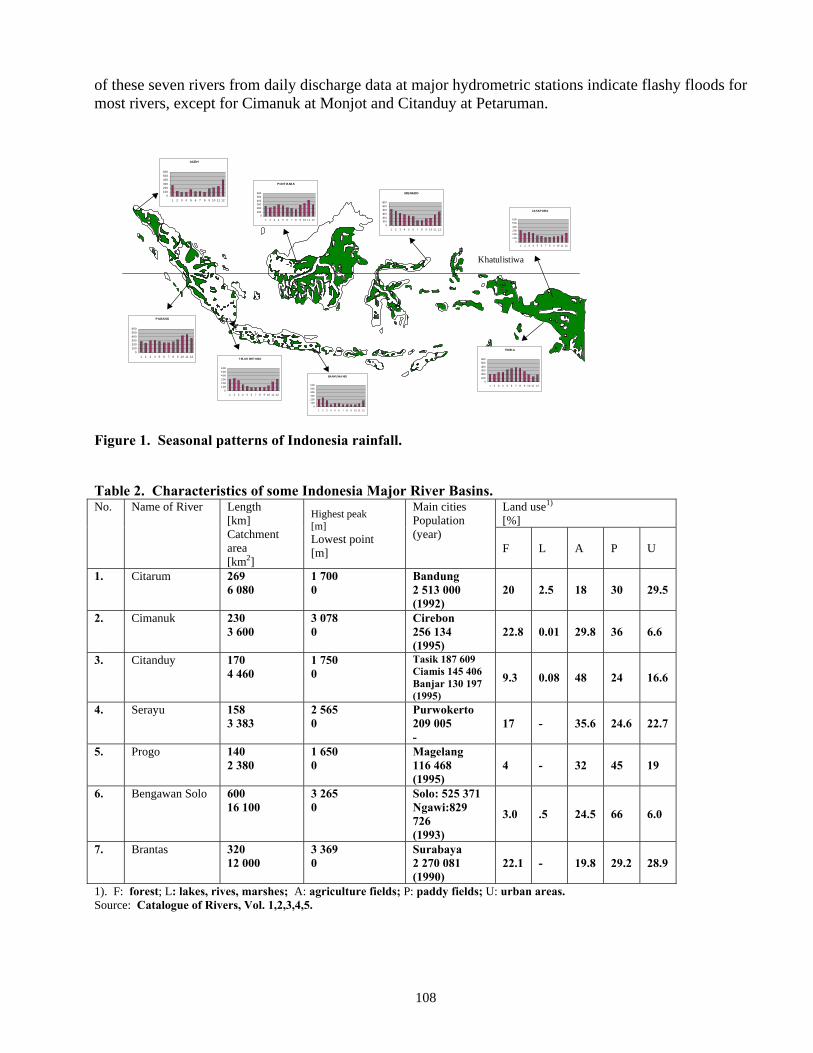
108
of these seven rivers from daily discharge data at major hydrometric stations indicate flashy floods for most rivers, except for Cimanuk at Monjot and Citanduy at Petaruman. Figure 1. Seasonal patterns of Indonesia rainfall. Table 2. Characteristics of some Indonesia Major River Basins.
Land use1) [%]
No. Name of River Length [km] Catchment area [km2]
Highest peak [m] Lowest point [m]
Main cities Population (year)
F L A P U
1. Citarum 269 6 080
1 700 0
Bandung 2 513 000 (1992)
20 2.5 18 30 29.5
2. Cimanuk 230 3 600
3 078 0
Cirebon 256 134 (1995)
22.8 0.01 29.8 36 6.6
3. Citanduy 170 4 460
1 750 0
Tasik 187 609 Ciamis 145 406 Banjar 130 197 (1995)
9.3 0.08 48 24 16.6
4. Serayu 158 3 383
2 565 0
Purwokerto 209 005 -
17 - 35.6 24.6 22.7
5. Progo 140 2 380
1 650 0
Magelang 116 468 (1995)
4 - 32 45 19
6. Bengawan Solo 600 16 100
3 265 0
Solo: 525 371 Ngawi:829 726 (1993)
3.0 .5 24.5 66 6.0
7. Brantas 320 12 000
3 369 0
Surabaya 2 270 081 (1990)
22.1 - 19.8 29.2 28.9
1). F: forest; L: lakes, rives, marshes; A: agriculture fields; P: paddy fields; U: urban areas. Source: Catalogue of Rivers, Vol. 1,2,3,4,5.
ACEH
0100200300
400500600
1 2 3 4 5 6 7 8 9 10 11 12
P ONTIANAK
0100
200300400
500600
1 2 3 4 5 6 7 8 9 10 11 12
Khatulistiwa
MENADO
0
10 020 0
30 0
40 050 0
60 0
1 2 3 4 5 6 7 8 9 1 0 1 1 1 2
PADANG
0100200300400
500600
1 2 3 4 5 6 7 8 9 10 11 12
TIMIKA
0100
200300400
500600
1 2 3 4 5 6 7 8 9 10 11 12
BANYUWA NGI
0
100200
300
400500
600
1 2 3 4 5 6 7 8 9 10 11 12
T ELUK BET UNG
0
1 002 003 00
4 005 006 00
1 2 3 4 5 6 7 8 9 10 11 12
JAYAPURA
0
1 00
2 00
3 00
4 00
5 00
6 00
1 2 3 4 5 6 7 8 9 10 11 12
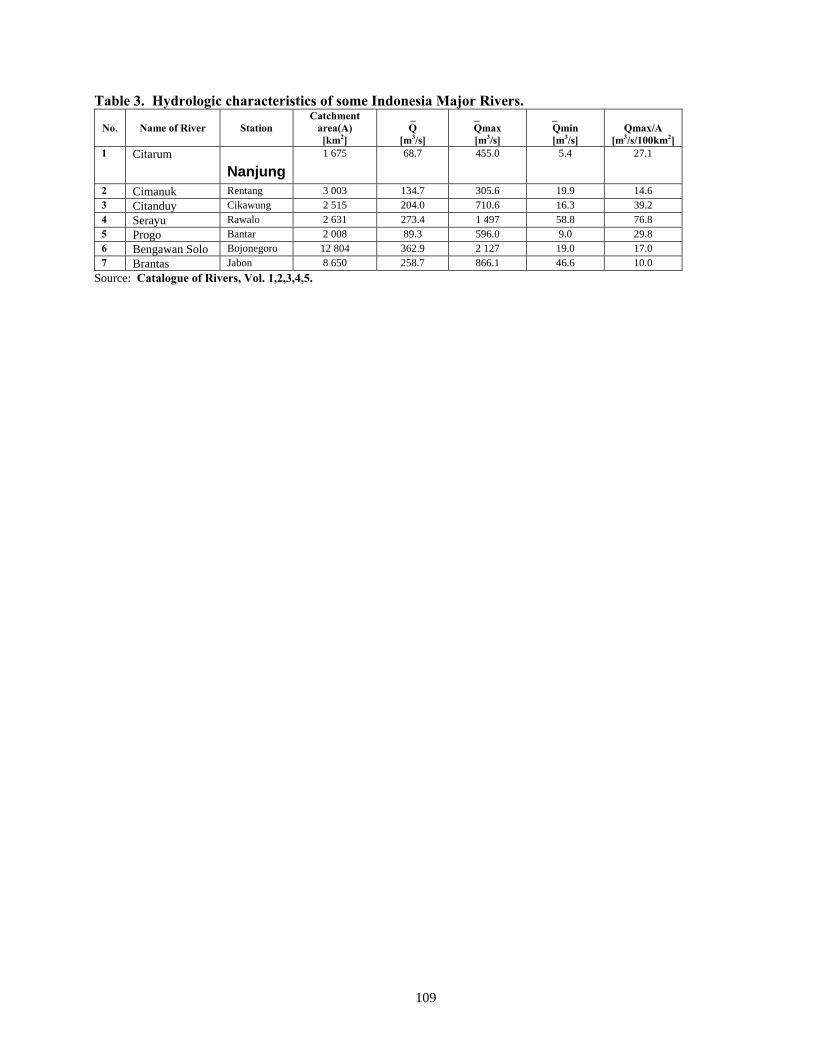
109
Table 3. Hydrologic characteristics of some Indonesia Major Rivers.
No. Name of River Station Catchment
area(A) [km2]
_ Q
[m3/s]
_ Qmax
[m3/s]
_ Qmin
[m3/s]
Qmax/A
[m3/s/100km2] 1 Citarum
Nanjung 1 675 68.7 455.0 5.4 27.1
2 Cimanuk Rentang 3 003 134.7 305.6 19.9 14.6 3 Citanduy Cikawung 2 515 204.0 710.6 16.3 39.2 4 Serayu Rawalo 2 631 273.4 1 497 58.8 76.8 5 Progo Bantar 2 008 89.3 596.0 9.0 29.8 6 Bengawan Solo Bojonegoro 12 804 362.9 2 127 19.0 17.0 7 Brantas Jabon 8 650 258.7 866.1 46.6 10.0
Source: Catalogue of Rivers, Vol. 1,2,3,4,5.
110
UNCERTAINTIES IN INDONESIA WATER RESOURCES The intrinsic uncertainties of a hydrologic system should be recognized from the internal and external origins of the system description, the input and the output of the system, and this division may be somewhat arbitrary depends on the definition of the water continuum. These uncertainties stem from the complex nature of the hydrologic system itself and the difficulties or the impossibility in constructing a perfect model representation of the complex system following known physical laws. The complex hydrologic system is characterized by time variant-non stationary-non linear system. Therefore, any attempts to understand this complex system will be limited to a simplified model system that is expected to mimic the basic properties of the prototype system. In Indonesia’s Water Law, the water continuum of a watershed or river basin as hydrologic system is defined integrating the commonly defined of river basin and the coastal zone, including the sea waters where river influence with human activities in the basin is still felt. Uncertainties in Indonesia water resources systems can be recognized in the following components: (i) the rainfall inputs as influenced by climate system; (ii) human dimension/activities/anthropogenic influences; (iii) the land phase with its dynamic changes/land use and cover changes; (iv) regional water balance and availability; and (v) model parameterization. Rainfall inputs as influenced by climate system: present rainfall information as derived from observation datasets of illustrates great uncertainties of the input to the river systems in Indonesia due to poor data quality. Rain varies significantly seasonally and spatially that ranges from 600 mm/year at few arid spots to well above 6000 mm/year at many mountainous regions. Fekete and Vorosmarty (2004) compared six-monthly dataset to assess uncertainties in the datasets and their impact on runoff estimates, and concluded that the need to improve precipitation estimates in arid and semiarid regions, in Indonesia this equivalent to mountainous regions, where a slight change in rainfall estimates can result in dramatic changes in runoff response due to non-linearity of the rainfall-runoff generation processes. Increased uncertainty with climate change requires the development of observational studies of droughts in Indonesia with monitoring and evaluation systems, including the fire danger rating system. Human dimension/activities/anthropogenic influences: population growth presently at 1.3% to 1.5% is the trigger to food and energy consumption, and other human needs, and this growth rate is believed at the positive side or with increased uncertainties. The rice consumption is estimated at 135 kg/capita/year which is rather high. Therefore a change in consumption pattern to lower rate would reduced drastically the demand for staple food, but would increase demand for meats, dairy and poultry products. This human dimension would have significant pressure changes to land and water resources and a time horizon of 20 to 30 years would be necessary for these adjustments to take place. Land phase with its dynamic changes: land use and cover changes can be seen as a direct consequences of population increase, and presently these have created mozaics of uncertainties due to land conversions through illegal loggings and expansions of road networks and industrial and human settlements. Population density on Java Island already reach 1000 people/sq.km with 60% of Indonesia’s population, but in West Papua population density is as low as 10 people/sq.km indicating different development policies. The past ten years were a period of dramatic change in Indonesia LUCC with uncertainties in massive forest denudation averaged at 3.8 million ha/year due to extensive illegal loggings to recent more controlled deforestation, so that now level of deforestation rate officially below one million hectare/year with some reserve uncertainty.
111
Regional water balance and availability: river discharge datasets in Indonesia mostly were obtained from hydrometric stations that were installed in early 1970s with some from older periods, but due to limitation in data processing capacity augmentation of river data was generated using rainfall-runoff and water balance models. Uncertainties in river datasets can be identified from the operational factors of hydrometric stations, data processing and data generation using models. Operational factors often restrict to guarantee continues data even from recording stations and most crucial is determination of rating curves that lack high discharges making gross uncertainties in estimating accurate flow volumes. Therefore, development of suitable water balance and rainfall-runoff models are very important, and it is believed can eliminate some uncertainties. Bloschl et al. (2007) provide a roadmap of how to address the issues of climate variability and land cover change impact on flooding and low flows that can be adopted as a national effort. Model parameterization: hydrologic model predictions were based on mathematical formulation of description of nature of the hydrologic system. Correct representation and conceptualization of the system and components of systems into model parameterization were essential step in obtaining suitable model structure. In Indonesia at present, there is no endorsed hydrologic model(s) applicable to existing river systems, however there are extensive experiences with diverse types of imported hydrologic models, mostly at national universities exercised by students. Simple models were suggested, such as Mock Water Balance Model based on soil moisture accounting, the NRCS (formerly SCS) water balance model based on soil-land-use complexes, or H2U unit hydrograph model based on fractal geomorphological approach. IMPLICATIONS AND CHALLENGES The public, stakeholders and end users of water, may be ignorance of the uncertainty of water resources, but the problems are there as with present science nobody can guarantee a perfect knowledge of the future. Ignoring the uncertainty in our decision concerning the future implied severe consequences. Recent national development in Indonesia is still characterized with positive population growth posed a need for increased food and energy production, and access to basic drinking water and sanitary services, which have increased awareness of regional water crises due to scarcity and access. Seasonal rainfall patterns generate floods and droughts so that apparent challenges are to manage abundant water during wet seasons to be distributed timely to dry seasons and through transboundary water transfer, and certainly these would require sufficient investments in time, expertise and money. The challenges of Indonesia water resources development are widespread according to local and regional biophysical, socio-cultural characters and existing levels of development. In Java which is characterized by high population density, small farming systems, and opportunities to work off farms, more people would be urbanized and become markets for nearby farm products, while in low density areas such as in West Papua which is characterized by vast areas with limited people, opportunities should be opened to large corporations to develop fully mechanized farming systems for export purposes. This policy should be within the framework of sustainable development which is already widely accepted. CONCLUDING REMARKS
1. Indonesia water availability is relatively abundant; however un-equal distribution in time and space in many cases has caused serious uncertainties to the environment and society.
112
2. Uncertainties in Indonesia water resources systems can be recognized in the following components: (i) the rainfall inputs as influenced by climate system; (ii) human dimension/activities/anthropogenic influences; (iii) the land phase with its dynamic changes/land use and cover changes; (iv) regional water balance and availability; and (v) model parameterization.
3. The challenges of Indonesia water resources development are widespread according to local and regional biophysical, socio-cultural characters and existing levels of development, but still within the framework of sustainable development .
REFERENCES Amorocho, J., Uncertainty and Determinism in Hydrology. Water Science and Engineering
Papers#1043 (1970). University of California, Davis. Beven, K, On undermining the science? Hydrol.Process. 20(2006)3141-3146. Bloschl, G., S. Ardoin-Bardin, M.Bonell, M.Dorninger, D.Goodrich, D.Gutknecht, D.Matamoros,
B.Merz, P.Shand, and J.Szolgay, At what scales do climate variability and land cover change impact on flooding and low flows? Hydrol.Process. 21(2007)1241-1247.
Catalogue of Rivers, Vol. I (1995), II (1997), III (2000), IV (2002), V (2005). Unesco – IHP RSC Southeast Asia and the Pacific.
Chen, CTA, JT Liu, and BJ Tsuang, Island-based catchment: the Taiwan example. Reg. Environ. Change (2004) 4:39-48.
Fekete, BM and CJ Vorosmarty, Uncertainties in precipitation and their impacts on runoff estimates. J.Clim. Vol.17(2004)294-304.
Kremer, HH, River catchment-coastal sea interaction and human dimensions. Reg. Environ. Change (2004) 4:1-3.
Montanari, A., What do we mean by ‘uncertainty’? The need for a consistent wording about uncertainty assessment in hydrology. Hydrol.Process. 21(2007) 841-845
Pawitan, H., Present Situation of Water Resources and Water Related Disasters and the Role of Agro-environmental Education in Indonesia, Tsukuba Asian Seminar on Agricultural Education (TASAE 2002), Nov. 6 ~ 12, 2002, Tsukuba, JAPAN.
______________, Long term changes of Java hydrologic regimes. Paper presented at International Symposium on Fresh Perspectives in Hydrology and the Eight Regional Steering Committee (RSC) Meeting for International Hydrological Program Southeast Asia and the Pacific, Christchurch, New Zealand, 20~24 November, 2000.
_________, M Taufik, and L.Kolopaking. Biophysical indicators of forested watershed functions: case study of Cicatih basin-West Java. Final Report of Collaborative Research between CIFOR and Hydrometeorology Lab-IPB, Bogor(2006).
_________, SP. Nugroho and E. Aldrian, Ecological hazards affecting the major rivers of Java Island. Paper presented at The International Conference on Hydrology and Water Resources Management for Hazard Reduction and Sustainable Development (HRSD 2007), 19-23 November, 2007, Metro Manila, Philippines
Todini, E. and P. Mantovan, Comment on:’On undermining the science?’ by Keith Beven. Hydrol.Process 21(2007)1633-1638.
Trenberth, KE, Rural land-use change and climate. Brief communications, Nature, Vol.427(2004)213. Vose, RS and TR Karl, Impact of land-use change on climate. Brief communications, Nature,
Vol.427(2004)213-214. Zehnder, AJB, H. Yang and R. Schertenleib, Water issues: the need for action at different levels.
Aquat. Sci. 65 (2003)1-20.
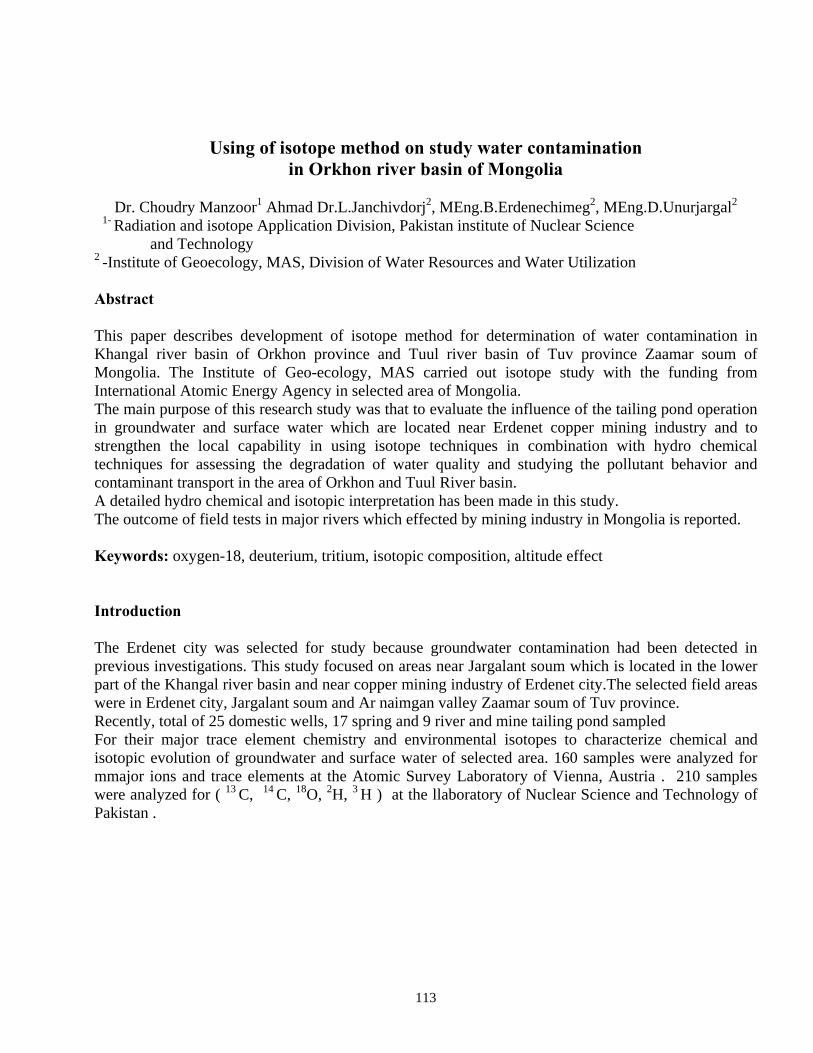
113
Using of isotope method on study water contamination in Orkhon river basin of Mongolia
Dr. Choudry Manzoor1 Ahmad Dr.L.Janchivdorj2, MEng.B.Erdenechimeg2, MEng.D.Unurjargal2
1- Radiation and isotope Application Division, Pakistan institute of Nuclear Science and Technology
2 -Institute of Geoecology, MAS, Division of Water Resources and Water Utilization Abstract This paper describes development of isotope method for determination of water contamination in Khangal river basin of Orkhon province and Tuul river basin of Tuv province Zaamar soum of Mongolia. The Institute of Geo-ecology, MAS carried out isotope study with the funding from International Atomic Energy Agency in selected area of Mongolia. The main purpose of this research study was that to evaluate the influence of the tailing pond operation in groundwater and surface water which are located near Erdenet copper mining industry and to strengthen the local capability in using isotope techniques in combination with hydro chemical techniques for assessing the degradation of water quality and studying the pollutant behavior and contaminant transport in the area of Orkhon and Tuul River basin. A detailed hydro chemical and isotopic interpretation has been made in this study. The outcome of field tests in major rivers which effected by mining industry in Mongolia is reported. Keywords: oxygen-18, deuterium, tritium, isotopic composition, altitude effect Introduction The Erdenet city was selected for study because groundwater contamination had been detected in previous investigations. This study focused on areas near Jargalant soum which is located in the lower part of the Khangal river basin and near copper mining industry of Erdenet city.The selected field areas were in Erdenet city, Jargalant soum and Ar naimgan valley Zaamar soum of Tuv province. Recently, total of 25 domestic wells, 17 spring and 9 river and mine tailing pond sampled For their major trace element chemistry and environmental isotopes to characterize chemical and isotopic evolution of groundwater and surface water of selected area. 160 samples were analyzed for mmajor ions and trace elements at the Atomic Survey Laboratory of Vienna, Austria . 210 samples were analyzed for ( 13 C, 14 C, 18O, 2H, 3 H ) at the llaboratory of Nuclear Science and Technology of Pakistan .
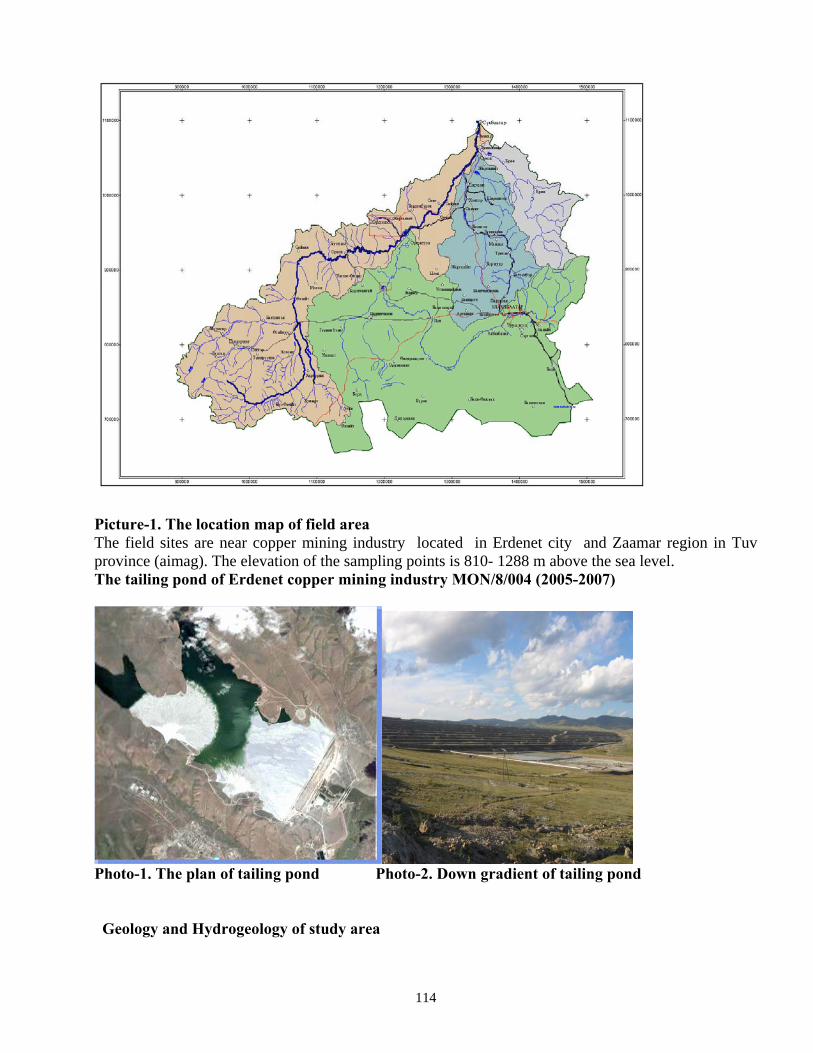
114
Picture-1. The location map of field area The field sites are near copper mining industry located in Erdenet city and Zaamar region in Tuv province (aimag). The elevation of the sampling points is 810- 1288 m above the sea level. The tailing pond of Erdenet copper mining industry MON/8/004 (2005-2007)
Photo-1. The plan of tailing pond Photo-2. Down gradient of tailing pond Geology and Hydrogeology of study area
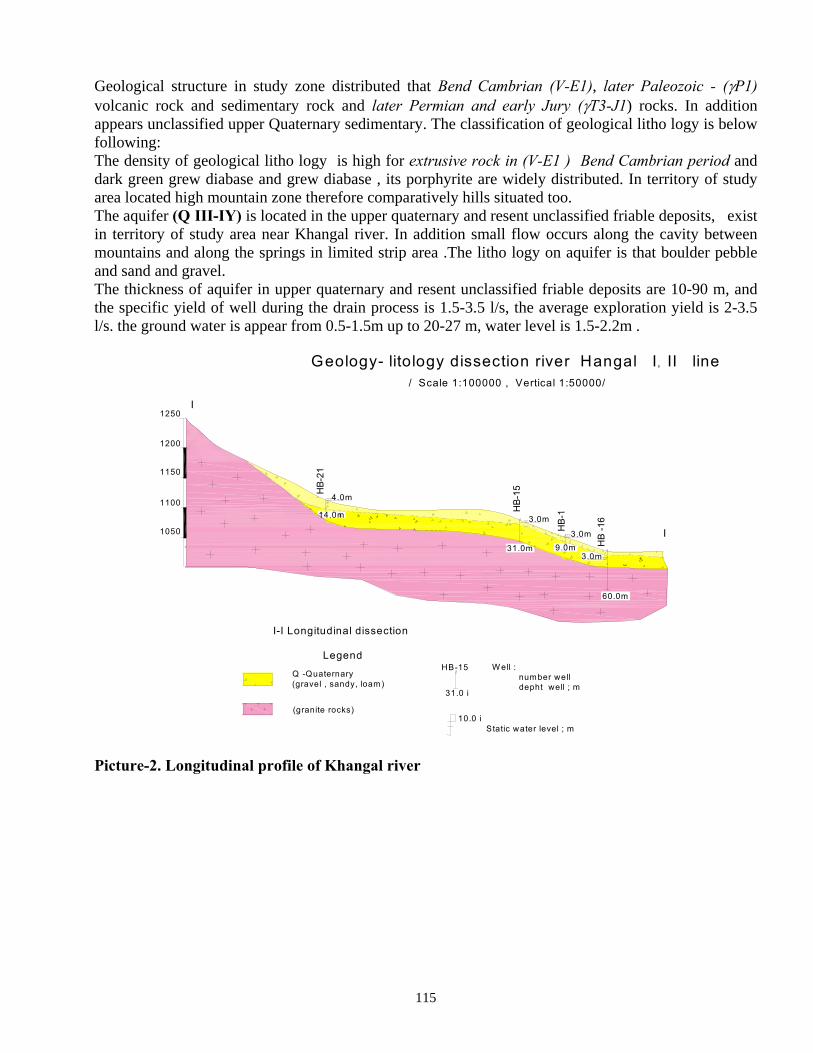
115
Geological structure in study zone distributed that Bend Cambrian (V-E1), later Paleozoic - (γP1) volcanic rock and sedimentary rock and later Permian and early Jury (γT3-J1) rocks. In addition appears unclassified upper Quaternary sedimentary. The classification of geological litho logy is below following: The density of geological litho logy is high for extrusive rock in (V-E1 ) Bend Cambrian period and dark green grew diabase and grew diabase , its porphyrite are widely distributed. In territory of study area located high mountain zone therefore comparatively hills situated too. The aquifer (Q III-IY) is located in the upper quaternary and resent unclassified friable deposits, exist in territory of study area near Khangal river. In addition small flow occurs along the cavity between mountains and along the springs in limited strip area .The litho logy on aquifer is that boulder pebble and sand and gravel. The thickness of aquifer in upper quaternary and resent unclassified friable deposits are 10-90 m, and the specific yield of well during the drain process is 1.5-3.5 l/s, the average exploration yield is 2-3.5 l/s. the ground water is appear from 0.5-1.5m up to 20-27 m, water level is 1.5-2.2m .
Geology- litology dissection river Hangal I, II line/ Scale 1:100000 , Vertical 1:50000/
1250
1200
1150
1100
1050
HB-
21
HB-
15
HB-
1
HB
-1614.0m
31.0m 9.0m
60.0m
3.0m
3.0m
3.0m
4.0m
Legend
Q -Quaternary(gravel , sandy, loam)
(granite rocks)
Static water level ; m
HB-15
31.0 i
W ell : number well depht well ; m
10.0 i
I-I Longitudinal dissection
I
I
Picture-2. Longitudinal profile of Khangal river
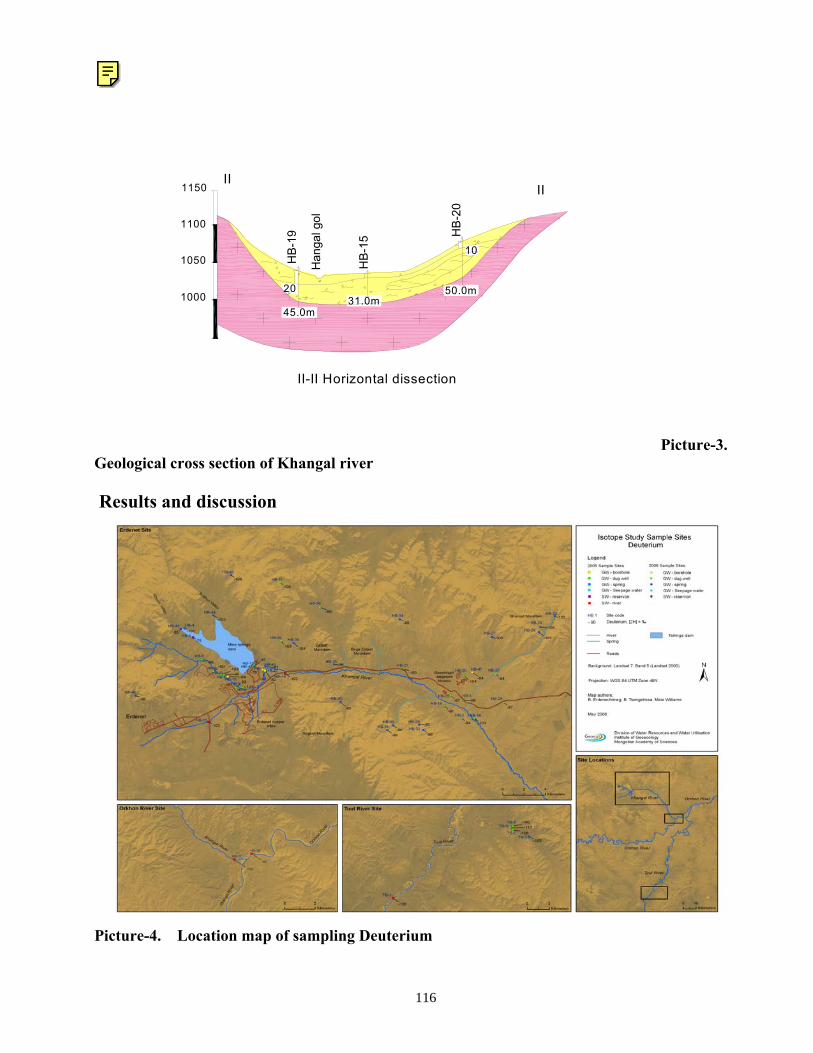
116
HB
-15 H
B-2
0
Han
gal g
ol
HB
-19
45.0m31.0m
50.0m20
10
1150
1100
1050
1000
IIII
II-II Horizontal dissection
Picture-3. Geological cross section of Khangal river Results and discussion
Picture-4. Location map of sampling Deuterium

117
Picture-5. Location map of sampling Oxygen18
Graph-1. Isotopic composition of the groundwater in Khangal and Tuul river basin Seepage water from the mine tailing pond and observation wells collected down gradient from the mine tailing, plotted close to the evaporation line indicating that aquifer of this part has been impacted by the mine tailing (HB-41,40,47) since the plume is characterized by enriched 18O and2H values due to evaporation in the pond.
Isotopic composition of the groundwater in the Hangal River basin of Mongolia
Global Meteoric Line
Local Meteoric Water Line
Evaporation Line
-200
-180
-160
-140
-120
-100
-80
-60
-40
-20
0
-20 -16 -12 -8 -4 018O
2 H
SRE-Tailing pond water SPF-Seepage water of Tailing pondGWB-Observation well of Tailing pond GWB-Tuul River basinGWD-Hangal River basin GWS-near ErdenetGWS-Tuul River basin GWS-near UlaantolgoiLinear (GMWL) Linear (LMWL)Linear (Evaporation line)
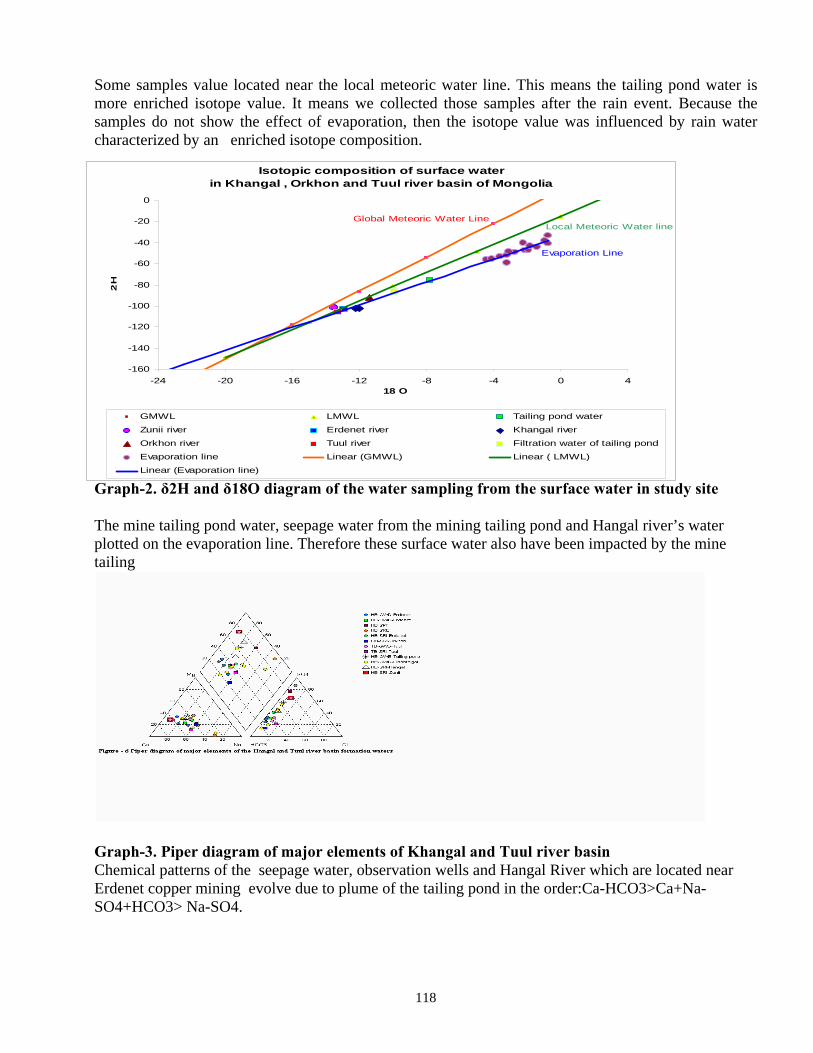
118
Some samples value located near the local meteoric water line. This means the tailing pond water is more enriched isotope value. It means we collected those samples after the rain event. Because the samples do not show the effect of evaporation, then the isotope value was influenced by rain water characterized by an enriched isotope composition. Graph-2. δ2H and δ18O diagram of the water sampling from the surface water in study site The mine tailing pond water, seepage water from the mining tailing pond and Hangal river’s water plotted on the evaporation line. Therefore these surface water also have been impacted by the mine tailing
Graph-3. Piper diagram of major elements of Khangal and Tuul river basin Chemical patterns of the seepage water, observation wells and Hangal River which are located near Erdenet copper mining evolve due to plume of the tailing pond in the order:Ca-HCO3>Ca+Na-SO4+HCO3> Na-SO4.
Isotopic composition of surface water in Khangal , Orkhon and Tuul river basin of Mongolia
Global Meteoric Water LineLocal Meteoric Water line
Evaporation Line
-160
-140
-120
-100
-80
-60
-40
-20
0
-24 -20 -16 -12 -8 -4 0 418 O
2 H
GMWL LMWL Tailing pond water
Zunii river Erdenet river Khangal river
Orkhon river Tuul river Filtration water of tailing pond
Evaporation line Linear (GMWL) Linear ( LMWL)
Linear (Evaporation line)
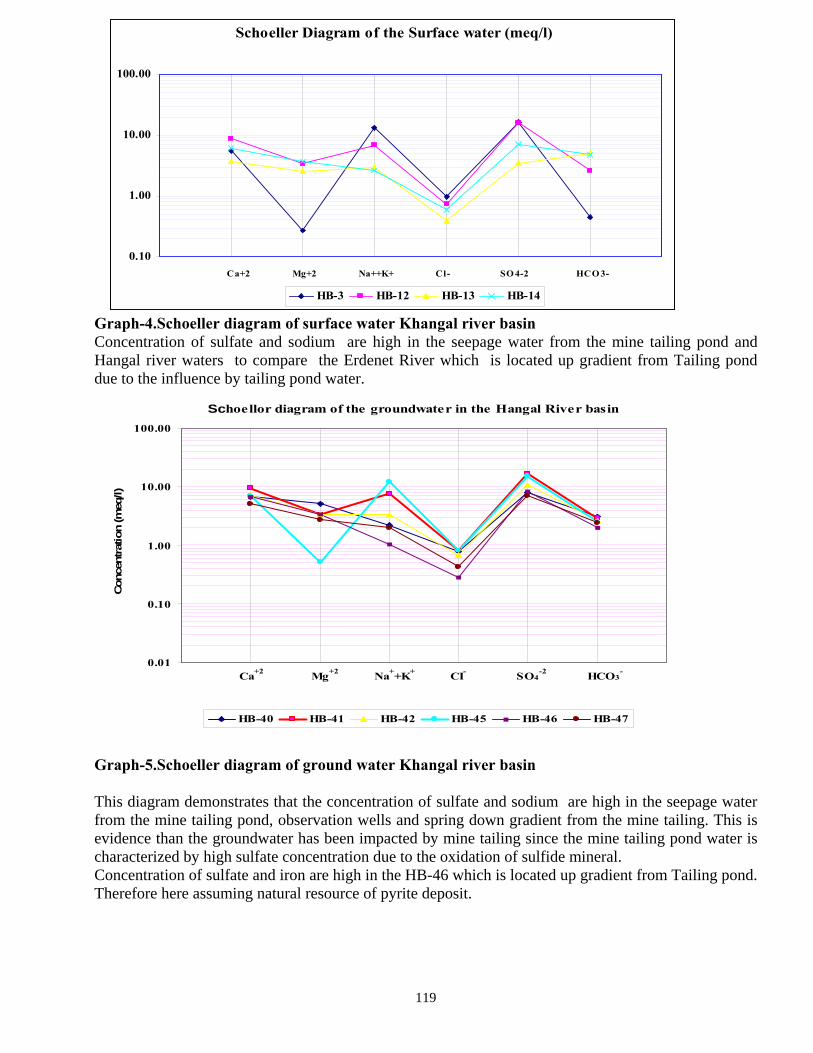
119
Graph-4.Schoeller diagram of surface water Khangal river basin Concentration of sulfate and sodium are high in the seepage water from the mine tailing pond and Hangal river waters to compare the Erdenet River which is located up gradient from Tailing pond due to the influence by tailing pond water.
Graph-5.Schoeller diagram of ground water Khangal river basin This diagram demonstrates that the concentration of sulfate and sodium are high in the seepage water from the mine tailing pond, observation wells and spring down gradient from the mine tailing. This is evidence than the groundwater has been impacted by mine tailing since the mine tailing pond water is characterized by high sulfate concentration due to the oxidation of sulfide mineral. Concentration of sulfate and iron are high in the HB-46 which is located up gradient from Tailing pond. Therefore here assuming natural resource of pyrite deposit.
Schoellor diagram of the groundwater in the Hangal River basin
0.01
0.10
1.00
10.00
100.00
Ca+2 Mg+2 Na++K+ CI- SO4-2 HCO3
-
Conce
ntrat
ion (m
eq/l)
HB-40 HB-41 HB-42 HB-45 HB-46 HB-47
Schoeller Diagram of the Surface water (meq/l)
0.10
1.00
10.00
100.00
Ca+2 Mg+2 Na++K+ Cl- SO 4-2 HCO 3-
HB-3 HB-12 HB-13 HB-14

120
Graph-6.Altitude effect in Khangal river basin As can be seen from diagram 18O isotope of springs is depleted in the higher altitude and is enriched in the lower altitude. In fact, d18O of springs move from high altitude to low altitude. Therefore isotope is enriched in the low altitude. Note: The correlation between d18O and temperature provides a useful tool to identify the recharge altitude of groundwater, given that air temperatures are cooler at higher elevation. Tropo spherical temperatures decrease by about 0.6° per 100-m rise in altitude. Precipitation should then experience a depletion in 18O of about 0.4‰ per 100 m rise in altitude
Graph-7. Tritium in Khangal river basin This diagram shows that tritium data of the surface water is higher than groundwater. Because snow melting and rain water with high tritium value contributed into surface water. Therefore surface water is included higher tritium value and recent water. Groundwater is included lower tritium value and older to compare the surface water. Also tritium value is high in the mine tailing pond water and seepage water. It is contributed by precipitation with enriched tritium value.
Tritium of Surface Water and Groundwater in the Khangal River and Tuul River Basins (2005)
0
5
10
15
20
25
30
35
40
GWD SRI GWB SPF SRE
Tritiu
m (T
U)
Altitude Isotope Effect in Hangal River Basin Water
950
1050
1150
1250
1350
1450
-16 -15 -14 -13 -12
18O (VSMOW)
Alti
tude
(m)
HB (Springs)
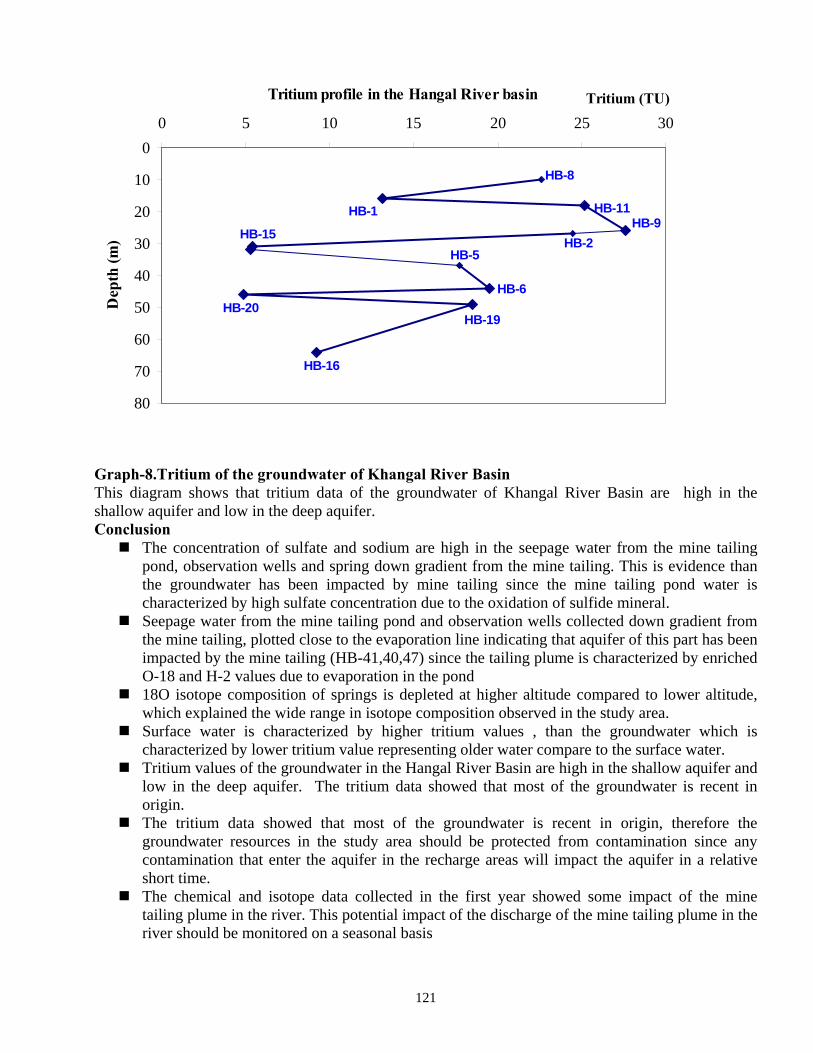
121
Graph-8.Tritium of the groundwater of Khangal River Basin This diagram shows that tritium data of the groundwater of Khangal River Basin are high in the shallow aquifer and low in the deep aquifer. Conclusion
The concentration of sulfate and sodium are high in the seepage water from the mine tailing pond, observation wells and spring down gradient from the mine tailing. This is evidence than the groundwater has been impacted by mine tailing since the mine tailing pond water is characterized by high sulfate concentration due to the oxidation of sulfide mineral.
Seepage water from the mine tailing pond and observation wells collected down gradient from the mine tailing, plotted close to the evaporation line indicating that aquifer of this part has been impacted by the mine tailing (HB-41,40,47) since the tailing plume is characterized by enriched O-18 and H-2 values due to evaporation in the pond
18O isotope composition of springs is depleted at higher altitude compared to lower altitude, which explained the wide range in isotope composition observed in the study area.
Surface water is characterized by higher tritium values , than the groundwater which is characterized by lower tritium value representing older water compare to the surface water.
Tritium values of the groundwater in the Hangal River Basin are high in the shallow aquifer and low in the deep aquifer. The tritium data showed that most of the groundwater is recent in origin.
The tritium data showed that most of the groundwater is recent in origin, therefore the groundwater resources in the study area should be protected from contamination since any contamination that enter the aquifer in the recharge areas will impact the aquifer in a relative short time.
The chemical and isotope data collected in the first year showed some impact of the mine tailing plume in the river. This potential impact of the discharge of the mine tailing plume in the river should be monitored on a seasonal basis
Tritium profile in the Hangal River basin
HB-16
HB-19
HB-6HB-20
HB-8
HB-9HB-11
HB-2
HB-1
HB-15
HB-5
0
10
20
30
40
50
60
70
80
0 5 10 15 20 25 30
Tritium (TU)D
epth
(m)
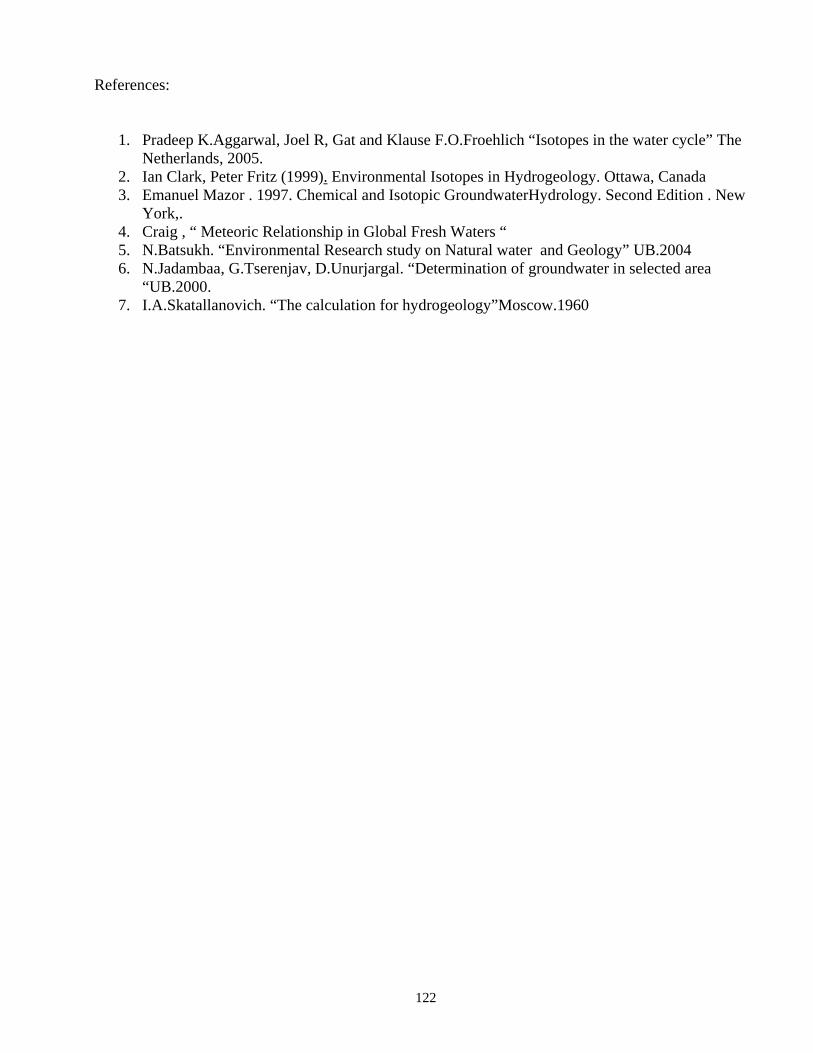
122
References:
1. Pradeep K.Aggarwal, Joel R, Gat and Klause F.O.Froehlich “Isotopes in the water cycle” The Netherlands, 2005.
2. Ian Clark, Peter Fritz (1999). Environmental Isotopes in Hydrogeology. Ottawa, Canada 3. Emanuel Mazor . 1997. Chemical and Isotopic GroundwaterHydrology. Second Edition . New
York,. 4. Craig , “ Meteoric Relationship in Global Fresh Waters “ 5. N.Batsukh. “Environmental Research study on Natural water and Geology” UB.2004 6. N.Jadambaa, G.Tserenjav, D.Unurjargal. “Determination of groundwater in selected area
“UB.2000. 7. I.A.Skatallanovich. “The calculation for hydrogeology”Moscow.1960
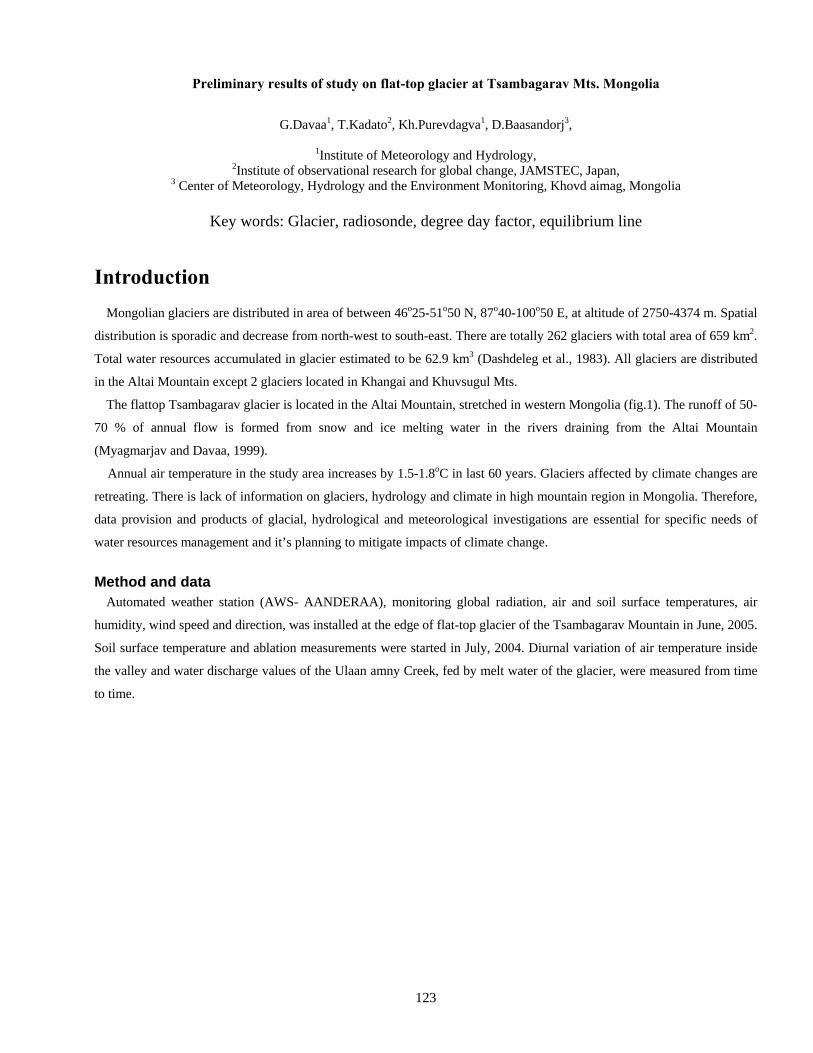
123
Preliminary results of study on flat-top glacier at Tsambagarav Mts. Mongolia
G.Davaa1, T.Kadato2, Kh.Purevdagva1, D.Baasandorj3,
1Institute of Meteorology and Hydrology, 2Institute of observational research for global change, JAMSTEC, Japan,
3 Center of Meteorology, Hydrology and the Environment Monitoring, Khovd aimag, Mongolia
Key words: Glacier, radiosonde, degree day factor, equilibrium line
Introduction Mongolian glaciers are distributed in area of between 46o25-51o50 N, 87o40-100o50 E, at altitude of 2750-4374 m. Spatial
distribution is sporadic and decrease from north-west to south-east. There are totally 262 glaciers with total area of 659 km2.
Total water resources accumulated in glacier estimated to be 62.9 km3 (Dashdeleg et al., 1983). All glaciers are distributed
in the Altai Mountain except 2 glaciers located in Khangai and Khuvsugul Mts.
The flattop Tsambagarav glacier is located in the Altai Mountain, stretched in western Mongolia (fig.1). The runoff of 50-
70 % of annual flow is formed from snow and ice melting water in the rivers draining from the Altai Mountain
(Myagmarjav and Davaa, 1999).
Annual air temperature in the study area increases by 1.5-1.8oC in last 60 years. Glaciers affected by climate changes are
retreating. There is lack of information on glaciers, hydrology and climate in high mountain region in Mongolia. Therefore,
data provision and products of glacial, hydrological and meteorological investigations are essential for specific needs of
water resources management and it’s planning to mitigate impacts of climate change.
Method and data Automated weather station (AWS- AANDERAA), monitoring global radiation, air and soil surface temperatures, air
humidity, wind speed and direction, was installed at the edge of flat-top glacier of the Tsambagarav Mountain in June, 2005.
Soil surface temperature and ablation measurements were started in July, 2004. Diurnal variation of air temperature inside
the valley and water discharge values of the Ulaan amny Creek, fed by melt water of the glacier, were measured from time
to time.
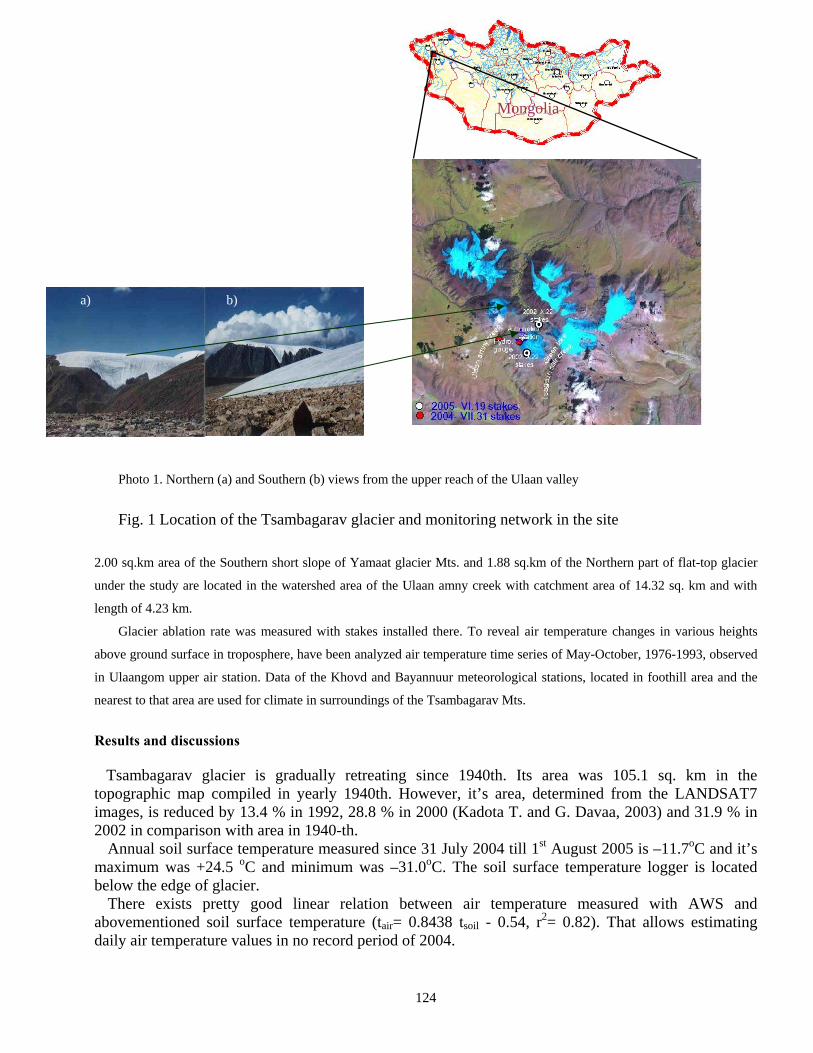
124
Photo 1. Northern (a) and Southern (b) views from the upper reach of the Ulaan valley
Fig. 1 Location of the Tsambagarav glacier and monitoring network in the site
2.00 sq.km area of the Southern short slope of Yamaat glacier Mts. and 1.88 sq.km of the Northern part of flat-top glacier
under the study are located in the watershed area of the Ulaan amny creek with catchment area of 14.32 sq. km and with
length of 4.23 km.
Glacier ablation rate was measured with stakes installed there. To reveal air temperature changes in various heights
above ground surface in troposphere, have been analyzed air temperature time series of May-October, 1976-1993, observed
in Ulaangom upper air station. Data of the Khovd and Bayannuur meteorological stations, located in foothill area and the
nearest to that area are used for climate in surroundings of the Tsambagarav Mts.
Results and discussions
Tsambagarav glacier is gradually retreating since 1940th. Its area was 105.1 sq. km in the topographic map compiled in yearly 1940th. However, it’s area, determined from the LANDSAT7 images, is reduced by 13.4 % in 1992, 28.8 % in 2000 (Kadota T. and G. Davaa, 2003) and 31.9 % in 2002 in comparison with area in 1940-th.
Annual soil surface temperature measured since 31 July 2004 till 1st August 2005 is –11.7oC and it’s maximum was +24.5 oC and minimum was –31.0oC. The soil surface temperature logger is located below the edge of glacier.
There exists pretty good linear relation between air temperature measured with AWS and abovementioned soil surface temperature (tair= 0.8438 tsoil - 0.54, r2= 0.82). That allows estimating daily air temperature values in no record period of 2004.
Mongolia
b) a)
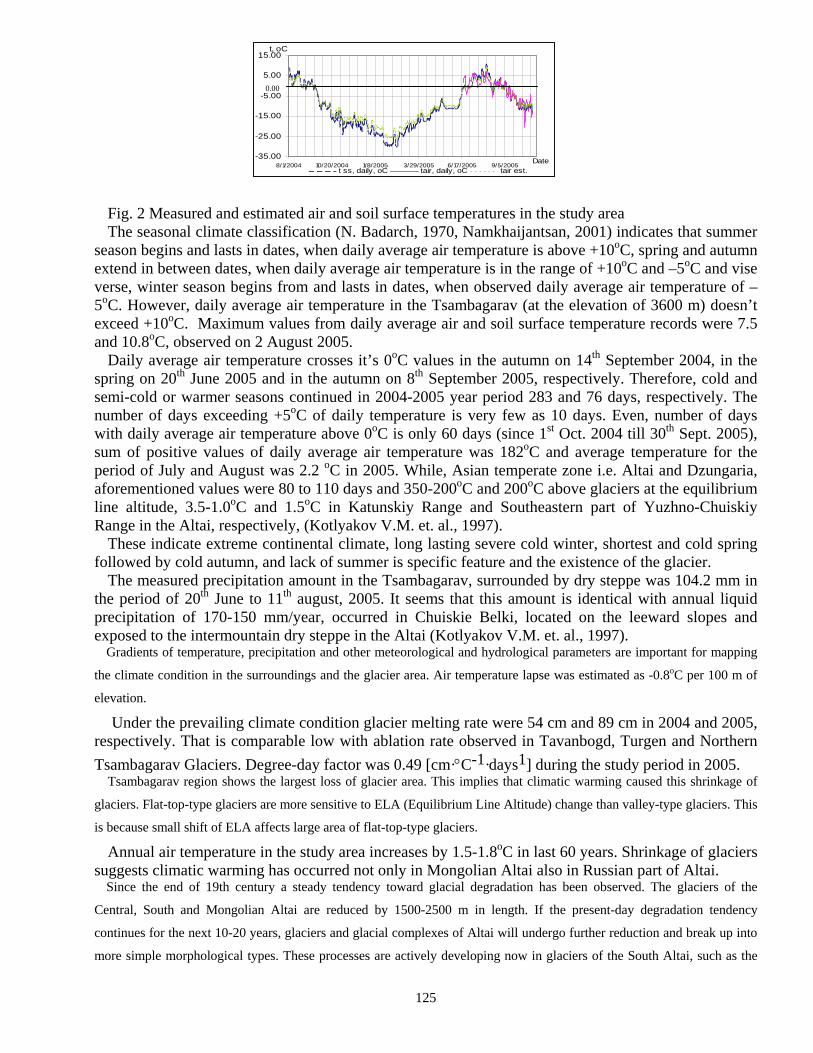
125
Fig. 2 Measured and estimated air and soil surface temperatures in the study area The seasonal climate classification (N. Badarch, 1970, Namkhaijantsan, 2001) indicates that summer
season begins and lasts in dates, when daily average air temperature is above +10oC, spring and autumn extend in between dates, when daily average air temperature is in the range of +10oC and –5oC and vise verse, winter season begins from and lasts in dates, when observed daily average air temperature of –5oC. However, daily average air temperature in the Tsambagarav (at the elevation of 3600 m) doesn’t exceed +10oC. Maximum values from daily average air and soil surface temperature records were 7.5 and 10.8oC, observed on 2 August 2005.
Daily average air temperature crosses it’s 0oC values in the autumn on 14th September 2004, in the spring on 20th June 2005 and in the autumn on 8th September 2005, respectively. Therefore, cold and semi-cold or warmer seasons continued in 2004-2005 year period 283 and 76 days, respectively. The number of days exceeding +5oC of daily temperature is very few as 10 days. Even, number of days with daily average air temperature above 0oC is only 60 days (since 1st Oct. 2004 till 30th Sept. 2005), sum of positive values of daily average air temperature was 182oC and average temperature for the period of July and August was 2.2 oC in 2005. While, Asian temperate zone i.e. Altai and Dzungaria, aforementioned values were 80 to 110 days and 350-200oC and 200oC above glaciers at the equilibrium line altitude, 3.5-1.0oC and 1.5oC in Katunskiy Range and Southeastern part of Yuzhno-Chuiskiy Range in the Altai, respectively, (Kotlyakov V.M. et. al., 1997).
These indicate extreme continental climate, long lasting severe cold winter, shortest and cold spring followed by cold autumn, and lack of summer is specific feature and the existence of the glacier.
The measured precipitation amount in the Tsambagarav, surrounded by dry steppe was 104.2 mm in the period of 20th June to 11th august, 2005. It seems that this amount is identical with annual liquid precipitation of 170-150 mm/year, occurred in Chuiskie Belki, located on the leeward slopes and exposed to the intermountain dry steppe in the Altai (Kotlyakov V.M. et. al., 1997).
Gradients of temperature, precipitation and other meteorological and hydrological parameters are important for mapping
the climate condition in the surroundings and the glacier area. Air temperature lapse was estimated as -0.8oC per 100 m of
elevation.
Under the prevailing climate condition glacier melting rate were 54 cm and 89 cm in 2004 and 2005, respectively. That is comparable low with ablation rate observed in Tavanbogd, Turgen and Northern
Tsambagarav Glaciers. Degree-day factor was 0.49 [cm·°C-1·days1] during the study period in 2005. Tsambagarav region shows the largest loss of glacier area. This implies that climatic warming caused this shrinkage of
glaciers. Flat-top-type glaciers are more sensitive to ELA (Equilibrium Line Altitude) change than valley-type glaciers. This
is because small shift of ELA affects large area of flat-top-type glaciers.
Annual air temperature in the study area increases by 1.5-1.8oC in last 60 years. Shrinkage of glaciers suggests climatic warming has occurred not only in Mongolian Altai also in Russian part of Altai.
Since the end of 19th century a steady tendency toward glacial degradation has been observed. The glaciers of the
Central, South and Mongolian Altai are reduced by 1500-2500 m in length. If the present-day degradation tendency
continues for the next 10-20 years, glaciers and glacial complexes of Altai will undergo further reduction and break up into
more simple morphological types. These processes are actively developing now in glaciers of the South Altai, such as the
-35.00
-25.00
-15.00
-5.00
5.00
15.00
8/1/2004 10/20/2004 1/8/2005 3/29/2005 6/17/2005 9/5/2005Date
t, oC
t ss, daily, oC tair, daily, oC tair est.
0.00
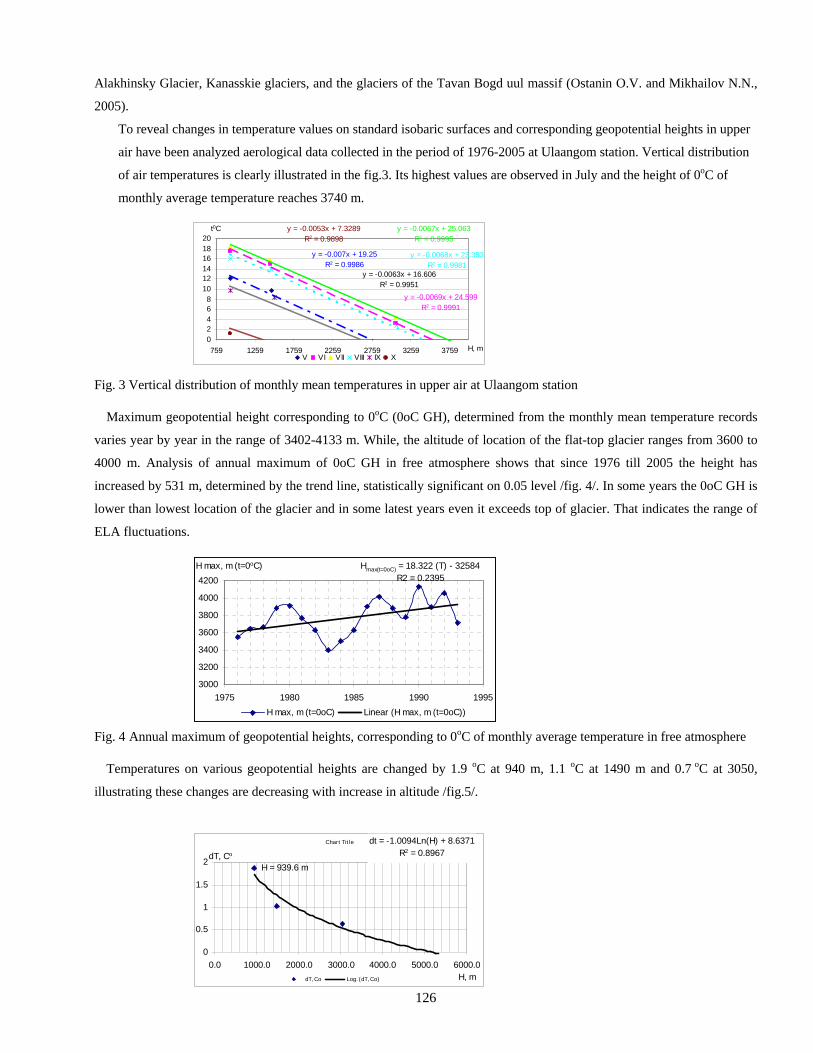
126
Alakhinsky Glacier, Kanasskie glaciers, and the glaciers of the Tavan Bogd uul massif (Ostanin O.V. and Mikhailov N.N.,
2005).
To reveal changes in temperature values on standard isobaric surfaces and corresponding geopotential heights in upper
air have been analyzed aerological data collected in the period of 1976-2005 at Ulaangom station. Vertical distribution
of air temperatures is clearly illustrated in the fig.3. Its highest values are observed in July and the height of 0oC of
monthly average temperature reaches 3740 m.
Fig. 3 Vertical distribution of monthly mean temperatures in upper air at Ulaangom station
Maximum geopotential height corresponding to 0oC (0oC GH), determined from the monthly mean temperature records
varies year by year in the range of 3402-4133 m. While, the altitude of location of the flat-top glacier ranges from 3600 to
4000 m. Analysis of annual maximum of 0oC GH in free atmosphere shows that since 1976 till 2005 the height has
increased by 531 m, determined by the trend line, statistically significant on 0.05 level /fig. 4/. In some years the 0oC GH is
lower than lowest location of the glacier and in some latest years even it exceeds top of glacier. That indicates the range of
ELA fluctuations.
Fig. 4 Annual maximum of geopotential heights, corresponding to 0oC of monthly average temperature in free atmosphere
Temperatures on various geopotential heights are changed by 1.9 oC at 940 m, 1.1 oC at 1490 m and 0.7 oC at 3050,
illustrating these changes are decreasing with increase in altitude /fig.5/.
H max, m (t=0oC) Hmax(t=0oC) = 18.322 (T) - 32584R2 = 0.2395
3000
3200
3400
3600
3800
4000
4200
1975 1980 1985 1990 1995
H max, m (t=0oC) Linear (H max, m (t=0oC))
Chart Tit le
H = 939.6 m
dt = -1.0094Ln(H) + 8.6371R2 = 0.8967
0
0.5
1
1.5
2
0.0 1000.0 2000.0 3000.0 4000.0 5000.0 6000.0H, m
dT, Co
dT, Co Log. (dT, Co)
y = -0.0067x + 25.063R2 = 0.9995
y = -0.0068x + 23.353R2 = 0.9981
y = -0.007x + 19.25R2 = 0.9986
y = -0.0053x + 7.3289R2 = 0.9898
y = -0.0069x + 24.599R2 = 0.9991
y = -0.0063x + 16.606R2 = 0.9951
02468
101214161820
759 1259 1759 2259 2759 3259 3759 H, m
t0C
V VI VII VIII IX X
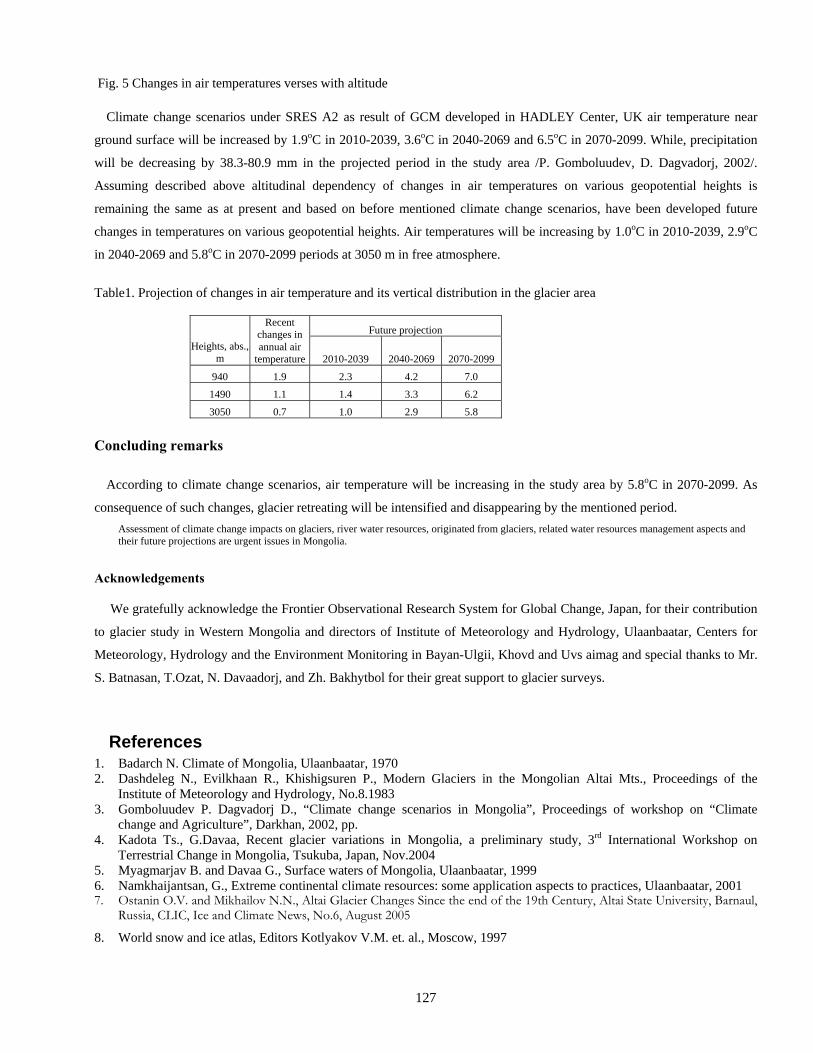
127
Fig. 5 Changes in air temperatures verses with altitude
Climate change scenarios under SRES A2 as result of GCM developed in HADLEY Center, UK air temperature near
ground surface will be increased by 1.9oC in 2010-2039, 3.6oC in 2040-2069 and 6.5oC in 2070-2099. While, precipitation
will be decreasing by 38.3-80.9 mm in the projected period in the study area /P. Gomboluudev, D. Dagvadorj, 2002/.
Assuming described above altitudinal dependency of changes in air temperatures on various geopotential heights is
remaining the same as at present and based on before mentioned climate change scenarios, have been developed future
changes in temperatures on various geopotential heights. Air temperatures will be increasing by 1.0oC in 2010-2039, 2.9oC
in 2040-2069 and 5.8oC in 2070-2099 periods at 3050 m in free atmosphere.
Table1. Projection of changes in air temperature and its vertical distribution in the glacier area
Future projection
Heights, abs., m
Recent changes in annual air
temperature 2010-2039 2040-2069 2070-2099
940 1.9 2.3 4.2 7.0
1490 1.1 1.4 3.3 6.2
3050 0.7 1.0 2.9 5.8
Concluding remarks
According to climate change scenarios, air temperature will be increasing in the study area by 5.8oC in 2070-2099. As
consequence of such changes, glacier retreating will be intensified and disappearing by the mentioned period.
Assessment of climate change impacts on glaciers, river water resources, originated from glaciers, related water resources management aspects and their future projections are urgent issues in Mongolia.
Acknowledgements
We gratefully acknowledge the Frontier Observational Research System for Global Change, Japan, for their contribution
to glacier study in Western Mongolia and directors of Institute of Meteorology and Hydrology, Ulaanbaatar, Centers for
Meteorology, Hydrology and the Environment Monitoring in Bayan-Ulgii, Khovd and Uvs aimag and special thanks to Mr.
S. Batnasan, T.Ozat, N. Davaadorj, and Zh. Bakhytbol for their great support to glacier surveys.
References 1. Badarch N. Climate of Mongolia, Ulaanbaatar, 1970 2. Dashdeleg N., Evilkhaan R., Khishigsuren P., Modern Glaciers in the Mongolian Altai Mts., Proceedings of the
Institute of Meteorology and Hydrology, No.8.1983 3. Gomboluudev P. Dagvadorj D., “Climate change scenarios in Mongolia”, Proceedings of workshop on “Climate
change and Agriculture”, Darkhan, 2002, pp. 4. Kadota Ts., G.Davaa, Recent glacier variations in Mongolia, a preliminary study, 3rd International Workshop on
Terrestrial Change in Mongolia, Tsukuba, Japan, Nov.2004 5. Myagmarjav B. and Davaa G., Surface waters of Mongolia, Ulaanbaatar, 1999 6. Namkhaijantsan, G., Extreme continental climate resources: some application aspects to practices, Ulaanbaatar, 2001 7. Ostanin O.V. and Mikhailov N.N., Altai Glacier Changes Since the end of the 19th Century, Altai State University, Barnaul,
Russia, CLIC, Ice and Climate News, No.6, August 2005
8. World snow and ice atlas, Editors Kotlyakov V.M. et. al., Moscow, 1997
128
Technology of Water transmission pipeline on long distance and its application for Gobi and steppe regions of Mongolia
BASANDORJ Davaa (PhD, Mongolian University of Science & Technology)
DALAI Jamiyan (Consulting Engineer of Mongolia, Water Center) GANZORIG Sharav (Consulting engineer of Mongolia, Prestige Group)
1. General
The potential of annually water resources of Mongolia is 34.6 km3 of which 6.1 km3 are ground water resources. While the northern part of the country
has sufficient water resources, the steppe and Gobi regions, which together represent 69 percent of the country’s total land area, lack a surface water
network and the demand for water in those areas is mostly supplied from ground water. In addition, as these regions are part of continental saline zones, a
high percentage of minerals and hard content in the water makes it less suitable for consumption. The South and Southeastern Gobi Regions are also a
focus of serious interest in the development of mining prospects that could provide much needed economic boost for the region and the country if they are
developed correctly. These projects will need large amounts of water, and there is concern that increasing extraction rates from the non-renewable
underground sources may cause irreversible environmental damage.
2. Background
Water is precious in Mongolia and in many parts of the country there are severe problems with the quantity and quality of water available. Public water
systems in Mongolia are typically based on wells, and in the South and Southeastern provinces (aimags) these well systems are drawing water from deep
aquifers containing old water that is not replenished from precipitation. Water from these wells is typically high in minerals and hardness, and there are
links between the poor water quality and health problems in the region.
Most of the water supply infrastructure of Mongolia was constructed during the 1970’s and 80’s, at a time when the economics of operation, maintenance
and expansion of public utilities was of little concern. Many water systems that were constructed to support agriculture and other small-scale economic
activities are in disrepair and there is no feasible way to rebuild and operate these systems without subsidies.
Today water utilities in Mongolia are faced with the realities of a “Market Economy”, and must try to support themselves from an economically
disadvantaged customer base. While there are some donor-funded programs for some of the major cities, there are still many small water systems that are
in need of improvement. Many of the improvements needed are due to depletion of the deep aquifers that causes wells to fail and water quality to decrease
to below legal standards. Finding new deep sources, drilling deep wells, and installing new pumps and pipelines are expensive and difficult to financially
justify.
Additionally, Mongolia’s electric power infrastructure dates prior to Market Economy, with one central, coal-fired power plant located in Ulaanbaatar
generating most of the supply for the country. Additional power is purchased from Russia at a high cost, sometimes with intermittent delivery. Mongolia
needs to increase the generating capacity and reliability it’s power infrastructure in a ways that are environmentally responsible and economically
sustainable.
The “Herlen-Gobi” and “Orhon-Gobi” Projects will address all of the above problems on a regional scale, based on the premise that the only way to solve
these problems is to develop an alternative to underground water sources.
3. Water Resource estimation of Project area
The projects will cover the southwest portion of Hentii aimag, southeast portion of Tov aimag, south and west portion of Dornogobi aimag, and the
eastern portion of both Omnogobi and Dundgobi aimags of Mongolia.
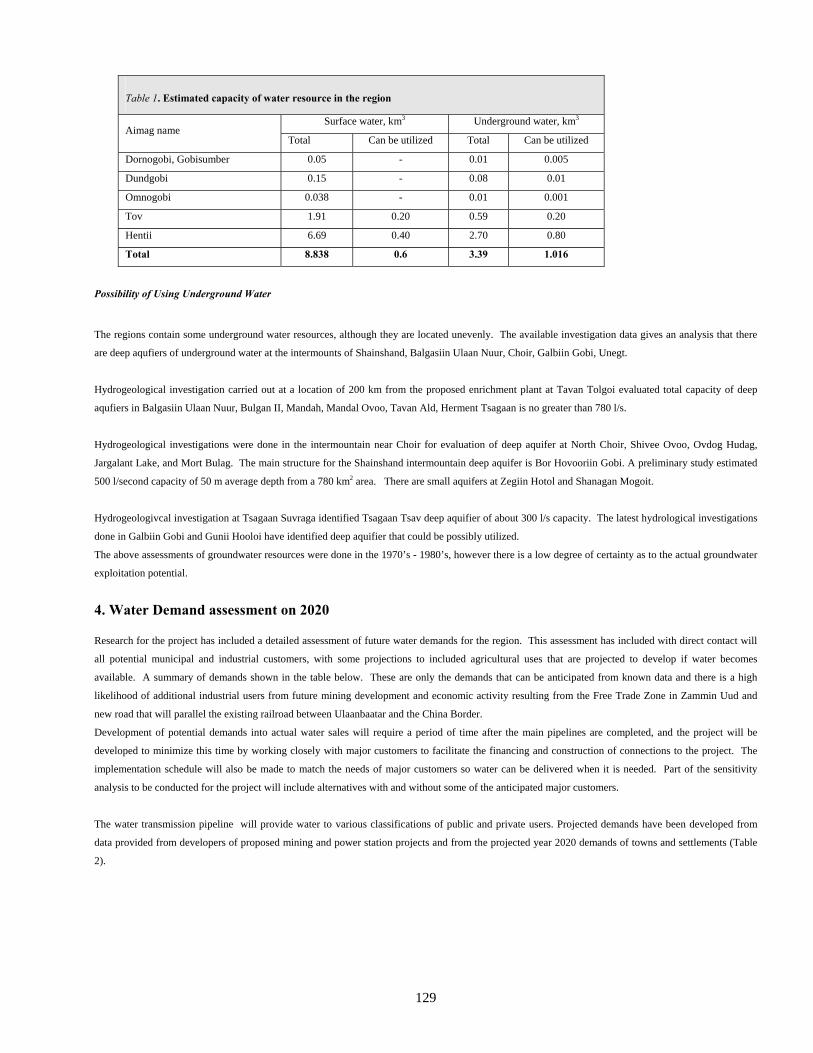
129
Possibility of Using Underground Water
The regions contain some underground water resources, although they are located unevenly. The available investigation data gives an analysis that there
are deep aqufiers of underground water at the intermounts of Shainshand, Balgasiin Ulaan Nuur, Choir, Galbiin Gobi, Unegt.
Hydrogeological investigation carried out at a location of 200 km from the proposed enrichment plant at Tavan Tolgoi evaluated total capacity of deep
aqufiers in Balgasiin Ulaan Nuur, Bulgan II, Mandah, Mandal Ovoo, Tavan Ald, Herment Tsagaan is no greater than 780 l/s.
Hydrogeological investigations were done in the intermountain near Choir for evaluation of deep aquifer at North Choir, Shivee Ovoo, Ovdog Hudag,
Jargalant Lake, and Mort Bulag. The main structure for the Shainshand intermountain deep aquifer is Bor Hovooriin Gobi. A preliminary study estimated
500 l/second capacity of 50 m average depth from a 780 km2 area. There are small aquifers at Zegiin Hotol and Shanagan Mogoit.
Hydrogeologivcal investigation at Tsagaan Suvraga identified Tsagaan Tsav deep aquifier of about 300 l/s capacity. The latest hydrological investigations
done in Galbiin Gobi and Gunii Hooloi have identified deep aquifier that could be possibly utilized.
The above assessments of groundwater resources were done in the 1970’s - 1980’s, however there is a low degree of certainty as to the actual groundwater
exploitation potential.
4. Water Demand assessment on 2020
Research for the project has included a detailed assessment of future water demands for the region. This assessment has included with direct contact will
all potential municipal and industrial customers, with some projections to included agricultural uses that are projected to develop if water becomes
available. A summary of demands shown in the table below. These are only the demands that can be anticipated from known data and there is a high
likelihood of additional industrial users from future mining development and economic activity resulting from the Free Trade Zone in Zammin Uud and
new road that will parallel the existing railroad between Ulaanbaatar and the China Border.
Development of potential demands into actual water sales will require a period of time after the main pipelines are completed, and the project will be
developed to minimize this time by working closely with major customers to facilitate the financing and construction of connections to the project. The
implementation schedule will also be made to match the needs of major customers so water can be delivered when it is needed. Part of the sensitivity
analysis to be conducted for the project will include alternatives with and without some of the anticipated major customers.
The water transmission pipeline will provide water to various classifications of public and private users. Projected demands have been developed from
data provided from developers of proposed mining and power station projects and from the projected year 2020 demands of towns and settlements (Table
2).
Table 1. Estimated capacity of water resource in the region
Surface water, km3 Underground water, km3 Aimag name
Total Can be utilized Total Can be utilized
Dornogobi, Gobisumber 0.05 - 0.01 0.005
Dundgobi 0.15 - 0.08 0.01
Omnogobi 0.038 - 0.01 0.001
Tov 1.91 0.20 0.59 0.20
Hentii 6.69 0.40 2.70 0.80
Total 8.838 0.6 3.39 1.016
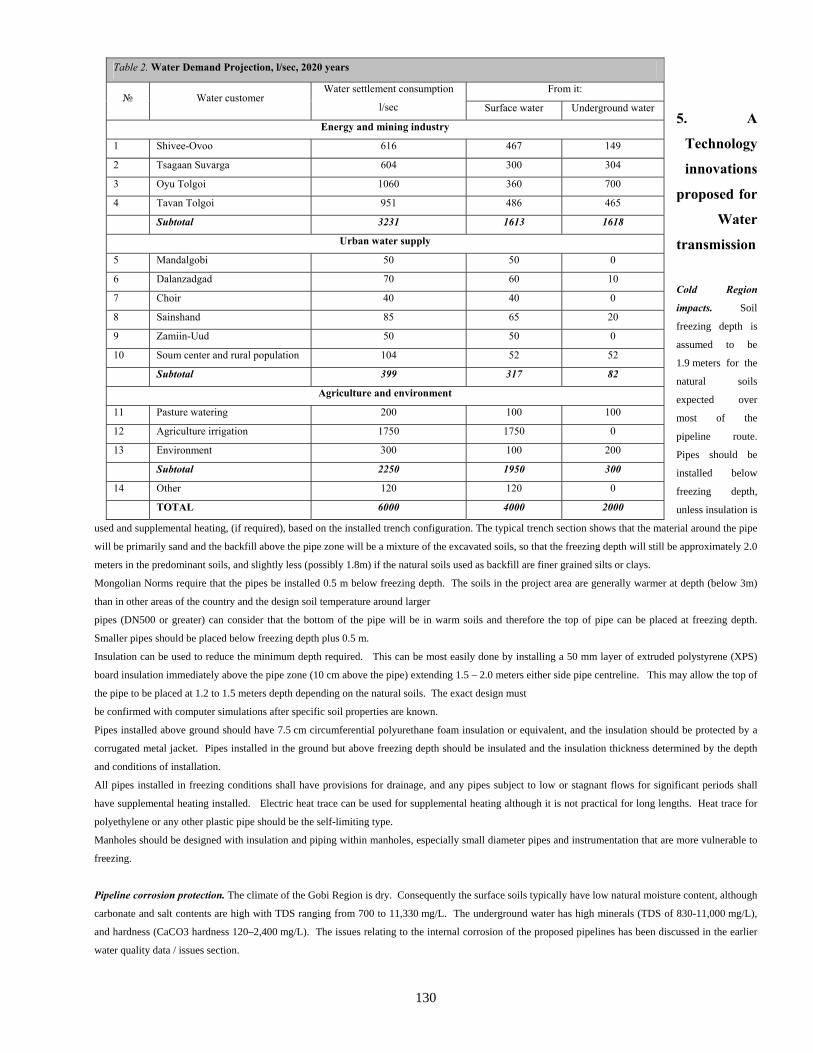
130
5. A
Technology
innovations
proposed for
Water
transmission
Cold Region
impacts. Soil
freezing depth is
assumed to be
1.9 meters for the
natural soils
expected over
most of the
pipeline route.
Pipes should be
installed below
freezing depth,
unless insulation is
used and supplemental heating, (if required), based on the installed trench configuration. The typical trench section shows that the material around the pipe
will be primarily sand and the backfill above the pipe zone will be a mixture of the excavated soils, so that the freezing depth will still be approximately 2.0
meters in the predominant soils, and slightly less (possibly 1.8m) if the natural soils used as backfill are finer grained silts or clays.
Mongolian Norms require that the pipes be installed 0.5 m below freezing depth. The soils in the project area are generally warmer at depth (below 3m)
than in other areas of the country and the design soil temperature around larger
pipes (DN500 or greater) can consider that the bottom of the pipe will be in warm soils and therefore the top of pipe can be placed at freezing depth.
Smaller pipes should be placed below freezing depth plus 0.5 m.
Insulation can be used to reduce the minimum depth required. This can be most easily done by installing a 50 mm layer of extruded polystyrene (XPS)
board insulation immediately above the pipe zone (10 cm above the pipe) extending 1.5 – 2.0 meters either side pipe centreline. This may allow the top of
the pipe to be placed at 1.2 to 1.5 meters depth depending on the natural soils. The exact design must
be confirmed with computer simulations after specific soil properties are known.
Pipes installed above ground should have 7.5 cm circumferential polyurethane foam insulation or equivalent, and the insulation should be protected by a
corrugated metal jacket. Pipes installed in the ground but above freezing depth should be insulated and the insulation thickness determined by the depth
and conditions of installation.
All pipes installed in freezing conditions shall have provisions for drainage, and any pipes subject to low or stagnant flows for significant periods shall
have supplemental heating installed. Electric heat trace can be used for supplemental heating although it is not practical for long lengths. Heat trace for
polyethylene or any other plastic pipe should be the self-limiting type.
Manholes should be designed with insulation and piping within manholes, especially small diameter pipes and instrumentation that are more vulnerable to
freezing.
Pipeline corrosion protection. The climate of the Gobi Region is dry. Consequently the surface soils typically have low natural moisture content, although
carbonate and salt contents are high with TDS ranging from 700 to 11,330 mg/L. The underground water has high minerals (TDS of 830-11,000 mg/L),
and hardness (CaCO3 hardness 120–2,400 mg/L). The issues relating to the internal corrosion of the proposed pipelines has been discussed in the earlier
water quality data / issues section.
Table 2. Water Demand Projection, l/sec, 2020 years
From it: № Water customer
Water settlement consumption
l/sec Surface water Underground water
Energy and mining industry
1 Shivee-Ovoo 616 467 149
2 Tsagaan Suvarga 604 300 304
3 Oyu Tolgoi 1060 360 700
4 Tavan Tolgoi 951 486 465
Subtotal 3231 1613 1618
Urban water supply
5 Mandalgobi 50 50 0
6 Dalanzadgad 70 60 10
7 Choir 40 40 0
8 Sainshand 85 65 20
9 Zamiin-Uud 50 50 0
10 Soum center and rural population 104 52 52
Subtotal 399 317 82
Agriculture and environment
11 Pasture watering 200 100 100
12 Agriculture irrigation 1750 1750 0
13 Environment 300 100 200
Subtotal 2250 1950 300
14 Other 120 120 0
TOTAL 6000 4000 2000
131
Should be steel pipe be selected as the preferred material, corrosion protection for steel pipe is necessary if the concentration of calcium and magnesium
ions exceeds 6-9 mg per litre. Therefore both external and internal corrosion protection is critical for preserving the longevity of the water system
pipelines.
Selection of pipe material and appropriate corrosion protection should be based on detailed investigation of soil water and underground water, and cost
estimations made for protection alternatives.
Depending on corrosion characteristics of soil, external protection measures for the steel pipe must be identified. Common practice in Mongolia for basic
corrosion protection involves outside coating with a layer of bitumen of 3 mm thick and wrapping by one layer of synthetic film or brizol (ruberoid film
coated with bitumen). The strengthened protection involves coating by 2 layers of bitumen and 2 layer of wrapping by ruberoid containing brizol or
bitumen. There are other wrapping products used outside Mongolia that may be more effective and these should be compared with the local methods for
cost-effectiveness.
If there are areas of high moisture soils identified, then additional measures, such as cathodic protection, may be required and this should be evaluated as
part of detailed design.
Cement lining is common in the region however the susceptibility of cement to degradation or scale accumulation that will increase roughness and reduce
hydraulic capacity recommend against using it for this project. Internal fusion-bonded epoxy coating does not have these problems and therefore is
recommended for internal corrosion protection. A cold-applied epoxy product is recommended for internal patching after welding.
Internal fusion bonded epoxy coated piping would give good corrosion protection in the event that the issues with cement lined pipes cannot be resolved.
Alternatively if pressures can be kept to modest levels the scope for further use of HDPE or uPVC pipe is available.
Control System. Control and communication system should be manage control strategies of booster stations, pumps, valves and tanks within the water
distribution system based on water demand forecast. It shall be measure and collect the flow of water in each pipe, the pressure at each node, the level of
water in each tank. It shall be control constant and variable speed pumps, different types of valves like slide valves, pressure and flow rate control valves.
Below are some features of proposed Distributed Control System (DCS) and fibre optic loops:
• The DCS will have redundant communications provided, with two optical fibre loops linking each node. Each node will be linked by 100
Mbits/sec Ethernet network.
• All electronic transmitters (including valve positioners) will be specified to use HART protocol for remote access of diagnostics, re-ranging,
and local interface with a hand held communicator. The DCS will interface directly with HART transmitters.
• All process transmitters will have an integral meter for local, visual indication.
• All electrical relays shall be SMART / Intelligent type with Profibus DP interface to the DCS. All electrical control cubicles shall communicate
to the DCS via Profibus DP.
• Variable frequency drives will also be linked via their serial communications ports to DCS for control and monitoring by the DCS.
• VFD’s controllers will be connected by Profibus DP.
The back up water control centre will be provided by mobile operators being able to use a laptop interface anywhere on the optical Ethernet network to
access, monitor or control equipment. All access will use security passwords to allow for different levels of operator functions.
Advanced technology for water reservoirs. Preliminary calculations show that the water reservoir will accumulate approximately 1 meter of ice during a
winter season, based on the monthly average temperature data in the Knight-Piesold Report. Analysis of the weather date from the OT site shows that
there are slightly fewer freezing degree days then reported in Knight-Peisold (1232 өC-days vs 1314 and 1330 өC-days), but the difference in calculated
ice thickness is minimal. This may be slightly overstated, as the calculations do not included solar radiation, which is relatively high. A covered reservoir
will trap solar radiation and the accumulated ice thickness will be substantially less than for an uncovered pond.
Design of the pond should included allowance for ice depth, and the rise and fall of the ice as the water level in the pond changes should not damage the
pond lining. Ice movement due to winds should also be considered. Water supply and outlet piping should be installed below anticipated freezing depth –
132
meaning through the sidewall rather than over it as is usually done – unless there is some supplemental heating. In general, the pond should be as deep as
possible to minimize heat loss.
6. Herlen-Gobi project
Project Description. The objective of the Herlen-Gobi Project is to divert water from the Herlen River and supply it to the Southeastern Gobi regions by
means of a pipeline network. This would require that a dam and intake structure be constructed at Togos Ovo, which is approximately 125 km southeast of
Ulaanbaatar. Then pipelines, pump stations, and supporting facilities would be constructed to bring water south. The pipelines would branch near
Sainshand, with one branch continuing South west to Tsagaan Suvarga, and the other branch turning Southeast, generally following the road and railroad to
Zamin Uud on the China border.
The Herlen-Gobi Project is serve the needs of a number of problems for beneficiaries at various levels, in a way that is comprehensive, sustainable, and
environmentally responsible: The project will provide water of high quality for potable use, not only to major population centers, but also to small users
along the pipeline route.
Water will be made available for agricultural users including livestock raising and farming. There will be sufficient quantity of water to support mining
developments that will provide employment and needed revenue for Mongolia.
This will be done in a way that is financially self-sustaining. Because the project will supply water to various classes of users, it will be possible to have a
rate structure that will allow small users with limited incomes to benefit while the major users support the cost of construction and operations.
Basic Description of the Water Supply System. There are two main parts of the system; the Dam, Reservoir and Water Intake Structure for water
collection and storage, and the Pipeline, Pump Station, and Water Treatment system for transmission and distribution of water to customers.
Collection and Storage. The dam will be located at approximately 50 km downstream from the Herlen River Bridge on the Ondorhaan Highway near
Baganoor, in a wide valley with mountains on either side. The dam will be 2560 meters long and have a maximum height of 25.5 meters. It will be
constructed from rock and earth fill mined from the surrounding area, with an impervious core constructed of clay and/or concrete. There will be an
impervious barrier constructed under than dam to a depth of 7-20 meters to block seepage under the dam. The dam design will incorporate measures for
fish passage as required based on the results of the Environmental Assessment
The drainage and intake structure, which will be concrete construction, will include a 5000-kilowatt hydroelectric turbine that will generate electricity for
operation of the dam facilities and first pump station. There will be buildings constructed near for the power station, security and operations support, and
appropriate roads and fencing.
The reservoir impoundment is estimated to be approximately 500 million cubic meters, covering an area of 62 square kilometers. The reservoir will extend
approximately 30 kilometers upstream from the dam.
Transmission, Treatment, and Distribution. The piping system will begin at the dam and water will flow by gravity approximately 10 kilometers to the
first pump station. The initial pipe diameter is presently set at 1200 mm and the diameter will be reduced along the way as the water is delivered to
customers. The route of the pipeline, which will be finally determined in the Feasibility Study, will generally head south to town of Choir where one
branch will continue south and the other will head southeast generally following the road and railroad to the China border.
There will be 2 pump stations between the dam and Choir, 5 pump stations on the southern leg, and 3 pump stations on the southeastern leg. There are no
significant hills or mountains on either leg and the total pump station capacity is estimated to be 24.2 mW. The pump stations will be designed with
multiple pumps and redundancy so that the system can be operated at various flow rates with high tolerance for equipment failure.
While the pump stations will be located to use the existing electrical supply network, there are some pump stations that will require new electrical lines to
be installed, and others will be needed to increase the reliability of the existing network. Current planning is for approximately 112 kilometers of high
voltage power transmission lines to be constructed that will connect to the existing electric grid, with substations located at each pump station. The
Feasibility Study will investigate the use of wind or solar alternatives in suitable areas.
133
The pipelines are planned to be coated steel, installed below seasonal freezing depth. There is no known permafrost along the pipeline routes, and from the
available data the soils are of low corrosion potential. There are no river crossings or major highway crossings identified for the main transmission
pipelines.
Control valves will be installed at necessary locations and metering stations will be installed that are connected to a central operations control facility.
Current planning is to use radio telemetry to acquire data for system operations and to remotely control the pump stations from a single location for safety
and efficiency.
The water from the Herlen River will require minimal treatment before use. Disinfection with chlorine is typically used for water intended for human
consumption, although it is not necessary for industrial uses and undesirable for agricultural uses. If chlorination is used it will be done close to the
distribution points as required for human consumption. The full treatment requirements appropriate technology will be developed during the Feasibility
Study.
7. “Orkhon-Gobi” project
The objective of the “Orhon-Gobi” Project is to divert water from the Orhon River and supply it to the South Gobi regions through Bulgan, Tuv and
Dundgovi by means of a pipeline network. This would require that a dam and intake structure be constructed, at location approximately 300 km West of
Ulaanbaatar and 30 km Southwest of Bulgan city. Then pipelines, pump stations, and supporting facilities would be constructed to bring water as far South
as Tavan Tolgoi. The pipelines would supply water to users along the way and by three branches to Mandalgobi, Dalanzadgad, and Oyu Tolgoi.
The dam would also be constructed with a hydro-power generating station of 30-40mW capacity that would serve the Northern regions of Mongolia.
The “Orhon–Gobi” Project is serve the needs of a number of problems for beneficiaries at various levels, in a way that is comprehensive, sustainable, and
environmentally responsible:
The project will provide water of high quality for potable use, not only to major population centers, but also to small users along the pipeline route.
Water will be made available for agricultural users including livestock raising and farming.
There will be sufficient quantity of water to support mining developments that will provide employment and needed revenue for Mongolia.
Clean and reliable electric power will reduce dependence on foreign supplies and benefit the Mongolian economy.
This will be done in a way that is financially self-sustaining, with cost recovery from both water and power sales. Because the project will supply water to
various classes of users, it will be possible to have a rate structure that will allow small users with limited incomes to benefit while the major users support
the cost of construction and operations.
Orhon River Capacity. The Orhon River has been studied extensively in the past. There have been flow measurements taken nearly continuously since
1948, and there have been a number of previous studies done on the utilization of water from the Orhon River.
This information has been carefully studied in preparation of the “Orhon-Gobi” Project to date. The previous measurements show that the long-term
average yearly flow is 44.1 m3/sec or approximately 1.39 billion cubic meters per year. Based on the anticipated demands from the project of between 2.0
and 2.5 m3/sec, the project would take only between 4.5 and 5.6 percent of the average flow, which will leave sufficient water to sustain downstream users.
The height of the dam and volume of the reservoir have been determined to allow demands to be met under seasonal flow variations and to keep the water
intake ice-free during winter.
Basic Description of the System
There are two main parts of the system; the Dam, Reservoir and Water Intake Structure for water collection and storage, and the Pipeline, Pump Station,
and Water Treatment system for transmission and distribution of water to customers.
Collection and Storage. The dam will be located at approximately 25 km upstream from the “Orhon” observation station. The dam will be 800 meters long
and have a maximum height of 70 meters. It will be constructed from rock and earth fill mined from the surrounding area, with an impervious core
134
constructed of concrete. There will be an impervious barrier constructed under than dam to a depth of 10-15 meters to block seepage under the dam. The
dam design will incorporate measures for fish passage as required based on the results of the Environmental Assessment
The drainage and intake structure, which will be concrete construction, will include a 30-40 megawatt hydroelectric turbine that will generate electricity for
operation of the dam facilities and first pump station. The reservoir impoundment is estimated to be approximately 800 million cubic meters, covering an
area of 20 square kilometers. The reservoir will extend approximately 18 kilometers upstream from the dam.
Water Transmission and Distribution. The piping system will begin at the dam and water will pumped by the first pump station. The initial pipe diameter
is presently set at 1500 mm and the diameter will be reduced along the way as the water is delivered to customers. The route of the pipeline, which will be
finally determined in the Feasibility Study, will generally head south to the Tavan tolgoi 613 km, where three branches will continue to the Mandalgovi 96
km, Dalanzadgad 85 km and to the Oyu tolgoi 123 km.
Power Generation. A power plant with power generating turbines with a capacity of 30-40 megawatts will be installed near the dam. Transmission lines
will be constructed to connect to the existing 110 kilovolt system in the vicinity of the dam site.
Summary of Benefits. The Orhon-Gobi Project will bring positive benefit the people of Mongolia: Improved water supply for two cities and six soum
centers, affecting 50,000 people. Outlets at 50 locations for people and for animal watering – covering 100,000 hectares and capable of supporting 135,000
animals, providing opportunity for economic stability, settlement development, and transition from nomadic herder lifestyle.
Irrigation water to support 2000-3000 hectares for planting vegetables, animal feeding - improving the yield and quality of harvest.
Enhanced and sustainable water supply to support mining developments and energy - both important for Mongolia’s economic development. Water to
support greening projects such as planting trees that can reduce desertification and improve the Gobi ecology. Hydropower will bring clean, reliable
electricity supply that will contribute to making Mongolia energy self-sufficient and reduce foreign trade deficit. The Project will create recreational and
tourism opportunities, with associated economic benefits.
Conclusions.
The Herlen–Govi and Orhon-Gobi Projects will address multiple needs for Mongolia in a way that is sustainable in a market economy and sensitive to the
environment.