international builders show january 13, 2010 builders show january 13, ... •quarterly survey of...
TRANSCRIPT
55+ Economic & Market Forecast
International Builders Show
January 13, 2010
• Paul Emrath
• VP-Survey and Housing Policy Research

Outline
• NAHB 55+ HMI & other survey results
• Financing 55+ housing
• NAHB housing/house price forecast
• 55+ housing forecast

55+ Housing Market Index (HMI) Survey
• Quarterly survey of 55+ builders
• Patterned after survey for the NAHB/Wells Fargo HMI, successfully conducted since the mid-1980s
• Asks builders to rate markets as “good”, “fair” or “poor”
• Results used to create summary indexes
– Scale of 0 to 100
– 50 means “GOOD” = “POOR”
– Can includes special questions (e.g., on sales incentives )

NAHB 55+ HMI Survey:
New 55+ Single Family Home Sales
Source: 55+ Housing Market Index, 4th Qtr. 2010 and
Builders’ Economic Council (BEC) survey, Nov 2010, NAHB EcHp.
Note: Only numbers from the BEC survey (the last column) are seasonally adjusted
55+ HMI Survey Survey of
all SF
Builders
Dec 2010
2009 2010
Q4 Q1 Q2 Q3 Q4 (P)
55+ Single-Family HMI 17 19 12 15 14 16
Components:
Present Sales 17 17 12 15 14 16
Expected Next 6 Months 29 30 17 24 24 25
Traffic 12 18 12 11 10 11
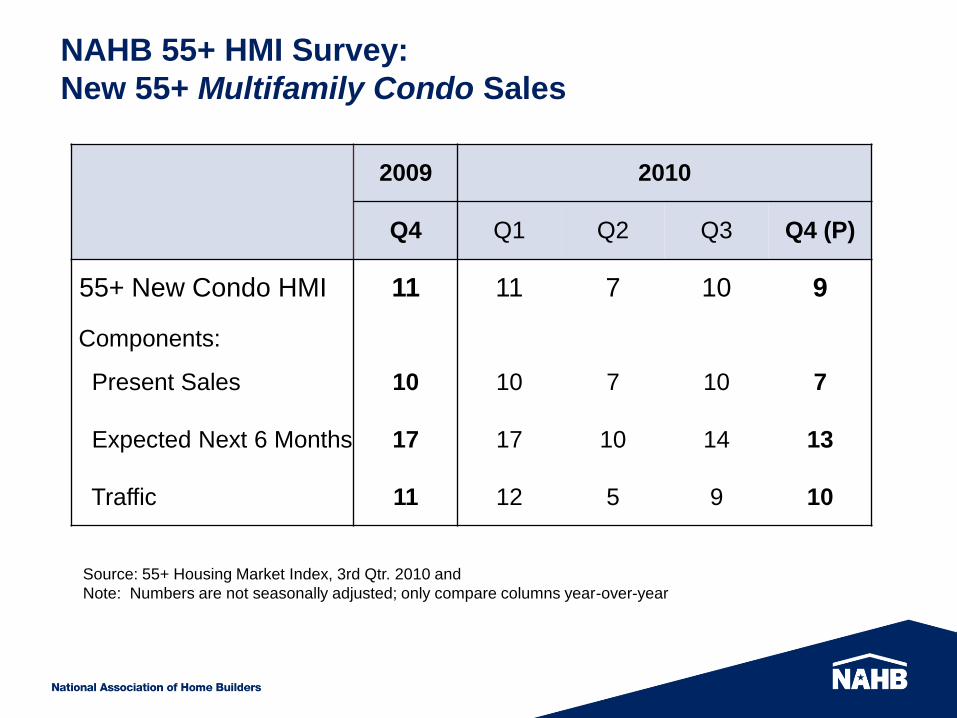
NAHB 55+ HMI Survey:
New 55+ Multifamily Condo Sales
Source: 55+ Housing Market Index, 3rd Qtr. 2010 and
Note: Numbers are not seasonally adjusted; only compare columns year-over-year
2009 2010
Q4 Q1 Q2 Q3 Q4 (P)
55+ New Condo HMI 11 11 7 10 9
Components:
Present Sales 10 10 7 10 7
Expected Next 6 Months 17 17 10 14 13
Traffic 11 12 5 9 10

NAHB 55+ HMI Survey:
Multifamily Rental Apartments
Source: 55+ Housing Market Index, 3rd Qtr. 2010 and
Note: Numbers are not seasonally adjusted; only compare columns year-over-year
2009 2010
Q4 Q1 Q2 Q3 Q4(P)
Production of New 55+ Rental Apartments:
Present Production 16 13 15 14 17
Expected Next 6 Months 18 19 16 16 23
Demand for Existing 55+ Rental Apartments:
Present Demand 26 28 31 28 28
Expected Next 6 Months 30 34 30 32 32

Sales incentives/premiums used to promote
55+ housing developments
Source: 55+ Housing Market Index Special Questions, 3rd Qtr. 2009, NAHB EcHp.
33%
15%
3%
5%
15%
34%
49%
None of the above
Other
Trips
Discounts on outside services
Prepaid homeowner fee (e.g. one year)
A free option package (e.g. 3rd bathroom)
Free upgrades package (e.g. premium carpeting, upgraded appliances)
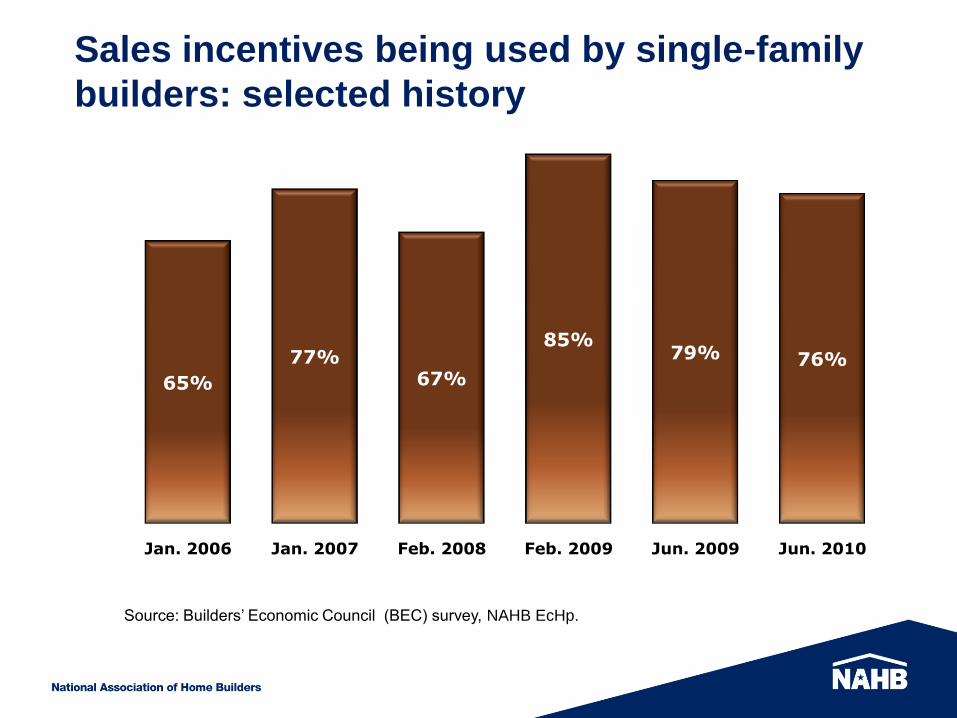
Sales incentives being used by single-family
builders: selected history
Source: Builders’ Economic Council (BEC) survey, NAHB EcHp.
65%
77%67%
85%79% 76%
Jan. 2006 Jan. 2007 Feb. 2008 Feb. 2009 Jun. 2009 Jun. 2010

Incentives marketed as a substitute for the
Expired Home Buyers Tax Credit?(Of those who report using incentives)
Source: Builders’ Economic Council (BEC) survey, June 2010, NAHB EcHp.
Yes
19%No
81%

Reasons for Not Using Special Sales Incentives
19%
6%
18%
41%
50%
Other
Market now strong enough, incentives not needed
Don't think incentives work in my market area
Have tried incentives, but they were ineffective
Cannot afford to offer incentives due to rising
construction costs
Source: Builders’ Economic Council (BEC) survey, June 2010, NAHB EcHp.

Financing of 55+ Housing
• New construction: financing for acquisition, development & construction
– Many challenges, need to be innovative
– 55+ similar to other markets
• Sales of existing homes: mortgages
– Problems of financial turmoil, declining prices
– 55+ markets may be different
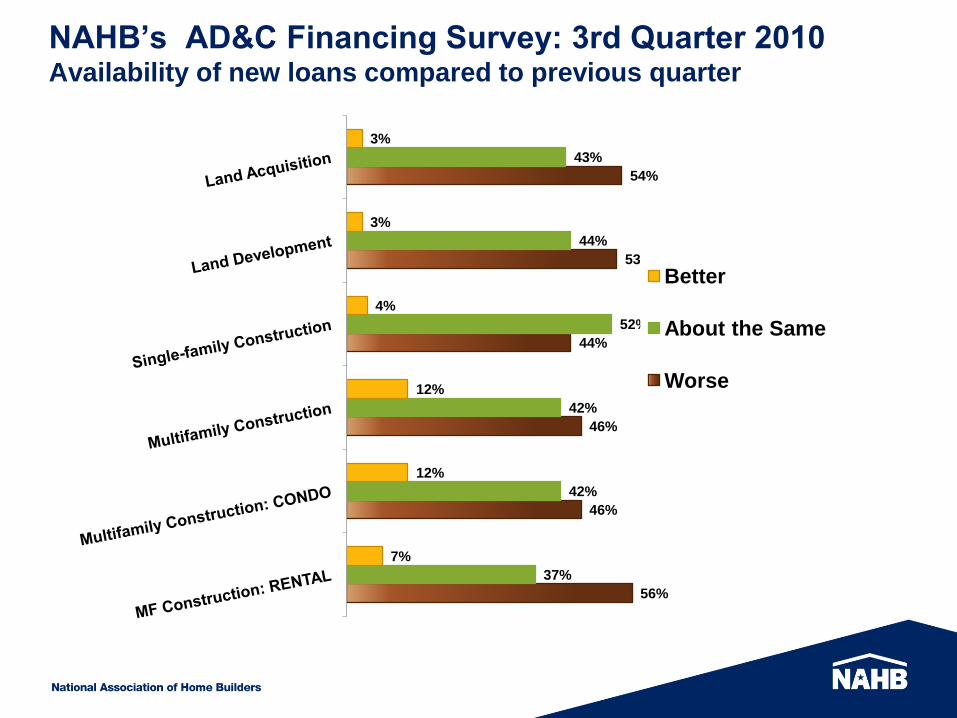
NAHB’s AD&C Financing Survey: 3rd Quarter 2010Availability of new loans compared to previous quarter
56%
46%
46%
44%
53%
54%
37%
42%
42%
52%
44%
43%
7%
12%
12%
4%
3%
3%
Better
About the Same
Worse

AD&C Financing Survey: Availability of Loans Last 4 Quarters
Land Acquisition
Better 3% 2% 5% 4%
Worse 54% 55% 64% 66%
Land Development
Better 3% 4% 5% 4%
Worse 53% 61% 70% 62%
Single-family Construction
Better 4% 6% 5% 2%
Worse 44% 48% 48% 58%
Multifamily Construction
Better 12% 8% 12% 3%
Worse 46% 63% 65% 79%
Multifamily Construction: CONDO
Better 12% 8% 12% 3%
Worse 46% 63% 65% 79%
Multifamily Construction: RENTAL
Better 7% 7% 0% 8%
Worse 56% 45% 81% 64%
AD&C
Q110
AD&C
Q409
AD&C
Q210
AD&C
Q310

60%
67%
70%
71%
78%
Lenders are increasing documentation requirements
Lenders are requiring personal guarantees or collateral not related to
the project
Lenders are reducing amount willing to lend
Lenders are lowering the allowable LTV (or loan-to-cost) ratio
Lenders are not making new loans
AD&C Financing Survey: 3rd Quarter 2010 Nature of changes for the worse
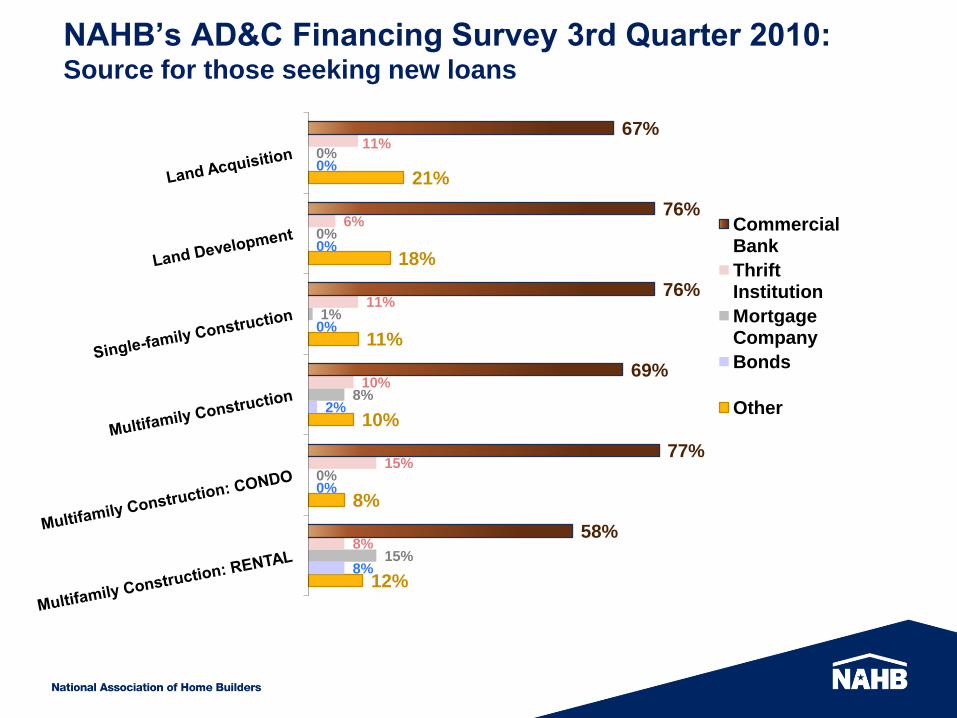
NAHB’s AD&C Financing Survey 3rd Quarter 2010:Source for those seeking new loans
12%
8%
10%
11%
18%
21%
8%
0%
2%
0%
0%
0%
15%
0%
8%
1%
0%
0%
8%
15%
10%
11%
6%
11%
58%
77%
69%
76%
76%
67%
Commercial Bank
Thrift Institution
Mortgage Company
Bonds
Other
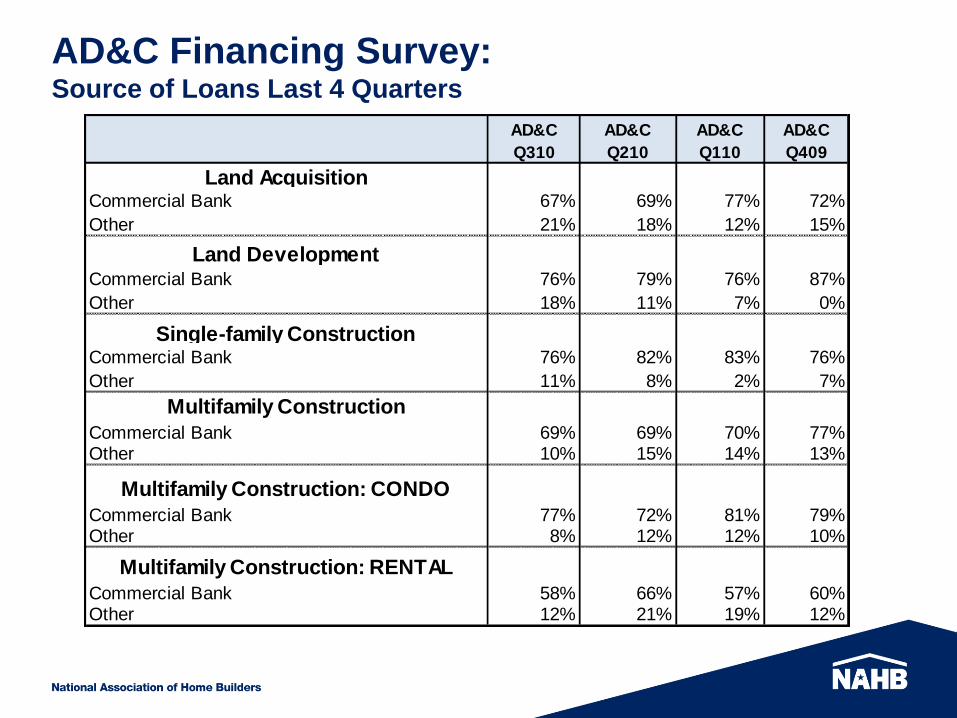
AD&C Financing Survey: Source of Loans Last 4 Quarters
Land AcquisitionCommercial Bank 67% 69% 77% 72%
Other 21% 18% 12% 15%
Land DevelopmentCommercial Bank 76% 79% 76% 87%
Other 18% 11% 7% 0%
Single-family ConstructionCommercial Bank 76% 82% 83% 76%
Other 11% 8% 2% 7%
Multifamily Construction
Commercial Bank 69% 69% 70% 77%Other 10% 15% 14% 13%
Multifamily Construction: CONDO
Commercial Bank 77% 72% 81% 79%Other 8% 12% 12% 10%
Multifamily Construction: RENTAL
Commercial Bank 58% 66% 57% 60%Other 12% 21% 19% 12%
AD&C
Q409
AD&C
Q310
AD&C
Q110
AD&C
Q210

AD&C Financing Sessions at 2011 IBS(All in Orange County Convention Center)
• Securing Investors and Lenders for Land Developers Friday, January 14, 3:30-5:00 pm West 304 C-D
• Age-Restricted Rental Housing: Obtaining Financing in Today's Market Saturday, January 15, 10:00 - 11:30 am West 314 B
• Surviving Lender Action Saturday, January 15, 10:00-11:30 am West 308 A-B
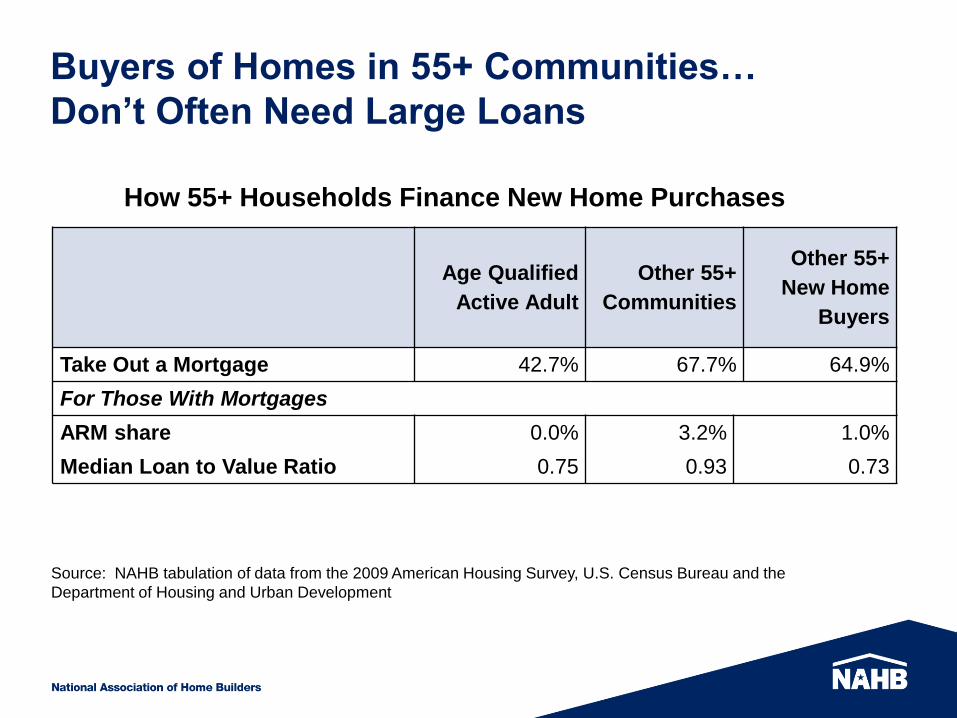
Buyers of Homes in 55+ Communities…
Don’t Often Need Large Loans
Age Qualified
Active Adult
Other 55+
Communities
Other 55+
New Home
Buyers
Take Out a Mortgage 42.7% 67.7% 64.9%
For Those With Mortgages
ARM share 0.0% 3.2% 1.0%
Median Loan to Value Ratio 0.75 0.93 0.73
How 55+ Households Finance New Home Purchases
Source: NAHB tabulation of data from the 2009 American Housing Survey, U.S. Census Bureau and the
Department of Housing and Urban Development
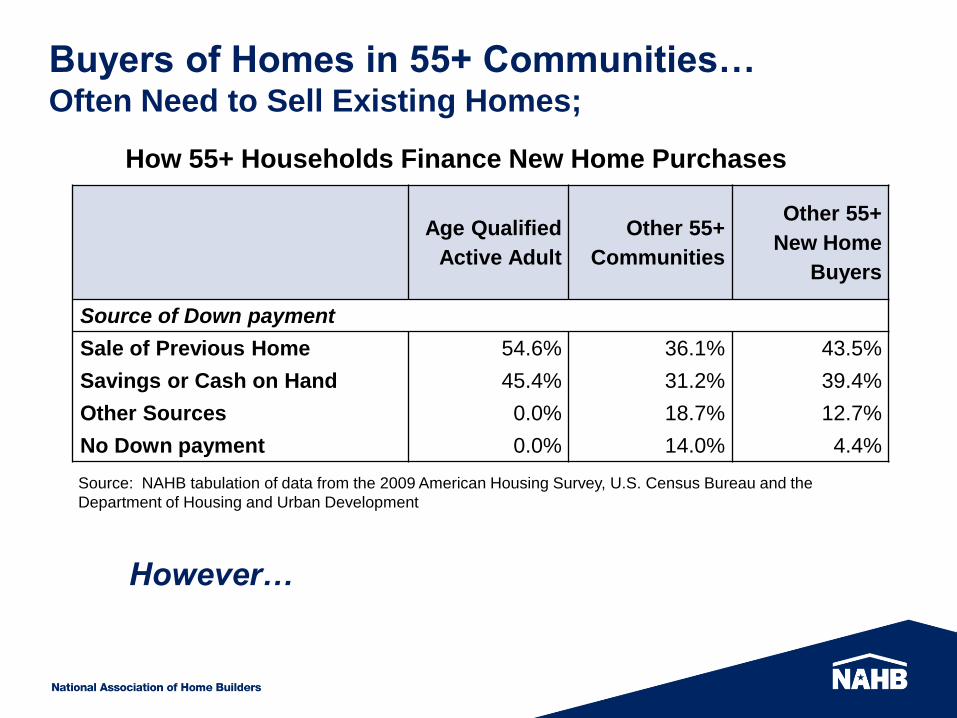
Buyers of Homes in 55+ Communities…Often Need to Sell Existing Homes;
Age Qualified
Active Adult
Other 55+
Communities
Other 55+
New Home
Buyers
Source of Down payment
Sale of Previous Home 54.6% 36.1% 43.5%
Savings or Cash on Hand 45.4% 31.2% 39.4%
Other Sources 0.0% 18.7% 12.7%
No Down payment 0.0% 14.0% 4.4%
How 55+ Households Finance New Home Purchases
Source: NAHB tabulation of data from the 2009 American Housing Survey, U.S. Census Bureau and the
Department of Housing and Urban Development
However…
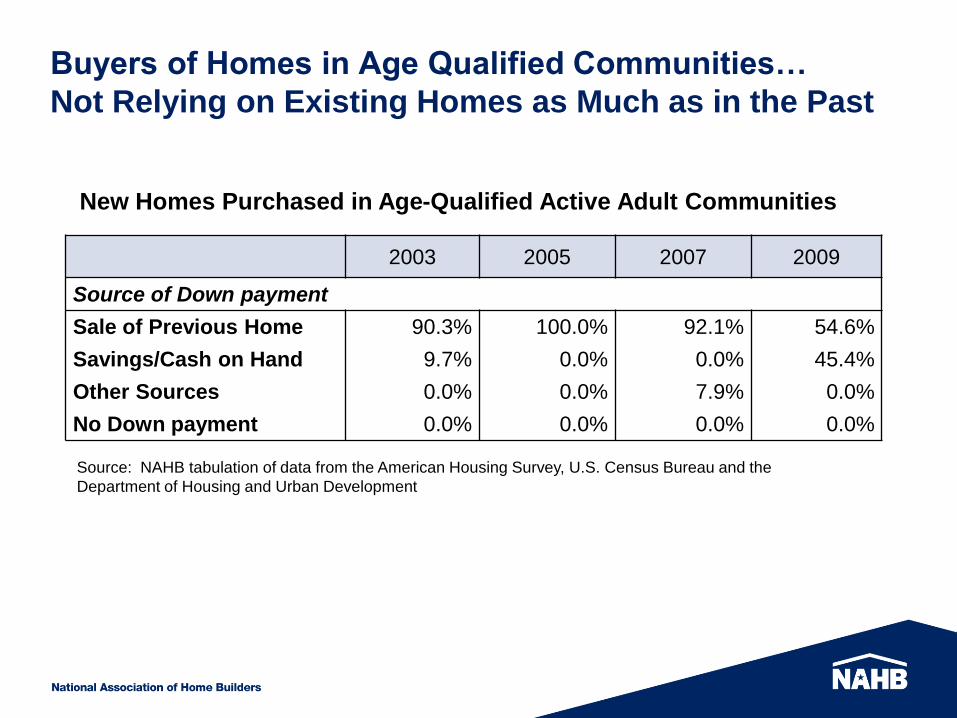
Buyers of Homes in Age Qualified Communities…
Not Relying on Existing Homes as Much as in the Past
2003 2005 2007 2009
Source of Down payment
Sale of Previous Home 90.3% 100.0% 92.1% 54.6%
Savings/Cash on Hand 9.7% 0.0% 0.0% 45.4%
Other Sources 0.0% 0.0% 7.9% 0.0%
No Down payment 0.0% 0.0% 0.0% 0.0%
New Homes Purchased in Age-Qualified Active Adult Communities
Source: NAHB tabulation of data from the American Housing Survey, U.S. Census Bureau and the
Department of Housing and Urban Development
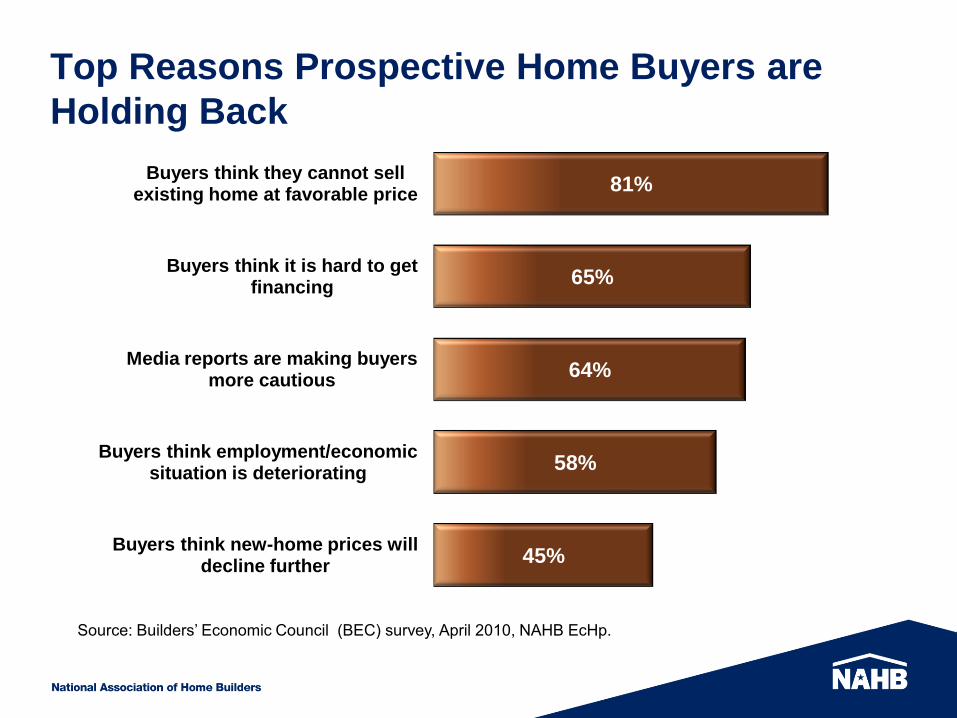
Top Reasons Prospective Home Buyers are
Holding Back
45%
58%
64%
65%
81%
Buyers think new-home prices will decline further
Buyers think employment/economic situation is deteriorating
Media reports are making buyers more cautious
Buyers think it is hard to get financing
Buyers think they cannot sell existing home at favorable price
Source: Builders’ Economic Council (BEC) survey, April 2010, NAHB EcHp.

NAHB Forecast
• GDP Growth
• Employment
• House Prices
• Sales & Starts
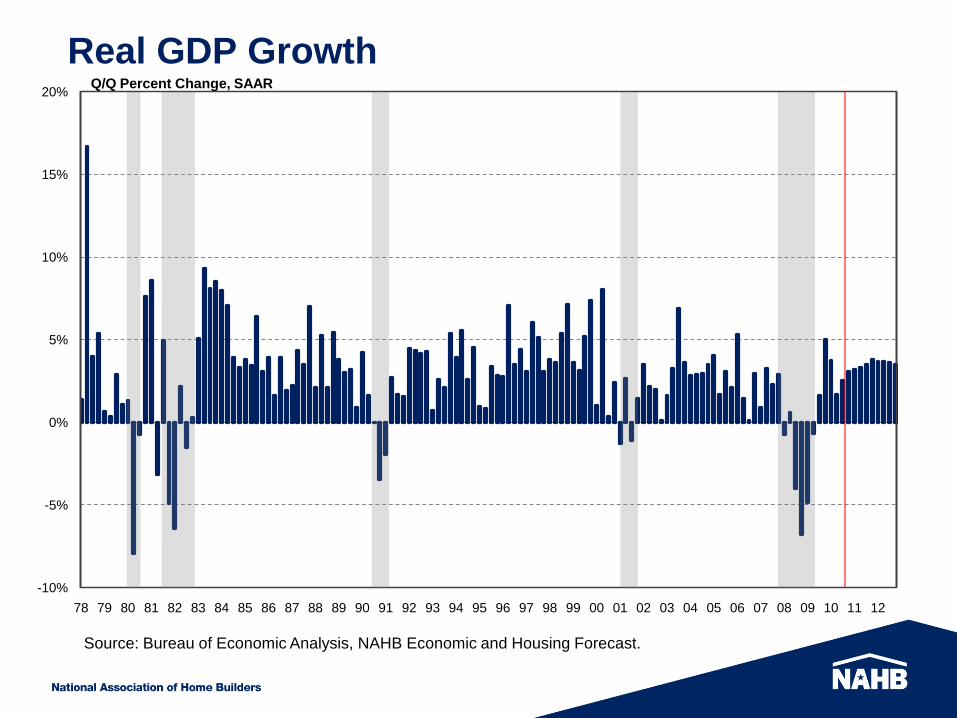
Real GDP Growth
-10%
-5%
0%
5%
10%
15%
20%
78 79 80 81 82 83 84 85 86 87 88 89 90 91 92 93 94 95 96 97 98 99 00 01 02 03 04 05 06 07 08 09 10 11 12
Q/Q Percent Change, SAAR
Source: Bureau of Economic Analysis, NAHB Economic and Housing Forecast.
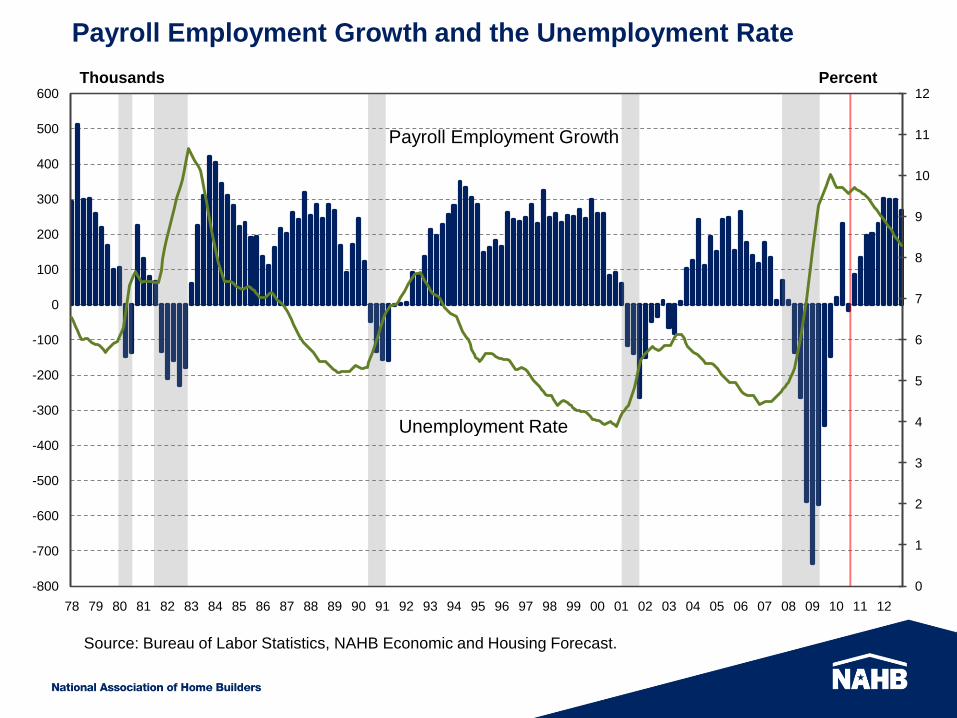
Payroll Employment Growth and the Unemployment Rate
0
1
2
3
4
5
6
7
8
9
10
11
12
-800
-700
-600
-500
-400
-300
-200
-100
0
100
200
300
400
500
600
78 79 80 81 82 83 84 85 86 87 88 89 90 91 92 93 94 95 96 97 98 99 00 01 02 03 04 05 06 07 08 09 10 11 12
Payroll Employment Growth
Unemployment Rate
PercentThousands
Source: Bureau of Labor Statistics, NAHB Economic and Housing Forecast.

Measures of House Prices
87 88 89 90 91 92 93 94 95 96 97 98 99 00 01 02 03 04 05 06 07 08 09 10 11 12
0
20
40
60
80
100
120
140
160
180
200
Case-Shiller
FHFA
NAR
Flow of Funds
2000Q1 = 100
Sources: National Association of Realtors, Federal, Reserve Board, S&P Case-Shiller, FHFA
NAHB Economic and Housing Forecast.

US Housing Market Conditions
Prices and Income – Current and Trend
0
50
100
150
200
250
300
91 92 93 94 95 96 97 98 99 00 01 02 03 04 05 06 07 08 09 10
0.0
0.5
1.0
1.5
2.0
2.5
3.0
3.5
4.0
4.5
5.0Median House Price / Median Income Income and Prices, Thousands
House Price
Price / Income
Income
3.2
4.7
Source: US Census Bureau, National Association of Realtors

House Prices and Income – Trend, Peak and Current
0%
20%
40%
60%
80%
100%
120%
140%
160%
180%
200%
220%
240%
U
S
M
I
U
T
W
Y
N
V
A
L
G
A
O
H
S
D
I
D
I
N
A
R
M
T
N
H
I
L
A
Z
C
T
N
M
A
K
C
O
K
S
K
Y
M
O
V
T
N
E
M
N
C
A
T
X
T
N
F
L
W
V
I
A
P
A
M
S
O
K
N
D
R
I
W
I
O
R
M
E
V
A
M
A
N
C
S
C
W
A
N
Y
D
C
D
E
L
A
N
J
H
I
M
D
Percentage of Historical Trend
Source: US Census Bureau, National Association of Realtors
FLCANV
AZ

Median Value of New Homes Purchased by
55+ Buyers
2005 2007 200905-07
change
In Age-Qualified Active Adult
Communities $320,000 $300,000 $300,000 -6.3%
In Other Communities Occupied
Mostly by 55+ Residents$300,000 $274,000 $255,000 -15.0%
In Ordinary (Non-55+)
Communities$258,000 $280,000 $239,000 -7.4%
S&P/Case-Shiller® U.S. National
Home Price Index166 135 134 -19.4%
Source: NAHB tabulation of data from the American Housing Survey, U.S. Census Bureau and the
Department of Housing and Urban Development; Standard & Poor’s
0
1
2
3
4
5
6
7
8
0.0
0.2
0.4
0.6
0.8
1.0
1.2
1.4
1.6
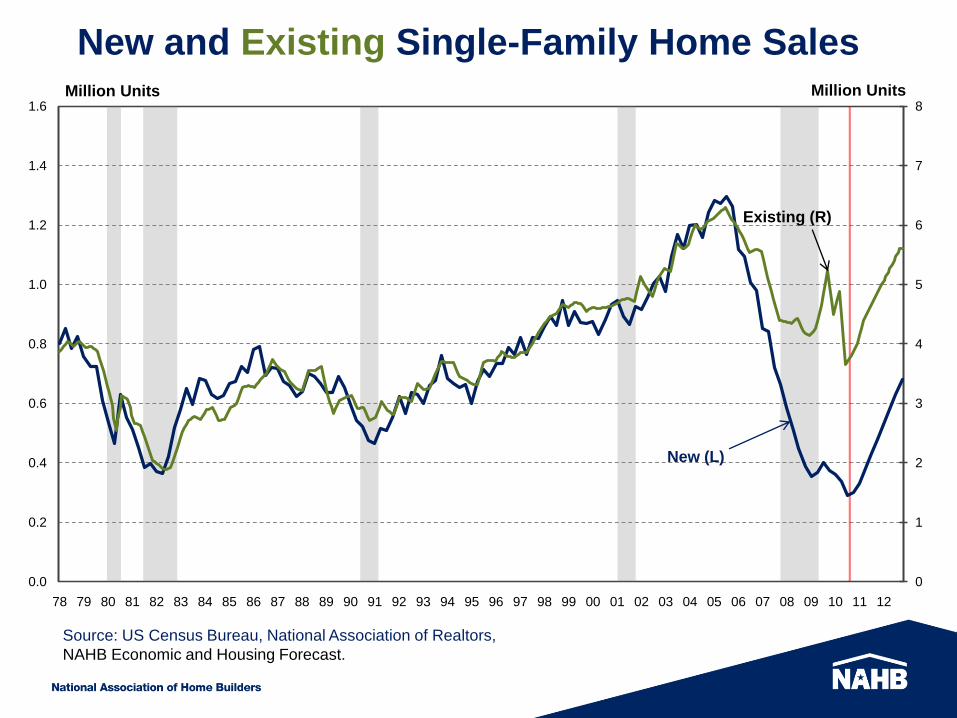
78 79 80 81 82 83 84 85 86 87 88 89 90 91 92 93 94 95 96 97 98 99 00 01 02 03 04 05 06 07 08 09 10 11 12
Million Units
Existing (R)
New (L)
Million Units
New and Existing Single-Family Home Sales
Source: US Census Bureau, National Association of Realtors,
NAHB Economic and Housing Forecast.

0.0
0.2
0.4
0.6
0.8
1.0
1.2
1.4
1.6
1.8
2.0
89 90 91 92 93 94 95 96 97 98 99 00 01 02 03 04 05 06 07 08 09 10 11 12
Million Units, SAAR
Single-Family Housing Starts
Source: US Census Bureau, NAHB Economic and Housing Forecast.

0
50
100
150
200
250
300
350
400
450
500
89 90 91 92 93 94 95 96 97 98 99 00 01 02 03 04 05 06 07 08 09 10 11 12
Thousands of Units, SAAR
Multifamily Housing Starts
Source: US Census Bureau, NAHB Economic and Housing Forecast.
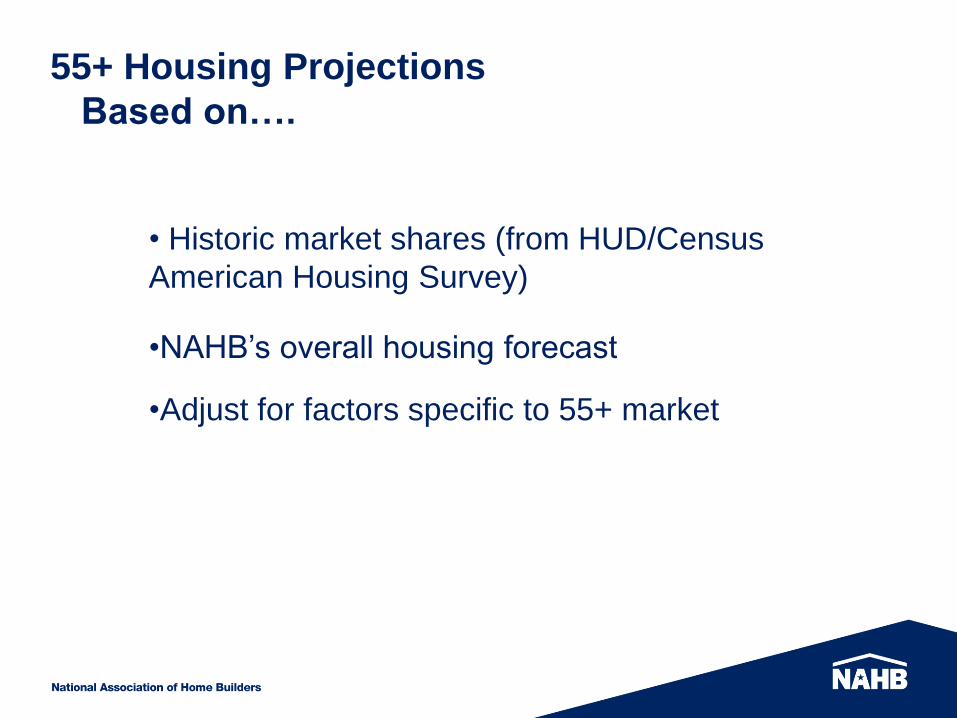
55+ Housing Projections
Based on….
• Historic market shares (from HUD/Census
American Housing Survey)
•NAHB’s overall housing forecast
•Adjust for factors specific to 55+ market

55+ Households as a Share of
the Total Housing Market
Total
In Age-
Qualified
Communities
In Other
Communities
Occupied
Mostly by 55+
All Recent Movers 14.0% 2.1% 2.6%
Movers into Rental Units 11.9% 2.3% 1.9%
Home Buyers: 18.5% 1.5% 4.1%
Existing Home Buyers 18.0% 1.4% 4.5%
New Home Buyers: 21.3% 2.3% 2.2%
New For-sale Home Buyers 20.1% 2.8% 1.9%
New Custom Home Buyers 24.4% 0.7% 3.0%
Source: NAHB tabulation of data from the 2009 American Housing Survey,
U.S. Census Bureau and the Department of Housing and Urban Development
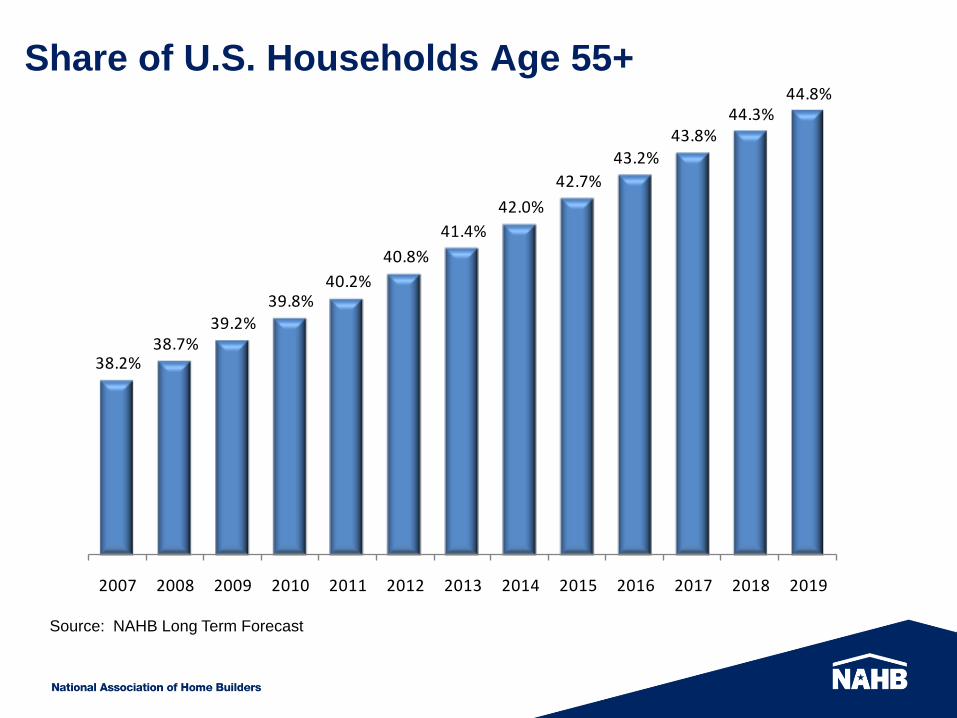
38.2%38.7%
39.2%39.8%
40.2%
40.8%
41.4%
42.0%
42.7%
43.2%43.8%
44.3%44.8%
2007 2008 2009 2010 2011 2012 2013 2014 2015 2016 2017 2018 2019
Share of U.S. Households Age 55+
Source: NAHB Long Term Forecast

Homeownership Rate by Age
16.3%
44.7%
64.7%
73.7%77.9% 80.2% 81.3% 78.9%
68.7%
15-24 25-34 35-44 45-54 55-59 60-64 65-74 75-84 85+
Source: NAHB tabulation of data from the 2008 American Community Survey, U.S. Census Bureau.
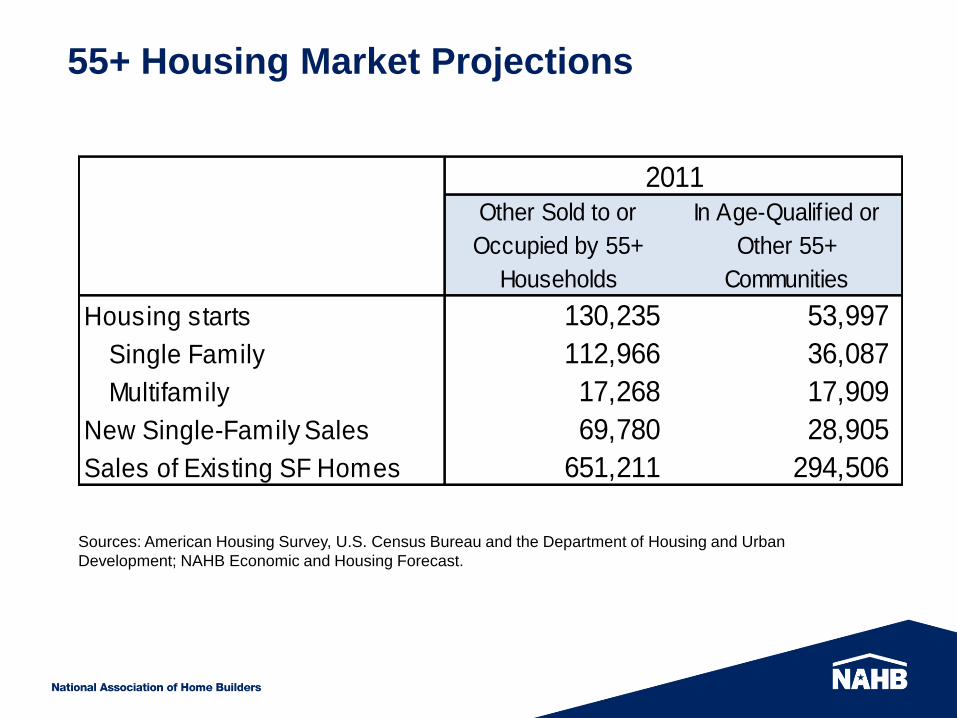
55+ Housing Market Projections
Sources: American Housing Survey, U.S. Census Bureau and the Department of Housing and Urban
Development; NAHB Economic and Housing Forecast.
Other Sold to or
Occupied by 55+
Households
In Age-Qualif ied or
Other 55+
Communities
Housing starts 130,235 53,997
Single Family 112,966 36,087
Multifamily 17,268 17,909
New Single-Family Sales 69,780 28,905
Sales of Existing SF Homes 651,211 294,506
2011
55+ Housing Market Projections
Sources: American Housing Survey, U.S. Census Bureau and the Department of Housing and Urban
Development; NAHB Economic and Housing Forecast.
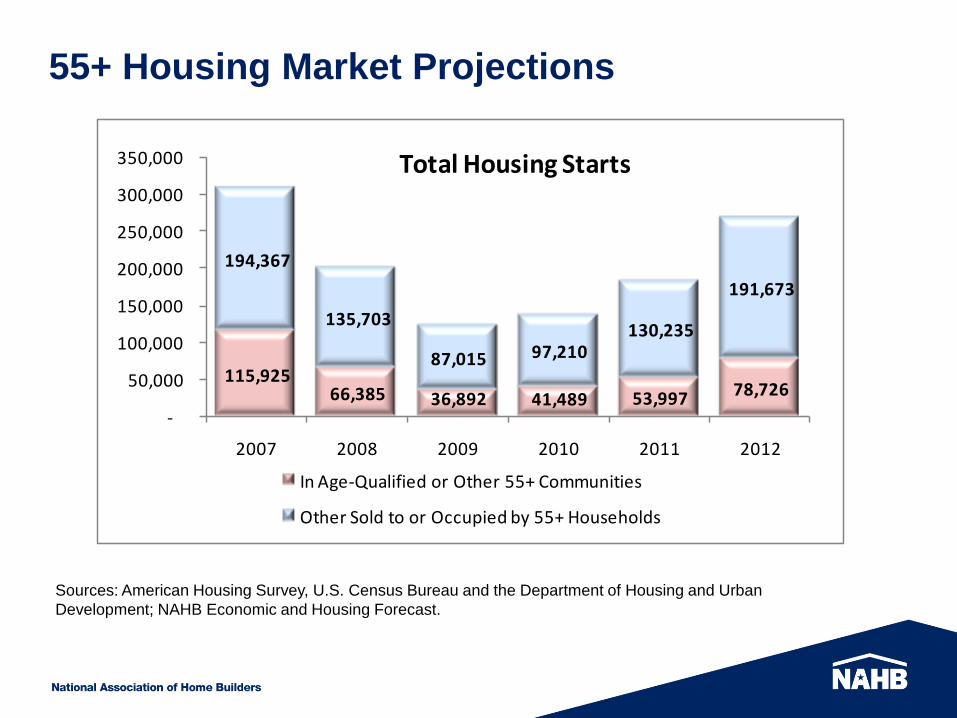
115,925 66,385 36,892 41,489 53,997 78,726
194,367
135,703
87,015 97,210 130,235
191,673
-
50,000
100,000
150,000
200,000
250,000
300,000
350,000
2007 2008 2009 2010 2011 2012
In Age-Qualified or Other 55+ Communities
Other Sold to or Occupied by 55+ Households
Total Housing Starts

55+ Housing Market Projections
Sources: American Housing Survey, U.S. Census Bureau and the Department of Housing and Urban
Development; NAHB Economic and Housing Forecast.
78,613 33,097 23,749 26,409 36,087 53,442
157,330
103,606
74,342 82,670
112,966
167,294
-
50,000
100,000
150,000
200,000
250,000
2007 2008 2009 2010 2011 2012
Single-Family Housing Starts
In Age-Qualified or Other 55+ Communities
Other Sold to or Occupied by 55+ Households
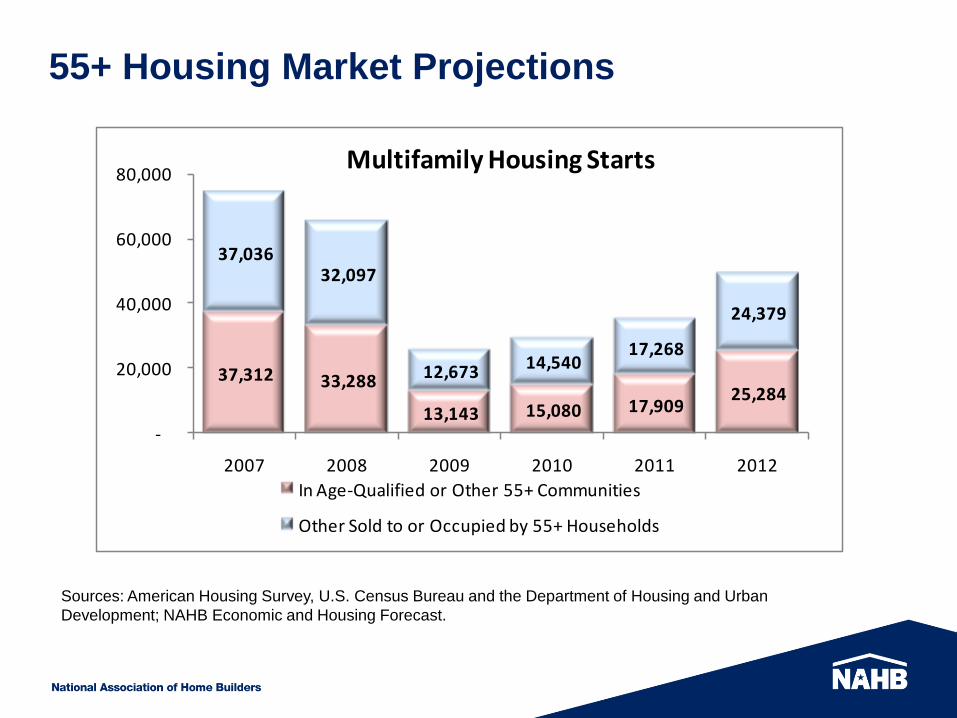
55+ Housing Market Projections
Sources: American Housing Survey, U.S. Census Bureau and the Department of Housing and Urban
Development; NAHB Economic and Housing Forecast.
37,312 33,288
13,143 15,080 17,909 25,284
37,036 32,097
12,673 14,540 17,268
24,379
-
20,000
40,000
60,000
80,000
2007 2008 2009 2010 2011 2012
Multifamily Housing Starts
In Age-Qualified or Other 55+ Communities
Other Sold to or Occupied by 55+ Households
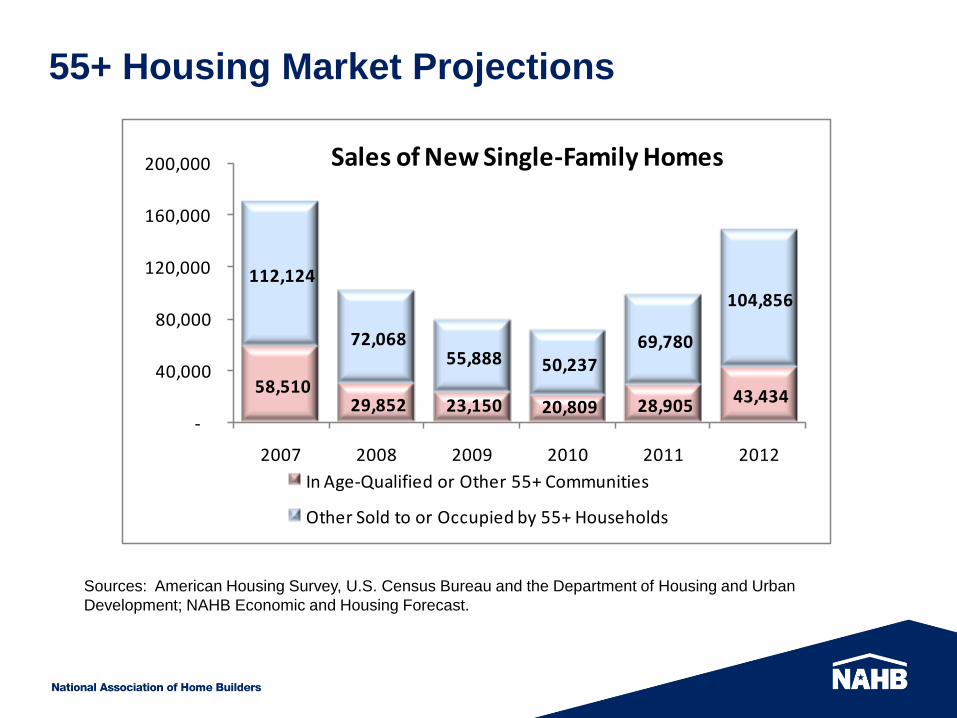
55+ Housing Market Projections
Sources: American Housing Survey, U.S. Census Bureau and the Department of Housing and Urban
Development; NAHB Economic and Housing Forecast.
58,510 29,852 23,150 20,809 28,905 43,434
112,124
72,068 55,888 50,237
69,780
104,856
-
40,000
80,000
120,000
160,000
200,000
2007 2008 2009 2010 2011 2012
Sales of New Single-Family Homes
In Age-Qualified or Other 55+ Communities
Other Sold to or Occupied by 55+ Households

55+ Housing Market Projections
Sources: American Housing Survey, U.S. Census Bureau and the Department of Housing and Urban
Development; NAHB Economic and Housing Forecast.
267 244 256 247 295 346
631 539 567 545
651 764
-
200
400
600
800
1,000
1,200
2007 2008 2009 2010 2011 2012
Tho
usa
nd
s
Sales of Existing Single-Family Homes
In Age-Qualified or Other 55+ Communities
Other Sold to or Occupied by 55+ Households

This presentation is available on the internet:
www.buildersshow.com/education
Contact
Paul Emrath
VP-Survey and Housing Policy Research
NAHB Economics and Housing Policy Group
1-800-368-5242 x8449

Thank You