internal service quality dimensions in healthcare...
TRANSCRIPT
Service Quality Evaluation in Internal Healthcare Service Chains
Charles Hollis
BSc (Magna Cum Laude) – Brigham Young University- Hawaii (1979)
MBA – Northeast Louisiana University (1980)
A thesis submitted for the degree of
Doctor of Philosophy
Queensland University of Technology
Faculty of Business
2006

2
Abstract Measurement of quality is an important area within the services sector. To date, most
attempts at measurement have focussed on how external clients perceive the quality of
services provided by organisations. Although recognising that relationships between
providers within a service environment are important, little research has been conducted
into the identification and measurement of internal service quality. This research focuses on
the measurement of internal service quality dimensions in the complex service environment
of an internal healthcare service chain.
The concept of quality in healthcare continues to develop as various provider, patient and
client, governmental, and insurance groups maintain an interest in how to ‘improve’ the
quality of healthcare service management and delivery. This research is based in healthcare
as a major area within the service sector. The service environment in a large hospital is
complex, with multiple interactions occurring internally; health is a significant field of
study from both technical and organisational perspectives providing specific prior research
that may be used as a basis for, and extension into service quality; and the implications of
not getting service delivery right in healthcare in terms of costs to patients, families,
community, and the government are significant.
There has been considerable debate into the nature, dimensionality, and measurement of
service quality. The five dimensions of SERVQUAL (tangibles, assurance, reliability,
responsiveness, and empathy) have become a standard for evaluations of service quality in
external service encounters, although these have been challenged in the literature. As
interest in internal service quality has grown, a number of researchers have suggested that
external service quality dimensions apply to internal service quality value chains
irrespective of industry. However, this transferability has not been proven empirically.
This research examines the nature of service quality dimensions in an internal healthcare
service network, how these dimensions differ from those used in external service quality
evaluations, and how different groups within the internal service network evaluate service
quality, using both qualitative and quantitative research. Two studies were undertaken. In
the first of these, interviews with staff from four groups within an internal service chain
were conducted. Using dimensions established through qualitative analysis of this data,
3
Study Two then tested these dimensions through data collected in a survey of staff in a
major hospital.
This research confirms the hierarchical, multidirectional, and multidimensional nature of
internal service quality. The direct transferability of external quality dimensions to internal
service quality evaluations is only partially supported. Although dimension labels are
similar to those used in external studies of service quality, the cross-dimensional nature of a
number of these attributes and their interrelationships needs to be considered before
adopting external dimensions to measure internal service quality. Unlike in previous studies,
equity has also been identified as an important factor in internal service quality evaluations.
Differences in service expectations between groups in the internal service chain, and
differentiation of perceptions of dimensions used to evaluate others from those perceived
used in evaluations by others were found. This has implications on formulation of future
internal service quality instruments. For example, the expectations model of service quality
is currently the dominant approach to conceptualising and developing service quality
instruments. This study identifies a number of problems in developing instruments that
consider differences in expectations between internal groups. Difficulty in evaluating the
technical quality of services provided in internal service chains is also confirmed.
The triadic nature of internal service quality evaluations in internal healthcare service
chains and the problems associated with transferring the traditional dyadic measures of
service quality are identified. The relationships amongst internal service workers and
patients form these triads, with patient outcomes a significant factor in determining overall
internal service quality, independent of technical quality.
This thesis assists in supporting the development of measurement tools more suited to
internal service chains, and will provide a stronger and clearer focus on overall
determinants of internal service quality, with resultant managerial implications for
managerial effectiveness.
Key Words: Internal Service Quality, Equity

4
Table of Contents
1 Research Outline for Service Quality Evaluations in Internal Healthcare Service Chains………………………………………………14
1.1 Introduction……………………………………………………………………14
1.2 Research Background……………………………………………………..15
1.3 Research Justification……………………………………………………..18
1.4 Gaps in the Literature…………………………………………………….20
1.5 Methodology……………………………………………………………….21
1.6 Thesis Structure…………………………………………………………...23
1.7 Key Findings and Contribution…………………………………………..24
1.8 Summary…………………………………………………………………...26
2 Internal Service Quality in Healthcare…………………………..27
2.1 Introduction………………………………………………………………..27
2.2 Service Delivery……………………………………………………………28
2.2.1 Basic service model……………………………………………………....29
2.2.2 Internal marketing………………………………………………………..30
2.2.3 Internal networks………………………………………………………...33
2.2.4 Conceptualising internal service marketing channels………………………37
2.2.5 Summary of internal service quality………………………………………41
2.3 Service Quality…………………………………………………………….42
2.3.1 Defining service quality…………………………………………………..43
2.3.2 Service quality research orientations………………………………………46
2.4 Dimensions of Service Quality……………………………………………49
2.4.1 SERVQUAL dimensions…………………………………………………51
2.4.2 Beyond SERVQUAL…………………………………………………….55
2.4.3 Social dimensions of service quality………………………………………58
2.4.3.1 Interaction dimensions of service quality…………………………………58

5
2.4.3.2 Equity dimensions of service quality…………………………………….60
2.4.3.3 Competence dimensions of service quality……………………………….63
2.4.3.4 Perceived effort dimensions of service quality…………………………….65
2.4.3.5 Summary of social dimensions………………………………………….66
2.5 Internal Versus External Quality Dimensions…………………………..66
2.6 Quality in Health Care……………………………………………………73
2.6.1 Development of healthcare quality orientation……………………………..74
2.6.2 Defining healthcare quality……………………………………………….77
2.6.3 Measuring healthcare quality……………………………………………..81
2.7 Conclusion, Research Problems and Research Questions………………87
3 Methodology………………………………………………………................95
3.1 Introduction………………………………………………………………..95
3.2 Research Paradigm………………………………………………………..96
3.3 Methodologies investigating service quality……………………………102
3.4 Research design for this Thesis…………………………………………...104
3.5 Methodology – Study 1…………………………………………………..106
3.5.1 Interview guide – Study 1……………………………………………………107
3.5.2 Sample – Study 1……………………………………………………….108
3.5.3 Recording interviews – Study 1……………………………………………...112
3.5.4 Interview data analysis – Study 1……………………………………………112
3.6 Methodology – Study 2…………………………………………………..114
3.6.1 Questionnaire design – Study 2……………………….............................115
3.6.2 Scale issues – Study 2…………………………………………………...117
3.6.3 Questionnaire Pre-test – Study 2…………………………………………119
3.6.4 Sample design – Study 2………………………………………………...119
3.6.5 Sample response – Study 2……………………………………………...120

6
3.6.6 Data analysis – Study 2………………………………………………….121
3.7 Issues of Validity and Reliability………………………………………..122
3.7.1 Reliability……………………………………………………………………122
3.7.2 Validity………………………………………………………………………124
3.8 Conclusion………………………………………………………………..126
4 Results of Study 1 – An Exploratory Study…………………….......129
4.1 Introduction………………………………………………………………129
4.2 Results of Study 1……………………...…………………………………129
4.2.1 P1 Internal service quality dimensions will differ to external service quality dimensions in the healthcare setting……………………………………...131
4.2.1.1 Defining service quality………………………………………………131
4.2.1.2 Service quality dimensions……………………………………………133
4.2.1.3 Comparing dimensions of this study to previous research…………………152
4.2.2 P2 Service expectations of internal service network groups will differ between groups within an internal healthcare service chain………………………...158
4.2.3 P3 Internal service quality dimensions used to evaluate others in an internal healthcare service chain will differ from those perceived used in evaluation by others………………………………………………………………………..159
4.2.4 P4 Ratings of service quality dimensions will differ in importance amongst internal healthcare service groups………………………………………160
4.2.5 P5 Internal healthcare service groups are unable to evaluate the technical quality of services provided by other groups…………………………….160
4.2.5.1 Ability to evaluate others…………………………………………….160
4.2.5.2 Quality review processes……………………………………………..161
4.2.6 P6 Relationship strength impacts on evaluation of internal service quality....162
4.2.6.1 Impact of interpersonal relationships…………………………………..163
4.2.6.2 Interdisciplinary respect……………………………………………...164
4.2.6.3 Impact of regular working relationships on evaluations of others………….165
4.3 Conclusion………………………………………………………………...165
4.3.1 P1 Internal service quality dimensions will differ to external service quality dimensions in the healthcare setting P3 Internal service quality dimensions used to evaluate others in an internal healthcare service chain will differ from those perceived used in evaluation by others…………………………………………………………………...166

7
4.3.2 P2 Service expectations of internal service network groups will differ between groups within an internal healthcare service chain………………………...167
4.3.3 P4 Ratings of service quality dimensions will differ in importance amongst internal healthcare service groups………………………………………..168
4.3.4 P5 Internal healthcare service groups are unable to evaluate the technical quality of services provided by other groups……………………………..168
4.3.5 P6 Relationship strength impacts on evaluation of internal service quality…169
5 Results of Study 2………………………………………………………….170
5.1 Introduction to Study 2…………………………………………………..170
5.2 H1 Internal service quality dimensions individuals use to evaluate others in an internal service chain will differ from those they perceive used in evaluations by others…………………………………………………….174
5.2.1 Attributes individuals use to evaluate the quality of service provided by others…………………………………………………………………...175
5.2.1.1 Factors used to evaluate internal service quality of others who provide service……………………………………………………………………179
5.2.1.2 Differences in perceptions of dimensions used to evaluate internal service quality
of others…………………………………………………………...182
5.2.1.3 Summary of factors used to evaluate internal service quality of others……..184
5.2.2 Perceived attributes used by others to evaluate respondent work quality………………………………………………………………….184
5.2.2.1 Perceived factors used by others to evaluate respondent work quality……...188
5.2.2.2 Difference between discipline areas in perceptions of dimensions used by others to evaluate service quality……………………………………………189
5.2.3 Attributes used to evaluate service quality………………………………..190
5.2.4 Comparison of attributes by strata……………………………………….192
5.3 H2 Service expectations of internal service quality……………………199
5.3.1 Expectations of internal service quality…………………………………..199
5.3.2 Differences in expectations of internal service quality……………………203
5.4 H3 Ratings will differ in importance of service quality dimensions amongst internal service groups…………………………………….211
5.4.1 Ranking of attributes by strata…………………………………………...215
5.4.1.1 Ranking of service quality attributes – Allied Health……………………..216
5.4.1.2 Ranking of service quality attributes – Corporate Services………………..217
5.4.1.3 Ranking of service quality attributes – Nursing………………………….218

8
5.4.1.4 Ranking of service quality attributes – Medical………………………….220
5.4.2 Comparison of ranking of service quality attributes……………………….221
5.5 H4 Internal service groups find it difficult to evaluate the technical quality of services provided by other groups……………………….226
5.6 Conclusion………………………………………………………………..232
6 Internal Healthcare Service Evaluation: Conclusion and Discussion…………………………………………………..........................236
6.1 Introduction………………………………………………………………236
6.2 Evaluation of Internal Service Quality…………………………………238
6.2.1 Ability to articulate service quality………………………………………239
6.2.2 Dimensions used to evaluate internal service quality……………………...240
6.2.2.1 Tangibles…………………………………………………………..243
6.2.2.2 Responsiveness……………………………………………………..245
6.2.2.3 Courtesy…………………………………………………………...247
6.2.2.4 Reliability………………………………………………………….248
6.2.2.5 Competence………………………………………………………..249
6.2.2.6 Access, Communication and Understanding the Customer……………….250
6.2.2.7 Equity……………………………………………………………..254
6.2.2.8 Patient Outcomes…………………………………………………...257
6.2.2.9 Collaboration………………………………………………………258
6.2.2.10 Caring……………………………………………………………259
6.2.2.11 Summary of Internal Service Quality Dimensions……………………...259
6.3 Perceived differences in dimensions used in evaluation of others and those used in evaluations by others…………………………………….262
6.4 Applicability of SERVQUAL dimensions to internal service quality evaluations………………………………………………………………..264
6.5 Expectations………………………………………………………………266
6.6 Ranking importance of internal service quality dimensions…………..267

9
6.7 Difficulty in evaluating technical quality of services provided by other groups…………………………………………………………………….269
6.8 Contribution to the Literature…………………………………………..270
6.8.1 Nature of internal service quality………………………………………...270
6.8.2 Role of Equity in internal service quality evaluations……………………..272
6.8.3 Differences in perceptions of dimensions use to evaluate others from those used in evaluations by others…………………………………………………..272
6.8.4 Triadic nature of internal services………………………………………..273
6.8.5 Evaluations of technical quality………………………………………….273
6.8.6 Service expectations…………………………………………………….274
6.9 Future Research………………………………………………………….274
6.10 Managerial Implications……………………………………………….275
6.11 Limitations………………………………………………………………278
6.12 Summary………………………………………………………………...279
7 Appendices…………………………………………………………………282
7.1 Appendix 1 Study 1 Interview Guide…………………………………..282
7.2 Appendix 2 Study 2 Questionnaire…………………………………….283
7.3 Appendix 3 Rotated Components of Factor Analysis…………………291
7 Bibliography……………………………………………………………….294

10
List of Tables
Table 2.1 Summary of service quality dimensions………………………………………………….. 73
Table 2.2 Typology of quality dimensions……………………………………………………….. 80
Table 2.3 Summary of hospital service quality dimensions……………………………………… 84
Table 3.1 Key features of positivist and phenomenological paradigms……………………………... 98
Table 3.2 Quantitative and qualitative paradigm assumptions…………………………………… 99
Table 3.3 Participants in Study 1…………………………………………………………………. 111
Table 3.4 Study 2 sample size and response rates………………………………………………... 121
Table 3.5 Approaches to assessing reliability……………………………………………………. 123
Table 4.1 Service quality categories……………………………………………………………… 135
Table 4.2 Dimensions of healthcare service quality……………………………………………... 136
Table 4.3 Summary of external service quality dimensions compared to Study 1 findings……… 154
Table 4.4 Comparison of this Study to other internal service quality investigations…………….. 157
Table 5.1 Dimensions used to evaluate internal service quality of others…………………………… 176
Table 5.2 Importance to individuals of attributes used to evaluate service quality of others who provide service…………………………………………………………………………
177
Table 5.3 Comparison of importance rank of internal service quality attributes used to evaluate others……………………………………………………………………………………
178
Table 5.4 Rotated Component Matrix – Part IV Factors used to evaluate service quality of those who provide excellent service…………………………………………………………..
182
Table 5.5 Mean and Standard Deviation of Factors used to evaluate others……………………... 183
Table 5.6. F and Significance for Factors perceived used by others to evaluate quality…………. 183
Table 5.7 Internal service quality dimensions perceived used in evaluations by others…………. 185
Table 5.8 Perceived importance of attributes used by others to evaluate respondent work quality…. 187
Table 5.9 Comparison of rank importance of perceived internal service quality attributes used by others……………………………………………………………………………………..
188
Table 5.10 Rotated Component Matrix – Part V Attributes used by others to evaluate respondent work quality………………………………………………………………………………
189
Table 5.11 Mean and standard deviation for factors identified as used to evaluate the service quality by others………………………………………………………………………………….
190
Table 5.12 F and significance for factors used to evaluate quality by others………………………... 190
Table 5.13 Differences in importance of individual variables and those perceived to be used by others to evaluate individuals……………………………………………………………..
193
Table 5.14 Difference in rank importance of variables used by individuals for internal service evaluations and those perceived used by others…………………………………………..
193
Table 5.15 Perceptions of internal service quality dimensions used to evaluate others and those perceived used in evaluations by others – Allied Health………………………………….
194
Table 5.16 Perceptions of internal service quality dimensions used to evaluate others and those perceived used in evaluations by others – Corporate Services…………………………
195
Table 5.17 Perceptions of internal service quality dimensions used to evaluate others and those perceived used in evaluations by others – Nursing……………………………………..
196

11
Table 5.18 Perceptions of internal service quality dimensions used to evaluate others and those perceived used in evaluations by others – Medical…………………………………….
197
Table 5.19 Comparison of items on paired t-test with significant variation……………………… 198
Table 5.20 Individual Expectations compared across strata……………………………………… 201
Table 5.21 Comparison of expectations – top ten………………………………………………… 202
Table 5.22 Expectation factors of internal healthcare service quality……………………………. 203
Table 5.23 Mean and Standard Deviations of Factors identified as expectations………………... 204
Table 5.24 ANOVA Table: Expectations………………………………………………………… 205
Table 5.25 Paired t-test (α 0.004) Expectations and variables used to evaluate others service quality……………………………………………………………………………...........
206
Table 5.26 Paired t-test (α 0.004) Expectations and variables used by others to evaluate service quality……………………………………………………………………………...........
207
Table 5.27 Expectations and Perceptions of attributes used to evaluate others……………………… 208
Table 5.28 Expectations and perceptions of attributes used by others…………………………… 209
Table 5.29 Expectations and perceptions of variables used to evaluate others. Comparison of dimensions for which significant differences exist in means for paired t-test in each stratum (α .004)…………………………………………………………………………
209
Table 5.30 Comparing expectations with perceptions of dimensions used by others to evaluate respondent work. Paired t-tests for dimensions with significant differences in means (α .004)…………………………………………………………………………………
210
Table 5.31 Ranking of Service Quality Attributes – Total………………………………………... 213
Table 5.32 Comparison of implicit and explicit service quality attributes 215
Table 5.33 Ranking of Service Quality Attributes - Allied Health………………………………. 216
Table 5.34 Comparison of implicit and explicit service quality attributes – Allied Health…………. 217
Table 5.35 Ranking of Service Quality Attributes – Corporate Services………………………… 218
Table 5.36 Comparison of implicit and explicit service quality attributes – Corporate Services…… 218
Table 5.37 Ranking of Service Quality Attributes – Nursing……………………………………. 219
Table 5.38 Comparison of implicit and explicit service quality attributes – Nursing………………. 219
Table 5.39 Ranking of Service Quality Attributes – Medical……………………………………. 220
Table 5.40 Comparison of implicit and explicit service quality attributes – Medical………………. 221
Table 5.41 Ranking of most important service quality attributes by strata………………………. 221
Table 5.42 Comparison of Attribute Average Scores……………………………………………. 222
Table 5.43 Comparison of ranking of service quality attributes…………………………………. 223
Table 5.44 Difference in strata rankings of attributes……………………………………………. 224
Table 5.45 Perceived ability to evaluate quality (Means – 7 pt. Scale)………………………….. 228
Table 5.46 Comparison of variables using ANOVA (α 0.05)…………………………………… 229
Table 6.1 Comparison of this study to other internal service quality investigations…………….. 241
Table 6.2 Comparison of dimensions used in the evaluation of others and those used in evaluation by others…………………………………………………………………….
262
Table 6.3 Ranking of most important service quality attributes by strata………………………... 268

12
List of figures
Figure 2.1 Basic Service Model………………………………………………………………………. 30
Figure 2.2 Internal Service Chain…………………………………………………………………….. 35
Figure 2.3 Porter’s Generic Value Chain (1985)……………………………………………………... 39
Figure 2.4 Model of Internal Service Value Chain…………………………………………………… 41
Figure 2.5 Gummesson-Gronroos Perceived Quality Model………………………………………… 47
Figure 2.6 The Gap Model of Service Quality……………………………………………………….. 48
Figure 2.7 Network Relationships in Hospital Internal Service Value Chains ………………………. 91
Figure 3.1 Research design for this thesis……………………………………………………………. 104
Figure 3.2 Data in Study 1…………………………………………………………………………… 114
Figure 3.3 Summary of research design for this thesis………………………………………………. 127
Figure 5.1 Part VI Ranking of service quality attributes pro forma…………………………………. 212
Figure 6.1 Network Relationships in Hospital Internal Service Value Chains and Patient Outcomes. 254
Figure 6.2 Conceptualisation of exchange and internal service quality evaluation………………….. 256
Figure 6.3. Perceived Equity of exchange and internal service quality evaluation…………………... 256
Figure 6.4 Worker relationships to patient outcomes………………………………………………… 258

13
Statement of Originality
The work contained in this thesis has not been previously submitted for a degree or diploma
at any other higher education institution. To the best of my knowledge and belief, the thesis
contains no material previously published or written by another person except where due
reference is made.
Signed……………………………………………………………………………..
Date…………………………………………………………………….

14
1.0 Research Outline for Service Quality Evaluations in Internal Healthcare Service Chains
1.1 Introduction
Over the past thirty years, the nature, dimensionality and measurement of service quality
has been debated by academics. The concept of service quality has been described as
elusive and abstract (Parasuraman, Zeithaml, & Berry, 1985). This elusiveness is
attributable to the unique characteristics of services: intangibility, inseparability of
production and consumption, heterogeneity, and perishability (Zeithaml, Parasuraman &
Berry, 1985).
While much debate has revolved around the precise measurement of service quality, the
most common approach to measurement is based on the five dimensions identified by
Parasuraman, Zeithaml and Berry (1985, 1988): tangibles, assurance, reliability,
responsiveness, and empathy. These dimensions form the basis of evaluations of service
quality in external service encounters and underpin the popular service quality
measurement instrument SERVQUAL. One of the assertions of SERVQUAL is that it is an
appropriate instrument for all industries and applicable to both external and internal service
quality measurement (Parasuraman, Zeithaml & Berry, 1988; Parasuraman, Berry &
Zeithaml, 1991). This claim, however, has had mixed response in the literature (e.g.
Babakus & Boller, 1992; Dabholkar, 1995; Frost & Kumar, 2000; Gremler, Bitner, &
Evans, 1994; Teas, 1993).
Interest in internal service quality is growing (e.g. Brooks, Lings & Botschen, 1999; Frost
& Kumar, 2000; Kang, James, & Alexandris, 2002; Mathews & Clark, 1997; Reynoso &
Moores, 1995: Voss, Calantone, & Keller, 2005). This interest is based on the assumption
that if internal quality is improved, then this will flow to external customers with
subsequent improvements in satisfaction. However, the question as to which dimensions
are used in internal service quality evaluations has not been resolved.
This thesis presents a review of the research of the application of marketing concepts to
internal service environments, the nature of service quality, service quality measurement,

15
extension of external service quality dimensions to internal environments, and healthcare
quality measures. Key dimensions of internal service quality evaluation are then identified
in Study 1 of this thesis and compared to those identified in both prior external and internal
service quality studies. The overall aim of this thesis is to identify and test these dimensions
and contrast them to existing indicators relating to internal service quality.
The research is conducted within a major public hospital. There are four reasons for
choosing this environment. First, healthcare is a major area within the service sector
accounting for approximately 8.5% of GDP in Australia and 14% of GDP in the United
States (Deeble, 1999; Swineheart & Smith, 2005). Second, the service environment within
a large hospital is complex, with multiple interactions occurring internally between service
providers in the delivery of any service to a single external client. Third, health is a
significant field of study from both a technical and organizational perspective thus
providing specific prior research that can be used both as a basis for, and extension of, this
research into service quality. Fourth, the importance of the implications of not getting
service delivery right in healthcare in terms of cost to the patient (death or impairment), the
family and community, and to the government in real terms and politically.
The purpose of this chapter is to summarise the thesis and provide rationale for the research.
Firstly, it summarises the key research into service quality and the extension of external
quality dimensions to internal service quality evaluation. Next, gaps in the literature and
specific research questions are discussed. This is followed by an outline of the research
methodology and the structure of this thesis. Finally, the key findings and contributions are
outlined.
1.2 Research Background
The research undertaken in this thesis is grounded in marketing theory. While there are
many academic disciplines that investigate the issue of quality, marketing is considered the
best match for the purpose of this research. There are three reasons for this. First, marketing
is based on the central importance of the needs of the final client in guiding organizational
activities. Second, Services Marketing is a strong and well established area within
marketing and provides important frameworks and concepts that are valuable in

16
understanding the nature of the service product. Understanding the service product is
critical if the nature of service quality is to be fully understood. Third, the commonly used
SERVQUAL instrument and the expectations-perceptions model of service quality on
which it is based, as well as the Nordic and perceptions- based conceptualisations of service
quality, were developed within the services marketing discipline.
The development of marketing as an independent academic discipline has been well
documented (e.g. Bartels, 1951; 1962; 1965; 1970; Hunt, 1971; 1976; 1991; Lichtenthal &
Beik, 1984). Marketing has been defined as the process of planning and executing the
conception, pricing, promotion and distribution of ideas, goods and services to create
exchanges and satisfy individual and organizational objectives (Marketing News, 1985).
Central to the concept of marketing are fundamental principles that:
1) The organization exists to identify and satisfy the needs of customers,
2) Satisfying customer needs is accomplished through coordinated integrative
effort throughout the organization, and
3) The organizational focus should be on long-term as opposed to short-term
success in achieving profitability for the organization.
(Kotler, 2000; McColl-Kennedy & Kiel, 2000)
Success in marketing allows organizations to maintain profitability and meet organizational
objectives.
It was not until the 1970’s that services were identified as having sufficiently different
characteristics to the physical products to require a separate approach to marketing (Fisk,
Brown & Bitner, 1993). Four characteristics are commonly cited as the factors that
distinguish services from goods: intangibility, inseparability of production and
consumption, heterogeneity, and perishability (Bateson, 1995; Berry, 1980; Lovelock,
1992; Uhl & Upah, 1983).
With improving product quality an accepted means to improve profitability, contain costs,
and to gain customer acceptance of products (Deming, 1986; Feigenbaum, 1963; Juran,
1964), the quality movement turned from physical products to services. However, the
characteristics of services created challenges for the definition and measurement of service

17
quality (Gronroos; 1983; 1984; Oliver, 1997; Parasuraman, Zeithaml, & Berry, 1985). The
concept of service quality has been described as elusive and abstract (Farner, Luthans, &
Sommer, 2001; Parasuraman, Zeithaml, & Berry, 1985). Nevertheless, improvements to
service quality have been linked to increased profit margins, lower costs, positive attitudes
toward the service by customers, and willingness of customers to pay price premiums
(Halstead, Casavant & Nixon, 1998; Heskett, Jones, Loveman, Sasser & Schlesinger, 1994,
Heskett, Sasser & Schlesinger, 1997; Zeithaml, 2000). Overall market performance and
market share have also been linked to service quality (Rust & Zahorik, 1993). Service
reputation is difficult for competitors to duplicate so organizations with a service point of
differentiation achieve a sustainable competitive advantage in the market place.
Internal marketing as a management approach has been proposed as a means to motivate all
members of the organization to examine their own role and adopt a customer consciousness
and service orientation (Berry, 1981; Piercy & Morgan, 1991). This is expected to improve
internal service quality, thus enabling the organization to deliver high value service that
will result in customer satisfaction and loyalty, ultimately leading to higher profits (Heskett,
Jones, Loveman, Sasser & Schlesinger, 1994; Heskett, Sasser, & Schlesinger, 1997; Varey,
1995a, b). The value chain (Porter, 1985) has become a basis to develop an internal
customer structure of an organization.
Porter’s value chain differentiates between the different types of internal groups that are
involved directly in the satisfaction of quality requirements of external customers as they
pass along the value chain. Each member of the chain is engaged in value adding functions.
This includes those who are not directly involved in the process or with external customers
who support those groups that are. The value chain provides a framework that
conceptualises service distribution within the organization as a service value chain.
Service quality is commonly conceptualised as a measure of how well the service level that
is provided matches that which customers expect to be provided (Lewis & Booms, 1983).
Delivering quality service therefore means conforming to customer expectations on a
consistent basis. Extensive research on the characteristics and quality of organizational
effectiveness has been conducted from the perspective of an organization’s external
customers (Fisk, Brown & Bitner, 1993; Parasuraman, Zeithaml & Berry, 1988; Taylor,

18
1994). Measuring service quality has been examined noting that the most widely used
instrument being SERVQUAL (Parasuraman, Zeithaml & Berry, 1988), that has identified
five dimensions as factors in the measurement of service quality: tangibles, responsiveness,
assurance, reliability and empathy. However, there is debate regarding the usefulness of
SERVQUAL to appropriately measure service quality. While there have been studies
examining internal service quality, much less has been investigated about service quality
from an internal customer perspective. Most studies attempting to measure internal service
quality used the SERVQUAL methodology (e.g. Brooks, Lings & Botschen, 1999;
Edvardsson, Larsson, & Settlind, 1997; Kang, James & Alexandris, 2002; Reynoso &
Moores 1995; Young & Varble, 1997) and assume that external service quality dimensions
are applicable in internal service chains. The next section examines justification for the
research undertaken is this thesis.
1.3 Research Justification
Australian expenditure on healthcare represents approximately 8.5% of gross domestic
product (Deeble, 1999) and about 14% of gross domestic product in the United States
(Levit, Sensenig, Cowan et al., 1994; Swineheart & Smith, 2005)). The sheer economic
force of the healthcare sector, its expected growth due to the aging of the population, and
the acceleration of government spending have stimulated an interest in quality as a way to
control costs and increase access to care (Thomasma, 1996; Deeble, 1999).
The concept of quality in healthcare continues to develop as various provider, patient and
client, governmental, and insurance groups maintain an interest in how to ‘improve’ the
quality of healthcare service management and delivery. In the 1980s, Donabedian (1980)
declared that quality in healthcare would become a blend of clinical, professional, and
consumer input, with the user perspective becoming dominant. Friedman (1995) suggested
that quality would become the most prominent healthcare consumer issue. The movement
toward management of consumer perceptions of healthcare quality is important for the
following reasons. First, evaluations of quality are related to satisfaction and service reuse
intent (e.g. Bowers, Swan, & Koehler, 1994; Nelson, Batalden, Mohr, & Plume, 1998;
O’Connor, 1992; Taylor & Baker, 1994); compliance with advice and treatment regimens
(Curry, Stark, & Summerhill, 1999; Wartman, Morlock, Malitz, & Palm, 1983), fewer

19
complaints and lawsuits (Brown, Bronkesh, Nelson, & Wood, 1993) and better health
outcomes (Elbeck, 1987; Kaplan, 1989). Second, quality improvement methods require the
identification and meeting of patient expectations (Huq & Martin, 2000; Jun, Petersen &
Zsidisin, 1998), and third, positive perceptions of quality have favourable impact on financial
performance in healthcare organizations (Chang & Chen, 1998; Nelson, Rust, Zahorick, Rose,
Batalden & Siemanski, 1992; Press, Ganey, & Malone, 1991).
This trend towards a more consumer-oriented evaluation of healthcare, away from the
traditional expert driven approaches, is consistent with the marketing philosophy of consumer
sovereignty. The use of marketing theories, models and measures in this thesis capitalizes on
this trend and assists in developing a deeper consumer based understanding of the issue of
healthcare service quality.
As healthcare and the hospital sector in particular are mainly concerned with the provision
of services rather than physical goods, the application of marketing concepts in general and
services marketing to healthcare is appropriate. In the healthcare field, measuring quality of
care has traditionally relied on the structure-process-outcome framework developed by
Donabedian (1980). In this paradigm, structure refers to the characteristics of the resources in
the health care delivery system, including the attributes of professionals (such as age and
specialty) and of facilities (such as location, ownership, and patient loads). Process
encompasses what is done to and for the patient and can include practice guidelines as well as
aspects of how patients seek to obtain care. Outcomes are the end results of care. They include
the health status, functional status, mental status, and general well being of patients and
populations.
However, healthcare organizations are able to gain insights in service evaluation processes
by reference to the extensive services quality literature in marketing. A number of
researchers have made contributions to understanding of customer perceptions of service
quality in healthcare applications (e.g. Carman, 2000; Curry, Stark & Summerhill, 1999;
Jun, Peterson & Zsidisin, 1998; Kang, James & Alexandris, 2002; O’Connor, Trinh &
Shewchuk, 2000). The strategic importance of service quality is evident in the healthcare
industry. The literature suggests that sustainable competitive advantage for service
organizations, such as those in the healthcare industry, is best attained through service quality

20
and satisfaction as perceived by customers (e.g. Cronin & Taylor, 1992; Taylor, 1994; Quinn,
1992; Zeithaml, 2000). Hospital administrators are recognising that patient perception of
service quality will influence service provider choice (Brand, Cronin & Routledge; Swineheart
& Smith, 2005; Woodside, Frey & Daly, 1989). While these issues may appear to be only
relevant in private healthcare situations, the public sector also recognises the importance of
service quality. Service quality is seen as a means to reduce costs and to more efficiently
deliver service in resource constrained environments (Deeble, 1999). Politicians may also see
it as a means to reduce political costs of perceived lack of service quality in public healthcare
systems.
1.4 Gaps in the Literature
This research attempts to address a number of gaps in the literature. Firstly, much of the
service quality literature and the measurement of service quality have focused on external
customers. While a number of studies have been undertaken addressing internal service
quality (e.g. Brooks, Lings, & Botschen, 1999; Edvardsson, Larsson, & Settlind, 1997;
Kang, James, & Alexandris, 2002; Reynoso & Moores, 1995; Young & Varble, 1997), they
have tended to use the SERVQUAL approach to service quality evaluation uncritically or
with minimal adaptation. The research takes these assumptions of SERVQUAL for granted
rather than establish the applicability of SERVQUAL dimensions in internal service chains.
Secondly, current conceptualisations of internal marketing have not differentiated between
different types of internal customers that may exist within an organization and their
differing internal service expectations. While each of the common major disciplinary
groups within a typical Australian public hospital interact with patients and provide value
to service encounters, the internal network interactions between and within groups also
have a significant impact on the ultimate value patients receive. The existence of these
interactions implies that, potentially, there may exist different emphases on the dimensions
of service quality that are used by internal service providers to evaluate service quality
provided by other parts of the network in value creation. However, the literature does not
address how these dimensions might differ.
21
Finally, one of the inconsistencies in the literature is the relative importance of service
quality dimensions. Studies in different industries and even within industries have varied in
perceived importance of dimensions (e.g. Dean, 1999; Parasuraman, Zeithaml & Berry;
1988; Sachdev & Verma, 2004). There is little in the literature relating this issue to
healthcare and internal service value chains.
These gaps in the literature have led to three research questions concerning the applicability
of established external service quality dimensions to internal service quality value chains.
Some researchers have proposed that the dimensions are readily transferable (e.g. Brady &
Cronin, 2001; Parasuraman, Zeithaml & Berry, 1988), and have supported this to some
extent, through the use of the SERVQUAL method of service quality measurement, albeit
with modification (e.g. Jun, Peterson, & Zsidisin, 1998; Kang, James & Alexandris, 2002).
Studies generally have not investigated the existence of other dimensions or the salience of
dimensions.
RQ1 What are the dimensions used to evaluate service quality in internal healthcare
service networks?
RQ2 How do dimensions used in service quality evaluation in internal healthcare
networks differ from those used in external quality evaluations?
RQ3 How do different groups within internal service networks in the healthcare
sector evaluate service quality?
1.5 Methodology
This research is both exploratory and explanatory in nature comprising two studies. Study 1
is exploratory in that it seeks to identify service quality dimensions used in internal
healthcare service network value chains through qualitative in-depth interviews. Within the
context of these interviews, the relationships between and amongst staff groups and their
potential impact on evaluations of service quality and performance were also explored.
Study 2 of the research is explanatory in nature as it takes the dimensions identified and
seeks to confirm these through quantitative research and analysis.

22
The literature provides limited understanding of identifying internal service quality
dimensions. Research designs tend to be based on previously identified external dimensions
and, in the process, have not added significantly to understanding of the dimensions
relevant to this study. This apparent reliance on particular concepts of service quality has
led to a general acceptance of essentially five service quality dimensions (Parasuraman,
Zeithaml & Berry, 1988). However, there appear to be problems with this approach. Rather
than to repeat previous studies and accept assumptions relating to these five factors, this
research seeks to identify internal service quality dimensions and relate them to the external
service quality dimensions identified in the literature. This means that a research design
specific to this study is required.
With methodology driven by the research problem (Hair, Bush & Ortinau, 2003; Neuman,
2003), the research questions of this thesis relating to “how, why” questions are best
answered with qualitative methods and “who, what” questions are best answered by using
the survey method for data collection (Yin 1994). This mix of methods is designed to
provide a richness of data as themes are explored through qualitative methods that can be
confirmed through quantitative methods (Deshpande, 1983).
There are two studies in this research. The first (Study 1) comprises 28 depth interviews
held in a major acute care hospital in the Brisbane metropolitan area. Representatives of
four strata of health workers (Allied Health, Corporate Services, Nursing, and Medical)
provided data relating to dimensions used to evaluate internal service quality within the
hospital service value chain, the nature of relationships and how they might affect
evaluations of internal service quality.
Based on the results of Study 1 and with reference to the literature, a questionnaire was
developed for Study 2. A pre-test study of 45 respondents was conducted in another
hospital to avoid contamination. The pre-test study tested the questionnaire and allowed
any changes to be made prior to administration in Study 2. Study 2 comprised distribution
of the questionnaire to 500 staff representing the four strata in the same hospital where the
interviews were conducted. An overall response rate of 56% was achieved with no stratum
with less than 50% response. Reliability of the scales was confirmed through calculation of
co-efficient alpha for each section of the questionnaire and the factors identified through

23
factor analysis. The data was analysed using SPSS Software. Factors were identified using
factor analysis and hypotheses tested using ANOVA. The importance rankings of attributes,
expectations and perceptions of internal service quality dimensions were also examined.
1.6 Thesis Structure
This thesis comprises six chapters, appendices, and bibliography. Chapter 1 summarizes the
thesis and provides a rationale for the research. It outlines the key research into service
quality and the extension of external service quality dimensions to internal service quality
evaluation. Chapter 1 also discusses gaps in the literature and the research questions
addressed in this thesis. The research methodology is outlined and key contributions are
outlined.
Chapter 2 is concerned with the extant service quality literature derived primarily from the
marketing discipline and its application in internal environments generally and healthcare
specifically. Chapter 2 begins with a discussion of the nature of service delivery and the
internal service environment. This encompasses notions of internal marketing, internal
networks, and internal marketing channels to explain the nature of relationships within an
organization and to provide a framework to explain the provision of service and to discuss
relationships in service channels. Next, service quality is defined and research orientations
for service quality and factors affecting service quality discussed. The service quality
measurement literature is summarised and application of external service quality
dimensions to internal service quality measurement is examined. Approaches to quality
measurement in healthcare and the transferability of quality measures from the marketing
discipline are then discussed. Finally, three research questions and six research propositions
are articulated.
This research was undertaken in two studies and reported in Chapters 4 and 5. The research
methodology was guided by the extant services marketing and quality literature at the time
of initial data collection.
Chapter 3 discusses the methodology to be used for Study 1 to examine the research
question. Study 1 is an exploratory study using depth interviews to develop understanding

24
of the attributes and dimensions used by hospital workers within an internal service value
chain to evaluate the quality of service provided by others within the internal service chain.
The nature of relationships within the internal service chain is also explored. Study 2 is
explanatory in nature as it takes the dimensions identified in Study 1 and seeks to confirm
these through quantitative research and analysis. The methodology to test hypotheses,
identify factors and the basis for analysis of data is presented. Data was collected through a
questionnaire distributed to four strata in a public hospital.
Chapter 4 reports the findings of Study 1. Twelve attributes are derived from an initial list
of 33. Results are compared and contrasted to the literature to identify attributes used in
internal service quality. The results presented are related to previous studies and used as the
basis for Study 2. Four hypotheses are developed for testing and examination in Study 2.
Chapter 5 presents the results of Study 2. Internal service quality factors are identified,
attributes ranked by importance, expectations and perceptions of four strata of health
workers examined, and hypotheses tested. The results are presented and compared with
previous studies.
Chapter 6 discusses these findings in light of the research questions and hypotheses and the
literature in general. The Chapter identifies issues relating to the transfer of external service
quality dimensions to internal service quality measurement. The internal service quality
dimensions identified in this study are discussed. The multi-level and multi-dimensional
nature of internal service quality is identified. Managerial implications, limitations of this
research and future research directions are also discussed.
1.7 Key Findings and Contributions
Based on the two studies, one qualitative and the other quantitative, the findings of this
research partially support the general extension of external service quality dimensions to
internal service chains. Twelve dimensions identified in Study 1 through in-depth
interviews gave richness in understanding of internal service quality dimensions. These
dimensions generally reflect those found in previous studies. Factor analysis established
four dimensions used in service evaluations in internal service chains: responsiveness,

25
reliability, tangibles, and equity. While the dimensions of tangibles, reliability, and
responsiveness suggest the transferability of these factors to all service environments, this
research study finds that these dimensions provide only a partial evaluation of internal
service quality while the fourth, equity, is also a specific quality dimension that should be
accounted for.
Contributions of this research are:
1. Confirmation of the partial transferability of key external quality dimensions to
internal service chains. The multidimensional nature of internal service quality is
confirmed. There is also suggestion that internal service quality is multilevel in
nature in the way service quality is perceived. This research establishes that
traditional external service dimensions may be modifiers of other factors rather than
being direct determinants as presented in previous research.
2. Identification of equity (perceived fairness in interrelationships and interactions) as
an important factor in the evaluation of quality in an internal service quality chain.
Although identified in the organizational behaviour literature as a factor in
employee relationships, equity in internal service encounters has not been directly
considered in previous research of internal service quality. This is the first time that
equity has been identified as a specific service quality dimension rather than
generally as an antecedent to satisfaction.
3. Identification of differences in perceptions of dimensions used by the four strata to
evaluate others compared to perceptions of those used in evaluations by others.
4. Identification of the triadic nature of internal healthcare service delivery on quality
evaluations. That is, rather than traditional dyadic evaluations between the service
receiver and provider, a third party also becomes part of the evaluation process.
Therefore, internal healthcare service quality is seen through perceptions of what
has transpired for the evaluator and also the third party, who is usually the patient.
5. Confirmation of difficulties held by people to evaluate the technical quality of work
performed by those outside their area of expertise.
6. Identification of differences between groups in an internal healthcare service value
chain of expectations of service delivery and quality.
1.8 Summary

26
Internal service quality is an important issue for organizations as improvements can
positively affect external service delivery. Large sums are spent each year in attempts to
improve service quality. There is a need to investigate measures of internal service
quality and the applicability of external service quality dimensions in internal service
value chains. This is particularly relevant in the healthcare sector.
In summary, this chapter has outlined the purpose of this research, identified the
research questions, and outlined the research methodology to investigate the research
questions. This research was undertaken in two studies. Study 1 was a qualitative study
involving depth interviews of staff at a major metropolitan hospital; Study 2 was a
quantitative study of staff of the same hospital (who had not participated in Study 1) to
collect data through a questionnaire. This chapter also outlined the structure of the
thesis and presents key findings and contributions of this research. Chapter 2 follows
and is concerned with the extant service quality literature derived primarily from the
marketing discipline and its application in internal service environments generally and
healthcare specifically.

27
2.0 Internal Service Quality in Healthcare 2.1 Introduction
While there are many disciplines that investigate the issue of service quality,
marketing is considered the best match for this research for three reasons: first,
marketing is based on the central importance of the needs of the client in guiding
organizational activities; second, Services Marketing is a strong and well established
area within marketing and provides important frameworks and concepts that are
valuable in understanding the nature of the service product and understanding the
service product is critical to understanding the nature of service quality; and third,
service quality models developed within the services marketing discipline are
commonly used across disciplines and in particular healthcare.
The theoretical basis for the application of marketing theories and concepts to the
healthcare industry has its foundation in the broadening of the concept of marketing
(Kotler & Levy, 1969a; Kotler, 1972a) which came out of the debate that took place in
the 1970's on the broadening the conceptual domains of the marketing discipline (e.g.
Barksdale & Darden, 1971; Bell & Emory, 1971; Enis, 1981; Kotler, 1972 a, b; Kotler
& Levy, 1969 a, b; Kotler & Zaltman, 1971; Luck, 1969; McNamara, 1972; Stidsen &
Schutte, 1972; Zaltman & Vertinsky, 1971). The marketing concept suggests that the
key to achieving organizational goals consists of determining the needs and wants of
target markets and delivering the desired satisfactions more effectively and efficiently
than competitors (Kotler, 2000).
As healthcare and the hospital sector in particular are mainly concerned with the
provisions of services rather than physical goods, this chapter introduces the
conceptual framework used to understand the nature of services and the basic service
model, and examines the application of marketing concepts to internal healthcare
environments. The concept of internal marketing and the role of internal networks are
addressed to illustrate their role in organisational service quality. The nature and scope
of service quality, the application of external service quality dimensions to internal
environments, and healthcare quality are discussed to establish that further research is

28
required to develop understanding of the nature of internal service quality dimensions.
Directions for research that were examined by the studies undertaken in this thesis are
discussed, and the research questions and research propositions underpinning these
studies rare identified.
Application of quality management practices by providers of physical products and
services has become widespread. Understanding differences between physical
products and services through the dimensions of intangibility, inseparability,
perishability, and heterogeneity (Zeithaml, Parasuraman, & Berry, 1985) has enabled
development of approaches for improving service quality. Healthcare providers have
developed greater interest in perceptions of quality as competition increases in some
sectors; service users consider use of a service in the future; governments enhance
regulatory control and minimise political issues emanating from healthcare. Healthcare
organizations seek cost reduction; decreased employee turnover; enhanced risk
management and reduction in potential for litigation; and to possibly gain better health
outcomes for patients through improvements in service quality.
2.2 Service delivery
Much of the literature discusses the nature of services in terms of how an organisation
develops and delivers services to external customers. The conceptualisation of service
quality has typically focussed on these external relationships. However, recognition
that interactions between employees can improve external quality has led to greater
interest in improving internal relationships through internal marketing (Ballantyne,
1997; Ballantyne, Christopher & Payne, 1995; Gronroos, 2000; Hart, 1995; Heskett,
Jones, Loveman, Sasser & Schlesinger, 1994; Varey, 1995a, b). How service is
organised and delivered through the basic service model provides a framework for
understanding the relationships to be considered in evaluation of internal service
quality.
Section 2.2 provides an overall framework for understanding the nature of service
delivery. This is then extended to the internal environment. The relationships that
impact on internal service delivery are discussed and an internal delivery channel
29
conceptualised through an internal service value chain. Section 2.3 then discusses the
nature of service quality.
2.2.1 Basic service model
Internal service encounters take place within organizational structures and
interpersonal interactions. This section discusses the basic service model to provide
understanding of the framework in which services are delivered and how they may
impact on evaluations of internal service quality.
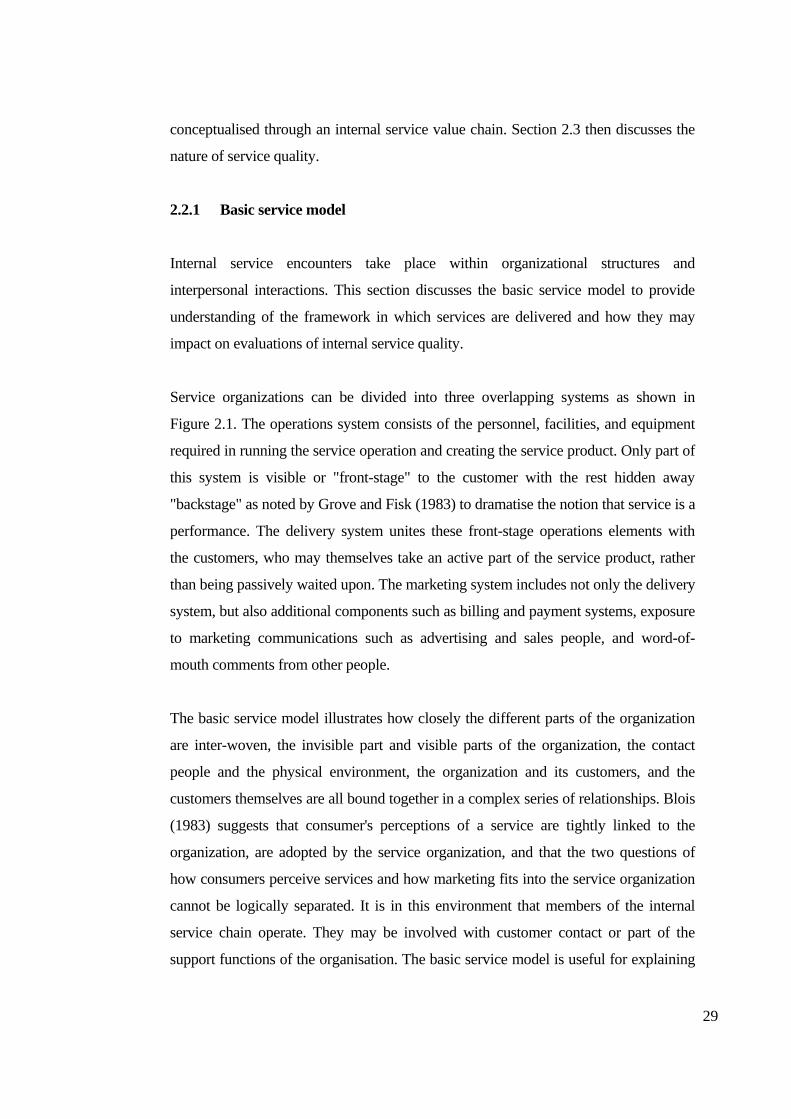
Service organizations can be divided into three overlapping systems as shown in
Figure 2.1. The operations system consists of the personnel, facilities, and equipment
required in running the service operation and creating the service product. Only part of
this system is visible or "front-stage" to the customer with the rest hidden away
"backstage" as noted by Grove and Fisk (1983) to dramatise the notion that service is a
performance. The delivery system unites these front-stage operations elements with
the customers, who may themselves take an active part of the service product, rather
than being passively waited upon. The marketing system includes not only the delivery
system, but also additional components such as billing and payment systems, exposure
to marketing communications such as advertising and sales people, and word-of-
mouth comments from other people.
The basic service model illustrates how closely the different parts of the organization
are inter-woven, the invisible part and visible parts of the organization, the contact
people and the physical environment, the organization and its customers, and the
customers themselves are all bound together in a complex series of relationships. Blois
(1983) suggests that consumer's perceptions of a service are tightly linked to the
organization, are adopted by the service organization, and that the two questions of
how consumers perceive services and how marketing fits into the service organization
cannot be logically separated. It is in this environment that members of the internal
service chain operate. They may be involved with customer contact or part of the
support functions of the organisation. The basic service model is useful for explaining

30
the relationships that may exist in the internal service chain of a healthcare
environment.
Figure 2.1 Basic Service Model Operations System Service Delivery System Marketing System Backstage Front Stage
Adapted from Eiglier and Langeard (1977) and Lovelock (1992)
2.2.2 Internal marketing
Two basic ideas underlie the concept of internal marketing: namely that everyone in
the organization has a customer; and that internal customers must sold on the service
and be happy in their jobs, before they can effectively serve the final customer (Fisk,
Brown & Bitner, 1993). This means that marketing tools and concepts might be used
just as effectively with employees as internal customers. This has implications for
employees understanding their roles and the mission of the organization in the carrying
Advertising
Sales calls
Correspondence and phone calls
Random exposure to facilities and vehicles
Chance encounters with service providers
Word of Mouth
Market research
Inanimate Environment Invisible Organization and System Contact
Personnel Invisible Visible
Customer A
Customer B
Bundle of Service Benefits Received by Customer A

31
out of activities and can impact on the interactions between areas of the organization
and thus impact on perceptions of internal service quality.
Internal marketing is a management philosophy suggesting that management should create,
continuously encourage, and enhance an understanding of and an appreciation for the roles
of the employees in the organization. Internal marketing has been described as a holistic
management process (George, 1990). This process integrates the multiple functions of the
organization by ensuring that all employees understand and experience the business and its
activities in an environment that supports customer consciousness, and ensuring that all
employees are prepared and motivated to act in a service oriented manner (Gronroos,
2000). Therefore, for a service organization, internal marketing would be a means to
facilitate understanding of customer expectations and employee roles in delivering service
quality. It would also be expected to play a role in defining internal organisation activities
that in turn impact on relationships within different parts of the organisation and thereby
affect evaluations of internal service quality.
Internal marketing focuses on achieving effective internal exchanges between the
organization and its employee groups as a prerequisite for successful exchanges with
external markets (Ballantyne, 1997; Ballantyne, Christopher & Payne, 1995; George,
1990; Hart, 1995; Heskett, Jones, Loveman, Sasser & Schlesinger, 1994; Varey, 1995a, b).
This enhances and ensures speed and relevance of response to factors that constrain,
influence, or determine the actions and achievable objectives of the organization. The
application of internal marketing concepts in an internal healthcare service chain could
therefore be seen as a means to improve service delivery and quality, firstly within the
chain, and secondly, to external customers of the internal chain and organisation.
Internal marketing encourages the view that marketing is a process that involves the whole
organization as the means by which a match is continuously maintained between its
offerings and its customers’ needs (Gronroos, 2000). Marketing processes are the core
activity of the service provider and responsibility for them crosses functional divides
(Payne, 1988). The objective of internal marketing is therefore to create, maintain and
enhance internal relationships between people in the organization across so that they feel
motivated to provide services to internal customers as well as to external customers

32
(Gronroos, 2001). In terms of how this might be achieved, various authors have argued
that multi-disciplined self-managing work teams provide the most suitable organization
structure to deliver improved quality, responsiveness and customer focus by ensuring
ownership and involvement at all levels (Chaudrey-Lawton, Lawton, Murphy & Terry,
1992; Tjosvold, 1992; Wellins, Byham & Wilson, 1991). However, having a structure is
only part of the process to ensure service quality.
A key weakness in these conceptualisations of internal marketing is that while they focus
on internal customers and suppliers, they do not differentiate between the different types
of internal customers that may exist in the organization or their differing internal service
expectations. This means that internal marketing efforts attempting to increase internal
service quality would not segment internal customers within the organisation, but would
be undifferentiated and aimed at all internal customer service groups. To determine the
appropriateness of a segmented approach, there is a need to explore service expectations
of different internal customer groups within the internal environment and identify any
differences between these groups.
The literature is limited in providing guidelines for the implementation of an internal
marketing perspective. Piercy and Morgan (1991) emphasise the managerial and
behavioural themes identified in the internal marketing literature and recommend
formulating marketing plans which apply external (4Ps) marketing techniques to internal
(employee) markets. However, the practicality of implementing such an approach is
doubtful given the potential for conflict if collaboration between internal departments is
ignored. As Rafiq and Ahmed (1995) suggest, the ad hoc transfer of marketing concepts to
an internal context is unlikely to produce results until precise means of operationalisation
are provided. This operationalisation may help overcome problems arising from the lack
of a widespread understanding of internal marketing among managers (Varey & Lewis,
1999). However, despite the interest in and perceived benefits of internal marketing, very
few organizations actually apply the concept in practice (Rafiq & Ahmed, 2000).
Ballantyne (1997) provides an implementation case study that illustrates how dominant
internal marketing modes connect in a complementary way as a relationship development
process. He also identifies how internal networks enable the discovery of new knowledge
33
and transfer this knowledge to the host organization. However, the case study involved a
change process and could be seen as a series of transactional relationships rather than
continuous relationships given the prior relationships and networks were effective until
organizational factors disrupted them. The development and management of internal
networks may facilitate effective internal marketing.
If the focus of internal marketing is achieving effective internal exchanges between the
organization and its employee groups (Barnes, Fox & Morris, 2004; Ballantyne,
Christopher & Payne, 1995; Heskett, Jones, Loveman, Sasser & Schlesinger, 1994;
Varey, 1995a, b) as well as between internal employee groups, then the quality of
interactions within the internal network of groups is enhanced by internal marketing.
The following section examines the nature of internal networks and how they can
provide a framework for diverse areas of an organization such as a hospital to deliver
internal service.
2.2.3 Internal networks All organizations are internal networks and they all participate in external exchange
networks. While every organization embodies an internal network of authority, functions,
communications, and exchanges, there is a difference between a network organization and
a network of organizations or relationships. Achrol (1997) suggests that the mere presence
of a network of ties is not a distinguishing feature of the network organization, but rather
the quality of the relationships and the shared values that govern them differentiate and
define boundaries of the network organization. These relationships are characterised by
non-hierarchical, long-term commitments, multiple roles and responsibilities, mutuality,
and affiliational sentiments. A network organization can therefore be defined as follows:
A network organization is distinguished from a simple network of exchange
linkages by the density, multiplexity, and reciprocity of ties and a shared value
system defining membership roles and responsibilities.
(Achrol, 1997)
Achrol’s definition (1997) is helpful in understanding the nature of relationships in a
healthcare organisation such as a hospital. Achrol and Kotler (1999) expand this
34
definition to describe a network organization as an independent coalition of task or skill
specialised economic entities (which may be independent firms or autonomous
organizational units) operating without hierarchical control. Dense lateral connections,
mutuality, and reciprocity embed this coalition in a shared value system that defines
membership and responsibilities. Four types of organizational networks that demonstrate
such dense ties and affiliational cultures are internal market networks, vertical market
networks, intermarket networks, and opportunity networks (Achrol, 1997).
Achrol (1997) defines an internal market network as a firm organised into internal
enterprise units that operate as independent profit centres buying from, selling to, or
investing in other internal and external units as best serves their needs based on market
terms of trade subject to organization policy. A vertical market network is the
organization set of direct supply or distribution relationships organised around a focal
organization best positioned to manage and lead network participants in a particular
market (Coughlan, Anderson, Stern, & El-Ansary, 2001; Rosenbloom, 2004). An
intermarket network is institutionalised affiliations among firms operating in different
industries and the firms linked in vertical exchange relationships with them, characterised
by dense interconnections in resource sharing, strategic decision making, culture and
identity, and periodic patterns of collective action (Achrol, 1997; Rosenbloom, 2004). An
opportunity network is a set of firms specialising in various products, technologies, or
services that assemble, disassemble, and reassemble in temporary alignments around
particular projects or problems (Achrol, 1997).
While these networks have been described in commercial applications, the
conceptualisation of these networks may be extended to healthcare in general and
hospitals in particular. Internal networks are manifest in most large hospital structures
with process teams or autonomous units created to provide structure to service delivery.
Vertical networks help maximise productivity and resource allocations in healthcare
systems as hospitals and clinics create partnerships among independent skill-specialised
departments/centres. Intermarket networks may have less practical application but it is
possible for hospitals and other healthcare organizations to be part of an intermarket
network such as in interactions with medical and non-medical suppliers. This may also
extend to relationships with media and sponsors assisting with fundraising and program
35
publicity. Health care providers, by virtue of the specialised nature of service offerings
may find opportunity networks appropriate means of being able to meet demand or
facilitate service delivery.
Network theory is readily transferable to healthcare environments and forms a useful
means to describe relationships and structures to enable transfer of value. However, this
thesis will focus on networks within hospitals that are more readily characterised by
internal market networks. These reflect the service value chains that provide services to
each other and patients in service delivery processes.
Every time employees interact as part of an internal service network a service encounter
occurs (Shostack, 1984a). Service relationships are built on these encounters as each
encounter tests the organization's or internal network's ability to keep its promises. Each
encounter contributes to the external customer's overall satisfaction and willingness to
continue dealing with the organization (Bitner, 1990; Bitner, Booms & Tetreault, 1990;
Brand, Cronin & Routledge, 1997; Woodside, Frey & Daly, 1989). From the
organization's perspective, each encounter presents an opportunity to prove its potential as
a quality service provider, to build trust, and to build customer loyalty. On the other hand,
the converse is also true. Each encounter presents the possibility of reducing perceptions
of quality, destroying trust, and decreasing customer loyalty. These relationships are
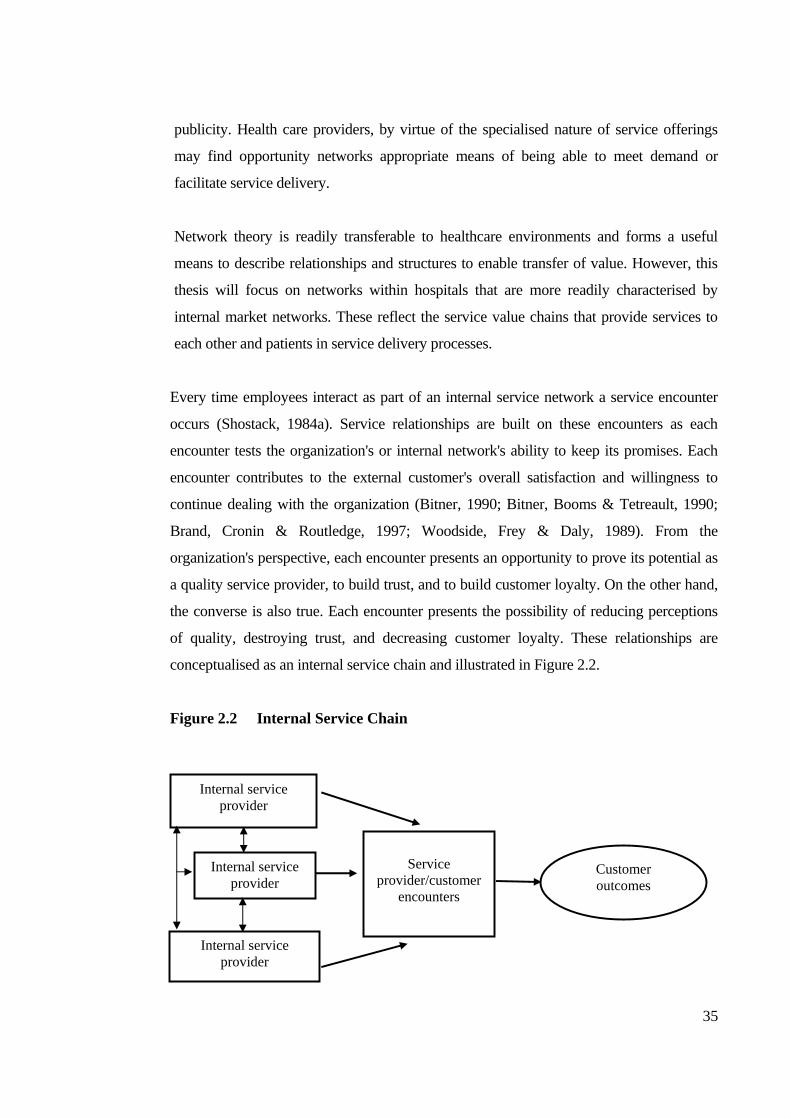
conceptualised as an internal service chain and illustrated in Figure 2.2.
Figure 2.2 Internal Service Chain
Internal service provider
Service
provider/customer encounters
Customer outcomes
Internal service provider
Internal service provider

36
Through a series of positive encounters, a client develops a sense of trust in the
organization that evolves with growing relationship commitment (Morgan & Hunt, 1994).
A series of negative events will have the opposite effect. On the other hand, a random
combination of positive and negative interactions will leave the customer feeling unsure of
the relationship, and doubtful of its consistency (Bitner, Booms & Tetreault, 1990;
Gronroos, 2000). In healthcare, for example, from an external perspective, a patient
visiting a doctor in a hospital could have a poor encounter with the appointment
scheduling on the phone, a very positive encounter with the nurse, a satisfactory encounter
with technicians (e.g. pathology, radiology), and a satisfactory encounter with the doctor.
This mixture of experiences will leave the patient wondering about the overall quality of
the organization and unsure of what to expect on the next visit (Bitner, 1990; 1995).
Extending this to an internal perspective, trust in the ability of other employees can be
affected by inconsistent performance which, in turn, can affect overall internal
performance.
The consistency (or inconsistency) of encounters in the series thus builds toward a
composite image of the organization and can add or detract from the potential for
relationship continuation (Hennig-Thurau, Gwinner & Gremler 2002; Morgan & Hunt,
1994; Olsen & Johnson, 2003). By comparison, within an organization, employees are
part of an internal network of relationships where encounters are more continuous by
nature and perceptions of quality and performance are developed over time and so
expectations are built (either favourable or not) on the level of service for further
service encounters with elements of the internal service network (Gittell, 2002; Olsen &
Johnson, 2003).
Under the exchange paradigm that underpins traditional marketing theory and practice,
the focus of evaluation of networks has been on the instrumental processes – i.e. how to
maximise cooperation and minimise conflict. Variables highlighted have included
cooperation, conflict, and opportunism (Gittell, 2002). However, the network paradigm
focuses on the relational paradigm, or in other words, how to develop mutually
reinforcing, long-term relationships (Achrol, 1997). The key variables in network cultures
are trust and social norms of behaviour (Morgan & Hunt, 1994). These aspects are of

37
interest in this thesis with the relationships that are formed in internal networks through
interactions between workers. Relationship quality is influenced by interactive quality
(Svensson, 2004) and emotion (Edvardsson, 2005; Wong, 2004) and contributes to the
effectiveness of networks that would provide the processes for service delivery through
internal marketing channels.
2.2.4 Conceptualising internal service marketing channels
A key element of the marketing process is the distribution of products that are
produced to the customer through marketing channels. A marketing channel is usually
defined as the external contractual organization that management operates to achieve
its distribution objectives (Rosenbloom, 2004). This definition specifically notes that a
marketing channel is outside the organization and not part of the internal
organizational structure. The focus is on the external customer. This conceptualisation
of marketing channels and focus on external customers hinders the transfer of
marketing channel concepts to internal service environments. The integration of the
customer into the service process and the need for direct contact between the service
provider and customer for service delivery influence the nature of the channel used for
service distribution and deliver. With service delivery a key service channel activity,
the conceptualisation of a marketing channel for internal service delivery can help
understanding of the channel relationships that impact on evaluations of internal
service quality. Some writers (e.g. Swineheart & Smith, 2005) have used traditional
marketing terms by referring to an ‘internal supply chain’ to indicate the flow of goods,
services and/or information that, while useful, do not fully capture the nature of
internal service channels. Therefore, with marketing forming the basis of this
investigation of internal service quality in healthcare, it is important to have a basis on
which to see relationships and conceptualise how service is delivered within the
organisation through a marketing channel of distribution.
The nature of services (intangibility, heterogeneity, inseparability and perishability) has
made it difficult to conceptualise marketing channels in a service environment. When the
customer and the service provider are involved in the simultaneous production and
consumption of the service, problems arise in defining the various elements within the
38
channel. In effect, the customer becomes an integral part of the channel resulting in a short
channel (Dant, Lumpkin & Rawwas, 1998; Rosenbloom, 2004). That is, the service
provider deals directly with the service user. This would generally be the case in an
internal service encounter. On the other hand, service providers also usually have external
suppliers providing goods and services that enable them to provide services to their
customers. These suppliers form part of a channel in which the service provider is a
customer. In this situation, more conventional channel management concepts can be
applied with relationships being at a business-to-business level (Rosenbloom, 2004).
However, a better conceptualisation of service channels can be derived by viewing a
service organization as comprising a number of elements both visible and invisible to the
customer that, in performing allotted activities, act in similar roles to conventional channel
members by adding value in a chain. This was illustrated in the basic service model in
Figure 2.1 and the service chain in Figure 2.2. For example, in a hospital, the various
departments/functions perform tasks that in isolation provide some benefits, but when
linked they lead to interventions that are designed to provide positive outcomes in patient
care.
The concept of a value chain was popularised by Porter (1985) who suggested that firms
be broken down into strategically relevant activities to better understand the behaviour of
costs and the existing and potential sources of differentiation. Value is the amount buyers
are willing to pay for what a company provides and is measured by total revenue (Porter,
1985). Creating value for buyers that exceeds the cost of doing so thus becomes the basis
of any generic strategy. Competitive position is then determined by value instead of cost.
The value chain of all activities determines total value for the firm. These activities are not
a collection of independent activities, but a system of interdependent activities linked
together. The value chain displays total value and consists of value activities and margin.
Value activities are the physically and technologically distinct activities performed by an
organization. Margin is the difference between total value and the collective cost of
performing the value activities (Porter, 1985). The value chain is illustrated in Figure 2.3.
Porter (1985) described the formation of a channel value chain through linkages between
the value chains of channel members. These linkages provide opportunities for

39
competitive advantage and are similar to organization linkages. The channels have value
chains that an organization's product passes through to get to the end user. Coordinating
and jointly optimising within channels can lower costs or enhance differentiation thus
creating competitive advantage.
Figure 2.3 Porter’s Generic Value Chain (1985)
Support MARGIN
Activities
MARGIN
MARGIN
Primary Activities
Although the original value chain model is set in the context of a traditional manufacturing
firm, Porter (1985) does suggest its use in services. In his service example, Porter
abandons the manufacturing model with the primary and support activity divide and
concentrates on the steps in service delivery and cost drivers. Various authors have
examined aspects of services based on Porter’s model (1985). For example, Armistead and
Clark (1993) examined adaption of the original model to emphasise the operational
context to produce a framework for considering service delivery to meet strategic
objectives, while Heskett, Jones, Loveman, Sasser and Schlesinger (1994) propose that the
service profit chain (based on the value chain) puts hard values on soft measures, relating
profitability, customer loyalty, and customer satisfaction to the value of services created
by satisfied, loyal and productive employees. Lings (2000) suggestion that potentially
there are two internal markets within an organization also assists with the
conceptualisation of an internal service value chain. These two markets are the direct
internal market that covers interactions between adjacent departments in the value chain,
Firm Infrastructure
Human Resource Management
Technology Development
Procurement
Inbound Operations Outbound Marketing Service Logistics Logistics & Sales

40
and the indirect internal market between support departments and supply departments in
the value chain. Bruhn and Georgi (2006) also use Porter’s value chain concept to derive
the processes of a service company that lead to value and integrate them into a service
value chain.
Using a service value chain to describe an internal service marketing channel differs from
Porter's value chain conceptualisation in that it treats the delivery of value as only one step
in the value generation process, rather than treating marketing as Porter does as only one
step in the value delivery process. Instead of value being the outcome of the chain as
described by Porter (1985) and Heskett, Jones, Loveman, Sasser and Schlesinger (1994), a
service value chain uses value as the focus for each link in a series of internal service
encounters that enables the organization to maximise outcomes. The activity patterns of
internal customers represent the links in the internal service value chain.
Internal customers and internal suppliers within a hospital each supply the other and are
invisibly connected in terms of the input-output links in the value chain. These links are
formed through the internal network of staff relationships that emerge from health service
process design in the organizational system. It can therefore be conceptualised that internal
networks provide a framework for health service value delivery.
As there are a number of disciplines/areas that interact to meet the needs of
patients/internal networks, it is appropriate to use a value chain to describe internal service
channels in hospitals. Individually, workers may have some impact on patients, but greater
value is provided through synergy of services provided by other areas. For example, while
a doctor may ultimately have responsibility for a patient, the doctor depends on services
provided by nurses, non-clinical workers, and perhaps allied health in order to meet all the
needs of patients. Each worker involved is part of the chain providing value to each other,
which in turn impacts on patient outcomes.
Thus, it can be argued that relationships among channel members who provide the links in
the service value chain impact on the creation of value and overall service quality. The
service value chain becomes a framework for conceptualising the service channel within
an organization as workers from various areas interact to provide ultimate value to the end

41
user. Adapting Porter’s value chain model, Heskett et al.’s service value chain and
Gronroos’ service system model (Porter, 1985; Gronroos, 1990a; Heskett, Jones, Loveman,
Sasser & Schlesinger, 1994), a model of a Hospital Internal Service Chain developed for
this thesis is shown in Figure 2.4.
Figure 2.4 Model of a Hospital Internal Service Value Chain
Support Activities Primary Activities Developed from Porter (1985), Gronroos (1990a) & Heskett et al. (1994)
2.2.5 Summary of internal service delivery
The basic service model provides a framework for understanding the basis of internal
service encounters in healthcare. While the model has been primarily designed to
conceptualise the experience of external customers, the principles may be adapted to
internal service environments. This helps understand the service relationships within
an internal healthcare environment such as a hospital. The concepts of internal
marketing help explain the interactions and relationships required if the organization
Systems and operational resources
Physical resources and equipment
Internal service
provider
Service provider/ patient
encounters
Patient outcomes/
value Internal service
provider
Internal service
provider
Technology and Systems
Know-How Systems Support
Managers and Supervisors Management
Function
Support Functions and Support Persons Physical
Support

42
is to have positive service experiences by external customers through the positive
experiences of employees within the organisation. The internal service chain enables
conceptualisation of the internal service delivery channel and the relationships that
may impact on service quality within a hospital. The concepts discussed in Section
2.2 provide a framework for understanding the environment in which members of an
internal healthcare service chain would evaluate the service provided by other
members of that chain and factors in the internal service chain that may influence
those evaluations.
In order to effectively evaluate internal service, an understanding the nature of service
quality is required. The following section discusses issues relating to the definition of
service quality, and how dominant research orientations of service quality while
helping conceptualise and operationalise service quality have created debate that
leaves many questions unanswered about service quality generally, and internal
service quality specifically.
2.3 Service Quality
The role of service quality is recognized as being a critical determinant for the success
of an organization in a competitive environment. Improvements in service quality have
been linked to increased profit margins, lower costs, positive attitudes towards the
service by customers, and willingness of customers to pay price premiums (Halstead,
Casavant & Nixon, 1998; Heskett, Jones, Loveman, Sasser & Schlesinger, 1994;
Zeithaml, 2000). Cronin (2003) suggests that customer perceptions of service quality
for an organisation are intimately linked to internal service quality. This section
examines the nature of service quality, its conceptualisation and definition. The
difficulties in defining service quality and the two dominant major service quality
research orientations are discussed. The following section then examines dimensions
of service quality.

43
2.3.1 Defining service quality
Parasuraman, Zeithaml, and Berry (1985) describe the concept of service quality as elusive
and abstract. While a number of definitions can be found in the physical product literature
(e.g. Crosby, 1979; Garvin, 1983; Hauser & Clausing, 1988), these are not usually
applicable in the service area. This arises primarily from the distinctive characteristics of
services, namely: intangibility, inseparability of production from consumption and
heterogeneity (Zeithaml, Bitner & Gremler, 2006). Klaus (1985) suggests that many
authors have employed a product attribute approach when conceptualising about service
quality, emphasising service performance standards relating to the organization's support
system (backstage) to the detriment of the interface and client systems (front-stage). On the
other hand, consumer satisfaction has become a widely used approach that emphasises the
interface between the organization's contact personnel and consumers, thereby viewing
service quality as an "open system" rather than a "closed system” associated only with the
organization itself (Churchill & Surprenant, 1982; Spreng, Mackenzie, & Olshavsky,
1996).
In operations, service quality is defined as conformance to operating specifications with
performance measures such as waiting times, error rates in transactions, and processing
times used to determine whether the process is in or out of control (Reichheld & Sasser,
1990; Schmenner, 1995; Taylor, 1995).
Service quality means understanding the customer's needs and identifying ways to meet or
exceed them. One definition of quality describes it as the totality of features and
characteristics of a product or service that bear upon its ability to satisfy stated or implied
needs (ISO 8402-1986: Quality- vocabulary). Quality is sometimes equated with customer
satisfaction, or the difference between the customer's perceptions and expectations of a
service transaction (Churchill & Surprenant, 1982; Oliver, 1997; Parasuraman, Zeithaml &
Berry, 1988). This is known as the Expectancy Disconfirmation Model of Satisfaction
(Oliver, 1997).
This expectancy disconfirmation model proposes that there are three determinates of
customer (dis)satisfaction: expectations, perceptions and (dis)confirmation (Gronroos,

44
1984; Parasuraman, Zeithaml & Berry, 1988; Oliver, 1997). Expectations are formed from a
number of factors suggested by Parasuraman, Berry and Zeithaml (1993):
1. Explicit service promises - personal and non-personal statements about the service
made by the organization to customers.
2. Implicit service promises – service related cues other than explicit promises that
lead to inferences about what the service will be like. Price and tangibles associated
with the service are major cues (Zeithaml, 1988; Bitner, 1992). For example, in
general the higher the price and the more impressive the tangibles, the more the
customer will expect from the service.
3. Word-of-mouth communication – personal and sometimes non-personal statements
made by others outside the organization that convey information about the service.
This tends to be very important in services that are difficult to evaluate before
purchase and direct experience of them (Zeithaml & Bitner, 2000).
4. Past experience – previous experience to service that is relevant to the focal service
that may have been gained through prior encounters with the focal service or other
service experiences. For example, hospital patients may compare hospital stays
against the standard of hotel visits.
Expectations therefore form a baseline for service user satisfaction levels. This means that
the higher the expectation in relation to actual performance of service providers, the greater
the degree of disconfirmation and the lower the level of satisfaction to be achieved. On the
other hand, the lower the expectation is in comparison to actual performance the less the
degree of disconfirmation and higher the level of satisfaction (Tse & Wilton, 1988). This
model also implies that if service user expectations for a particular service are relatively low,
then they may be satisfied with the service experience even though the performance may
have been poor ( Oliver, 1997).
Although the disconfirmation of expectations model was developed originally to explain the
formation of consumer satisfaction judgments (Oliver, 1989) it has also been used to
explain service quality perceptions and has influenced subsequent service quality model
development (e.g. Gronroos, 1983; Parasuraman, Zeithaml & Berry, 1985, 1988). Although
they have things in common, satisfaction is usually seen as a broader concept, whereas
service quality focuses on dimensions of service (Zeithaml, Bitner & Gremler, 2006). This

45
thesis is focussed on service quality and seeks to further understanding of the underlying
dimensions of internal service quality to examine the applicability of external service
quality approaches to internal service value chains. Dominant models of service quality are
discussed in Section 2.3.2 on Service quality research orientations.
Lewis and Booms (1983) provided a definition of service quality based in the
expectancy/disconfirmation approach from the consumer's perspective that has become
fundamental to the quality literature:
Service quality is a measure of how well the service level that is delivered matches
customer expectations. Delivering quality service means conforming to customer
expectations on a consistent basis.
(Lewis and Booms, 1983:99)
While this definition reflects service quality in terms of how well a service level meets
expectations, in the end service quality is whatever the customer perceives it to be
(Gronroos, 2001). This means that understanding perceptions of dimensions used in
evaluations of service quality is central to understanding service quality. As discussed
later, whereas service quality is known to be based on multiple dimensions (e.g. Gronroos,
1983, 2001; Parasuraman, Zeithaml & Berry, 1985), there is no general agreement as to
the nature or content of the dimensions (Brady & Cronin, 2001).
This thesis addresses internal service quality dimensionality. Although there are no
specific definitions of internal service quality, the conceptualisation of service quality in
definitions of external service quality such as Lewis and Boom’s (1983) have been
extended to internal service quality (e.g. Brooks, Lings & Botschen, 1999; Farner,
Luthans & Sommer, 2001; Kang, James & Alexandris, 2002). Generally, employees do
not regard other members of the organisation as ‘customers,’ but conceptually it is
expected that they have perceptions of how well the service provided to them by other
members of the organisation matches what they expected to receive.

46
2.3.2 Service quality research orientations
Two main bodies of research appear to have the greatest influence on the quality literature.
The first is the Nordic perspective, which defines the dimensions of service quality in broad
terms of functional and technical quality. The second, described by Brady and Cronin
(2001) as the American perspective, examines service encounter characteristics or
functional quality attributes (e.g., reliability, responsiveness, empathy, assurance, and
tangibles).
The Nordic perspective is closely linked to the work of Gronroos (e.g. 1983; 1984;
Gummesson & Gronroos, 1987). He argues that customer perceived quality is a function of
two variables - expectations of the service and the experiences the customer gets. The
customer's experiences of the service can be separated into two main dimensions: what the
customer gets as an end result of the service; and how the service production-delivery
process is experienced. Extending the findings of Swan and Coombs (1976) that the
perceived performance of a product can be divided into an instrumental performance (the
technical dimension) and expressive performance (the psychological dimension), Gronroos
(1983, 1984) sees perceived service quality as being influenced by a technical and a
functional dimension.
Technical quality refers to what the customer receives or the end result of the service and
includes technical solutions, knowledge, systems and machines. The functional quality
dimension relates to how the customer experiences the service production-delivery process
including accessibility, appearance, long-run customer contacts, internal relations in the
organization, attitudes, behaviours and service orientation of service providers (Gronroos,
1983). In effect, technical quality is about outcomes of service encounters and functional
quality is about the interactive process of achieving those outcomes. Gronroos (1984) also
introduced image into his model as an intervening variable between technical quality and
functional quality on one dimension, and the consumer's perception of service quality on the
other. Gronroos (1984) concludes that functional quality is more important as long as the
technical quality is at a satisfactory level, suggesting that a high level of functional quality
may compensate for temporary problems in technical quality in overall assessments of
service quality.

47
Gummesson (1981, 1987a, 1987b) identifies four qualities that establish customer perceived
quality: design quality, production quality, delivery quality, and relational quality. The
Gummesson model starts from everybody's contribution in the organization to the four
qualities identified. It suggests that everyone in the organization makes a contribution to
total quality, adapting industrial concepts of quality, translating what is fit for the customer
or what the customer feels he/she requires into customer perceived quality and customer
satisfaction. The Gronroos (1984) and Gummesson (1981, 1987a, 1987b) models were later
integrated (Gummesson & Gronroos, 1987) in an attempt to synthesise two different
approaches that could guide management in their pursuit of quality. The customer perceived
quality is used to describe quality from two different vantage points: two dimensions of
quality perception (technical quality and functional quality), and sources of quality, the four
qualities, viz., design, production, delivery, and relational qualities. This is illustrated in
Figure 2.5.
Figure 2.5 Gummesson-Gronroos Perceived Quality Model
Dimensions of Quality Sources of Quality Perception
(Gummesson & Gronroos, 1987)
The American perspective, on the other hand, tends to focus on Gap Analysis and
recognises that a key set of discrepancies or gaps exist regarding executive perceptions of
service quality in relation to consumer expectations of service quality. The tasks associated
with service delivery to customers, and that these gaps can be major hurdles in attempting to
deliver a service which users would perceive as being of high quality, is a focus of this
perspective (Parasuraman, Zeithaml, & Berry, 1985). The approach is centred on the
customer as the only true judge of service quality (Parasuraman, Zeithaml, & Berry, 1994),
conceptualising the act of service as the customer's opinion as to the overall superiority or

48
excellence of a service (Zeithaml, 1988). Service quality is a type of attitude, related but not
equivalent to satisfaction, which is described as the degree and direction of the discrepancy
between the customer's expectations and perceptions of the service (Parasuraman, Zeithaml,
& Berry, 1988). If the final goal is taken to be the customer's satisfaction, this can be
measured as the difference between what is expected and what is perceived. This means that
if customers receive exactly or more than they expect they will be satisfied. Figure 2.6
represents the model of how gaps represent discrepancies that reflect problems regarding
the communication, design, and delivery of services so that the difference in expected
service and perceived service becomes a representation of service quality.
Figure 2.6 The Gap Model of Service Quality
Gap 5
Gap 1
Customer
------------------------------------------------------------------ Company Gap 4
Gap 3
Gap 2
(Zeithaml, Berry & Parasuraman, 1988)
While gap analysis may be conceptually helpful in providing a framework to
understand the underlying nature of service quality, there are a number of problems

49
with measurement instruments based on comparisons between expectations and
experiences over a number of attributes. Based on the literature (e.g. Cronin & Taylor,
1992; Peter, Churchill & Brown, 1993; Teas, 1993), these problems are summarized as
follows:
1. If expectations are measured after the service experience or at the same time
as the experience occurs, then what is measured is not really expectation but
something that has been biased by experience.
2. Measuring expectations prior to the service experience may not actually
measure the expectations with which users compare their experiences as the
experiences of the service experience may change expectations. These
altered expectations are those that should be used to determine the actual
quality perception of the customer.
3. Expectations are a perception of reality, and inherent in these are prior
expectations. This creates a problem in that, if first, expectations are
measured and then experiences are measured, then the expectations are
measured twice.
However, despite these concerns, gap analysis has been the dominant approach to
evaluation of service quality. This approach and criticism of it and the measurement of
differences between expectations and experience as a means of determining service quality
as difference scores is discussed in Section 2.4.
2.4 Dimensions of Service Quality Consumers generally evaluate service quality through a limited number of abstract and
explicit cues, surrogates, or features (Keller & Staelin, 1987; Prabhaker & Sauer, 1994)
on higher abstracts or quality dimensions (Parasuraman, Zeithaml & Berry, 1985, 1988;
Morgan & Piercy, 1992). Using cues provided by an array of information sources, a
consumer will infer or estimate the value of salient dimensions (Sujan & Deklava, 1987).
The effectiveness of quality cues comes from the storage of accessible information of
quality dimensions that often cannot be ascertained prior to consumption (Zeithaml,
1988). Although some information may be lost in the abstraction process, Johnson and
Fornell (1987) report that consumers roughly gather the same information in a few

50
abstract characteristics as would be contained in many more concrete characteristics or
cues. In other words, the use of cues simplifies the evaluation process in the mind of the
consumer.
Quality cues are characteristics that a consumer observes via any of the senses and that
are perceived to be diagnostic to determine the quality of a service (Teas & Agarwal,
2000). Cues are based on dichotomous features that services either have or do not have
(Johnson, Lehmann, Fornell, & Horne, 1992) and are often considered in research as
either intrinsic or extrinsic. Because of the intangibility of services, extrinsic cues are
often used to attach meaning to the service. For example, price, brand, and store name are
extrinsic cues for quality (Dodds & Grewal, 1991; Zeithaml, 1988). Bitner (1992)
identified the service environment as a servicescape and included ambient conditions
(temperature, air quality, noise etc), space/function (layout, equipment, furnishings, etc)
and signs, symbols and artefacts (signage, personal artefacts, style of décor, etc) as
dimensions that affect perceptions of service quality.
Quality dimensions can be described as the consumer's evaluation criteria of the
perceived performance of a service (given that a service is regarded as a performance).
The literature indicates that consumers use a limited amount, as well asa diversity of
service quality dimensions (Carman, 1990; Dabholkar, 1995; Parasuraman, Zeithaml &
Berry, 1988). In general, it shows that consumers often distinguish dimensions of
(1) Technical quality that concerns tangibles, the service production and servicescapes
(Gronroos, 1990a; Lehtinen & Lehtinen, 1991; Parasuraman, Zeithaml & Berry, 1985,
1988; Westbrook, 1981).
(2) Functional quality that relates to the interaction processes between a service provider
and a customer, comprehending quality dimensions such as empathy, responsiveness
and provider's effort. With complex services or complex tasks, dimensions like
competence and professionalism also become relevant (Gronroos, 1990a;
Parasuraman, Zeithaml & Berry, 1985, 1988).

51
(3) Reliability that involves consistency of performance and dependability (Parasuraman,
Zeithaml & Berry, 1985, 1988). It is closely related to the uncertainty feeling by or
the perceived risk of the consumer provoked by the variability of service quality
(Dabholkar, 1996).
Investigations of service quality have identified a number of dimensions used in
evaluation of service quality and these dimensions have been used to inform the studies
reported in this thesis. Section 2.4 examines the predominate notions of service quality
dimensionality. Section 2.4.1 discusses the dimensions of the major instrument based
on the gaps perspective, SERVQUAL. While SERVQUAL has tended to dominate the
literature, alternative views are presented in Section 2.4.2. Sections 2.4.3 to 2.4.6
address social dimensions of service quality, perceived effort, competence and equity
as factors of service quality. Section 2.5 then examines external versus internal
dimensions of service quality.
2.4.1 SERVQUAL dimensions
The predominant service quality measurement method described in the literature is
SERVQUAL. Developed by Parasuraman, Zeithaml, and Berry (1988), it assesses both
the user's service expectations and perceptions of the provider's performance. Their
qualitative research suggested ten dimensions of service quality that they labelled
tangibles, reliability, responsiveness, competence, courtesy, credibility, security, access,
communication, and understanding. Through empirical research, they reduced these ten
dimensions to five underlying dimensions of service quality that were posited to be
generic to all service industries- reliability, responsiveness, tangibles, empathy (access,
communication and understanding) and assurance (competence, courtesy, credibility, and
security). Tangibles refer to appearance of physical facilities, equipment, personnel, and
communication materials. Reliability means the ability to perform the promised service
dependably and accurately; responsiveness is willingness to help customers and provide
prompt service; assurance is knowledge and courtesy of employees and their ability to
convey trust and confidence; and empathy is caring and the individualised attention firms
provide to customers. These are measured by a 22-item scale- SERVQUAL. While none
of the services studied as part of the initial development of SERVQUAL were within the
healthcare domain, several studies have supported SERVQUAL's applicability to

52
healthcare (e.g., Boshoff & Gray, 2004; Headley & Miller, 1993; Kang, James &
Alexandris, 2002; Lytle & Mokwa, 1992; Mostafa, 2005; Mowen, Licata, & McPhail,
1993; Walbridge & Delene, 1993).
In examining attributes that determine quality and satisfaction with healthcare delivery
Bowers, Swan and Koehler (1994) identified 12 dimensions that encompassed the original
ten SERVQUAL dimensions and added the dimensions of outcomes and caring. They then
reduced these to five dimensions: empathy, reliability, responsiveness, communication,
and caring. They observe that users of health services are not typically able to assess
technical quality of care they receive so they use quality attributes to assess healthcare
delivery. However, given the personal nature of healthcare, it is not surprising caring and
outcomes rated as important dimensions.
Although SERVQUAL and the dimensions identified have been widely used, it has been
subject to criticism. As early as 1990, Carman (1990) expressed concern over the
measurement of service quality across multiple service functions, the treatment of the
expectations measurement, and the omission of importance in the measurement of service
quality. Carman also found that the number of dimensions underlying the service quality
construct was between five to nine depending on the type of service and that the wording
and subject of some items should be adapted to the specific service context at hand. Rao
and Kelkar (1997) tested the measurement model proposed by Carman and found that
while the inclusion of perceived importance ratings does not improve the explanatory
power of the model substantially the inclusion of importance weights make good
theoretical and intuitive sense. They attributed the lack of significant results to operational
difficulties. Babakus and Boller (1992) do not support SERVQUAL's applicability across
a wide variety of services, question its dimensionality, the appropriateness of
operationalising service quality as a gap score, and the specific measurement properties
associated with SERVQUAL.
Additionally, Cronin and Taylor (1992) argued that both the conceptualisation and
operationalisation of SERVQUAL are inadequate. They suggest that the performance-
minus-expectations is an inappropriate basis for use in the measurement of service quality.
With service quality described as a form of attitude, related but not equivalent to

53
satisfaction, that results from the comparison (Bolton and Drew, 1991a; Parasuraman,
Zeithaml, and Berry, 1988), Cronin and Taylor (1992, 1994) argue that this definition
suggests ambiguity between the definition and the conceptualisation of service quality.
Although researchers indicate that measurement of consumer's perceptions of service
quality closely conform to the disconfirmation of expectations paradigm (Bitner, 1990;
Bolton & Drew, 1991a), they also suggest that service quality and satisfaction are distinct
constructs (Bitner, 1990; Bolton & Drew, 1991a, b; Parasuraman, Zeithaml, & Berry
1988). The most common explanation of the difference between the two is that perceived
quality is a form of attitude, a long-term overall evaluation, whereas satisfaction is a
transaction specific measure (Bitner, 1990; Bolton & Drew 1991a; Parasuraman, Zeithaml,
& Berry, 1988).
Cronin and Taylor (1992; Taylor & Cronin, 1994) conclude that although service quality
has been conceptually described as a construct that is similar to an attitude, the
SERVQUAL operationalisation is more consistent with the conceptualisation found
within the consumer satisfaction/dissatisfaction paradigm. This suggests that a
performance-based measure of service quality may be an improved means of measuring
the service quality construct, that service quality is an antecedent of consumer satisfaction
and that consumer satisfaction exerts a stronger influence on purchase intentions than
service quality. They describe this as the SERVPERF model.
Similarly, Teas (1993) examined conceptual and operational issues associated with the
perceptions-minus-expectations perceived quality model. He concludes that increasing
performance-minus-expectations scores may not always correspond to increasing levels of
perceived quality and therefore the SERVQUAL perceived quality framework might not
be theoretically valid. Teas (1993) found that the evaluated performance specification is
superior to the SERVQUAL approach.
Peter, Churchill and Brown (1993) present an argument as to why difference scores such
as those employed by the SERVQUAL scale should be avoided. Brown, Churchill, and
Peter (1993) specifically extend these arguments to the SERVQUAL scale and conclude
there are serious problems in conceptualising service quality as a difference score.

54
Babakus and Boller (1992) and Babakus and Mangold (1992) also support the use of
performance-based measures of service quality over gap measures as a means to
determine service quality.
Parasuraman, Zeithaml, and Berry (1993, 1994) counter these concerns by suggesting that
shared method variance may be the reason that SERVPERF performs better than
SERVQUAL in explaining variance in an overall measure of perceived service. They also
note that explained variance is the only measure where SERVPERF performs better than
SERVQUAL. The question is posed as to whether managers who use service quality
measurements are more interested in accurately identifying service shortfalls, or
explaining variance in an overall measure of perceived service.
Both Cronin and Taylor (1994) and Teas (1994) responded to this rejoinder by further
strenuously arguing their respective cases. The net result at that time appeared to be
agreement to disagree, and a "challenging agenda for further research on measuring service
quality" (Parasuraman, Zeithaml, & Berry, 1994:120). Despite a body of literature
criticising the five-dimension conceptualisation (e.g., Babakus & Boller, 1992; Babakus &
Mangold, 1992; Brown, Churchill & Peter, 1993; Patterson & Johnson, 1993; Peter,
Churchill & Brown, 1993; Spreng & Singh, 1993; McAlexander, Kaldenberg, & Koenig,
1994) and the use of difference scores (e.g. Cronin & Taylor 1992; Page & Spreng, 2002;
Taylor & Cronin, 1994; Teas, 1994) SERVQUAL and its dimensions continued to drive
service quality research. Paulin and Perrin (1996) postulated that conflicting interpretations
in the SERVQUAL literature, particularly regarding its validity, are due to contextuality
and that contexts should be assessed. None of the criticisms include a contextual analysis
of the major factors contributing to variance among SERVQUAL investigations. One can
question how results of service quality measurement in healthcare services may be
compared with those in the transportation or banking industries without taking into account
the nature of the respective customers, the manner in which customers are questioned
about services, and the purpose of the services involved.
Notwithstanding the debate over SERVQUAL’s five-factor structure, there remains wide
agreement that these dimensions (reliability, responsiveness, assurance, empathy, and
tangibles) are important aspects of quality service (e.g., Brady & Cronin, 2001; Bruhn &

55
Georgi, 2006; Gupta, McDaniel & Herath, 2005; Kang & James, 2004; Fisk, Brown, and
Bitner, 1993; Seth, Deshmukh & Vrat, 2005; Svensson, 2004) and provide a basis for
extending understanding the nature of service quality.
2.4.2 Beyond SERVQUAL
Another approach to service quality evaluation is Lehtinen and Lehtinen's (1991) three-
dimensional model of service quality that comprises physical quality, interactive quality
and corporate quality. While the dimensions used are similar to those identified by other
researchers, the creation of three overlaying dimensions gave different emphasis to
elements of service evaluation compared to other models. Physical quality is based in the
physical elements of service and corresponds to tangible and accessibility dimensions of
other researchers. Interactive quality originates between the customer and interactive
elements of service organizations. Dimensions included are responsiveness,
professionalism, behaviour, communication, understanding the customer, recovery,
timeliness and speed, and reliability. Corporate quality is often associated with the tangible
or physical dimension but was separated from the physical dimensions by Lehtinen and
Lehtinen (1991) to address the influence of corporate issues and includes factors such as
corporate/local image and credibility.
Rust and Oliver (1994) propose a three-component model based on the technical and
functional quality dimensions identified by Gronroos (1982, 1984): the service product (i.e.
technical quality), the service delivery (i.e. functional quality), and the service environment.
While Rust and Oliver did not test their conceptualization of service quality, support for
similar models is found in retail banking (McDougall & Levesque, 1994) and in healthcare
(McAlexander, Kaldenberg, & Koenig, 1994).
Dabholkar, Thorpe, and Rentz (1996) propose a hierarchical factor structure to capture
quality dimensions based on the retail and services literatures as well as three qualitative
studies. They propose that customers think of retail service quality in a hierarchical
evaluation at three different levels--a dimension level, an overall level, and a sub-
dimension level. The dimension level equates to factors identified by the researchers as
central to service quality, the overall evaluation is composite experience or perception of

56
overall service quality, and sub-dimensions are sub-sets of the dimensions used in service
quality evaluation. Comparing SERVQUAL dimensions to their own qualitative research,
Dabholkar, Thorpe, and Rentz (1996) propose five dimensions central to service quality--
physical aspects, reliability, personal interaction, problem solving, and policy. So while
they suggest five dimensions similar to SERVQUAL, they argue the retail environment is
different so SERVQUAL dimensions need modification and require a hierarchical factor
structure to better capture overall customer evaluations of service quality. In fact, while
recognising that no researcher can claim definitively to capture customer perceptions of
overall service quality, Dabholkar, Thorpe, and Rentz (1996) believe that (they) come
closer to capturing these overall evaluations because the second-order factor extracts the
underlying commonality among dimensions (Dabholkar, Thorpe & Rentz, 1996:13). They
further suggest that it appears that a measure of service quality across industries is not
feasible. Therefore, research on service quality should involve the development of industry
specific measures of service quality following triangulation of qualitative research
procedures and subsequent validation using quantitative methods.
Using this mix of methods, Dabholkar, Shepherd, and Thorpe (2000) questioned the
conceptualisation of service quality and the approaches used to measure service quality,
and in particular the disconfirmation process. Using focus groups, they identified the
factors of reliability, personal attention, comfort, and features as factors missing from the
SERVQUAL scale. These factors were then tested using items by modifying SERVQUAL
or from their own qualitative analysis and were found to be important predictors of service
quality. They also found that factors relevant to service quality are better conceived as
antecedents rather than as components. This means that consumers not only evaluate
different factors related to the service, but also form a separate overall evaluation of the
service quality. This contradicts service quality models that assume quality is measured as
a straightforward sum of the components. Dabholkar, Shepherd and Thorpe (2000) also
suggest that using antecedents provides a more complete understanding of service quality
and how evaluations are formed. An advantage of the antecedents model is that measures
of overall service quality can provide better feedback to managers regarding overall
impressions of service provided. On the other hand, the components model has no separate,
reliable construct of overall service quality and marketers would have to use all the items
related to the factors just to measure customer evaluations of service quality. This study

57
moves the service quality debate beyond the predominate view of service quality as a
disconfirmation process and questions the approach of conceptualising factors of service
quality as components. Factors as antecedents suggests that the extension of external
service quality approaches to internal service quality evaluations needs further
investigation given that the predominate approach to service quality evaluation is based on
the disconfirmation model.
Also adopting the view that service quality perceptions are multilevel and
multidimensional, Brady and Cronin (2001) furthered the discussion of service quality
measurement in a hierarchical model that shows service quality may be made up of three
different levels of dimensions. They suggest that the first level reflects the customer’s
overall perception of service quality; the second level reflects the primary dimensions that
consumers use to evaluate service quality; and the third level identifies the sub-dimensions
and individual items that make up the primary dimensions of the model. The primary
dimensions identified are interaction quality, physical environment quality, and outcome
quality. Within Interaction Quality are sub-dimensions of attitude, behaviour, and expertise.
Physical environment quality has sub-dimensions of ambient conditions, design, and social
factors. Outcome quality sub-dimensions are waiting time, tangibles and valence. Each of
these sub-dimensions is modified by a reliability item, a responsiveness item, and an
empathy item. Brady and Cronin (2001) believe that such a structure more fully accounts
for the complexity of human perceptions. There is theoretical support for a multi-
dimensional, multilevel model (e.g., Carman, 1990; Czepial, Solomon, & Surprenant,
1995; Dabholkar, Thorpe, & Rentz, 1996; McDougall & Levesque, 1994; Mohr and Bitner,
1995). Brady and Cronin (2001) also suggest that this model also explains internal service
quality although they did not specifically investigate internal service quality, assuming that
external evaluations of service quality are transferable to internal service quality
evaluations. This means that previous conceptualisation based on SERVQUAL and other
disconfirmation models applied to internal service evaluations need to be re-evaluated in
the context of the transfer of external service dimensions to internal service evaluations.
2.4.3 Social dimensions of service quality
The previous discussion has highlighted the problems achieving consensus amongst
58
researchers about the nature of service quality and its dimensionality. With the tendency
to reduce dimensions to arrive at succinct groups of dimensions, there appears to be a
number of salient social or personal interaction dimensions subsumed into broader
factors that may be relevant in understanding the dimensionality of internal service
quality. Section 2.4.3 examines these dimensions. While it is not an exhaustive list, it is
representative of areas that, based on the literature, would suggest their usefulness in this
thesis.
2.4.3.1 Interaction dimensions of service quality
Service quality can be seen as comprising two major factors: the service outcome (what
the value received by the customer in the exchange) and the process of service delivery
(how the outcome is delivered to the customer) (Czepiel, 1990; Gronroos, 1990a;
Parasuraman, Zeithaml, & Berry, 1985). Therefore, it is not only the functional outcome,
but also the meanings the service user gives to the social interactions taking place during
the transaction that influence satisfaction with the transaction and with the product itself.
That is, consistent with the concept of interaction quality (Brady & Cronin, 2001), it is
expected that satisfaction with the process (e.g. social interactions) and with the service
outcome combine to influence satisfaction with the transaction (Mohr & Bitner, 1995)
and thus perceptions of service quality.
Service environment relationships within a services marketing channel tend to be more
personal due to the inseparability of service provider and service recipient in the service
production process. In hospitals, the work environment is such that service provision is
dependent on team and relationship formation. It is therefore useful to consider the role
and nature of interpersonal relationships in evaluations of internal service quality.
Considering the personal nature of service exchanges, the nature of relationships may
help explain aspects of evaluations of service quality. The concept of relationship quality
may provide useful dimensions for the investigation of the nature of relationships and their
impact on quality. However, the study of relationship quality has primarily focused on
preliminary identification of factors that might be important in buyer-seller relationship
development (Bejou, Wray, & Ingram, 1996; Gronroos, 2000: Hansen, Sandvik & Selnes,
59
2003). Relationship quality is defined as when the customer is able to rely on the [service
provider's] integrity and has the confidence in the [service provider's] future performance
because the level of past performance has been consistently satisfactory. Relationship
quality, then, is viewed as a higher order construct composed of at least two dimensions:
(1) trust in the [service provider] and (2) satisfaction with the [service provider] (Crosby,
Evans, & Cowles, 1990:70). Anderson and Narus (1984:45) define satisfaction in this
context as a positive affective state resulting from the appraisal of all aspects of a firm's
working relationship with another firm. This definition can be extended to working
relationships in internal service networks such as in hospital environments. Satisfaction is a
dominant sentiment and a standard for evaluating relationships, and, because utilitarianism
seems to outweigh group interests in the presence of alternatives (Gassenheimer, Calantone
& Scully, 1995), satisfaction directs the progression of the relationship as well as
generating commitment toward continuing the relationship (Garbarino & Johnson, 1999;
Hsieh & Hiang, 2004; Thibaut & Kelly, 1959; Singh & Sirdeshmukh, 2000).
While both Bejou, Wray and Ingram (1996) and Crosby, Evans and Cowles (1990) deal
with relationships between sales people and customers in a financial service environment,
propositions about relationship quality may be transferred to healthcare environments by
suggesting that healthcare service providers would use a similar model. Crosby, Evans and
Cowle (1990) suggest relationship quality is indicated from measures of similarities
between the parties, service domain experience, relational selling behaviour, sales
effectiveness, and anticipation of future interaction. These may be modified to reflect the
healthcare environment so that relational selling behaviour, for example, becomes
interaction at times other than during service provision; and sales effectiveness could relate
to outcomes of interventions in healthcare. The higher order construct suggested of trust
and satisfaction can also be readily transferred to the healthcare environment and would be
valuable conceptualisation for this thesis.
In examining the work environment of multidisciplinary hospital staff, McCusker,
Denukuri, Cardinal, Karofsky and Riccardi (2005) identify factors of team work,
professionalism, and interdisciplinary relations that indicate that interaction is a factor in
overall assessments of internal and external service quality. Svensson (2004) also reports

60
the impact of interactive quality on perceptions of service quality that indicates the
importance of relationships or social interaction within internal work environments.
Gwinner, Gremler, and Bitner (1998) also earlier identified several relational benefits in
a study of a wide range of services with different level of contact and standardisation
that consumers seek as part of the social dimension of exchange relationships. They
report that consumers consistently rated confidence benefits (knowing that you can trust
your service provider and feel less vulnerable) and social benefits (going to the service
provider who recognises you and treats you as a friend) as important aspects of their
service encounter. However, as per social exchange theory (Thibaut & Kelly, 1959),
relational exchanges hold intrinsic utility as well, because these exchanges have social
as well as economic dimensions. That is, the exchange process itself matters in addition
to the utility gained from the service rendered and consumed. In other words, "service
encounters are first and foremost social encounters" (McCallum & Harrison, 1985:25).
Understanding ‘social’ factors in working relationships and how these impact on
evaluations of internal service quality needs further examination. Recent studies (e.g.
Edvarsson, 2005; Wong, 2004) have addressed the role of emotion as an aspect of
service quality assessment that might be considered in light of social interaction within
an internal service environment. This raises the question of the importance of social
factors in evaluations of internal service quality and how they may influence
perceptions of quality performed in an internal service chain.
2.4.3.2 Equity dimensions of service quality
Perceived equity is a key psychological reaction to the value that a service company
provides (Olsen & Johnson, 2003). Central to understanding marketing as an exchange,
and relationship building process (Bagozzi, 1975), equity has been seen as an important
antecedent to customer satisfaction (Oliver & Swan, 1989a, 1989b) and subsequent
service use (Bolton & Lemon, 1999). Oliver (1997) defines equity as fairness, rightness,
or deservingness comparison of other entities, whether real or imaginary, individual or
collective, person or non-person (Oliver, 1997:194).
61
Equity research has tended to focus on a customer’s satisfaction with a relatively
distinct service usage occasion, encounter, or transaction (Olsen & Johnson, 2003).
However, research with an emphasis on the cumulative effect of customer experience
with the service provider (e.g. Dube, Johnson, & Renaghan, 1999; Garbarino, &
Johnson, 1999; Johnson, Anderson, & Fornell, 1999; Mittal & Kamakura, 2001; Mittal,
Kumar, & Tsiros, 1999) has made equity’s role as an antecedent or consequence of
satisfaction unclear. Outcomes, within equity theory, are thought to be evaluated in
relation to those of other entities in the exchange as opposed to the more traditional
concepts of expectations, norms or ideals (Oliver & Swan, 1989a).
The relevance of equity theory to marketing has been recognised for some time
(Huppertz, Arenson, & Evans, 1978). Arising from social exchange theory (Homans,
1961), an underlying assumption is that interpersonal interactions are repetitive and
evolve over time. The close relationship of equity to the concept of reciprocity in market
exchange relationships (Bagozzi, 1975a, 1975b) suggests that equity may be
conceptualised as a relatively cumulative perception.
Equity theory operates at three levels: distributive equity, procedural equity, and
interactional equity. Distributive equity rests in a “rule of justice” stated by Homans
(1961:235) that [a person’s] rewards in exchange with others should be proportional to
his [her] investments. Equity is the evaluation of what is fair or right based on a
comparison of outcomes relative to inputs (Bolton & Lemon, 1999; Huppertz, Arenson,
& Evans, 1978). Distributive equity is operationalised using measures of fairness and
outcomes relative to inputs made. Distributive equity has been shown to be an
antecedent to product or service satisfaction (Bolton & Lemon, 1999; Oliver & Swan,
1989a). With service quality being a component of satisfaction, it is unclear how equity
relates specifically to service quality, and, in particular in internal healthcare service
value chains.
Procedural equity and interactional equity deal with the perceived equity of processes
and the manner in which the interaction takes place. In investigating service failure,
researchers have found that procedural equity and interactional equity moderate the
evaluation of outcome failure (McColl-Kennedy & Sparks, 2003; Tax, Brown &

62
Chandrashekaran, 1998). Oliver (1997) suggests that the referents used for the
comparison process in equity judgments are outcomes and inputs of self and others and
are not part of the disconfirmation process. Extending this to an internal environment,
the role of interactional equity between members of an internal service chain has not
been addressed in the service quality literature.
Notions of equity, or perceived justice, have also been extended to a firm’s service
recovery efforts (Andreassen, 2000; McColl-Kennedy & Sparks, 2003; Smith & Bolton,
1998; Smith, Bolton, & Wagner, 1999; Tax, Brown & Chandrashekaran, 1998). Equity
has also been identified as a key aspect of employee commitment in the management
and human resource management literature (e.g. Flood, Turner, Ramamoorthy, &
Pearson, 2001; Guest and Conway, 1997; Guest, 1998).
Although research conducted in the context of transactions or service episodes has
identified that equity in service quality evaluation may affect loyalty through satisfaction as
an antecedent (e.g. Fisk & Young, 1985; Huppentz, Arenson & Evans, 1978; McColl-
Kennedy & Sparks, 2003; Oliver & Swan, 1989a, b), Olsen and Johnson (2003) suggest
that for customers who are relatively satisfied with their service provider and have no
particular reason to complain, equity is not actively monitored by them. This means that, in
this situation, equity is a judgment that bridges the gap between satisfaction and behaviour
intentions. On the other hand, for customers who have reason to complain, equity is more
relevant and top-of-mind. Consequently, equity becomes a driver rather than a consequence
of satisfaction (Olsen & Johnson, 2003).
Despite recognition of the role of equity in satisfaction and issues relating to service
recovery, equity does not appear to have been specifically identified as a dimension of
service quality. Cronin (2003) suggests that further research into equity would enrich our
understanding of service quality. It is proposed that when service users in an internal
service network, such as in a hospital environment, perceive that the price in terms of
perceived equity of the exchange was fair, it is likely to confirm and possibly enhance their
post use benevolence expectations of the service provider. However, if equity of the
exchange is perceived as unfair, the relationship between equity perceptions and
benevolence trust is governed either by the forgiveness or betrayal hypothesis, or perhaps

63
both mechanisms acting together (Bitner, Booms & Tetreault, 1990). This then would
impact on evaluations of internal service quality.
If equity in an exchange exists to the degree that one person’s input-to-output ratio is
perceived as equalling the other person’s input-to-output ratio (Oliver, 1997; Walster,
Walster, & Berscheid, 1978), then it is reasonable that equity would form part of the
evaluation process in internal service value chains. If service quality is composed of the
service outcome (what is received during the exchange) and process of service delivery
(how the outcome is transferred), then the meanings given to the interactions taking
place during the transaction influence evaluations of internal service quality. When a
worker has multiple interactions with other workers from other disciplines/departments
within the organization, impressions of these interactions are combined to influence
perceived service quality of the individual or their work unit (Oliver, 1997; Parasuraman,
Zeithaml, & Berry; 1994). None of the instruments commonly used in evaluations of
service quality specifically identify elements of equity in the evaluation process, and
equity has not been addressed in evaluations of internal service quality. Given that
workers in the internal service chain are dealing with other workers in the organisation,
it is expected that equity in working relationships would form part of internal service
evaluations.
2.4.3.3 Competence dimensions of service quality
It is assumed that competence is a significant factor in the evaluation of service delivery
in internal healthcare networks and service processes. Encounter specific post-service
use evaluations including performance perceptions and satisfaction judgements serve to
modify service user relational evaluations (Singh & Sirdeshmukh, 2000). Specifically,
it is suggested that performance-based evaluations (i.e. perceptions and
disconfirmation) and satisfaction have a direct effect on post-service use evaluations of
competence trust. Competence was identified by Parasuraman, Zeithaml and Berry
(1988) in their original ten dimensions, but competence was absorbed into the assurance
dimension when they collapsed the ten dimensions into five factors. Because of the
nature of healthcare, this thesis assumes that competence would be a more relevant
dimension for evaluations of internal service quality in a hospital. An internal service

64
user's positive confidence in the competence of the service provider is likely to increase
if the service performance is judged by the user to be high quality and/or exceeding
their initial expectations, and this in turn, is attributed to the ability of the service
providers. Conversely, if perceived internal service provider performance is of low
quality and/or below expectations, then probably service user trust in the competence of
the service provider would be reduced. Competence is also considered in terms of
professionalism (Gronroos, 2000; Reynoso & Moores, 1995, 1996).
However, some researchers argue that service users who have a high level of pre-trust
are likely to be unperturbed by a single negative encounter. This high pre-trust in an
internal environment may be due to past working relationships or professional respect.
Being unperturbed by a single negative encounter, they are likely to forgive the service
provider and the negative effect in terms of service quality evaluation is likely to be
small (Anderson & Sullivan, 1993; Tax, Brown, & Chandrashekaran, 1998). Obviously,
if negative encounters persist, the forgiveness effect is likely to disappear. On the other
hand, other researchers argue that negative encounters for those with a high level of pre-
trust produce a contrast effect (feelings of betrayal) so that the negative effect is
enhanced (Bitner, Booms, & Tetrault, 1990). Probably these effects work together so
that service users are able to forgive an isolated negative encounter but their persistence
creates a betrayal effect.
This is linked to conceptualisations of customer satisfaction and how competence might
be influenced by these conceptualisations. Until the early 1990s, transaction specific
satisfaction dominated the marketing and consumer behaviour literature (for reviews,
Oliver, 1997; Yi, 1990). This approach defines satisfaction as customer evaluation of
their experience with, and reactions to, a particular product transaction, episode, or
service encounter (Oliver, 1997). Since the early 1990s, service and satisfaction research
has emphasised cumulative satisfaction, defined as a customer’s overall evaluation of a
product or service provider to date (Johnson, Anderson & Fornell, 1995; Johnson &
Fornell, 1991). Cumulative satisfaction recognises that customers rely on their entire
experience when forming intentions and making purchase decisions and so greater
flexibility for outcomes is obtained (Garbarino & Johnson, 1999; Mittal & Kamakura,
2001). Therefore, perceptions of competence based on transactions are likely to be

65
different from those derived on a cumulative basis of experience with service providers.
It is generally accepted that experience is a factor influencing predictions of service
quality and perceptions of competence built on past experiences (Zeithaml & Bitner,
2006). The question then arises, are assessments of internal service quality impacted by
the length of working relationships and the quality of relationships in the internal service
value chains? The answer to this question would enable this research to further
understand how evaluations of internal service quality are formed and factors that
determine those evaluations.
2.4.3.4 Perceived effort dimensions of service quality Perceived effort of service providers is another dimension to be considered in
evaluating relationships and service outcomes. Mohr and Bitner (1995) found that
perceived effort has a strong positive impact on transaction satisfaction, and this effort
is not eliminated when the perceived success of the service outcome is statistically
controlled. This shows that employee effort is appreciated by customers in its own right,
regardless of its impact on the outcome. Mohr and Bitner (1995) also suggest that
outcomes can bias effort judgements. That is, when customers do not get the service
outcome they want, they are less likely to recognise employee effort and hard work.
This has implications in assessing service provider performance in healthcare both from
an external and internal perspective.
Perceived effort has not been examined as a factor in internal service quality
evaluations as most studies have focussed on external service quality and assume that
external dimensions are transferable to the internal environment. However, perceived
effort may be linked with perceptions of equity, team work, professionalism, and
interactive quality in an internal service environment and these relationships may form
an important aspect of internal service quality evaluations.
2.4.3.5 Summary of social dimensions
Because services are inherently intangible and characterised by inseparability of the
service provider and recipient (Bateson, 1999; Lovelock, 1981; Shostack, 1977), the

66
interpersonal interactions that take place during service delivery often have the greatest
effect on perceptions of service quality (Bitner, Booms & Mohr, 1994; Gronroos, 1982;
Hartline & Ferrell, 1996; Surprenant & Solomon, 1987). Identified as the employee-
customer interface (Hartline & Ferrell), these interactions are a key element in a service
exchange (Czepiel, 1990). The significance of interactions is captured in Surprenant
and Solomon’s (1987) suggestion that service quality is more the result of processes
than outcomes. If interactions are so important in evaluations of external service quality,
it then follows that in internal service chains where members of the chain, while
members of different groups are part of an organisation with an assumed common
purpose, will place importance on interaction and social factors in evaluations of
internal service quality. However, the extent of social interaction in evaluations of
internal service quality has not been established in the literature and so is examined in
this thesis.
2.5 Internal Versus External Quality Dimensions
As discussed previously, gaining agreement on dimensions for measuring service quality
is a challenge. Measurement of service quality has focused on external end-user
perceptions of quality and the dimensions used to evaluate service quality in external
relationships. There appears to be a general assumption that the issues relating to internal
service relationships are the same dimensions of service quality and satisfaction as in
external relationships. However, there has been little systematic research addressing
internal service quality compared to that addressing external service quality. This section
examines the application of external service quality dimensions to internal service
environments proposed in the literature and specific studies of internal service quality.
Gremler, Bitner and Evans (1994) report similarity between the experiences of internal
customers in internal service encounters and the experiences of external customers in
external encounters. Reynoso and Moores (1995, 1996) find that internal customers (as
with external customers) are able to produce scaled assessments of the service they
receive from other parts of their organization. They suggest nine dimensions representing
tangible aspects of the service that may capture such assessments, but more importantly,
characterize a range of desirable behaviours and actions on the part of supplying units

67
such as helpfulness, promptness, communication, reliability, professionalism,
preparedness, consideration, confidentiality and tangibles.
Building on this research, Mathews and Clark (1997) explored comparability between
external and internal service quality dimensions. Their results demonstrate certain areas of
great similarity concerning the factors of importance in developing service satisfaction in
external and internal service relationships. However, they also demonstrate how the
relative importance of these attributes might differ in the two types of encounter.
Generally, the conclusions to be drawn from Mathews and Clark's (1997) results focus on
the importance of service orientation or attitude of the service providing staff (including
flexibility or responsiveness), open communication, internal management processes,
personal relationships and competence in determining satisfaction with both internal and
external service relationships. They suggest communication and service orientation as
being the most important attributes of internal service quality.
Caruana and Pitt (1997) developed an internal measure of service quality scale
(INTQUAL) that provides a benchmark against which service companies can compare
their own firm scores and those of their divisions. INTQUAL focuses on internal actions
that management needs to take to implement and ensure a quality service to customers.
Caruana and Pitt (1997) identify 17 items that, through factor analysis are reduced to two
items, suggest that the five dimensions reported by Berry and Parasuraman (1991) refer to
two factors: service reliability and the management of expectations. However, the scale
does not identify within the management of expectations specific dimensions to manage.
It does not address dimensions used by people to evaluate the performance of others
within the organization but rather differences between the firm and organizational units.
Nine measures of internal structures and processes associated with service quality were
developed by Gilbert and Parhizgari (2000) who examined what employees need in order
to perform their tasks effectively to accomplish the goals of a quality focused organization.
These measures were importance of the mission, supportive policies toward the work
force, appropriateness of the organizational design, working conditions, pay and benefits,
positive supervisory practices, work force loyalty and pride, operational efficiency, and
customer oriented behaviour. Gilbert and Parhizgari (2000) termed their instrument the

68
organizational assessment for quality (OAQ) which would provide a measurement base
for managers to gauge the quality of their internal systems to enable them to gain insight
about organizational effectiveness and areas most in need of improvement. As such, this
instrument does not address the specific dimensions individuals would use to evaluate
internal service quality.
Lewis and Gabrielson (1998) examined employee perspectives of intra-organisational
aspects of service quality management in relation to their ability and motivation to
provide quality service. They used eight headings: organizational culture and working
environment; individual attitudes; the role of management; role perception and training;
infrastructure and organizational systems; evaluation and rewards; service recovery; and
improvements. While their study focused on functional dimensions of service quality, in
particular people and culture-related variables, they found that there was focus on
technical rather than functional aspects by the banks in which the study was based, and no
real service quality culture within the organizations. Their study did not, however, address
the dimensions used by employees to evaluate other employees, but rather employee
perspectives of management in relation to service quality.
In developing an internal service barometer, Bruhn (2003) more recently has identified 12
dimensions (competence, reliability, accessibility, friendliness, reaction speed, time to
provide the service, flexibility, customization, added value generated, cost-benefit ratio,
transparency in services offered, cost transparency) to reflect essential quality aspects of
the internal services at the pharmaceutical organisation in which the research was based.
As the main purpose of this research was to develop an internal services satisfaction index,
and to identify areas for improving services based on the survey results, a number of the
dimensions could be regarded as organisation specific rather than as broad dimensions
transferable from industry to industry. However, dimensions such as competence,
reliability, accessibility, friendliness, flexibility, and timeliness related dimensions are
consistent with other research. Bruhn’s (2003) study was limited to one company in one
industry and participants were limited to one service in the organisation studied.
McCusker, Denukuri, Cardinal, Karofsky & Riccardi. (2005) assessed the work
environment of multidisciplinary hospital staff using factors of supervisory support, team

69
work, professionalism, and interdisciplinary relations. While this study was not
specifically investigating internal service quality but rather the work environment and
how the work environment influences patient care and outcomes, the factors identified
may be useful as dimensions for evaluating internal service quality.
Other studies investigating internal service quality use the SERVQUAL dimensions
(reliability, responsiveness, assurance, tangibles, empathy) to apply to internal service
environments (e.g., Brooks, Lings, & Botschen, 1999; Chaston, 1994; Edvardsson,
Larsson & Setterind, 1997; Frost & Kumar, 2000; Kang, James & Alexandris, 2002;
Lings & Brooks, 1998; Young & Varble, 1997) and propose that the SERVQUAL
instrument could be used to measure internal service quality. Frost and Kumar (2000)
made an internal adaptation of the Gap model and SERVQUAL to develop
INTSERVQUAL as an instrument to measure internal service quality, but no attempt
was made to test the dimensionality of the instrument. INTSERVQUAL was seen as a
useful construct in explaining perceptions of internal service quality. INTSERVQUAL
found that the responsiveness dimension of SERVQUAL influenced internal service
quality most whereas in the studies by Parasuraman, Zeithaml and Berry (1988, 1991)
reliability was found to have the most significant influence of all the SERVQUAL
dimensions on the overall perception of service quality. Kang, James and Alexandris
(2002) modified SERVQUAL for use in evaluating internal service quality in a
university setting. They report that it is appropriate for measuring internal service
quality, and confirm that all five dimensions were distinct and conceptually clear. They
also found that the reliability and responsiveness dimensions significantly influenced
overall service quality perception.
In examining internal customer satisfaction as part of the relationship between internal
service and external service, Farner, Luthans and Sommer (2001) used SERVQUAL to
measure internal customer satisfaction. Sales associates who deal with the external
customers evaluated the performance of an internal department in how their service
impacted on external service quality. SERVQUAL was modified to reflect what was
seen as the most relevant dimensions of internal customer service for the study:
reliability and responsiveness, as these were deemed by management as to most directly
affect sales associate impact on external customers. The tangible, assurance, and

70
empathy dimensions were felt by management to not directly affect sales associate
delivery of service to external customers and were deleted. Farner, Luthans and
Sommer’s (2003) findings in relation to reliability and responsiveness were in opposite
directions, leading them to suggest that the concept of internal customer service is not
as straight forward as suggested in the literature and it is a complex construct. They
suggest that while external service quality has proven measures (such as SERVQUAL),
internal evaluations appear to be difficult to define, operationalise, measure, and
analyse. This adds to the need for further research into the underlying dimensions of
internal service quality.
Chaston (1994) and Lings and Brooks (1998) add a proactive decision making (ability
to solve problems by controlling environment) dimension, and Brooks, Lings and
Botschen (1999) add Attention to detail (ability to provide detailed information without
mistake) and Leadership (level of direction employees receive from managers)
dimensions to the SERVQUAL dimensions as internal service quality dimensions. On
the other hand, others such as Kang, James and Alexandris (2002) do not add
dimensions but assert that SERVQUAL dimensions with modification to the underlying
statements are useful in the measurement of internal service quality.
Other research into internal service relationships using SERVQUAL has focused on one
particular service area within the organization and the perceived quality of service that
area provides to other parts of the organization (e.g. Jayasuriya, 1998; Pitt, Watson, &
Kavan, 1995; Rands, 1992) suggesting SERVQUAL is an appropriate instrument for
measuring internal service quality. While many of these studies evaluate SERVQUAL
dimensions, evidence is produced to indicate that the five basic SERVQUAL dimensions
are not exactly transferable across service environments due to modifications required in
the instrument.
While these results are not a complete endorsement of the SERVQUAL instrument, a
common thread from previous studies is general agreement on the transferability of the
SERVQUAL instrument to internal service environments, especially if the instrument is
modified. By extension, this implies that the dimensions used to measure service quality
are transferable, yet as noted above there are problems with this. Table 2.1 summarizes

71
significant service dimensions representative of existing research that one might expect to
be identified as salient in internal service evaluation if transferability from external to
internal situations is relevant. The dimensions identified by Reynoso and Moores (1995)
and Bruhn (2003) are also shown as representative of the internal marketing literature and
indicate, based on their studies, that apart from organisation and industry modifications,
that dimensions appear to be generally transferable.
Much of the extant service quality research based in the SERVQUAL approach supports
the assumption that the external SERVQUAL service quality dimensions are transferable
to internal service quality evaluations. Other researchers who eschew SERVQUAL also
suggest that external dimensions are transferable to internal service evaluations (e.g.
Brady & Cronin, 2001). However, little research has specifically examined dimensions
from the perspective of members of the internal service chain in how they evaluate
service from other members of the chain. Organisational dimensions such as those
identified by Gilbert and Parhizgari (2000) and Caruana and Pitt (1997) do not examine
dimensions at the employee to employee level. This is also true of the SERVQUAL
dimensions proposed as relevant to evaluations of internal service quality in internal
service value chains. The dimensions identified by Bruhn (2003) correspond to a number
of external dimensions, and with added others, may give a better basis for understanding
dimensions used by members within the internal service quality chain, but these need
further investigation given the limitations of Bruhn’s study of internal customers in one
company, in one industry, and respondents limited to evaluations of one service in the
organisation.
Given the importance of service quality and the ongoing debate concerning SERVQUAL,
its dimensionality, and other measures of quality, it seems reasonable to examine further
the nature and extent of service quality determinants of internal service encounters. The
salience of dimensions or attributes being measured to those evaluating internal services
is also a concern. Given the limited research concerning the identification of factors
affecting measurement of quality in internal service relationships compared to the
plethora of studies into external service relationships, it is appropriate to suggest that
further exploratory studies regarding internal service quality are needed. While the
literature assumes that external service dimensions are transferable to internal service

72
environments, the dimensions used by members of internal service chains to evaluate
service provided by other members of the chain have not been fully substantiated. Few
studies have used qualitative methods to gain understanding of the underlying dimensions
of service quality generally, and internal service quality specifically. It is therefore
proposed that internal service quality dimensions may differ from those used in external
service quality evaluations.
While there has been extensive research relating to healthcare quality and the use of the
marketing approaches to healthcare evaluations, there is limited understanding of the
nature of evaluations of service provided by internal work groups in a healthcare
environment. The following section examines the nature of quality in healthcare and
dimensions used in evaluations of healthcare service quality.
Table 2.1 Summary of service quality dimensions
Dimensions PZB GR LL BSK DAB JPZ *RM *B Tangibles X X X X X X X Responsiveness X X X X X X Promptness X X X

73
Flexibility X Customization X Empathy Accessibility X X X X X X Communication X X X X X Understanding X X X X X Consideration Assurance X X Competence X X X X Courtesy X X X Credibility X X X X Security X X Professionalism X X X Behaviour X X Problem Solving X Confidentiality X Personal Interaction X Friendliness X Collaboration X Policy X Outcomes X X Caring X X Recovery X X Cost benefit ratio X Transparency – service offering
X
Cost transparency X Reliability X X X X X X X X Preparedness X
PZB = Parasuraman, Zeithaml, Berry (1985, 1988) Dimensions in Bold = PZB consolidated five dimensions GR = Gronroos (1984) LL = Lehtinen & Lehtinen (1991) BSK = Bowers, Swan & Koehler (1994) DAB = Dabholkar (1995) JPZ = Jun, Petersen, Zsidisin (1998) * Internal service quality dimensions
RM = Reynoso & Moores (1995) B = Bruhn (2003)
2.6 Quality in Health Care
The concept of quality in healthcare continues to develop as various provider, patient and
client, governmental, and insurance groups maintain an interest in how to ‘improve’ the
quality of healthcare service management and delivery. This section examines the
literature on the nature of quality measurement in healthcare environments and the
application of management and marketing models to evaluations of healthcare quality.
2.6.1 Development of healthcare quality orientation

74
In the healthcare environment, quality initiatives could be argued to have gained
recognition with Florence Nightingale's work during the Crimean War (1854-1856), when
the introduction of nutrition, sanitation, and infection control initiatives in war hospitals
contributed to a reduction in the death rate. However, the focus on quality is a more recent
phenomenon, beginning in the late 1980's (O'Leary & Walker, 1994).
A number of converging influences account for the accelerated rise in the quality
movement in healthcare. These include the growth and transfer of quality theories and
practices from the industrial sector, concerns about rising health costs, and changes in the
healthcare industry (Deeble, 1999; Hansson, 2000; Huq & Martin, 2000; Nelson, Batalden,
Mohr, & Plume, 1998).
Many writers have set forth an amalgamation of theories and practices to describe how
quality is practiced in industry and other settings. Terms relating to quality are often used
interchangeably, and the lines between distinct theories and practices have blurred
(Reeves & Bednar, 1994). The teachings of quality champions have provided the basis for
quality programs instituted by most organizations in the private and public sectors
(Anderson, Rungtusanatham, & Schroeder, 1994).
Various elements of the work of those who have made significant contributions to the
quality field have been transferred to the areas of healthcare organization, financing, and
delivery. For example, management commitment and leadership, statistical process
control, continuous improvement of processes, and removal of barriers to employee
participation and control of their own quality (Deming, 1986); Total Quality Control
(Feigenbaum, 1963); planning and product design, quality audits, and orienting quality
management toward both suppliers and customers (Juran, 1964); focus on cultural change
and calculating quality costs (Crosby, 1984); training and quality as cost control
mechanisms (Ishikawa, 1985); customer based specifications in product creation and
provision (Taguchi & Clausing, 1990); and benchmarking against organizations
recognised as leaders and the implementation of best practice (Camp, 1989; Watson,
1993) are all areas applied in healthcare contexts.
75
Despite the relative confusion in which “quality doctrine” to use and terms, two core
principles of quality have become predominant in healthcare: measurement and process
engineering (Friedman, 1995). Measurement and process engineering are directly related
to other core concepts, including striving for continuous improvement, fulfilling customer
needs, changing corporate cultures, providing feedback to internal and external customers,
and basing quality programs on data and industry best practices (Snell & Dean, 1992).
Concerns about the growth of healthcare costs and rising utilisation have also created
interest in quality as a means of controlling spending growth and improving service
(O’Connor, Trinh, & Shewchuk, 2000; O'Leary & Walker, 1994; Swineheart & Smith,
2005; Todd, 1993). In the United States, healthcare accounts for about 14 percent of the
gross domestic product, much of it paid for by government sources (Levit, Sensenig,
Cowan, et. al., 1994; Swineheart & Smith, 2005). Australian expenditure on healthcare
represents approximately 8.5 percent of gross domestic product (AIHW, 1994; Deeble,
1999). Burner and Waldo (1995) suggest that while overall healthcare spending in the
United States may be slowing, long-term prospects indicate that healthcare will continue
to represent a significant share of GDP. The sheer economic force of the healthcare sector
and the acceleration of government health spending have stimulated an interest in quality
as a way to control costs and increase access to care (Deeble, 1999; Teisburg, Porter, &
Brown, 1994; Thomasma, 1996).
Changes in the healthcare industry have also contributed to the rise of the healthcare
quality movement. In the United States, continued mergers, consolidation of health plans,
and growth of managed-care arrangements have created a highly competitive environment.
In order to compete and survive, health plans must provide high quality, low cost care
(Furse, Burcham, Rose, & Oliver, 1994; O’Connor, Trinh & Shewchuk, 2000). In
Australia, with the public hospital system funded largely by the government, concerns
have been expressed at the rising costs of administering the Medicare program (Deeble,
1999). Casemix, a health practice and management system, (Queensland Health, 1995) is
seen as a means of improving quality and lowering overall system costs. Under Casemix,
hospitals are funded on the basis of their outputs rather than according to historical
funding levels. As a result, hospitals have begun to measure their performance on the
basis of Casemix weighted separations which reflect access to services and the complexity

76
of patients treated, instead of merely counting the number of patients and their lengths of
stay to determine performance levels (Queensland Health, 1995). In the U.K., policy
makers have been anxious to improve the efficiency of healthcare delivery together with
choices available to patients (Curry, Stark & Summerhill, 1999; Secretaries of State for
Health, 1989, Stevenson, Sinfield, Ion & Merry, 2004).
As consumers of health services become more knowledgeable and opinionated about the
quality of healthcare, there has been an increase in complaints and litigation. Quality
programs are seen as a means of risk reduction by healthcare management and a means of
reducing costs associated with complaints and litigation, or the threat of litigation (Brown,
Bronkesh, Nelson & Wood, 1993; Nelson, 1987). From the consumer’s perspective,
improvements in healthcare quality relate to quicker recovery, quality of life, and better
experiences while in care.
Changes in healthcare markets, providers, and sites of care also present other kinds of
quality issues. For example, rapid emergence of new healthcare markets creates
opportunities for entrance of entities, including payers, with limited skills or firms that are
too overextended in start-up phases to provide appropriate, high-quality care (Teisburg,
Porter, & Brown, 1994).
Consequently, accurate quality assessment and consumer satisfaction measures are needed
to identify high quality providers and prevent the emergence of inefficient or marginal
providers. This is one of the reasons that the U.S. Federal Government requires internal
quality assurance programs for risk health maintenance organizations providing care to
U.S. Medicare beneficiaries (Armstead, Elstein, & Gorman, 1995). Similarly, in Australia,
Casemix and other funding initiatives have increased pressure on quality programs,
although quality assurance programs have been a feature of hospital systems with
standards set and accreditation given by The Australian Council on Healthcare Standards
(ACHS, 1989).
In summary, the movement toward management of consumer perceptions of healthcare
quality is important for the following reasons. First, evaluations of quality are related to
satisfaction and service reuse intent (e.g. Bowers, Swan & Koehler, 1994; Nelson,

77
Batalden, Mohr & Plume, 1998; O’Connor, Shewchuk, & Bowers, 1992; Taylor & Baker,
1994); compliance with advice and treatment regimens (Curry, Stark, & Summerhill,
1999; Wartman, Morlock, Malitz, & Palm, 1983), fewer complaints and lawsuits (Brown,
Bronkesh, Nelson, & Wood, 1993) and better health outcomes (Elbeck, 1987; Kaplan,
1989). Second, quality improvement methods require the identification and meeting of
patient expectations (Huq & Martin, 2000; Jun, Petersen & Zsidisin, 1998), and Third,
positive perceptions of quality have favourable impact on financial performance in
healthcare organizations (Chang & Chen, 1998; Nelson, Batalden, Mohr & Plume, 1992;
Press, Ganey, & Malone, 1991). That is, the targets of analysis when measuring quality
generally include clinical effectiveness, financial performance, consumer satisfaction,
employee satisfaction, risk management and quality assurance. These targets tend to have
a management orientation and do not measure internal service quality within an internal
service chain, nor do they address the impact of factors affecting evaluations of internal
service quality. The purpose of this research is to identify the factors used in internal
healthcare service evaluations and establish the importance of these dimensions to
members of the internal healthcare service chain.
2.6.2 Defining healthcare quality
One of the conceptual problems facing healthcare is that quality cannot be measured if it
cannot be defined. However, there is no single definition of quality in the management,
marketing, and healthcare fields (Reeves & Bednar, 1994). As noted earlier, even in the
literature, the concept of quality has had multiple definitions that are used to describe a
wide variety of phenomena. Writers in the health field are tending to use the Institute of
Medicine's (USA) quality definition which indicates that quality of care is the degree to
which health services for individuals and populations increase the likelihood of desired
health outcomes and are consistent with current professional knowledge (Lohr, 1990). The
appeal of this definition is that it is broad enough to encompass several traditional quality
measurement domains and emerging domains. These include access to care, processes of
care, outcomes of care, appropriateness, and consumer satisfaction (Jencks, 1995).
That there is no single nomenclature for health quality measurement suggests that there
may be problems created in implementing quality programs. Shaughnessy, et al. (1994),

78
indicate that certain terms, such as "outcomes," "indicators," and "measures," have
multiple meanings in the literature. This lack of a uniform definition of quality has
implications for providing information to patients, providers, and payers about the costs
and quality of care, as well as about satisfaction with care. While additional work may be
needed to further refine and clarify the nomenclature of quality, Shaughnessy, Crisler,
Schlenker, Arnold, Kramer, Powell, & Hittle (1994) suggest two taxonomies for defining
outcomes and outcome measures. One classifies outcomes and outcome measures
according to the directness with which they reflect health status change related to the
purpose of care. The second classifies outcomes and outcome measures according to the
care interval or period of medical intervention to which the measures pertain.
In the healthcare field, measuring quality of care has traditionally relied on the structure-
process-outcome framework developed by Donbedian (1980). In this paradigm, structure
refers to the characteristics of the resources in the healthcare delivery system, including
the attributes of professionals (such as age and specialty) and of facilities (such as location,
ownership, and patient loads). Process encompasses what is done to and for the patient
and can include practice guidelines as well as aspects of how patients seek to obtain care.
Outcomes are the end results of care. They include the health status, functional status,
mental status, and general well being of patients and populations.
Donabedian (1980) states that:
this threefold approach is possible because there is a fundamental functional
relationship among the three elements. ...Structural characteristics of the
settings in which care takes place have a propensity to influence the process of
care so that its quality is diminished or enhanced. Similarly, changes in the
process of care, including variations in its quality, will influence the effect of
care on health status, broadly defined.
(Donabedian, 1980:83-84)
Stiles and Mick (1994) elaborate on Donabedian's structure, process, and outcome
dimensions and how they relate to quality, offering it as a conceptual paradigm by which
healthcare executives and other interested parties can classify and organise the extant
literature on quality improvement in healthcare. They developed a matrix approach that
79
examines each element of structure, process, and outcome by factors of technical,
interpersonal, and amenities. They also suggest utility for the paradigm as an operational
tool by which healthcare managers may conceptually locate their own institutional efforts
at quality improvement. Table 2.2 illustrates these dimensions. It is interesting to note that
the dimensions of service quality proposed by Brady and Cronin (2001), ‘interaction
quality’, ‘physical environment quality’, and ‘outcome quality’ relate to those proposed
by Stiles and Mick (1994). However, the factors used in evaluations of internal service
quality within the internal service value chain of hospitals have not been established.
While the models of Donabedian (1980) and Stiles and Mick (1994) are useful, there is
considerable crossover between quality definition and quality measurement with and
among the model components. Jencks (1995), Zimmerman, Karon, Arling, et al. (1995),
and Shaughnessy, et al. (1995) indicate the difficulties in distinguishing between process
and outcome measures. For example, dissatisfaction with care may prohibit patients from
obtaining it, which is a process measure. Conversely, it may be considered an outcome
measure.
Shaughnessy et al. (1995) and Jencks (1995) also note the controversy surrounding the
relative merits of process versus outcome measures. They suggest that process and
outcome measures each have strengths and weaknesses, which come into play depending
on their ultimate use as tools for management and research. For example, certain kinds of
management decisions cannot wait for outcomes that take months or years to develop or
are significantly affected by prior care. On the other hand, patient outcomes are an
important indicator of performance and can be used to examine processes of care.
Outcomes in healthcare are extremely complex and, according to Lohr (1988), are
represented by five Ds, death, disease, disability, discomfort, and dissatisfaction. Different
illnesses have different outcomes. Nevertheless, even with the same illnesses, people
differ by, for example, their age, general health, genetic makeup, etc., so that outcomes
cannot be exactly the same (Leonard, Wilson, & Malott, 2001). It is also suggested that
sometimes blends of outcome, process, and structural measures can be beneficial, such as
for certain kinds of program evaluations and in the overall context of quality improvement
(Shaughnessy et al., 1995). However, applications of these measures to internal service
quality have not been established. Quality tends to be viewed in terms of patient outcomes

80
rather than interactions between members of the internal service value chain, While recent
research has addressed performance measurement in an internal supply chain as a
healthcare continuous improvement implementation (Swineheart & Smith, 2005), the
research focus, however, was more on how internal service quality impacted on external
customers rather than the interactions between individuals within the internal service
chain.
Table 2.2 Typology of Quality Dimensions
Structure Process Outcomes
(Stiles and Mick, 1994)
2.6.3 Measuring healthcare quality
As with the broader domain of services marketing, there is a large health services
literature on consumer satisfaction with healthcare. However, it would appear that many
current satisfaction measures are really patient's perceptions of satisfaction, which may
81
not accurately reflect the quality of the care they receive. For example, patient satisfaction
is linked with their general expectations about care (Gilbert, Lumpkin, & Dant, 1992) or
their previous experiences with the healthcare system (John, 1994). Consequently, patient
satisfaction is measured on what is observed: a facility's environmental aesthetics or
healthscape (Hutton & Richardson, 1995); the availability of high-tech equipment; the
array of services; a physician's comforting bedside manner; or a facility's amenities,
including good food and accessibility to public transportation (Teisberg, Porter, & Brown,
1994).
How to measure satisfaction with the technical quality of care is one area where
researchers have struggled. Research in this area has to address two issues. One is that
satisfaction measures generally assess patient perceptions of the technical quality of care
they did or did not receive and may not reflect the reality of their care. Second, most
consumers do not have the ability to judge the technical quality of their care, which for
most people is a mystery. As Ross, Fommelt, Hazlewood, & Chang (1987) note, a
satisfied patient is not always a healthy patient, and vice versa. In internal healthcare
service networks involving skilled disciplines, it is possible that the professional training
of healthcare workers gives them better ability to evaluate the quality of service provided
by other disciplines. In the strictest sense, evaluations of internal service quality would be
between workers from different parts of the internal service value chain. However, the
service act would often involve medical interventions to assist with treatment of patients.
That is, the service provided from one discipline to another may have at its focus a third
party, the patient. It is also unlikely that workers from one discipline could effectively
comment on the technical competence of workers in another discipline. It is therefore
proposed that other dimensions are used to evaluate internal service quality in much the
same way external consumers use cues they are familiar with to evaluate service.
The difficulties associated with service quality measurement have led to healthcare
management adopting measures from industry and in particular the premises of the gap
analysis school and the SERVQUAL model. As noted earlier, there appear to be
limitations to the SERVQUAL model that further compound the problems associated with
implementing quality assurance programs in healthcare environments. This is particularly
relevant given that many of the standards prescribed to measure quality include definitions
82
that assume the ability to measure outcomes. If there is unreliability in satisfaction
measures then management may opt for measures that are obtainable but do not reflect the
real situation. With the problems associated with measuring external service quality and
satisfaction from a patient's perspective and difficulties in measuring internal service
quality, healthcare measures have tended to focus only on the ‘measurable’, which may
not be a valid representation of quality and satisfaction.
However, the conceptual framework and dimensions used in SERVQUAL as an
instrument for measuring service quality continue to allow it to be regarded by many as an
effective and stable tool for measuring quality across service industries (e.g. Baht, 2005;
Bebko, 2000; Cannon, 2002; Hughey, Chawla & Khan, 2003; Kang, James & Alexandris,
2002; Newman, 2001; Paraskevas, 2001; Sachdev & Verma, 2004; Sharma & Mehta,
2005; Stewart, 2003; Zeithaml, Bitner & Gremler, 2006), including healthcare. The
modification of the instrument to meet specific environments is seen as a means of
overcoming some of the limitations of the instrument although the extent of modification
varies from researcher to researcher. For example, Reidenbach and Sandifer-Smallwood
(1990) reduce the 10 SERVQUAL items to 7 dimensions, while Johnston (1995) increased
SERVQUAL to 18 dimensions. Lim and Tang (2000) added accessibility/affordability;
and Tucker and Adams (2001) caring and outcomes. Tomes and Ng (1995) regrouped the
dimensions into empathy, understanding of illness, relationship of mutual respect, dignity,
food, physical environment and religious needs.
Dean (1999) found applicability of a modified SERVQUAL instrument as a means of
measuring service quality in two types of health service environments: medical and
healthcare. Her research confirmed a four factor structure that was stable in both
environments corresponding to Parasuraman, Zeithaml and Berry’s dimensions of
reliability/responsiveness (loaded together), assurance, tangibles and empathy. However,
Dean (1999) also found that the relative importance of the dimensions of quality are
inconsistent for the two types of health services suggesting that importance values should
be part of the measurement tool. She further suggested that extra diagnostic advantage was
gained by using gap scores to measure service quality compared to perception only scores.
However, her research focussed on external dimensions of healthcare quality and did not
address internal service chain measures of quality.

83
Apart from the SERVQUAL based healthcare service quality research, Camilleri and
O’Callaghan (1998) suggest the dimensions professional and technical care, service
personalization, price, environment, patient amenities, accessibility, and catering.
Andaleeb (1998) named five variables; communication, cost, facility, competence, and
demeanour. Walters and Jones (2001) found security, performance, aesthetics,
convenience, economy and reliability; while Hasin, Seeluangsawat, and Shareef (2001)
identified communication, responsiveness, courtesy, cost, and cleanliness. Cunningham
(1991) referred to service quality dimensions as clinical quality, economic or finance-
driven quality and patient-driven quality. Clinical quality is associated with the usage of
terms such as morbidity, mortality and infection rates, while economic or finance-driven
quality and patient-driven quality refer to the service aspect of quality. Ovretveit (2000),
on the other hand, identified the dimensions of patient quality, professional quality and
management quality. Patient quality refers to giving patients what they want, professional
quality involves giving them what they need, and management quality involves using the
least resources without error or delays in giving patients what they want and need in his
definitions. Each of these studies have examined external service, but if external service
quality dimensions are transferable to internal service quality evaluations then one would
expect these dimensions to used in internal service quality evaluations by members of
hospital internal service value chains.
In the main, the dimensions found in previous studies generally fall into the categories
identified in Table 2.2, which are technical, interpersonal, and amenities (which Potter,
Morgan & Thompson [1994] identified as the amenities and environment dimension).
With further dimensions that have emerged (i.e. access/waiting times, costs, outcomes and
religious needs), the quality dimensions identified in the literature can be summarized as
follows:
• Technical
• Interpersonal
• Amenities/environment
• Access/waiting time
• Costs
• Outcomes; and

84
• Religious needs
In general, these dimensions have been examined from the perspective of external service
quality and patient satisfaction. To further summarize the hospital service quality
literature, Table 2.3, while not exhaustive, shows representative hospital service quality
dimensions from previous studies. It has not been established that these dimensions are
transferable from external service quality evaluations to internal service quality
evaluations.
Table 2.3 Summary of hospital service quality dimensions
A significant number of Quality Assurance and Quality Improvement activities have been
implemented or developed through health systems such as Queensland Health. While little
evidence exists of a whole of organization approach to these initiatives, the most
consistent approach to quality activities is evident in Public Hospitals and Community
Health Services seeking accreditation by the Australian Council of Health Accreditation
Standards (ACHS) and the Community Health Accreditation Standards Program
(CHASP) (Queensland Health, 1994a).
Study Country Service quality dimensions
Parasuraman et al. (1985)
USA Tangibles, reliability, responsiveness, communication, credibility, security, competence, courtesy, understanding, access
Parasuraman et al. (1988)
USA Tangibles, reliability, responsiveness, assurance, empathy
Reidenbach & Sandifer-Smallwood (1990)
USA Patient confidence, empathy, quality of treatment, waiting time, physical appearance, support services, business aspects
Cunningham (1991) USA Clinical quality, patient-driven quality, economic- driven quality
Tomes & Ng (1995) UK Empathy, understanding of illness, relationship of mutual respect, religious needs, dignity, food, physical environment
Andaleeb (1998) USA Communication, cost, facility, competence, demeanour Gross & Nirel Ireland Accessibility, structure, atmosphere, interpersonal Camilleri & O’Callaghan (1998)
Malta Professional and technical care, service personalisation, price, environment, patient amenities, catering
Ovretveit (2000) Sweden Client quality, professional quality, management quality Carman (2000) USA Technical aspect (nursing care, outcome and physician
care), accommodation aspect (food, noise, room temperature, cleanliness, privacy, parking)
Walters & Jones (2001) New Zealand
Security, performance, aesthetics, convenience, economy, reliability
Hasin et al. (2001) Thailand Communication, responsiveness, courtesy, cost, cleanliness
85
The Australian Council on Healthcare Standards is a confederation of health industry and
professional bodies dedicated to the pursuit of quality healthcare. The organization's
specific mission is to promote, in cooperation with healthcare professionals, continuing
improvement in the quality of care delivered to patients and the community by Australian
healthcare organizations (Holt, 1994). The ACHS Accreditation Guide contains a
comprehensive set of contemporary professional standards covering all aspects of a
healthcare facility's operations. The standards are designed to assist healthcare facilities to
provide high quality patient care in an efficient and effective manner. However, only areas
that are surveyable are part of the program.
Similarly, in the United States, the Health Care Financing Administration (HCFA) has
embarked on a new program to ensure the quality of care provided to U.S. Medicare and
Medicaid beneficiaries (Gagel, 1995). The approach, entitled the Health Care Quality
Improvement Program (HCQIP), focuses on improving the outcomes of care, measuring
improvement, and surveying for patient satisfaction. The basic premise of the HCQIP is
that beneficiaries will benefit most from a quality management program that emphasises
improving the processes by which care is delivered (Gagel, 1995). The fundamental
theme of HCQIP is working in partnerships with providers and beneficiaries and
improving quality by supporting internal quality assurance and quality improvement
efforts, including strengthening purchaser/supplier relationships.
Programs such as the ACHS Accreditation program and HCQIP tend to address the
traditional structure-process-outcome quality framework. With demands from
governments for greater accountability of outcomes and management of limited resources,
and increased community expectations for improved and expanded services, healthcare
organizations are under pressure to focus on the relevance and effectiveness of services
provided.
In addressing these issues, Queensland Health, for example, has adopted Best Practice as
corporate policy to direct a coordinated approach to effective delivery of quality health
services under the Quality Client Service Project (Queensland Health, 1994a). This
approach moves from the traditional structure-process-outcome model in that it specifies

86
seven best practice criteria: client focus, people involvement and employee empowerment,
process improvement, information and analysis, leadership, policies and plans, and
organizational performance (Queensland Health, 1994b). However, there appear to be no
real measures of internal service quality.
Having a client focus has not been a traditional orientation for the healthcare industry
other than as a focus on the outcomes of medical interventions. Queensland Health
defines clients as the people of Queensland, thus inferring that everything the organization
does- from the way hospital grounds are tended to the way a kidney is transplanted or the
way telephone inquiries are handled, to the development of new health policies, serves the
health needs of the people of Queensland (Queensland Health, 1994b). This client focus
includes both internal and external clients and supplier relationships internal and external.
This implies an understanding of client needs, and having a marketing orientation.
However, this broad-spectrum approach of defining everyone as a client makes it difficult
to develop customer-oriented programs that actually meet the needs of the customer rather
than those of management. The lack of segmentation implied by this approach suggests
sub-optimal results for both clients and those charged with service delivery.
It has been established that the healthcare sector is dedicated to the notion of quality.
However, defining quality has been difficult leading to the examination of outcomes
that are readily measured as indicators of performance. While quality concepts and
theories have been transferred from industry to the healthcare environment, this section
has explored further the application of marketing concepts that would assist healthcare
managers to address service quality issues. These issues currently appear to be reduced
to operational indicators rather than evaluations of service quality.
2.7 Conclusion, Research Problems and Research Questions
The strategic importance of service quality is evident in the healthcare industry. The
literature suggests that sustainable competitive advantage for service organizations, such
as those in the healthcare industry, is best attained through service quality and customer
satisfaction as perceived by customers (e.g. Cronin & Taylor, 1992; Taylor, 1994; Quinn,
1992; Zeithaml, 2000). Hospital administrators are recognising that patient perception of

87
service quality will influence service provider choice (Brand, Cronin & Routledge, 1997;
Reidenbach & Sandifer-Smallwood, 1990; Woodside, Frey, & Daly, 1989). While these
issues may appear to be relevant only in private healthcare situations, the public sector
also recognises the importance of service quality. Service quality from an organizational
perspective is seen as a means to reduce costs and to more efficiently deliver service in
resource constrained environments (Deeble, 1999). From a patient perspective,
improvement in service quality may represent better health outcomes, better in-care
experiences, improvements to quality of life, and prospects of longer life.
Unlike a physical product where quality can be readily assessed, service quality is an
elusive and abstract construct that is difficult to define and measure. The subjective nature
of service quality makes the measurement task more complex and gaining agreement on
an appropriate methodology even more. The complexity of measuring healthcare quality
is evident through examination of three of the four characteristics of services: intangibility,
heterogeneity, and inseparability of production and consumption (Parasuraman, Zeithaml
& Berry, 1985). The intangible nature of healthcare services means they cannot be stored,
inventoried, or tested for quality as a physical product. Patient experience, either directly
or vicariously from outside sources, is often the only way of testing quality manifested in
healthcare services.
Service performance can vary from one encounter to the next. This heterogeneity occurs
because different doctors, nurses, and other service providers deliver the service to a
variety of patients with varying needs. Variations may occur due to contextual situations,
training, experience, and individual abilities as well as the interaction of the patient who is
part of the service performance. Interaction among doctors, administrators, nurses and
non-clinical staff in the internal service network as well as timing factors combine in
numerous different ways to affect the quality of healthcare provided. Also, in healthcare,
production and consumption of service are inseparable. This makes quality control
difficult. This is compounded by the personal nature of healthcare services and the
varying circumstances warranting medical interventions.
There is an extensive healthcare literature that examines service quality in healthcare
contexts, generally with an external focus on service quality, e.g. staff – patients, the

88
organisation – patients. However, just as in the general marketing literature, there is
continued debate as to appropriate dimensions and measurement methodology for
healthcare service quality. Following introduction of the concept of internal customers and
internal marketing with an organization (Gronroos, 1985; Christopher, Payne &
Ballantyne, 1994), there is general consensus that poor internal service quality is likely to
have a negative impact on the quality of services provided to external customers (Caruana
& Pitt, 1997; McDermott & Emerson, 1991; Walshak, 1991; Wisner & Stanley, 1999).
The effective and efficient realisation of service quality between the organization and its
external customer can be seen only after internal performance has been examined and
optimised (Boschoff & Mels, 1995; Edvardsson, Larsson & Settlind, 1997). Another
aspect of the internal service concept is that satisfaction of internal customers (i.e.
employees) is also important for success of the organization (Gremler, Bitner & Evans,
1994; Gilbert, 2000). Therefore, improving internal service quality is seen as essential to
improving external service quality.
Although generally used to measure service quality delivered to external customers, the
SERVQUAL dimensions and other external service quality dimensions have been
suggested as transferable to internal environments (Brady & Cronin, 2001; Reynoso &
Moores, 1996; Lings, 2000, Kang, James & Alexandris, 2002). The dimensions important
to different internal groups, particularly when evaluating internal service quality in
healthcare, have not been established in the literature and may differ from those which are
important to external customers. This leads to the first research question:
RQ1: What are the dimensions used to evaluate service quality in internal
healthcare service networks?
The literature has generally assumed that there are no differences between external and
internal service quality dimensionality. This thesis proposes that in the process of using
external measures for internal service quality, the impact of the nature of internal
environments, particularly in healthcare, has not been addressed. The commentary of the
need to modify instruments such as SERVQUAL is indicative of the lack of ready
transferability of dimensions. Notwithstanding the work of Dabholkar, Thorpe and Rentz
(1996) and Brady and Cronin (2001) suggesting a hierarchical dimensionality to service

89
quality, the ready acceptance of SERVQUAL dimensions as standard has furthered the
assumption that dimensionality is the same. However, this assumption has not been
established empirically.
In any case, the empirical support for modification and adaption discussed earlier to meet
the needs of various service environments provide impetus to the need to identify the
dimensions of internal healthcare service quality evaluation. This then leads to the second
research question based on the conjecture of differentiation:
RQ2: How do dimensions used in service quality evaluation in internal
healthcare service networks differ from those used in external quality
evaluation?
These two research questions lead to Proposition 1. Although the literature suggests that
external service quality dimensions are transferable to internal service quality evaluations,
this has not been verified and so there may be differences in dimensions used.
P1 Internal service quality dimensions will differ to external service quality
dimensions in the healthcare setting.
Healthcare service quality is affected by the nature of service delivery. Porter's (1985)
value chain differentiates between internal groups that are directly involved in external
encounters as they pass along the value chain and those support functions that are not
directly involved in those processes. While Porter does not specifically address internal
networks, the service value chain provides a structure to conceptualise service channels.
These service value chains are operationalized through internal service networks. Internal
marketing is seen as a means to improve relationships in internal networks and
consequently service quality. Effective internal exchanges are also a prerequisite for
successful exchanges with the external market (George, 1990). However, current
conceptualisations of internal marketing which focus on internal customers and suppliers
have not differentiated between different types of internal customers that may exist within
an organization and their differing internal service expectations. As a result, internal

90
marketing efforts aimed at increasing internal service quality have been undifferentiated
and aimed at all internal groups rather than targeted to specific internal groups.
To help conceptualise the internal service relationships between common major
disciplinary groups within a typical Australian public hospital Figure 2.7 was developed.
The four main groups covering work areas (Allied Health, Corporate Services, Nursing,
and Medical) are shown and how they might interact with each other and patients depicted.
While each group interact with patients in one direction and provide value to the service
encounter through specialised and other services that aggregate to provide the total patient
service experience, the internal network interactions between and within groups have a
significant impact on the ultimate value patients receive. This conceptualisation also
indicates the multi-level or hierarchical nature of the internal healthcare service chain and
the possibility of relationships beyond the normal dyadic interactions used in most service
quality research.
The existence of these interactions implies that, potentially, there exist different emphases
on the dimensions of service quality that are used by internal service providers to evaluate
the quality of service provided by other parts of the network in value creation. This gives
rise to a third research question:
RQ3: How do different groups within internal service networks in the
healthcare sector evaluate service quality?
Figure 2.7 Network Relationships in Hospital Internal Service Value Chains
Nursing
Medical
Non-
Clinical
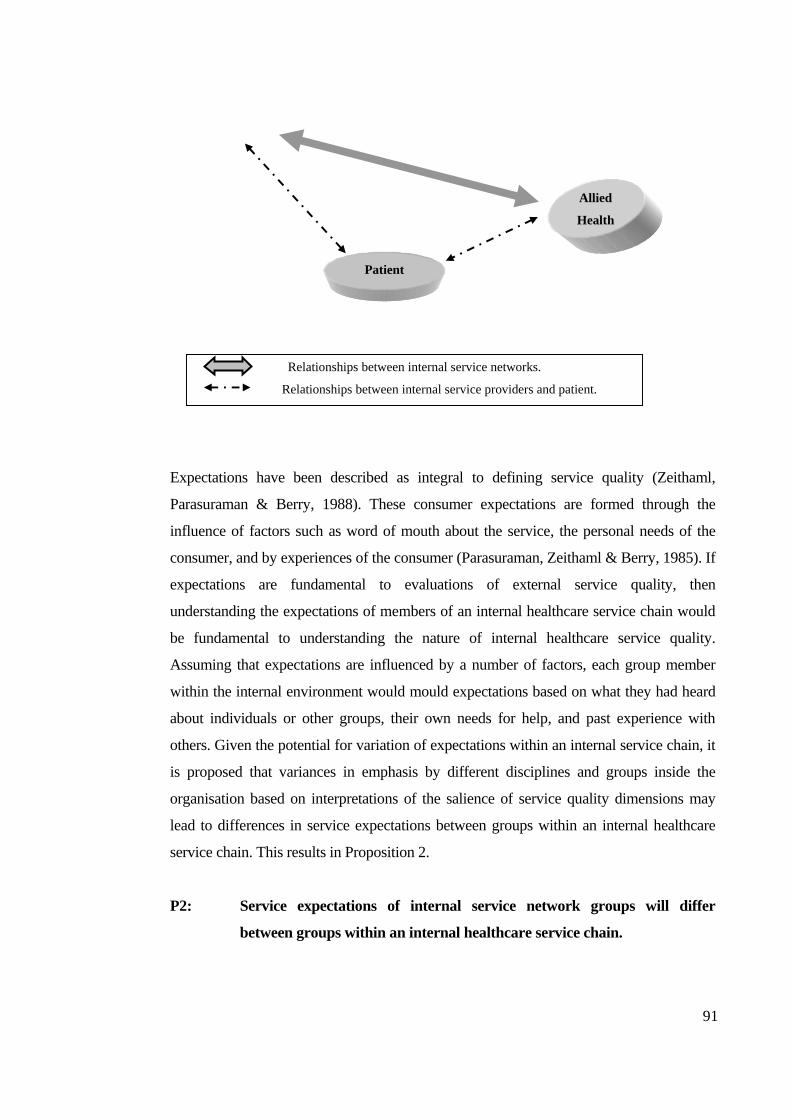
91
Expectations have been described as integral to defining service quality (Zeithaml,
Parasuraman & Berry, 1988). These consumer expectations are formed through the
influence of factors such as word of mouth about the service, the personal needs of the
consumer, and by experiences of the consumer (Parasuraman, Zeithaml & Berry, 1985). If
expectations are fundamental to evaluations of external service quality, then
understanding the expectations of members of an internal healthcare service chain would
be fundamental to understanding the nature of internal healthcare service quality.
Assuming that expectations are influenced by a number of factors, each group member
within the internal environment would mould expectations based on what they had heard
about individuals or other groups, their own needs for help, and past experience with
others. Given the potential for variation of expectations within an internal service chain, it
is proposed that variances in emphasis by different disciplines and groups inside the
organisation based on interpretations of the salience of service quality dimensions may
lead to differences in service expectations between groups within an internal healthcare
service chain. This results in Proposition 2.
P2: Service expectations of internal service network groups will differ
between groups within an internal healthcare service chain.
Allied
Health
Patient
Relationships between internal service networks.
Relationships between internal service providers and patient.

92
With little research into the dynamics of evaluation of internal service quality, the
question arises as to the differences between worker’s internal and external personal
perceptions of service quality. That is, in line with perceptual differences in evaluating
one’s own performance compared to how others would see one’s performance (Gilbert,
2000), do workers perceive that dimensions they use to evaluate the service quality of
others in an internal service value chain are the same as they would use to evaluate how
they themselves perform? This leads to Proposition 3:
P3: Internal service quality dimensions individuals use to evaluate others will
differ from those perceived used in evaluations by others.
One of the inconsistencies in the literature is the relative importance of service quality
dimensions. Studies in different industries and even within industries have varied in
perceived importance of dimensions (e.g. Dean, 1999; Farner, Luthans & Sommer, 2001;
Frost & Kumar, 2000; Kang, James & Alexandria, 2002; Parasuraman, Zeithaml & Berry,
1985). This may be due in part to the context of the studies undertaken, and that the
importance of dimensions is not taken into account in instruments that attempt to measure
service quality. Any differences in importance attached to dimensions by different work
groups may impact on the ability to develop instruments that capture evaluations of
internal service quality across the organisation and between groups within the internal
service chain. Within a hospital, the different discipline groups may have varying
perceptions and expectations that influence the salience placed on dimensions used to
evaluate internal service quality. This leads to Proposition 4:
P4: Ratings of service quality dimensions will differ in importance amongst
internal healthcare service groups
The marketing literature maintains that, in the absence of tangible and measurable
indicators of quality, service receivers use proxy measures (e.g. Teas & Agarwal, 2000;
Zeithaml, Bitner & Gremler, 2006) to evaluate service quality. This is particularly so
with some services, such as healthcare, that are more difficult to evaluate than others, even
after use, and so credence qualities become evident (Zeithaml, 1981). One of the
assumptions of service quality evaluation is that recipients are able to make informed
93
evaluations of the service they have received. Unlike patients, who use credence qualities
to evaluate hospital services, Healthcare professionals tend to be well trained and
informed about the environment in which they work. It could be assumed that healthcare
professionals would be able to make informed evaluations of internal healthcare services.
However, it is expected that in an environment such as a hospital with a number of
disciplines present, that individuals within the hospital workforce would experience
difficulty in evaluating services provided by people outside their own area of expertise.
Thus technical or clinical quality would be evaluated using credence qualities.
Technical or clinical quality in healthcare is defined on the basis of the accuracy of
medical diagnoses and procedures or conformance to professional specifications (Stiles &
Mick, 1994). Although patients give technical quality the highest priority, various
techniques used in the evaluation of technical quality are not understood or available to
them. Researchers of healthcare quality have therefore resorted to measuring technical
quality by proxy. An example is the reliability dimension of SERVQUAL (Parasuraman,
Zeithaml & Berry, 1988). The criteria for measurement encompass the factors such as the
credibility and professionalism of doctors, their skill and competence, and the trust placed
in them (Van der Bij & Vissers, 1999). This thesis seeks to establish that difficulties are
experienced in evaluations of internal technical healthcare service quality and to examine
the nature of the dimensions used to evaluate internal technical service quality and this
leads to Proposition 5:
P5: Internal healthcare service groups find it difficult to evaluate the
technical quality of services provided by other groups.
Because services are inherently intangible and characterised by inseparability of the
service provider and recipient (Bateson, 1999; Lovelock, 1981; Shostack, 1977), the
interpersonal interactions that take place during service delivery often have the greatest
effect on perceptions of service quality (Bitner, Booms & Mohr, 1994; Gronroos, 1982;
Hartline & Ferrell, 1996; Surprenant & Solomon, 1987). Identified as the employee-
customer interface (Hartline & Ferrell), these interactions are a key element in a service
exchange (Czepiel, 1990). The significance of interactions is captured in Surprenant
and Solomon’s (1987) suggestion that service quality is more the result of processes

94
more than outcomes. If interactions are so important in evaluations of external service
quality, it then follows that in internal service chains where members of the chain, while
members of different groups are part of an organisation with an assumed common
purpose, will place importance on interaction and social factors in evaluations of
internal service quality. However, the extent of social interaction in evaluations of
internal service quality has not been established in the literature and so is examined in
this thesis. An expected factor in interactions between members of an internal service
chain is the impact of relationship strength given that members of an organisation tend
to have ongoing relationships and encounters during the course of performing work.
This leads to Proposition 6.
P6: Relationship strength impacts on evaluations of internal service quality
This Chapter has discussed the nature of service quality and dimensions used in
evaluations of service quality. The application of marketing approaches to healthcare
quality has been examined and dimensions used in service quality evaluation. Although
the literature supports the transferability of external service quality to evaluations of
internal service quality, this has not been empirically established. This has led to the
first research question asking what are the dimensions used in evaluations of internal
healthcare service quality. The second research question seeks to examine how the
dimensions of internal healthcare service quality differ to dimensions used in
evaluations of external service quality. A third research question seeks to find
understanding of how different groups within an internal service network in the
healthcare sector evaluate service quality. A number of propositions relating to these
questions have been posed. The next chapter describes and justifies a methodology to
investigate these research questions and propositions.

95
3.0 Methodology
3.1 Introduction Chapter 2 discussed the development of services marketing and attempts to establish
measures of service quality. Research in this field has tended to follow either a Nordic
or an American perspective (Brady & Cronin, 2001). Although perceptions of service
quality are based on multiple dimensions, there is no general agreement as to the nature
of the dimensions. There is also a general assumption that external service quality
dimensions are transferable to internal service quality evaluations (e.g. Brady & Cronin,
2001; Kang, James & Alexandris, 2002; Parasuraman, Zeithaml & Berry, 1988). This
debate on the nature of service quality, the lack of agreement on the dimensionality of
service quality, and limited specific research addressing internal service quality,
particularly in healthcare has led to three research questions: (1) RQ1 What are the
dimensions used to evaluate service quality in internal healthcare service
networks?; (2) RQ2 How do dimensions used in service quality evaluation in
internal healthcare service networks differ to those used in external quality
evaluation?; and (3) RQ3 How do different groups within internal service
networks in the healthcare sector evaluate service quality? From these central
research questions the following propositions were formulated.
P1: Internal service quality dimensions will differ to external service quality
dimensions in the healthcare setting.
P2: Service expectations of internal service network groups will differ between
groups within an internal healthcare service chain.
P3: Internal service quality dimensions individuals use to evaluate others will
differ from those they perceive used in evaluations by others in an internal
healthcare service chain.
P4: Ratings of service quality dimensions will differ in importance amongst
internal healthcare service groups.
P5: Internal healthcare service groups find it difficult to evaluate the technical
quality of services provided by other groups.
P6: Relationship strength impacts on evaluations of internal service quality.

96
This chapter examines the nature of research paradigms, and identifies the paradigm in which
this thesis is based. Research methodologies that examine service quality are discussed and an
appropriate methodology to investigate the above research questions and propositions is
formulated. Issues of research design, sampling, data analysis, reliability and validity in
relation to the methodology used in this research are then discussed. The following sections
examine these factors to establish an effective means to determine the dimensions of internal
service quality, how they differ from those used in evaluations of external service quality and
how different internal service groups within the healthcare sector evaluate internal service
quality.
3.2 Research Paradigm
The history of Western philosophy can be traced to the ancient Greek thinkers such as
Pythagoras (560-480BC), Socrates (470-399BC), Plato (427-347BC), and Aristotle (384-
322BC) whose philosophical view collectively has been referred to as "Platoism" (Hunt, 1991).
While thinkers have struggled with concepts such as ontology, epistemology and methodology
since the time of Plato, concern with issues in the philosophy of science is a relatively recent
phenomenon for marketing scientists (Deshpande, 1983). As a result, a number a questions
arise concerning the nature of contemporary marketing research.
In identifying twelve fundamental questions (including questions on appropriate methods of
inquiry, beliefs about the nature of marketing, objectivity and rationality of marketing research,
and whether knowledge is 'constructed' rather than 'discovered') Hunt (1991) suggests that
many researchers turn to the philosophy of science literature to find perspectives or 'isms' to
help answer these questions and address the many 'ogies' of science. These 'ogies' include:
Methodology the study of procedures in inquiry
Ontology the study of 'being' or what is 'real'
Epistemology the study of how we 'know'
Axiology the study of value
(Creswell, 1994; Guba, 1990; Guba & Lincoln, 1985, 1994)
In the social sciences, there has been long standing debate about the most appropriate
philosophical position from which methodology should be derived. This debate has focussed

97
on the relative value of two fundamentally opposing paradigms, positivism and
phenomenology (Guba, 1990; Hughes, 1990; Hunt, 1991; Patton, 2002; Reichardt and Cook,
1979). Building on the work of Kuhn (1970), Patton (1990:37) defines a paradigm as
A worldview, a general perspective, a way of breaking down the complexity of the
real world. As such, paradigms are deeply embedded in the socialization of adherents
and practitioners: paradigms tell them what is important, legitimate, and reasonable.
Paradigms are also normative, telling the practitioner what to do without the
necessity of long existential or epistemological consideration.
The basis of the positivist paradigm is that the social world exists externally, and that its
properties can be measured through objective methods, rather than being inferred subjectively
through sensation, reflection or intuition (Denzin & Lincoln, 2003; Guba & Lincoln, 1989;
Easterby-Smith, Thorpe & Lowe, 1994; Nieswiadomy, 1993; Patton, 2002; Phillips, 1990;
Smith, 1994). Positivism recognises only the empirical and the logical forms of knowledge as
having any claims to the status of knowledge (Hughes, 1990; Patton, 2002). Flowing from this
position are implications that espouse independence, value-freedom, causality, a hypothetico-
deductive approach, operationalism, reductionism, generalisation, and cross-sectional analysis
(Denzin & Lincoln, 2003; Easterby-Smith, Thorpe & Lowe, 1994; Hedrick, 1994; Hughes,
1990; Oiler, 1986).
The phenomenological paradigm, on the other hand, stems from the view that the world and
'reality' are not objective and exterior, but they are socially constructed and given meaning by
people (Denzin & Lincoln, 2003; Deshpande, 1983; Easterby-Smith, Thorpe & Lowe, 1994;
Guba, 1990; Patton, 2002). Hence, the research task should not be to gather facts and measure
how often certain patterns occur, but to appreciate the different constructions and meanings
that people place upon their experience. Phenomenologists suggest that one should therefore
try to understand and explain why people have different experiences, rather than search for
external causes and fundamental laws to explain their behaviour.
Fundamental differences in the two paradigms are summarised below in Table 3.1. While the
table presents the 'pure' versions of each paradigm and the basic beliefs are essentially
incompatible, when it comes to the actual research methods and techniques used by
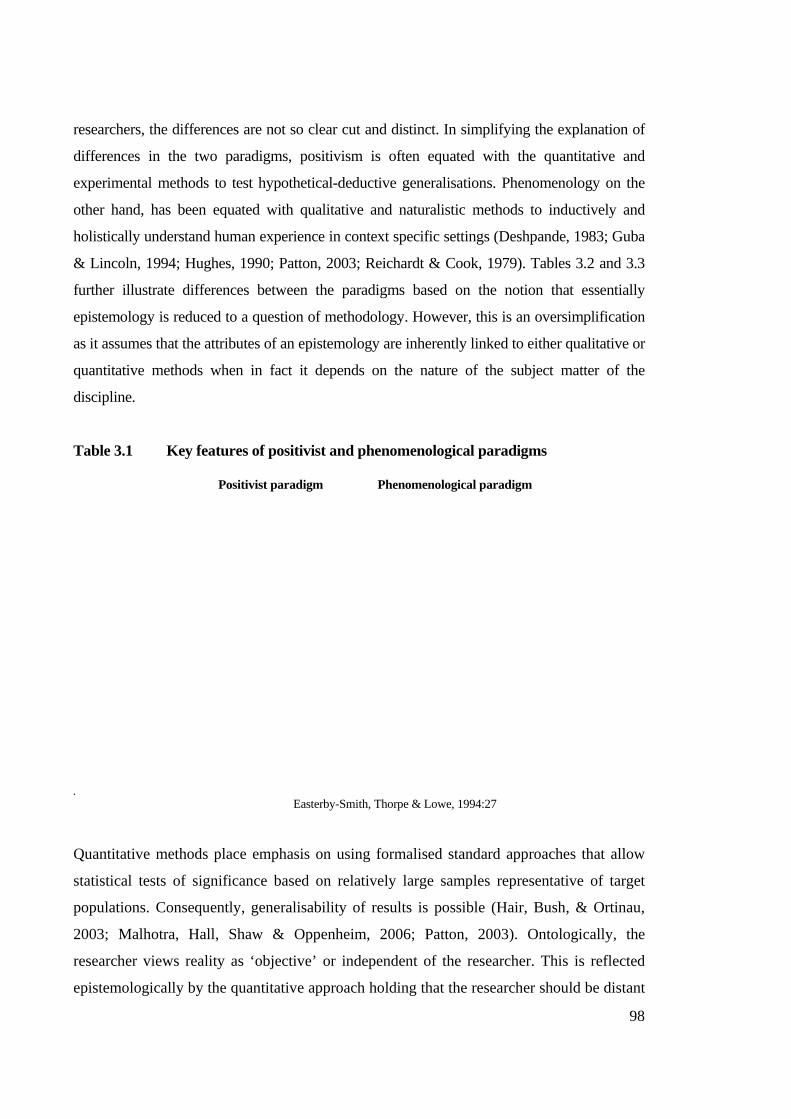
98
researchers, the differences are not so clear cut and distinct. In simplifying the explanation of
differences in the two paradigms, positivism is often equated with the quantitative and
experimental methods to test hypothetical-deductive generalisations. Phenomenology on the
other hand, has been equated with qualitative and naturalistic methods to inductively and
holistically understand human experience in context specific settings (Deshpande, 1983; Guba
& Lincoln, 1994; Hughes, 1990; Patton, 2003; Reichardt & Cook, 1979). Tables 3.2 and 3.3
further illustrate differences between the paradigms based on the notion that essentially
epistemology is reduced to a question of methodology. However, this is an oversimplification
as it assumes that the attributes of an epistemology are inherently linked to either qualitative or
quantitative methods when in fact it depends on the nature of the subject matter of the
discipline.
Table 3.1 Key features of positivist and phenomenological paradigms
Positivist paradigm Phenomenological paradigm
Easterby-Smith, Thorpe & Lowe, 1994:27
Quantitative methods place emphasis on using formalised standard approaches that allow
statistical tests of significance based on relatively large samples representative of target
populations. Consequently, generalisability of results is possible (Hair, Bush, & Ortinau,
2003; Malhotra, Hall, Shaw & Oppenheim, 2006; Patton, 2003). Ontologically, the
researcher views reality as ‘objective’ or independent of the researcher. This is reflected
epistemologically by the quantitative approach holding that the researcher should be distant

99
and independent of that being researched (Reichardt & Cook, 1979). This perceived
objectivity is reinforced with the axiological issue of the role of values in the research. In a
quantitative study the researcher’s values are kept out of the study where only the ‘facts’
are reported (Creswell, 1994). As a result, quantitative research is seen as more objective
than qualitative research, being more sustainable in terms of validity and reliability due to
principles of rigour, objectivity, replicability, definiteness and so forth (Filstead, 1990; Hair,
Bush, & Ortinau, 2003; Reichardt & Cook, 1979).
Table 3.2 Quantitative and Qualitative Paradigm Assumptions
Assumption Question Quantitative Qualitative
Creswell, 1994:5
On the negative side, quantitative methods tend to be inflexible and artificial. They are not
effective in understanding processes or the significance that people attach to actions. They
are not helpful in generating theories; and because they focus on what is, or what has been
recently, they make it hard for the policy-maker to infer what changes and actions should
take place in the future (Easterby-Smith, Thorpe & Lowe, 1994; Reichardt & Cook, 1979).
Quantitative studies seek the facts or causes of social phenomenon wherein theories and
hypotheses are tested in a cause and effect order. Concepts, variables, and hypotheses are
chosen before the study begins and remain in a static design for the duration of the study.
Studies are designed to develop generalisations that contribute to the theory to enable one

100
to better predict, explain, and understand some phenomenon (Guba, 1990; Guba & Lincoln,
1994; Patton, 2002). This inability to develop ‘understanding’ is a weakness of quantitative
methods (Hughes, 1990; Patton, 1990).
Qualitative methods have strengths in their ability to look at change processes over time, to
understand people's meanings, to adjust to new issues and ideas as they emerge, and to
contribute to the evolution of new theories (Guba & Lincoln, 1994; Patton, 2002). They
also provide a way of gathering data that is seen as natural rather than artificial. Qualitative
methods give the ability to ask ‘how’ and ‘why’ questions. Ontologically, for qualitative
researchers the only reality is that constructed by the individuals involved in the research
situation. As a result, multiple realities exist for any given situation: the researcher, the
individuals being investigated, and those interpreting the study. Epistemologically, a
qualitative approach holds that the relationship of the researcher to that being researched is
one of interaction where the researcher seeks to minimise the distance between themselves
and the subject. Methodologically, inductive logic is used. Categories emerge from
informants rather than being a priori as in quantitative research. This emergence provides a
depth and richness of ‘context-bound’ information leading to patterns or theories that help
explain phenomena (Denzin & Lincoln, 2003; Guba & Lincoln, 1994; Hughes, 1990;
Patton, 2002).
Weaknesses in qualitative methods include the time and resources required for data
collection, and the analysis and interpretation of data may be very difficult. There is also
the problem that many people, especially policy-makers, may give low credibility to studies
based on a phenomenological approach due to perceived lack of rigour, problems in being
able to replicate research studies, objectivity and generalisation (Filstead, 1990; Reichardt
& Cook, 1979).
Quantitative methods, according to Reichardt and Cook (1979), have been developed for
the task of 'verifying or confirming' theories (theory testing) while qualitative methods were
developed for the task of 'discovering or generating' theories (theory generation). In other
words, quantitative methodologies ask ‘who, what, where, how many, how much’
questions while qualitative methods ask ‘how, why’ questions (Yin, 1994). According to

101
Deshpande (1983) marketing research has been too preoccupied with 'confirming'
propositions or hypotheses rather than 'discovering' new propositions or hypotheses.
Hirschman (1986) argues that the key factors in marketing are essentially socially constructed:
human beliefs, behaviours, perceptions and values. Hence it is important to employ research
methods drawn from this perspective. However, the dominant paradigm in marketing research
has been for survey research methods, which are aimed at predicting, often statistically,
behaviour amongst consumers or clients (Hunt, 1991; Gummesson, 1991). This may be
because marketing as an academic discipline has emerged from economics and the
behavioural sciences, both of which have long established quantitative traditions. These
traditions have influenced training and academic socialisation that tends to make researchers
biased in favour of and against certain approaches (Patton, 2002).
If, as Deshpande (1983) suggests, that the philosophies of positivism and phenomenology
represent the extremes of a continuum, then there is a case for methodologies and approaches
which provide a 'middle ground' and 'bridging' between the two extreme viewpoints (Easterby-
Smith, Thorpe & Lowe, 1994; Filstead, 1990). Deshpande (1983) suggests that triangulating
quantitative and qualitative approaches can enrich marketing research activity. The notion of
triangulation suggests using an appropriate mix of both quantitative and qualitative methods
such that the weaknesses of one set of methodologies are compensated for by the strengths of
the other and vice versa (Fielding & Fielding, 1986; Jick, 1979; Morse, 1991; Reichardt &
Cook, 1979).
Although the distinction between the two paradigms may be clear at the philosophical level, a
pragmatic position must be adopted for applied research such as this thesis. The literature
review has identified relevant models and theories that have been developed and grounded,
which means that this thesis is concerned with verification of components of previous research
rather than discovery of new theories.
The underpinning philosophy for this thesis tends toward the ‘middle ground’ of Deshpande’s
continuum (1983) which suggests that, on one hand, if the literature indicates explicit
variables that could be easily operationalised and measured then the research would be
situated at the extreme positivist end of the continuum. On the other hand, if the literature

102
indicates little empirical research and unknown concepts and variables, then the
phenomenological position at the other end of the continuum would be adopted. While key
variables have been identified in the literature for this thesis, there are additional variables that
need to be identified or clarified to allow verification to take place in the specific environment
of healthcare. Therefore, it is essential to establish these variables and the nature of adaptations
in order to ensure the effectiveness of the study. This is accomplished using phenomenological
approaches mixed with quantitative methods. Therefore, as suggested above, this thesis
occupies 'middle ground' 'bridging' the two extreme views of positivism and phenomenology
(Deshpande, 1983; Easterby-Smith, Thorpe & Lowe, 1994; Patton, 2002).
Given the epistemological position for this thesis, the methodologies used in determining
service quality, examining internal networks and internal marketing, and evaluating internal
service value chains will be discussed in the following section. Consideration is given to
available marketing research methodologies to focus on appropriate research design and
methods used in this study.
3.3 Methodologies investigating service quality
The literature review, presented in Chapter 2, indicates the nature of research undertaken to
investigate the phenomenon examined by this thesis. The studies examined were largely
explicitly in the quantitative paradigm. In most cases, they were replication or verification
studies examining service quality dimensions, in particular SERVQUAL dimensions.
Researchers have attempted to test and/or adapt the SERVQUAL instrument in various
settings. These settings include healthcare (Babakus & Mangold, 1989; Bowers, Swan &
Koehler, 1994; Dean, McAlexander, Kaldenberg & Koenig, 1994); business to business
services (Brensinger & Lambert, 1990); a dental school patient clinic, business school
placement centre, tyre store, and acute care hospital (Carman, 1990); department stores (Finn
& Lamb, 1991; Dabholkar, 1996); banking, pest control, dry cleaning, and fast food (Cronin &
Taylor, 1992); a utility company (Babakus & Boller, 1992); the computer software industry
(Pitt, Oosthuizen, & Morris, 1992); and banking (Spreng & Singh, 1993). These studies
generally do not fully support the factor structure posited by Parasuraman, Zeithaml, and
Berry (1988). More recent studies have moved from the SERVQUAL replication approach
(e.g. Brady & Cronin, 2001; Dabholkar, Shepherd & Thorpe, 2000; Gilbert & Parhizgari,

103
2000, Johnston, 2004; Mukherjee & Nath, 2005) and have used a mixture of qualitative and
quantitative methodologies.
Most of the research methodologies reviewed have attempted to validate SERVQUAL or its
dimensions, and in the process have not added significantly to understanding of the
dimensions relevant to this study of internal service quality. Instead, through replication and
validation attempts, a layering of research based on acceptance of the SERVQUAL
perspective has led to general acceptance that there are essentially five dimensions of service
quality as postulated by Parasuraman, Zeithaml and Berry (1988). These studies of service
quality have also generally investigated external service quality rather than internal measures.
The few studies of internal service quality to date have tended to adopt the approach of
extension of SERVQUAL dimensions to internal service quality. The research underpinning
this thesis seeks to identify internal service quality dimensions within an internal service chain
and relate them to external service quality dimensions identified in the literature. This thesis
also examines how different groups within internal service networks in the healthcare sector
evaluate service quality. The literature has not established the nature of internal service quality
dimensions or the transferability of external dimensions to internal service chains. This means
that while prior approaches have been considered, a research design specific to this thesis is
required.
The literature recognizes that services are difficult to study using traditional research
methodologies (Bateson, 1985; Nyquist & Booms, 1985; Shostack, 1977) given that a service
can be described as an act, a process, and a performance. Gilmore and Carson (1996) suggest
that the predominant characteristics of services (intangibility, perishability, inseparability, and
variability) may best be researched using an integrative stream of qualitative research methods.
Qualitative methods provide a more intrusive and less structured approach than quantitative
research techniques and so are appropriate for the exploratory nature of research undertaken in
this thesis.
Given that this thesis requires internal service quality dimensions to be identified before
conducting an in-depth analysis of the validity of these dimensions in determining perceptions
of service quality, a mix of qualitative and quantitative methods is used.

104
3.4 The Research Design for this Thesis
This thesis deals with human beliefs, behaviours, perceptions and values. However, by
adopting a mixed qualitative and quantitative approach it is expected to improve the accuracy
of judgements by collecting different kinds of data relating to the same phenomena. Therefore
this research involves two types of studies, one qualitative (Study 1) and one quantitative
(Study 2). Figure 3.1 shows the research design for this thesis.
Figure 3.1 Research design for this thesis
Data was collected through a two-stage research design. Study 1 is a qualitative,
exploratory study design to develop understanding of the attributes and dimensions
important to hospital workers within the internal service value chain to evaluate the quality
of service provided by others within that internal service value chain. Study 1 provides
richness of data to facilitate this. The results of Study 1 are reported in the following
chapter.
Research questions
Research Propositions
Research design
Issues of reliability and validity
Study 1 Interview Protocol Pre-test interviews Depth interviews Interview data analysis
Study 2 Questionnaire design Pre-test questionnaire Data collection Data analysis

105
Study 2 is a quantitative study developed from the findings of Study 1 in conjunction with
prior findings from the literature and seeks to confirm propositions and findings identified
in Study 1. A questionnaire was developed and pre-tested. The research hypotheses tested in
Study 2 have been formulated in order to fill gaps identified in the literature review and are
concerned with identification of service quality dimensions important to internal service
network workers in a hospital environment. More specifically, the questions are concerned
with internal service relationships among channel members providing links in the service
value chain and the dimensions used by workers in those links to evaluate service quality.
Given the SERVQUAL dimensionality and instrument have not been fully supported in the
literature or adapted to healthcare, and there is an overall lack of a theory-based dimension
structure in the literature applicable to healthcare, further research is necessary to gain
understanding of service quality dimensions applicable in a hospital internal service value
chain. Qualitative interviews make it possible to assign meaning to the service experience as
the participant sees it, not as the researcher perceives it. Interviews also allow discovery of
relevant determinates of the service experience not yet identified. Simon (1994) and Jarratt
(1996) support this approach by suggesting inclusion of qualitative interviewing approaches in
a research design prior to quantitative evaluation.
While focus groups have been used extensively as an interview technique in prior studies,
they have been generally comprised of several groups of people external to the organisation
or internal groups attempting to identify service characteristics important to external
customers (e.g. Jun, Petersen & Zsidisin, 1998). Recent attempts have been made to
separate groups within the internal service network (e.g. Frost & Kumar, 2000; Lings,
2000; O’Connor, Trinh & Shewchuk, 2000). Problems that arise from focus groups include
the difficulty of identifying differences of opinion between internal groups. Focus groups
tend to discuss a topic for an hour or two with six to ten people. Each person may only have
about 20 minutes of "interview time" which may vary significantly in practice depending
on the composition of the focus group and the skill of the moderator in ensuring balanced
discussion and focus on the questions being discussed. To allow greater richness,
comprehension, and in-depth understanding of what individuals attribute to service quality
in-depth interviews were chosen over focus groups for Study 1.

106
3.5 Methodology Study 1
The purpose of Study 1 was to develop understanding of the attributes and dimensions
important to hospital workers within the internal service value chain as they evaluate the
quality of service provided by others within the internal service value chain. In-depth
interviews were conducted to discover attributes and dimensions used in descriptions of
service quality. This provided a richness of data to give understanding to the themes
developed. At this stage in the research, the attributes and dimensions are defined in terms
of those identified in the literature to allow consistency and comparability of findings.
For the purposes of this research, a semi-structured approach to the interviews was used. This
is particularly appropriate for this research as:
(i) it is necessary to understand the constructs that the interviewee uses as a
basis for opinions and beliefs about a particular matter or situation and,
(ii) an aim of the interview is to develop an understanding of the respondent's
'world'.
(Easterby-Smith, Thorpe & Lowe, 1994; Malhotra, Hall, Shaw & Oppenheim, 2006)
The technique of semi-structured interviews was used in this research (Kvale, 1996; Rubin &
Rubin, 1995) because they are relatively unstructured and open-ended, and they provided large
amounts of rich but disorganized data. Content analysis was used to organize the data by
creating categories to classify the meanings expressed in the data (Strauss & Corbin, 1990;
Weber, 1985). These interviews provided the means to conduct an initial, exploratory study in
order to identify the issues to follow in the more structured survey (Study 2) in this research.
In the semi-structured individual interviews for this research, the topic and issues covered
were determined in advance, the sample of people contacted were previously determined, and
attempts to prevent biases affecting data occurred before data collection, rather than after
(Kvale, 1996; McCracken, 1988; Seidman, 1998). Flexibility was allowed in the conduct of
the interviews to allow for unexpected issues raised by the interviewees. Bias (biases arising
from sequencing subject matter, from any inadvertent omission of questions, from
unrepresentative sampling, and from an uncontrolled over/under representation of subgroups
among respondents) was handled by careful design of the interview itself. Representation of

107
groups was a key issue in this research given the diverse nature of service providers in
healthcare.
Semi-structured interviews allowed flexibility for both the researcher and respondents,
allowing variation in detail on individual topics relative to each respondent. Development of
an interview protocol prompted respondents with topics reflecting the needs of the research
and to engage in what Wallendorf and Brucks (1993) call guided introspection. However,
flexibility in sequencing and wording of questions allowed respondents freedom of expression.
The choice of a hospital and health environment in which to undertake this research
recognized the convenience of having workers from a variety of disciplines within one
organization who are in close interaction in the performance of their work activity. This
allowed examination of the issues relating to dimensions of service quality evaluation in
internal service value chains.
3.5.1 Interview Guide – Study 1
An interview guide in the form of a list of questions or issues to be explored in the course
of an interview was prepared in order to ensure that the same key information was obtained
from interviewees. This guide provided topics or subject areas within which the researcher
was free to explore, probe, and ask questions to elucidate and illuminate particular subjects.
In other words, the guide served as a basic checklist to indicate the topics and their
sequence in the interview to remind the interviewer to ask about certain things. The guide
was pre-tested in interviews preceding Study 1, and also with healthcare academics and
workers. A copy of the guide is found in Appendix 1.
The questions numbered one to six provided an overall framework for the interviews.
Questions 1 and 2 of the interview guide sought to establish the environment of the
interviewee and the nature of working relationships with people from other sections. These
questions and the subsequent probing questions allowed the researcher to understand the
working environment and how work was performed in the hospital. Work networks and the
nature of relationships individuals have within work teams and across disciplines were

108
identified. These questions also assisted with placing of responses to subsequent questions
in context.
The next section of the interview dealt with developing an understanding of the importance
of quality in the interviewee's role, their perception of service quality and how it might be
measured, and whether they were aware of processes in place to evaluate quality in the
hospital. This was followed by questions to understand the means used by the interviewee
to evaluate the quality of work done by people from other sections with whom they worked,
and the role of expectations in assessment of the quality of work done.
The final section of the interview dealt with working relationships, time spent working with
people from different areas and how relationships might affect their evaluation of quality.
The design of the interview guide was to focus interviewees on the proposition relating to
the overall research question how do dimensions used in service quality evaluation in
internal healthcare service network differ from those used in external environments?
3.5.2 Sample – Study 1
Study 1 was preceded by a pre-test to evaluate the interview guide. The sample design for this
study was purposive (Newman, 2003). That is, rather than take a random cross section of the
population to be studied; small numbers of people with specific characteristics are selected.
This was done to ensure that a cross section of strata was interviewed and that interviewees
were sufficiently articulate to question questions asked and seek clarification as required or as
other issues arose.
The stratification of respondents was based on the Australian Council of Healthcare Standards
classifications that identify 34 different subgroups in six categories: Allied Health,
Community Services, Dental Services, Medical Disciplines, Nursing, and Non-Clinical
(Pawsey, 1990). For the purposes of this study, Community Services and Dental Services have
not been included. Not all hospitals have these services and they tend to deal directly with
patients without extensive interaction with other service areas. Other than Nursing, the
remaining categories have a number of subgroups:
109
Allied Health Audiology, Biomedical Engineering, Clinical Psychology,
Medical Records, Nutrition and Dietetics, Occupational
Therapy, Orthoptics, Pharmacy, Physiotherapy, Social Work,
Speech Pathology.
Medical Disciplines Accident and Emergency, Anaesthetics, Critical Care Units,
General Practitioners in Solo Practice with Hospital Affiliation,
Medicine, Obstetrics and Gynaecology, Organ Imaging,
Paediatrics, Pathology, Psychiatry, Surgery.
Non-Clinical Accounting, Central Sterile Service, Cleaning, Clerical, Food
Services, Linen, Maintenance, Management, Supply Services.
For management purposes, organizational structures often include Medical Records in Non-
Clinical and use the term Corporate Services to cover all non-clinical functions. This was
the case at the hospital in which this research was based and the term Corporate Services
was used in this research to cover all non-clinical classifications.
Samples from each of four broad categories were sought reflecting major subgroups or strata
within each category. The strata chosen were identified as Allied Health, Corporate Services
(non-clinical), Nursing, and Medical. These strata were used in each of the studies undertaken.
For a qualitative study that has to stand as a research study in its own right, the number of
interviews may be larger (Morton-Williams, 1985:29). Strauss and Corbin (1998) suggest a
general rule of thumb is to sample (interview) until saturation of each category identified is
achieved. This means, until no new or relevant data seem to emerge regarding a category; the
category development is dense, in so far as all paradigm elements are accounted for, along
with variation and process; and the relationships between categories are well established and
validated.
The total number of interviews required for this study was somewhat problematic. Unlike
quantitative research that requires appropriate samples to allow statistical analysis and testing
of hypotheses, qualitative research seeks richness in data to gain an in-depth understanding of
issues and their underlying factors. Qualitative research is unstructured, exploratory in nature
110
and based on small samples (Kvale, 1996; Malhotra, 1999). For an appropriate qualitative
research sample size, Taylor and Bogdan (1998) observe that it is a difficult if not impossible
question to answer prior to conducting some research (1998: 93). Kvale suggests interviewing
as many subjects as necessary to find out what you need to know (1996:101). However, Kvale
(1996) observed that in current interview studies the total number of interviews tended to be
15 plus or minus 10. Morton-Williams (1985) suggests that studies being undertaken as a
preliminary to a quantitative survey will usually comprise between 20 and 40 depth interviews
or from four to twelve group discussions.
Study 1 comprised 28 depth interviews conducted at a major Queensland metropolitan
hospital with strata representing groups identified as Allied Health, Corporate Services,
Nursing, and Medical. This number of interviews sits within the range of interviews
suggested by Kvale (1996) and Morton-Williams (1985). Interviewees were selected to be
typical of the strata in terms of the range of work and responsibilities held. To ensure that
there was not contamination of the sample, those interviewed in the pre-test were not in the
selection pool and therefore not re-interviewed. The list of participants from the strata
Allied Health (AH), Corporate Services (CS), Nursing (N), and Medical (M), their role at
the hospital, and length of service at the hospital is shown in Table 3.3.
Coding indicated a level of saturation in the data for strata with 28 interviews so that further
interviews were not required. There were 21 females and 7 males interviewed which
approximates the gender balance within the hospital. Nursing and Allied Health areas of the
hospital were dominated by females, medical dominated by males, with Corporate Services
being mixed depending on work area. Of the 21 female and 7 male respondents, 6 have
been at the hospital less than 5 years, 12 between 5 and 10 years, 5 between 10 and 15
years, and 5 with more than 15 years service at the hospital.
While there was potential for biased responses in the interviews as a result of the
employment status of some respondents, this was not apparent. The assurance of anonymity
and privacy of the interview session may have been responsible. The privacy guarantee was
important not only to retain the validity of the research but also to protect respondents. The
guarantee of privacy also increases the likelihood of accurate reflections of the opinions of

111
interviewees, as they are free to express views that may not be forth coming if there was
fear of being identified.
Table 3.3 Participants in Study 1 Code Role Gender Time at hospital
(years)
1 CS1 Ward Clerk F 4
2 CS2 Records F 6
3 AH1 Physiotherapist F 5
4 AH2 Physiotherapist F 15
5 AH3 Physiotherapist F 8
6 AH4 Physiotherapist F 5
7 N1 Nurse Manager M 12
8 N2 Nurse Manager F 15
9 AH5 Social Worker F 6
10 AH6 Occupational Therapist F 3
11 AH7 Occupational Therapist F 2
12 CS3 Triage Receptionist F 6
13 CS4 Records M 5
14 CS5 Receptionist F 2
15 AH8 Occupational Therapist F 7
16 CS6 Ward Receptionist F 9
17 CS7 Ward Receptionist F 18
18 CS8 Manager M 15
19 N3 Clinical Nurse Manager F 10
20 N4 Registered Nurse F 5
21 N5 Clinical Nurse F 3
22 N6 Clinical Nurse F 11
23 N7 Clinical Nurse F 12
24 N8 Enrolled Nurse F 1
25 M1 Cardiologist M 15
26 M2 Physician M 6
27 M3 Physician M 5
28 M4 Surgeon M 10
3.5.3 Recording interviews – Study 1

112
To record the data, note taking is an obvious method but has limitations with the
interviewer needing to conduct the interview as well as record proceedings. There is some
discussion in the literature on the merits of taping interviews (e.g. Jankowicz, 1995; Patton,
1982; Strauss & Corbin, 1998). Reasons to tape include increased accuracy of data
collection and more focussed attention on the respondent (Kvale, 1996; Perakyla, 1997;
Seidman, 1998). Patton (1982) suggests that using a tape recorder does not eliminate the
need for note taking and can serve two purposes: 1) helping formulate new questions as the
interview moves along, and 2) facilitation of later analysis, including locating important
quotations from the tape itself. For the purposes of this research interviews were tape-
recorded with the permission of the interviewees. Notes were also made during the
interview as appropriate and following the interview. Recording and subsequent
transcription of interviews increases the reliability of data used in this research (Perakyla,
1998). Working with tapes and transcripts eliminates many of the problems with the
unspecified accuracy of sole use of field notes.
3.5.4 Interview data analysis – Study 1
The recorded interviews were transcribed and the data systematically analysed (Huberman &
Miles, 1994; Miles & Huberman 1984; Patton, 1990; Seidman, 1998; Spiggle, 1994; Strauss
& Corbin, 1998; Weber, 1985). The analysis involved three steps. The first was to sort and
classify the data. Following a review of interview transcripts and related documents, data was
categorized or labelled to identify units of data as belonging to, representing, or being an
example of some more general phenomenon (Strauss & Corbin, 1998; Seidman, 1998; Spiggle,
1994). This categorization took place during the process of open coding (Miles & Huberman,
1984; Strauss & Corbin, 1998; Weber, 1985). The aim of open coding is to discover, name,
and categorize phenomena in terms of their properties and dimensions. Miles and Huberman
(1994) suggest that coding drives the retrieval and organization of data. The content categories
were chosen and labelled with particular reference to service quality concepts and the service
marketing literature based on a prior-research driven code development approach (Boyatzis,
1998; Patton, 2002; Strauss & Corbin, 1998). This allowed for consistency of terminology and
comparability with prior studies. Category labels drawn from the service quality literature
were attached to the inputs perceived as most appropriate resulting in categories into which the
comments were coded. Where there was no obvious match to labels commonly used in the
113
literature, new labels were developed to describe attributes evident in the data. This approach
recognises the contribution of prior research in providing valid codes (Boyatzis, 1998), but
also allows for the addition of new concepts as they are discovered. Transcripts were
systematically read and marked with notations. As new themes were identified, previous
transcripts were reviewed to ensure that these themes had not been overlooked. Data was
recorded on a spreadsheet to represent categories identified in each interview. The matrix
allowed visual identification of the spread and concentration of themes represented by
categories. Quotations indicative of themes were also collected and collated into categories.
During the second step, transcripts and notes were analysed to consider each of the themes and
assess the fit of each theme to the data in a process known as axial coding (Miles & Huberman,
1984; Straus & Corbin, 1998). Analytical memos were written about each of the themes. Then
the third step, through selective coding, the data was again scrutinized to integrate and refine
themes and identify findings for each one (Miles & Huberman, 1984; Straus & Corbin, 1998).
Figure 3.2 summarizes the processes used in the collection and analysis of data in Study 1.
To determine the reliability of the classification system through content analysis, stability was
ascertained when the content was coded more than once by the researcher (Weber, 1985).
Reproducibility or inter-coder reliability was tested using an independent researcher familiar
with the field to allocate the comments to the categories identified. Overall, agreement was
found in the identification of themes and consistency of allocation. Minor disagreement in
terminology in two cases was resolved through discussion and reference to how similar
themes had been treated in the literature. Had there been serious disagreement, provision had
been made to refer items to an additional researcher familiar with the field. However, this
option was unnecessary. Also, the exploratory nature of Study 1 allowed for the creation of a
number of theme categories that accommodated nuances in meaning that in other studies may
have been forced into stricter categories.
Figure 3.2 Data in Study 1
Collect Data Analyse Data
Audio Recording

114
Data 1 = Raw sense data, experience of the researcher
Data 2 = Recorded data, physical record of experiences
Data 3 = Selected, processed data in this thesis
(Adapted from Neuman, 2003)
3.6 Methodology Study 2
Study 2 is a quantitative study that examines the themes identified in Study 1. A
questionnaire developed from the themes identified in Study 1 and those identified in the
literature, and more specifically the SERVQUAL dimensions, forms the basis of Study 2.
This study is not a replication or justification of SERVQUAL, but recognition of the
usefulness of using the SERVQUAL perspective and other prior research to inform the
framework for this study. Several statements from the SERVQUAL instrument were used
to test similar dimensions identified in Study 1, or modified to allow for situational factors
such as the healthcare environment. Other statements were derived from factors identified
in Study 1 not covered by the SERVQUAL instrument and to test hypotheses postulated
from the research question. The questionnaire was distributed through the Quality Office of
the hospital used in Study 1 to staff within the strata of Allied Health, Nursing, Medical,
and Corporate Services.
3.6.1 Questionnaire design – Study 2
Having developed themes and identified factors relevant to the research questions in Study 1,
a confirmatory quantitative survey in the form of a questionnaire was developed. The format
Listen
Observe
Interview
Data 1
Observations
Jotted Notes
Memory and Emotion
Field Notes
Data 2
Sort and Classify Open Coding Axial Coding Selective Coding Interpret and Elaborate
Data 3

115
of the questionnaire was driven by the factors identified in the depth interviews and the
literature. The questionnaire provided a structured approach in that it contained a pre-
formulated written set of questions to which the respondents recorded their answers. The
questionnaire contained structured or ‘closed’ questions that required the respondent to
exercise judgement on a set of specified response alternatives. Closed questions help the
respondent to make quick decisions by making a choice among the several alternatives
provided. They also help the researcher to code the information for the subsequent analysis
(Malhotra, Hall, Shaw & Oppenheim, 2006). A copy of the questionnaire is found in
Appendix 2.
The questionnaire used in Study 2 consisted of seven parts:
Part I This portion of the survey deals with how hospital workers think about their work and the nature of working relationships they have with people from other disciplines/departments.
Part II This section deals with a number of statements intended to measure
perceptions about quality and hospital operations. Part III This section contains a number of statements that deal with
expectation. The purpose of this section is to help identify the relative importance of expectations relating to issues in these statements to individuals.
Part IV This section identifies attributes that might be used to evaluate quality of service work. Individuals are asked to rate how important each of these is to them when workers from other disciplines/areas deliver service to them.
Part V This section identifies a number of attributes pertaining to how
workers from other disciplines/departments might evaluate the quality of the individual's work. Individuals rate how important that they think each of these attributes are to these workers.
Part VI Individuals identify the five attributes they think are most important
for others to evaluate the excellence of service quality of their work.
Part VII Demographic and classification data.
Statements for Part I and II were developed based on responses and comments made by
interviewees in Study 1. They were scaled to be consistent with other parts of the survey

116
instrument. These sections were used to provide information about the attitudes of
respondents to service quality and to gain understanding of how they viewed aspects of
hospital processes and the nature of working relationships they have with other areas or
disciplines within the hospital. Respondents were asked to rank how strongly they felt
about the statement on a 7 point scale. They were also given the option of indicating
whether the statement was completely irrelevant to their situation.
The composition of Parts IV and V of the survey is an amalgam of questions taken from the
SERVQUAL instrument and custom designed. SERVQUAL questions were used in Parts
IV and V where items were assumed identical or similar in meaning. SERVQUAL
questions were used as they have been shown to be robust through extensive use in
previous studies. Approximately 20% of questions in Part IV are SERVQUAL based and
approximately 10% in Part V. The purpose of this study is not to replicate SERVQUAL,
and therefore it has not been used as a default. However, where SERVQUAL dimensions
and those identified in Study 1 are consistent, items have been drawn from SERVQUAL.
SERVQUAL has been extensively researched to validate its psychometric properties and
while it has attracted criticism for its conceptualisation of service quality measurement
issues, it nonetheless has been applied in a variety of industries, including healthcare (e.g.
Bebko, 2000; Boschoff & Gray, 2004; Hughey, Chawla & Khan, 2003; Newman, 2001;
Paraskevas, 2001). Items relating to the 12 service quality dimensions identified in Study 1,
and to examine the hypotheses of Study 2, were constructed in a similar format to the
SERVQUAL questions to provide consistency and to allow comparability with previous
research. SERVQUAL items used addressed issues relating to appearance, physical
facilities, doing things on time, accuracy, interest in solving problems and behaviour
instilling confidence.
Part VI addresses the five attributes respondents thought most important for others to
evaluate excellence of respondent service quality. Respondents listed five attributes they
thought were the most important attributes in the evaluation of service quality. They then
ranked these five items in importance. Respondents were asked to rank attributes they
perceived others would use rather than those they would use in evaluations of service
quality as it was thought that there would be less bias in responses. By thinking of what
others would do moved the focus of the respondent from their own world, and therefore, it

117
was felt that they would be more likely to reflect on the importance of attributes
unencumbered by their own preferences.
3.6.2 Scale issues - Study 2
Answers to survey questions are typically a choice of position, either within some category or
along some continuous spectrum (Alreck and Settle, 1995). Scales provide a representation of
the categories or continuum along which respondents arrange themselves, thus allowing
description of the distribution of respondents along the scale or in the categories. This permits
the position of various individuals or groups to be compared with one another. The nature of
scales used in this research was determined by the themes and factors identified in the depth
interviews and reference to the literature.
Seven-point Likert scales have been used in the questionnaire for this study. These are in
the form of bipolar semantic differential scales. A seven-point scale has no absolute mid-
point but was chosen to allow respondents more scope on either side of the perceived mid-
point of “4” to register meanings they attach to a particular response. Studies also indicate
improved reliability for scales with approximately seven points compared to other scales
(e.g. Masters, 1974; Birkett, 1986; Alwin and Krosnick, 1991).
Respondents were asked to rate each attitude object in turn on a number of seven-point
rating scales bounded at each end by polar adjectives or phrases. The category increments
are treated as interval scales so group mean values can be computed for each object on each
scale. Likert scales are commonly treated as interval scales (Cooper and Schindler, 2001;
Malhotra, 1999). An interval scale arranges objects according to their magnitudes and also
distinguishes this ordered arrangement in units of equal intervals. The use of a seven-point
scale is further indicated due to some attributes being evaluated in this study relating to
those found in the SERVQUAL dimensionality, and SERVQUAL uses a seven-point scale.
Also, with items taken from the SERVQUAL instrument either verbatim or modified to
reflect the environment in which the study was undertaken, the use of scaling comparable
to previous research provides greater reliability for the questionnaire.
118
A seven-point scale was used in Parts I to V of the instrument. In Parts I, II, and III
respondents were asked how they felt about statements made by indicating the strength of
their agreement with the statement by circling one of the numbers between 1 and 7 with 1
representing Strongly Disagree and 7 representing Strongly Agree. Respondents were also
given a Not Applicable option if they felt the statement was completely irrelevant to their
situation. In Parts IV and V, respondents were asked to indicate the importance of an
attribute by circling a number between 1 and 7 with 1 representing Not Important, and 7
representing Very Important. Respondents were also given the option of indicating that an
attribute was completely irrelevant to their situation by indicating that is was Not
Applicable.
In order to assess the relative importance of attributes, respondents were asked to identify
the five attributes they considered most important to others in evaluating service quality.
They were then asked to rank attributes in order of importance based on which attribute
they thought was most important, the second most important, and then the least important.
This approach allows identification of more salient factors when the nature of the issues
surveyed would generate similar scores among a number of factors. By forcing respondents
to identify the five most important attributes, and having them identify the most important
and so forth allows easier identification of key factors (Alreck and Settle, 1995; Malhotra,
Hall, Shaw & Oppenheim, 2006). This is particularly useful as it was expected that the
nature of the attributes being tested would make it difficult to identify salience and depth of
feeling between attributes. This type of scale was used in the SERVQUAL instrument
(Zeithaml, Parasuraman & Berry 1990), and is repeated in this survey.
As other researchers have used the SERVQUAL scale or modifications of it in their studies,
the use of the same style of scaling allows comparability of results in determining the nature of
dimensions used in evaluating internal service quality.
3.6.3 Questionnaire Pre-test - Study 2 The questionnaire was pre-tested in a study of 45 respondents with representation from each
stratum at a different location to where Study 2 was located. This was done to identify and
eliminate potential problems with the survey instrument (Malhotra, Hall, Shaw & Oppenheim,
2006) and to establish face validity. The pre-test was administered in a second hospital to

119
avoid contamination of data when the final survey was conducted. An additional pre-test of
the questionnaire was carried out with nursing and health related academics. In addition, the
survey was shown to people outside the discipline to test face-validity. After some minor
changes to wording had been made, the questionnaire was prepared for the survey.
3.6.4 Sample design - Study 2
The survey used stratified random sampling based on the strata developed for Study 1 (Allied
Health, Corporate Services, Nursing, and Medical). This sampling design is regarded as the
most efficient among probability designs (Sekaran, 1992).
With low response rates regarded as typical for mail surveys (Licata, Mowen and Chakraborty,
1995), measures were taken to improve response rates. This was achieved through the Quality
department of the hospital. The Quality Manager of the hospital, using staff lists, randomly
selected participants in the survey. Survey instruments were distributed through the internal
mail system accompanied by a letter from the respective discipline manager requesting
assistance in completing the survey. A return envelope was provided for return of the
completed questionnaire to the Quality Manager who acted as 'post office' for the survey.
Completed questionnaires were then collected for data entry and analysis. Follow-up was
provided in the form of a reminder to staff to complete the questionnaire.
In determining the sample size, consideration was given to the size of the population and the
groups being examined. Using the central limit theorem, and that the normal distribution is
used as an approximation to the sampling distribution whenever the sample size is at least 30,
it was decided to survey approximately half the staff at the hospital. However, for the medical
and allied health categories, it was necessary to survey almost the complete population of
these categories to ensure sufficient response to allow statistical analysis (Roscoe, 1975). The
significance of the central limit theorem is that it allows use of sample statistics to make
inferences about population parameters without knowing anything about the shape of the
frequency distribution of that population other than what is gained from the sample.
3.6.5 Sample response – Study 2

120
A total of 500 questionnaires were distributed on a proportional allocation to ensure that the
sample reflected the population using a stratified random sample in the same hospital in
which Study 1 was conducted. This sample approximates 50% of the hospital staff. However,
due to the small population of the medical and allied health categories, as near as possible to
all staff in these categories was surveyed to ensure sufficient responses.
Questionnaires were sent individually to employees for completion and return by a
specified date through the internal mail system of the hospital for collection by the
researcher. Managers provided cover letters to selected staff providing background to the
service quality nature of the research, thus ensuring that all respondents came from a
similar interpretation of service quality, reiterating hospital support for the research, and
inviting them to complete the survey. This approach contributed to the overall response rate
of 56.4%, with no strata falling below 50% of their responses. Response rates for Allied
Health and Medical exceed the normal experience in this type of survey. This was due to
the follow-up within these strata where managers reminded staff to complete the
questionnaire in person. This could be accomplished due to the small population in these
strata. The Nursing and Corporate Services strata show response is within the normal range
for this type of survey. Overall, response is representative of the hospital population.
However, in obtaining sufficient response from the Allied Health and Medical areas to
allow statistical analysis, these strata are over represented in relation to percentage make-up
of the population. This is in keeping with the stratified random sample method used for this
study and not expected to unduly bias data. These percentages are shown in Table 3.4.
Table 3.4 Study 2: Sample size and response rates
N % N (Total)
Sample Response % of totalResponse
Response Rate
Allied Health
65
6.08
50
40
14.18
80.0
Corporate Services 350 32.71 150 78 27.66 52.0 Nursing 600 56.07 250 127 45.04 50.8 Medical 55 5.14 50 37 13.12 74.0

121
Total
1070
100
500
282
100
56.4
3.6.6 Data analysis – Study 2
Data from Study 2 was analysed using SPSS. Descriptive statistics were derived and
analysed. However, to gain further understanding of the large number of variables, further
multivariate analysis was undertaken.
To define the underlying structure of the data matrix, factor analysis was performed. Factor
analysis addresses the problem of analysing the structure of the interrelationships among a
large number of variables by defining a set of common underlying variables (Cooper &
Schindler, 2001; Hair, Black, Babin, Anderson & Tatham, 2006). With factor analysis, the
separate dimensions of the structure were firstly identified, and then the extent to which
each variable is explained was determined. Once these dimensions and the explanation of
each variable were determined, the two primary uses of factor analysis (data reduction and
summarization) were achieved (Hair, Black, Babin, Anderson & Tatham, 2006). That is, in
summarising the data, the underlying dimensions describe the data in a smaller number of
concepts than the original individual variables. Data reduction was achieved by calculating
scores for each underlying dimension and substituting them in calculations for the original
variables.
In determining which factors to extract, the main criterion was the use of eigenvalues. That
is, only factors having eigenvalues greater than 1 are considered significant (Hair, Black,
Babin, Anderson & Tatham, 2006). Factors with eigenvalues of less than 1 are considered
insignificant and disregarded. These factors can also be depicted in an eigenvalue plot in a
Scree Test which plots the eigenvalues against the number of factors in their order of
extraction, and the shape of the resulting curve is used to evaluate their cut-off point.
To provide a more meaningful pattern of variable loadings (the degree of correspondence
between the variable and the factor, with higher loadings making the variable representative
of the factor) the factors were rotated. Orthogonal rotation involves maintaining the axes at
90 degrees, while oblique rotation rotates the axes without retaining the 90 degree angle

122
between the reference axes. There are a number of orthogonal rotation methods, but for this
research VARIMAX was chosen as it is regarded as giving a clearer separation of the
factors and has proved very successful as an analytical approach for obtaining an
orthogonal rotation of factors (Hair, Black, Babin, Anderson & Tatham, 2006). While, in
the results for Study 2 orthogonal rotation is reported, oblique rotation was also performed
but there was no substantial difference in the results obtained. This was consistent with the
findings of Dean (1999) who also reported no difference in results for these methods of
rotation.
Factor scores were also calculated for each factor. These factor scores were then used in
further analysis such as ANOVA to test hypotheses relating to the data. Hypotheses were
also tested using t and paired t tests. The results of these analyses of Study 2 are reported in
chapter 5.
3.7 Issues of Validity and Reliability
3.7.1 Reliability
The term reliability refers to the extent to which a scale produces consistent results if repeated
measurements are made. Positivists would ask whether the measure yields the same results on
different occasions (assuming no real change in what is measured) while phenomenologists
ask whether similar observations will be made by different researchers on different occasions
(Easterby-Smith, Thorpe & Lowe 1994; Rubin & Rubin, 1995). In other words, how reliable
are the results?
Broadly defined, reliability is the degree to which measures are free from random error and
therefore yield consistent results (Carmines & Zeller, 1979; DeVellis, 1991; Nunnally &
Bernstein, 1994). This means that reliable interval level measures consistently rank orders and
maintain distance between subjects. Imperfections in the measuring process that affect
assignment of scores different ways each time a measure is taken cause low reliability. Thus,
reliability is primarily a matter of stability: if an instrument is administered to the same
individual on two different occasions, will it yield the same result? In this research, where a
mix of qualitative and quantitative data is generated, the issue is concerned with whether other

123
researchers, collecting the same data, would obtain the same results. A number of approaches
to assessing reliability are shown in Table 3.5.
Table 3.5 Approaches to assessing reliability
Test-retest reliability: Measures the stability of responses over time, typically in the same group of respondents.
Alternative-forms reliability: Uses differently worded stems or response sets to obtain the same information about a specific topic
Internal-comparison reliability: Comparing the responses among the various items on a multiple-item index designed to measure a homogeneous concept.
Scorer reliability: Comparing the scores assigned the same qualitative material by two or more judges.
(Hair, Bush, & Ortinau, 2003; Nunnally and Bernstein, 1994; Tull and Hawkins, 1993)
In the qualitative data collection phase (Study 1) of this research, reliability of the semi-
structured interviews was improved through pre-testing the interview guide and conducting
pre-test interviews. Reliability in analysis of data was improved by an independent
researcher allocating respondent comments to the categories identified and comparing to
those of the researcher.
Problems with the test-retest approach include those who completed the scale the first time
may not be available for the second administration. Respondents may also become sensitive to
the scale measurement and therefore alter their responses, and environmental or personal
factors may change between the two administrations that may affect responses (Hair, Bush, &
Ortinau, 2003; Nunnally and Bernstein, 1994). Nunnally and Bernstein (1994) recommend
generally that the retest method not be used to estimate reliability.
Reliability of the survey questions used in Study 2 of this research was therefore endured
through statistical tests on data collected to determine the proportion of systematic variation
in scales used. This is done by determining the association between scores obtained from
different administrations of the scales using internal consistency measures. (Carmines &
Zeller, 1979; Nunnally & Bernstein, 1994; Nunnally, 1970). If the association is high, the
scales yield consistent results and are therefore reliable. One method of doing this is the
calculation of Cronbach’s coefficient alpha (Malhotra, Hall, Shaw & Oppenheim, 2006;
Nunnally and Bernstein, 1994). This coefficient varies from 0 to 1 with a value of 0.6 or

124
less generally indicating unsatisfactory internal consistency or reliability (Malhotra, 1999).
These tests were done using the reliability test in SPSS and are reported in Chapter 5.
3.7.2 Validity
Validity, like reliability, is concerned with error. Validity is concerned with consistent or
systematic error rather than variable error. Thus measurement that is valid embodies only the
characteristics of interest and random error (Tull and Hawkins, 1993; Sekaran, 1992). From a
positivist perspective, validity tests how well an instrument measures the particular concept it
is supposed to measure, while phenomenologists would question whether the researcher has
gained full access to the knowledge and meanings of informants (Easterby-Smith, 1994;
Rubin & Rubin, 1995). An attitude measurement has validity if it measures what it is supposed
to measure. If this is so, then differences in attitude scores will reflect differences among the
objects or individuals on the characteristics being measured. In surveys to measure attitudes, it
is presumed that attitudes are latent constructs residing in the minds of individuals (Krosnik &
Fabrigar, 1997). Four types of validity were considered: face validity, content validity,
criterion validity, and construct validity.
Face or consensus validity is concerned with the degree to which a measurement 'looks like' it
measured what it is supposed to measure (Litwin, 1995). However, it is often integrated into
content validity and lost as a separate test for validity (Hair, Bush, & Ortinau, 2003; Malhotra,
Hall, Shaw & Oppenheim, 2006). Face validity is a judgement made by the researcher as the
questions are designed. This was refined in this thesis through pre-tests, and evaluation by
other people. Thus, as each question was scrutinised there was an implicit assessment of its
face validity. Revisions enhanced the face validity of the question until it passed the
researcher's subjective evaluation. Having people unrelated to the discipline review the
questionnaire used in this study further tested face validity.
Content validity is the representativeness or sampling adequacy of the content of the
measurement instrument (Hair, Bush, & Ortinau, 2003; Nunnally & Bernstein, 1994). In other
words, content validity is the extent to which scales provide adequate coverage of the topic
being studied. Consideration of content validity in this thesis, and Study 2 in particular,
involved definition of what was to be measured based on both the literature and in-depth

125
interviews so that all relevant items could be included on the scale along with the selected
SERVQUAL dimensions. Then the questionnaire was pre-tested to identify issues with the
content and context of questions.
Criterion validity is the ability of a measure to correlate with other standard measures of the
same construct or established criterion (Malhotra, Hall, Shaw & Oppenheim, 2006;
Zikmund, 2000). This study seeks to identify service quality dimensions used by internal
service network members to assess service quality and to determine relative importance of
these dimensions. The instrument used in Study 2 is based on previous instruments in
question style and content. Some items were also taken or modified from SERVQUAL
which contributes to the validity of the instrument. Themes and issues not previously
addressed are covered using similar question formats and style that suggests results should
be comparable to previous studies. The instrument in this thesis has criterion validity based
on its association with previous research indicators of service quality in the examination of
internal service quality.
Construct validity is established by the degree to which the measure confirms a network of
related hypotheses generated from a theory based on the concepts. (Carmines & Zeller, 1979;
Malhotra, Hall, Shaw & Oppenheim, 2006; Nunnally & Berstein, 1994). Construct validity is
established during the statistical analysis of the data generated by Study 2. With construct
validity, the empirical evidence is consistent with the theoretical logic behind the concepts.
The mixed methodology used for this study encompasses semi-structured interviews and
survey data. Every effort has been made to accrually test what the researcher set out to
measure and the reliability of the processes involved.
3.8 Conclusion
The purpose of this chapter has been to establish that a valid and reliable research
methodology to systematically assess the nature of relationships among channel members
providing links in the internal service value chain has been used. The methodology needs to

126
identify internal service quality dimensions and compare these to existing measures of service
quality; examine relationships and their impact on evaluation of service quality and
performance.
The literature review reveals limited data that systematically assesses the issues raised by
the research questions and propositions about internal service quality in healthcare settings.
Studies in related areas were examined to determine usefulness in developing appropriate
research methods. While service quality and channel relationships have been investigated
previously, this prior research has not fully addressed the issues raised in this thesis. The
purpose of the studies undertaken in this thesis is to identify internal service quality
dimensions and compare them to those used in external service environments, to investigate
the nature of relationships in internal service networks and differences in expectations of
service quality between members of internal service networks. Figure 3.3 summarises the
research design for this thesis.
Epistemology is discussed to assist in providing an appropriate framework and justification
for this research methodology. The notion that positivism and phenomenology occupy
opposite ends on a continuum leads to placing this research toward the middle ground of
the continuum. Assumptions have been made in the literature that dimensions of external
service quality are transferable to internal service quality evaluation. However, it has not
been established that members of internal service value chains or networks in healthcare
use these dimensions, or how dimensions are used in evaluations of internal service quality.
Given this lack of a theory-based factor structure in the literature applicable to healthcare, it
is therefore necessary in this research to investigate the underlying dimensions of internal
service quality. This has been accomplished using phenomenological approaches such as
the depth interviews undertaken in this study.
Figure 3.3 Summary of research design for this thesis
Research Questions
Research Paradigm Issues
Research Methodologies Review
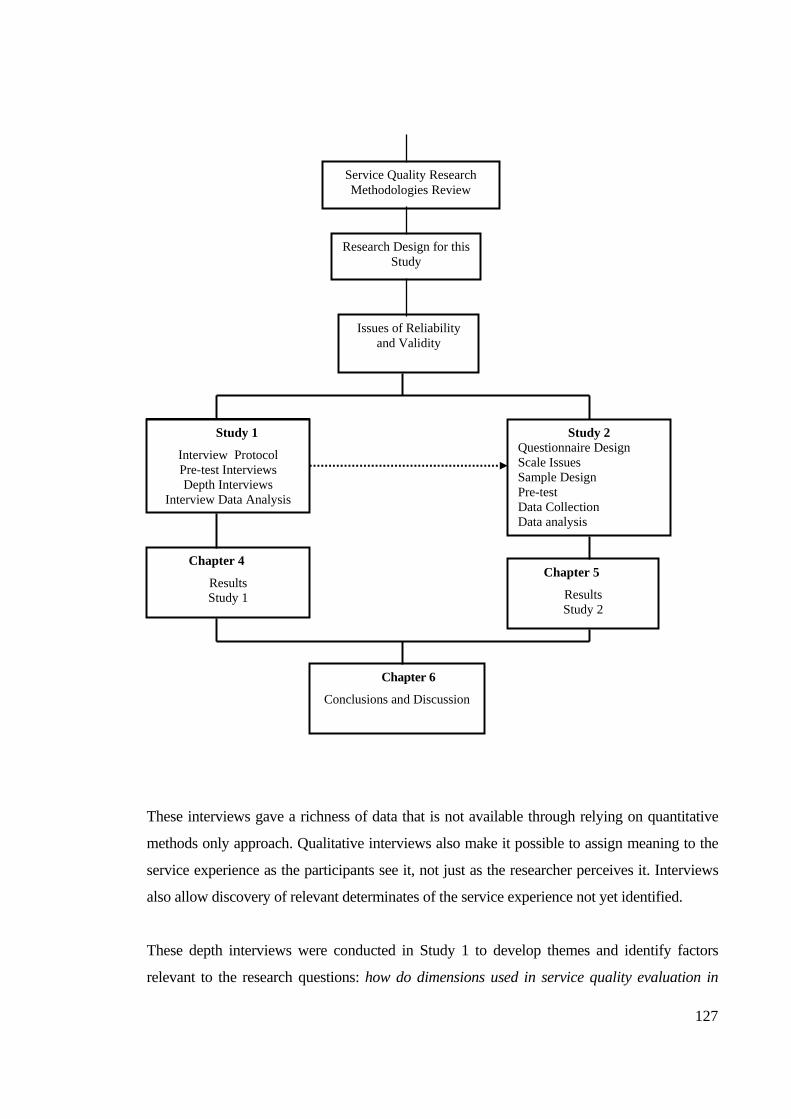
127
These interviews gave a richness of data that is not available through relying on quantitative
methods only approach. Qualitative interviews also make it possible to assign meaning to the
service experience as the participants see it, not just as the researcher perceives it. Interviews
also allow discovery of relevant determinates of the service experience not yet identified.
These depth interviews were conducted in Study 1 to develop themes and identify factors
relevant to the research questions: how do dimensions used in service quality evaluation in
Service Quality Research Methodologies Review
Research Design for this Study
Issues of Reliability and Validity
Study 2 Questionnaire Design Scale Issues Sample Design Pre-test Data Collection Data analysis
Chapter 4
Results Study 1
Chapter 5
Results Study 2
Study 1
Interview Protocol Pre-test Interviews Depth Interviews
Interview Data Analysis
Chapter 6
Conclusions and Discussion

128
internal healthcare networks differ to those used in external quality evaluations?; and, how do
different groups within internal service networks in the healthcare sector evaluate service
quality?. From Study 1, a quantitative survey in the form of a questionnaire was developed to
form the basis of Study 2. This mixed methods methodology allowed identification of themes
and factors important in the evaluation of internal service quality that would not have been
forth-coming in a single method approach.
Sample design for this research is purposive. Data in Studies 1 and 2 is based on a stratified
sample drawn from categories of hospital workers identified as medical, allied health, non-
clinical, and nursing. This design gave a cross-section of disciplines making up the internal
service value chain within the hospital in which this research was based, allowing examination
of the dimensionality of internal service quality between service groups.
This Chapter has addressed issues of research objectives for this study, epistemology, a review
of research methodologies and the articulation of the research design for this research. The
research methodology provides the rationale and procedures for collecting and analysing the
data necessary to appropriately examine the issues raised by the research questions and
propositions relevant to the studies undertaken in this thesis. The following chapter discusses
the analysis of the qualitative research in Study 1. Chapter 5 then discusses results of the
quantitative research performed in Study 2.

129
4.0 Results of Study 1 - an Exploratory Study 4.1 Introduction This chapter reports results of Study 1 examining service quality evaluation in internal
healthcare service chains. The purpose of Study 1 was to develop understanding of the
attributes and dimensions used by members of the internal service value chain or internal
service network in the healthcare sector to evaluate the quality provided by others in the
internal value chain. From three research questions: (1) RQ1 What are the dimensions
used to evaluate service quality in internal healthcare service networks?; (2) RQ2
How do dimensions used in service quality evaluation in internal healthcare networks
differ to those used in external quality evaluations?; and (3) RQ3 How do different
groups within internal service networks in the healthcare sector evaluate service
quality?, six propositions were formulated:
P1: Internal service quality dimensions will differ to external service quality
dimensions in the healthcare setting.
P2: Service expectations of internal service network groups will differ between
groups within an internal healthcare service chain.
P3: Internal service quality dimensions individuals use to evaluate others will
differ from those perceived used in evaluations by others in an internal
healthcare service chain.
P4: Ratings of service quality dimensions will differ in importance amongst
internal healthcare service groups.
P5: Internal healthcare service groups find it difficult to evaluate the technical
quality of services provided by other groups.
P6: Relationship strength impacts on evaluations of internal service quality.
Data was collected for Study 1 through 28 in-depth interviews conducted at a major
Queensland metropolitan hospital, with strata representing groups identified as Allied
Health, Corporate Services, Nursing, and Medical, to discover attributes and dimensions
used in descriptions of service quality. Interviewees were selected to be typical of the strata
in terms of the range of work and responsibilities held. These interviews provided a
richness of data to give understanding to the themes developed. At this stage of the research,

130
the attributes and dimensions are defined in terms of those identified in the literature to
allow consistency and comparability of findings.
An interview guide was developed and pre-tested (see Appendix 1). The guide provided
topics or subject areas to allow exploration, probing, and questioning to elucidate and
illuminate particular issues. The interview guide also provided an overall framework for the
interviews to establish the environment of the interviewee and the nature of working
relationships with people from other areas of the hospital. An understanding of the
importance of quality in the interviewee’s role, their perception of service quality and how
it might be measured, and whether they were aware of processes in place to evaluate quality
in the hospital was also gained through following the interview guide. The means used by
the interviewee to evaluate the quality of work done by people from other sections with
whom they worked, and the role of expectations in assessment of the quality of work done
was examined. Exploration of working relationships, time spent working with people from
different areas and how relationships might affect evaluations of service quality was also
undertaken.
To ensure that there was no contamination of the sample, those interviewed in the pre-test
were not in the selection pool and therefore not re-interviewed. Coding indicated a level of
saturation in the data with 28 interviews so that further interviews were not required. There
were 21 females and 7 males interviewed which approximates the gender balance within
the hospital. Interviews were recorded, transcribed and the data systematically analysed.
The data was firstly sorted and classified, and then categorized. Secondly, transcripts and
other materials were analysed to consider each of the themes. Then, thirdly, the data was
again scrutinized to refine themes and identify findings for each. Reliability was improved
through using an independent researcher to categorize the data to verify categories
identified.
The following sections report the findings of Study 1 that address the research propositions
generated from a review of the service quality literature and healthcare industry practice.
From the findings of Study 1, hypotheses are formulated for testing through quantitative
measures in Study 2.
131
4.2 Results of Study 1
4.2.1 P1 Internal service quality dimensions will differ to external service quality dimensions in the healthcare setting.
To explore the proposition that service quality dimensions will differ in an internal service
environment compared to those identified in the evaluation of service quality to external
service situations, an appreciation of worker understanding of the concept of service quality
and the dimensions that they might use to evaluate that quality is needed. Section 4.2.1.1
reports findings on notions of service quality within the hospital environment. Section
4.2.1.2 identifies the dimensions used to evaluate service quality in an internal hospital
service environment and compares these to dimensions identified in previous research to
establish any differences.
4.2.1.1 Defining service quality
At the heart of schema to evaluate service quality is an assumption that participants can
define service quality or at least they have an understanding of what represents service
quality. In Study 1, respondents were unanimous in articulating the importance of service
quality and identified quality as an essential element of service provision. However, when
asked to explain what was meant by service quality, most articulated a definition of quality
in terms of processes or user satisfaction. This is illustrated by the following responses to
the question, "What does service quality mean to you?"
Um………it’s providing a professional service that meets the needs of clients - the patient. (AH1) Service quality is working to time-frames - ensuring the department is accountable for work performed - come in on budget - but will sacrifice to meet patient needs - can fix budget down the track - can't fix patient later. (AH2) Expediting when a patient comes in and they are upset, distressed, anxious- they are suffering…they are in pain and alerting a nurse, a medical person of this patient…its quality care to get them into the emergency room, to have their chart there…stamped, they've got labels, the doctors have enough correspondence to write on…I think that's quality. (CS3) By the number of times you have to sort out problems I guess. (CS4)

132
I define it as you do your job properly…things are neatly done…patients get their proper appointments…things just don't get left you know and people would be ringing up saying didn't receive this appointment and tests get booked um instructions get properly written down so the patients… um …don't… say they're got to fast for a certain test and it doesn't get you know the appropriate people don't get told they'll eat something. (CS5) Jeez…I'm not really sure how to define quality to be truthful with you… (CS8) Um…service quality to me… ah…there's a lot of emphasis on just measuring the outcome according to performance indicators. For instance, the standard for people waiting for admission in outpatients is 30 minutes. (N1) To me quality is one of those words that that… one of those high-faluting, confaluting bloody meanings…if I can get a patient into the hospital…have their procedure done and get them out of hospital without any harm coming to them then I've done a good job. (N5) Well ahh…I dunno… (Laugh)…well, I don't know… (N8) Um… (Pause)…well I guess if we are talking about specific forms of information that um…if we looked at a service provided…it’s difficult to define because it means a lot of things in different circumstances. (M1) I think that's the overall quality of the service we provide…um…it's everything from access into the service, continuum of care…um…the role every member of the team plays. (M2)
The emphasis on quality programs over a period of time was evident despite difficulty in
articulating meaning. Staff appeared indoctrinated with the notion of quality within the
hospital and could recite the "mantra" of its importance. There was a sense of learning the
importance of quality with almost ‘textbook’ definitions but with an inability to further
develop the notion of quality. Conceptualising outside the measurable items listed on
quality review programs proved difficult. This is symptomatic of the tendency to only
consider items that can be readily measured rather than look at issues that may give greater
meaning to understanding the actual quality delivered.
As individual interviews progressed, a number of people became aware of their inability to
define quality in terms other than processes and became reflective on quality issues.
"You're asking tough questions" (AH3) is representative of this feeling. There was a feeling
that things other than processes should be looked at, which provided a springboard into

133
discussion on dimensions that might be used to evaluate quality in general and service
quality in particular.
4.2.1.2 Service quality dimensions Interviewees were asked to identify attributes that might provide a means of measuring
service quality. A number of people had difficulty in beginning to articulate attributes they
thought could be used to assess quality. Probing and restating questions brought responses
but often ideas were limited to two or three items before being exhausted. One nurse
expressed inability to identify attributes by stating: I don't know - I suppose it all boils
down to the way I was brought up… (N8) Another, attributes??? … (N1). An Allied Health
worker responded: I can’t think, I’m sorry… (AH6) On the other hand, others were definite
in nominating attributes they thought were an essential part of service quality. In many
cases, these attributes could be linked to quality programs within the hospital measuring
processes rather than service quality per se. Achievement on these measures was
considered reaching a quality level deemed acceptable.
The absence of complaint was frequently cited as a major measure of service quality. This
again is indicative of the difficulty staff experience in being able to conceptualise service
quality and attach meaningful measures of service quality. The following transcript
excerpts illustrate responses to the question "how do you measure quality?"
Flagging of incidents… (N2)
Complaints determine if we are doing a good job… (N3) Nobody brings in a complaint against me… (N5) We actually keep a register of patient complaints as it were…you know…when patients actually write back to the hospital or the ward and tell us about the service…but apart from that measuring it is quite difficult and subjective isn't it? (N7) My impression is that we will hear if something is not right… (AH5) Judge quality on how patient reports it… (AH7) …good or bad can be determined by complaints… (N3)

134
Positive feedback from relatives… (CS3) Only by way of complaint… (CS4) Oh, people tell you you've done a good job, people thank you for doing things for them…patients will complain… (CS6) I guess the best way is by the number of complaints…we keep a register of complaints… (CS8) Other direct ways we gauge quality are things like the compliments we get, the complaints we get… (M2)
The existence of complaints as a measure led to concerns as to how to classify this
dimension. The literature generally does not support "complaints" as a separate category in
itemising attributes used to evaluate service quality. Complaints were a means for staff to
obtain a measurable item on issues that may transcend a number of dimensions. They also
tend to relate to more tangible and easy to conceptualise problems (e.g. lateness).
Overall, the themes articulated as attributes used to evaluate service quality were classified
to yield 33 categories as shown in Table 4.1. No attempt was made to restrict categories but
rather to identify as many potential categories as possible. The number of categories at this
stage was unwieldy to work with but was an essential part of the process in understanding
overall issues people think are part of the evaluation process for service quality in a hospital
environment. In the absence of other measures, complaints are seen as a legitimate means
by hospital workers to assess service quality, however, rather than keep them as a separate
category or dimension, “complaints” were interpreted in a more generic light and seen as a
mechanism to demonstrate failures in specific attributes. Specific references to complaints
were classified in one or more of the items shown in Table 4.1 such as accuracy,
competence, communication, performance, feedback, and patient outcomes.
Review of the categories shown in Table 4.1 suggests that some simultaneously fit into
more than one broader category. The categories shown in Table 4.1 are not mutually
exclusive and concepts suggested by different strata have the potential to be classified in a
number of ways. Also, a number of dimensions were sufficiently closely aligned to be
logically considered to represent the same dimension but with different terminology. The
33 themes shown in Table 4.1 reflect dimensions used to assess quality in a hospital
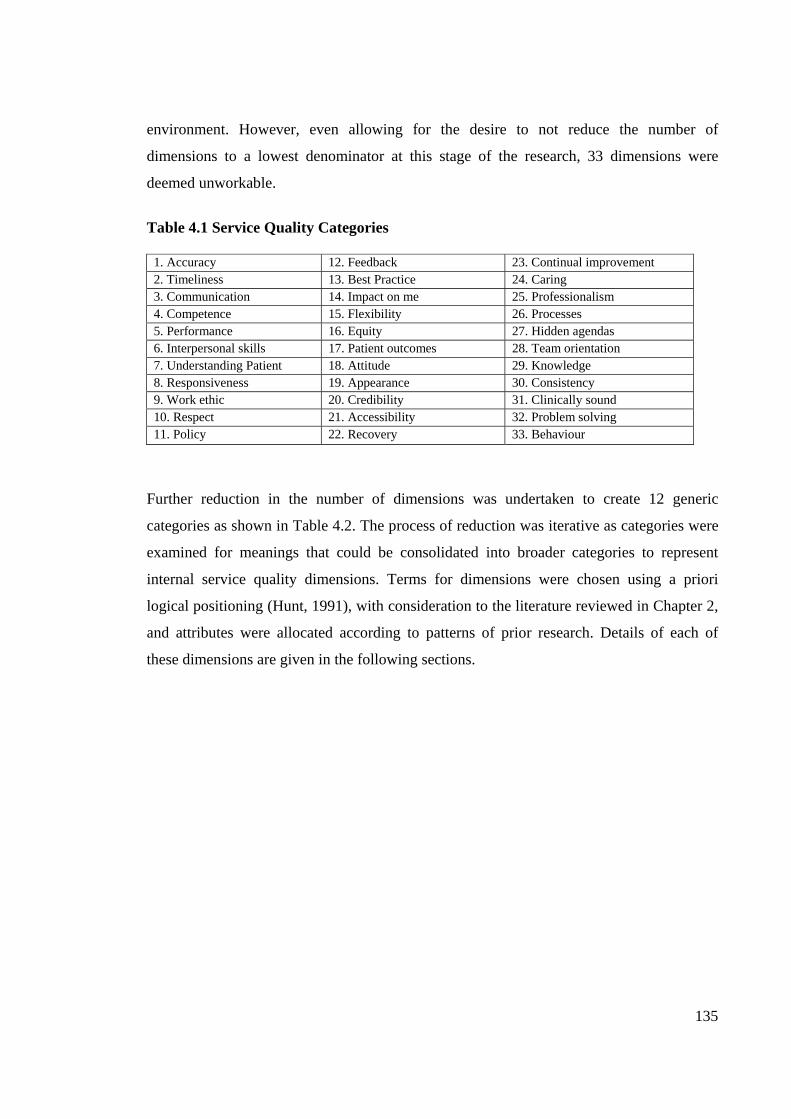
135
environment. However, even allowing for the desire to not reduce the number of
dimensions to a lowest denominator at this stage of the research, 33 dimensions were
deemed unworkable.
Table 4.1 Service Quality Categories
1. Accuracy 12. Feedback 23. Continual improvement 2. Timeliness 13. Best Practice 24. Caring 3. Communication 14. Impact on me 25. Professionalism 4. Competence 15. Flexibility 26. Processes 5. Performance 16. Equity 27. Hidden agendas 6. Interpersonal skills 17. Patient outcomes 28. Team orientation 7. Understanding Patient 18. Attitude 29. Knowledge 8. Responsiveness 19. Appearance 30. Consistency 9. Work ethic 20. Credibility 31. Clinically sound 10. Respect 21. Accessibility 32. Problem solving 11. Policy 22. Recovery 33. Behaviour
Further reduction in the number of dimensions was undertaken to create 12 generic
categories as shown in Table 4.2. The process of reduction was iterative as categories were
examined for meanings that could be consolidated into broader categories to represent
internal service quality dimensions. Terms for dimensions were chosen using a priori
logical positioning (Hunt, 1991), with consideration to the literature reviewed in Chapter 2,
and attributes were allocated according to patterns of prior research. Details of each of
these dimensions are given in the following sections.
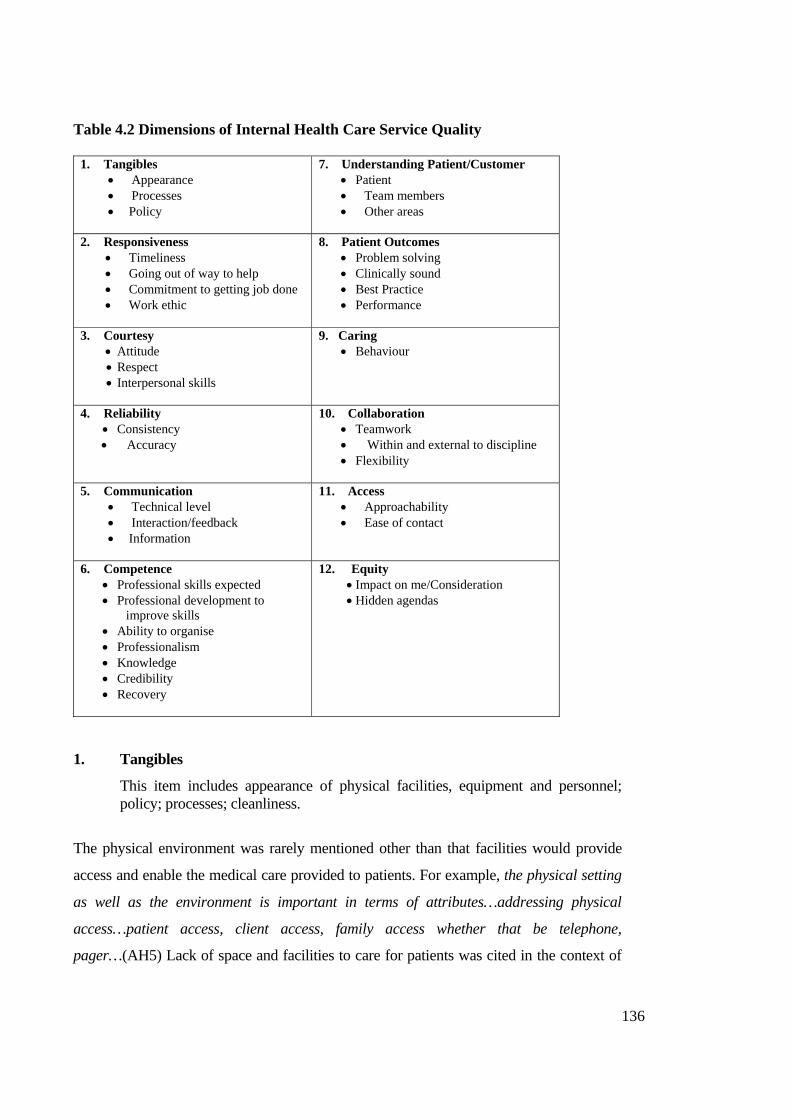
136
Table 4.2 Dimensions of Internal Health Care Service Quality
1. Tangibles • Appearance • Processes • Policy
7. Understanding Patient/Customer • Patient • Team members • Other areas
2. Responsiveness • Timeliness • Going out of way to help • Commitment to getting job done • Work ethic
8. Patient Outcomes • Problem solving • Clinically sound • Best Practice • Performance
3. Courtesy • Attitude • Respect • Interpersonal skills
9. Caring • Behaviour
4. Reliability • Consistency • Accuracy
10. Collaboration • Teamwork • Within and external to discipline • Flexibility
5. Communication • Technical level • Interaction/feedback • Information
11. Access • Approachability • Ease of contact
6. Competence • Professional skills expected • Professional development to
improve skills • Ability to organise • Professionalism • Knowledge • Credibility • Recovery
12. Equity • Impact on me/Consideration • Hidden agendas
1. Tangibles
This item includes appearance of physical facilities, equipment and personnel; policy; processes; cleanliness.
The physical environment was rarely mentioned other than that facilities would provide
access and enable the medical care provided to patients. For example, the physical setting
as well as the environment is important in terms of attributes…addressing physical
access…patient access, client access, family access whether that be telephone,
pager…(AH5) Lack of space and facilities to care for patients was cited in the context of

137
the facility where this research was conducted. Physical capacity to deal with patients was
also discussed in terms of waiting times for service provision.
The physical environment was evaluated in terms of patient safety. If the environment
compromises patient safety and well-being then there was an expectation that immediate
steps would be taken to remedy the situation. There is a feeling that if the tangible aspects
of the service are adequate, it is not an immediate factor. This implies that tangibles are
important but they only become an issue when they are not up to standard. There is an
expectation of quality of the tangible construct, and therefore being tangible, a relatively
easy dimension to evaluate. Up-to-date equipment, and facilities that cope with demand
and give a feeling of space, were seen by interviewees as part of a quality environment.
Anything that improved the ability to deliver service in the ‘servicescape’ (Bitner, 1992)
that extends beyond just the physical aspects was seen as a positive.
On the other hand, the human aspect of the servicescape or environment was seen as more
important. This extended to the working relationships in that environment, and the way
staff interacted not only amongst themselves, but also with patients and family. For
example, a staff member takes a patient and comes back upset with the reception they got
– it’s not so much care but relationships…(N3), and how they talk to me, how they treat
me, and how they treat patients…(N5) These relationships and personal interactions were
expressed as part of the “hospital” – meaning the servicescape. There was a sense that if
the environment did not impede service delivery in any way; then the physical
environment was not a factor in service quality evaluations in the same way as the
‘tangible’ dimensions has been reported in the literature. In Study 1, it appears to only
become a factor when minimum perceived levels are not met. This included, for example,
a management decision to cut down on the availability of snacks for theatre staff and to
provide “cheap bikkies etc,” an action that did not consider the impact on the working
environment and staff – thus affecting quality (M4). The quality of the work environment
was perceived as affected by this decision.
Another aspect of this dimension was its expression in terms of policy and processes.
Policy provides the framework in which work is performed given the personal and often
intrusive nature of services provided. Processes are defined in terms of medical procedures,

138
continuum of care, information transfer and processing and were considered important
dimensions in the provision of quality service.
Processes were seen to impact on service quality as they either facilitated, or were
detrimental in some way to patient care and the ability of workers to carry out their duties.
This was evident when looking at how one area might impact on the work of others. This
is illustrated in the Equity dimension discussed below with reference to hidden agendas
and the “impact on me” issues. Whether workers were “genuine” (N1) or not was a
dimension of evaluation in this context.
2. Responsiveness
Defined as speed and timeliness of service delivery, willingness to help, commitment and work ethic.
Timeliness was seen as a major dimension by all strata. For clinical staff, this may be a
function of the need to respond to patient care situations, especially in acute care units of
the hospital. Corporate Services staff also stated the importance of timeliness as it related
to processes they carried out. Failure to do something within a perceived reasonable time
was seen as an irritation and interference with the ability of staff to perform duties.
Timeliness is also easily and objectively measured and therefore forms part of
management measures of effectiveness. Instruments to measure time are also readily
available and easily interpreted by even the unskilled.
The importance of timeliness is illustrated in the following transcription excerpts:
…consistently punctual…they keep their word, they pass it on when they said they would. (CS1)
I like to do things… do it right…do it now. (CS5) turn up on time for meetings (AH2) …done in a timely manner. (AH7) …being timely in what they're doing… (AH6) Can they perform service on time…? (N1)

139
It's going to see the patient in a timely way… (M2) I would expect it to be available in a timely fashion… (M3)
Patients appropriately assessed, in a timely manner (M4)
Tardy responses were seen as a serious impediment to Corporate Services people being
able to perform their duties appropriately. There was a sense of lack of control over work
when others did not comply with perceived Corporate Services timeframes. Medical staff
on the other hand felt a sense of urgency in things being done in a timely manner as it
impacted on their ability to provide care. Medical staff need to wait for results of medical
tests and so a measure of the quality provided by laboratories was the timeliness and
accuracy of test results. Medical staff also expected records to be available as required with
entries fully completed. The irony of this from a Corporate Services perspective is that the
medical staff and nurses are mostly to blame for delays in records being available as they
would, according to several interviewees, often be in the wrong place or not completed. On
the other hand, clinical staff reported that Corporate Services as delaying delivery of
records. These issues illustrated an apparent level of frustration with aspects of
relationships between corporate services and clinical areas.
Going out of one's way to help was seen in the context of being there when it mattered.
Willingness to do whatever it took to get the job done and one's work ethic were themes
that are included in responsiveness. I would expect everyone to be like me – thorough, get
everything done, stay back if necessary… (CS3). Doctors, particularly surgeons, stated that
members of 'their' team would not be “clock-watchers.” This is linked to the idea of
commitment to getting the job done, and not letting personal issues get in the way of doing
job. Overall, work ethic was seen as a measure of the contribution one made to the team
and patient care. This was extended to perceptions of the level of caring one had for
patients.
3. Courtesy
Courtesy represents the politeness, respect, consideration, interpersonal and friendliness in dealing with other staff and patients.

140
The majority of staff spoke of the importance of courtesy in interpersonal interactions.
How they talk to me, how they treat me, and how they treat patients… (N 5), surely the
first area to measure would be the relationship area…, the way they talk to everyone (N7),
an ability to interact…(M1), wards men will do more for you if you have a good
relationship…(AH3), way they come across when they ask for something to be
done…(CS3) are examples of this. Courtesy was seen as an essential element in work
effectiveness and interaction with patients. One's attitude and professionalism were rated
in terms of the courtesy dimension. This was not only in relation to interaction with co-
workers, but especially patients or their families.
Another measure frequently cited was the degree of respect one had for other workers
within the team and in interactions with other disciplines. There was some concern by
several respondents that some disciplines felt superior to others and this was reflected in
attitudes towards others and general interaction. It does impact because you feel a little bit
unintelligent because of the level we are and that does put you off a bit (CS3). Some
people have a good interdisciplinary approach but some people aren’t into all that stuff…
(N7).
Interpersonal skills and relationships were considered an issue by all strata during the
interviews. They were particularly rated as important by medical and nursing staff. The
following transcription excerpts illustrate this:
…evaluate everybody…and it gets down to…the courtesy, the consideration, there's personal skills…interaction between the patient and the professional (M2)
For the person in the bed that relationship thing is most important…what they really want to see is a friendly face and somebody who will talk to them… (N7)
Evaluate others by how they talk to me, how they treat me, and how they treat the patients. (N5)
This area of interpersonal skills and relationships may be regarded as an element of the
teamwork dimension identified by Corporate Services interviewees as an important
dimension. Although some staff related ability to put these issues aside, there was a sense
that work was better when you had good relationships with colleagues and teamwork and a
function of this was interpersonal skills that helped build team- work. Interpersonal skills
141
were also seen as an element of the communication process and affected the transfer of
information. Clinical teams often meet to discuss patient intervention needs and because of
interdisciplinary nature of these teams, interpersonal skills and the working relationships
within these teams were considered important. There was some frustration expressed that
medical staff would not often attend these meetings and this led to a lack of cohesion in
working relationships.
4. Reliability
Reliability is the ability to perform the promised service dependably and accurately and includes consistency of performance.
Do it right, do it now… (CS5)
In an environment such as a hospital one expects a level of training that result in
dependable performance of expected services. Staff had firm notions as to what
constituted appropriate levels of performance within their own discipline [e.g., there are
certain outcomes (AH1), people use the system properly… (CS4), care based on
recognised standards… (N3)], but were reluctant or unable to comment on the accuracy of
work performed by others. Didn’t really understand things or what was going on… (CS6),
I’m not going to assess other people’s work… (CS7), how do you know…? (N5).
Performance was usually expressed only in terms of impact on the patient and themselves.
This may be due in part to the professional nature of the different areas within a hospital
where one does not presume to be an expert in another's field. One does not also comment
on the professional performance of a person in another discipline as it is assumed that they
are competent in their field.
However, consistency of performance and accuracy were significant factors for each
stratum in evaluating the performance of other workers in terms of the quality of service
provided and patient outcomes.
5. Communication
This dimension is defined as the ability of service providers to communicate so that other staff and patients will understand them. This includes the clarity, completeness and accuracy of instructions of both verbal and written information to be communicated.

142
It depends on the type of information transfer going on… (M1)
Making good notes, communicating… (M2)
Documentation level appropriate… (AH2)
Knowing what’s going on for the patient… (AH6)
How you explain things… (N1)
Communication – I like people to be up-front and give feedback… (N2)
It needs to be like to the point and what people want without being
verbose… (CS8)
They’re satisfied (patients) that they’ve all the information they need…
(AH6)
Effective communication was seen as an important quality dimension by all strata.
Communication takes place at an informal and formal level within the hospital environment.
Nevertheless, medical staff rated communication highly, particularly the timeliness and
accuracy of information relating to patient care. Communication was discussed not only in
the traditional oral sense, but also in terms of written communication through record
keeping, case notes and reporting results of medical tests. Lack of completeness or
untimely completion of records exasperated several interviewees. Overall, there was little
difference between strata relating to the communication dimension.
The nature of healthcare suggests that communication is a significant issue and this was
evident in the interviews. Communication exists on several levels with communication
relating to patient care paramount. This communication takes place between carer and
patient, ancillary staff and patient, family and patient, team members assigned to the
patient and a number of other permutations. Communication is a critical factor in personal
interactions.
The clarity and effectiveness of communication in the value chain is in most cases crucial
to the well being of the patient, thus the emphasis on its importance. The data shows that
much of this communication within and between network groups involves transfer of
information necessary for progression of patient treatment or effective performance of
duties. Given the critical nature of the sharing of information accurately and in a timely
fashion, it may be that communication is too broad a category and that information should
be investigated as a separate dimension. Communication between service providers and

143
patients or families on the other hand ranges from reassurance, counselling, and
information relating to procedures and treatments or rehabilitation programs, to
“socialising.” Interviewees show that communication with patients and their families often
requires interpersonal skills to enhance the communication process that may not be as
evident in the more technical environment of clinical care.
The data indicates that from internal service quality evaluation perspectives, there are
several levels of communication to be considered. Firstly, there is communication between
team members which interviewees rated as important to service delivery. Then there is
communication between team members and other areas interacting with that team. These
relationships generally constitute traditional views of members of the internal service
network. However, it was evident from the data, that internal service quality is also
perceived by members of the internal healthcare service chain in terms of interactions with
external customers, that is patients and patient family members. Comments such as how I
perceive they treat the actual client and family, whether they are listening…(AH5), how
they communicate with their patients…(N8) and can hear what patients are saying, both
what the overt message and covert message…(M1) are representative of these perceptions.
This suggests that assessments of communication for internal service quality evaluations
need to be multi-level and multi-directional.
Feedback was mentioned consistently as an important trait in evaluating the performance
of others in relation to communication. This is in recognition of the communication
process involving feedback to complete the communication loop.
6. Competence
Competence means the skill, expertise, and education to perform the service. It includes carrying out the correct procedures, the rendering of good sound treatment or service, and the general ability to do a good job.
Doing the A-1, A-grade, Gold Mark standard of treatment… (AH3)
Accuracy is most important… (CS4)
There was a general feeling that anyone employed to work in a hospital would have a
minimum level of competence prior to being employed by the hospital or health department.

144
This is assumed with the professional qualifications that personnel are required to meet.
Competence, professional skill and performance are regarded highly by clinical staff and
relate to the patient outcomes. Patient outcomes are a function of how all these come
together. Corporate Services put these attributes in terms of accuracy. To Corporate
Services staff, accuracy led to positive outcomes for them. Accuracy lessened the impact on
them; they were not correcting others’ omissions and mistakes. Accuracy allowed them to
perform at an appropriate level.
Observations included comments that those who did not maintain professional standards were
"weeded out" in due course. There was reluctance to suggest that one was able to comment on
the competence of others. However, observations of nursing staff who you think are a bit
sloppy or comments like I'd hate for them to be my doctor were made. Overall, the perception
was that personal opinions would be formed but not articulated other than in conversations
with close colleagues who one perceived had been similarly affected as evaluations could be
based on hearsay, or what we hear back.
Knowledge, the ability to organise oneself and activities, and overall professionalism were all
considered important elements of showing competence. This competence in turn lent
credibility to workers. They have to be all based on having a good knowledge…understand
the literature and keeping up to date with it… (M1)
Keeping one's skills up to date was seen as an important aspect of competence. Got the
additional post-graduate qualifications and skills… (N1) is typical of these comments.
Provision of time and incentives to pursue professional development by the hospital was
seen as an important 'benefit' to staff. Staff who did not appear to wish to progress in this
area is regarded as letting themselves and the 'team' down.
Another aspect of competence was the understanding that given the nature of patient
involvement with the hospital that regardless of professionalism and competence things
did not always go to plan. The ability to adjust to the situation and recover from situations
that may not have been effective in meeting patient needs was seen as essential by all
strata. Unfortunately for the patient, recovery on the part of the healthcare service provider
does not necessarily mean recovery for the patient.

145
7. Understanding the customer
This dimension includes understanding the needs of the patient and patient's family on one hand, and the needs of staff on the other. It is often expressed in terms of meeting the medical needs as well as the social, mental, and emotional needs of the patient.
They would be treated medically but not their known social or psycho-
social other issues… (AH6)
If a relative of a patient was sitting there for quite some time…I would
check to see how the patient was going…if they could not go in I would
offer them a cup of tea…just to reassure them… (CS3)
You didn’t help anyone (other staff) because they might expect it later…
(CS5)
They really need a friendly face and someone to talk to… (N7)
Linked to understanding the patient is appreciation of the needs of family members given
that a loved one is in need of medical care. Some staff recognised the patient in terms of a
“customer” but this term was generally seen as inappropriate in a medical environment. In
terms of understanding the needs of other staff, there was limited understanding of other
workers as “customers.” However, the concept of an internal customer was apparent in the
context of inter-personal interactions as well as professional support and service provision,
especially in support of patient care. Understanding the impact of actions on others was
seen as critical in meeting needs of internal service networks. This aspect is addressed
further in the Equity dimension.
Understanding the impact of actions on others raises the question as to who the customer
is. This study deals with internal service quality and evaluations of service quality within
an internal service chain. Yet much of the discussion by respondents in relation to these
internal evaluations was in terms of the patient or patient families, who may be viewed as
external to the organisation. This creates another dimension in evaluations and suggests a
multi-level approach to evaluations in an internal healthcare service chain.
8. Patient Outcomes
Patient outcomes are defined as relief from pain, saving life or quality of life, and
satisfaction after medical treatment.
146
Patient outcomes and the patient were the focus of most respondents. They saw
themselves as being there for patients and everything they did was essentially in response
to patient needs. Therefore, performance was measured in terms of patient outcomes. We
are able to see either by outcomes or just moving around the ward (AH1). If something
one did had an adverse impact on a patient, then it would be regarded as an unsatisfactory
outcome. Patient outcomes appear as one measure that is trans-disciplinary and a
dimension on which people were prepared to evaluate others, and in particular other
disciplines on a more subjective level even to measure colleague’s work through
performance that you see (AH5). If the patient was in pain, or quality of life had
diminished as a result of some intervention, then one would question the performance of
the provider unless some other factor was evident. We look at the care patients are
given…looking at the steps…improving what we’re doing…medical outcomes (N3). Care
is to be clinically sound and based on best practice.
Focus on the patient is illustrated in the following transcription excerpts of Study 1:
Evaluate the quality of work done by others by how it impacts on my patient…timeliness and appropriateness of treatment provided (AH3)
Outcomes of patient care…have we met primary goal…did we meet what we set out to do… (N2)
Looking at…um…what's being achieved in terms of outcomes that your intervention and outcome measures… (AH5)
Probably primarily in terms of patient outcomes… (AH6)
Outcomes for the patient are number 1… (AH8)
We have a set of clinical indicators that we collect data on… Whatever we do is for patients… (CS8)
Whatever gives you a good guide that they are getting good care… (N3) I would rather look at the well-being and need for the patient… (N8)
Um…well, we could look at the outcomes I guess. At the end of the day that's what we are trying to achieve… (M1)
I think you've got to have a satisfied patient…that's the most critical aspect… (M2)
147
This focus on the patient thus affected perceptions of the importance of particular
dimensions, as dimensions were often qualified on the basis of how these dimensions
impacted on the patient and patient outcomes rather than the individual worker. The
impact on the worker was generally secondary to the impact on the patient. However, it
should be noted that this focus on the patient did not feature as strongly in non-clinical
staff responses. The relationships clinical staffs have with patients may be a factor in
these assessments.
This may be linked to traditional healthcare quality measures that have focussed on
medical outcomes and have been extended to the service aspects of care. Patient outcomes
are more objective and visible manifestations of medical intervention and have some
capacity to be measured and evaluated. It is one area where staff are prepared to make
some judgement on the performance of workers from other disciplines.
Linked to patient outcomes was reaction of family members to the care received by the
patient. Family satisfaction was seen as an extension of patient outcomes. A complaint by
a family member was seen to be an extension of the patient's experience and therefore a
reflection on the hospital. This focus on the patient introduces a third-party relationship
external to the service dyad between workers. This is an additional dimension not present
in usual service dyads where there is a service provider and recipient.
9. Caring
Caring is the concern, consideration, sympathy and respect shown to patients and their families. This includes the extent to which a patient is put at ease by the service and made to feel emotionally comfortable.
I would rather look at the well-being and need for the patient… (N8)
I think humanity might be the most important… (M1)
Given that this study took place in a healthcare facility, it would be expected that staff
would be caring in nature and performance. In this environment, care is probably more
heightened than in other service contexts. Caring was expressed in terms of the way in
which a patient was spoken to, respect of the person during physical intervention, physical
care of the patient, and the way in which carers and staff interacted with family members.

148
Caring was a reflection of the behaviour and personal interaction of health carers and
support staff.
Caring was a dimension evident in all stratum. However, there were different levels of
caring and different targets for care. For clinical related disciplines caring predominately
was directed toward the patient or by extension to the patient’s family. Caring in the
Corporate Services context related more to the care one took in doing one’s job and how
other workers cared about them in the performance of their work. The Corporate Services
view was of the more traditional view of a service relationship between service provider
and recipient, whereas, clinical staff have the patient as a third-party in this internal service
value chain.
This dimension also reflects a multi-level nature of service evaluation evident in other
dimensions in this study.
10. Collaboration
Collaboration includes teamwork, synergy of teams and departments within the internal service network, internal and external to disciplines, and the hospital itself.
There’s a two-way sort of trade… (M2) Sort of working from different perspectives but to get the same aim for the person we’re treating… (AH7)
Team work is important…need to work together… (CS4)
The attribute of Collaboration shows the importance of teamwork in an internal service value
chain. All strata in the study regarded collaboration as significant in the performance of their
duties and the ability to meet patient needs. While specific teams are operative and
collaboration within the team is essential to patient care, there is a perceived need for
collaboration between disciplines and units of the hospital. This collaboration takes a number
of forms including units working toward the overall success of the hospital within budgets and
resource allocations provided, flexibility in work patterns and interaction to allow for fluid
situations relating to patient care, and cooperation in meeting time constrained activities.
11. Access
Access involves approachability and ease of contact.

149
This dimension is indicated in interaction between team members from multiple
disciplines and interaction between different areas. On one hand, there is implicit and
explicit availability of staff through the processes that are required to care for patients and
the hospital throughput. However, resource constraints impact on this dimension and may
lead to delays in patients being seen. I think it also has to be followed up with a real
allocation of time, support resources and things…to say to staff how can we help you to do
that... (N2). This often means that personnel are unable to communicate with others and
need to wait for responses. This lack of access leads to various levels of frustration.
Interpersonal interactions are affected by personality and personal factors that impact on
the approachability of staff members by others. On the surface, it appears that people state
that in a professional environment they are not overly concerned with this issue. This may
be due to understanding of professional needs of team members and other disciplines as
well as the processes in place that provide structure to clinical pathways and the general
treatment of patients. Professionalism would dictate that processes would be followed
regardless of personal feelings. However, many respondents indicate a preference to work
with people whom they know and get on with. I look forward to working with certain
people (AH7, AH8, N1), makes a difference who you work with (CS6), are they pleasant
to work with (N2), I enjoy the company of some versus others (N5), and I look forward to
working with some people as I know I will have a good day (N6) are illustrative comments
of this. In other situations, some respondents indicate that they just do what they have to
and tend to keep to themselves if in close contact, or avoid the staff member in question if
possible. Just come in and do my work (CS3), it affects the way you work… you don’t
enjoy working with them (CS4), I just put my head down (N4), and just keep to myself
(AH4) are examples of comments made by interviewees. These situations translate into
evaluations of interpersonal skills when assessing the approachability and accessibility of
staff members.
12. Equity
This means a sense of equity or fairness in working relationships, the impact that actions of others have on co-workers, and no hidden agendas.

150
You are judging them on the chain of events and it’s the smoothness or bumpiness…that you are basing your assessment on… (CS4) If we thought it affected the work we do… (CS5)
How it impacts on my work… (AH7) How they impact on me (AH2) Impact on staff (AH3) What impact will they have on my role (N1) The dimension of equity and the subsequent impact on me address the notion that work
performed by other workers should not have an adverse impact on an individual. These
notions of equity and fairness in an internal healthcare service chain were found in Study 1. I
expect things done properly so it doesn’t impact too much on us (CS6) and outcomes of what
they done and how it affects us (CS4) reflect this attitude. Interviewees reported that workers
should have consideration for other workers, especially those in other areas, and they are
influenced by how they talk to me, how they treat me… (N5). These were seen as significant
issues by a number of respondents who felt that they were often impacted on by the actions of
others outside the normal expectation associated with working relationships. As a result of this
impact, interviewees felt that they were not being treated fairly and so there was inequity in
the relationship.
Equity does not appear in the previous studies of service quality shown in Table 4.3
(Section 4.2.1.3), nor has it been suggested as a specific factor in evaluations of service
quality generally and internal healthcare service quality specifically. Equity has been
identified generally as fairness in the literature relating to external consumer satisfaction,
fair treatment in relation to other customers in external transactions and external service
recovery processes, and an overall antecedent to satisfaction in external service encounters
(e.g., Fisk & Coney, 1982; Fisk & Young, 1985; Oliver, 1997). But equity does not appear
to be identified in the marketing literature as a direct factor in evaluations of service quality
in internal healthcare environments. The context of equity in an internal service chain
appears to be in relation to the perceived impact of other members of the chain on an
individual, which may be more consistent with organizational behaviour investigations of
equity. While equity is seen in the social dimensions of service quality discussed in the
literature review, this finding of Study 1 suggests that concepts of equity and fairness as
commonly used in the marketing literature may need expansion to allow transferability to
internal service chains.

151
The term equity was chosen as it deals with the feelings of staff that others’ work may
inequitably impact upon them, and that they tend to measure performance of others in terms
of the impact on them individually as opposed to another category of the impact of services
performed on patients.
Also affecting perceptions of equity was the notion of ‘hidden agendas’. Having no "hidden
agendas" is included in this dimension given the impact on the worker of encountering
them. These agendas were also reported in terms of the affect on interrelationships –
suspicion as to what is their agenda? (N2) On the other hand, work is affected because
people are looking for hidden agendas (N1). The agenda of management was sometimes
also seen to be hidden, they keep telling us we do a good job but they keep trimming
budgets and we still have to do the work (AH3). While alternative agendas would be
expected given the diverse disciplinary mix in an internal healthcare service chain, and
indeed, were evident as interviewees reported differences expressed in team meetings, there
was a sense of being taking advantage of by the agendas of others. Hence, these ‘hidden
agendas’ affected perceptions of internal service quality and are part of the sense of equity
felt in transactions forming the relationship within the internal healthcare chain.
Hidden agendas are included in this dimension as they are seen to unfairly impact on
others. This aspect was mentioned by some of the respondents who felt that other parts of
the organization were working to an agenda that often did not take into account the needs
of others. This is an indication of the breakdown of the internal service chain.
In speaking of agendas, staff at times referred to the internal machinations of the various
disciplines and sections of the hospital and the impact these have on other areas. Therefore,
having 'agendas' got in the way of the primary mission of the hospital to care for patients as
groups being more concerned with a disciplinary focus than broader patient care issues
distracted people. In cases where people suspected others of having 'hidden agendas',
decision-making and programs were viewed with mistrust.
This dimension of equity was also implied as interviewees discussed the nature of working
relationships and how members of teams interacted internally and with other areas of the
hospital. The statement that the bottom line is if they make grief for you (CS4) summarises
152
attitudes relating to this. The roles of teams are significant in patient care in many areas of
the hospital and are multi-disciplinary by nature. In terms of patient outcomes, there were
implications that the nature of care given could impact on other staff causing them to need
to rectify situations or take actions that they would not have otherwise had to undertake if
the job was done 'right' the first time.
The findings of Study 1 suggest that equity is a key dimension in evaluations of healthcare
internal service quality. Underpinning this dimension is a sense of equity in working
relationships, the impact that actions of others have on coworkers, and the absence of
‘hidden agendas’. However, equity’s significance as a factor needs further evaluation and
this is undertaken and reported in Study 2.
4.2.1.3 Comparing dimensions of this study to previous research
A comparative study was done using common attributes from previous research. The
studies selected do not provide a comprehensive list of dimensions but are representative of
those identified in the literature that one might expect to be identified as salient in internal
service quality evaluation if transferability from external to internal situations is relevant.
Parasuraman, Zeithaml, and Berry (1985, 1988) were chosen as they have provided the
SERVQUAL dimensions (Tangibles, Responsiveness, Empathy, Assurance, Reliability)
that have become standard for much of the service quality literature. Gronroos (1984)
provides dimensions from the Nordic perspective, identified in Chapter 2, while Lehtinen
and Lehtinen (1991) and Dabholkar, Thorpe, and Rentz (1996) represent extensions of
conceptualising and evaluating service quality. The hierarchical dimensions of Brady and
Cronin (2001) were also used for comparative purposes. Bowers, Swan, and Koehler
(1994), Jun, Petersen, and Zsidisin (1998) and Reynoso and Moores (1995) are healthcare
based studies that allow more direct comparison of dimensions consistent with the
healthcare base of Study 1. The results of this comparison are summarised in Table 4.3. The
dimensions of Brady and Cronin (2001) are not shown in Table 4.3 due to their multi-level
conceptualization of service quality. Their primary dimensions of interaction quality,
physical environment quality, and outcome quality are presented with nine sub dimensions
modified by a reliability item, a responsiveness item, and an empathy item. Each of these
elements is represented by items presented in other studies. It is their hierarchical

153
representation of these elements that sets theirs apart from other studies. Initially the 12
dimensions shown in Table 4.2 (Tangibles, Responsiveness, Courtesy, Reliability,
Communication, Competence, Understanding Patient/Customer, Patient Outcomes, Caring,
Collaboration, Access, and Equity) were compared to these dimensions. Then consideration
was given to other themes identified in Table 4.1 and how they equated to dimensions from
the literature shown in Table 4.3.
The dimensions of tangibles and reliability are common to each of these studies.
Responsiveness was identified in each study except Dabholkar, Thorpe, and Rentz (1996).
This suggests that these broad dimensions are present in some form or another in both
evaluations of external and internal service quality. The SERVQUAL dimensions of
assurance and empathy are represented across studies, but have been reported more in
terms of factors that are generally seen to make up assurance and empathy than being
specifically labelled.
Of the twelve core dimensions identified in the study reported in this dissertation, eleven
are reported in other studies. This means that there appears to be consistency of attributes
used to evaluate service quality in both external and internal situations. However, in
comparing the studies and nuances in this study, there seems to be inconsistency in how
attributes are used in internal service evaluations. The twelfth dimension, Equity, for
example, is not listed in the service quality literature as a specific service quality dimension
but rather an antecedent to satisfaction. This study suggests that equity is used in internal
service quality evaluations in line with findings in the organizational behaviour literature
relating to fairness in interactions (e.g. Flood, Turner, Ramamoorthy & Pearson, 2001).

154
Table 4.3 Summary of external service quality dimensions compared to Study 1 findings
Dimensions Study 1
PZB GR LL BSK DTR JPZ RM
Tangibles* X X X X X X X X Processes b Policy b X Responsiveness* X X X X X X X Promptness/timeliness b X X Work Ethic b Collaboration X X Teamwork b Flexibility b Empathy Access* X X X X X X Communication* X X X X X X Feedback X Understanding* X X X X X Equity X Consideration b X Caring X X X Respect b Assurance X X Competence* X X X X Courtesy* X X X X Personal Interaction b X Credibility* b X X X X Security* X X Professionalism b X X X Knowledge b Behaviour X X Problem Solving b X Confidentiality X Recovery b X X Reliability* X X X X X X X X Outcomes X X X Preparedness b X Accuracy b Consistency b *Original PZB dimensions before consolidated Bold dimensions = PZB consolidated five dimensions
PZB = Parasuraman, Zeithaml, Berry (1985, 1988) GR = Gronroos (1984) LL = Lehtinen & Lehtinen (1991) RM = Reynoso & Moores (1995) BSK = Bowers, Swan & Koehler (1994) DTR = Dabholkar, Thorpe & Rentz (1996) JPZ = Jun, Petersen, Zsidisin (1998)
Dimensions shown with a bold X for this study are the 12 dimensions identified in Table 4.2. Dimensions shown with b under this study represent dimensions indicated in Table 4.1 that relate to dimensions found in previous studies or are indicated by this study.
Outcomes and caring are dimensions identified by Bowers, Swan and Koehler (1994), Jun,
Petersen and Zsidisin (1998) and this study. These studies are based in healthcare,

155
suggesting that outcomes, particularly patient outcomes, and caring may have greater
salience in healthcare environments than in other situations. In a healthcare situation,
outcomes may be more measurable compared to notions of responsiveness, reliability,
empathy and so forth. Caring may be a factor due the nature of health ‘care’. Questions are
also raised as to the hierarchical nature of service quality (Dabholkar, Thorpe & Rentz,
1996) and how service dimensions may interrelate. The results of Study 1 also suggest that
dimensions impact on other factors in a variety of ways and that some may be modifiers of
others (e.g. something is reliable, responsive etc) and any tool to evaluate service quality
would need to take these into account. It may be that outcomes is a broad dimension of
internal service quality and that other sub-dimensions comprising of some number of
dimensions identified as attributes combine to provide the outcome being evaluated. This is
consistent with the findings of Brady and Cronin (2001), suggesting that service quality is a
hierarchy of multidimensional factors, with outcome quality a function of waiting time,
tangibles, valence, and also impacted by social factors.
Another consideration in the application of external service quality dimensions and
approaches to internal service quality evaluation is the apparent triadic nature of a number
of relationships that alter the usual conceptualisation of service provision as an encounter
between a service provider and service recipient. That is, while evaluations are made of
members of the internal service chain, these evaluations are mitigated by the impact on a
third party, namely the patient in this case. Previous studies do not consider the network of
relationships making up internal service delivery and the impact these may have on service
evaluation.
Personal interaction was seen as an overall dimension influenced by a number of other
factors in Study 1. In Study 1, personal interaction was included as a component of
interpersonal skills in the broader context of courtesy. Dabholkar, Thorpe, and Rentz
(1996) suggest that Personal Interaction is a major dimension of service quality also
moderated by other sub-dimensions. Interaction quality is also a major factor identified by
Brady and Cronin (2001), moderated by sub dimensions of attitude, behaviour and
expertise. The use of the term courtesy in this study was based on the external service
quality literature and covers the notions raised by Dabholkar, Thorpe, and Rentz (1996).
This also questions the direct application of external service quality dimensions to internal

156
service quality evaluations. This tends to support the social dimensions of service quality
discussed in the literature review.
It also appears that much of the literature has focussed on the service recipient in
developing service quality constructs. The perspectives of participants in each part of the
internal service chain have not been fully considered. This raises the question as to
differences in perceptions of service quality dimensions used to evaluate others in the
internal service chain versus those perceived used by others.
Study 1 reveals that in a healthcare environment, there are a number of attributes used in
the evaluation of service quality that partially confirm those reported in previous studies.
The tendency to consolidate dimensions to the lowest denominator such as the five
SERVQUAL dimensions of Parasuraman, Zeithaml, and Berry (1988) may be distorting
evaluations of internal service quality. Comparing the results of Study 1 to other studies of
internal service quality suggests a number of differences in labels and emphases. These are
summarised in Table 4.4.
The importance of communication in internal service quality evaluations is highlighted in
each study shown in Table 4.4. Then, finding general agreement across these studies on
dimensions and what to call them appears problematic. However, through comparison of
definitions and interpretation of the terms, it is possible to match a number of the
dimensions. For example, the term competence used in this study encompasses the notions
of professionalism and preparedness identified by Reynoso and Moores (1995).
Collaboration and access (this study) might include teamwork and organization support
respectively from Matthews and Clark (1997). Responsiveness (this Study) might include
the issues related to helpfulness (Reynoso & Moores, 1995) and service orientation
(Matthews & Clark, 1997). A number of items lost through aggregation to the 12 core
dimensions are evident in these other studies as shown in Table 4.4. Items from other
studies supported by Study 1 are shown with a b to indicate that these were identified but
labelled differently or included in other dimensions during consolidation of items. Results
of these studies suggest that the orientation of dimensions and nuances of meanings differ
to those of external service evaluations.

157
Table 4.4 Comparison of this study to other internal service quality investigations This Study Reynoso &
Moores (1995) Matthews & Clark (1997)
Brooks, Lings & Botschen (1999)
Tangibles Tangibles Responsiveness Responsiveness Courtesy Courtesy Reliability Reliability Reliability Communication Communication Open Communication Communication Competence Competence Competence Understanding the customer
Understanding the customer
Patient Outcomes Caring Collaboration Access Access Equity
b Flexibility Flexibility b Promptness
Confidentiality b Helpfulness b Consideration b Professionalism
Service orientation b Performance
improvement
b Teamwork b Intra-group behaviour
Change management Objective setting Organization support b Personal relationships
Leadership Leadership b Credibility b Attention to detail
bIndicates items suggested in Study 1 but included in other items.
One purpose of the interviews in Study 1 was to identify dimensions used in an internal
service value chain to evaluate the quality of service between elements of that service chain.
These were then compared to those found in the literature in external service quality
evaluations to determine transferability of external service quality dimensions to internal
service quality evaluations. While labels attached to dimensions suggest that transferability
is appropriate, further analysis suggests that complete acceptance of dimensions as
suggested in the literature is not supported. Study 1 finds that the nature of service quality
evaluations in internal service chains is sufficiently different to challenge assertions in the

158
literature that external approaches to service quality evaluation are readily applicable to
internal service quality chains.
4.2.2 P2 Service expectations of internal service network groups will differ between groups within an internal healthcare service chain
Expectations are generally seen as fundamental to explanations of the nature and
evaluations of service quality. Interviewees were asked “how do your expectations
influence your assessment of the quality of work done?” They were then asked, “If your
expectations are met are you satisfied with quality?” These questions were asked to
investigate the perceptions of individuals of how they view expectations in their evaluations
of others in a healthcare internal service value chain, and to begin evaluation of Proposition
2:
General response firmly supported the notion that expectations do influence evaluations of
others and that when expectations were met then satisfaction with the quality of work
performed would be experienced. How they influence evaluations of quality of work done
is indicated by the following examples:
I do feel disappointed if they don’t follow through the way I would have (CS3)
I guess it’s the standards you set so if they don’t meet standards… (AH1)
I have high expectations of myself so I tend to expect a high level from other people and a commitment to what they are doing (AH6)
I guess your expectation is kind of what you base things on (AH7)
Make sure that people who work with me understand what I want them to do (M1)
I might be happy with the final outcome, but not the process to get that outcome (CS8) If people don’t come up to my standards I’ll probably tell them (N5)
I expect others to deliver as I would (N6)
Discussions about expectations signalled the role of expectations for each group. Often
responses were couched in terms of expectations relating to patient outcomes and how
these would be a reflection on the service provider. In many respects, expectations seemed
to be a modifier of dimensions that would be used to evaluate service quality. That is, in

159
healthcare, everyone is expected to be working toward positive patient outcomes and so this
fundamental expectation permeates the environment. However, expectations in the nature
of service and how it is provided appears from the context of responses to have some
differences between groups. These expectations would therefore be assumed to impact on
evaluations of internal service quality. However, this assumption needs to be tested further,
as while Study 1 indicates that expectations are integral to evaluation process, the
qualitative nature of this research does substantiate the basis of the assumption. Thus, while
there is some support for proposition 2, it is tested in Study 2.
4.2.3 P3 Internal service quality dimensions used to evaluate others in an internal
healthcare service chain will differ from those perceived used in evaluations by others
This proposition is based on perceptual difference in self-evaluation and how others would
evaluate one’s performance. Study 1 indirectly addressed this proposition as it was assumed
that in the interview situation that people would infer that there would be no difference in
how service quality would be evaluated. This was borne out by responses dealing with
relationships where interviewees did not want to be seen as having different perspectives
based on relationships. However, interviewees referred to their evaluations being based on
their own standards and expectations, and inferred that other disciplines would use their
discipline standards and experience to inform their evaluations of service quality that may
differ from the interviewee’s. Recognition that disciplines are different and come from
different skill sets that may influence the criteria used to evaluate internal service quality is
reflected in the comment if I knew the official quality standards for that profession …
(AH1). This proposition was more specifically addressed in Study 2. Nonetheless, support
for this proposition that there are differences is indicated by the data and illustrated through
the following statements:
As I move across to a different discipline there is potential for perceptions and such to be different (N1) Quality can be subjective for everyone involved (N6) Some disciplines have too narrow a focus (N7) You do assess them differently (AH1) Sometimes what is my standard is different to someone else (AH3)

160
What we expect is not necessarily what the next person agrees with (CS3) Need to realise we work in a different environment (CS7) These are often in the eye of the beholder (M1)
In order to establish the presence of different perceptions and their potential to impact on
evaluation of internal service quality the differences suggested by Study 1 need further
understanding generated through Study 2. Any differences in perceptions may affect the
orientation used in developments of instruments to measure internal service quality and
hence true measures of internal service quality.
4.2.4 P4 Ratings of service quality dimensions will differ in importance amongst
internal healthcare service groups
In Study 1, interviewees were asked which attributes they thought were important in the
evaluation of service quality to understand the dimensions used in assessment of service
quality. Given the qualitative nature of this study, no ranking is possible. However, the list
of 33 attributes and subsequent 12 attributes determined through data reduction, and the
importance of these attributes, was tested in Study 2. Frequency of mention was used as a
means of ranking importance, but was not formally reported due to the size of the sample
and the difficulty in deriving meaningful ranks. The nature of attributes has been described
above.
4.2.5 P5 Internal healthcare service groups are unable to evaluate the technical quality of services provided by other groups
4.2.5.1. Ability to evaluate others
Results indicate an inability or unwillingness of all groups to evaluate the quality of
disciplines outside their own. While this may be partially due to professional courtesy and
the particular expertise that disciplines have, respondents felt uncomfortable with the notion
of evaluating someone outside of their own discipline. However, in the absence of other
measures, non-technical measures are used to evaluate others such as the way they
communicate with patients, interact with other staff, complete paperwork, the number of
complaints, cards and letters received thanking staff, and ultimately the impact of their

161
activity on patients. This makes it difficult to effectively evaluate the performance of
personnel in the networks and service value chains within a hospital on an objective basis.
This led to respondents describing quality in terms that they could relate to or in terms of
functions and processes. This is consistent with the use of credence qualities in evaluations
of service quality (Zeithaml, 1981). The following transcription excerpts illustrate how
respondents approach this issue.
Looking at what the patient or family needs are…looking at the service provided…um…looking at quality of work…looking at…um…what's being achieved in terms of outcomes (AH5)
Often in relation to how it impacts on my work (AH7) A thank you from a relative…positive feedback from relatives CS3)
…little things you overhear when you’ve got all these people around you (CS6)
I’m not going to assess other people’s work because I don’t know their situation (CS7)
Hearsay, you get to know whether people are doing a good job (CS8)
How do you know? Basically the person walking out the door saying 'thank you very much’ (N5)
I just sit back and look at them for a while and check what they do I suppose and if I think they are doing the right thing for the patient then I find they are ok, and if they are a bit stand-offish or can't be bothered then I think ahhh!!! I get a bit angry that way… (N8)
I don’t think there any measures…it would be concerned with a feeling (M1) The other direct ways we gauge quality are things like the compliments we get (M2) Any service quality evaluation instrument needs to be able to capture an accurate measure
of service quality. If reasonably educated and experienced professionals find it difficult to
evaluate service provided by other parts of an organisation, then what is to be measured to
evaluate internal healthcare service quality?
4.2.5.2 Quality review processes Responses to questions about quality review processes led to admissions by interviewees
that there appeared to be no systematic review process to assess quality other than at the

162
accreditation that follows a prescribed procedure. A number of processes were suggested as
means of measuring quality and often related to clinical measures or other dimensions for
which ready measurement could be made. Interviewees reported that evaluation of service
quality within disciplinary areas seemed ad hoc and may focus on some theme that had
been introduced as a management tool. Few respondents felt that procedures were in place
to monitor quality of service work and that there were no means to evaluate work done by
other disciplines. Little attention is paid to interdisciplinary work quality and service
provision in a formal sense according to participants. Issues that arise would tend to be
dealt with on an ad hoc basis. While interviewees saw quality as a major issue, the
mechanisms to measure and evaluate service quality within the hospital do not appear to
address fundamental issues.
If there was a perception that formal reviews were in place, people were vague and either
reported hearsay that one had been performed in another area or that there was a review but
they were unsure or were not part of it, even when commenting on their own area or
discipline. The comment that I believe that there is one around here somewhere…but that
is as much as I can honestly tell you about it! (CS4) is indicative of overall perceptions of
formal review processes.
Informal evaluations of quality were based often on perceptions of interpersonal
relationships and the impact other people's work have on individuals and patients as
discussed previously. Informal evaluations were discussed in terms of meetings to discuss
issues that arise rather than systematic evaluation.
4.2.6 P6 Relationship strength impacts on evaluation of internal service quality
The nature of working relationships was explored in Study 1 to ascertain possible
connections between the nature of relationships and how these impact on the evaluation of
service quality. These may be seen as part of the personal interaction dimensions identified
by Dabholkar, Thorpe and Rentz (1996) and Brady and Cronin (2001). However,
determinates of personal interaction need to be understood, and relationship strength may
be a factor comprising this dimension.

163
4.2.6.1 Impact of interpersonal relationships Overall, the importance of interpersonal relationships is shown in the nature of the work
performed in the hospital. With teams a common organizational unit within sectors of the
hospital, participants indicated that the relationships within the team assumed greater
importance than those through interaction with other workers external to the team. Teams
are typically multi-disciplinary by nature which interviewees felt encouraged greater
interaction than if disciplines interacted independently. This appeared to create a sense of
belonging for team members but seemed to do little to facilitate interactions elsewhere.
Interviewees reported that team members become focussed on the patients under their care
and others become less important because they are outside the sphere of influence of the
team. Thus teamwork was seen as an important measure of internal healthcare service
quality and the core of working relationships.
Outside of team environments, participants reported that working relationships took on
various forms. For clinical staff, there may not have been a team focussed on a particular
patient, but individuals from discipline areas worked in areas that brought them together for
the care of individual patients. While workers are relatively independent, interviewees saw
relationships important to ensuring that patients are treated appropriately.
Many respondents reported that interpersonal relations take on another dimension to that
expected among workers in other service environments. There was a strong focus on the
nature of relationships with patients and family, and these relationships were seen as a
measure of the quality of work done by others and therefore could affect the relationship
between workers. So instead of a dyadic relationship between workers being the focus of
internal service quality evaluation, evaluations appear to be triadic by considering
relationships and quality with a third party.
As in any organization, respondents clearly preferred working with some people to others.
When teamed with people they related well to, they enjoyed and looked forward to coming
to work. On other occasions, when assigned to work with others they did not as readily
relate to, then the process of work became the focus rather than the relationship of co-
workers. The following statements reflect these relationships.

164
Look forward to working with certain people – it improves productivity and enjoyment
(N2)
Look forward to working with certain people – I know I will have a good day (N6)
Makes a difference if rostered on with people you like…may decrease stress
levels…improves communication (AH1)
Tend to stick to myself when working with people I like less (CS7)
In summary, the importance of relationships to evaluations of internal healthcare service
quality is indicated by the comments of one nurse who, when commenting on attributes to
measure service quality, suggests that surely the first area to measure would be the
relationship area (N7).
4.2.6.2 Interdisciplinary respect A number of respondents felt that other areas of the hospital did not always respect their
work role compared to how other areas in the hospital are treated as indicated in the
following interview transcript excerpts:
There's a pecking order…some disciplines are more important…medical professional people do feel as though they are more superior… (CS3)
…just because you are a level 2 doesn’t mean that you’re brainless… (CS4)
…more how you would value that particular field of work or expertise…one profession to another – that would make a difference on how someone would judge the quality of someone’s work… (AH7)
If you tell doctors nursing staff aren’t happy with them, they will say “big deal.” (N5)
Some disciplines have a narrow focus. Some people have good interdisciplinary approach but some people aren't into all that stuff…one profession to another. That would make a difference on how someone would judge the quality of someone’s work. (N7)
If people respect me for my needs, my beliefs, respect my understanding, for my working… (N8)
This perceived lack of respect was commented on by members of the Corporate
Services, Nursing, and Allied Health strata. Medical participants did not raise any
issues specifically relating to respect for their discipline, but did comment on respect
for each other generically as an important aspect of working together in the hospital.

165
For the strata who perceived a lack of respect for their discipline, it was seen as an
impediment to successful working relationships.
4.2.6.3 Impact of regular working relationships on evaluation of others
Questions relating to the impact of regular working relationships drew mixed response. On
one hand, some claimed they would be harder on those they worked with on a regular basis
as they should know what they are doing while others they worked with on a less regular
basis would be given allowances for not being as familiar with work situations and people.
On the other hand, others claimed they would make allowances for those who they worked
with on a regular basis when things did not go quite right on the basis of them 'having a bad
day.' In the middle were interviewees who claimed that it did not matter who they worked
with, as they would treat them all the same when it came to evaluating work activity. For
example, you have in your own mind this little checklist anyway and I guess I use this
checklist for everyone. It doesn’t matter whether you meet them regularly or irregularly
(N7).
While there is no one approach to the impact of regular contact on evaluations of others, it
is evident that people are influenced by relationships in evaluating others - the direction of
the influence may vary between individuals but needs to be considered when conducting
evaluations of others. This may be related to expectations and how those expectations
impact on evaluations.
From the responses given in Study 1, it is apparent that relationship strength may have an
impact on the evaluation of service quality in an internal healthcare service value chain.
However, it would appear that the direction of the evaluation is unpredictable and depends
on the preconceptions and expectations of the individual making the evaluation.
4.3 Conclusion
As a qualitative exploratory study, Study 1 gives a richness of data that provides the basis
to develop Study 2. Study 1 provides understanding of the three research questions, (1)
RQ1 What are the dimensions used to evaluate service quality in internal healthcare
service networks?; (2) RQ2 How do dimensions used in service quality evaluations in

166
internal healthcare service networks differ from those used in external quality
evaluation?; and (3) RQ3 How do different groups within internal service networks in
the healthcare sector evaluate service quality?. Propositions from these research
questions have been addressed in Study 1. This section discusses these propositions that
have led to the development of hypotheses to be tested in Study 2.
4.3.1 P1: Internal service quality dimensions will differ to external service quality
dimensions in the healthcare setting.
P3: Internal service quality dimensions used to evaluate others in an internal
healthcare service chain will differ from those perceived in evaluations by
others
Inherent in RQ2 is the challenge to the assertion that external service quality dimensions
are transferable to internal service quality. In order to investigate P1 that internal service
quality dimensions will differ to external service quality dimensions, it is necessary to
establish what dimensions are used in an internal healthcare service chain to evaluate
service quality (RQ1). Study 1 has identified 33 dimensions used by groups within a
healthcare environment in which this study is based to evaluate the quality of service
performed in an internal service value chain. Using the literature as a guide, these
dimensions were then consolidated into 12 dimensions described in this chapter, viz.,
tangibles, responsiveness, courtesy, reliability, communication, competence, understanding
the customer, patient outcomes, caring, collaboration, access, and equity. The original 33
dimensions and consolidated core 12 dimensions were largely consistent with those
identified in prior studies of external and internal service quality (Tables 4.3 and 4.4). The
caring and patient outcome measures were consistent with studies investigating service
quality in healthcare. However, although the notion of equity has been considered as an
antecedent to satisfaction, equity appears to have significance not previously reported as a
service quality dimension. This is examined further in Study 2.
Comparison of dimensions identified in Study 1 with those found in studies of external
service quality suggests that dimensions used in an internal service network to evaluate
service quality are similar to those used to evaluate service quality in external service
exchanges. However, this study only partially supports the transfer of these dimensions due

167
to apparent differences in the way service quality is evaluated in internal service chains
(P1). This is supported when dimensions identified in Study 1 are compared with
dimensions identified in previous studies investigating external and internal service quality.
Study 1 indicates that there are some differences in dimensions (e.g. social dimensions)
used to evaluate others compared to those used in evaluations by others (P3). The nature of
internal service quality dimensions may be influenced by the perceptions underlying the
construct of service evaluations. That is, in order to develop appropriate instruments to
measure internal service quality, it is necessary to understand the perspective from which to
make that evaluation. This is important due to the nature of the service relationship in
internal healthcare service chains.
The triadic nature of internal service identified in this study also indicates a change in
orientation is required when investigating internal service quality. Much of the literature
focuses on one part of the service exchange whereas it is apparent in internal service chains
in hospitals that multiple relationships need to be considered to effectively understand the
nature of the service experience. This focus raises the question of orientation in
development of service quality measurement tools. Do discipline areas have the same
perception of how they might evaluate others or how others might evaluate them? These
questions are addressed in Study 2 under the following hypothesis:
H1: Internal service quality dimensions that individuals use to evaluate others in an internal service chain will differ from those they perceive used in evaluations by others.
4.3.2 P2: Service expectations of internal service network groups will differ
between groups within an internal healthcare service chain In the literature, expectations are seen as fundamental to the definition and evaluation of
service quality. If expectations form the basis of service quality evaluation, then the nature
of expectations needs to understood in an internal healthcare service chain. Whose
expectations form the basis of any measure of service quality? In usual service evaluations,
it is the expectations of the evaluator. However, how are expectations of each group to be
considered in an environment that appears to be triadic in nature, rather than dyadic as
traditionally conceptualised? The role of patient outcomes, for example, is one factor that
involves expectations beyond the workers in the internal service chain. Also, how do

168
expectations of service influence perceptions of service quality and do they differ
amongst groups? Study 1 suggests that there may be differences between group
expectations which lead to hypothesis H2.
H2 Service expectations of internal service network groups will differ.
4.3.3 P4 Ratings will differ in importance of service quality dimensions amongst
internal healthcare service groups.
It is presumed that in order to gain an accurate measure of internal service quality, it is
necessary to understand the importance of attributes or dimensions used in the evaluation
process. Otherwise, it is probable that valid measures of internal service quality will be lost
due to over emphasis on measures that are not reflections of the salience placed on
attributes. Current instruments firstly assume that dimensions are consistent from the
external environment to the internal environment across industries. Secondly, they also
assume that dimensions are consistent from one group within an organisation to another.
Thus, a one size fits all approach to internal service quality measurement is suggested by
current approaches in the literature.
While the importance of service quality dimensions were considered in Study 1, due to the
qualitative nature of Study 1, the relative importance of the 12 dimensions identified in
Study 1 could not be established. To gain understanding of the importance of these
dimensions and to investigate differences in salience amongst internal service chain
member groups, the following hypothesis was examined in Study 2:
H3 Ratings will differ in importance of service quality dimensions amongst internal service groups.
4.3.4 P5: Internal healthcare service groups find it difficult to evaluate the technical quality of services provided by other groups.
Results of Study 1 indicate an inability of group members to evaluate the quality of
disciplines outside their own. While there may be elements of professional courtesy and
respect for the particular expertise held by disciplines, respondents generally felt
uncomfortable with evaluating someone outside their own discipline. However, outside of
technical expertise, respondents were willing to offer judgment on non-technical measures

169
such as communication with patients, interaction with other staff, and administrative
processes associated with their work separate to those performed by Corporate Services.
Inherent in conceptualising the development of instruments to measure internal service
quality is the assumption that participants are able to recognise the salient attributes in
evaluating quality. If members of the internal service chain are unable to evaluate technical
quality, especially if the triadic nature of the service relationship involving the patient is
considered, then what attributes, their importance, and how they are used needs to be
examined.
To establish that internal service groups find it difficult to evaluate technical quality of
services provided by other groups, hypothesis H4 was developed.
H4 Internal service groups find it difficult to evaluate the technical quality of services provided by other groups.
4.3.5 P6: Relationship strength impacts on evaluations of internal service quality
The impact of relationship strength on the assessment of service quality was explored in
Study 1. On one hand, it was found that people felt that they would be more critical in their
assessment of people they worked with on a regular basis as opposed to those they worked
with on an irregular basis. On the other hand, the reverse was also found, while in the
middle were those who felt it would make no difference as they would apply the same
criteria in both cases. The nature of relationships and relationship strength in internal
service chains requires further investigation. However, rather than broaden Study 2 to also
include a study into relationship strength, it was considered outside the available resources
for this dissertation and not pursued. The development of this issue will add to further
understanding of internal service quality and will, in the future, build on the current study.
170
5.0 Results of Study 2 5.1 Introduction Study 2 Study 1 drew data from depth interviews of members of four strata (Allied Health,
Corporate Services, Nursing, and Medical) in a major metropolitan hospital. While themes
have been identified, the nature of research undertaken in Study 1 does not allow any
generalisation of results. Depth of understanding has been gained from the resulting
analysis, but to confirm the importance of themes and issues identified in Study 1, further
research was undertaken in Study 2 as outlined in the research methodology for this thesis
to provide answers to the three research questions: (1) RQ1 What are the dimensions
used to evaluate service quality in internal healthcare service networks?; (2) RQ2
How do dimensions used in service quality evaluation in internal healthcare networks
differ to those used in external quality evaluations?; and (3) RQ3 How do different
groups within internal service networks in the healthcare sector evaluate service
quality?
Study 1 identified 33 dimensions that through data reduction were reduced to 12
dimensions used to evaluate internal service quality to answer RQ1. These dimensions
(tangibles, responsiveness, courtesy, reliability, communication, competence,
understanding the customer, patient outcomes, caring, collaboration, access, and equity) are
generally similar in terminology to those identified in the literature in external service
quality studies. While superficially this would give evidence of transferability of external
service quality dimensions to evaluations of service quality in an internal service chain, the
content and nuances of meaning in the dimensions identified and reported in Study 1
suggest some difficulty with that approach. In addition, the equity dimension appears to
have meaning as a service quality dimension not previously reported. Study 1 partly
answers the question of how dimensions used in service quality evaluation in internal
healthcare networks differ to those used in external quality evaluations (RQ2), and this
question was examined further in Study 2. Study 1 provides background to how groups
within internal service networks in the healthcare sector evaluate internal service quality
(RQ3), and this is also investigated further in Study 2. Measures of expectations,
importance, perception of dimensions used, and perceived ability to evaluate technical
service quality help develop understanding of the nature of dimensions used in internal

171
service quality evaluations and to inform the research questions relating to differences
between external and internal service quality evaluation.
A range of hypotheses were developed from the propositions investigated in Study 1.
The first, H1 Internal service quality dimensions that individuals use to evaluate
others in an internal service chain will differ from those they perceive used in
evaluations by others was developed from the progression of identifying dimensions
used in evaluations of internal service quality to the investigation of how they might differ
from those used in external evaluations of service quality. As differences were noted from
an internal/external perspective, observations of perceptual processes used in evaluations
of internal service quality and how these were affected by the orientation of the evaluation,
raised questions of how these would affect development of measurement tools. Study 1
revealed multiple levels of evaluation that led to questions of whether there are
differences in perceptions of internal service quality dimensions that individuals use to
evaluate others from those they perceive used in evaluations by others. Understanding
these differences is important as it gives understanding of how internal service quality
in a healthcare service chain is perceived by members of the service chain, building on
the understanding of internal service quality dimensionality identified in Study 1. This
approach also seeks to overcome potential introduction of self-assessment issues to the
process as participants consider evaluation of internal service quality, drawing on the
literature that suggests that self-evaluations of service quality differ from evaluations by
others. Establishing that differences exist helps define issues to be considered in
subsequent development of measurement tools.
The second hypothesis, H2 Service expectations of internal service network groups
will differ examines a fundamental aspect on service quality definition and evaluation,
expectations. Data in Study 1 indicated that service expectations may differ between
strata. Understanding differences in expectations is important to developing a
framework in order to evaluate internal service quality and the salience of dimensions
used in these evaluations. Expectations are examined and the hypothesis that
expectations will differ between internal service network groups tested.

172
The third hypothesis, H3 Ratings will differ in importance of service quality dimensions
amongst internal service groups. While Study 1 identified service quality dimensions
used by members of an internal healthcare service chain, the qualitative approach of Study
1 did not allow establishment of relative importance of dimensions identified as factors in
evaluations of internal service quality. Ratings of service quality are examined and strata
compared in Study 2 on the premise that ratings of service quality dimensions will differ in
importance amongst internal service groups.
The fourth and final hypothesis, H4 Internal service groups find it difficult to evaluate
the technical quality of services provided by other groups. Based on findings in the
literature relating to evaluation of technical quality in external service evaluations, Study 1
considered ability of members of the internal service chain to evaluate service quality of
other internal groups or disciplines. An inability (or unwillingness) to evaluate the service
quality of others in the internal service chain was identified as a key understanding in Study
1. Although members of an internal service chain may be more informed regarding internal
service encounters than customers in external service encounters, Study 2 proposes that
internal service groups find it difficult to evaluate the technical quality of services provided
by other groups. This has ramifications on the items to be included in instruments to
measure internal service quality and how these instruments are used to gain accurate
measures on internal service quality if technical quality is difficult to measure.
In summary, theses four hypotheses that emerged from examination of propositions in
Study 1 were tested in Study 2 and are reported in this chapter:
H1 Internal service quality dimensions that individuals use to evaluate others in an internal service chain will differ from those they perceive used in evaluations by others. H2 Service expectations of internal service network groups will differ.
H3 Ratings will differ in importance of service quality dimensions amongst internal service groups. H4 Internal service groups find it difficult to evaluate the technical quality of services provided by other groups.

173
Study 2 is a quantitative study that examines the themes identified in Study 1. A
questionnaire developed from the themes identified in Study 1 and those identified in the
literature, and more specifically the SERVQUAL instrument, forms the basis of Study 2.
This study is not a replication of SERVQUAL but recognition of the usefulness of using
that and other prior research to inform the framework for this study. Several statements
from the SERVQUAL instrument were used to test similar dimensions identified in Study 1,
or modified to allow for situational factors such as the healthcare environment. Other
statements were derived from factors identified in Study 1 not covered by the SERVQUAL
instrument and to test hypotheses postulated from the research question. The questionnaire
was distributed through the Quality Office of the hospital used in Study 1 to staff within the
strata of Allied Health, Nursing, Medical, and Corporate Services, excluding those who had
participated in Study 1.
The questionnaire used in Study 2 consisted of seven parts outlined as follows and in full in
Appendix 2:
Part I This portion of the survey deals with how hospital workers think about their work and the nature of working relationships they have with people from other disciplines/departments.
Part II This section deals with a number of statements intended to measure perceptions about quality and hospital operations. Part III This section contains a number of statements that deal with
expectation. The purpose of this section is to help identify the relative importance of expectations relating to issues in these statements to individuals.
Part IV This section identifies attributes that might be used to evaluate
quality of service work. Individuals are asked to rate how important each of these is to them when workers from other disciplines/areas deliver service to them.
Part V This section identifies a number of attributes pertaining to how
workers from other disciplines/departments might evaluate the quality of the individual's work. Individuals rate how important that they think each of these attributes are to these workers.
Part VI Individuals identify the five attributes they think are most important
for others to evaluate the excellence of service quality of their work.

174
Part VII Demographic and classification data.
References to three digit variable numbers in this chapter are interpreted thus: the first
number represents the Part of the questionnaire; the next two digits refer to the variable
number in that Part. For example, variable 101 is the first variable in Part I; 520 is the 20th
variable in Part V.
The following sections of this Chapter provide the analysis of the results from Study 2.
5.2 H1: Internal service quality dimensions individuals use to evaluate others in
an internal service chain will differ from those they perceive used in
evaluations by others.
The purpose of section 5.2 is to empirically test hypothesis 1. That is, perceived internal
service quality dimensions used to evaluate others will differ from those perceived used in the
evaluations by others of the respondent. This proposition arises from literature concerning
perceptual differences in self-evaluation of service quality compared to evaluations by others
and evaluations issues indicated in Study 1.
Part IV examines attributes perceived used when evaluating the quality of service provided by
others. The results of analysis of Part IV are reported in section 5.2.1. Part V investigates
perceptions of attributes others would use in evaluations of service provided by the respondent
and these results are reported in section 5.2.2. The results are then compared and combined in
section 5.2.3 to provide a picture of dimensions used to evaluate internal healthcare service
quality.
Analysis of the items of both Parts IV and V was firstly undertaken by calculating means for
each item. Ranking were determined on the basis of these means. However, given the number
of items, data reduction was accomplished through the use of component factor analysis to
establish limited number of attributes used to firstly evaluate others (Part IV), and secondly,
identify those perceived used by others to evaluate the respondent (Part V). An orthogonal
method was preferred through Varimax rotation as this means that the second and subsequent

175
factors are derived from the variance remaining after the previous factor has been extracted.
Oblique methods on the other hand, compare only the common or shared variance. While
oblique methods were used as a comparison there was no difference to factors reported and so
this method has not been shown in this Study. Variance between strata was determined using
ANOVA utilising factor scores determined during principal component analysis. Where
necessary, the alpha used was adjusted to control Type 1 error due to the number of attributes
being tested. In these cases, the Bonferroni method was used.
5.2.1 Attributes individuals use to evaluate the quality of service provided by others
Part IV identifies attributes that might be used to evaluate quality of service work of others.
Individuals were asked to rate how important each of these attributes are to them when
workers from other disciplines/areas deliver excellent quality of service to them. In Part IV,
respondents were asked to indicate the importance of an attribute by circling a number
between 1 and 7 with 1 representing Not Important and 7 representing Very Important.
Respondents were also given the option of indicating that an attribute was completely
irrelevant to their situation by indicating that it was Not Applicable (0). Dimensions
identified in Study 1 inform the items shown in Table 5.1.

176
Table 5.1 Dimensions used to evaluate internal service quality of others
Tangibles 401 Staff will be neat in appearance* 402 The physical facilities used by service providers
will be visually appealing* Responsiveness 408 They listen to my ideas 429 Workers from other disciplines/areas can be
relied on to “put in extra effort” when needed Courtesy 405 Workers I have contact with are friendly 410 They respect my timeframes 420 They speak to me politely 422 They respect my role 423 Workers have a pleasing personality 427 They have well-developed inter-personal skills Reliability 403 Work will be performed accurately 407 When they promise to do something by a certain
time they do it* 409 When I have a problem they show a sincere
interest in solving it* 411 Tasks are performed right the first time* Communication 413 Communication is easily understood 417 They provide appropriate information to me Competence 412 Their behaviour instils confidence in me* 414 They are knowledgeable in their field 415 They demonstrate skill in carrying out tasks 416 They have a clear understanding of their duties
Understanding Customer 404 They will understand my work needs 419 Service providers are responsive to my needs Caring 421 They are responsive to patient needs 425 They show commitment to serve patients and co-workers Collaboration 424 Other workers are flexible in their work approach 428 They will show a team orientation in their approach to work Access 406 They are easy to approach 426 I can contact service providers when I need to Equity 418 I am treated fairly by them 430 The actions of other workers will not adversely impact on my work *Items taken or modified from SERVQUAL. Other items developed based on findings of Study 1 and tested in the Pre-test.
Table 5.2 shows the mean ratings and ranking of importance of 30 attributes used in the
evaluation of service provided by workers from other disciplines/areas for each stratum and
total respondents based on section IV of the questionnaire. On the seven-point scale used
there is a tendency to rate items toward the Very Important end of the scale. All means are
approximately 5.00 and above. Ranking of means identifies the importance of attributes
used to evaluate service provided by others.

177
Table 5.2 Importance to individuals of attributes used to evaluate internal service quality of others who provide service
(Means) Variable
Alli
ed
Hea
lth
Ran
k
Cor
pora
te
Serv
ices
Ran
k
Nur
sing
Ran
k
Med
ical
Ran
k
Tot
al
Ran
k
401 Staff will be neat in appearance 5.85 20 5.73 19 6.06 12 5.27 26 5.88 17 402 The physical facilities used by service providers will be visually appealing.
5.07 29 5.15 29 5.45 29 5.27 26 5.34 29
403 Work will be performed accurately. 6.50 2 6.44 2 6.53 2 6.16 2 6.46 2 404 They will understand my work needs. 5.95 17 5.82 16 5.80 23 5.53 21 5.80 19 405 Workers I have contact with will be friendly.
5.88 19 6.02 10 5.98 16 5.76 11 5.96 15
406 They are easy to approach. 6.03 14 6.03 8 6.01 14 5.84 8 6.03 11 407 When they promise to do something by a certain time they do it.
6.20 5 5.86 15 5.90 18 5.97 3 5.97 14
408 They listen to my ideas. 5.95 17 5.49 25 5.68 26 5.27 26 5.61 25 409 When I have a problem they show a sincere interest in solving it.
5.63 25 5.78 17 5.72 25 5.68 12 5.68 24
410 They respect my timeframes. 5.82 22 5.71 20 5.88 19 5.54 20 5.77 20 411 Tasks are performed right the first time.
5.73 24 5.63 23 5.56 28 5.57 19 5.58 27
412 Their behaviour instils confidence in me.
5.60 26 5.45 26 5.87 21 5.65 14 5.71 23
413 Communication is easily understood. 6.00 16 5.92 13 6.16 10 5.97 3 6.04 10 414 They are knowledgeable in their field.
6.13 7 6.09 6 6.28 5 5.97 3 6.16 5
415 They demonstrate skill in carrying out tasks.
6.13 7 6.03 8 6.26 8 5.84 8 6.12 8
416 They have a clear understanding of their duties.
6.23 4 6.09 6 6.28 7 5.89 6 6.16 5
417 They provide appropriate information to me.
6.13 7 6.17 3 6.30 4 5.78 10 6.17 4
418 I am treated fairly by them. 6.13 7 6.12 5 6.28 5 5.68 12 6.14 7 419 Service providers are responsive to my needs.
6.10 12 5.76 18 5.86 22 5.59 16 5.84 18
420 They speak to me politely. 6.17 6 6.16 4 6.14 11 5.59 16 6.07 9 421 They are responsive to patient needs. 6.54 1 6.54 1 6.58 1 6.19 1 6.51 1 422 They respect my role. 6.13 7 6.02 10 6.03 13 5.62 15 5.98 13 423 Workers have a pleasing personality. 5.07 29 5.44 27 5.59 27 4.89 30 5.38 28 424 Other workers are flexible in their work approach.
5.78 22 5.57 4 5.91 17 5.43 25 5.76 21
425 They show commitment to serve patients and co-workers.
6.28 3 6.00 12 6.36 3 5.86 7 6.22 3
426 I can contact service providers from other areas when I need to.
6.08 13 5.67 22 6.17 9 5.59 16 5.99 12
427 They have well-developed inter-personal skills.
5.85 20 5.71 20 5.88 17 5.24 29 5.76 21
428 They will show a team orientation in their approach to work.
6.03 14 5.88 14 5.99 15 5.46 23 5.90 16
429 Workers from other areas can be relied on to "put in extra effort" when needed.
5.47 28 5.33 28 5.77 24 5.49 26 5.61 25
430 The actions of other workers will not adversely impact on my work.
5.53 27 4.84 30 5.22 30 5.41 24 5.23 30

178
Being responsive to the needs of patients (421) and performing work accurately (403) are
seen as the first and second most important attributes overall and by each stratum
respectively. Agreement then varies between strata. The third most important attribute
overall is commitment to serve patients and co-workers (425), which is supported by Allied
Health and Nursing. Corporate Services regarded being provided appropriate information
(417) as third most important. On the other hand, Medical grouped the attributes of
timeliness (407), understandable communication (413), and knowledge (414) as equal third
most important attributes. A comparison of the top 15 rankings is shown in Table 5.3.
Table 5.3 Comparison of importance rank of internal service quality attributes used to evaluate others
Rank Allied Health Corp Serv. Nursing Medical Total
1 421 Responsiveness to patients
421 Responsiveness to patients
421 Responsiveness to patients
421 Responsiveness to patients
421 Responsiveness to patients
2 403 Accuracy 403 Accuracy 403 Accuracy 403 Accuracy 403 Accuracy 3 425 Commitment 417 Approp info 425 Commitment 407 Timeliness
413 Communication 414 Knowledge
425 Commitment
4 416 Understand duties
420 Speak politely 417 Approp info 417 Approp info
5 407 Timeliness 418 Treated fairly 418 Treated fairly 414 Knowledge 416 Understand duties
6 420 Speak politely 414 Knowledge 416 Understand duties
416 Understand duties
7 414 Knowledge 415 Skill 417 Approp info 418 Treated fairly 422 Respect role
416 Understand duties 425 Commitment 418 Treated fairly
8 406 Approachability 415 Skill
415 Skill 406 Approachability 415 Skill
415 Skill
9 426 Accessibility 409 Speak politely 10 405 Friendliness
422 Respect role 413 Communication 417 Approp info 413 Communication
11 420 Speak politely 405 Friendliness 406 Approachability 12 419 Responsive to my
needs 425 Commitment 401 Appearance 409 Interest in
helping 418 Treated fairly
426 Accessibility
13 426 Accessibility 413 Communication 422 Respect role 422 Respect role 14 406 Approachability
428 Teamwork 428 Teamwork 406 Approachability 412 Instil confidence 407 Timeliness
15 407 Timeliness 428 Teamwork 422 Respect role 405 Friendliness
It is interesting that in evaluations of service quality provided by others in an internal
healthcare service chain, that the primary attribute relates to a third party, the patient. This
supports notions of a triadic relationship conceptualised earlier in this thesis (Figure 2.8)
and moves concepts of internal service quality evaluation from the traditional dyadic
evaluation perspective extant in the literature. This also reflects patient outcomes dimension

179
identified in Study 1. Moreover, a number of key attributes relate to the quality of personal
interaction or interaction quality (Brady & Cronin, 2001). For example, speak politely (420),
respect my role (422), approachability (406), accessibility (426), show interest in solving
my problems (409), and friendliness (405). This reinforces the role social dimensions have
in evaluations of internal service quality and indicates that these may be more relevant to an
internal service network than frameworks used in traditional external evaluations of service
quality.
The sense of equity or fairness in working relationship found in Study 1 is also confirmed
as an important attribute in evaluations of internal healthcare service quality. Being treated
fairly (418) is highly ranked by Allied Health (7), Corporate Services (5) and Nursing (5),
and strongly ranked by Medical (12), with an overall ranking of 7. On the other hand, the
actions of others adversely impacting on work (430) was overall seen as the least important
attribute.
While these results are useful in understanding the relative importance of attributes, the
number of attributes and the closeness of mean scores make it difficult to be definitive when
describing and ranking attributes. To reduce and summarise this data, factor analysis was
performed. The results of this factor analysis are reported in the following section.
5.2.1.1 Factors used to evaluate internal service quality of others who provide
service
The 30 items shown in Table 5.2 were subjected to a principal component analysis. Four
components with an eigenvalue greater than 1 were identified and subjected to a varimax
rotation. Together, the four components account for 68% of the variance of the items.
The four factors identified are helpful in understanding the underlying structure of the
variables used in Part IV. Each of the factors identified deal with attributes that might be
used to evaluate the quality of service work.
In naming the factors identified, consideration was given to labels used in previous studies
where possible to name these factors to allow consistency and comparison. Consequently,

180
where variables identified in factors correlate to attributes identifiable in the literature,
consistent labels have been assigned for ease of comparison. The nomenclature chosen for
convenience is that used by Zeithaml, Parasuraman and Berry (1990) who identified ten
dimensions defined as follows:
• Tangibles – appearance of physical facilities, equipment, personnel, and
communication materials.
• Reliability – ability to perform the promised service dependably and accurately.
• Responsiveness – willingness to help customers and provide prompt service.
• Competence – possession of the required skills and knowledge to perform the
service.
• Courtesy – politeness, respect, consideration, and friendliness of contact personnel.
• Credibility – trustworthiness, believability, honesty of the service provider.
• Security – freedom from danger, risk, or doubt.
• Access – approachability and ease of contact.
• Communication – keeping customers informed in language they can understand and
listening to them.
• Understanding the customer – making the effort to know customers and their needs.
Parasuraman, Zeithaml and Berry (1990) reduced these ten dimensions to five dimensions
that have gained currency in the literature comprising:
• Tangibles – appearance of physical facilities, equipment, personnel, and
communication materials.
• Reliability – ability to perform the promised service dependably and accurately.
• Responsiveness – willingness to help customers and provide prompt service.
• Assurance – competence, courtesy, credibility, security. The knowledge and
courtesy of employees and their ability to convey trust and confidence.
• Empathy – access, communication, understanding the customer. Caring,
individualised attention provided to customers.
Unless otherwise noted, the use of these terms to describe factors identified in factor
analysis of Study 2 ascribes the same meaning as defined above. The definition of tangibles
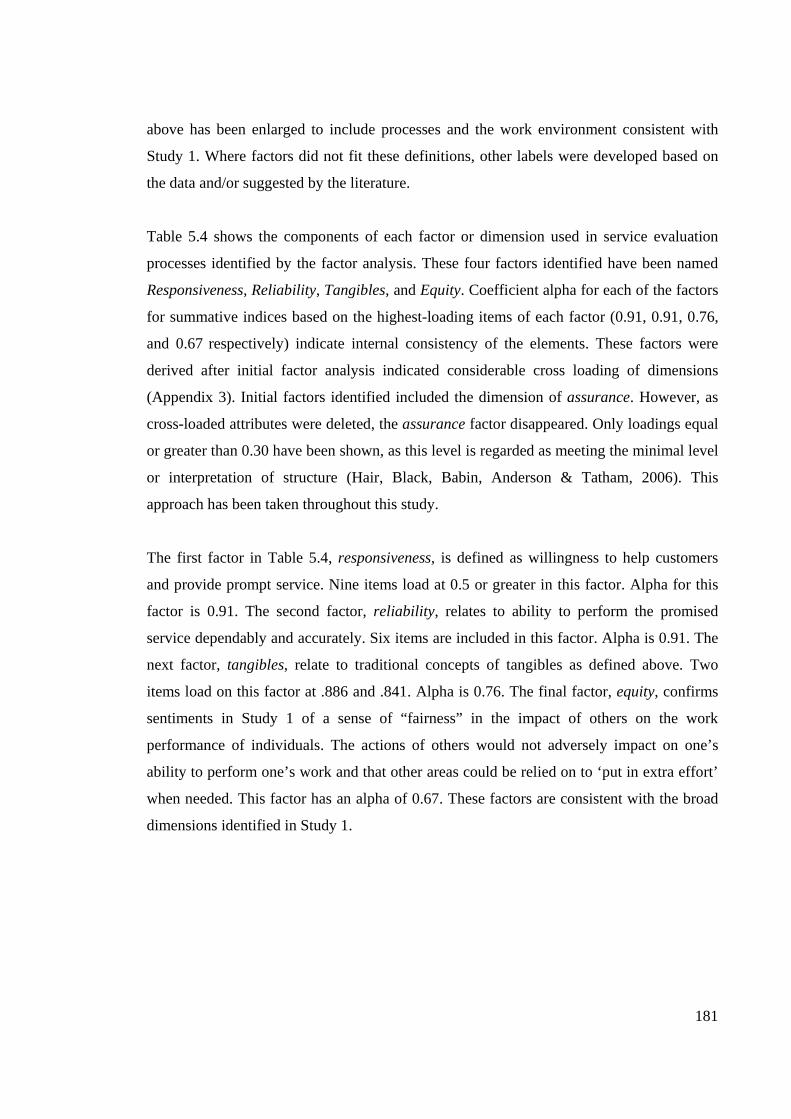
181
above has been enlarged to include processes and the work environment consistent with
Study 1. Where factors did not fit these definitions, other labels were developed based on
the data and/or suggested by the literature.
Table 5.4 shows the components of each factor or dimension used in service evaluation
processes identified by the factor analysis. These four factors identified have been named
Responsiveness, Reliability, Tangibles, and Equity. Coefficient alpha for each of the factors
for summative indices based on the highest-loading items of each factor (0.91, 0.91, 0.76,
and 0.67 respectively) indicate internal consistency of the elements. These factors were
derived after initial factor analysis indicated considerable cross loading of dimensions
(Appendix 3). Initial factors identified included the dimension of assurance. However, as
cross-loaded attributes were deleted, the assurance factor disappeared. Only loadings equal
or greater than 0.30 have been shown, as this level is regarded as meeting the minimal level
or interpretation of structure (Hair, Black, Babin, Anderson & Tatham, 2006). This
approach has been taken throughout this study.
The first factor in Table 5.4, responsiveness, is defined as willingness to help customers
and provide prompt service. Nine items load at 0.5 or greater in this factor. Alpha for this
factor is 0.91. The second factor, reliability, relates to ability to perform the promised
service dependably and accurately. Six items are included in this factor. Alpha is 0.91. The
next factor, tangibles, relate to traditional concepts of tangibles as defined above. Two
items load on this factor at .886 and .841. Alpha is 0.76. The final factor, equity, confirms
sentiments in Study 1 of a sense of “fairness” in the impact of others on the work
performance of individuals. The actions of others would not adversely impact on one’s
ability to perform one’s work and that other areas could be relied on to ‘put in extra effort’
when needed. This factor has an alpha of 0.67. These factors are consistent with the broad
dimensions identified in Study 1.

182
Table 5.4 Rotated Component Matrix – Part IV Factors used to evaluate internal service quality of those who provide excellent service (loadings ≥ 0.30)
Component Responsiveness Reliability Tangibles Equity 417 provide appropriate information .799
415 skill in performing tasks .786 .315 414 knowledge of their field .775 .376 416 clear understanding of duties .749 .419 421 responsive to patient needs .725 .357 420 speak politely to me .685 .348 422 respect my role .656 426 can contact others when needed .545 .307 403 accuracy .526 .363 407 timeliness .788 408 listen to ideas .786 409 interest in solving my problems .733 .325 410 respect for my timeframes .727 411 tasks performed right first time .383 .676 412 behaviour instils confidence .329 .650 402 physical facilities visually appealing .886 401 appearance .841 430 no adverse impact by others actions .743 429 relied on to put in extra effort when needed .364 .665 Coefficient alpha 0.91 0.91 0.76 0.67
Extraction Method: Principal Component Analysis. Rotation Method: Varimax with Kaiser Normalization. a Rotation converged in 5 iterations
5.2.1.2 Differences in perceptions of dimensions used to evaluate internal
service quality of others Following identification of the four factors identified in Table 5.4 (responsiveness,
reliability, tangibles, and equity), it was hypothesised that there are differences between
discipline areas in perceptions of dimensions they would use to evaluate the quality of
service received by them from workers from other disciplines or areas. Factor scores
were used to calculate means and standard deviations for the four factors as shown in
Table 5.5. ANOVA was performed using factor scores derived during principal
component analysis to test for difference in scores between the groups.

183
Table 5.5 Mean and Standard Deviation of Factors used to evaluate others
Strata Allied
HealthCorporateServices
Nursing Medical Total
Factor 1 Responsiveness
Mean 0.16 0.12 0.10 -0.44 0.02 Std. Deviation 0.87 0.78 0.91 1.24 0.95 Factor 2 Reliability
Mean 0.10 0.04 -0.01 0.01 0.03 Std. Deviation 0.92 0.87 1.05 0.78 0.95 Factor 3 Tangibles
Mean -0.18 0.01 0.19 -0.16 0.04 Std. Deviation 0.67 0.94 0.96 0.80 0.90 Factor 4 Equity
Mean 0.06 -0.07 -0.02 0.09 0.00 Std. Deviation 0.89 1.16 0.98 0.74 0.98
The results of ANOVA found that of the original four factors, there is significant
difference between strata in the factor scores for the factor responsiveness. Table 5.6
shows F and the significance for each factor. Tukey and Dunnett’s T3 post hoc tests
identified that significant difference in means exists between the Medical stratum and
Corporate Services and Nursing strata and for responsiveness (p < 0.05).
Table 5.6 F and Significance for Factors perceived used by others to evaluate
quality Factor df F Sig.
1. Responsiveness 3 3.320 0.021* 2. Reliability 3 0.131 0.942 3. Tangibles 3 2.439 0.065 4. Equity 3 0.279 0.840
*significant items α 0.05

184
5.2.1.3 Summary of factors used to evaluate internal service quality of others
Part IV consisted of 30 items. Ranking of these items found that responsiveness to patient
needs was the most important attribute in evaluating service quality of others in internal
healthcare service chains. This was followed by Accuracy of work. While attributes were
identified by rank, the number of items, the closeness of means and the nature of these
items make it difficult to be definitive in identifying internal service quality dimensions.
To reduce the number of items, four factors indicating the dimensions individuals in the
hospital use to evaluate the service quality of those who provide excellent service were
identified from factor analysis: responsiveness, reliability, tangibles, and equity.
To examine differences in perceptions of dimensions that might be used to evaluate
service quality, respondents were asked to rate the importance of attributes to others when
they might evaluate the quality of service provided by that respondent. These statements
were in Part V of the survey instrument. Results of this examination are reported in the
following section.
5.2.2 Perceived attributes used by others to evaluate respondent work quality
Part V of the survey examines individual perceptions regarding attributes pertaining to how
workers from other disciplines/departments evaluate the quality of work. In Part V,
respondents were asked to indicate the importance of 25 attributes by circling a number
between 1 and 7 with 1 representing Not Important and 7 representing Very Important.
Respondents were also given the option of indicating that an attribute was completely
irrelevant to their situation by indicating that it was Not Applicable (0). The statements,
while based on Part IV, were worded differently to reflect the orientation of the assessment
to what was thought others might use in evaluations of internal service quality. Dimensions
identified in Study 1 and issues raised by interviewees in Study 1 inform the items in Table 5.7.
Table 5.7 Internal service quality dimensions perceived used in evaluations by others

185
Tangibles 501 Your appearance Responsiveness 503 Doing things when you say you will 512 Your responsiveness to the needs of other
disciplines/areas 524 Your level of commitment to “getting the job
done.” Courtesy 507 How you relate to other staff members 509 Friendliness you have for patients and staff 511 Respect you have for time frames of workers
from other disciplines/areas 515 Level of respect you show for other workers'
disciplines and roles 516 Whether you treat individual workers with
respect Reliability 502 Accuracy of your work 508 Keeping your head down and just doing your
work Communication 504 Your level of communication skills 514 Feedback from you on work performed by
other disciplines/areas
Competence 505 Your knowledge of your field 518 The degree of confidence your behaviour
instils in other workers 520 Regard held for your professional skill 521 Your ability to organise work activities Understanding customer 522 The effort you make to understand the needs
of patients 523 The effort you make to understand the needs
of workers you interact with Patient outcomes 510 Outcomes of your work for patients Collaboration 519 The degree of flexibility you have to work
situations 525 Your work in a team Access 506 Going out of your way to help others Equity 513 Dealings you have with other disciplines/
areas have no hidden agendas 517 The impact of your work performance on
other workers
Table 5.8 shows the mean scores of each of the attributes indicated by the 25 statements
from Part V of the survey instrument for each strata and total respondents. Overall,
accuracy (502) is seen as the most important attribute, followed by knowledge (505),
timeliness (503) and communication (504). This is followed by patient outcomes (510).
Table 5.9 provides a comparison of item ranking for the top 15 items. It is evident that
respondents primarily saw themselves as being evaluated on their reliability (ability to
perform the promised service dependably and accurately) encompassing, for example,
knowledge (505), accuracy (502), level of communication skills (504), and patient
outcomes (510). Grouping other items together, personal interaction quality is again a
factor [e.g. teamwork (525), treat workers with respect (516), friendliness (509)], which
may be considered part of responsiveness (willingness to help customers and provide

186
prompt service) through items such as timeliness (503), respect for timeframes of others
(511), effort made to understand patient needs (522), and commitment to getting the job
done (524). There are also equity issues being raised with the impact of work performance
on other workers (517), and depending on interpretation, commitment to getting the job
done (524) ranking 12 and 13 respectively.
The 25 attributes used in Part V provide some direction in understanding the perceived
importance of items used in evaluations of internal healthcare service quality by others. As
indicated above, grouping of items is possible due to the nature of items. To more
rigorously reduce and summarise the data further, factor analysis was carried out. This is
reported in the following section.
Table 5.8 Perceived importance of attributes used by others to evaluate respondent work quality
(Means)

187
Variable
Alli
ed
Hea
lth
Ran
k
Cor
pora
te
Serv
ices
Ran
k
Nur
sing
Ran
k
Med
ical
Ran
k
Tot
al
Ran
k
501 Your appearance. 5.28 23 5.63 23 5.87 23 5.05 24 5.62 22502 Accuracy of your work. 6.48 3 6.56 1 6.62 1 6.49 1 6.57 1 503 Doing things when you say you will. 6.48 3 6.53 2 6.53 4 6.32 2 6.49 3 504 Your level of communication skills. 6.55 1 6.29 9 6.56 3 6.24 3 6.47 4 505 Your knowledge of your field. 6.53 2 6.47 5 6.59 2 6.24 3 6.51 2 506 Going out of your way to help others. 5.90 20 6.07 18 6.13 19 5.97 8 6.07 18507 How you relate to other staff members.
6.15 13 6.09 17 6.38 11 6.08 7 6.25 10
508 Keeping your head down and just doing your work.
4.67 25 5.37 24 4.81 25 4.69 25 4.86 25
509 Friendliness you have for patients and staff.
6.26 8 6.14 14 6.40 10 5.83 14 6.25 10
510 Outcomes of your work for patients. 6.38 6 6.42 6 6.54 5 6.17 5 6.45 5 511 Respect you have for time frames of workers from other areas.
6.18 9 6.28 10 6.10 20 5.50 20 6.05 19
512 Your responsiveness to the needs of other areas.
6.08 17 6.10 15 6.12 20 5.53 19 6.03 20
513 Dealings you have with other areas have no hidden agendas.
5.64 22 5.82 22 5.90 22 5.42 22 5.78 21
514 Feedback from you on work performed by other areas.
4.87 24 5.36 25 5.58 24 5.17 23 5.38 24
515 Level of respect you show for other worker's disciplines and roles.
6.18 9 6.28 10 6.21 17 5.69 17 6.14 13
516 Whether you treat individual workers with respect.
6.44 5 6.32 8 6.42 9 5.94 10 6.34 8
517 The impact of your work performance on other workers.
6.10 15 6.21 13 6.33 12 5.78 15 6.20 12
518 The degree of confidence your behaviour instils in other workers.
6.10 15 6.05 19 6.25 16 5.86 13 6.14 13
519 The degree of flexibility you have to work situations
6.05 19 6.02 20 6.27 14 5.44 21 6.08 18
520 Regard held for your professional skill.
6.18 9 6.10 15 6.20 18 5.92 11 6.14 13
521 Your ability to organise work activities.
5.85 21 6.34 7 6.27 14 5.75 16 6.14 13
522 The effort you make to understand the needs of patients.
6.31 7 6.26 12 6.51 6 6.14 6 6.39 6
523 The effort you make to understand the needs of workers you interact with.
6.08 17 6.02 20 6.28 13 5.69 17 6.12 17
524 Your level of commitment to "getting the job done."
6.15 13 6.50 3 6.45 7 5.97 8 6.35 7
525 Your work in a team. 6.18 9 6.48 4 6.43 8 5.89 12 6.32 9
Table 5.9 Comparison of rank importance of perceived internal service quality attributes used by others
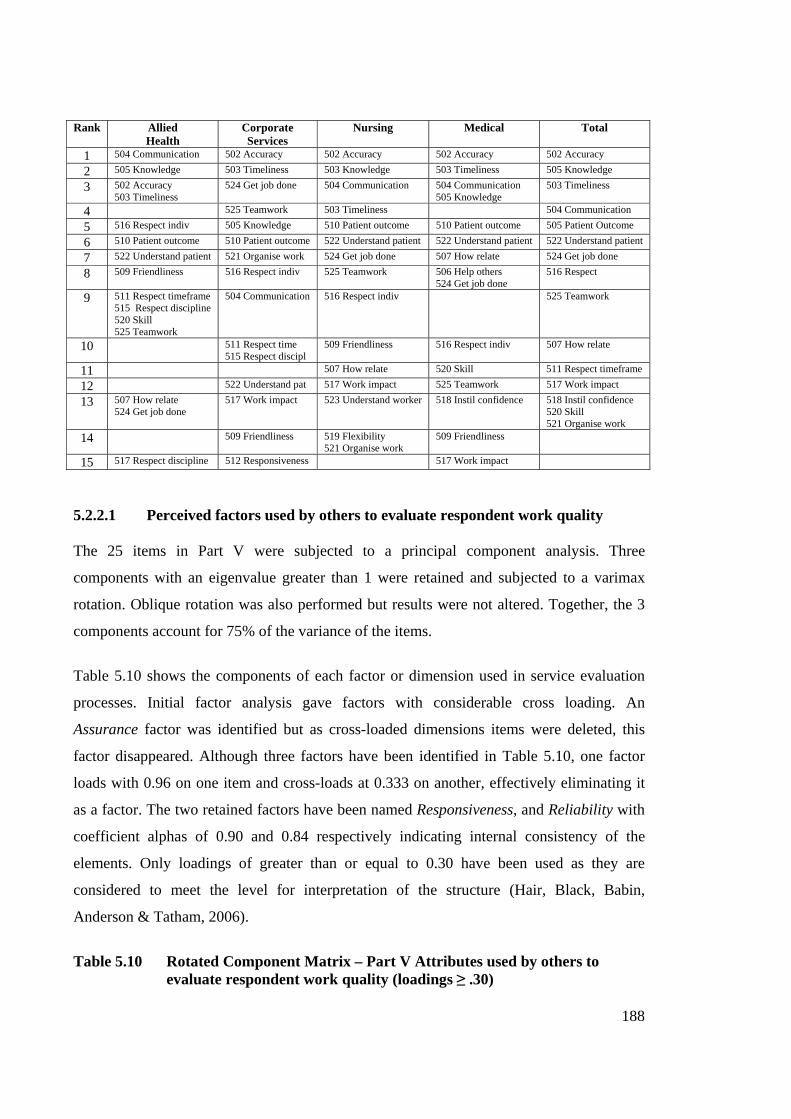
188
Rank Allied Health
Corporate Services
Nursing Medical Total
1 504 Communication 502 Accuracy 502 Accuracy 502 Accuracy 502 Accuracy
2 505 Knowledge 503 Timeliness 503 Knowledge 503 Timeliness 505 Knowledge
3 502 Accuracy 503 Timeliness
524 Get job done 504 Communication 504 Communication 505 Knowledge
503 Timeliness
4 525 Teamwork 503 Timeliness 504 Communication
5 516 Respect indiv 505 Knowledge 510 Patient outcome 510 Patient outcome 505 Patient Outcome
6 510 Patient outcome 510 Patient outcome 522 Understand patient 522 Understand patient 522 Understand patient
7 522 Understand patient 521 Organise work 524 Get job done 507 How relate 524 Get job done
8 509 Friendliness 516 Respect indiv 525 Teamwork 506 Help others 524 Get job done
516 Respect
9 511 Respect timeframe 515 Respect discipline 520 Skill 525 Teamwork
504 Communication 516 Respect indiv 525 Teamwork
10 511 Respect time 515 Respect discipl
509 Friendliness 516 Respect indiv 507 How relate
11 507 How relate 520 Skill 511 Respect timeframe
12 522 Understand pat 517 Work impact 525 Teamwork 517 Work impact
13 507 How relate 524 Get job done
517 Work impact 523 Understand worker 518 Instil confidence 518 Instil confidence 520 Skill 521 Organise work
14 509 Friendliness 519 Flexibility 521 Organise work
509 Friendliness
15 517 Respect discipline 512 Responsiveness 517 Work impact
5.2.2.1 Perceived factors used by others to evaluate respondent work quality The 25 items in Part V were subjected to a principal component analysis. Three
components with an eigenvalue greater than 1 were retained and subjected to a varimax
rotation. Oblique rotation was also performed but results were not altered. Together, the 3
components account for 75% of the variance of the items.
Table 5.10 shows the components of each factor or dimension used in service evaluation
processes. Initial factor analysis gave factors with considerable cross loading. An
Assurance factor was identified but as cross-loaded dimensions items were deleted, this
factor disappeared. Although three factors have been identified in Table 5.10, one factor
loads with 0.96 on one item and cross-loads at 0.333 on another, effectively eliminating it
as a factor. The two retained factors have been named Responsiveness, and Reliability with
coefficient alphas of 0.90 and 0.84 respectively indicating internal consistency of the
elements. Only loadings of greater than or equal to 0.30 have been used as they are
considered to meet the level for interpretation of the structure (Hair, Black, Babin,
Anderson & Tatham, 2006).
Table 5.10 Rotated Component Matrix – Part V Attributes used by others to
evaluate respondent work quality (loadings ≥ .30)

189
Component Responsiveness Reliability 3 509 friendliness to patients & staff .877 507 relate to other staff .829 517 impact of work on other disciplines .807 516 treat individuals with respect .795 .365 504 communication skill .787 .360 522 effort to understand patient needs .728 506 going out of way .695 .333 502 accuracy .884 505 knowledge .847 503 timeliness .312 .762 508 keeping head down .959 Coefficient alpha 0.90 0.84
Extraction Method: Principal Component Analysis. Rotation Method: Varimax with Kaiser Normalization. a Rotation converged in 5 iterations. 5.2.2.2 Differences between discipline areas in perceptions of dimensions
used by others to evaluate service quality
Following ranking of the items in Table 5.9 and identification of the two factors in
Table 5.10, it was hypothesised that there are differences between discipline areas in
perceptions of dimensions they thought would be used by workers from other areas to
evaluate the quality of service received by them from workers from other disciplines or
areas.
Using factor scores derived during principal component analysis, ANOVA was
performed and found that for Factor 1 responsiveness that there is significant difference
in factor scores. Tukey and Dunnett’s T3 post hoc tests identified that significant
difference in means (.47) exists between the medical stratum and nursing stratum for
responsiveness (p < 0.05). There is no significant difference in means for Factor 2
(reliability). On the basis of significant variation for the responsiveness factor, the null
hypothesis that there are differences between strata was accepted. Table 5.12 shows F
and significance for factors identified as used by others to evaluate service quality.

190
Table 5.11 Mean and Standard Deviation for factors identified as used to evaluate the service quality by others
Strata Allied
Health Corporate Services
Nursing Medical Total
Factor 1 Responsiveness
Mean 0.16 0.08 0.19 -0.29 0.07 Std. Deviation 0.68 1.23 0.79 0.68 0.90 Factor 2 Reliability
Mean -0.07 0.20 0.00 -0.13 0.16 Std. Deviation 0.93 0.84 0.92 1.02 0.92 Table 5.12 F and Significance for Factors used to evaluate quality by others
Factor df F Sig. 1. Responsiveness 3 2.759 0.043*
2. Reliability 3 1.258 0.289
* Significant item α 0.05 5.2.3 Attributes used to evaluate service quality Two factors, responsiveness and reliability represent the dimensions that respondents
perceive others would use to evaluate the quality of work performed by them. By
comparison, respondents identified responsiveness, reliability, tangibles and equity as
dimensions important to them when they evaluated quality of work performed by others. A
factor of Assurance was initially identified but discounted as items that cross-loaded were
deleted from the analysis. Responsiveness and reliability represent common factors
between perceptions of dimensions used to evaluate others and those others would use in
evaluations. Combining these groups of dimensions results in the following factors as
dimensions used to evaluate service quality in internal healthcare service environments:
Responsiveness
Reliability
Tangibles
Equity

191
This result is consistent with dimensions identified in Study 1 and represents further
distillation of the 12 dimensions resulting from the original 33 identified in Study 1. The
factors responsiveness, tangibles, and reliability are confirmation of dimensions identified
in prior research outlined in chapter 2. This seems to support suggestions in the literature
that these dimensions are transferable from the external environment to internal service
value chains. However, in ranking importance of the items in both Part IV and V, it was
apparent that there are nuances in how these items are viewed that may have been lost
through consolidation by factor analysis. It is these nuances that indicate that there are
multi-level considerations as well as multi-dimensional conceptualization of internal
healthcare service quality. The equity dimension has not been previously identified as a
specific service quality dimension although equity has been seen as an antecedent to
satisfaction and a factor in service recovery evaluations (Oliver, 1997). However, equity
has not been specifically identified as an internal service quality evaluation dimension.
The tangibles factor is inconsistent with findings in Study 1 and rankings shown in Tables
5.2 and 5.8, where physical factors were not seen as a major contributor to assessments of
internal service quality. Dimensions in factors identified in the initial factor analysis were
indicative of a broader interpretation of an environment that included ambient conditions
and interaction between personnel that is supported in Study 1 and rankings of items from
Parts IV and V. However, as cross-loaded dimensions were deleted, physical dimensions
remained. This may be due to tangibles generally being one of the SERVQUAL
dimensions that are retained in factor analysis (Mels, Boshoff, & Nel, 1997).
The loss of the assurance dimension identified in initial factor analysis but deleted as cross-
loaded dimensions were cast aside is also consistent with previous research that found that
assurance measures load on several different factors depending on the industry context (e.g.
Babakus & Boller, 1992; Carman, 1990; Dabholkar, Shepherd, & Thorpe, 2000; Frost &
Kumar, 2000; Mels, Boshoff, & Nel, 1997).
While these broad factors may embody the notion that delivering reliable, responsive and
equitable service in an appropriate environment contributes to internal service quality
perceptions, they do not suggest what is supposed to be, for instance, reliable, responsive,
or equitable. Study 1 and the items from Study 2 suggests that while a broader

192
classification regime may be tidy, levels of meaning are lost in the process. This suggests
that hierarchical conceptualization of internal service quality may provide greater meaning
to internal service quality evaluations.
5.2.4 Comparison of attributes by strata
This section examines how each stratum of the healthcare setting views the attributes in
Study 2. It was hypothesized that there are differences in perceptions of dimensions used by
individuals to evaluate service quality rendered by others in the internal service chain and
in dimensions they perceive used by others to evaluate quality of work provided by them
(H1).
Table 5.13 compares means of dimensions respondents would use to evaluate others and
those they perceive others would use to evaluate them. Analysis of means gives no clear
picture as to dimensions that are used to evaluate service quality between areas in an
internal service environment. Respondents tended to rate items toward the Very Important
end of the scale. The situation is clearer when rank importance is used to compare the two,
as shown in Table 5.14. Generally, there are shifts in rank position indicating that there are
differences in attributes one would use to evaluate internal service quality and those
perceived others would use to evaluate quality of work. Accuracy (Item 2) has the most
consistency between the two being one rank apart. On the other hand, for Allied Health and
Medical, doing things when promised (Item 3) remained a key attribute in both situations,
while both Corporate Services (15 to 2) and Nursing (18 to 4) show a large movement in
ranking. Large differences can be seen across a number of items (e.g., impact on others,
teamwork, communication). Nevertheless, despite these visual clues to variance between
the two groups of data, it is necessary to undertake statistical analysis to test the
significance of variance observed.
Paired t-tests were performed to establish any difference between statements relating to
perceptions of variables used by individuals to evaluate internal service quality rendered by
others and variables perceived to be used by others to evaluate quality of work provided by
respondents. Sixteen pairs of statements were tested for each stratum. These statements
from Parts IV and V were chosen as they allow direct comparison from one section of the

193
questionnaire dealing with perceptions of attributes used to evaluate others to the next
dealing with perceptions of attributes used to evaluate the quality of others. The results of
these tests are shown in Tables 5.15 to 5.18.
Table 5.13 Differences in importance of variables used by individuals for internal service evaluation and those perceived to be used by others in their evaluations (means)
Item Variable Allied Health
1 2
Corporate Services
1 2
Nursing
1 2
Medical
1 2
Total
1 2 1 Appearance 5.85 5.28 5.84 5.63 6.06 5.87 5.27 5.59 5.88 5.622 Accuracy 6.50 6.48 6.43 6.56 6.53 6.62 6.16 6.49 6.46 6.573 Doing things when promised 6.20 6.48 5.86 6.53 5.94 6.53 5.97 6.32 5.97 6.494 Communication 6.00 6.55 5.77 6.29 6.16 6.56 5.97 6.24 6.04 6.475 Knowledge 6.13 6.53 6.09 6.47 6.28 6.59 5.97 6.24 6.16 6.516 Relating to other staff 5.85 6.15 5.71 6.09 5.88 6.38 5.24 6.08 5.76 6.257 Friendliness 5.88 6.26 6.02 6.14 6.03 6.40 5.76 5.83 5.96 6.258 Respect for others time-frames 5.82 6.18 5.71 6.28 5.88 6.10 5.54 5.50 5.77 6.059 Responsiveness 6.10 6.08 5.76 6.10 5.86 6.12 5.59 5.53 5.84 6.0310 Respect for roles 6.13 6.18 6.02 6.28 6.03 6.21 5.62 5.69 5.98 6.1411 Impact on others 5.53 6.10 4.84 6.21 5.22 6.33 5.41 5.78 5.23 6.2012 Behaviour instils confidence 5.60 6.10 5.36 6.05 5.87 6.25 5.65 5.86 5.71 6.1413 Flexibility 5.78 6.05 5.57 6.02 5.91 6.27 5.43 5.44 5.76 6.0814 Understand worker needs 5.95 6.08 5.82 6.02 5.80 6.28 5.53 5.69 5.80 6.1215 Level of commitment 6.28 6.15 6.00 6.50 6.36 6.45 5.86 5.97 6.22 6.3516 Team work 6.03 6.18 5.88 6.48 5.99 6.43 5.46 5.89 5.90 6.32
1 = Importance of attributes used to evaluate others 2 = Importance of attributes used by others to evaluate respondent Table 5.14 Difference in rank importance of variables used by individuals for internal service evaluation and those perceived used by others Item Variable Allied Health
1 2
Corporate Services
1 2
Nursing
1 2
Medical
1 2
Total
1 2 1 Appearance 20 23 19 23 12 23 26 24 17 24 2 Accuracy 2 3 2 1 2 1 2 2 2 1 3 Doing things when promised 3 3 15 2 18 4 3 2 14 3 4 Communication 16 1 13 9 20 3 3 3 10 4 5 Knowledge 7 2 6 5 5 2 3 3 5 2 6 Relating to other staff 20 13 20 17 17 11 29 7 21 10 7 Friendliness 19 8 11 14 16 10 11 14 15 10 8 Respect for others time-frames 22 9 20 10 19 21 20 20 20 19 9 Responsiveness 12 17 18 15 22 20 16 19 18 20 10 Respect for roles 7 9 10 10 13 17 15 17 13 13 11 Impact on others 27 15 30 13 30 12 24 15 30 12 12 Behaviour instils confidence 26 15 26 19 21 16 14 13 23 13 13 Flexibility 23 19 4 20 17 14 25 21 21 18 14 Understand worker needs 17 17 16 20 23 13 21 17 19 17 15 Level of commitment 3 13 12 3 3 7 7 8 3 7 16 Team work 14 9 14 4 15 8 23 12 16 9
1 = Importance of attributes used to evaluate others 2 = Importance of attributes used by others to evaluate respondent Allied Health

194
At α 0.05, it was found that for Allied Health, there were eight dimensions (50%) for which
significant difference exists. However, adjustment was required due to the number of pairs
evaluated and the multiple comparisons involved. The alpha level is adjusted to control for
the overall Type 1 error rate. The Bonferroni method was used and resulted in α 0.003 for
this analysis. At this level, three dimensions are significant. These are pairs 4
(communication), 5 (knowledge), and 12 (behaviour instilling confidence). In each case,
the perception of what others would use to evaluate internal service quality is greater than
perceptions of attributes used to evaluate others.
Table 5.15 Perceptions of internal service quality dimensions used to evaluate
others and those perceived used in evaluations by others – Allied Health
t df Sig. (2-tailed)
Pair 1 401 appearance – 501 appearance 2.609 39 .013^ Pair 2 403 accuracy – 502 accuracy .240 39 .812 Pair 3 407 timeliness – 503 timeliness -2.562 39 .014^ Pair 4 413 communication easily understood –
504 communication skill -4.113 39 .000^*
Pair 5 414 knowledge of their field – 505 knowledge -3.399 39 .002^* Pair 6 427 well developed interpersonal skills –
507 relate to other staff -1.912 39 .063
Pair 7 405 other workers will be friendly – 509 friendliness to patients & staff
-2.396 38 .022^
Pair 8 410 respect for my timeframes – 511 respect for the timeframes of others
-2.108 38 .042^
Pair 9 419 responsive to my needs – 512 responsive to other depts/disciplines
.000 37 1.000
Pair 10 422 respect for my role – 515 respect for other disciplines & roles
-0.476 38 .637
Pair 11 430 no adverse impact by others actions – 517 impact of work on other disciplines
-2.347 38 .024^
Pair 12 412 behaviour instil confidence – 518 degree of confidence instilled
-3.210 38 .003^*
Pair 13 424 flexibility – 519 degree of flexibility -1.812 38 .078 Pair 14 404 others understand my work needs –
523 effort to understand other workers -1.233 38 .225
Pair 15 425 commitment to serve patients & co-workers – 524 level of commitment to getting the job done
.868 38 .391
Pair 16 428 team orientation to work – 525 teamwork -1.189 38 .242 a area = allied health ^Significant variance α 0.05 *Significant variance at α 0.003

195
Corporate Services
At α 0.05, it was found that for Corporate Services, there were 12 dimensions of the 16
pairs for which there is significant difference. Using the Bonferroni method to adjust for the
number of pairs (α 0.003) to control for Type 1 error, seven dimensions were found to have
significant difference. These are pairs 3 (timeliness), 5 (knowledge), 8 (respect timeframes),
11 (impact on work), 12 (instil confidence), 13 (flexibility), and 15 (commitment). In each
case the perception of what others would use to evaluate internal service quality is greater
than perceptions of attributes used to evaluate others.
Table 5.16 Perceptions of internal service quality dimensions used to evaluate others and those perceived used in evaluations by others – Corporate Services
t df Sig.
(2 tailed)Pair 1 401 appearance – 501 appearance 1.021 74 .310 Pair 2 403 accuracy – 502 accuracy -2.110 76 .038^ Pair 3 407 timeliness – 503 timeliness -5.456 75 .000^* Pair 4 413 communication easily understood –
504 communication skill -3.010 75 .004^
Pair 5 414 knowledge of their field – 505 knowledge -4.928 76 .000^* Pair 6 427 well developed interpersonal skills –
507 relate to other staff -2.845 73 .006^
Pair 7 405 other workers will be friendly – 509 friendliness to patients & staff
-1.512 77 .135
Pair 8 410 respect for my timeframes – 511 respect for the timeframes of others
-3.548 71 .001^*
Pair 9 419 responsive to my needs – 512 responsive to other depts/disciplines
-3.008 69 .004^
Pair 10 422 respect for my role – 515 respect for other disciplines & roles
-0.928 74 .357
Pair 11 430 no adverse impact by others actions – 517 impact of work on other disciplines
-6.146 75 .000^*
Pair 12 412 behaviour instil confidence – 518 degree of confidence instilled
-4.200 72 .000^*
Pair 13 424 flexibility – 519 degree of flexibility -3.991 77 .000^* Pair 14 404 others understand my work needs –
523 effort to understand other workers -1.784 74 .078
Pair 15 425 commitment to serve patients & co-workers – 524 level of commitment to getting the job done
-3.454 76 .001^*
Pair 16 428 team orientation to work – 525 teamwork -2.987 74 .004^ Area = Corporate Services ^Significant variance α 0.05 *Significant variance at α 0.003

196
Nursing At α 0.05, it was found that for the Nursing stratum, there were 13 dimensions (81%) for
which there are significant difference. Using the Bonferroni method to adjust for the
number of pairs (α 0.003), ten dimensions were found to have significant difference:
timeliness (3), communication (4), knowledge (5), interpersonal skills (6), friendliness (7),
impact of actions (11), instil confidence (12), flexibility (13), understand needs (14), and
teamwork (16). In each case, the perception of what others would use to evaluate internal
service quality is greater than perceptions of attributes used to evaluate others.
Table 5.17 Perceptions of internal service quality dimensions used to evaluate
others and those perceived used in evaluations by others – Nursing
t df Sig. (2 tailed)
Pair 1 410 appearance – 501 appearance 1.960 125 .052 Pair 2 403 accuracy – 502 accuracy -1.239 126 .218 Pair 3 407 timeliness – 503 timeliness -6.744 126 .000^* Pair 4 413 communication easily understood –
504 communication skill -5.351 126 .000^*
Pair 5 414 knowledge of their field – 505 knowledge -4.064 126 .000^* Pair 6 427 well developed interpersonal skills –
507 relate to other staff -5.731 126 .000^*
Pair 7 405 other workers will be friendly – 509 friendliness to patients & staff
-3.855 125 .000^*
Pair 8 410 respect for my timeframes – 511 respect for the timeframes of others
-2.378 125 .019^
Pair 9 419 responsive to my needs – 512 responsive to other depts/disciplines
-2.734 126 .007^
Pair 10 422 respect for my role – 515 respect for other disciplines & roles
-2.096 125 .038^
Pair 11 430 no adverse impact by others actions – 517 impact of work on other disciplines
-6.824 124 .000^*
Pair 12 412 behaviour instil confidence – 518 degree of confidence instilled
-3.460 126 .001^*
Pair 13 424 flexibility – 519 degree of flexibility -3.946 126 .000^* Pair 14 404 others understand my work needs –
523 effort to understand other workers -4.290 125 .000^*
Pair 15 425 commitment to serve patients & co-workers – 524 level of commitment to getting the job done
-1.074 124 .285
Pair 16 428 team orientation to work – 525 teamwork -4.691 123 .000^* Area = Nursing ^Significant variance α 0.05 *Significant variance at α 0.003

197
Medical
Using the Bonferroni method to adjust for the number of pairs (α 0.003), one dimension
was found to have significant difference. This is pair 6 (interpersonal skills). Perception of
what others would use to evaluate internal service quality is greater than perceptions of
attributes used to evaluate others.
Table 5.18 Perceptions of internal service quality dimensions used to evaluate others and those perceived used in evaluations by others – Medical
t df Sig.
(2 tailed) Pair 1 401 appearance – 501 appearance 1.160 36 .254 Pair 2 403 accuracy – 502 accuracy -2.411 36 .021^ Pair 3 407 timeliness – 503 timeliness -2.405 36 .021^ Pair 4 413 communication easily understood –
504 communication skill -2.137 36 .039^
Pair 5 414 knowledge of their field – 505 knowledge -2.372 36 .023^ Pair 6 427 well developed interpersonal skills –
507 relate to other staff -5.252 35 .000^*
Pair 7 405 other workers will be friendly – 509 friendliness to patients & staff
-0.780 35 .441
Pair 8 410 respect for my timeframes – 511 respect for the timeframes of others
.119 35 .906
Pair 9 419 responsive to my needs – 512 responsive to other depts/disciplines
.393 35 .697
Pair 10 422 respect for my role – 515 respect for other disciplines & roles
-0.274 35 .786
Pair 11 430 no adverse impact by others actions – 517 impact of work on other disciplines
-1.708 35 .096
Pair 12 412 behaviour instil confidence – 518 degree of confidence instilled
-1.113 35 .273
Pair 13 424 flexibility – 519 degree of flexibility .154 35 .878 Pair 14 404 others understand my work needs –
523 effort to understand other workers -1.000 34 .324
Pair 15 425 commitment to serve patients & co-workers – 524 level of commitment to getting the job done
-0.572 35 .571
Pair 16 428 team orientation to work – 525 teamwork -2.847 34 .007^ Area = Medical ^Significant variance α 0.05 *Significant variance at α 0.003
Performing paired t-tests for each of the stratum for each of the identified pairs of
dimensions reveals significant differences for a number of dimensions. This supports the
hypothesis that there are differences relating to perceptions of variables used by individuals
to evaluate service quality rendered by others and variables perceived to be used by others
to evaluate quality of work provided by respondents.

198
In summary, Table 5.19 identifies the areas where difference exists in the perceptions of
internal service quality dimensions individuals use to evaluate others from those they
perceive used in evaluations by others. While no one pair exhibited significant difference
across all strata, sufficient differences exist to indicate that there are differences in
perceptions of dimensions that an individual would use versus those perceived used by
others. The pattern of differences indicates that the medical stratum is more consistent (1
item with differences) in perceptions of dimensions they would use and those used by
others. Allied Health is also relatively consistent (3 items with differences). However, there
are significant differences across a number of variables for both Corporate Services and
Nursing. The low sample size for both Allied Health and Medical means that power is low
for these strata so it is difficult to find significant difference. Across strata, those pairs with
significant difference in means show that perception of what others would use to evaluate
internal service quality is greater than perceptions of attributes used to evaluate others.
Table 5.19 Comparison of items on paired t-test with significant variation (α 0.003)
Variable Allied Health
Corporate Services
Nursing Medical
Appearance Accuracy Doing things when promised X X Communication X X Knowledge X X X Relating to other staff X X Friendliness X Respect for others time-frames X Responsiveness Respect for roles Impact on others X X Behaviour instils confidence X X X Flexibility X X Understand worker needs X Level of commitment X Team work X
X indicates significant variation
These differences in perception of attributes between strata raise questions as to what
perceptions should be used in developing instruments to evaluate internal service quality.
On one hand there are perceptions of what one would use to evaluate others. On the other,
there are perceptions of what is important to others in evaluating internal service quality. It
is apparent that any attempt to generalise attributes will need to consider the relative

199
salience of attributes to different strata. Otherwise, any measurement obtained may not be a
true reflection or interpretation of internal service quality from one or more of the groups
being evaluated in the internal service chain.
If, as suggested by Brady & Cronin (2001), perceptions form a better means of service
quality evaluation than expectations, then what perceptions form the basis of the evaluation
when dealing with internal service chains? How do these differences in perception between
what attributes would be used to evaluate others and what attributes would be used in
evaluations of internal service quality by others affect evaluations of internal service quality.
Do these differences follow patterns of differences in self evaluation and evaluation by
others? If so, how do they impact on evaluation of internal service quality? These issues
require further research to help determine how effective concentration on perceptions is to
providing accurate evaluations of internal service quality.
5.3 H2 Service expectations of internal service network groups will differ
5.3.1 Expectations of internal service quality
The purpose of this section is to investigate the role of expectations in determining internal
healthcare service quality. If service quality is based in part on the expectations of the
evaluators of the service, then it is important to understand the basis of expectations and
their nature in internal healthcare service chains. It was proposed (P2) that within an
organization, different groups will vary in expectations in terms of internal service
delivery and quality.
Part III of Study 2 deals with individual expectations of internal service quality.
Respondents were asked to indicate how strongly they agreed or disagreed with 20
statements on a seven point scale in Part III. Respondents also had a response option of
indicating if the statement was irrelevant to their situation. Statements cover a range of
issues relating to the work environment and expectations of quality suggested in Study 1.
For example, equity was identified as an issue in Study 1 and is examined through
statements 306 and 309; patient outcomes (316), competence (313, 314), collaboration
(312), reliability (301, 315), communication (305), and courtesy (311, 308). Issues relating
200
to setting of standards (302), being able to measure quality of other disciplines (303), and
outcomes (319, 320) are also examined. Respondents indicated how strongly they agreed
with statements with 1 being strongly disagree and 7 strongly agree. They were also given
the option to indicate if they felt the statement was completely irrelevant (0) to them. Table
5.20 shows the statement items and provides a comparison of the item means across the
strata.
For each statement in Part III of the survey instrument, there is general agreement with
the sentiment of the statement. Analysis of means shows that all but five statements
have a mean equal to or greater than 6.0. However, Variable 303 I expect to be able to
measure the quality of service from other disciplines/areas resulted in a total mean of
3.58, indicating that the focus on quality may not generally extend beyond the
respondents immediate discipline or focus. This is consistent with the findings of Study
1 that indicated an unwillingness to judge others. Six percent of respondents felt that
this statement was irrelevant to their situation. Of these, Corporate Services represent
76% of responses regarding this statement as irrelevant.
Using the means in Table 5.20, rank order of expectations was calculated. Comparison of
the top ten ranks is provided in Table 5.21. The rank of the item I have high expectations
for my own work performance (317) was second overall and either ranked first or second
for each stratum. This item was not counted in the top ten ranks in Table 5.21 as it reflected
an assessment of the respondents own expectations about their own performance and has
been used as a point of reference as it was expected that individuals would consider
themselves to have high expectations. While the attributes identified from Parts IV and V
reported in previous sections as important in evaluations of internal service quality (e.g.,
accuracy, patient outcomes, communication and teamwork) are expectations expressed by
respondents in Part III, the expectation to be treated with respect is the most highly ranked
expectation. There is also the perception that individuals have a high expectation of their
own work. A further expectation is that the work of others will not detract from ability of
the respondent to perform their duties. This aspect reflects the attitude in Study 1 of work
not having an adverse impact. This expectation of not having adverse work impact and that
of equity in working relationships further supports the importance of equity dimensions in
evaluations of internal service quality. There is also an expectation that management will

201
set standards for quality service (302). However, regardless of expectations for
management setting standards, there is a relatively low expectation of being able to
measure the quality of service from other disciplines/areas (303).
Table 5.20 Individual Expectations compared across strata
(Mean Scores)
Variable Allied Health
Corp. Services
Nursing Medical Total
301 I expect others to their work accurately. 6.30 6.28 6.54 6.24 6.42 302 I expect management to set standards for quality service
6.12 6.52 6.10 5.00 6.02
303 I expect to be able to measure the quality of service from other disciplines/areas.
3.93 4.68 5.29 4.03 4.80
304 I expect others to treat me with respect. 6.65 6.68 6.63 6.24 6.59 305 I expect others to be able to communicate without problem.
6.15 6.05 6.32 6.05 6.21
306 I expect others work to not detract from my ability to perform my duties.
6.23 5.77 6.07 5.92 6.02
307 I expect others to be interested in me as a person. 4.78 4.59 4.57 4.08 4.54 308 I expect to form relationships beyond working relationships in work environments.
3.83 3.52 3.54 3.56 3.58
309 Equity in working relationships is important to me. 6.20 5.65 6.15 5.11 5.93 310 I expect workers to do more than just what is in their job description.
4.85 4.71 4.95 5.05 4.91
311 I expect other workers to have competent inter-personal skills.
5.50 5.02 5.73 5.41 5.53
312 I expect workers to effectively work in a team environment.
6.08 6.25 6.23 5.70 6.14
313 I expect people I work with to be skilled in their position.
6.10 5.91 6.08 5.73 6.00
314 I expect people I work with to be knowledgeable in their field.
6.03 6.05 6.10 5.92 6.05
315 I expect people to get their work done on time. 5.87 5.84 5.60 5.65 5.69 316 I expect work performed to have positive outcomes for patients.
6.28 6.39 6.45 5.83 6.33
317 I have high expectations for my own work performance.
6.55 6.63 6.66 6.32 6.59
318 I expect co-workers and workers from other areas to be flexible in their approach to work.
5.78 5.39 6.01 5.68 5.82
319 When my expectations are met I am usually satisfied with quality of work performed by other people.
6.00 5.65 5.84 5.86 5.83
320 I tend to be more critical when evaluating work quality of people I work with on a regular basis than those I work with on an irregular basis.
4.63 4.80 4.38 4.14 4.45
To generalise these expectations: they relate to the reliability of work being performed and
to the social issues in working relationships that affect getting that work done. Social
interaction issues in expectations further confirm the role of these factors in evaluations of
internal service quality.

202
Table 5.21 Comparison of expectation rank – top ten Rank Allied Health Corporate Services Nursing Medical Total
1 Treated with respect
Treated with respect Treated with respect
Accuracy Treated with respect
Treated with respect
2 Accuracy Mgmt set standards Accuracy Accuracy 3 Patient outcomes Patient outcomes Patient outcomes Communication Patient outcomes 4 Not detract my
ability Accuracy Communication Not detract my
ability Knowledge
Communication
5 Equity Teamwork Teamwork Teamwork 6 Communication Communication
Knowledge Equity Satisfied if
expect. met Knowledge
7 Mgmt set standards Mgmt set standards
Skill Not detract from ability Mgmt set standards
8 Skill Timeliness Not detract my ability
Team work
9 Teamwork Not detract my ability Flexibility Flexibility Skill 10 Knowledge Equity Satisfied if
expect. met Patient outcomes
Satisfied if expect. met
To group and reduce the 20 items used in Part III shown in Table 5.20, factor analysis was
performed. The 20 items in Part III were subjected to a principal component analysis. Five
components with an eigenvalue greater than 1 were identified and subjected to a varimax
rotation (Appendix 3). Together, the 5 components account for 66% of the variance of the
items. However, as cross-loaded items were deleted, 3 factors were discarded. The two
remaining factors, reliability and social factors have co-efficient alpha of 0.86 and 0.67
respectively (Table 5.22). This result confirms the observations made in the analysis of
Tables 5.20 and 5.21. These factors are also consistent with the results reported in section
5.2 and reflect expectations relating to reliability of internal service and the social factors
aspects that are important in evaluations of service quality in internal healthcare service
chains.
The first factor, reliability, indicates expectations that the service will be performed
dependably and accurately. Within this factor are the items of skill, knowledge, and
timeliness. This expectation is consistent with findings previously reported in this study.

203
Table 5.22 Expectation factors of internal healthcare service quality
Factor 1 Reliability Loading 313 I expect people I work with to be skilled in their position
.903
314 I expect people I work with to be knowledgeable in their field
.901
315 I expect people to get their work done on time
.704
Coefficient alpha 0.86
Factor 2 Social factors
308 Form relationships beyond working relationships
.831
307 Interest in me as a person .760 319 If expectations are met, usually satisfied with quality of work done by others
.567
310 Do more than just what is in job description .558 Coefficient alpha .67
The second factor identifies expectations of Social factors. This factor is consistent with
dimensions identified in Study 1 and indicated in section 5.2.1 dealing with ranking of
attributes used to evaluate others. The forming of interpersonal working relationships and
interest shown for others as ‘people’ were consistent themes in Study 1. These social
factors were identified in Study 1 as significant dimensions and these were used as an
indication of expected performance. Effectively working in a team environment, competent
interpersonal skills, flexibility and equity are part of this expectation. Linked to this were
meeting expectations of performance levels and going out of one’s way to do more than
just what was in one’s job description.
5.3.2 Differences in expectations of internal service quality
To test the hypothesis (H2) that there are differences between discipline areas in
expectations, ANOVA was performed using factor scores calculated during principal
component analysis. It was found that no significant difference in factor scores exists
between discipline areas for Factor 1 (reliability) and for Factor 2 (Social factors) (p <
0.05).

204
Table 5.23 Mean and Standard Deviations of factors identified as expectations
AlliedHealth
Corporate Services
Nursing Medical Total
Factor 1 Reliability
Mean 0.02 -0.03 0.01 0.05 0.01
Std. Deviation 0.98 0.98 0.96 1.05 0.98
Factor 2 Social factors
Mean 0.16 0.07 -0.06 0.02 0.02
Std. Deviation 1.00 0.97 1.01 0.73 0.97
Factor df F Sig.
1. Reliability 3 0.059 0.981
2. Social factors 3 0.611 0.609
α 0.05
However, given the data reduction through factor analysis and the apparent existence of
multi-dimensionality of internal service quality attributes lost through this data
reduction, further ANOVA of variables in Part III was performed to determine the
statistical significance of the difference between means. It was hypothesised that there
are differences in means. At α 0.05 there are 9 items that show significant difference.
However, using the Bonferroni procedure to adjust the observed significance level to
compensate for the number of comparisons made in ANOVA of Part III (α 0.002), it was
found that significant difference exists in means for expectations in three dimensions.
These are expectations that management would set service quality standards (302), to have
the ability to measure the quality of service from other disciplines/areas (303), and that
there would be equity in working relationships (309). These results are shown in Table
5.24.

205
Table 5.24 ANOVA Table: Expectations F Sig. 301 expect others to do work accurately 2.212 .087 302 expect management to set service quality standards 12.272 .000^* 303 measure the quality of service from other areas 12.547 .000^* 304 treated with respect 3.591 .014^ 305 communicate without problem 0.887 .448 306 others work to not detract from ability to perform own duties 0.658 .579 307 interest in me as a person 1.149 .330 308 form relationships beyond working relationships 0.493 .687 309 equity in working relationships important 7.678 .000^* 310 do more than just what is in job description 0.121 .947 311 competent inter-personal skills 3.249 .022^ 312 effective teamwork 3.491 .016^ 313 skilled in position 1.443 .231 314 knowledgeable in field 0.337 .799 315 do work on time 1.496 .216 316 positive patient outcomes 4.526 .004^ 317 high expectations for own work performance 2.928 .034^ 318 expect other workers to be flexible 3.652 .013^ 319 if expectations met usually satisfied with quality of work done by others 0.572 .634 320 more critical evaluating regular co-workers than irregular co-workers 1.795 .148 ^Significant variance α 0.05 *Significant variance at α 0.002
From these results, it was also hypothesised that given the expectations indicated in Part
III of the survey instrument, then expectations would reflect the perceptions of dimensions
used in evaluations of service quality. To test this hypothesis, paired t-tests were
undertaken linking variables in Part III to those in Parts IV (attributes used to evaluate
others) and V (attributes used by others).
Using the Bonferroni procedure to adjust the observed significance level to compensate
for the number of comparisons made in ANOVA (α 0.004), it was found that
significant difference in means exists for expectations and variables that are used to
evaluate others’ internal service quality. Table 5.25, which identifies expectations
compared to perceptions of attributes used to evaluate others, shows seven pairs with
significant differences. These are respect (2), impact of actions (4), equity (5), putting
in extra effort (6), inter-personal skills (7), teamwork (8), and timeliness (11). Equity is
indicated by both items 2 and 4, demonstrating expectations of equity in the working
relationship. Also supporting previous results of this study, social factors is a major
factor in expectations of internal service quality when considering attributes used to
evaluate others in the internal service chain.
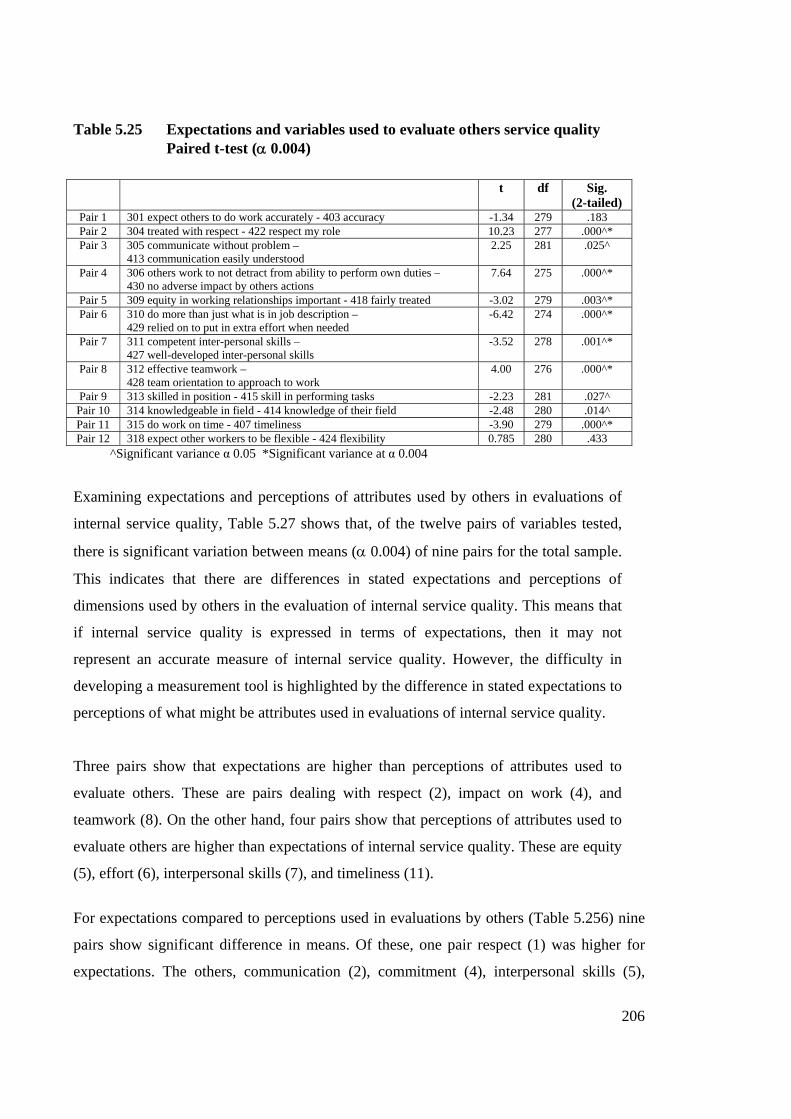
206
Table 5.25 Expectations and variables used to evaluate others service quality Paired t-test (α 0.004)
t df Sig.
(2-tailed) Pair 1 301 expect others to do work accurately - 403 accuracy -1.34 279 .183 Pair 2 304 treated with respect - 422 respect my role 10.23 277 .000^* Pair 3 305 communicate without problem –
413 communication easily understood 2.25 281 .025^
Pair 4 306 others work to not detract from ability to perform own duties – 430 no adverse impact by others actions
7.64 275 .000^*
Pair 5 309 equity in working relationships important - 418 fairly treated -3.02 279 .003^* Pair 6 310 do more than just what is in job description –
429 relied on to put in extra effort when needed -6.42 274 .000^*
Pair 7 311 competent inter-personal skills – 427 well-developed inter-personal skills
-3.52 278 .001^*
Pair 8 312 effective teamwork – 428 team orientation to approach to work
4.00 276 .000^*
Pair 9 313 skilled in position - 415 skill in performing tasks -2.23 281 .027^ Pair 10 314 knowledgeable in field - 414 knowledge of their field -2.48 280 .014^ Pair 11 315 do work on time - 407 timeliness -3.90 279 .000^* Pair 12 318 expect other workers to be flexible - 424 flexibility 0.785 280 .433 ^Significant variance α 0.05 *Significant variance at α 0.004
Examining expectations and perceptions of attributes used by others in evaluations of
internal service quality, Table 5.27 shows that, of the twelve pairs of variables tested,
there is significant variation between means (α 0.004) of nine pairs for the total sample.
This indicates that there are differences in stated expectations and perceptions of
dimensions used by others in the evaluation of internal service quality. This means that
if internal service quality is expressed in terms of expectations, then it may not
represent an accurate measure of internal service quality. However, the difficulty in
developing a measurement tool is highlighted by the difference in stated expectations to
perceptions of what might be attributes used in evaluations of internal service quality.
Three pairs show that expectations are higher than perceptions of attributes used to
evaluate others. These are pairs dealing with respect (2), impact on work (4), and
teamwork (8). On the other hand, four pairs show that perceptions of attributes used to
evaluate others are higher than expectations of internal service quality. These are equity
(5), effort (6), interpersonal skills (7), and timeliness (11).
For expectations compared to perceptions used in evaluations by others (Table 5.256) nine
pairs show significant difference in means. Of these, one pair respect (1) was higher for
expectations. The others, communication (2), commitment (4), interpersonal skills (5),

207
teamwork (6), knowledge (8), timeliness (9), flexibility (11), and accuracy (12) are higher
for perceptions of attributes used in evaluations by others than expectations.
Based on this analysis of all respondents in Study 2, there are differences in expectations
and those attributes used to evaluate others in an internal healthcare service chain. There
are also differences in expectations and perceptions of attributes used by others in their
evaluations of internal service quality. This suggests that further research be undertaken to
better understand the role of expectations in determining evaluations of internal healthcare
service quality.
Table 5.26 Expectations and variables used by others to evaluate service quality
Paired t-test (α 0.004) t df Sig.
(2-tailed)Pair 1 304 treated with respect - 516 treat individuals with respect 4.96 279 .000* Pair 2 305 communicate without problem - 504 communication skill -3.32 279 .001* Pair 3 306 others work to not detract from ability to perform own duties –
517 impact of work on other disciplines -1.75 275 .081
Pair 4 310 do more than just what is in job description - 506 going out of way -11.50 278 .000* Pair 5 311 competent inter-personal skills - 507 relate to other staff -10.09 277 .000* Pair 6 312 effective teamwork - 525 teamwork -2.87 276 .004* Pair 7 313 skilled in position - 520 regard held for professional skill -1.71 276 .089 Pair 8 314 knowledgeable in field - 505 knowledge -8.22 279 .000* Pair 9 315 do work on time - 503 timeliness -11.90 279 .000* Pair 10 316 positive patient outcomes - 510 patient outcomes -1.40 260 .164 Pair 11 318 expect other workers to be flexible - 519 degree of flexibility -4.43 278 .000* Pair 12 301 expect others to do work accurately – 502 accuracy -4.04 278 .000* *Significant variance at α 0.004 To further evaluate differences in strata, ANOVA was calculated for each stratum using
the above pairs. Table 5.27 shows items relating to expectations (Part III) and perceived
dimensions (Part IV) used to evaluate service from others by strata. Bonferroni procedure
was used to compensate for the number of variables used (α 0.004). Significant
differences in means between expectations and perceptions of attributes used to evaluate
others were found in one item for Allied Health (respect 2); three items for Corporate
Services (respect 2, impact on work 4, and teamwork 7); five items for Nursing (respect 2,
impact on work 4, commitment 6, teamwork 8, and timeliness 11); and one item for
Medical (respect 2). These results are compared and summarized in Table 5.29.

208
Table 5.27 Expectations and perceptions of attributes used to evaluate others
Pair
Dimension Allied Health
Corporate Services
Nursing Medical
t df
Sig. (2-
tailed)
t
df
Sig. (2-
tailed)
t
df
Sig. (2-
tailed)
t
df
Sig. (2-
tailed) 1. Accuracy -1.951 39 .058 -1.587 76 .117 .000 125 1.000 .770 36 .446 2. Respect 3.787 39 .001* 5.302 74 .000* 6.895 125 .000* 3.745 36 .001* 3. Communication .973 39 .337 .988 77 .326 1.853 126 .066 .488 36 .628 4. Impact on work 2.732 39 .009 4.778 74 .000* 4.769 124 .000* 2.615 35 .013 5. Equity .453 39 .653 -2.675 76 .009 -1.220 125 .225 -2.102 36 .043 6. Commitment -2.222 39 .032 -2.639 72 .010 -5.350 126 .000* -1.582 34 .123 7. Interpersonal skills -2.058 39 .046 -4.102 74 .000* -1.260 126 .210 .902 36 .373 8. Teamwork .404 39 .688 2.256 74 .027 3.024 126 .003* 1.506 34 .141 9. Skills -.216 39 .830 -.627 77 .532 -2.328 126 .022 -.644 36 .524 10. Knowledge -.726 39 .472 -.491 76 .625 -2.447 126 .016 -.529 36 .600 11. Timeliness -2.481 39 .018 -.655 75 .514 -3.469 126 .001* -1.672 36 .103 12. Flexibility .000 39 1.000 -1.146 77 .255 1.361 125 .176 1.505 36 .141 *Significant variance at α 0.004
Table 5.28 shows items relating to expectations (Part III) and perceived dimensions used
by others (Part V) to evaluate service quality by strata. Bonferroni procedure was used to
compensate for the number of variables used (α 0.004). Significant differences in means
between expectations and perceptions of attributes used by others in evaluations of internal
service quality were found for four items for Allied Health (commitment 4, interpersonal
skills 5, knowledge ), and timeliness 9; seven items for Corporate Services (respect 1,
commitment 4, interpersonal skills 5, knowledge 8, timeliness 9, flexibility 11, and
accuracy 12; five items for Nursing (respect 1, commitment 4, interpersonal skills 5,
knowledge 8, and timeliness 9; and three items for Medical (commitment 4, interpersonal
skills 5, and timeliness 9). These results are summarized in Table 5.30.

209
Table 5.28 Expectations and perceptions of attributes used in evaluations by others
Pair Dimension
Allied Health
Corporate Services
Nursing Medical
t
df
Sig. (2-
tailed)
t
df
Sig. (2-
tailed)
t
df
Sig. (2-
tailed)
t
df
Sig. (2-
tailed)1. Respect 1.538 38 .132 2.969 77 .004* 3.100 126 .002* 1.963 35 .0582. Communication -2.393 39 .022 -1.000 75 .321 -2.477 126 .015 -1.125 36 .2683. Impact on work .432 38 .668 -1.221 74 .226 -2.365 126 .020 1.022 34 .3144. Commitment -3.956 39 .000* -6.001 75 .000* -7.800 126 .000* -5.017 35 .000*5. Interpersonal skills -4.759 39 .000* -6.793 74 .000* -5.498 126 .000* -3.651 35 .001* 6. Teamwork -.797 38 .430 -1.815 77 .073 -1.906 123 .059 -1.156 35 .2557. Skills -.552 38 .584 -.784 74 .435 -1.144 126 .255 -.852 35 .4008. Knowledge -3.491 39 .001* -4.610 75 .000* -5.419 126 .000* -2.317 36 .0269. Timeliness -4.356 39 .000* -5.486 75 .000* -9.238 126 .000* -3.416 36 .002*10. Patient Outcomes -1.044 38 .303 .000 63 1.000 -.635 122 .527 -1.482 34 .14811. Flexibility -1.498 38 .142 -5.422 77 .000* -2.310 125 .023 1.070 35 .29212. Accuracy -1.639 39 .109 -3.750 75 .000* -1.135 125 .258 -1.859 36 .071
*Significant variance at α 0.004
Table 5.29 Expectations and perceptions of variables used to evaluate others. Comparison of dimensions for which significant differences exist in means for paired t-test in each stratum (α .004)
Pair Dimension Allied
Health Corporate Services
Nursing Medical
1. Accuracy 2. Respect X* X* X* X* 3. Communication 4. Impact on work X* X* 5. Equity X 6. Commitment X 7. Interpersonal skills X 8. Teamwork X* 9. Work skills 10. Knowledge 11. Timeliness X 12. Flexibility
X indicates significant difference *indicates higher on expectations
Examination of differences in expectations and perceptions of variables used to evaluate
others (Table 5.29) shows that the dimension of respect had significant difference across all
strata. Allied Health only has one dimension for which significant difference was found,
Medical two, Nursing three, and Corporate Services four dimensions respectively. However,
greater differences are evident between expectations and perceptions of dimensions that
others might use in evaluation of service quality (Table 5.30). The dimensions of
commitment, interpersonal skills, and timeliness show significant difference across all strata.

210
Significant differences for the knowledge dimension are also found for three of the four
strata. Both Corporate Services and Nursing show significant differences on a number of
dimensions.
For Allied Health, expectations of respect (2) are higher than perceptions of respect as an
attribute in evaluations of others. Corporate Services is higher in expectations for respect
(2) and impact on work (4), and higher in perceptions of attributes used to evaluate others
for interpersonal skills (7). Nursing is higher in expectations for respect (2), impact on work
(4), and teamwork (8), and higher in perceptions of attributes used to evaluate others for
commitment (6) and timeliness (11). For Medical, expectations of respect (2) were higher
than perceptions.
Table 5.30 Comparing expectations with perceptions of dimensions used by others to evaluate respondent work. Paired t-tests for dimensions with significant differences in means (α .004)
Pair Dimension Allied
Health Corporate Services
Nursing Medical
1. Respect X* X* 2. Communication 3. Impact on work 4. Commitment X X X X 5. Interpersonal skills X X X X 6. Teamwork 7. Work skills 8. Knowledge X X X 9. Timeliness X X X X 10. Patient outcomes 11. Flexibility X 12. Accuracy X
X indicates significant variation *indicates higher on expectations
For expectations compared with perceptions of dimensions used by others to evaluate
service quality of respondents, significant differences were found for the dimensions of
timeliness (9), interpersonal skill (5), and commitment (4). Knowledge (8) was also a
factor indicating significant differences across three of the strata. Of items with significant
differences, respect (1) was higher on expectations than perceptions. All others were
higher on perceptions of attributes used by others in evaluations of internal service quality.

211
The size of the sample for Allied Health and Medical may have affected results in
calculations in Tables 5.25 to 5.30, and consequently made it difficult to confirm
significant differences. This may help explain why Corporate Services and Nursing have a
greater number of differences.
These results indicate that while it may reasonable to suppose that expectations would
drive perceptions of service quality, there are sufficient differences between expectations
and perceptions of dimensions used to evaluate internal service quality to indicate that
expectations in this healthcare environment would not be reliable predictors of perceptions
of attributes used in evaluations of internal service quality. This indicates that the
SERVQUAL approach to service quality is unhelpful in evaluations of internal healthcare
service quality. The perceptions approach of Brady and Cronin (2001) may be a more
appropriate framework. However, this study suggests that further research into perceptions
of internal service quality is necessary to understand the significance of different
perceptions of what attributes are used in evaluations of others and what are used in
evaluations by others.
5.4 H3 Ratings will differ in importance of service quality dimensions
amongst internal service groups.
The purpose of section 5.4 is to examine importance rankings of internal service quality
amongst groups in the internal service chain. While rankings have been implicitly obtained
previously in this study (section 5.2.1), this section has been designed to provide explicit
ranking of internal service quality attributes. Following examination of rankings of the total
sample, each stratum within the sample is examined to identify ranking importance of
attributes.
In order to assess the relative importance of attributes, respondents were asked to identify in
Part VI (shown below Figure 5.1) the five attributes they considered most important to
others in evaluating service quality. This approach was taken in that Part V was used to
provide the attribute list and it immediately preceded Part VI. Also, it was thought that by
focussing on what others would use to evaluate service quality, then perceptions of
importance would be purer than looking at what the respondent would use to evaluate

212
service quality. To focus respondents on attributes of greater importance, they were then
asked to rank attributes in order of importance based on which attribute they thought was
most important, the second most important, and then the least important. This approach
allows identification of more salient factors when the nature of the issues surveyed would
generate similar scores among a number of factors. By forcing respondents to identify the
five most important attributes and then having them identify the most important and so forth,
enables identification of key factors (Alreck & Settle, 1995; Malhotra, Hall, Shaw &
Oppenheim, 2006). This is particularly useful as it was expected that the nature of the
attributes being tested would make it difficult to identify salience and depth of feeling
between attributes.
Figure 5.1 Part VI -Ranking of service quality attributes pro-forma
PART VI
DIRECTIONS
Each statement in PART V represents an attribute that might be used to evaluate service quality. By using the number of the statement, please identify below the five attributes you think are most important for others to evaluate the excellence of service quality of your work. Statement numbers ______, ______, _______, _______, _______ Which one attribute among the above five is likely to be most important to other workers? (please enter the statement number) _________________ Which attribute among the above five is likely to be the second most important to other workers? _________________ Which attribute among the above five is likely to be least important to other workers. ______________________
The nominations were tabulated and weighted to give positional rank for each of the
dimensions nominated. Weighting of items was done to indicate relative importance based on
how important the item was compared to other attributes. Items were weighted by scoring the
attribute nominated as “most important” ‘10’, the “second most important” ‘8’, and the “least
important” ‘2’. Nominations for the third and fourth importance were not asked for. The

213
number of nominations in these two categories was determined by deducting the number of
ranked nominations from the frequency of mentions in the five variables nominated as the
most important from the list of variables in Part V. These were scored ‘5’ as a compromise
between ‘6’ and ‘4’ that would have been assigned had third and forth nominations been used.
It was also used as a means to minimise impact on total scores. Only items mentioned are
scored so items not mentioned in effect score zero. Non-nomination therefore contributes to
the relatively low aggregate scores for attributes. For example, the total possible score for any
one item is 2,500 in Table 5.31, so with non-nomination, the highest rating attribute scored
1016 and the lowest 26 out of a possible 2500.
Rankings of attributes are ranked 1 through 25 for the total sample in Table 5.31. Rankings
are based on the weighted score for each item and are an aggregate of sample scores. As
such, scores do not address any differences that may exist from one stratum to the next.
Differences between strata are addressed in the following section.
Table 5.31 Ranking of Service Quality Attributes - Total
Rank
Attribute Weighted
Score 1 5 Your knowledge of your field. 1016 2 2 Accuracy of your work. 870 3 10 Outcomes of your work for patients. 784 4 4 Your level of communication skills. 711 5 25 Your work in a team. 624 6 3 Doing things when you say you will. 470 7 22 The effort you make to understand the needs of patients. 338 8 12 Your responsiveness to the needs of other disciplines/areas. 254 8 24 Your level of commitment to "getting the job done." 254
10 16 Whether you treat individual workers with respect. 243 11 17 The impact of your work performance on other workers. 227 12 7 How you relate to other staff members. 222 13 21 Your ability to organise work activities. 214 14 23 The effort you make to understand the needs of workers you interact with. 203 15 15 Level of respect you show for other workers' disciplines and roles. 190 16 19 The degree of flexibility you have in work situations. 152 17 9 Friendliness you have for patients and staff. 151 18 6 Going out of your way to help others 146 19 20 Regard held for your professional skill. 145 20 11 Respect you have for time frames of workers from other disciplines/areas. 98 21 18 The degree of confidence your behaviour instils in other workers. 94 22 13 Dealings you have with other disciplines/areas have no hidden agendas. 61 23 8 Keeping your head down and just doing your work. 60 24 1 Your appearance. 57 25 14 Feedback from you on work performed by other disciplines/areas 26
Attributes numbered after Part V.

214
On the basis of the total sample, the attributes perceived most important for others to evaluate
the excellence of service quality of work performed by individuals are:
1. Knowledge
2. Accuracy
3. Patient Outcomes
4. Communication
5. Teamwork
6. Timeliness
There is a noticeable distance in weighting between knowledge and the next level (accuracy
and patient outcomes) and there is a further gap to the next level of teamwork, communication
and timeliness. Understanding patient needs may be grouped with these three as well
following the patterns of grouping in the literature. Assigning these variables to SERVQUAL
dimensions effectively reduces them to the elements of Assurance, Reliability, Empathy, and
Responsiveness. This would support the results of factor analysis reported in other sections.
However, aggregating dimensions suggested by variables into the general categories posited
by prior researchers may simplify conceptualisation but creates difficulty in understanding the
nuances of attributes that form dimensions used to evaluate internal service quality. The
aggregation is therefore limited to allow closer investigation of the themes identified in this
research. Factor analysis allows reduction of data and summarisation to identify variables
that may be grouped to describe factors at a more manageable level. These factors have
been reported previously in this study.
Comparing these explicit attributes to the implicit attributes of Part V reported in Table 5.9,
the results indicate that essentially the same attributes are seen as key attributes in
evaluations of service quality. However, there are differences in rank order of attributes for
the top six attributes, with accuracy and knowledge reversed in importance for the top
position. While there is consistency in attributes, teamwork is ranked higher in explicit
ranking at 5, compared to 9th in implicit attributes (Table 5.9). A comparison is provided in
Table 5.32. Differences may be attributed to the method of rank calculation in each case
and the relative closeness of some items that makes absolute ranking difficult.

215
Table 5.32 Comparison of implicit and explicit service quality attributes
Rank Implicit attributes Explicit attributes
1 Accuracy Knowledge
2 Knowledge Accuracy
3 Timeliness Patient outcomes
4 Communication Communication
5 Patient outcomes Teamwork
6 Understanding patient needs Timeliness
These results further support the view that internal healthcare service quality perceptions
are multilevel and multi-dimensional, a conceptualisation of service quality proposed by
Dabholkar, Thorpe and (1996) and Brady and Cronin (2001). For example, evaluations of
internal healthcare service quality are expressed in terms of patient outcomes which make
the relationship triadic rather than dyadic, introducing the multi-level concept in terms of
the participants. Multi-level is also indicated within dimensions when nuances are attached
to the meanings of attributes identified in factor analysis. Multi-dimensional is shown
through the factors that are used to evaluate internal healthcare quality. While factor
analysis effectively reduced data to factors representing dimensions of internal service
quality, these factors do not address questions as to what attributes constitute the notions,
for example, of reliability, responsiveness, empathy, and assurance.
5.4.1 Ranking of attributes by strata To understand differences between strata, data was further analysed by stratum. Results for
each stratum are shown in the following sections. Responses for each attribute were
weighted according to the ranking of respondents and scored the same as for the total
sample. Differences in weighted scores across the strata are a function of the response rate
for the stratum and responses of each stratum. It is interesting that no strata scored 50% of
the possible score for any of the attributes. This is indicative of the spread of nominations
and differences of opinion in ranking of attributes. It is also reflective of the multilevel and
multidimensional characteristics of service quality perceptions indicated in this Study and
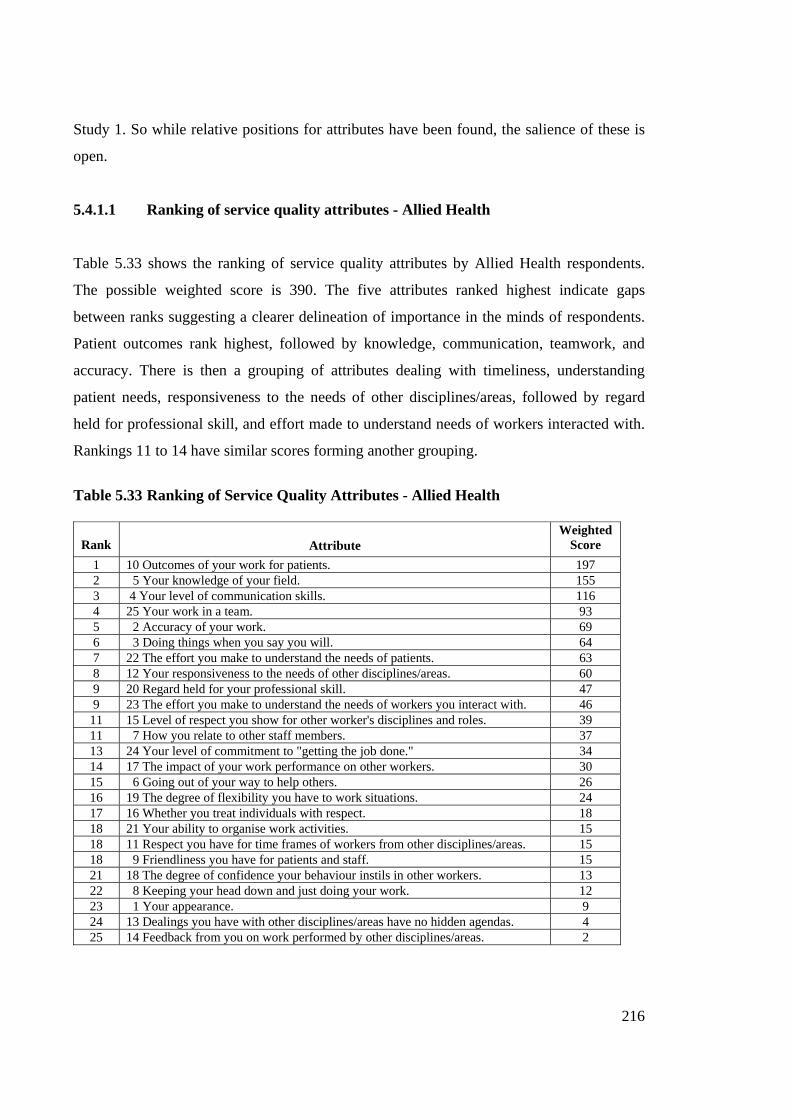
216
Study 1. So while relative positions for attributes have been found, the salience of these is
open.
5.4.1.1 Ranking of service quality attributes - Allied Health
Table 5.33 shows the ranking of service quality attributes by Allied Health respondents.
The possible weighted score is 390. The five attributes ranked highest indicate gaps
between ranks suggesting a clearer delineation of importance in the minds of respondents.
Patient outcomes rank highest, followed by knowledge, communication, teamwork, and
accuracy. There is then a grouping of attributes dealing with timeliness, understanding
patient needs, responsiveness to the needs of other disciplines/areas, followed by regard
held for professional skill, and effort made to understand needs of workers interacted with.
Rankings 11 to 14 have similar scores forming another grouping.
Table 5.33 Ranking of Service Quality Attributes - Allied Health
Rank Attribute
Weighted Score
1 10 Outcomes of your work for patients. 197 2 5 Your knowledge of your field. 155 3 4 Your level of communication skills. 116 4 25 Your work in a team. 93 5 2 Accuracy of your work. 69 6 3 Doing things when you say you will. 64 7 22 The effort you make to understand the needs of patients. 63 8 12 Your responsiveness to the needs of other disciplines/areas. 60 9 20 Regard held for your professional skill. 47 9 23 The effort you make to understand the needs of workers you interact with. 46
11 15 Level of respect you show for other worker's disciplines and roles. 39 11 7 How you relate to other staff members. 37 13 24 Your level of commitment to "getting the job done." 34 14 17 The impact of your work performance on other workers. 30 15 6 Going out of your way to help others. 26 16 19 The degree of flexibility you have to work situations. 24 17 16 Whether you treat individuals with respect. 18 18 21 Your ability to organise work activities. 15 18 11 Respect you have for time frames of workers from other disciplines/areas. 15 18 9 Friendliness you have for patients and staff. 15 21 18 The degree of confidence your behaviour instils in other workers. 13 22 8 Keeping your head down and just doing your work. 12 23 1 Your appearance. 9 24 13 Dealings you have with other disciplines/areas have no hidden agendas. 4 25 14 Feedback from you on work performed by other disciplines/areas. 2

217
A comparison of these rankings to those in Table 5.9 shows differences in the rankings of
attributes used for evaluations of internal healthcare service quality (Table 5.34). The order
of patient outcomes is reversed, moving from rank 6 as an implicit attribute to rank 1 as an
explicit attribute. Knowledge remains the second most important attribute. Teamwork is
introduced at rank 4, while in Table 5.9 it is rank 9. Respect for individuals is not highly
regarded in the explicit attributes (rank 17) compared to rank 5 in the implicit rankings.
Table 5.34 Comparison of implicit and explicit service quality attributes – Allied
Health
Rank Implicit attribute Explicit attribute 1 Communication Patient outcomes 2 Knowledge Knowledge 3
(equal) Accuracy
Timeliness Communication
4 Teamwork 5 Respect individual Accuracy 6 Patient outcomes Timeliness
5.4.1.2 Ranking of service quality attributes - Corporate Services The possible weighted score for Corporate Services is 700 in Table 5.35. For respondents
in the Corporate Services stratum the most significant dimension for evaluating service
quality is accuracy of work performed. This is followed by knowledge, with teamwork,
timeliness, and communication essentially equal in the next position. There is then a gap to
commitment. A number of other attributes are then clustered relatively closely together.
The relatively low ranking of patient outcomes (rank 10) by Corporate Services compared
to other strata (rank 1, 2, and 3 for other strata, and 3 overall) indicates a relative non-
patient focus of patients in evaluations of internal service quality. This orientation is further
evidenced by 23% of Corporate Services responses to the statement my work is patient
centred (v109) in Part I of Study 2 being rated Not Applicable. This contributes to most of
the overall Not Applicable result of 5% for the study.
Comparing these results with those in Table 5.9, the ranking of attributes between those
derived implicitly differ from the explicit items ranked in Part VI. This comparison is
shown in Table 5.36. Accuracy is rank 1 in both cases. It is interesting that the implicit
ranking of patient outcomes is rank of 6 compared to the explicit rank of 10. There are
other differences in the rank of attributes. However, again it is difficult to determine the

218
differences of rankings in real terms given the closeness of means used in implicit ranks
and the method used to calculate the explicit ranks.
Table 5.35 Ranking of Service Quality Attributes - Corporate Services
Rank
Variable
Weighted Score
1 2 Accuracy of your work 315 2 5 Your knowledge of your field 255 3 25 Your work in a team 208 4 3 Doing things when you say you will 180 5 4 Your level of communication skills 126 6 24 Your level of commitment to "getting the job done." 123 7 17 The impact of your work performance on other workers 94 8 12 Your responsiveness to the needs of other disciplines/areas 84 8 21 Your ability to organise work activities 84 10 10 Outcomes of your work for patients 81 11 7 How you relate to other staff members 75 12 16 Whether you treat individual workers with respect 70 13 11 Respect you have for time frames of workers from other disciplines/areas 63 14 22 The effort you make to understand the needs of patients 59 15 23 The effort you make to understand the needs of workers you interact with 58 16 19 The degree of flexibility you have to work situations 45 17 8 Keeping your head down and just doing your work 36 18 6 Going out of your way to help others 34 19 15 Level of respect you show for workers' disciplines and roles 38 20 1 Your appearance 27 21 13 Dealings you have with other disciplines/areas have no hidden agendas 22 22 18 The degree of confidence your behaviour instils in other workers 17 23 9 Friendliness you have for patients and staff 16 24 14 Feedback from you on work performed by other disciplines/areas 15 25 20 Regard held for your professional skill 13
Table 5.36 Comparison of implicit and explicit service quality attributes –
Corporate Services
Rank Implicit attributes Explicit attributes
1 Accuracy Accuracy
2 Timeliness Knowledge
3 Get job done Teamwork
4 Teamwork Timeliness
5 Knowledge Communication
6 Patient outcomes Commitment

219
5.4.1.3 Ranking of service quality attributes - Nursing Nursing rank attributes of service quality attributes as shown in Table 5.37. The possible
score is 1080. There is some difference between the top attribute, knowledge, and the next
three attributes that are clustered (communication, patient outcomes and accuracy). There is
a gap to the fifth ranked attribute, teamwork, with the remaining rank scores falling away.
Table 5.37 Ranking of Service Quality Attributes - Nursing
Rank
Variable
Weighted Score
1 5 Your knowledge of your field 465 2 4 Your level of communication skills 378 3 10 Outcomes of your work for patients 371 4 2 Accuracy of your work 365 5 25 Your work in a team 278 6 3 Doing things when you say you will 197 7 22 The effort you make to understand the needs of patients 161 8 16 Whether you treat individual workers with respect 127 9 21 Your ability to organise work activities 94 10 7 How you relate to other staff members 88 11 17 The impact of your work performance on other workers 85 11 23 The effort you make to understand the needs of workers you interact with 85 13 24 Your level of commitment to "getting the job done" 80 13 12 Your responsiveness to the needs of other disciplines/areas 80 15 15 Level of respect you show for other workers' discipline and roles 75 16 9 Friendliness you have for patients and staff 72 17 19 The degree of flexibility you have to work situations 70 18 6 Going out of your way to help others 69 19 20 Regard for your professional skill 51 20 13 Dealings you have with other disciplines/areas have no hidden agendas 33 21 18 The degree of confidence your behaviour instils in other workers 29 22 1 Your appearance 20 23 11 Respect you have for time frames of workers from other disciplines/areas 15 24 14 Feedback from you on work performed from other disciplines/areas 9 25 8 Keeping your head down and just doing your work 4
Comparing these attributes to those in Table 5.9 in Table 5.38, it is found that there are
differences in the rank order of attributes. This may be explained by the closeness of the
weighted scores and the means used to calculate rank in Table 5.9. Again teamwork is seen
as an important attribute from the explicit ranking in Part VI.
Table 5.38 Comparison of implicit and explicit service quality attributes – Nursing

220
5.4.1.4 Ranking of service quality attributes - Medical Weighted ranking of attributes by Medical respondents is found in Table 5.39. The possible
score is 330. Knowledge and patient outcomes are virtually equal in weighting with
accuracy closely following. Communication then follows with the remaining attributes with
relatively low ranking scores. The closeness of scores makes it difficult to be definitive in
the rank of the first attributes. This may account for some of the differences when
comparing the explicit results with implicit results of Table 5.9. The comparison is shown
in Table 5.40.
Table 5.39 Ranking of Service Quality Attributes - Medical
Rank Attribute Weighted
Score 1 5 Your knowledge of your field 141 2 10 Outcomes of your work for patients 135 3 2 Accuracy of your work 121 4 4 Your level of communication skills 85 5 22 The effort you make to understand the needs of patients 55 6 9 Friendliness you have for patients and staff 48 7 25 Your work in a team 45 8 18 The degree of confidence your behaviour instils in other workers 35 9 7 How you relate to other staff members 34 9 20 Regard held for your professional skill 34 11 3 Doing things when you say you will 29 12 15 Level of respect you show for other workers'' disciplines and roles 28 12 16 Whether you treat individual workers with respect 28 14 12 Your responsiveness to the needs of other disciplines/areas 25 15 21 Your ability to organise work activities 24 16 17 The impact of your work performance on other workers 18 17 6 Going out of your way to help others 17 17 24 Your level of commitment to "getting the job done" 17 19 19 The degree of flexibility you have to work situations 13 20 8 Keeping your head down and just doing your work 12 21 23 The effort you make to understand the needs of workers you interact with 11 22 11 Respect you have for time frames of workers from other disciplines/areas 5 23 1 Your appearance 2 23 13 Dealings you have other disciplines/area have no hidden agendas 2 25 14 Feedback from you on work performed by other disciplines/areas 0
Rank Implicit attributes Explicit attributes 1 Accuracy Knowledge 2 Knowledge Communication 3 Communication Patient outcomes 4 Timeliness Accuracy 5 Patient outcomes Teamwork 6 Understand the patient Timeliness

221
Table 5.40 Comparison of implicit and explicit service quality attributes –
Medical
Rank Implicit attributes Explicit attributes 1 Accuracy Knowledge 2 Timeliness Patient outcomes 3 Communication
Knowledge Accuracy
4 Communication 5 Patient outcomes Understanding patients 6 Understanding patient Friendliness
5.4.2 Comparison of ranking of service quality attributes Section 5.4.1 has established that there are not only differences in ranking of implicit and
explicit dimensions, but also differences in ranking between strata. This section examines
the nature of these differences. Table 5.41 summarizes the six highest ranked variables for
each of the strata and compares them to those for the total survey for items in Part VI. All
strata regard knowledge and accuracy in the top five ranks. For clinical staff, patient
outcomes are important but do not figure in rankings for Corporate Services. Nursing and
Allied Health align for attributes but not rankings.
Table 5.41 Ranking of most important service quality attributes by strata
Rank Allied Health
Corporate Services
Nursing Medical Total
1 Patient outcomes
Accuracy Knowledge Knowledge Knowledge
2 Knowledge Knowledge Communication Patient outcomes Accuracy 3 Communication Team work Patient outcomes Accuracy Patient outcomes4 Team work Timeliness Accuracy Communication Communication 5 Accuracy Communication Team work Understanding
patient needs Team work
6 Timeliness Commitment Timeliness Friendliness Timeliness To allow further comparison of each item across strata, average scores for each attribute
were calculated. Average scores were calculated by taking the total points for each item and
dividing by the number of respondents in the strata. These average scores give greater

222
comparability for each item and are shown in Table 5.42. Comparison of average scores for
each item shows low scores for each item. This is accounted for when the effect on scores
of non-nomination is taken into account. However, the scores indicate the difficulty in
nominating the most important attribute and the spread of items thought to be important.
The aggregation of dimensions overcomes this problem to some extent. However, doing
this negates the variation between strata and the nuances indicated by these variations are
lost. This may account to some degree for the difficulties experienced in developing service
quality measurement tools, as the approaches used do not take into account the multilevel
and multidimensional nature of service perceptions indicated in Study 1 and these results.
Table 5.42 Comparison of attribute average of weighted scores Variable Allied
HealthCorp.
ServicesNursing Medical Total
501 Your appearance. 0.23 0.39 0.19 0.06 0.23 502 Accuracy of your work. 1.77 4.50 3.38 3.21 3.48 503 Doing things when you say you will. 1.64 2.57 1.82 .088 1.88 504 Your level of communication skills. 2.97 1.84 3.50 2.58 2.84 505 Your knowledge of your field. 3.97 3.64 4.31 4.27 4.06 506 Going out of your way to help others. 0.67 0.49 0.64 0.52 0.62 507 How you relate to other staff members. 0.95 1.07 0.70 1.03 0.89 508 Keeping your head down and just doing your work. 0.31 0.51 0.04 0.36 0.24 509 Friendliness you have for patients and staff. 0.38 0.22 0.67 1.46 0.60 510 Outcomes of your work for patients. 5.05 1.16 3.44 4.09 3.14 511 Respect you have for time frames of workers from other areas.
0.38 0.90 0.14 0.15 0.39
512 Your responsiveness to the needs of other areas. 1.54 1.20 0.74 0.76 1.02 513 Dealings you have with other areas have no hidden agendas.
0.10 0.31 0.31 0.06 0.24
514 Feedback from you on work performed by other areas.
0.05 0.21 0.08 0.00 0.10
515 Level of respect you show for other worker's disciplines and roles.
1.00 0.54 0.79 0.85 0.76
516 Whether you treat individual workers with respect. 0.46 1.00 1.18 0.85 0.97 517 The impact of your work performance on other workers.
0.77 1.34 0.79 0.55 0.91
518 The degree of confidence your behaviour instils in other workers.
0.33 0.24 0.27 1.06 0.38
519 The degree of flexibility you have to work situations 0.61 0.64 0.65 0.39 0.61 520 Regard held for your professional skill. 1.20 0.19 0.47 1.03 0.58 521 Your ability to organise work activities. 0.38 1.20 0.87 0.73 0.86 522 The effort you make to understand the needs of patients.
1.61 0.84 1.49 1.67 1.35
523 The effort you make to understand the needs of workers you interact with.
1.18 0.82 0.82 0.33 0.81
524 Your level of commitment to "getting the job done." 0.87 1.76 0.74 0.52 1.02 525 Your work in a team. 2.39 2.97 2.57 1.36 2.50
N 39 70 108 33 250

223
Using the average scores in Table 5.42, the rank for each attribute was calculated and
presented in Table 5.43. It can be seen that there is limited agreement on ranking of
attributes. The top six ranks are as indicated in Table 5.41. However, to gain a better
understanding of the differences shown in rank, further analysis was undertaken.
Table 5.43 Comparison of ranking of service quality attributes
Attribute Allied Health
Corporate Services
Nursing Medical Totals
1 Your appearance 23 20 22 23 24 2 Accuracy of your work 5 1 4 3 2 3 Doing things when you say you will 6 4 6 11 6 4 Your level of communication skill 3 5 2 4 4 5 Your knowledge of your field 2 2 1 1 1 6 Going out of your way to help others 15 18 18 17 18 7 How you relate to other staff members 11 11 10 9 12 8 Keeping your head down and 22 17 25 20 23 9 Friendliness you have for patients & staff 20 23 16 6 17 10 Outcomes of your work for patients 1 10 3 2 3 11 Respect you have for time frames of workers from other disciplines/areas
18 13 23 22 20
12 Your responsiveness to the needs of other disciplines/areas
8 8 13 14 8
13 Dealings you have with other disciplines/ areas have no hidden agendas
24 21 20 23 22
14 Feedback from you on work performed by other disciplines/areas
25 24 24 25 25
15 Level of respect you show for other workers' disciplines and roles
11 19 15 12 15
16 Whether you treat individual workers with respect
17 12 8 12 10
17 The impact of your work performance on other workers
14 7 11 16 11
18 The degree of confidence you behaviour instils in other workers
21 22 21 8 21
19 The degree of flexibility you have to work situations
16 16 17 19 16
20 Regard held for your professional skill 9 25 19 9 19 21 Your ability to organise work activities 18 8 9 15 13 22 The effort you make to understand the needs of patients
7 14 7 5 7
23 The effort you make to understand the needs of workers you interact with
9 15 11 21 14
24 Your level of commitment to "getting the job done"
13 6 13 17 8
25 Your work in a team 4 3 5 7 5
Using the data in Table 5.43, the variable with the highest rank was given the value of zero
and the difference between the highest ranked to the remaining rankings was determined.
For example, for the attribute appearance, Corporate Services has the highest rank of 20.
This becomes 0 and the ranks for the other strata reflect the distance from the highest rank.
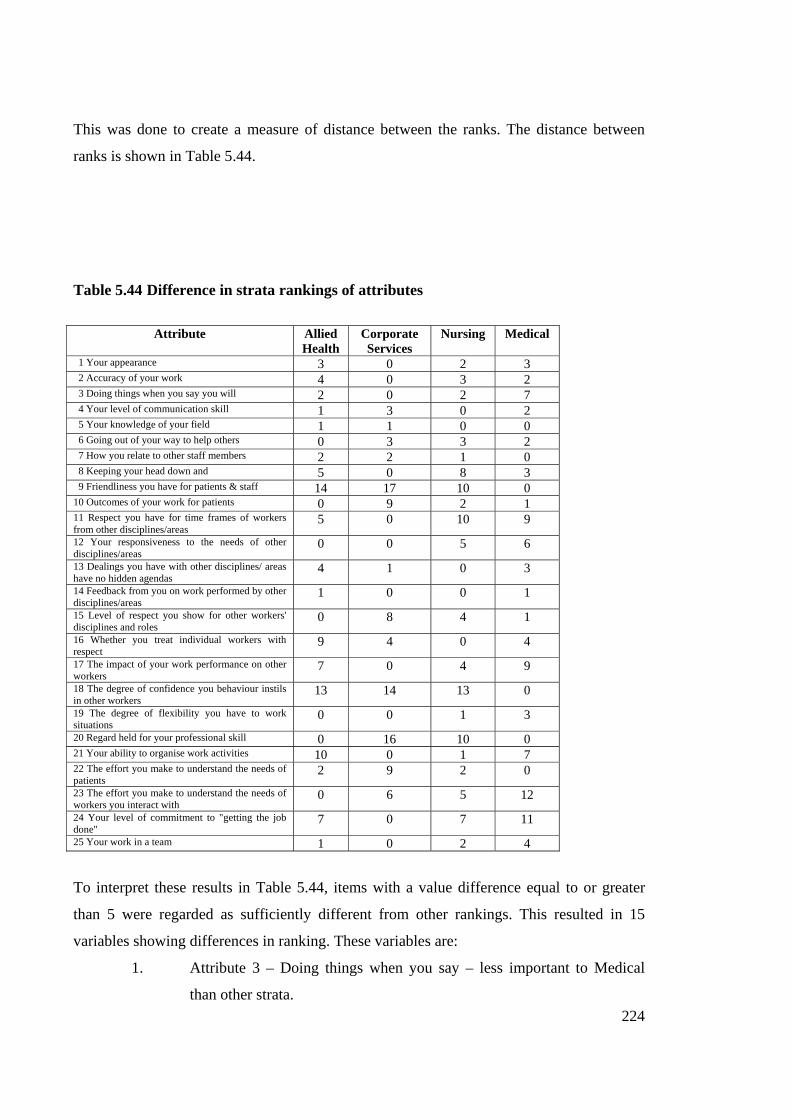
224
This was done to create a measure of distance between the ranks. The distance between
ranks is shown in Table 5.44.
Table 5.44 Difference in strata rankings of attributes
Attribute Allied Health
Corporate Services
Nursing Medical
1 Your appearance 3 0 2 3 2 Accuracy of your work 4 0 3 2 3 Doing things when you say you will 2 0 2 7 4 Your level of communication skill 1 3 0 2 5 Your knowledge of your field 1 1 0 0 6 Going out of your way to help others 0 3 3 2 7 How you relate to other staff members 2 2 1 0 8 Keeping your head down and 5 0 8 3 9 Friendliness you have for patients & staff 14 17 10 0 10 Outcomes of your work for patients 0 9 2 1 11 Respect you have for time frames of workers from other disciplines/areas
5 0 10 9
12 Your responsiveness to the needs of other disciplines/areas
0 0 5 6
13 Dealings you have with other disciplines/ areas have no hidden agendas
4 1 0 3
14 Feedback from you on work performed by other disciplines/areas
1 0 0 1
15 Level of respect you show for other workers' disciplines and roles
0 8 4 1
16 Whether you treat individual workers with respect
9 4 0 4
17 The impact of your work performance on other workers
7 0 4 9
18 The degree of confidence you behaviour instils in other workers
13 14 13 0
19 The degree of flexibility you have to work situations
0 0 1 3
20 Regard held for your professional skill 0 16 10 0 21 Your ability to organise work activities 10 0 1 7 22 The effort you make to understand the needs of patients
2 9 2 0
23 The effort you make to understand the needs of workers you interact with
0 6 5 12
24 Your level of commitment to "getting the job done"
7 0 7 11
25 Your work in a team 1 0 2 4
To interpret these results in Table 5.44, items with a value difference equal to or greater
than 5 were regarded as sufficiently different from other rankings. This resulted in 15
variables showing differences in ranking. These variables are:
1. Attribute 3 – Doing things when you say – less important to Medical
than other strata.

225
2. Attribute 8 – Keeping your head down and just doing your work – seen
as more important by Corporate Services and Medical compared to other
strata.
3. Attribute 9 – Friendliness you have for patients and staff – seen as much
more important by Medical staff compared to all other strata.
4. Attribute 10 – Outcomes of your work for patients – not as important to
Corporate Services.
5. Attribute 11 – Respect you have for timeframes of workers from other
disciplines/areas – seen as much more important to Corporate Services
than to other strata.
6. Attribute 12 – Responsiveness to needs of other disciplines – Both
Allied Health and Corporate Services see this as more important than
Nursing and Medical.
7. Attribute 15 – Level of respect you show for other workers’ disciplines
and roles – less important to Corporate Services.
8. Attribute 16 – Whether you treat individual workers with respect – less
important to Allied Health than to other strata.
9. Attribute 17 – The impact of your work performance on other workers –
less important to allied health and medical staff.
10. Attribute 18 – The degree of confidence your behaviour instils in other
workers – seen as much more important to Medical staff than other strata.
11. Attribute 20 – Regard held for your professional skill – seen as much
more important to Medical and Allied Health staffs than to Corporate
Services and Nursing staffs.
12. Attribute 21 – Your ability to organise work activities – more important
to Corporate Services and Nursing than to Allied Health and Medical
strata.
13. Attribute 22 – The effort you make to understand the needs of patients –
less important to Corporate Services.
14. Attribute 23 – The effort you make to understand the needs of workers
you interact with – More important to Allied Health than other strata.
15. Attribute 24 – Your level of commitment to “getting the job done” –
more important to Corporate Services.

226
Corporate Services show a different orientation to those of the other strata in this research.
This was indicated in Study 1 and has been supported by Study 2. While this was suggested
by comparison of highest-ranking service quality attributes in Table 5.41, it is further
evidenced in Table 5.44. Corporate Services vary by 5 or more ranking levels in 5 of the
attributes to those of the other strata. The Medical stratum also varies in importance
attribution of several variables compared to other strata.
These differences among strata illustrate variations in orientation and perceptions of roles
played in the care of patients and hospital operations. These findings are consistent with
those of Study 1. Comparison of these rankings reveals variation between strata that is not
readily identifiable from analysis of attributes in Section 5.4.1 and factor analysis that
reduces data to more generic dimensions. However, by using the top ten dimensions by
rank and comparing them to the attributes in factors identified by strata, it was found that
Reliability and Responsiveness ranked one and two in importance, followed then by the
empathy and assurance dimensions. Using the dimensions suggested by Brady and Cronin
(2001), interactive quality would be most important followed by outcome quality.
While this study has not tested specifically for a hierarchy in attributes used to evaluate
internal service quality, the pattern of ranking and the nature of the elements making up the
overall dimensions suggested above indicate that a multilevel nature of dimensions exists.
Further research in the composition of dimensions is needed to ascertain the hierarchy of
attributes that make up dimensions. It also cannot be assumed that attributes making up
dimensions are mutually exclusive and only appear within one broader dimension.
5.5 H4 Internal service groups find it difficult to evaluate the technical quality of services provided by other groups Study 1 identified apparent difficulty or reluctance in evaluating the technical quality of
services provided by other groups within the internal service chain. To evaluate this further
and to test the hypothesis that internal service groups find it difficult to evaluate technical
quality of services provided by other groups, a number of statements addressing this issue
provided data in Study 2. These statements developed from data in interviews in Study 1

227
and informed by the literature (e.g., Brady & Cronin, 2001; Parasuraman, Zeithaml & Berry,
1988) were presented on a seven point scale. These statements are as follows:
117 I have a clear understanding of other disciplines/units expectations of work when I deal with
them. 205 I fully understand what represents quality in my work performance. 206 I can easily measure quality in my work. 207 I can readily tell when work performed by others is not quality work. 208 My unit has procedures in place to evaluate the quality of service provided to us by other
areas. 209 Information is regularly collected about service quality expectations of disciplines/areas my
unit deals with. 211 I have formal means to evaluate quality of work performed by other disciplines/areas. 212 Quality standards are clearly defined for each division of the hospital. 213 Informal evaluations of work quality are a regular part of my work activity. 214 I find it difficult to evaluate the work quality of disciplines/areas other than my own.
Study 2 found that quality is seen as important to respondents in their work. There is a
strong feeling that they fully understand what represents quality in their own work
performance (205). It was generally felt that they could easily measure quality in their own
work (206) and that they had a clear understanding of the expectations of others relating to
their work (117). In terms of evaluating quality of the work of others, it was felt that they
had the ability to readily tell when the work of others was not quality work (207). On the
other hand, there were feelings that they did not have procedures in place to evaluate the
quality of service from others (208) and that it was difficult to evaluate work quality from
other areas (214). There were limited formal means to evaluate work quality from other
areas (211) and that there were doubts that quality standards were clearly defined for each
division of the hospital (212). Cross tabulation shows differences within groupings as
indicated by mean scores in Table 5.45.
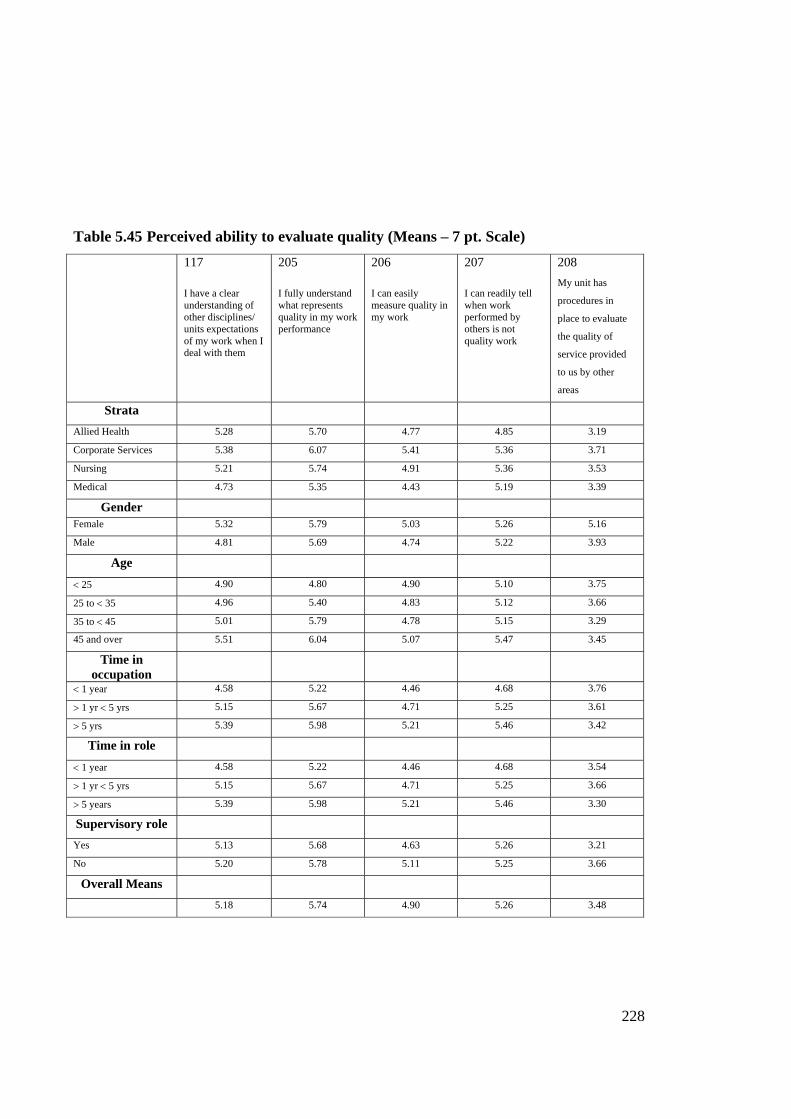
228
Table 5.45 Perceived ability to evaluate quality (Means – 7 pt. Scale)
117 I have a clear understanding of other disciplines/ units expectations of my work when I deal with them
205 I fully understand what represents quality in my work performance
206 I can easily measure quality in my work
207 I can readily tell when work performed by others is not quality work
208 My unit has
procedures in
place to evaluate
the quality of
service provided
to us by other
areas
Strata Allied Health 5.28 5.70 4.77 4.85 3.19
Corporate Services 5.38 6.07 5.41 5.36 3.71
Nursing 5.21 5.74 4.91 5.36 3.53
Medical 4.73 5.35 4.43 5.19 3.39
Gender
Female 5.32 5.79 5.03 5.26 5.16
Male 4.81 5.69 4.74 5.22 3.93
Age < 25 4.90 4.80 4.90 5.10 3.75
25 to < 35 4.96 5.40 4.83 5.12 3.66
35 to < 45 5.01 5.79 4.78 5.15 3.29
45 and over 5.51 6.04 5.07 5.47 3.45
Time in occupation
< 1 year 4.58 5.22 4.46 4.68 3.76
> 1 yr < 5 yrs 5.15 5.67 4.71 5.25 3.61
> 5 yrs 5.39 5.98 5.21 5.46 3.42
Time in role < 1 year 4.58 5.22 4.46 4.68 3.54
> 1 yr < 5 yrs 5.15 5.67 4.71 5.25 3.66
> 5 years 5.39 5.98 5.21 5.46 3.30
Supervisory role Yes 5.13 5.68 4.63 5.26 3.21
No 5.20 5.78 5.11 5.25 3.66
Overall Means 5.18 5.74 4.90 5.26 3.48

Table 5.45 (cont.)
209 Information is
regularly
collected about
service quality
expectations of
disciplines/ areas
my unit deals
with
210 My work
quality is
formally
assessed as
part of my
performance
appraisal
211 I have formal
means to
evaluate
quality of
work
performed
by other
disciplines/
areas
212 Quality
standards are
clearly
defined for
each division
of the hospital
213 Informal
evaluations of
work quality
are a regular
part of my
work activity
214 I find it difficult
to evaluate
work quality of
disciplines/
areas other than
my own
Strata Allied Health 3.66 4.76 2.12 3.68 4.95 4.47
Corporate Services 2.90 4.01 2.43 4.03 3.51 4.44
Nursing 3.50 5.58 3.01 4.32 5.01 4.64
Medical 3.97 3.70 2.71 3.83 4.25 4.58
Gender
Female 3.55 3.46 2.75 4.14 4.82 4.57
Male 3.23 3.30 2.65 3.93 4.10 4.41
Age < 25 4.11 5.50 2.67 4.50 5.20 4.50
25 to < 35 3.44 4.82 2.55 4.14 4.35 4.53
35 to < 45 3.50 4.70 2.84 4.13 4.67 4.34
45 and over 3.44 4.79 2.80 4.02 4.84 4.88
Time in occupation
< 1 year 3.62 4.84 2.80 4.76 4.83 4.41
> 1 yr < 5 yrs 3.50 4.86 2.59 3.93 4.21 4.59
> 5 yrs 3.47 4.78 2.75 4.09 4.74 4.59
Time in role < 1 year 3.26 4.86 2.77 4.24 4.75 4.43
> 1 yr < 5 yrs 3.51 4.89 2.74 4.33 4.58 4.34
> 5 years 3.49 4.70 2.73 3.91 4.72 4.81
Supervisory role
Yes 3.40 4.78 2.72 3.95 5.06 4.57
No 3.48 4.81 2.73 4.23 4.35 4.60
Overall Means
3.50 4.89 2.74 4.11 4.65 4.57
To evaluate the notion that there are differences amongst means, ANOVA procedures were
carried out. Examination of the data was carried out on the basis of strata, gender, age, time
in occupation, time in role, and whether a supervisory role was held. Table 5.46

230
summarizes the results of this analysis by showing variables for which significant
difference exists in means.
Table 5.46 Comparison of variables using ANOVA (α 0.05)
Variable
Stra
ta
Gen
der
Age
Tim
e in
O
ccup
atio
n
Tim
e in
Rol
e
Tim
e at
H
ospi
tal
Supe
rvis
ory
Rol
e
117 Clear understanding of others expectations of my work X X 205 Fully understand what represents quality in my work X X X 206 I can easily measure quality in my work X X X 207 Readily tell when work by others not quality work X 208 Have procedures to evaluate service quality from others 209 Regularly collect info re service quality expectations X 210 My work quality formally assessed in performance appraisal
X X
211 I have formal means to evaluate quality of work of others X 212 Quality standards are clearly defined for each area 213 Informal evaluations are regular part of work activity X X X 214 It is difficult to measure work quality of other areas X Significant difference in means for item
For strata, there is significant difference in means in being able to easily measure quality in
work (206), information regularly collected about service quality expectations (209), formal
assessment of work quality in performance appraisal (210), formal means to evaluate
quality of work of others (211) and informal evaluations being a regular part of work
activity (213). Significant difference in means between Medical and Corporate Services
exists with Corporate Services being less able to measure quality of work (206). There is
also significant difference between Corporate Services and all other strata regarding
collection of information about service quality expectations with Medical the highest,
followed by Nursing and Allied Health (209). Significant differences were also found for
Nursing compared to Corporate Services and Medical for formal assessment of work
quality in performance appraisals with Medical being higher (210). There are also
significant differences between Corporate Services and Allied Health and Nursing
regarding regular informal evaluations of work quality (213) where Nursing is the highest.
Gender shows significant difference in means for having clear expectations of work (117)
and informal evaluations being a regular part of work activity (213). In both cases, the level
of difference for females was higher than males.

231
Time in occupation does not have any significant differences in means except in terms of
fully understanding what represents quality (205). As might be expected this was a function
of experience with the less than one year in the occupation group being less sure of quality
issues. Time in the role shows a number of items with significant differences in means.
Items 117, 205, 206, and 208 also show that experience is a factor in being able to address
quality issues. For clear understanding of other discipline expectations (117) and fully
understanding what represented quality work performance (205), there is significant
difference between those with less than one year compared to more than five years. For
feelings that their work quality could be easily measured, there was significant difference in
means between those with over five years in the role compared to those less than five years
in the role, with those less than one year having the greatest difficulty. Being able to readily
tell when work performed by others is not quality work (207) showed significant difference
in means between those less than one year in the role and those with more than one year in
the role.
Ability to measure the quality of one’s work (206) was found to have significant difference
in means based on whether a supervisory role was held. Supervisors felt they had less
difficulty. Supervisors also felt that they had informal evaluations of work quality as a
regular part of their work activity (213).
These results suggest that while there appears to be understanding of quality issues, there is
some difficulty in effectively evaluating technical service quality provided by other groups.
This supports the hypothesis (H4) that internal service groups find it difficult to evaluate
the technical quality of service provided by other groups and confirms the findings of Study
1 relating to ability to evaluate the quality of areas outside one’s own discipline.
5.6 Conclusion

232
In Study 2, four key hypotheses were tested. Firstly, the notion that internal service quality
dimensions used to evaluate others differ from those others will use in evaluations was
examined. This was then followed by investigation of the role of service expectations in
each group and whether expectations differ amongst groups. The third hypothesis was
explored by evaluating rank importance of attributes used to evaluate internal healthcare
service quality and how they differ amongst groups. The fourth hypothesis considered the
ability of internal service groups to evaluate technical quality of service provided by other
groups. All hypotheses were supported in this study. In summary, the results of Study 2 are
as follows:
H1: Internal service quality dimensions individuals use to evaluate others
in an internal service chain will differ from those they perceive used by
others.
ANOVA and paired t-tests indicated a number of variables that had significant variation
in means between those dimensions used to evaluate others and those perceived used by
others in the evaluation of service quality. Evidence suggests that there are a number of
dimensions where significant difference exists. Those supporting the notion that
individuals perceive that others have different dimensions on which to evaluate service
quality varies from those used by them to evaluate others. While there is some overlap,
sufficient difference exists to support the hypothesis that internal service dimensions
individuals use to evaluate others will differ from those they perceive used by others to
evaluate service quality.
When factor analysis reduced and summarised dimensions, it was found that there was
more commonality. For the total sample, the dimensions of Responsiveness and
Reliability are common in both evaluations of others and perceived evaluations by
others. Two other factors, Tangibles and Equity are additional dimensions used to
evaluate others but not seen as used by others in evaluations. This suggests that four
factors are used in the evaluation of internal service quality.
The assurance factor identified in SERVQUAL is neglected in this study due to
significant cross-loading on several dimensions. Although evident in initial factor

233
analyses, the assurance dimension disappeared as cross loaded dimensions were deleted.
The tangibles factor also was not evident in early factor analyses as initial loadings
indicated a broader environment dimension more consistent with the Social factors and
ambience suggested by Brady and Cronin (2001). However, as cross-loaded dimensions
were deleted, factor analysis retained the physical dimensions consistent with the
tangibles factor of SERVQUAL. This confirms findings of prior research that the
tangibles dimension is generally retained in factor analysis (Mels, Boshoff & Nel,
1997).
Results of Study 2 support the hypothesis that there are differences in perceptions of
dimensions used to evaluate others from those perceived used in evaluations of service
quality by others.
H2: Service expectations of groups within internal service network groups will differ
Factor analysis of expectation items found two expectation factors. One deals with
expectations of reliability and the other of Social factors. These are consistent with
findings in Study 1. On one hand, there are expectations of outcomes associated with
the view of reliability being the ability to perform the service dependably and
accurately. The social factors represent social interaction between workers associated
dimensions such as friendliness, courtesy, respect and so forth suggested in Study 1.
This is also consistent with the findings of Brady and Cronin (2001).
ANOVA revealed that items examined in relation to expectations show significant
difference between groups. This suggests that there are differences in expectations of
internal service network groups. Comparison of expectations with dimensions that one
would use to evaluate service quality of others through paired t-test analysis shows that
for twelve pairs of statements there is significant difference for seven of the pairs.
Further comparison of expectations with those dimensions perceived used by others
reveals nine of twelve pairs of items with significant difference. This supports the
hypothesis that service expectations of internal service network groups will differ.
234
H3: Ratings will differ in importance of service quality dimensions amongst
internal service groups
Ranking of dimensions was approached using different methods. Each method
demonstrates differences in rankings. ANOVA confirmed the significance of variance
for each stratum and those for the total sample. It was found that rankings of
dimensions for clinical staff are more closely aligned than those for Corporate Services.
However, there are noticeable variations in rankings within the clinical strata as well
that supports the proposition that there are differences in importance ranking for service
quality dimensions. The scores indicate the difficulty in nominating the most important
attribute and the spread of items thought to be important. However, the aggregation of
dimensions overcomes this problem to some extent.
However, doing this negates the variation between strata and the nuances indicated by
these variations are lost. This may account to some degree for the difficulties
experienced in developing service quality measurement tools, as the approaches used do
not take into account the multilevel and multidimensional nature of service perceptions
indicated in Study 1 and these results. Using the attributes posited by Brady and Cronin
(2001) to classify dimensions in this study would indicate that attribute rankings fall
into the overall categories of Interaction Quality and Outcome Quality as the most
important areas of internal service quality.
Differences become less noticeable when dimensions are summarised through factor
analysis. The most important overall factors were reliability and responsiveness. It then
becomes more problematic to state that there are differences in rankings of service quality
dimensions between internal service network groups. The question is the salience or
valence of dimensions affected through data reduction. Therefore, in this there is partial
support for the hypothesis that service quality dimensions will differ in importance between
strata. However, overall there are significant differences that support the hypothesis that
there are differences in importance of dimensions amongst internal service groups.
H4: Internal service groups find it difficult to evaluate the technical quality
of services provided by other groups

235
While there was strong agreement of the importance of service quality and the apparent
ability to measure quality, it was found that there is some difficulty in evaluating work
quality outside one’s discipline. This has implications in the assessment of internal
healthcare service quality as key dimensions include accuracy, knowledge, and patient
outcomes. How this is to be measured becomes problematic if groups are unable to
determine what constitutes accuracy, knowledge in the discipline, and how patient
outcomes are affected by the interventions of other groups. These findings support the
hypothesis that internal service groups find it difficult to evaluate technical quality of
services provided by other groups.

236
6.0 Internal Healthcare Service Evaluation: Conclusions and Discussion 6.1 Introduction Despite the extensive service quality literature, there is continued debate as to what the
appropriate dimensions and methodology to measure service quality are. This is particularly
true for internal service quality that is concerned with the quality of service within an
internal service chain compared to the external orientation of service encounter evaluations
with external customers. This research investigated three research questions:
RQ1 What are the dimensions used to evaluate service quality in internal healthcare
service networks?
RQ2 How do dimensions used in service quality evaluations in internal healthcare
service networks differ from those used in external quality evaluations?
RQ3 How do different groups within internal service networks in the healthcare
sector evaluate service quality?
External service quality evaluations are often viewed from the perspective of the external
customer looking at the organization whereas internal service quality examines interactions
within the organization. The approach of using direct transferability of external service
quality dimensions to measure internal quality of service assumes that employees in an
organizational environment act the same and have the same perceptions about internal
service quality as consumers do for external service quality evaluations. Yet it is recognized
that there are differences between consumer marketing and business-to-business marketing.
Lack of information on the transferability of external service quality dimensions to the
internal environment, the importance of specific dimensions to different internal groups
when evaluating service quality, service expectations of internal service network groups,
the evaluation of technical quality of services provided, and perceptions of dimensions used
to evaluate others compared to those used by others in evaluations of service quality was
established by reference to the extant literature and this researcher determined that all
required further investigation. A review of the literature led to six propositions to
investigate these issues in an internal healthcare service chain:

237
P1: Internal service quality dimensions will differ to external service quality
dimensions in the healthcare setting.
P2: Service expectations of internal service network groups will differ between
groups within an internal healthcare service chain.
P3: Internal service quality dimensions individuals use to evaluate others will
differ from those perceived used in evaluations by others in an internal
healthcare service chain.
P4: Ratings of service quality dimensions will differ in importance amongst
internal healthcare service groups.
P5: Internal healthcare service groups find it difficult to evaluate the technical
quality of services provided by other groups.
P6: Relationship strength impacts on evaluations of internal service quality.
This research was undertaken in two studies conducted in a major metropolitan hospital.
The health sector was chosen because of its size and the impact of the sector on the
economy and society. The complexity of the internal service chain in hospitals readily
provides a variety of internal departments and disciplines with jobs involved in service
encounters. The first, Study 1, was a qualitative study comprising depth interviews that
provided richness in data used to identify dimensions perceived as being used to evaluate
service quality in an internal service value chain. These dimensions were compared to those
used in evaluations of external service quality and found to be relatively consistent in terms
of labels. However, inconsistencies in perceptions of the nature of internal service quality
and the application of these dimensions led to Study 2. Internal service expectations and the
influence of relationships were also examined. The results of Study 1 are reported in
Chapter 4. An outcome of Study 1 was the development of four hypotheses that were tested
in Study 2.
H1: Internal service quality dimensions individuals use to evaluate others in an internal service chain will differ from those they perceive used in evaluations by others.
H2: Service expectations of groups within internal service networks will differ.
238
H3: Ratings will differ in importance of service quality dimensions amongst internal service groups.
H4: Internal service groups find it difficult to evaluate the technical quality of
service groups.
The second study, Study 2, was based on a quantitatively focused survey. Study 1 and the
literature on studies into service quality informed the questionnaire used in Study 2. Study
2 tested four hypotheses about the nature of dimensions used in evaluating internal
healthcare service quality and those dimensions used in service quality evaluations
identified in the literature. Internal service quality dimension importance ranking was also
investigated, as were service expectations of internal service networks and the ability to
evaluate technical quality of services provided by other groups. The results of Study 2 are
reported in Chapter 5. Findings show that all four hypotheses were supported.
The following sections discuss the contributions of this research, namely
• Identification of internal service quality dimensions and their nature.
• The role of equity in internal service quality evaluations.
• Differentiation of perceptions of dimensions used to evaluate others from those used in evaluations by others.
• Identification of the triadic nature of internal services.
• Evaluation of technical quality of internal services.
• Differences in service expectation between groups within the internal service chain.
The implications of this research for management, issues to be considered for further
research, and .the limitations of this research are also discussed.
6.2 Evaluation of Internal Service Quality
It has been generally assumed in the literature that external service quality dimensions are
transferable to internal service chains. However, this has not been empirically established
and so has led to RQ1: What are the dimensions used to evaluate service quality in internal
healthcare service networks? The answer to this question is fundamental to understanding
what to measure in evaluations of internal healthcare service quality.
239
Through understanding what dimensions are used in internal healthcare service quality
evaluation, it is then possible to compare these to external dimensions of service quality to
examine the proposition that the dimensions are different.
P1: Internal service quality dimensions will differ to external service quality dimensions in the healthcare setting.
This in turn leads to the question as to how these dimensions differ:
RQ2 How do dimensions used in service quality evaluations in internal healthcare service networks differ from those used in external quality evaluations?
Study 1 identified issues around the complexity of articulating service quality that may
influence the nature of dimensions used to evaluate internal healthcare service quality.
Twelve dimensions were identified in Study 1 and further examined in Study 2. It was
found that while similarities exist in many of the labels attached to dimensions used in
service quality evaluation, the way these dimensions are perceived indicates differences
that are lost through data reduction and application in an internal service chain.
6.2.1 Ability to articulate service quality
While staff members at the hospital in which this research was conducted were adamant
about the importance of service quality, they generally had difficulty in articulating a clear
definition of service quality. The “mantra” of service quality had been learned, but there
was an obvious gap between the rhetoric and conceptualization of quality. Intuitively, one
would expect people working in a hospital to agree that quality was important and to have
some notion of how to determine what quality is. Yet, if the players in the service
performance do not know what represents quality, it becomes problematic to develop
measurement tools, as it is unclear in the minds of the participants what should be measured.
The intangibility characteristic of service contributed to this difficulty in articulating
service quality (Bitner, 1992; Gronroos, 1980; Shostack, 1977; Zeithaml, 1981).
Interviewees struggled to identify dimensions that might be used and often fell back to
tangible cues to describe the quality process and outcomes. Quality was defined in terms of
processes or user satisfaction. This is consistent with management and medical approaches
to evaluating quality in healthcare: for example, benchmarks for clinical care; clinical

240
pathways, and patient outcomes (Donabedian, 1980; Stiles & Mick, 1994). This in turn
created problems in identifying generic dimensions that might be used to evaluate internal
service quality that may focus more on factors affecting service delivery and expectation
affecting satisfaction.
With a wide range of professional disciplines attempting to articulate service quality in this
hospital environment, complaints, or the lack thereof, were proxy measures of service
quality. This was consistent across disciplines. Complaints are a mechanism that
demonstrate failure in specific attributes and as such do not represent a separate dimension
of service quality. They are symptomatic of failure in other attributes, as complaints usually
have an object to which the complaint is attached. Another reason that complaints may be
seen as a measure of service quality is because complaints are measurable and so add
tangibility to service interactions.
6.2.2 Dimensions used to evaluate internal service quality
Based on an initial list of 33 attributes identified in Study 1 that might be used to evaluate
service quality in internal service networks or value chains, twelve core dimensions were
distilled through grouping of dimensions into core attributes. These are tangibles,
responsiveness, courtesy, reliability, communication, competence, understanding the
customer, patient outcomes, caring, collaboration, access, and equity. The naming of
dimensions largely followed those identified in prior research to allow consistency and
comparison.
In comparing these dimensions to prior studies addressing internal service quality
dimensions, it was found that there is some difficulty in gaining consensus about the labels
used by researchers. This is illustrated in Table 6.1 that compares results from Study 1 to
three studies addressing internal service quality dimensions. However, through comparison
of definitions and interpretation of the terms, it is possible to match a number of the
dimensions. Many of the terms used by previous researchers were replicated in the initial
list of 33 attributes of this research but “lost” in the process of consolidating the list of
terms to twelve. The following examples illustrate this comparative process. The term
competence (as used in this study) encompasses the notions of professionalism and

241
preparedness as identified by Reynoso and Moores (1995). Collaboration and access (this
study) might include teamwork and organization support respectively from Matthews and
Clark (1997). Responsiveness (this study) might include the issues related to helpfulness
(Reynoso & Moores, 1995) and service orientation (Matthews and Clark, 1997).
Table 6.1 Comparison of this study to other internal service quality investigations
This Study Reynoso & Moores (1995)
Matthews & Clark (1997) Brooks, Lings & Botschen (1999)
Tangibles Responsiveness Courtesy Reliability Communication Competence Understanding the customer Patient outcomes Caring Collaboration Access Equity
Tangibles Reliability Promptness Flexibility Confidentiality Professionalism Helpfulness Communication Consideration Preparedness
Service orientation Open communication Flexibility Performance improvement Team-work Leadership Intra-group behaviour Change management Objective setting Competence Organization support Personal relationships
Reliability Responsiveness Credibility Competence Courtesy Communication Understanding the customer Access Attention to detail Leadership
Other studies investigating internal service quality borrow the commonly employed
SERVQUAL instrument external service quality dimensions (reliability, responsiveness,
assurance, tangibles, empathy) to apply to internal service environments (e.g. Chaston,
1994; Edvardsson, Larsson & Setterind, 1997; Frost & Kumar, 2000; Kang, James &
Alexandris, 2002; Young & Varble, 1997). This is consistent with the view of Parasuraman,
Zeithaml and Berry (1985, 1988) that suggests that overall service quality dimensions can
easily be adapted to serve all service situations. Chaston (1994) added proactive decision
making to the SERVQUAL dimensions, while Kang, James and Alexandris (2002) assert
that SERVQUAL dimensions, with modification to the underlying statements, are useful in
the measurement of internal service quality. The dimensions identified in Study 1 also
indicate some similarity to those identified in SERVQUAL.
However, a semantic comparison of dimensions gives an allusion of the practicality of the
transferability of external dimensions to internal evaluations of service quality. While the
attributes may be similar, there are differences that need to be considered in the
development of any instrument to measure internal service quality. The levels of meaning
attached to attributes and how these attributes are used is lost in the semantics of service

242
quality. Multi-level and multidimensionality of internal service quality dimensions was
suggested in Study 1, supporting the findings of Brady and Cronin (2001) and Kang and
James (2004).
Study 2 evaluated the twelve dimensions identified in Study 1 further, and factor analysis
effectively reduced these dimensions to four: responsiveness, reliability, tangibles and
equity. These four dimensions may describe overall factors that determine internal service
quality, but they do not capture the multi-levels and nuances of multi-dimensions within
these factors indicated in Study 1. Factor analysis reveals significant cross-loading on a
number of dimensions that indicate that attributes being evaluated in internal service
evaluations are not unidimensional and should be evaluated hierarchically. Two of these
dimensions were identified as being used by others to evaluate respondents, responsiveness
and reliability. These results indicate problems in applying the SERVQUAL model directly
to internal service environments. This may be due to SERVQUAL focusing on the service
delivery process and not addressing service encounter outcomes (Gronroos, 2001; Mangold
& Babakus, 1991).
In considering the hierarchical conceptualization of internal service quality, the approach of
Brady and Cronin (2001) is generally supported by this research. They propose three
overall factors of Interaction Quality, Physical Environment Quality, and Outcome Quality
as dimensions of service quality with sub-dimension items of reliability, responsiveness,
and empathy. The 12 dimensions of Study 1 could be allocated to these higher dimensions
to indicate a broader notion of what constitutes internal service quality. These dimensions
are discussed in the following sub-sections of section 6.2.
The results of Studies 1 and 2 support the transferability of the concept that service quality
is multi-level and multi dimensional to internal service quality perceptions. The following
sections discuss individual attributes identified in Study 1 and examined further in Study 2.
6.2.2.1 Tangibles

243
The tangibles dimension has been reported in studies evaluating the SERVQUAL
dimensions. Typically, this dimension addresses the physical environment in which the
service takes place. The term servicescape has been used to describe this dimension (e.g.
Bitner, 1992). Within an internal service context involving hospital internal service chains,
the physical dimensions of the tangible dimension do not seem important unless they affect
the ability to provide care to the patient. For example, Study 1 revealed an attitude that it
was a given that the physical environment would be safe for patients: that is equipment
would be appropriate, hygiene factors taken care of, patient facilities are adequate etc.
However, if these factors were deficient then the physical aspects became significant in
evaluations of service quality. Generally, the appearance of staff was not rated highly in
importance ratings compared to other attributes. The physical environment was addressed
in terms of patient safety and ability to provide an appropriate environment in which to care
for patients. As a dimension to evaluate internal service quality, tangibles were not seen as
very relevant. However, it was identified as a factor in Study 2. This was not consistent
with Study 1 and could be attributed to previous findings that the tangibles factor is one of
the SERVQUAL dimensions retained in factor analysis (Mels, Boshoff and Nel, 1997).
On the other hand, by broadening the tangibles dimension to include processes, tangibles
became more significant, as in Study 1, processes were seen to impact on ability to perform
work and subsequently on patient outcomes. That is, in the absence of other tangible
measures, processes become physical evidence of the service (Zeithaml, Bitner & Gremler,
2006). Respondents in Study 1 discussed the impact of processes on their ability to perform
their work, as well as the impact on patients (e.g. time taken to process patients on
admission or the day clinic, the record keeping processes, clinical pathways directed by
each discipline under overall control of medical staff). Evaluations of processes allow
examination of efficiency versus effectiveness in delivery of healthcare. Both of these
address the technical aspect of “what” service is provided through the process and the
functional aspect of “how” the process functions (Gronroos, 1990a).
From the perspective of internal service value chains, tangibles also include the holistic
environment that comprises the perceived servicescape (Bitner, 1992). The atmosphere of
the workplace or ambient conditions generated by inter-personal relationships was seen as

244
significant in the interviews and confirmed through factor analysis. Factor analysis of the
set of dimensions used to evaluate service quality in Study 2 identified an Environment
dimension that was used to evaluate others. This dimension became the more traditional
tangibles factor when cross-loaded items were deleted. The broader notion of environment
was evident in Study 1, as this environment not only encompasses the tangible dimensions
of the servicescape, but the atmospherics in which the internal service quality chain
operates. The ambient conditions and social factors identified as part of this environment
dimension are consistent with the findings of Brady and Cronin (2001) and are indicative of
expectations in the social factors factor identified in Study 2. This takes the tangible
dimension beyond that conceptualized in SERVQUAL and better captures the notions of
elements that are used to evaluate internal service quality.
Other factors identified in this research as contributing to the environment dimension
include the friendliness and personality of other workers as well as relationships between
service providers. Collaboration and communication, while seen as separate dimensions,
also contributed to the overall environment in which workers interacted. Environmental
issues such as the provision of “cheap bikkies” or the absence of snacks for operating teams
were a tangible aspect of this environment and were seen as detrimental to the work
environment and worker morale.
It is generally accepted in the literature that intangibility of the service creates difficulty in
evaluating service quality (Gronroos, 2001; Teas and Agarwal, 2000; Zeithaml, Bitner &
Gremler, 2006). Therefore, in evaluations of service quality, customers tend to look for
ways to tangibilise services in order to give meaning to their experiences. Because
medicine has traditionally focussed on outcome measures to evaluate effectiveness, it has
the impact of creating tangible dimensions in the minds of evaluators. Patient outcomes are
a tangible result of a number of intangible interventions by healthcare practitioners in the
internal service value chain. Medical services are credence services where the outcome is
difficult to measure even after experience (Zeithaml, 1981). This aspect of the product adds
to the difficulty in measuring service quality in a health environment.
Bebko (2000) reported the characteristic of tangibility as a key factor affecting consumer
quality expectations and that process and outcome tangibles are an important source of

245
tangibility to the customer and producer. This research supports these findings as results
indicate the use of tangible cues to give meaning to service and to articulate internal service
quality in clinical terms (e.g. response, treatment of patient, being on time for meetings;
accurate completion of paperwork; patient outcomes; ‘bedside manner”). Although
discussed as a separate dimension, Equity might also be seen as an outcome measure as its
impact usually has a “tangible” result for the person affected by the actions of others.
These findings support the Physical Environment Quality dimension identified by Brady
and Cronin (2001) that includes ambient conditions, design, and social factors as elements
of the environment as well as more traditional physical aspects.
6.2.2.2 Responsiveness
Responsiveness is defined as willingness to help customers and provide prompt service.
Attributes expressing this dimension included timeliness or promptness, willingness to go
out of one’s way to help, commitment to getting the job done and one’s overall work ethic.
Reynoso and Moores (1995) also found the ability to provide prompt service as an internal
service quality dimension in a hospital context.
Timeliness was identified in Study 1 as a significant attribute of service quality by all strata.
For clinical staff, time was critical in the treatment of patients and this may have heightened
perceptions of the importance of time as a measure of quality. However, non-clinical staff
also stated the importance of time as a measure of quality relating to processes they were
involved with. While timeliness was included in the responsiveness dimension in the
consolidation of attributes shown in Table 6.3, it was still tested in Study 2 as an attribute.
Study 2 found that, in ratings of the importance of service quality attributes, timeliness
ranked in the top six attributes for Allied Health, Corporate Services and Nursing strata.
Being time based, timeliness is a tangible and measurable dimension in the minds of
evaluators. While specific time standards may not be in place, people have perceptions of
appropriate durations for actions to take place (Hui & Tse, 1996; Taylor, 1995). The sense
of timeliness may be heightened when one member of the internal service chain cannot
carry out some aspect of their work until another member of the chain has performed some

246
task. Intensity may also be exasperated given the time constraints of intervention in acute
illness.
Timeliness within the overall responsiveness dimension takes on two levels within the
internal service chain of the hospital. First, there are the interactions between members of
the internal service value chain who have expectations relating to timeliness of interactions
with members of other areas of the chain. Medical staff have expectations with respect to
fast and accurate medical test results to allow them to proceed with interventions on
patients, nursing and allied health staff expect patients to be treated in a timely manner, and
corporate services staff expect that records are updated quickly and accurately. Thus
timeliness impacts on the quality of interactions and outcomes in the internal service
quality chain.
Secondly, the timeliness of interventions on patients was also seen as a critical measure of
internal service quality. There are measures in place to evaluate how long it takes for a
patient to be seen in the day clinic compared to expectations by members of the service
chain as to appropriate response times for patient interventions. This raises issues of single
service interactions being seen as outcomes for different levels of customers at the same
time. A question for further research may be the salience of this attribute to internal service
value chain members in terms of timeliness of interactions affecting them versus those they
see as impacting on the patient and how these impact on evaluations of internal service
quality.
Also included in the responsiveness dimension are perceptions of commitment to getting
things done and overall work ethic. This aspect is linked to the equity dimension discussed
later as it impacts on the ability to do one’s job or perhaps whether one is left to pick-up
any short-fall from other members of the internal service value chain. Commitment has
been recognized as an essential ingredient for successful long-term relationships in prior
research (Dwyer, Schurr, & Oh, 1987; Garbarino & Johnson, 1999; Morgan & Hunt, 1994)
albeit from a consumer’s perspective. The employee commitment literature suggests
several aspects such as personal identification with the organization, psychological
attachment, concern for the future of the organization, and loyalty (e.g. Meyer, Allen, &
Smith, 1993). It would appear from this research that commitment from an employee
247
perspective is also seen as contributing to the effectiveness of teamwork or as identified in
this research, collaboration. Could other workers be depended on when needed? This
appears to be an issue in human service areas such as healthcare as the human body does
not malfunction at convenient times. Not only would workers with less commitment be
letting down other workers, they could have an impact on patient care and service outcomes.
These social factors contribute to perceptions of internal service quality both in terms of the
environment and the outcomes of service encounters. They also are relevant perceptions of
interactions between workers in service delivery.
The various levels and dimensions associated with the responsiveness factor support the
view of the existence of responsiveness elements across factors that are used to evaluate
internal service quality. This means that evaluations of internal service quality need to
operationalise the concept of responsiveness in any evaluation instruments.
6.2.2.3 Courtesy
The dimensions of courtesy and competence under a SERVQUAL regime would be
consolidated under the assurance dimension, reflecting knowledge and courtesy and ability
to convey trust and confidence. Indeed, initial factor analysis in Study 2 resulted in the
identification of the assurance dimension inclusive of these two dimensions. However, it
was apparent in the healthcare environment that courtesy, which includes attributes of
attitude, respect and interpersonal skills, was an important dimension to internal service
chain members.
Both studies show people expected to be treated with respect and they expected patients to
be treated with respect as well. Evaluations of quality were influenced by how one was
treated as well as how the patient was treated. The courtesy dimension impacts on
interpersonal relationships and as such affects the ability of internal service groups to
effectively deliver quality service to external customers, in this case patients. Again there is
the question of salience as to which evaluation has the greatest impact on examinations of
internal service quality – the impact on workers or perceived impact on patients. There is
also the question of how emotions of internal service healthcare workers triggered by

248
interrelationships affect relationships with patients, evaluations of patient outcomes, and
evaluations of internal service quality.
This dimension influences social factors within the service environment and the quality of
interaction within the internal service chain and subsequently perceptions of overall
outcome quality.
6.2.2.4 Reliability
Reliability is the ability to perform the promised service dependably and accurately and
includes consistency of performance. Identified in Study 1 and confirmed through factor
analysis in Study 2, reliability was identified as the most important dimension in the
evaluation of internal service quality. This is consistent with results of prior research where
attributes were ranked (Kang, James & Alexandris, 2002; O’Connor, Trinh & Shewchuk,
2000; Zeithaml, Parasuraman & Berry, 1990). However, having determined that reliability
is significant, this dimension is not as clear-cut as indicated in the literature.
Studies 1 and 2 of this research show that in a hospital environment there is an expectation
that there is sufficient training and professionalism to allow dependable performance of
expected services. This was evident in Study 1 where staff had firm notions of what
constituted appropriate levels of performance within their own discipline but were reluctant
or unable to comment on the accuracy of work performed by those outside their own
discipline. This may have been due, in part to the professional nature of discipline areas
within a hospital where one does not presume to be an expert in another’s field or on the
professional performance of an individual as they were presumed to be competent in their
field as a prerequisite to working at the hospital. However, consistency of performance and
accuracy were significant factors in evaluating the performance of other workers in terms
of the quality of service provided and patient outcomes. What was interesting is that
notions of reliability also cross other attributes rather than being one distinct factor. In other
words, reliability was a modifier of another factor rather than the primary dimension.
In Study 2, reliability was shown to be a factor in perceptions of dimensions used to
evaluate others and in evaluations of service quality by others. Analysis of item ranking

249
across strata and for the sample as a whole confirmed the primary position of reliability as
an internal service quality dimension.
While this overall dimension of reliability was identified, the multi-levels identified in this
research that are sub-dimensions of this factor indicate that any instrument considered for
evaluations of internal service quality needs to consider these sub-dimensions and the
hierarchical nature of this dimension. That is, reliability is a factor that crosses a number of
dimensions. Therefore, reliability may be seen as a modifier of other dimensions rather than
being a direct determinant of internal service quality.
6.2.2.5 Competence
Competence covers a range of attributes such as professional skills, professional
development to upgrade skills, ability to organize, professionalism, knowledge, credibility,
and ability to recover from problems in service delivery. Competence is seen as possession
of the required skills and knowledge to perform the service (Zeithaml, Parasuraman &
Berry, 1990).
In an internal service value chain, especially in a healthcare environment, it appears that
attitude forms part of the competence equation. The degree of professionalism was seen as
important. How one conducted oneself and sought to improve through professional
development was perceived as critical to effective collaboration and patient interventions.
External customers seek an assurance that healthcare service providers do have appropriate
skills and knowledge to perform the service as survival may depend on these skills. This
orientation may mean competence salience differs in a healthcare setting compared to other
less personally intrusive consumer services. This research suggests that internal service
chain members see competence in terms of how the performance of others impacts on their
ability to provide service, or service recovery that they have to perform. Ultimately, from
the internal service chain perspective, the importance of competence is defined in terms of
the impact on patients and patient outcomes.
It would have been easy to consolidate the dimensions of courtesy and competence into the
overall assurance dimension of SERVQUAL without further investigation. However, the

250
qualitative importance of these aspects of assurance that emerged in the interviews of Study
1 means that they need to be considered independently in evaluations of internal service
quality. This is because of their potential to affect relationships and interaction between
service providers. Any measurement tool should take into account the impact of these two
dimensions in evaluating the assurance dimension in internal service value chains.
6.2.2.6 Access, Communication and Understanding the customer
The attributes of access, communication and understanding the customer would normally
be consolidated into the SERVQUAL dimension of Empathy. Initial factor analysis in
reducing the number of variables performed in Study 2 identified the empathy dimension as
important in both the evaluations of others and evaluations by others. However, due to
deletion of cross loading of items, the empathy dimension was eliminated. This indicates
that empathy may also be a modifier of dimensions rather than a direct determinant of
internal service quality.
Access
Access, which involves approachability and ease of contact (Zeithaml, Parasuraman &
Berry, 1990), is often problematic in a healthcare environment. Because of the nature of
patient interventions and demands of patients in an acute care medical facility, staff
members are not always available in the required timeframes or may be interrupted to take
on higher priority situations. This affects both approachability and ease of contact. People
may not be available to meet timeframes of other internal service providers due to the crisis
nature of many tasks.
As access involves approachability and ease of contact, it deals with perceived
approachability of other members of the internal service value chain and the nature of
relationships affecting interaction between service chain members. It was apparent from
Study 1 that workers had different coping strategies depending on the nature of interactions
and interrelationships. The length of the relationship seemed to have a bearing on
perceptions of access depending on the direction of the relationship. That is, positive
relationships contributed to the sense of approachability. The longer a team was intact and

251
the more often individuals from different strata work together the more comfortable they
generally are with each other. This was shown in Study 1 as the nature of relationships
dictating the degree of interaction during a shift was commented on by interviewees. These
relationships were seen to have some impact on evaluations of internal service quality.
Communication
Communication was mentioned by all strata in Study 1 as important in the evaluation of
service quality. Communication is seen as keeping customers informed in language they
can understand as well as listening to clients and their concerns (Zeithaml, Parasuraman &
Berry, 1990). Communication was one of the original dimensions identified by
Parasuraman, Zeithaml and Berry (1985) before consolidation of dimensions into the five
SERVQUAL dimensions (Parasuraman, Zeithaml & Berry, 1988). Prior studies have
focused on communication issues with the external customer. Communication in healthcare
exists on several levels with communication relating to patient care seen as paramount.
Communication within the internal service value chain not only includes verbal
communication, but written communication in the form of reports, notes on treatment,
instructions, and overall policy and procedures of the institution. To these layers of
communication within the internal service chain are interposed communications with
patients and family. This often results in a triadic communication network as opposed to
dyadic communication common in external service encounters.
The clarity and effectiveness of communication in the value chain is crucial to the well-
being of the patient. This in turn impacts on the measurable outcomes of the service and
accounts for the emphasis on its perceived importance in the internal service chain. As
much of this communication within and between network groups involves information
transfer necessary for patient intervention or effective performance of duties it may mean
that communication per se is too broad a category. Information should be evaluated as a
separate category in internal service situations especially in an information dependent
environment such as a hospital.
While communication is an important attribute making up part of the SERVQUAL
empathy dimension, it is also a vital component of the services marketing triangle
(Gronroos, 2001; Kotler, 2000) dealing with internal marketing, external marketing, and

252
interactive marketing. The making and keeping of promises is seen as vital to effective
service provision (Bitner, 1994). In an internal service value chain, communication skills
are thus linked with competence. The “promise” of professionalism, ability to carry out
one’s duties, and collaboration are linked to ability to communicate. Knowledge may be
important in a healthcare situation but without information transfer and effective
communication it may be virtually useless. The ease with which communication is slotted
into the empathy dimension may lead to the significance of this attribute being overlooked
in evaluations of internal service quality.
Study 2 confirms the rating importance of communication by clinical strata as one of their
top four attributes for evaluating service quality. Only Corporate Services rated
communication fifth. As with prior studies, factor analysis in this research has led to the
inclusion of communication in the empathy dimension. Tools to evaluate internal service
quality may need to ensure inclusion of communication and information transfer as
attributes to give a more complete measure of internal service quality. The salience of
communications within the internal healthcare service network and between members of
the network and patients needs further examination.
Understanding the Customer
Understanding the customer involves making an effort to know customers and their needs.
In most situations, this involves a dyadic interaction between service provider and recipient
and often focuses on the service receiver’s perception of the service offered (Dabholkar,
Thorpe & Rentz, 1996; Lovelock, 1983; Parasuraman, Zeithaml & Berry, 1988). This is
more complicated in an internal service value chain as an internal healthcare service
network features a number of relationships between workers and patients. The question that
first needs to be addressed is “who is the customer?”
In healthcare, at least two levels of customers exist: one is other workers in the internal
service network, and the other, the patient. Patients impact on relationships and service
interactions amongst internal service networks in the hospital, as found in Study 1 and
suggested in previous studies (e.g. Bitner, 1995; Gremler & Gwinner, 2000; Heskett, Jones,
Loveman, Sasser & Schlesinger, 1994). Therefore, instead of the traditional view of service
exchange through dyads, another dimension is added to create a triad of service

253
relationships that impact on evaluations of internal service providers in internal healthcare
service value chains. While internal marketing processes have the objective of identifying
and satisfying employees’ needs as individual service providers (Varey, 1995a, b) which in
turn enables the organization to deliver high value service leading to customer satisfaction
(Heskett, Sasser & Schlesinger, 1997), operationalising these in a service triad becomes
problematic. As Farner, Luthans and Sommer (2001) observe, while external customer
service has proven measures it appears that the internal customer concept is much more
difficult to define, operationalise, measure, and analyse. As a dimension for evaluating
internal service quality, multiple aspects of this attribute would need to be considered in the
formulation of any future measurement tool. This is another indication of the multi-level,
multi-dimensional and multi-directional nature of internal service quality.
While services have been described as an interactive process described as theatre, an act or
performance (Grove & Fisk, 1983; Solomon, Surprenant, Czepiel & Gutman, 1985) and
recognized as multi-dimensional (e.g. Parasuraman, Zeithaml & Berry, 1988) the outcome
of existing service quality models is usually based on one perspective of the service
encounter rather than taking into account multi-directional evaluations. This means that the
emphasis is on issues that may influence service quality in a dyadic service experience
usually from the perspective of the receiver rather than addressing triadic evaluations. This
triadic perspective is suggested by the nature of interactions and roles suggested by Grove
and Fisk (1983), relationship development and performance (Czepiel, 1990; Wilkinson &
Young, 1999), and bi-directional process of service encounters (Czepiel, 1990; Heskett,
Jones, Loveman, Sasser & Schlesinger, 1994).
Figure 6.1 illustrates network relationships and patient outcomes in hospital internal service
value chains. The interactions between members of the internal service network impact on
the quality of medical care and patient outcomes. The irony of healthcare is that there might
be the highest-level internal service quality; the technical and functional dimensions of
healthcare may be world’s best, yet the patient still does not survive. In general, the
workers concerned would not see this as a service failure. On the other hand, if the patient
survives contrary to expectations, do internal service chain members in healthcare have
greater satisfaction because expectations have been exceeded? Unlike other services, due to
the potential severity of outcomes, outcome measures in healthcare may have a different

254
impact on overall assessments of internal service quality. These relationships and the nature
of these service triads require further investigation.
Figure 6.1 Network relationships in hospital internal service value chains and patient outcomes
6.2.2.7 Equity
Equity involves the sense of equity in relationships with other workers, whether their
actions impact on one’s ability to perform one’s duties, whether there are hidden agendas in
actions and generally the sense of fairness in how the actions of others impact on the
individual concerned. This includes perceptions that others were doing their fair share of
the work; that there may be a difference in how one work discipline treats another with
Nursing
Allied Health
Medical
Non-Clinical
Patient Outcomes
Relationships between internal service networks.
Relationships between internal service providers and patients that provide patient outcomes.
255
respect compared to how others are treated by them; or how, compared to other workers,
one was spoken to.
Of the dimensions identified in Study 1 shown in Table 6.1, equity does not appear to have
been identified as a specific internal service quality dimension in previous research
although it is one of the social dimensions of service quality. Equity was also identified as a
factor used in the evaluations of internal service quality provided by others through factor
analysis in Study 2.
In previous service quality research, equity has been described as an antecedent to
satisfaction and subsequent loyalty for customers in external service quality evaluations
(Bolton & Lemon, 1999; Oliver & Swan, 1989a; 1989b). Equity does not appear on lists of
attributes describing factors in service quality evaluation. Equity or fairness is typically
seen as a factor in satisfaction within service recovery processes (Andreassen, 2000;
Hoffman & Kelley, 2000; McColl-Kennedy & Sparks, 2003). However, given that equity
in an exchange exists to the degree that one person’s input-to-output ratio is approximating
the other person’s input-to-output ratio (Oliver, 1997; Walster, Walster, & Berscheid, 1978),
then it is reasonable that equity would form part of the evaluation process in internal
service value chains. If service quality is composed of the service outcome (what is
received during the exchange) and process of service delivery (how the outcome is
transferred), then the meanings given to the interactions taking place during the transaction
influence evaluations of internal service quality. When a worker has multiple interactions
with other workers from other disciplines/departments within the organization, impressions
of these interactions are combined to influence perceived service quality of the individual
or their work unit, as shown in Figure 6.2 (Oliver, 1997; Parasuraman, Zeithaml, & Berry;
1994). The perceived equity or fairness of these interactions then becomes a factor in these
evaluations. This is consistent with the organizational behaviour literature that suggests
individuals within an organization evaluate their relationships with others on the basis of
equity theory (Miles, Hatfield, & Huseman, 1994).
Figure 6.2 Conceptualisation of exchange and internal service quality evaluation

256
Based on Oliver (1997) and Parasuraman, Zeithaml & Berry (1994)
Study 1 shows that perceptions of internal service quality are influenced by how other
workers impact on one’s ability to perform one’s duties; whether one has to “fix things” as
a result of what others have done; whether they have “hidden agendas;” how flexible they
are; that they will do more than just what is in their “job description;” or whether they can
be relied on to put in extra effort when needed. The sense of fairness or equity associated
with what one does compared to what inputs-to-outcomes are achieved from others appears
to be a real issue to healthcare workers and their associations with other workers within the
internal service value chain. The sense of equity impacts on perceptions of the overall
environment dimension. Equity then is a driver of internal service quality rather than a
consequence of satisfaction. This relationship of equity to perceived exchange satisfaction
and overall satisfaction is illustrated in figure 6.3.
Figure 6.3 Perceived Equity of exchange and internal service quality evaluation
One of the reasons that the equity dimension may not have been identified as a specific
service quality dimension in previous research is that the dominant approach to identifying
Process
Outcome
Exchange Satisfaction
Perceived Service Quality
Overall Satisfaction with individual /unit
Process
Outcome
Exchange Satisfaction
Perceived Service Quality
Overall Satisfaction with individual /unit
Equity
Equity
257
service quality dimensions has been implicit deduction from evaluations of performance of
individuals or units (Carman, 2000), rather than the explicit approach of this research that
asked for responses to identify service quality attributes. Also, interest in internal service
quality is a relatively recent development and much of that research has concentrated on
dimensions such as suggested by the SERVQUAL tool. Another aspect of this may be the
process orientation of many of the approaches to evaluations of service quality (Brady &
Cronin, 2001).
This present study has established that equity is a factor in evaluations of internal service
quality. However, whether it is seen as an overall factor in keeping with the traditions of the
SERVQUAL approach, or a modifier on a number of sub-dimensions of other factors needs
further research. This author’s findings are consistent with the organizational behaviour
literature investigating employee attitudes and behaviour toward other employees (Miles,
Hatfield & Huseman, 1994). It may be that an equity item needs to be added to the
reliability, responsiveness and empathy modifiers suggested in the hierarchical approach of
Brady and Cronin (2001).
6.2.2.8 Patient Outcomes
The patient outcome dimension identifies the role of other workers on patient outcomes as a
factor in evaluating internal service quality. Patient outcomes have been identified in prior
research (e.g., Bowers, Swan, & Koehler, 1994; Jun, Peterson, & Zsidisin, 1998) in the
context of patient satisfaction, but not as an internal service quality dimension. This poses
an interesting orientation to notions of service quality. One assumes that all members of an
organization are following the marketing concept where the customer is the focus of
organization’s activities. As paraphrase Albrecht (1990), if you’re not serving the customer,
your job is to serve somebody who is. Delivery of quality internal service has been
conceptualized as critical to employee satisfaction since improvements to internal service
quality are expected to produce improved external service quality (Heskett, Jones,
Loveman, Sasser & Schlesinger, 1994; Heskett, Sasser & Schlesinger, 1997).
The patient outcomes dimension also highlights the triadic nature of service quality
evaluation. Evaluations of external service quality and by extension internal service quality

258
have been examined in encounters as a dyadic or unidirectional phenomenon (e.g.;
Dabholkar, Thorpe & Rentz., 1996; Gronroos, 1984; Parasuraman, Zeithaml & Berry,
1988). However, perceptions of internal service quality delivery are impacted by an
external measure of patient outcomes. This is illustrated in Figure 6.4.
Figure 6.4 Worker relationships to patient outcomes
Worker-Patient interaction Worker-Patient interaction
Worker interaction
6.2.2.9 Collaboration
Collaboration encompasses the notion of teamwork and working together for patient
outcomes. Berry, Zeithaml and Parasuraman (1990) and Zeithaml, Parasuraman and Berry
(1990) identify teamwork as a principal factor in delivering excellent service and this is
confirmed in Study 2. Collaboration was also identified by Jun, Petersen and Zsidisin
(1998) as a service quality dimension in healthcare. Collaboration suggests “interaction”
where group life consists of joint activity and where people fit their lives together by using
shared sets of understandings as they interpret and reinterpret a situation as events unfold
(Swan & Bowers, 1998).
The nature of healthcare requires collaboration within work teams and in association with
other disciplines. Communication, Competence, Caring and to some extent Access all have
some relevance to Collaboration. Communication is essential for collaboration in a
healthcare environment as so much hinges on the dissemination of information and data to
facilitate patient interventions. Communication is one of the bolts that hold everything
together in the synergy of multi-disciplinary internal service groups. Competence, caring
Patient Outcome
Worker A Worker B

259
and access also play important roles in these processes. However, each has distinctive
characteristics that help make up the overall dimension of collaboration. Collaboration not
only encompasses these dimensions but the many facets of interpersonal relationships
among members of the internal service value chain and the organizational elements of the
healthcare facility.
Collaboration was seen as a facilitation tool that contributed to patient outcomes and is
another dimension affected by both the dyadic and triadic interrelationships that impact on
evaluations of internal service quality. Care providers in the hospital need to feel that
everyone is working for the betterment of the patient, that as one group or individual
completes their shift or intervention that they can pass the “baton” onto the next person or
team to follow through. From a patient perspective, this needs to appear seamless; to
members of the internal service value chain it is collaborative.
6.2.2.10 Caring
Intuitively, caring should figure in evaluations of healthcare quality and has been identified
as a salient dimension in this research. Caring has also been identified by both Jun, Petersen
and Zsidisin (1998) and Bowers, Swan, and Koehler (1994) as a healthcare service
dimension. Evaluations of others in the internal service chain in disciplines with primary
“care” functions within the hospital were related to how patients were cared for. Attitudes
toward the patient, friendliness, communication, interpersonal interactions, and caring how
they impacted on others all contribute to this overall dimension of caring. While it may
effectively sit in the empathy dimension of SERVQUAL, there are significant implications
for the evaluation of team members and others in the internal service chain. Caring is seen
to impact on overall assessments of patient outcomes and the collaboration dimensions.
6.2.2.11 Summary of internal service quality dimensions
Section 6.2 has discussed the twelve internal service dimensions identified in this Study 1
of this research as important in the evaluation of internal service quality in healthcare, viz.,
tangibles, responsiveness, courtesy, reliability, communication, competence, understanding
the customer, patient outcomes, caring, collaboration, access, and equity. Except for the
260
equity dimension, these dimensions appear consistent as labels with attributes found in
prior research in both external and internal contexts. However, what is apparent in this
research from Study 1 and Study 2 is that traditional dyadic unidirectional views of service
of service quality need to be modified to be recognised as a triadic multilevel,
multidimensional and multi-directional conception of internal service quality. Therefore,
while the labels attached to these dimensions may suggest the general transferability of
external service quality dimensions to internal service value chains, the nature of the
internal service environment needs to be taken in account to understand how these
dimensions are used by members of the internal service chain. This is discussed further in
section 6.3.
This research reported in the current study shows that internal service quality attributes are
multilevel and multidimensional. While factor analysis effectively reduces the 12
dimensions identified to four dimensions, reliability, responsiveness, tangibles, and equity,
these dimensions do not address what needs to be reliable, responsive etc. Study 1 indicates
that elements of dimensions are spread across factors. The cross loading of items in factor
analysis also indicates this multilevel, multidimensionality and multi-directionality to
factors. This research supports the findings of Brady and Cronin (2001) and suggests that
the traditional views of evaluations of service quality need to be extended to account for
these levels.
The extension of the tangibles dimension to an environment dimension indicates the
importance of all aspects of the work place in evaluations of internal service quality. This
idea is captured to a large extent in the concept of a servicescape and Brady and Cronin’s
(2001) concept of environmental quality including ambient conditions, design, and social
factors. However prior studies have not addressed the working environment as a factor in
evaluations of internal service quality in internal value chains.
In a practical sense, it is difficult to include all these dimensions in a measurement tool to
evaluate internal service quality. The problem for management is how to reduce the number
of dimensions while capturing the essence of internal service quality issues. If they are
envisaged as sub-dimensions of overall dimensions in a hierarchical structure, it is easier to
address the aspects identified in these dimensions.
261
While the notion of equity or fairness has been established in some aspects of evaluations
of service quality and satisfaction with service encounters in prior research, both Studies 1
and 2 of this thesis identify the role of equity in evaluations of internal service quality. In
previous studies, equity dimensions have not been identified specifically in lists of
attributes used in evaluations of service quality, and has generally been subsumed in a
broader social dimension of service quality. However, with the importance of social
dimensions identified in internal healthcare service chains in this study, the role of equity
has been established. While the organizational behaviour literature reports the significance
of equity in employee relations, it has not been raised as a factor in internal service quality
evaluations. The analysis conducted in Study 2 suggests that equity is an important factor
but may be a modifier of other factors rather than a direct determinant of internal service
quality. The fact is, nonetheless, that equity plays an important role in the determination of
internal healthcare service quality.
The importance of the reliability and responsiveness dimensions has also been established
in the evaluation of service in internal service value chains. However, this study has
confirmed that rather than being an overall dimension, reliability and responsiveness are
factors that contribute to evaluations of other factors. In other words, something else is
reliable or responsive in a particular context. This means that the traditional SERVQUAL
and associated conceptualization of service quality based on gaps or disconfirmation does
not fully explain the nature of internal service quality.
The triadic nature of relationships in evaluating internal service quality identified in this
research extends the concept of service quality and delineates the dyadic nature of external
service quality evaluations to triadic internal service quality evaluations. Service quality
tools that do not consider the triadic nature of internal service relationships fail to capture
the extent of internal service quality evaluations.
The twelve dimensions identified in Study 1 and four factors in Study 2 provide a broad
base for understanding the dimensions used in the evaluation of internal healthcare service
quality. While it is difficult to conceptualize a measurement tool to efficiently evaluate each
dimension, the importance of these dimensions to members of the internal service chain

262
needs to be considered to capture nuances that may be lost through reduction techniques.
Section 6.6 examines the implications of the relative importance of these dimensions. The
following sections also examine the impact of reduction through factor analysis of these
dimensions.
6.3 Perceived differences in dimensions used in the evaluation of others and those used in evaluations by others
H1: Internal service quality dimensions individuals use to evaluate others in an internal service chain will differ from those they perceive used in evaluations by others.
Another aspect of perceptions of internal service quality was examined by this research
through the hypothesis that internal service quality dimensions individuals use to evaluate
others differ from those they perceive others use. Table 6.2 shows the factors identified as
those used to evaluate others and those perceived used in evaluations by others.
Table 6.2 Comparison of dimensions used in the evaluation of others and those
used in evaluation by others.
Evaluation of others Evaluation by others Responsiveness Responsiveness
Reliability Reliability Tangibles
Equity
While the dimensions of responsiveness and reliability are relevant for both evaluation of
others and evaluation by others, divergence is noted in the presence of the tangibles and
equity dimensions for evaluations of others. The impact of this divergence requires further
investigation. On one hand, this may be similar to perceptual differences in evaluating
one’s own performance compared to how others would see one’s performance (Gilbert,
2000). On the other, these expectations or perceptions of service quality dimensions may
affect behaviour in given contexts. Do internal service providers modify behaviour in
interactions with people from other areas because they feel performance is evaluated on
other dimensions to what they would use in evaluating others? The implications for
management are significant. An effective and uncomplicated service quality measurement
tool is sought; yet, the complexity of the behavioural issues may negate or distort findings
using such an instrument.

263
While Table 6.2 shows some differences between the limited number of factors derived
through factor analysis that one would use to evaluate others and those perceived in
evaluations by others, significant divergence was found through paired t-tests of statements
reflecting these dimensions. The implications of these differences require further research;
however, it is reasonable to consider the impact this would have on internal service quality
tools. Exactly what is the tool going to measure? These differences in perception of
attributes between the four strata of internal service groups used in the study raise questions
as to what perceptions should be used in developing instruments to evaluate internal service
quality. On one hand there are perceptions of what one would use to evaluate others. On the
other, there are perceptions of what is important to others in evaluating internal service
quality. It is apparent that any attempt to generalise attributes will need to consider the
relative salience of attributes to different strata. Otherwise, any measurement obtained may
not be a true reflection or interpretation of internal service quality from one or more of the
groups being evaluated in the internal service chain.
If, as suggested by Brady & Cronin (2001), perceptions form a better means of service
quality evaluation than expectations, then what perceptions form the basis of the evaluation
when dealing with internal service chains? How do these differences in perception between
what attributes would be used to evaluate others and what attributes would be used in
evaluations of internal service quality by others affect evaluations of internal service quality.
Do these differences follow patterns of differences in self evaluation and evaluation by
others? If so, how do they impact on evaluation of internal service quality? These issues
require further research to help determine how effective concentration on perceptions is to
providing true evaluations of internal service quality.
Measurement of internal service quality may be an elusive quest in that by relying on
instruments such as SERVQUAL (albeit modified) distorted or “feel-good” results are
achieved. As Farner, Luthans and Sommer (2001) assert, internal customer service may not
be as straightforward as some advocates suggest. It is a complex construct that makes it
more difficult to assess internal service quality in the same fashion as external service.

264
These differences point to the need for a multi-level, multidimensional approach to
evaluations of internal service quality.
6.4 Applicability of SERVQUAL dimensions to internal service quality evaluations Factor analysis in Study 2 of statements reflecting the dimensions identified in Study 1
confirms the presence of SERVQUAL dimensions of responsiveness, reliability, and
tangibles. Assurance and empathy dimensions were identified in initial factor analysis but
deleted due to cross loading of items. The direct application of SERVQUAL dimensions,
and with it external dimensions of service quality, in the evaluation of service quality in
internal service situations is not fully supported. Linking the findings of Study 1 and Study
2 suggests that the factors identified in SERVQUAL may not be direct determinants of
internal service quality. This means that while the traditional service quality dimensions
may be useful indicators of service quality, they do not effectively capture the complexities
of multilevel and multidimensional aspects of internal service quality.
In the academic pursuit of neatness in the number of dimensions, the practical application
of service quality dimensions may be hindered. This may be a reason for the difficulty in
development of service quality instruments that effectively measure service quality, and in
particular those that might contribute to improving interaction between internal service
groups so that external customers may be better served. That SERVQUAL dimensions have
been tested over a period of time in various settings with mixed results indicates a problem
with the generalisability of the dimensions in their generic or application specific modified
form (e.g. Babakus & Boller; 1992; Brown, Bronkesh, Nelson & Wood, 1993; Carman,
1990; Cronin & Taylor, 1992; Dabholkar, Thorpe & Rentz, 1996; Paulin & Perrin, 1996).
The problem may be that nuances are undetectable within the overall dimensions and that
means should be developed to better capture the sub-dimensions making up the overall
dimension in future measurement instruments. The loss of these nuances is evident in the
loss of elements seen as important in the qualitative Study 1 through factor analysis in
Study 2. If internal service quality is the result, as a whole or in part, of other attributes not
fully encompassed by instruments such as SERVQUAL, then an incomplete understanding
of quality will result.

265
Studies that use SERVQUAL as an internal service quality measurement tool assume that
the dimensions used are appropriate for such an application (e.g. Cannon, 2002; Farner,
Luthans & Sommer, 2001; Kang, James & Alexandris, 2002). The acceptance of these
dimensions in an internal service environment and the broad nature of these dimensions
probably have contributed to the mixed results reported. This research has sought to
identify internal service quality dimensions and compare them to those used in external
service situations. The labels of dimensions identified in this research appear to be similar
to those identified in previous research into service quality and suggest that dimensions are
readily transferable. However, this assumes that internal service quality relationships are
dyadic and uni-dimensional. The results of this study do not support that notion. The
hierarchical and multidimensional nature of attributes as well as the triadic nature of
relationships identified in this study suggests the need for a different approach to internal
service quality evaluations. At the same time, the SERVQUAL dimensions should not be
discarded as they are represented in the body of items used in internal service quality
evaluations. A change in conceptualisation may rather see these dimensions as modifiers of
some other factor than the direct determinates of internal service quality.
In summary, based on the results of this research, the notion that external service quality
dimensions are also used in internal service quality evaluation is partially supported.
However, in the healthcare context, these dimensions are mitigated by the triadic nature of
internal service networks where services are provided within the network, but evaluations
are based on the impact or outcomes to the patient. The existence of triadic relationships in
internal service chains outside healthcare needs to be investigated. It is possible that they
are present in areas such as hospitality, education, and other high involvement services.
While this study did not set out to validate SERVQUAL or any other study, it does not
support the direct application of SERVQUAL dimensions to internal service quality
evaluations. However, aspects of these dimensions would need to be included in any
evaluation tool.
6.5 Expectations

266
H2: Service expectations of groups within internal service networks will differ.
This research examined the notion that different areas within an organization will vary in
expectations of service delivery and quality. Analysis of variance revealed the key finding
that there are differences in expectations between groups of an internal service value chain.
The implications of this pose problems in development of internal service quality
instruments that will fully capture service quality. If the expectation model of service
quality measurement is followed, then the question of consistency between groups may be
an issue.
It was also hypothesised that given a range of expectations being expressed in relation to a
number of factors that these expectations would be reflected in perceptions of attributes that
might be used to evaluate others and those that might be used in evaluations of service
quality by others. It was found that there were significant differences in half of the
dimensions tested, indicating some problems with the translation of expectations, when
explicitly stated, to perceptions of dimensions used in internal service quality evaluations.
The link between expectations and dimensions used to evaluate others and dimensions
others would use in evaluations also need further research. With expectations seen in the
literature as a principal factor in service quality evaluation and satisfaction (e.g.
Parasuraman, Zeithaml & Berry, 1988), variations in expectations would require
management to be aware of these differences in undertaking quality evaluations.
Factor analysis of variables examined in expectations resulted in two factors, reliability and
social factors. Expectations of reliability were expected given the nature of factors
identified as dimensions used in evaluating service quality.
The social factors dimension might be conveniently named empathy but each of the
variables making up this factor have a connection to relationships and so it was felt that this
label more appropriately conveyed meaning of this dimension. This dimension is consistent
with the interaction quality dimension identified by Brady and Cronin (2001). The
expectations of interrelationships carry an expectation of some impact on internal service
quality. This may be explained to some extent by the impact of relationships of internal
workers on service quality evaluations (Gittell, 2002). Relationships also point to

267
expectations on equity and impact on the environment in which internal service interactions
take place.
6.6 Ranking importance of internal service quality dimensions
H3: Ratings of service quality dimensions will differ in importance amongst internal
service groups. The salience of dimensions identified in this research was tested in Study 2 through the
ranking of attributes based on their importance for evaluation of service quality. It is
important to understand the importance of attributes used in internal service quality
evaluation in order to ensure that measurement instruments capture a true reflection of
internal service quality. When these attributes in Study 2 were ascribed to the SERVQUAL
dimensions (tangibles, reliability, responsiveness, assurance, and empathy), it was found
that reliability and responsiveness were the two most important dimensions of internal
service quality. Finding reliability is the most important dimension in service quality
evaluation supports the findings of Zeithaml, Parasuraman and Berry (1990), while Kang,
James, and Alexandris (2002) nominate reliability and responsiveness as most important
without being able to differentiate importance. In a healthcare setting, O’Connor, Trinh,
and Shewchuk (2000) also found that reliability was the most important attribute. However,
the nuances of what needs to be reliable appear to have been lost through the factor analysis
process. Therefore, these factors may not accurately encapsulate the multilevel and multi-
dimensions evident in Study 1 and Study 2.
Evaluations of rankings show that there are differences amongst the strata when the
individual attributes are considered. Table 6.3 shows these variations for the top six
attributes.

268
Table 6.3 Ranking of most important service quality attributes by strata R
ank
Allied Health Corporate Services
Nursing Medical Total
1 Patient outcomes Accuracy Knowledge Knowledge Knowledge 2 Knowledge Knowledge Communication Patient outcomes Accuracy 3 Communication Team work Patient outcomes Accuracy Patient outcomes 4 Team work Timeliness Accuracy Communication Communication 5 Accuracy Communication Team work Understanding
patients Team work
6 Timeliness Commitment Timeliness Friendliness Timeliness
With factor analysis, these attributes became subsumed in an overall dimension that, while
reflecting the nature of attributes, lost the nuances identified in the qualitative study. For
example, in section 6.3, Table 6.2 indicates factors identified in Study 2 perceived to be
used to evaluate internal service quality. There are no differences in the dimensions used to
evaluate internal service quality based on factors identified through factor analysis. Yet
analysis at the attribute level reveals only 40% close agreement in the ratings of attributes.
Of the 60% of variables that exhibited differences in ratings, the Corporate Services stratum
varied from other strata in ratings of one third of these attributes. While differences exist
amongst clinical staff, the divergence between clinical and non-clinical staff is apparent.
Corporate Services do not readily see themselves as concerned with patient outcomes or
understanding patient needs, but are more concerned, for example, with respect for other’s
timeframes, level of commitment to getting the job done, and ability to organise work.
ANOVA supports the existence of differences between internal service groups. Much of
this difference in orientation may be explained in the traditional focus of medical areas on
medical outcomes while the orientations of non-medical groups are grounded more in
managerial approaches to quality with measurable outcomes. The salience of these
differences and their impact on internal service evaluation in healthcare and in wider
applications needs to be evaluated through further research.
6.7 Difficulty in evaluating technical quality of services provided by other groups

269
H4: Internal service groups find it difficult to evaluate the technical quality of other service groups.
In terms of consumer evaluations of service quality, it has been reported in the literature
that consumers are unqualified to evaluate the technical aspects of service quality they have
received and so rely on attributes with which they are familiar. The marketing literature
maintains that, in the absence of tangible and measurable indicators of quality, service
receivers use proxy measures (e.g. Teas & Agarwal, 2000; Zeithaml, Bitner & Gremler,
2006). For example, patients would tend to evaluate such items as the food, comfort of the
bed and the personal interactions they have with staff to place meaning on their hospital
stay as they have no way of knowing about the quality of medical interventions. The
extension of this is that if there are problems with any of these attributes, then by inference
there may be problems with other areas.
The author hypothesised that members of internal service groups find it difficult to evaluate
technical quality of services provided by other groups. It was supposed that similar to
customers who have difficulty evaluating the unknown, members of internal service value
chains would also have difficulty. Results of Study 2 indicate that there is some difficulty
in evaluating technical service quality in internal service chains. While members of a
hospital based internal service quality service chain are more “qualified” than patients to
assess the quality of service provided, they still experience problems. This may explain
some of the inability to articulate service quality and reliance on tangible cues to evaluate
internal service quality. While patient outcomes would be a result of the technical attributes
of the service provided, the question arises by what perspective are members of the internal
service value chain evaluating the patient outcome? Do the salience of discipline attributes
transfer in the evaluation of other disciplines?
The implications of this for developing internal service quality measurement tools is that at
the end of the day an incomplete evaluation of service quality is obtained as no measure of
technical competence is considered by those doing the evaluation. This is in contrast to
Gilbert’s (2000) study that suggested that the two key measures of internal service quality
are technical competence and personal service. To obtain an accurate measure of internal
service quality, definition of the technical components and how people know that technical

270
aspects have been delivered need to be considered in developing measurement tools. There
is also the problem of who establishes the definition of technical quality. If the area
responsible for the technical delivery defines the dimensions, then the extent that these are
a reflection of reality, given that self-assessment issues may result in inaccurate evaluations
of service quality need to be considered.
6.8 Contribution to the Literature
This research makes six identifiable contributions to the literature in the area of internal
service quality evaluation. These are:
• Identification of internal service quality dimensions and their nature.
• The role of equity in internal service quality evaluations.
• Differentiation of perceptions of dimensions used to evaluate others from those used in evaluations by others
• Identification of the triadic nature of internal services
• Evaluation of technical quality of internal services.
• Differences in service expectation between groups within the internal service chain.
6.8.1 Nature of internal service quality
This study confirms the hierarchical, multidirectional, and multidimensional nature of
internal service quality. Traditionally, service quality has been viewed as unidimensional
and often unidirectional and this view has influenced conceptualisation of service quality
and the development of service quality measurement. This is particularly true of external
measures of service quality that have often been used as measures on internal service
quality. However, with an understanding of internal service quality as a multilevel and
multidimensional phenomenon, a richer understanding of service quality can be obtained. It
is suggested that problems with service quality measurement in the past can in part be
attributed to an inadequate view of nature of service quality.
Previous internal service quality studies have generally used the SERVQUAL approach to
service quality and consequently have not fully captured the essence of internal service

271
quality. The view of Brady and Cronin (2001) that the overall SERVQUAL dimensions
may be modifiers rather than direct service quality dimensions is supported by this author’s
study.
The direct transferability of external service quality dimensions to internal service quality
evaluations is not fully supported. Although dimension labels are similar to those used in
external studies of service quality, the cross-dimensional nature of a number of these
attributes and their interrelationships needs to be considered before adopting external
dimensions to measure internal service quality.
The tangibles dimension is replaced with a broader dimension of environment that
encompasses not only the physical aspects but also processes, psychosocial aspects, and the
overall service scape. The friendliness and personality of other workers as well as the
nature and duration of relationships between service providers influence this factor.
Teamwork, collaboration and communication also contribute to the environment dimension.
While equity has been identified in prior research as an antecedent to satisfaction, it has not
been identified as an individual factor in external service quality evaluation or specifically
as an internal service quality dimension. This research identifies equity as a significant
factor in the evaluation of quality in an internal service quality chain.
The significance of the reliability as the most important and responsiveness as the next
important dimensions confirms findings of previous studies. Empathy was seen as the third
most important dimension identified in this research, followed by assurance. Tangibles as
defined in the physical sense did not rate highly. However, at the end of the day these
dimensions may give classification of areas that are important to evaluations of internal
healthcare service evaluations but do not actually address what needs to be measured.
6.8.2 Role of equity in internal service quality evaluations

272
As stated above, this research identifies equity as an important factor in internal service
quality evaluations. Although identified in the organizational behaviour literature as a
factor in employee relationships, equity in evaluations of internal service encounters has
not been directly considered in the marketing literature. It is apparent from Studies 1 and 2
that equity influences perceptions of internal service quality and needs to be considered in
the development of evaluation instruments. However, the nature of the equity dimension
needs to be researched further to determine its relationship to other factors. It may be that
rather than being a direct determinate of service quality, equity is a modifier of other factors
that are determinates of service quality.
6.8.3 Differences in perceptions of dimensions used to evaluate others from those used in evaluations by others
This research identifies differences in perceptions of dimensions used in evaluations of
others compared to perceptions of those used by others in evaluations of service quality.
This has implications for how service quality is viewed in organizations and different work
units. With the expectations model of service quality measurement being a dominant
approach to conceptualising and developing service quality instruments, problems are
identified in developing instruments that consider differences in expectations between
internal groups.
While four factors encompassing responsiveness, reliability, tangibles, and equity were
thought to be important in the evaluations of others, it was thought that only factors of
responsiveness, and reliability were important to others in evaluating service quality. Prior
studies have not identified these differences. The implications of these differences in
perception of internal service dimensions impact on how service quality is defined and
measured within an organization. Behaviour may be affected as people respond to
perceptions that may be based on erroneous assumptions of dimensions evaluating internal
service quality. For example, if management believed that physical aspects covered by the
tangibles dimension were important when in fact they may not be in the traditional form,
and included items relating to physical attributes then respondents would not be accurately
reflecting the true significance of these elements. An effective and uncomplicated internal
service quality measurement tool is sought; yet, the complexity of behavioural issues may

273
negate or distort findings using such an instrument. This may mean that it may be more
difficult to assess internal service quality in the same fashion as external service.
The impact of these differences needs to be evaluated further and the impact on
management in the development of tools to measure internal service quality requires further
evaluation.
6.8.4 Triadic nature of internal services
This research identifies the triadic nature of internal service delivery and the impact of this
on internal service quality evaluations in the healthcare setting. Previous research tends to
view service quality as dyadic in nature. Service has been seen as an interactive process
described as a theatre or an act of performance (Grove & Fisk, 1983; Solomon, Surprenant,
Czepiel & Gutman, 1985). However, the triadic nature of internal service quality changes
the dynamics of service quality evaluations and introduces multilevel and multidimensional
aspects to those evaluations. This has significant implications on operationalization of
internal service quality measurement and conceptualisation.
Prior studies have not considered the triadic nature of internal service provision,
particularly in a healthcare environment. At least two levels of customer exist in a hospital
internal service network, one being other workers and the other being patients. Evaluations
of service quality were seen to involve evaluations of the impact of actions on third parties
in addition to the impact on the worker doing the evaluation. This complicates evaluations
of internal service quality as they have tended to be viewed as uni-dimensional or dyadic in
previous studies and approaches to quality management. The nature and impact of these
triadic relationships on outcome measures for internal service quality needs to be further
examined.
6.8.5 Evaluation of technical quality
This research confirms difficulties held by people to evaluate the technical quality of work
performed by those outside their area of expertise. While workers may be skilled and
knowledgeable in their own fields, they are unable or unwilling to pass judgement on the

274
performance of other professionals. Evaluations are then based on other factors. This
supports previous research that points to the use of other factors when inability to evaluate
technical quality exists. How this impacts on obtaining true assessments of internal service
quality requires further examination
6.8.6 Service expectations
It was found that there are differences in expectations between groups of service delivery
and quality in an internal healthcare service value chain. Factor analysis of the items used
in this study reveals two areas of expectations within an internal service chain, reliability
and social factors. While the concept of reliability as a service quality factor is well
established in the literature, the concept of social factors as an internal service quality
factor is now suggested. This supports Brady and Cronin (2001) who found that social
factors are a sub-dimension of Physical Environment Quality and may also influence
Outcome Quality. In this study, Social factors figured in expectations but did not figure as a
factor during factor analysis of dimensions used in internal service quality evaluations.
However, elements of this factor were evident in Study 1 and as sub-items in factors
identified in Study 2. Social factors were also seen to be important in rankings of individual
items. This suggests that social factors are a modifier of other factors rather than being a
direct dimension consistent with the hierarchical view of service quality.
6.9 Future Research
Several areas have been identified for further research. Overall, the hierarchical
multidimensional nature of internal service quality dimensions needs to be investigated
further. Specific areas of interest are:
1. The salience of timeliness in the responsiveness dimension on interactions
affecting internal service chain members versus those impacting on patients.
2. The effect of consolidation of internal service quality dimensions on the
effectiveness of service quality measurement: the issues of efficiency versus
effectiveness.

275
3. The nature and impact of triadic relationships on outcome measures for internal
service quality.
4. The role of information transfer in healthcare as a service quality dimension in
addition to a communication dimension.
5. The role of outcome measures in healthcare compared to other industries.
6. The salience of variations in internal group differences in ratings of the
importance of service quality dimensions on internal service quality evaluations.
7. The impact of perceptions of dimensions used by others to evaluate internal
service quality on behaviour of members of internal service chains.
8. The implications of divergence of ratings of importance of service quality
dimensions on development of internal service quality measurement instruments.
9. Links between expectations of members of an internal service chain and
differences in expectations between internal service groups.
10. The role of social factors in evaluations of internal service quality.
11. The implication of problems in evaluating technical quality in internal
healthcare service chains.
6.10 Managerial Implications
This research can assist managers in understanding how workers within an internal service
chain evaluate service quality. Essentially, three basic issues were addressed through the
research questions:
RQ1 What are the dimensions used to evaluate service quality in internal
healthcare service networks?
RQ2 How do dimensions used in service quality evaluations in internal
healthcare service networks differ from those used in external quality
evaluation?
RQ3 How do different groups within internal service networks in the healthcare
sector evaluate service quality?
The assumption that external service quality dimensions are transferable to internal service
quality evaluations has led to the adoption of external service quality instruments and

276
approaches in internal service quality evaluations. Through understanding what dimensions
are used in evaluations on internal service quality, better tools can be developed to capture
true evaluations of internal service quality. This research shows that there are unique
aspects of internal service quality evaluation that mean that external service quality
evaluation approaches cannot be readily transferred to internal situations.
From a strategic standpoint, being able to better evaluate internal service quality can lead to
better outcomes for external customers. In the case of healthcare, this represents
opportunities to improve outcomes for patients and to have greater efficiencies and
effectiveness within the internal service chain. Understanding the nature of internal service
quality will allow tracking of the relative performance of organisational groups across the
relevant dimensions.
The role of perceptions in dimensions of internal service quality also requires a change in
orientation from the expectations approach to conceptualising service quality. This has
implications on how dimensions are viewed in evaluations of internal service quality.
Linked to this is the multilevel and multidimensionality of internal service quality. The
nature of dimensions suggests that unitary conceptualisation of dimensions loses nuances
peculiar to particular groups within the organisation and misses the meaning attached to
attributes used to evaluate internal service quality. Understanding these levels and how
attributes may modify a dimension leads to better evaluations of internal service quality
allowing more appropriate management response by identifying issues that have a more
significant impact on levels of internal service quality. The managerial implications of
these differences in perception of internal service dimensions impact on how service quality
is defined and measured within an organization. Behaviour may be affected as people
respond to perceptions that may be based on erroneous assumptions of dimensions
evaluating internal service quality.
For adherents of the SERVQUAL approach to service quality evaluation, the implications
of this research are that SERVQUAL is not appropriate in an internal healthcare
environment. Delivering reliable and responsive service to other members of the internal
healthcare service chain is related to improved perceptions of service quality rather than
expectations. Understanding the relationship of perceptions to expectations in evaluations

277
of internal healthcare service is critical for healthcare managers to formulate strategies for
internal service quality improvement. When expectations are considered, there is also the
question of whose expectations management considers in the evaluation of service between
members of the internal service chain. The differences in expectations between groups
shown in Study 2 create problems in orientation of any single measurement instrument.
It is apparent that healthcare is an industry where social factors are a key driver in
perceptions of internal service quality. Ensuring that this dimension is taken into account in
any assessment of internal healthcare service quality is critical given that instruments
borrowed or adapted from applications outside healthcare may not consider social factors
relevant to the industry for which it was developed (Brady & Cronin, 2001; Parasuraman,
Zeithaml & Berry, 1988). This reinforces the importance of context in evaluations of
internal healthcare service quality and suggests that instruments that measure service
quality in internal healthcare service chains need to take into account these social factors.
Another factor for management to consider is the role of equity in perceptions of internal
service quality. How this is operationalised needs further development. However, it is clear
that equity influences judgements on service delivered by other members of the internal
service chain and this has not been considered in previous conceptualisations of service
quality generally, and internal service quality specifically. The potential to affect measures
of internal service quality is significant and needs to be taken into account by management.
In a professional environment such as healthcare, it is essential to gain a true measure of
internal service quality due to the potential impact on patients and hospital processes. The
inability of participants shown in Study 2 to evaluate technical quality of services provided
by groups outside of their own discipline leads to question about what is actually going to
be measured in internal service quality evaluations. As other cues are substituted for
technical evaluations, the implications for management are that the measures do not reflect
reality in the level and quality of services provided within the organisation. Then, measures
of external service quality are also impacted as aspects being measured may not be as
relevant to patients in the flow-on affect to them.
278
The multilevel nature of internal service evaluations has further managerial implications in
how to handle the triadic nature of internal service evaluations. Members of the internal
service chain consider the impact on themselves as well as third parties in assessment of
internal service quality. This research has identified these relationships that have not been
previously considered in the healthcare sector. Management needs to understand the
salience of these factors and build them into service evaluations. This requires a change in
mind-set by management who have traditionally followed a dyadic pattern to service
evaluation.
This research has identified differences between external and internal service quality
dimensions. While external dimensions are useful and important in understanding broader
issues of internal service quality, it is essential that management realise that internal service
environments are different to external environments and require an appreciation of how
these differences impact on perceptions of service quality within internal service chains.
6.11 Limitations
This research presents the findings of research investigating internal service quality
dimensions in a healthcare setting. A shortcoming of this research is the fact that it was
conducted in a single medical facility, albeit a relatively large public hospital. The facility
provided the convenience of having multiple disciplines in one location. However, this in
turn affects the generalisability of this research. Issues impacting on the generalisability of
the findings include sample size, single location, potential impact of unique aspects of
organizational culture, and whether results are a reflection of the industry or a mix of
locational factors and the specialised rather than general nature of illnesses treated at the
hospital in which the research was based. Organizational culture as a whole and discipline
culture reflected in the strata specifically may have been an influence that was not
accounted for in this research. There may also have been an influence on the
generalisability of research findings by having groups of distinctive specialised disciplines
that by their nature perhaps have perceptions and orientations that would not exist in other
organizations. The specialised nature of healthcare may mean that results of this research
may not be transferable to other professional services.

279
The qualitative nature of Study 1 also provides difficulty in generalisation of results from
this study. Another consideration is the sample size of Study 2. While appropriate statistical
analysis was possible based on the total sample, some aspects of analysis of the strata were
problematic. While a larger sample may have been useful, this was constrained by
population size of two of the strata where the sample obtained approached the population of
these strata. The strata sample size made it problematic in some aspects to perform factor
analysis. Another issue affecting analysis was what data was collected. However, the
analyses used in the study have taken into account these issues. Nevertheless, given these
limitations, results are useful indicators for further research.
6.12 Summary
This research has examined the transferability of external service quality dimensions to
evaluations of internal service quality and investigated gaps in the literature relating to the
nature and dimensionality of internal service quality. Much of the research in the literature
has tended to use the SERVQUAL approach to service quality evaluation uncritically. This
has tended to layer research on these assumptions rather than to establish the applicability
of SERVQUAL dimensions or other external dimensions in service quality evaluations in
internal service chains. Also, current conceptualisations of internal marketing have not
differentiated between different types of internal customers that may exist within an
organization and their differing internal service expectations or perceptions. There are also
inconsistencies in the literature concerning the relative importance of service quality
dimensions. Little in the literature relates these issues to healthcare and internal service
value chains.
This research is both exploratory and explanatory in nature. Study 1 is exploratory in that it
seeks to identify service quality dimensions used in internal service network service value
chains through qualitative in-depth interviews and explore the potential impact of
relationships between staff groups on evaluations of service quality. Study 2 is explanatory
in nature by taking the dimensions identified and seeking to confirm these through
quantitative research and analysis.

280
These two studies in combination found that internal service quality is hierarchical,
multidirectional, and multidimensional in nature. Previous research has assumed that
external quality dimensions are readily transferable to internal service quality evaluations.
This proposition is not fully supported by this research. While the 12 core dimensions
identified in Study 1 and subsequent factors found through data reduction in Study 2 are
similar to those found in prior studies of external and internal service quality, this research
suggests that they may be modifiers of service quality rather than direct determinants. For
example, an overall internal service quality dimension such as outcome quality may have
modifiers that relate to a reliability item, or a responsiveness item etc. Rather than discount
SERVQUAL and other dimensions identified previously in the literature, it is suggested
that internal service quality is a composite set of factors with overall dimensions and sub-
dimensions.
The role of perceptions of equity in evaluations of service encounters in internal service
chains has also been identified. This dimension deals with perceived fairness of
interrelationships and interactions. Previous studies have not directly considered the impact
of equity in evaluations of internal service quality. Further research is required into the
nature of this dimension to determine its relationship to other factors and role as either a
direct determinate of internal service quality or as a modifier of other factors identified as
determinates of service quality.
It was also found that there are different perceptions in service quality dimensions used to
evaluate others than those perceived used in evaluations by others. Prior studies have not
identified these differences. Managerial implications of this include difficulty in developing
an effective and uncomplicated internal service quality measurement tool due to problems
in orientation of the instrument. With the expectations model of service quality
measurement being a dominant approach to conceptualising and developing service quality
instruments, problems are identified in developing instruments that consider differences in
expectations and perceptions between internal groups.
The triadic nature of internal service delivery and its impact on internal service quality
evaluations has been identified. Previous research has viewed service quality as dyadic in
nature. At least two levels of customer service exist in a hospital internal service network,
281
one being other workers and the other being patients. Evaluations of service quality involve
the impact on third parties in addition to the impact of the interaction between workers.
This complicates evaluations of internal service quality and has not been previously
considered.
This research also confirms difficulties held by people in evaluating technical quality of
work performed by those outside their area of expertise. This means that evaluations are
based on other factors. This supports previous research that points to the use of other
factors when inability to evaluate technical quality exists. It also creates problems in
gaining a true measure of internal service quality as factors used due not fairly represent
technical quality.
Traditional concepts of service quality do not transfer readily to internal service
environments. The multi-level, multi-dimensional nature of internal service quality
suggests that prior conceptualizations of service quality do not provide a true picture of
service in internal service chains. Further research is required in a number of areas, such as:
the nature of triadic relationships on outcomes measures; the role of outcome measures in
healthcare compared to other industries; salience of variations in internal group differences
in dimension importance, expectations, and implications on development of internal service
quality measurement instruments; and the effect of consolidation of internal service quality
dimensions on the effectiveness of service quality measurement.
This research contributes to understanding of the nature of internal service and dimensions
used in evaluating internal service. Viewing internal service quality as multilevel allows
better conceptualization of service at several levels of abstraction and can assist in
simplifying the complexity of internal service quality evaluation. This thesis thus assists in
supporting the development of measurement tools that are more suited to internal service
chains and focus on overall determinates of internal quality rather than modifiers.

282
7.0 Appendices 7.1 Appendix 1 Study 1 Interview Guide
Preamble The purpose of this interview is to discuss work relationships and how you assess the quality of work performed by members of other departments who impact on the performance of your work. The things discussed in this interview are confidential. Information you provide is aggregated with other results so that you cannot be identified. 1. What is the nature of your work?
How long have you been working in this area? 2. How would you describe the nature of the working relationships you have with people from other
sections? How and why do you become involved? What role do you play? Who determines what you do? Do you have any control over the work performed by people from other areas?
3. How important is quality in your role?
What does service quality mean to you? How do you measure quality? Which attributes are important to you in assessing quality? Which attributes are most important? Is there a formal quality review process? Is there an informal quality review process? How does it work? Are you rewarded for quality work?
4. How do you evaluate the quality of work done by people from other sections with whom you work?
What attributes do you use? Which attributes are most important? Is there a formal process?
5. How do your expectations influence your assessment of the quality of work done?
If your expectations are met are you satisfied with quality? 6. How much time do you spend each day with workers form other departments as a percentage of
your work day? Do you have regular contact with the same people? How often do staff change? Do you look forward to working with certain people? How does this affect your work? How do you rate the quality of work for people you work with on a regular basis to those you have limited contact?

283
7.2 Appendix 2 Study 2 Questionnaire
Quality Questionnaire
Thank you for taking time to complete this survey. The purpose of the survey is to better understand issues that are important to you relating to work quality. As individuals have their own impressions it is important for you to answer each question as you see it. There are no right or wrong answers. All data is kept confidential. Questions are designed to not identify individuals. Individual responses are aggregated with other data to further protect individuals. PART I DIRECTIONS This portion of the survey deals with how you think about your work and the nature of working relationships you have with people from other disciplines/ departments. Please indicate the extent to which you agree with each of the following statements. If you strongly disagree with the statement, circle the number 1. If you strongly agree with the statement, circle 7. If your feelings are less strong, circle one of the numbers between 1 and 7 to indicate the strength of your agreement with the statement. If you feel the question is completely irrelevant to your situation, circle 0. If you change your answer either erase the incorrect answer or make it clear the answer you wish recorded. Strongly Strongly
N/A Disagree Agree 1. I control my work activities, especially when working with
people from other disciplines/areas…………………………..
0 1 2 3 4 5 6 7
2. I clearly understand my duties in relation to working with people from other disciplines/areas…………………………..
0 1 2 3 4 5 6 7
3. I am able to keep up with changes in the hospital that affect my job…………………………………………………………….
0 1 2 3 4 5 6 7
4. I am comfortable in my job in the sense that I am able to perform it well……………………………………………………
0 1 2 3 4 5 6 7
5. I have a clear understanding of my supervisor’s
expectations of my work……………………………………….
0 1 2 3 4 5 6 7
6. My work is affected when others do not do theirs properly...
0 1 2 3 4 5 6 7
7. I have no flexibility in how I perform my duties………………
0 1 2 3 4 5 6 7
8. My work has a strong influence on how others are able to do their work……………………………………………………..
0 1 2 3 4 5 6 7
9. My work is patient centred…………………………………….. 0 1 2 3 4 5 6 7
10. My work mainly provides a service to other disciplines/areas………………………………………………...
0 1 2 3 4 5 6 7
11. I feel a sense of responsibility to help my fellow workers do their job well……………………………………………………..
0 1 2 3 4 5 6 7

284
12. In performing my duties I have little interaction with staff
from other disciplines/areas…………………………………… 0 1 2 3 4 5 6 7
13. I find workers from other disciplines/areas have the same sense of commitment as I do………………………………….
0 1 2 3 4 5 6 7
14. I find working with staff from other disciplines/areas stimulating……………………………………………………….
0 1 2 3 4 5 6 7
15. I feel I am an important member of the hospital…………… 0 1 2 3 4 5 6 7
16. Being part of an effective team is essential to perform my duties……………………………………………………………
0 1 2 3 4 5 6 7
17. I have a clear understanding of other disciplines/units' expectations of my work when I deal with them……………
0 1 2 3 4 5 6 7
18. I sometimes feel lack of control over my job because too
many others demand my attention at the same time………. 0 1 2 3 4 5 6 7
19. I feel unfairly treated when workers from other disciplines/areas affect my workload………………………….
0 1 2 3 4 5 6 7
20. Some disciplines/ areas are difficult to work with……………
0 1 2 3 4 5 6 7
PART II DIRECTIONS Listed below are a number of statements intended to measure your perceptions about quality and hospital operations. Please indicate the extent to which you disagree or agree with each statement by circling one of the seven numbers next to each statement. If you feel the statement is completely irrelevant to your situation, circle 0.
Strongly Strongly N/A Disagree Agree
1. Quality is very important in my work……………………………….
0 1 2 3 4 5 6 7
2. Quality is only an issue during accreditation reviews…………… 0 1 2 3 4 5 6 7
3. We are too busy to implement quality improvement programs… 0 1 2 3 4 5 6 7
4. Quality programs are basically cost reduction activities………… 0 1 2 3 4 5 6 7
5. I fully understand what represents quality in my work performance………………………………………………………….
0 1 2 3 4 5 6 7
6. I can easily measure quality in my work…………………………..
0 1 2 3 4 5 6 7
7. I can readily tell when work performed by others is not quality work…………………………………………………………………..
0 1 2 3 4 5 6 7
8. My unit has procedures in place to evaluate the quality of service provided to us by other areas…………………………….
0 1 2 3 4 5 6 7
9. Information is regularly collected about the service quality expectations of disciplines/areas my unit deals with……………
0 1 2 3 4 5 6 7
10. My work quality is formally assessed as part of my performance appraisal……………………………………………..
0 1 2 3 4 5 6 7
11. I have formal means to evaluate quality of work performed by other disciplines/areas……………………………………………..
0 1 2 3 4 5 6 7
12. Quality standards are clearly defined for each division of the
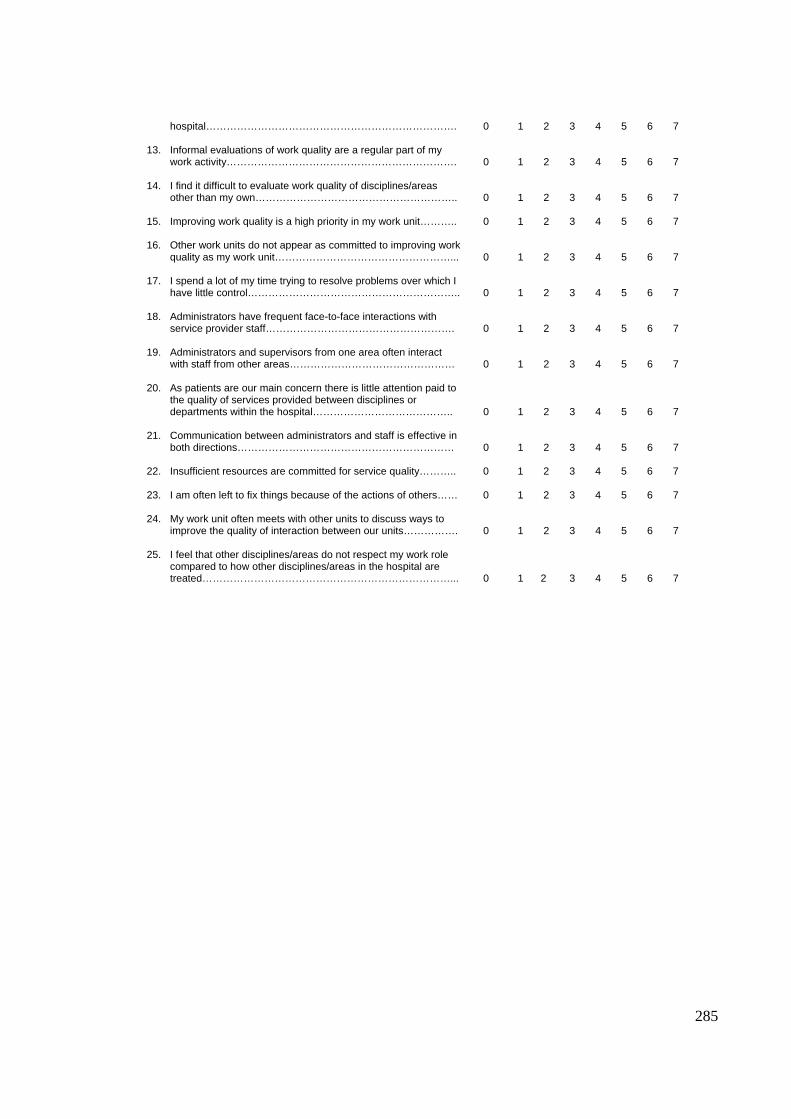
285
hospital……………………………………………………………….
0 1 2 3 4 5 6 7
13. Informal evaluations of work quality are a regular part of my work activity………………………………………………………….
0 1 2 3 4 5 6 7
14. I find it difficult to evaluate work quality of disciplines/areas other than my own…………………………………………………..
0 1 2 3 4 5 6 7
15. Improving work quality is a high priority in my work unit………..
0 1 2 3 4 5 6 7
16. Other work units do not appear as committed to improving work quality as my work unit……………………………………………...
0 1 2 3 4 5 6 7
17. I spend a lot of my time trying to resolve problems over which I have little control……………………………………………………..
0 1 2 3 4 5 6 7
18. Administrators have frequent face-to-face interactions with service provider staff……………………………………………….
0 1 2 3 4 5 6 7
19. Administrators and supervisors from one area often interact with staff from other areas…………………………………………
0 1 2 3 4 5 6 7
20. As patients are our main concern there is little attention paid to the quality of services provided between disciplines or departments within the hospital…………………………………..
0 1 2 3 4 5 6 7
21. Communication between administrators and staff is effective in both directions………………………………………………………
0 1 2 3 4 5 6 7
22. Insufficient resources are committed for service quality……….. 0 1 2 3 4 5 6 7
23. I am often left to fix things because of the actions of others…… 0 1 2 3 4 5 6 7
24. My work unit often meets with other units to discuss ways to improve the quality of interaction between our units…………….
0 1 2 3 4 5 6 7
25. I feel that other disciplines/areas do not respect my work role compared to how other disciplines/areas in the hospital are treated………………………………………………………………...
0 1 2 3 4 5 6 7

PART III
DIRECTIONS The following statements deal with expectations. We are interested in knowing how important these are to you. If you strongly disagree with the statement, circle number 1. If you strongly agree with the statement, circle number 7. If your feelings are less strong, circle one of the numbers in the middle. If you feel the statement is completely irrelevant to your situation, circle 0.
Strongly Strongly N/A Disagree Agree
1. I expect others to do their work accurately……………………..
0 1 2 3 4 5 6 7
2. I expect management to set standards for quality service……
0 1 2 3 4 5 6 7
3. I expect to be able to measure the quality of service from other disciplines/ areas…………………………………………..
0 1 2 3 4 5 6 7
4. I expect others to treat me with respect………………………..
0 1 2 3 4 5 6 7
5. I expect others to be able to communicate without problem….
0 1 2 3 4 5 6 7
6. I expect others' work to not detract from my ability to perform my duties………………………………………………………….
0 1 2 3 4 5 6 7
7. I expect others to be interested in me as a person…………… 0 1 2 3 4 5 6 7
8. I expect to form relationships beyond working relationships in work environments……………………………………………….
0 1 2 3 4 5 6 7
9. Equity in working relationships is important to me……………. 0 1 2 3 4 5 6 7
10. I expect workers to do more than just what is in their job description…………………………………………………………
0 1 2 3 4 5 6 7
11. I expect other workers to have competent inter-personal skills…………………………………………………………………
0 1 2 3 4 5 6 7
12. I expect workers to effectively work in a team environment….
0 1 2 3 4 5 6 7
13. I expect people I work with to be skilled in their position……..
0 1 2 3 4 5 6 7
14. I expect people I work with to be knowledgeable in their field…
0 1 2 3 4 5 6 7
15. I expect workers to get their work done on time………………
0 1 2 3 4 5 6 7
16. I expect work performed to have positive outcomes for patients…………………………………………………………….
0 1 2 3 4 5 6 7
17. I have high expectations for my own work performance……..
0 1 2 3 4 5 6 7
18. I expect coworkers and workers from other areas to be flexible in their approach to work……………………………….
0 1 2 3 4 5 6 7
19. When my expectations are met I am usually satisfied with quality of work performed by other people…………………….
0 1 2 3 4 5 6 7
20. I tend to be more critical when evaluating work quality of people I work with on a regular basis than those I work with on an irregular basis……………………………………………..
0 1 2 3 4 5 6 7

PART IV
DIRECTIONS Listed below are attributes that might be used to evaluate quality of service work. We would like to know how important each of these attributes are to you when, in your view, workers from other disciplines/areas deliver excellent quality of service to you. If you feel an attribute is not at all important for quality service, circle the number 1. If you feel an attribute is very important, circle 7. If your feelings are less strong, circle one of the numbers in the middle. If the question is completely irrelevant to your situation, circle 0. Remember, there are no right or wrong answers - we are interested in what you feel is important in delivering excellent quality of service.
N/A
Not Important
Very Important
1. Staff will be neat in appearance………………………………
0 1 2 3 4 5 6 7
2. The physical facilities used by service providers will be visually appealing………………………………………………
0 1 2 3 4 5 6 7
3. Work will be performed accurately……………………………
0 1 2 3 4 5 6 7
4. They will understand my work needs………………………… 0 1 2 3 4 5 6 7
5. Workers I have contact with are friendly…………………….. 0 1 2 3 4 5 6 7
6. They are easy to approach……………………………………. 0 1 2 3 4 5 6 7
7. When they promise to do something by a certain time they do it……………………………………………………………….
0 1 2 3 4 5 6 7
8. They listen to my ideas………………………………………… 0 1 2 3 4 5 6 7
9. When I have a problem they show a sincere interest in solving it………………………………………………………….
0 1 2 3 4 5 6 7
10. They respect my timeframes. …………………………………
0 1 2 3 4 5 6 7
11. Tasks are performed right the first time………………………
0 1 2 3 4 5 6 7
12. Their behaviour instils confidence in me……………………..
0 1 2 3 4 5 6 7
13. Communication is easily understood…………………………
0 1 2 3 4 5 6 7
14. They are knowledgeable in their field…………………………
0 1 2 3 4 5 6 7
15. They demonstrate skill in carrying out tasks…………………
0 1 2 3 4 5 6 7
16. They have a clear understanding of their duties……………. 0 1 2 3 4 5 6 7
17. They provide appropriate information to me………………… 0 1 2 3 4 5 6 7
18. I am treated fairly by them…………………………………….. 0 1 2 3 4 5 6 7
19. Service providers are responsive to my needs………………
0 1 2 3 4 5 6 7
20. They speak me to politely……………………………………... 0 1 2 3 4 5 6 7
21. They are responsive to patient needs……………………….
0 1 2 3 4 5 6 7
22. They respect my role…………………………………………..
0 1 2 3 4 5 6 7
23. Workers have a pleasing personality…………………………
0 1 2 3 4 5 6 7

288
24. Other workers are flexible in their work approach………….. 0 1 2 3 4 5 6 7
25. They show commitment to serve patients and coworkers…. 0 1 2 3 4 5 6 7
26. I can contact service providers when I need to……………... 0 1 2 3 4 5 6 7
27. They have well-developed inter-personal skills……………...
0 1 2 3 4 5 6 7
28. They will show a team orientation in their approach to work.
0 1 2 3 4 5 6 7
29. Workers from other disciplines/areas can be relied on to “put in extra effort” when needed……………………………...
0 1 2 3 4 5 6 7
30. The actions of other workers will not adversely impact on my work…………………………………………………………..
0 1 2 3 4 5 6 7
PART V
DIRECTIONS Listed below are a number of attributes pertaining to how workers from other disciplines/departments evaluate the quality of your work. We would like to know how important you think each of these attributes are to these workers. If you feel that other workers are likely to feel an attribute is not at all important in their evaluation of the quality of your work, circle the number 1. If other workers are likely to feel an attribute is very important, circle 7. If you feel other workers' feelings are likely to be less strong, circle one of the numbers in the middle. If you feel a statement is completely irrelevant to your situation, circle 0. Remember, there are no right or wrong answers and this is not a self-assessment - we are interested in what you think other workers' feelings are regarding attributes to describe excellence in the service you provide. Not Very
N/A Important Important
1. Your appearance……………………………………………..
0 1 2 3 4 5 6 7
2. Accuracy of your work……………………………………….
0 1 2 3 4 5 6 7
3. Doing things when you say you will………………………...
0 1 2 3 4 5 6 7
4. Your level of communication skills………………………….
0 1 2 3 4 5 6 7
5. Your knowledge of your field……………………………….
0 1 2 3 4 5 6 7
6. Going out of your way to help others……………………….
0 1 2 3 4 5 6 7
7. How you relate to other staff members……………………
0 1 2 3 4 5 6 7
8. Keeping your head down and just doing your work………
0 1 2 3 4 5 6 7
9. Friendliness you have for patients and staff………………
0 1 2 3 4 5 6 7
10. Outcomes of your work for patients……………………….
0 1 2 3 4 5 6 7
11. Respect you have for time frames of workers from other disciplines/areas………………………………………………
0 1 2 3 4 5 6 7
12. Your responsiveness to the needs of other disciplines/areas………………………………………………
.
0 1 2 3 4 5 6 7
13. Dealings you have with other disciplines/ areas have no hidden agendas………………………………………………
0 1 2 3 4 5 6 7
14. Feedback from you on work performed by other disciplines/areas……………………………………………
0 1 2 3 4 5 6 7

289
15. Level of respect you show for other workers' disciplines and roles……………………………………………………..
0 1 2 3 4 5 6 7
16. Whether you treat individual workers with respect………. 0 1 2 3 4 5 6 7
17. The impact of your work performance on other workers...
0 1 2 3 4 5 6 7
18. The degree of confidence your behaviour instils in other workers………………………………………………………..
0 1 2 3 4 5 6 7
19. The degree of flexibility you have to work situations…….. 0 1 2 3 4 5 6 7
20. Regard held for your professional skill…………………….
0 1 2 3 4 5 6 7
21. Your ability to organise work activities…………………….. 0 1 2 3 4 5 6 7
22. The effort you make to understand the needs of patients. 0 1 2 3 4 5 6 7
23. The effort you make to understand the needs of workers you interact with…. …………………………………………
0 1 2 3 4 5 6 7
24. Your level of commitment to “getting the job done.”……... 0 1 2 3 4 5 6 7
25. Your work in a team………………………………………….
0 1 2 3 4 5 6 7
PART VI
DIRECTIONS Each statement in PART V represents an attribute that might be used to evaluate service quality. By using the number of the statement, please identify below the five attributes you think are most important for others to evaluate the excellence of service quality of your work. Statement numbers ______, ______, _______, _______, _______ Which one attribute among the above five is likely to be most important to other workers? (please enter the statement number) _________________ Which attribute among the above five is likely to be the second most important to other workers? _________________ Which attribute among the above five is likely to be least important to other workers. _________________

PART VII
To enable analysis of the responses you have made please answer each of the following questions. Your responses remain confidential and reports resulting from this research will in no way contain data that may possibly identify individuals.
DIRECTIONS Please answer each item by marking the appropriate O with an X. 1. Area in which you work
O Allied Health O Corporate Services/Other O Nursing O Medical
2. Gender O Female O Male 3. Age O less than 25 years
O 25 years to less than 35 years O 35 years to less than 45 years O 45 years and over
4. Length of time you have worked in your current occupation
O Less than one year O More than one year, less than five years O Five years or more
5. Length of time in your current role
O Less than one year O More than one year, less than five years O Five years or more
6. Length of time at you have worked at Prince Charles Hospital
O Less than one year O More than one year, less than five years O Five years or more
7. Do you have a supervisory role? O Yes O No If yes, how many do you supervise? O Five or less
O Six to twenty O More than twenty
Thank you for your time and assistance. Your responses are important to the overall success of this research and are greatly appreciated. Please return this questionnaire as soon as possible.
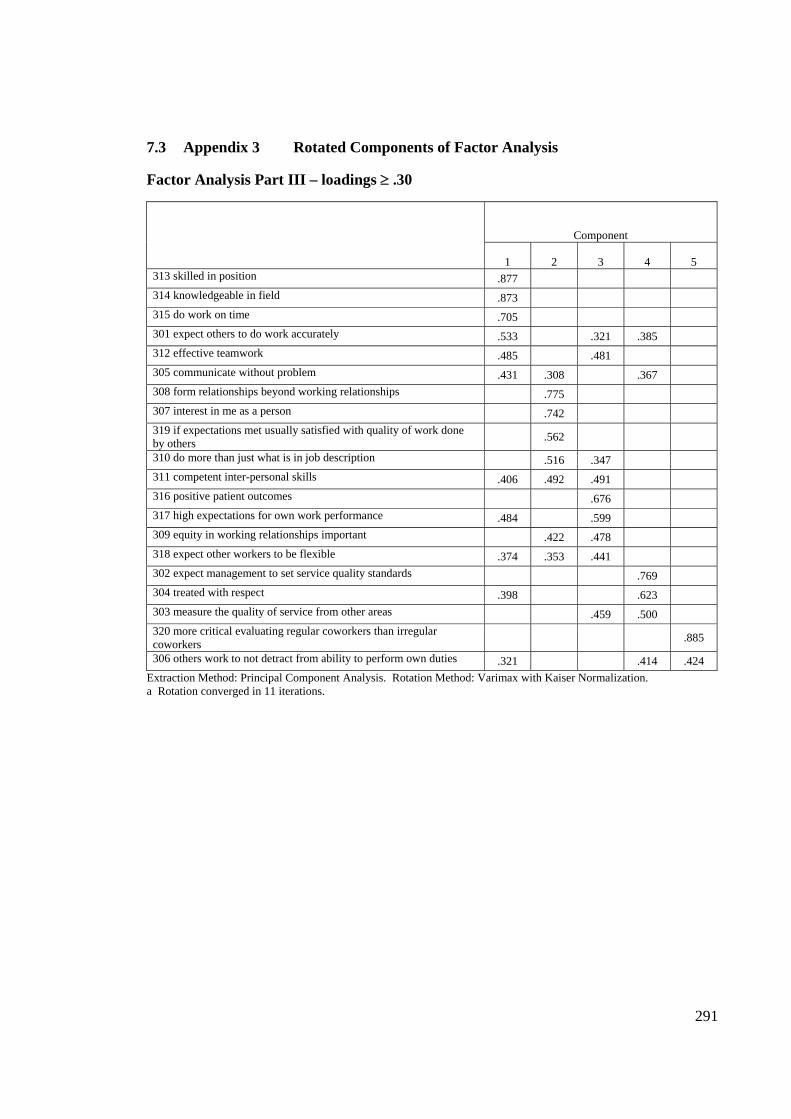
291
7.3 Appendix 3 Rotated Components of Factor Analysis Factor Analysis Part III – loadings ≥ .30
Component
1 2 3 4 5 313 skilled in position .877 314 knowledgeable in field .873 315 do work on time .705 301 expect others to do work accurately .533 .321 .385 312 effective teamwork .485 .481 305 communicate without problem .431 .308 .367 308 form relationships beyond working relationships .775 307 interest in me as a person .742 319 if expectations met usually satisfied with quality of work done by others .562
310 do more than just what is in job description .516 .347 311 competent inter-personal skills .406 .492 .491 316 positive patient outcomes .676 317 high expectations for own work performance .484 .599 309 equity in working relationships important .422 .478 318 expect other workers to be flexible .374 .353 .441 302 expect management to set service quality standards .769 304 treated with respect .398 .623 303 measure the quality of service from other areas .459 .500 320 more critical evaluating regular coworkers than irregular coworkers .885
306 others work to not detract from ability to perform own duties .321 .414 .424 Extraction Method: Principal Component Analysis. Rotation Method: Varimax with Kaiser Normalization. a Rotation converged in 11 iterations.

292
Factor Analysis Part IV – loadings ≥ .30
Component
1 2 3 4 417 provide appropriate information .781 414 knowledge of their field .754 .367 415 skill in performing tasks .751 .328 416 clear understanding of duties .737 .395 421 responsive to patient needs .703 .318 422 respect my role .637 .346 420 speak politely to me .614 .338 425 commitment to serve patients & coworkers .575 .462 418 fairly treated .559 .460 424 flexibility .533 .510 .336 403 accuracy .529 .361 426 can contact others when needed .523 .311 419 responsive to my needs .522 .412 .392 413 communication easily understood .505 .342 .399 .301 407 timeliness .763 408 listen to ideas .725 .324 410 respect for my timeframes .712 409 interest in solving my problems .700 .378 411 tasks performed right first time .364 .693 412 behaviour instils confidence .615 .335 404 others understand my work needs .525 .392 429 relied on to put in extra effort when needed .317 .682 430 no adverse impact by others actions .681 427 well-developed inter-personal skills .378 .604 .365 428 team orientation to approach to work .483 .596 402 physical facilities visually appealing .802 401 appearance .731 405 other workers will be friendly .430 .629 423 pleasing personality .472 .566 406 ease of approach .494 .526
Extraction Method: Principal Component Analysis. Rotation Method: Varimax with Kaiser Normalization. a Rotation converged in 10 iterations.

293
Factor Analysis Part V – loadings ≥ .30
Component 1 2 3 4 509 friendliness to patients & staff .784 .310
507 relate to other staff .754 .319
504 communication skill .746 .317 .301
522 effort to understand patient needs .742
517 impact of work on other disciplines .685 .440
516 treat individuals with respect .677 .324 .464
506 going out of way .566 .353 .302
501 appearance .539 .330
518 degree of confidence instilled .485 .327 .408
502 accuracy .802
505 knowledge .763
503 timeliness .662 .354
525 teamwork -.368 .623 .495
524 level of commitment to getting job done .309 .590 .352
510 patient outcomes .373 .518
520 regard held for professional skill .302 .512 .487
512 responsiveness to other depts/disciplines .378 .804
511 respect for timeframes of others .399 .679
513 no hidden agendas .563
515 respect for other disciplines & roles .471 .558
523 effort to understand other workers .512 .362 .514
519 degree of flexibility .312 .417 .510 .319
514 giving feedback to others .343 .482 .384
508 keeping head down .700
521 ability to organise work activities .485 .552
Extraction Method: Principal Component Analysis. Rotation Method: Varimax with Kaiser Normalization. a Rotation converged in 7 iterations.

294
8.0 BIBLIOGRAPHY
Achrol, R.S. (1991), "Evolution of the Marketing Organization: New Forms for Dynamic Environments," Journal of Marketing, 55 (October), 77-93. Achrol, R.S. (1997), "Changes in the Theory of Interorganizational Relations in Marketing: Toward a Network Paradigm," Journal of the Academy of Marketing Science, 25 (1), 56-71. Achrol, R.S. and Kotler, P. (1999), "Marketing in the Network Economy," Journal of Marketing, 63, 146-163. Achrol, R. and Stern, L. (1988), "Environmental Determinants of Decision-Making Uncertainty in Marketing Channels," Journal of Marketing Research, 25 (February), 36-50. Albertson, D. (1989), "Taking It To the Top," Health Industry Today, July, 18-20. Albrecht, K. (1990), Service Within. Solving the Middle Management Leadership Crisis, Business One Irwin, Homewood, IL. Alderson, W. (1957), Marketing Behavior and Executive Action: A Functionalist Approach to Marketing Theory, Irwin, Homewood, IL., reprinted (1978) Arno Press, New York, NY. Alderson, W. and Cox, R. (1948), "Towards a Theory of Marketing," Journal of Marketing, 13 (October), 139-152. Alexander, R., Surface, F.M., Elder, R.F., and Alderson, W. (1940), Marketing, Ginn, Boston. Alreck, P. and Settle, R. (1995), The Survey Research Handbook, 2nd Edition, Irwin, Chicago, IL. Alwin, D.F. and Krosnick, J.A. (1991), “The Reliability of Survey Attitude Measurement: The Influence of Question and Respondent Attributes,” Sociological Methods and Research, 20, 139-181. Andaleeb, S.S. (1998), “Determinants of customer satisfaction with hospitals: a managerial model,” International Journal of Health Care Quality Assurance, 11 (6), 181-187. Anderson, E. W. and Sullivan, M.W. (1993), "The Antecedents and Consequences of Customer Satisfaction in Firms," Marketing Science, 12 (2), 125-143. Anderson, E. and Weitz, B. (1986), "Make-Or-Buy Decisions: Vertical Integration and Productivity," Sloan Management Review, 27 (Spring), 3-19. Anderson, E. and Weitz, B. (1992), "The Use of Pledges to Build and Sustain Commitment in Distribution Channels," Journal of Marketing Research, 29 (February), 18-34. Anderson, J.C. and Narus, J.A. (1984), “Power Antecedents in Channel Relationships: Equity and Social Exchange Perspectives.” In Proceedings of the Division of Consumer Psychology, J.

295
C. Anderson ed., Division of Consumer Psychology, American Psychological Association, 77-81. Anderson, J.C. and Narus, J.A. (1990), "A Model of Distributor Firm and Manufacturer Firm Working Relationships," Journal of Marketing, 54 (January), 42-58. Anderson, J., Rungtusanathan, M., and Schroeder, R. (1994), "A Theory of Quality Management Underlying the Deming Management Method," Academy of Management Review, 19 (August), 472-509. Anderson, P.F. (1983), "Marketing, Scientific Progress, and Scientific Method," Journal of Marketing, 47 (Fall), 18-31. Andreassen, T.W. (2000), “Antecedents to satisfaction with service recovery,” European Journal of Marketing, 34 (1/2), 156. Ardnt, J. (1978), "How Broad Should the Marketing Concept Be?" Journal of Marketing, 42 (January), 101-103. Argyris, C. (1993), On Organizational Learning, Blackwell, Oxford, UK. Armistead, C. and Clark, G. (1993), “Resource Activity Mapping: The Value Chain in Operations Strategy,” The Service Industries Journal, 13 (October), 221-239. Armstead, R., Elstein, P., and Gorman, J. (1995), "Toward a 21st Century Quality-Measurement System for Managed-Care Organizations," Health Care Financing Review, 16 (Summer), 25-37. Australian Council on Healthcare Standards (1989), The ACHS Quality Assurance Standard in Profile, ACHS. Australian Institute of Health and Welfare (1994), Australia's health 1994: the fourth biennial health report of the Australia Institute of Health and Welfare, AGPS, Canberra. Babakus, E. and Boller, G.W. (1992), "An Empirical Assessment of the SERVQUAL Scale," Journal of Business Research, 24 (May), 253-268. Babakus, E. and Mangold, W.G. (1989), “Adapting the ‘SERVQUAL’ Scale to Health Care Environment: An Empirical Assessment,” in P. Bloom, et al., eds., AMA Educators’ Proceedings, American Marketing Association, Chicago. Babakus, E. and Mangold, W.G. (1992), "Adapting the SERVQUAL Scale to Hospital Services: An Empirical Investigation," Health Services Research, 26 (6), 676-686. Bagozzi, R.P. (1975a), "Marketing as Exchange," Journal of Marketing, 39, (October), 32-39. Bagozzi, R.P. (1975b), "Is All Social Exchange Marketing? A Reply," Journal of the Academy of Marketing Science, 3, 4 (Fall), 315-326.

296
Baht, M.A. (2005), “Correlates of service quality in banks: an empirical investigation,” Journal of Service Research, 5 (1), 77-99. Bak, C., Vogt, L., George, W. and Greentree, I. (1994), "Management by Team: An Innovative Tool for Running a Service Organization Through Internal Marketing," Journal of Services Marketing, 8 (1), 37-47. Baker, J. (1987), “The Role of the Environment in Marketing Services: The Consumer Perspective,” in The Service Challenge: Integrating for Competitive Advantage, J.A Czepiel, C.A. Congram, and J. Shanahan, eds. American Marketing Association, Chicago, 79-84. Baker, M.J. (1985), Marketing: An Introductory Text, Macmillan, London. Ballantyne, D. (1997), "Internal Networks for Internal Marketing," Journal of Marketing Management, 13, 343-366. Ballantyne, D., Christopher, M., and Payne, A. (1995), "Improving the Quality of Services Marketing: Service (Re) design is the Critical Link," Journal of Marketing Management, 11, 7-24. Barksdale, H.C and Darden, B. (1971), "Marketers' Attitudes Toward the Marketing Concept," Journal of Marketing, 35 (October), 29-36. Barnes, B.R., Fox, M.T. and Morris, D.S. (2004), “Exploring the linkage between internal marketing, relationship marketing and service quality: a case study of a consulting organization,” Total Quality Management, 15 (5-6), 593-601. Bartels, R. (1944), "Marketing Principles,” Journal of Marketing, 9 (October) 47-53. Bartels, R. (1951), "Can Marketing Be a Science?" Journal of Marketing, 15 (January) 319-328. Bartels, R. (1962), The Development of Marketing Thought, Irwin, Homewood, Ill. Bartels, R. (1965), "Marketing Technology, Tasks, and Relationships," Journal of Marketing, 29, 1(January), 45-48. Bartels, R. (1970), "Influences on Development of Marketing Thought, 1900-1923" in Marketing Theory and Metatheory, Irwin, Homewood, Ill. Bartels, R. (1974),"The Identity Crisis in Marketing," Journal of Marketing, 38 (October), 73-76. Bartels, R. (1983), "Is Marketing Defaulting Its Responsibilities?" Journal of Marketing, 47 (Fall) 32-35. Bateson, J.E.G. (1977), "Do we need Service Marketing," in Marketing Consumer Services: New Insights, P. Eiglier, et al., eds., Marketing Science Institute, Cambridge, MA.

297
Bateson, J.E.G. (1979), “Why We Need Service Marketing,” in Conceptual and Theoretical Developments in Marketing, O.C. Ferrell, S.W. Brown, and C.W. Lamb, eds., American Marketing Association, Chicago, 131-134. Bateson, J.E.G. (1985), “Perceived Control and the Service Encounter,” in The Service Encounter,” J.A. Czepiel, M.R. Solomon, and C. Surprenant, eds., Lexington Books, 67-82. Bateson, J.E.G. (1999), Managing Services Marketing, 4th ed., Dryden, Orlando, FL. Beaton, M. and Beaton, C. (1995),"Marrying Service Providers and Their Clients: A Relationship Approach to Services Management," Journal of Marketing Management, 11, 55-70. Bebko, C.P. (2000), “Service intangibility and its impact on consumer expectations of service quality,” Journal of Services Marketing, 14 (1), 2000. Bejou, D., Wray, B. and Ingram, T. (1996), “Determinates of Relationship Quality: An Artificial Neural Network Analysis,” Journal of Business Research, 36 (June) 137-143. Bell, C.R. and Zemke, R. (1988),"Terms of Empowerment," Personnel Journal, (September) 76-83. Bell, M.L. and Emory, C.W. (1971), "The Faltering Marketing Concept," Journal of Marketing, 35 (October), 37-42. Bennett, R. (1996), “Relationship Formation and Governance in Consumer Markets: Transactional Analysis Versus the Behaviourist approach,” Journal of Marketing Management, 12, 417-436. Bennett, R. and Cooper, R.G. (1981), "Beyond the Marketing Concept," Business Horizons, 22 (June), 76-83. Bergen, M., Dutta, S., and Walker, O. Jr. (1992), "Agency Relationships in Marketing: A Review of the Implications and Applications in Agency Related Theories," Journal of Marketing, 56 (July), 1-24. Berling, R. (1993), "The Emerging Approach to Business Strategy: Building a Relationship Advantage," Business Horizons, 36 (4), 16-27. Berry, D. (1990), "Marketing Mix for the 90's Adds an S and 2 C's to the 4 P's," Marketing News, 24 (December), 10. Berry, L. L. (1980), "Services Marketing is Different," Business Magazine, 30 (May-June), 24-29. Berry, L. L. (1981), "The Employee as Customer," Journal of Retailing, 3, 1, 33-40. Berry, L. L. (1983), "Relationship Marketing," in Emerging Perspectives on Services Marketing, Leonard L. Berry, G. Lynn Shostack, and Gregory Upah, Eds., American Marketing Association, Chicago, IL.

298
Berry, L. L. (1986a),"Big Ideas in Services Marketing," Journal of Consumer Marketing, 3, 2. Berry, L. L. (1986b), "Retail Businesses are Service Businesses," Journal of Retailing, 62, 1. Berry, L .L (1995), "Relationship Marketing of Services- Growing Interest, Emerging Perspectives," Journal of the Academy of Marketing Science, 23 (4), 236-245. Berry, L.L. (1990), “Competing With Time-Saving Service,” Business, April-June, 3-7. Berry, L.L., and Parasuraman, A. (1991), Marketing Services: Competing Through Quality, The Free Press, New York, NY. Berry, L.L., and Parasuraman, A. (1993), "Building a New Academic Field-The Case of Services Marketing," Journal of Retailing, 69 (Spring), 13-60. Berry, L.L., Parasuraman, A., and Zeithaml, V.A. (1988),"The Service Quality Puzzle," Business Horizons, 31 (September-October), 35-43. Berry, L.L., Shostack, G.L. and Upah, G.D. eds. (1983), Emerging Perspectives on Services Marketing, American Marketing Association, Chicago, IL. Berry, L.L., Zeithaml, V.A., and Parasuraman, A. (1990), "Five Imperatives for Improving Service Quality," Sloan Management Review, 31 (Summer), 29-38. Bialeszewski, D. and Giallourakis, M. (1985), "Perceived Communication Skills and Resultant Trust Perceptions Within the Channel of Distribution," Journal of the Academy of Marketing Science, 13 (Spring), 206-217. Bickert, J. (1992), "Database Marketing: An Overview," in The Direct Marketing Handbook, Nash, E.L., Ed., McGraw-Hill, New York, NY, 137-77. Birkett, N.J. (1986), “Selecting the Number of Response Categories for a Likert-type Scale,” Proceedings of the American Statistical Association, 488-492. Bitner, M.J. (1986), “Consumer Responses to the Physical Environment in Service Settings,” in Creativity in Services Marketing, M. Venkatesan, D.M. Schmalensee, and C. Marshall, eds. American Marketing Association, Chicago, 89-93. Bitner, M.J. (1990), "Evaluating Service Encounters: The Effects of Physical Surroundings and Employee Responses," Journal of Marketing, 54 (April), 69-82. Bitner, M.J. (1992), "Servicescapes: The Impact of Physical Surroundings on Customers and Employees," Journal of Marketing, 56 (April), 57-71. Bitner, M.J. (1995), "Building Service Relationships: Its All About Promises," Journal of the Academy of Marketing Science, 23 (4), 246-251.

299
Bitner, M.J., Booms, B.H., and Mohr, L.A. (1994), "Critical Service Encounters: The Employee's View," Journal of Marketing, 58 (October), 95-106. Bitner, M.J., Booms, B.H., and Tetreault, M.S. (1990), "The Service Encounter: Diagnosing Favorable and Unfavorable Incidents," Journal of Marketing, 54 (January), 71-84. Bitner, M.J. and Hubbert, A.R. (1994), “Encounter Satisfaction versus Overall Satisfaction versus Quality: The Customer’s Voice.” In Service Quality: New Directions in Theory and Practice, Rust, R. and Oliver, R., editors, Sage, Thousand Oaks, CA. Bitner, M.J., Nyquist, J.D., and Booms, B.H. (1985), “The Critical Incident as a Technique for Analyzing the Service Encounter,” in Services Marketing in a Changing Environment, Bloch, T.M., Upah, G.D., and Zeithaml, V.A., eds. American Marketing Association, Chicago, 48-51. Blieszner, R. and Adams, R. eds. (1992), Adult Friendships, Sage, London. Bloemer, J. and de Ruyter, K. (1995), “Integrating Service Quality and Satisfaction: Pain in the Neck or Marketing Opportunity?” Journal of Consumer Satisfaction, Dissatisfaction, and Complaining Behavior, 8, 44-52. Blois, K.J. (1983),"The Structure of Firms and Their Marketing Policies," Strategic Management Journal, 4, 251-261. Blois, K.J. (1996),"Relationship Marketing in Organizational Markets: When is it Appropriate?" Journal of Marketing Management, 12, 161-173. Bolton, R.N. and Drew, J.H. (1991a),"A Longitudinal Analysis of the Impact of Service Changes on Customer Attitudes," Journal of Marketing, 55 (January), 1-9. Bolton, R.N. and Drew, J.H. (1991b),"A Multistage Model of Customers' Assessment of Service Quality and Value," Journal of Consumer Research, 17 (March), 375-384. Bolton, R.N. and Lemon, K.N. (1999), "A Dynamic Model of Customer's Usage of Services: Usage as an Antecedent and Consequence of Satisfaction," Journal of Marketing Research, 36 (2), 171-186. Booms, B.H. and Bitner, M.J. (1981),"Marketing Strategies and Organization Structures for Service Firms," in Marketing of Services, J.H. Donnelly and W.R. George, eds. American Marketing Association, Chicago, IL. Booms, B.H. and Bitner, M.J. (1982), “Marketing Services by Managing the Environment,” Cornell Hotel and Restaurant Administration Quarterly, 23 (May), 35-9. Bopp, K.D. (1990), "How Patients Evaluate the Quality of Ambulatory Medical Encounters: Patient Surveys," Journal of Health Care Marketing, 10 (1), 6-16. Borden, N.M. (1964), "The Concept of the Marketing Mix," Journal of Advertising Research, 4, June, 2-7.
300
Boscarino, J.A. (1992), "The Public's Perception of Quality Hospitals II: Implications for Patient Surveys," Hospital and Health Services Administration, 37 (1), 13-36. Boschoff, C. and Gray, B. (2004), “The relationship between service quality, customer satisfaction and buying intentions in the private hospital sector,” South African Journal of Business Management, 35 (4), 27-37. Boulding, W., Kalra, A., Staelin, R., and Zeithaml, V. (1993), "A Dynamic Process Model of Service Quality: From Expectations to Behavioral Intentions," Journal of Marketing Research, 30 (February), 7-27. Bourgue, L.B. and Clark, V.A. (1992), Processing Data: The Survey Example, Sage, Newbury Park, CA. Bowen, D.G., Chase, R.B., Cummings, T.G. and Associates (1990), Service Management Effectiveness: Balancing Strategy, Organization and Human Resources, Operations, and Marketing, Jossey-Bass, San Francisco, CA. Bowen, D.E. and Lawler, E.E. (1992), "The Empowerment of Service Workers: What, Why, How, and When," Sloan Management Review, Spring, 31-39. Bowen, D.E. and Lawler, E.E. (1995),"Empowering Service Employees," Sloan Management Review, Summer, 73-84. Bowen, D.E. and Schneider, B. (1988),"Services Marketing and Management: Implications for Organizational Behavior," Research in Organizational Behavior, 10, 43-80. Bowers, M. and Sean, J.E. (1992), “Generic versus Specific Dimensions of Service Quality: Does SERVQUAL cover Hospital Health Care?” Unpublished manuscript, Birmingham, AL. Bowers, M.R., Swan, J.E. and Koehler, W.F. (1994), “What attributes determine quality and satisfaction with health care delivery?” Health Care Management Review, 19 (4), 49-55. Boyatzis, R.E. (1998), Transforming Qualitative Information: Thematic analysis and code development, Sage, Thousand Oaks, CA. Boyle, B., Dwyer, R., Robicheaux, R., and Simpson, J. (1992), "Influence Strategies in Marketing Channels: Measures and Use in Different Relationship Structures," Journal of Marketing Research, 29 (November), 462-473. Brady, M. and Cronin, J. (2001), “Some new thoughts on conceptualising perceived service quality: a hierarchical approach,” Journal of Marketing, 65 (4), 34-39. Brand, R.R., Cronin, J.J., and Routledge, J.B. (1997), “Marketing to older patients: perceptions of service quality,” Health Marketing Quarterly, 15 (2), 1-31. Brensinger, R. and Lambert, D.M. (1990), “Can the SERVQUAL Scale Be Generalized to Business-to-Business Services?” In Knowledge Development in Marketing, AMA Educators’ Proceedings, Bearden, W., Deshpande, R., Madden, T.J., Varadarajan, P.R., Parasuraman, A.,

301
Folkes, V.S., Stewart, D.W., and Wilkie, W.L., eds., 289, American Marketing Association, Chicago, IL. Brinberg, D. and McGrath, J. (1985), Validity and the Research Process, Sage, Newbury Park, CA. Broderick, A.J. (1998), “Role theory, role management and service performance,” The Journal of Services Marketing, 12 (5), 348-361. Broderick, A.J. (1999), “Role Theory and the Management of Service Encounters,” The Service Industries Journal, 19 (2), 117-131. Brooks, R.F., Lings, I.N., and Botschen, M.A. (1999), “Internal Marketing and Customer Driven Wavefronts,” The Service Industries Journal, 19 (4), 49-67. Brown, S. W. and Bond, E.U. III. (1995), “The Internal Market/External Market Framework and Service Quality: Toward Theory in Services Marketing,” Journal of Marketing Management, 11, 25-39. Brown, S.W., Bronkesh, S.J., Nelson, A. and Wood, S.D. (1993), Patient Satisfaction Pays: Quality Service for Practice Success, Aspen Publishers, Gaithersburg, MD. Brown, S.W. and Swartz, T.A. (1989) "A Gap Analysis of Professional Service Quality," Journal of Marketing, 63, 92-98. Brown, T.J., Churchill, G.A. Jr., and Peter, J.P. (1993),"Research Note: Improving the Measurement of Service Quality," Journal of Retailing, 69 (1), 127-139. Bruhn, M. (2003), “Internal service barometers: Conceptualization and empirical results of a pilot study in Switzerland,” European Journal of Marketing, 37 (9), 1187-1204. Bruhn, M. and Georgi, D. (2006), Services marketing: Managing the service value chain, Prentice Hall, Harlow, England. Buchanan, L. (1992),"Vertical Trade Relationships: The Role of Dependence and Symmetry in Attaining Organizational Goals," Journal of Marketing Research, 29 (February), 65-75. Buell, V.P. ed. (1986), Handbook of Modern Marketing, McGraw-Hill, New York, NY. Burner, S., and Waldo, D. (1995),"National Health Expenditures Projections: 1994-2005," Health Care Financing Review, 16 (Summer), 221-242. Buttle, F. (1996a), “Relationship Marketing.” In Buttle, F. (ed.), Relationship Marketing. Theory and Practice. Paul Chapman Publishing, London, 1-16. Buttle, F. (1996b), “SERVQUAL: review, critique, research agenda,” European Journal of Marketing, 30 (1), 8-32.

302
Calonius, H. (1988),"A Buying Process Model," in Innovative Marketing-A European Perspective, Blois, K. and Parkinson, S., eds., European Marketing Academy, University of Bradford, England, 86-103. Camilleri, D. and O’Callaghan, M. (1998), “Comparing public and private care service quality,” International Journal of Health Care Quality Assurance, 11 (4), 127-133. Camp, R. (1989), Benchmarking: The Search for Industry Best Practices That Lead to Superior Performance, Quality Press, Milwaukee, WI. Cannon, D.F. (2002), “Expanding Paradigms in Providing Internal Service,” Managing Quality Service, 12 (2), 87-99. Cannon, J.P., Achrol, R.S. and Gundlach, G.T. (2000), “Contracts, Norms, and Plural Form Governance, “Journal of the Academy of Marketing Science, 28 (2), 180-194. Capon, N., Farley, J., Hulbert, J., and Lei, D. 1991),"In Search of Excellence Ten Years Later: Strategy and Organization Do Matter," Management Decision, 29(4), 12-21. Carman, J.M. (1973), "On the Universality of Marketing," Journal of Contemporary Business, 2 (Autumn), 1-16. Carman, J.M. (1990), "Consumer Perceptions of Service Quality: An Assessment of the SERVQUAL Dimensions," Journal of Retailing, 66 (Spring), 33-55. Carman, J.M. (2000), “Patient perceptions of service quality: combining the dimensions,” Journal of Services Marketing, 14 (4), 337-352. Carmines, E.G. and Zeller, R.A. (1979), Reliability and Validity Assessment, Sage University series on Quantitative Applications in the Social Sciences, 07-017, Sage Publications, Beverly Hills, CA. Caruana, A. and Pitt, L. (1997), “INTQUAL – an internal measure of service quality and the link between service quality and business performance,” European Journal of Marketing, 31 (8), 604-616. Cate, R. and Lloyd, S. (1992), Courtship, Sage, London. Cavana, R.Y., Delahaye, B.L. and Sekaran, U. (2000), Applied Business Research: Qualitative and Quantitative Methods, Wiley, Brisbane. Chang, T. and Chen, S. (1998), “Market Orientation, Service Quality and Business Profitability: A Conceptual Model and Empirical Evidence,” Journal of Services Marketing, 12, 246-264. Chase, R. (1978),"Where Does the Customer Fit in a Service Operation," Harvard Business Review, 56 (November-December), 137-42.

303
Chaston, I. (1994), “Internal customer management and service gaps within the UK manufacturing sector,” International Journal of Operations and Production, 14 (9), 45-56. Chaudrey-Lawton, R., Lawton, R., Murphy, K. and Terry, A. (1992), Quality: Change through Teamwork, Century Books. Chillingerian, J. (2000), “Evaluating Quality Outcomes against Best Practice: A New Frontier,” in The Quality Imperative: Measurement and Management of Quality in Healthcare, J.R. Kimberly and E. Minvielle, eds. Imperial College Press, London, 141-167. Chiou, J. and Spreng, R. (1996), “The Reliability of Difference Scores: A Re-examination,” Journal of Consumer Satisfaction, Dissatisfaction and Complaining Behavior, 9, 158-167. Christopher, M., Payne, A., and Ballantyne, D. (1994), Relationship Marketing: Bringing Quality, Customer Service, and Marketing Together, Butterworth-Heinemann, London. Christy, R., Oliver, G. and Penn, J. (1996),"Relationship Marketing in Consumer Markets," Journal of Marketing Management, 12, 175-187. Churchill, G.A. and Surprenant, C. (1982), “An Investigation into the Determinants of Customer Satisfaction,” Journal of Marketing Research, 29 (November), 491-504. Clarke, R.N. and Shyavitz, L. (1987), "Health care marketing: lots of talk, any action?" Health Care Management Review, 12(1), 31-36. Clinton, M. and Scheive, D. (1995), Management in the Australian Health Care Industry, Harper Educational, Sydney. Collier, D.A. (1991),"New Marketing Mix Stresses Service," The Journal of Business Strategy, 12 (March-April), 42-45. Compton, F., George, W., Gronroos, C. and Karvinen, M. (1987),"Internal Marketing," in Czepiel, J., Congram, C. and Shanahan, J., Eds., The Services Challenge: Integrating for Competitive Advantage, American Marketing Association, Chicago, IL., 7-12. Converse, P.D. (1951), "Development of Marketing Theory: Fifty Years of Progress," in Changing Perspectives in Marketing, Wales H., ed., University of Illinois Press, Urbana, Ill., 1-31. Cook, T.D. and Reichardt, C.S. (1979), Eds., Qualitative and Quantitative Methods in Evaluation Research, Sage, Beverly Hills, CA. Cooper, D. R. and Schindler, P.S. (2001), Business Research Methods, McGraw-Hill Irwin, Singapore. Cooper, P.D. (1984), "Marketing from Inside Out," Profiles in Hospital Marketing, October, 71-73.
304
Cooper, P.D., Jones, K.M. and Wong, J.K. (1984), An Annotated and Extended Bibliography of Health Care Marketing, American Marketing Association, Chicago, IL. Coughlan, A.T., Anderson, E., Stern, L.W. and El-Ansary, A.I. (2001), Marketing Channels, 6th ed., Prentice-Hall, Upper Saddle River, NJ. Counte, M.A., Glandon, G.L., Olseke, D.M., and Hill, J.P. (1992), "Total Quality Management in a Health Care Organization: How Are Employees Affected?" Hospital and Health Services Administration, 37 (4), 603-618. Creswell, J.W. (1994), Research Design: Qualitative and Quantitative Approaches, Sage Publications, Thousand Oaks, CA. Cronin, J. J. Jr. (2003), “Looking back to see forward in services marketing: some ideas to consider,” Managing Service Quality, 13 (5), 332-337. Cronin, J.J Jr., and Taylor, S.A. (1992), "Measuring Service Quality: A Re-examination and Extension," Journal of Marketing, 56 (July), 55-68. Cronin, J.J. Jr., and Taylor, S.A. (1994), "SERVPERF versus SERVQUAL: Reconciling Performance-Based and Perceptions-Minus-Expectations Measurement of Service Quality," Journal of Marketing, 58 (January), 125-131. Crosby, L.A., Evans, K.R., and Cowles, D. (1990), "Relationship Quality in Services Selling: An Interpersonal Influence Perspective," Journal of Marketing, 54 (July), 68-81. Crosby, L.A., and Stephens, N. (1987), "Effects of Relationship Marketing on Satisfaction, Retention, and Prices in the Life Insurance Industry," Journal of Marketing Research, 24 (November), 404-411. Crosby, P. (1979), Quality is Free, McGraw-Hill, New York. Crosby, P. (1984), Quality is Free: The Art of Making Quality Certain, The New American Library, New York, NY. Cross, J. and Walker, B. (1987),"Service Marketing and Franchising: A Practical Business Marriage," Business Horizons, 30 (November/December). Culliton, J.W. (1948), The Management of Marketing Costs, Harvard University, Boston, MA. Cunningham, L. (1991), The Quality Connection in Health Care: Integrating Patient Satisfaction and Risk Management, Jossey-Bass, San Francisco, CA. Curry, A., Stark, S. and Summerhill, L. (1999), “Patient and Stakeholder Consultation in Healthcare,” Managing Service Quality, 9 (5), 327-336. Czepiel, J.A. (1980),"Managing Customer Satisfaction in Consumer Service Businesses," Report 80-109, September, Marketing Science Institute, Cambridge, MA.
305
Czepiel, J.A. (1990), "Service Encounters and Service Relationships: Implications for Research," Journal of Business Research, 20 (January), 13-21. Czepiel, J.A., Congram, C.A. and Shanahan, J. eds. (1987), The Services Challenge: Integrating for Competitive Advantage, American Marketing Association, Chicago, IL. Czepiel, J.A., Solomon, M.R. and Surprenant, C.F., eds., (1985), The Service Encounter: Managing Employee/Customer Interaction in Service Businesses, Lexington Books, Lexington, MA. Dabholkar, P.A. (1995), “The Convergence of Customer Satisfaction and Service Quality Evaluations with Increasing Customer Patronage,” Journal of Consumer Satisfaction, Dissatisfaction and Complaining Behavior, 8, 32-43. Dabholkar, P. A. (1996), "Consumer Evaluations of New Technology-Based Self-Service Options: An Investigation of Alternative Models of Service Quality," International Journal of Research in Marketing, 13, 29-51. Dabholkar, P., Johnston, W. and Cathey, A. (1994), "The Dynamics of Long-Term Business-to-Business Exchange Relationships," Journal of the Academy of Marketing Science, 22, 130-145. Dabholkar, P., Shepherd, C.D., and Thorpe, D. (2000), “A Comprehensive Framework for Service Quality: An Investigation of Critical Conceptual and Measurement Issues through a Longitudinal Study,” Journal of Retailing, 76 (2), 139-173. Dabholkar, P., Thorpe, D. and Rentz, J. (1996), “A Measure of Service Quality for Retail Stores: Scale Development and Validation,” Journal of the Academy of Marketing Science, 24 (1), 3-16. Dant, R.P., Lumkin, J.R. and Rawwas, M. (1998), “Sources of Generalized Versus Issue-Specific Dis/Satisfaction in Service Channels of Distribution: A Review and Comparative Investigation,” Journal of Business Research, 42 (May), 7-23. Day, G. (1994), "The Capabilities of Market-driven Organizations," Journal of Marketing, 58, 37-52. Day, G.S. and Wensley, R. (1983), "Marketing Theory with a Strategic Orientation," Journal of Marketing, 47, Fall, 79-89. Dean, A.M. (1999), “The applicability of SERVQUAL in different healthc care environments,” Health Marketing Quarterly, 16 (3), 1-21. Dean, J. (1951), Managerial Economics, Prentice-Hall, Englewood Cliffs, NJ. De Burca, S. (1995), "Services Management in the Business-To-Business Sector: From Networks to Relationship Marketing," in Understanding Services Management, Glynn, W.J. and Barnes, J.G., eds., Wiley, Chichester, England, 393-419.

306
Deeble, J. (1999), “Medicare: Where have we been? Where are we going?” Australian and New Zealand Journal of Public Health, 23 (6), 563-570. Deming, W. (1986), Out of the Crisis, Massachusetts Institute of Technology, Center for Advanced Engineering Study. Deng, S. and Dart, J. (1994), "Measuring Market Orientation: A Multi-Factor, Multi-Item Approach," Journal of Marketing Management, 10(8), 725-742. Denzin, N.K. (1989), The Research Act: A Theoretical Introduction to Sociological Methods, 3rd Edition, Prentice-Hall, Englewood Cliffs, NJ. Denzin, N.K. and Lincoln, Y.S. Eds. (1994), Handbook of Qualitative Research, Sage, Thousand Oaks, CA. Denzin, N.K. and Lincoln, Y.S. (2003), Strategies of Qualitative Inquiry, 3rd ed., Sage, Thousand Oaks, CA. De Ruyter, K. (1996), “Focus versus nominal group interviews: a comparative analysis,” Marketing Intelligence and Planning, 14 (6), 44-50. DeSouza, G. (1992),"Designing a Customer Retention Plan," The Journal of Business Strategy, March/April, 24-28. Deshpande, R. (1983), “‘Paradigms Lost’: On Theory and Method in Research in Marketing,” Journal of Marketing, 47 (Fall), 101-110. Deshpande, R., Farley, J. and Webster, F. (1993),"Corporate Culture, Customer Orientation and Innovativeness in Japanese Firms: a Quadrad Analysis," Journal of Marketing, 57, 23-37. Deshpande, R. and Webster, F. (1989), "Organizational Culture and Marketing: Defining the Research Agenda," Journal of Marketing, 53 (January), 3-15. DeVellis, R. (1991), Scale Development: Theory and Applications, Sage, Newbury Park, CA. Dodds, W.B. and Grewal, D. (1991), “Effects of Price, Brand, and Sore Information on Buyer’s Product Evaluation,” Journal of Marketing Research, 28 (August), 307-319. Donabedian, A. (1980), Explorations in Quality Assessment and Monitoring Vol. 1, Health Administration Press, Ann Arbor, MI. Donnelly, J. (1976), "Marketing Intermediaries in Channels of Distribution for Services," Journal of Marketing, 40 (January). Donnelly, J.H. Jr. and George, W.R., Eds. (1981), Marketing of Services, American Marketing Association, Chicago, IL. Dorenfest, S. (1990), "Vendors Must Make Good on Automated Medical Record," Modern Healthcare, April, 29.
307
Doucette, W. (1996), “The Influence of Relational Norms and Trust on Customer Satisfaction in Interfirm Exchange Relationships,” Journal of Consumer Satisfaction, Dissatisfaction, and Complaining Behavior, 9, 95-103. Doyle, S., and Boudreau, J. (1989), "Hospital/Supplier Partnership," Journal of Health Care Marketing, 9, 1, 42-47. Dube, L., Johnson, M.D., and Renaghan, L.M. (1999), “Adapting the QFD approach to extended service transactions,” Production and Operations Management, 8 (Fall), 301-317. Duck, S. ed. (1994a), Dynamics of Relationships, Sage, London. Duck, S. (1994b), Meaningful Relationships: Talking Sense and Relating, Sage, London. Duddy, E.A. and Revzan, D.A. (1947), Marketing: An Institutional Approach, McGraw-Hill, New York. Dunn, M., Norburn, D. and Birley, S. (1994),"The Impact of Organizational Values, Goals, and Climate on Marketing Effectiveness," Journal of Business Research, 30, 131-141. Dwyer, F.R., Schurr, P., and Oh, S. (1987), "Developing Buyer-Seller Relationships," Journal of Marketing, 51 (April), 11-27. Easterby-Smith, M., Thorpe, R. and Lowe, A. (1994), Management Research: An Introduction, Sage, London. Edgett, S. (1994), "The Traits of Successful New Service Development," Journal of Services Marketing, 8, 3, 40-49. Edgett, S. and Jones, S. (1991), "New Product Development in the Financial Services Industry: A Case Study," Journal of Marketing, 7, 3. Edvardsson, B. (2005), “Service quality: beyond cognitive assessment,” Managing Service Quality, 15 (2), 127-131. Edvardsson, B., Larsson, G. and Settlind, S. (1997), “Internal service quality and the psychological work environment: an empirical analysis of conceptual interrelatedness,” The Services Industries Journal, 17 (2), 252-263. Eiglier, P. (1977), "A Note on the Commonality of Problems in Service Management: A Field Study," in Marketing Consumer Services: New Insights, P. Eiglier, et al., eds., Marketing Science Institute, Cambridge, MA. Eiglier, P., Langeard, E., Lovelock, C.H., Bateson, J.E.G. and Young, R.F. (1977), Marketing Consumer Services: New Insights, Marketing Science Institute, Cambridge, MA.

308
Eiglier, P. and Langeard, E. (1977), "A New Approach to Service Marketing," in Marketing Consumer Services: New Insights, P. Eiglier, et al., eds., Marketing Science Institute, Cambridge, MA. Eisner, E.W. (1990), “The Meaning of Alternative Paradigms for Practice,” in The Paradigm Dialog, E.G. Guba, Ed., Sage, Newbury Park, CA. Elbeck, M. (1987), “An Approach to Client Satisfaction Measurement as an Attribute of Health Services Quality,” Health Care Management Review, 12 (3), 47-52. Enis, B.M. (1981), "Deepening the Concept of Marketing," Journal of Marketing, 37, 57-62. Enis, B.M., and Roering, K.J. (1981), "Services Marketing: Different Products, Similar Strategy," in J.H. Donnelly and W. R. George, eds., Marketing of Services, American Marketing Association, Chicago, IL., 1-4. Erevelles, S. and Leavitt, C. (1992), "A Comparison of Current Models of Consumer Satisfaction/Dissatisfaction," Journal of Consumer Satisfaction, Dissatisfaction and Complaining Behavior, 5, 104-114. Etgar, M. (1979), "Channel Domination and Countervailing Power in Distribution Channels," Journal of Marketing Research, 13 (February), 254-262. Ewing, M.T. and Caruana, A. (1999), “An internal marketing approach to public sector management,” The International Journal of Public Sector Management, 12 (1), 17-26. Farner, S., Luthans, F. and Sommer, S.M. (2001), “An empirical assessment of internal customer service”, Managing Service Quality, 11 (5), 350-358. Feigenbaum, A. (1963), Total Quality Control, 3rd Edition, McGraw-Hill, New York, NY. Felton, A.P. (1959), "Making the Marketing Concept Work," Harvard Business Review, July-August, 55-65. Ferber, R. (1970), "The Expanding Role of Marketing in the 1970's," Journal of Marketing, 34, January, 29-30. Ferrell, O.C., and Zey-Ferrell, M. (1977), "Is All Social Exchange Marketing," Journal of the Academy of Marketing Science, 5, 4 (Fall), 307-314. Fielding, N.G. and Fielding, J.L. (1986), Linking Data, Qualitative Research Methods Series 4, Sage, Newbury Park, CA. Filstead, W.J. (1979), “Qualitative Methods: a Needed Perspective in Evaluation Research,” in Cook, T.D. and Reichardt, C.S., Eds., Qualitative and Quantitative Methods in Evaluations Research, Sage, Beverly Hills, CA. Finn, D.W. and Lamb, C.W. Jr. (1991), "An Evaluation of the SERVQUAL Scales in a Retailing Setting," Advances in Consumer Research, 18, 483-490.

309
Fiol, C. and Lyles, M. (1985),"Organizational Learning," Academy of Management Review, 10, 803-813. Firnstahl, T.W. (1989),"My Employees Are My Service Guarantee," Harvard Business Review, July-August, 28-34. Fischoff, B. and Beyth, R. (1975),"I New It Would Happen- Remembered Probabilities of Once-future Things," Organizational Behavior and Human Performance, 13, 1-16. Fisk, R.P. and Tansuhaj, P.S. (1985), Services Marketing: An Annotated Bibliography, American Marketing Association, Chicago, IL. Fisk, R.P., Brown, S. W., and Bitner, M.J. (1993), "Tracking the Evolution of the Services Marketing Literature," Journal of Retailing, 69 (Spring) 61-103. Fisk, R.P., and Walden, K.D. (1979), "Naive Marketing: Further Extension of the Concept of Marketing," in Ferrell, O.C., Brown, S.W. and Lamb, C.W., eds., Conceptual and Theoretical Developments in Marketing, 459-473. Fisk, R.P and Young, C.E. (1985), “Disconfirmation of Equity Expectations: Effects of Consumer Satisfaction with Services,” in Hirschman, E.C and Holbrook, M.B. eds., Advances in Consumer Research, 12, Association for Consumer Research, Provo, UT, 340-345. Flood, P., Turner, T., Ramamoorthy, N. and Pearson, J. (2001), “Causes and consequences of psychological contracts among knowledge workers in the high technology and financial services industry,” International Journal of Human Resource Management, 12 (7), 1152-61. Ford, J. and Baucus, D. (1987),"Organizational Adaption to Performance Downturns: an Interpretation-based Perspective," Academy of Management Review, 12, 366-380. Foreman, S.K. and Money, A.H. (1995), “Internal Marketing: Concepts, Measurement and Application,” Journal of Marketing Management, 11, 755-768. Fornell, C. and Didow, N.M.(1980), "Economic Constraints on Consumer Complaining Behavior," in Advances in Consumer Research, Vol. 7, Olson, J.C., Ed., Association for Consumer Research, Ann Arbor, MI, 318-323. Fornell, C. and Robinson, W.T. (1983), "Industrial Organization and Consumer Satisfaction/Dissatisfaction," Journal of Consumer Research, 9(March), 403-412. Forsha, H.I. (1991), The Pursuit of Quality Through Personal Change, ASQC Quality Press, Milwaukee, WI. Fournier, S. and Mick, D.G. (1999), “Rediscovering Satisfaction,” Journal of Marketing, 63 (Oct), 5-23. Fowler, F. J. Jr. (1993), Survey Research Methods, 2nd Edition, Applied Social Research Methods Series Volume 1, Sage, Newbury Park, CA.

310
Foxall, G. (1989), “Marketing’s Domain,” European Journal of Marketing, 23 (8), 7-22. Franceschini, F. and Rossetto, S. (1997), “On-line service quality control: the ‘Qualitometro’ method.” De Qualitate, 6 (1), 43-57. Franceschini, F., Cignetti, M. and Caldara, M. (1998), “Comparing Tools for Service Quality Evaluation,” International Journal of Quality Science, 3 (4), 356-367. Frazier, G. (1983), "Interorganizational Exchange Behavior in Marketing Channels: A Broadened Perspective," Journal of Marketing, 47 (Fall), 68-78. Frazier, G. (1999), “Organizing and managing channels of distribution,” Journal of the Academy of Marketing Science, 27 (2), 226-240. Frazier, G. and Antia, K. (1995), "Exchange Relationships and Interfirm Power in Channels of Distribution," Journal of the Academy of Marketing Science, 23 (4), 321-326. Frazier, G. and Rhody, R. (1991),"The Use of Influence Strategies in Interfirm Relationships in Industrial Product Channels," Journal of Marketing, 55 (January), 52-69. Frazier, G. and Summers, J. (1984), "Interfirm Influence Strategies and Their Applications Within Distribution Channels," Journal of Marketing, 48 (Summer), 43-45. Frazier, G. and Summers, J. (1986), "Perceptions of Interfirm Power and Its Use Within a Franchise Channel of Distribution," Journal of Marketing Research, 23 (May), 169-176. Freeman, K.D. and Dart, J. (1993), “Measuring the Perceived Quality of Professional Business Services,” Journal of Professional Services Marketing, 9 (1), 27-47. Friedman, H.M. (1984), "Ancient Marketing Practices: The View from Talmudic Times," Journal of Public Policy and Marketing, 3, 194-204. Friedman, M. (1995),"Issues in Measuring and Improving Health Care Quality," Health Care Financing Review, 16 (Summer), 1-13. Frost, F.A. and Kumar, M. (2000), “INTSERVQUAL – an internal adaptation of the GAP model in a large service organization,” Journal of Services Marketing, 14 (5), 358-377. Fullerton, R. (1988), "How Modern is Modern Marketing?" Marketing's Evolution and the Myth of the Production Era," Journal of Marketing, 52, January, 108-125. Furse, D., Burcham, M., Rose, R., and Oliver, R. (1994), "Leveraging the Value of Customer Satisfaction Information," Journal of Health Care Marketing, 14 (Fall), 16-20. Gabbott, M. and Hogg, G. (1996), “The Glory Stories: Using Critical Incidents to Understand Service Evaluation in the Primary Healthcare Context,” Journal of Marketing Management, 12, 493-503.
311
Gabbott, M. and Hogg, G. (2000), “An empirical investigation of the impact of non-verbal communication on service evaluation,” European Journal of Marketing, 34 (3/4), 384-398. Gaedeke, R. (1977), Marketing in Private and Public Non-Profit Organizations, Goodyear, Santa Monica. Gagel, B. (1995),"Health Care Quality Improvement Program: A New Approach," Health Care Financing Review, 16 (Summer), 15-23. Ganeson, S. (1993),"Negotiation Strategies and the Nature of Channel Relationships," Journal of Marketing Research, 30 (May), 183-202. Ganesan, S. (1994),"Determinants of Long-Term Orientation in Buyer-Seller Relationships," Journal of Marketing, 58 (April), 1-19. Garbarino, E. and Johnson, M.S. (1999), “The Different Roles of Satisfaction, Trust, and Commitment in Customer Relationships,” Journal of Marketing, 63 (April), 70-87. Garvin, D.A. (1983), “Quality on the Line,” Harvard Business Review, 61 (September-October), 65-73. Garvin, D.A. (1987), "Competing on the Eight Dimensions of Quality," Harvard Business Review, 65 (November-December), 101-109. Garvin, D.A. (1993), "Building a Learning Organization," Harvard Business Review, 71 (July-August), 78-91. Gaski, J. (1984),"The Theory of Power and Conflict in Channels of Distribution," Journal of Marketing, 48 (Summer), 9-28. Gassenheimer, J., Calantone, R. and Scully, J. (1995), “Supplier Involvement and Dealer Satisfaction,” Journal of Business and Industrial Marketing, 10 (2), 7-19. George, W.R. (1990), "Internal Marketing and Organizational Behavior: A Partnership in Developing Customer-Conscious Employees at Every Level," Journal of Business Research, 20 (January) 63-70. George, W.R. and Barksdale, H. C. (1978),"Marketing Activities in the Service Industries," Journal of Marketing, 38 (October), 65-70. George, W. and Berry, L. (1981),"Guidelines for the Advertising of Services," Business Horizons, 24 (July-August). George, W. and Compton, F. (1985),"How to Initiate A Marketing Perspective in a Health Service Organization," Journal of Health Care Marketing, 5 (Winter), 29-37. George, W.R. and Marshall, C.E. eds. (1984), Developing New Services, American Marketing Association, Chicago, IL.

312
George, W.R., Weinberger, M.G., and Kelly, J.P. (1985),"Consumer Risk Perceptions: Managerial Tool for the Service Encounter," in The Service Encounter: Managing Employee/Customer Interaction in Service Businesses, Czepiel, J.A., Solomon, M.R. and Surprenant, eds., Lexington Books, Lexington, MA. Geyskens, I., Steenkamp, J.E.M. and Kumar, N. (1999), “A Meta-Analysis of Satisfaction in Marketing Channel Relationships,” Journal of Marketing Research, 36 (May), 223-238. Gilbert, D. and Bailey, N. (1990), "The Development of Marketing-A Compendium of Historical Approaches," The Quarterly Review of Marketing, Winter. Gilbert, F., Lumpkin, J., and Dant, R. (1992),"Adaption and Customer Expectations of Health Care Options," Journal of Health Care Marketing, 12 (September), 46-55. Gilbert, G. R. (2000), “Measuring internal customer satisfaction,” Managing Service Quality, 10 (3), 178-186. Gilbert, G.R. and Parhizgari, A.M. (2000), “Organizational effectiveness indicators to support service quality,” Managing Service Quality, 10 (1), 46-51. Gilmore, A. and Carson, D. (1996), “Integrative qualitative methods in a services context,” Marketing Intelligence and Planning, 14 (6), 21-26. Gilmore, A. and Carson, D. (1995), "Managing and Marketing to Internal Customers," in Understanding Services Management, Glynn, W.J. and Barnes, J.G., eds., Wiley, Chichester, England, 295-321. Gittell, J.H. (2002), “Relationship Between Service Providers and Their Impact on Customers,” Journal of Services Research, 4 (4), 299-311. Gold, M., and Wooldridge, J. (1995),"Surveying Consumer Satisfaction to Assess Managed-Care Quality: Current Practices," Health Care Financing Review, 16 (Summer), 155-173. Gordon, G. and DiTomaso, N. (1992),"Predicting Corporate Performance from Organizational Culture," Journal of Management Studies, 29, 783-798. Graham, P. (1993), Australian Marketing: Critical Essays, Readings and Cases, Prentice-Hall, Sydney. Greene, W.E., Walls, G.D. and Schrest, L.J. (1994),"Internal Marketing: The Key to External Marketing Success," Journal of Services Marketing, 8 (4), 5-13. Greenbaum, T.L. (1995), The Handbook for Focus Group Research, Lexington, New York, NY. Greenley, G. (1995),"Forms of Market Orientation in UK Companies," Journal of Management Studies, 32(1), 47-66.

313
Greenley, G. and Foxall, G. (1996),"Consumer and Non-consumer Stakeholder Orientation in UK Companies," Journal of Business Research Greenley, G. and Oktemgil, M. (1996),"A Development of the Domain of Marketing Planning," Journal of Marketing Management, 12, 29-51. Gremler, D.D., Bitner, M.J., and Evans, K.R. (1994), "The Internal Service Encounter," International Journal of Services Industry Management, 5 (2), 34-56. Gremler, D. D. and Gwinner, K. P. (2000), “Customer-Employee Rapport in Service Relationships,” Journal of Service Research, 3 (1), 82-104. Grether, E.T. (1949), "A Theoretical Approach to the Analysis of Marketing," in Theory in Marketing, Cox, R. and Alderson, W., eds., Irwin, Chicago. Groth, J.C. and Dye, R.T. (1999a), “Service Quality: perceived value, expectations, shortfalls, and bonuses,” Managing Service Quality, 9 (4), 274-285. Groth, J.C. and Dye, R.T. (1999b), “Service quality: guidelines for marketers,” Managing Service Quality, 9 (5), 337-351. Gronroos, C. (1980), "Designing a Long-Range Marketing Strategy for Services," Long-Range Planning, 13, 36-42. Gronroos, C. (1981), "Internal Marketing-An Integral Part of Marketing Theory," in J.H. Donnelly and W.R. George, eds., Marketing of Services, American Marketing Association, Chicago, IL, 236-38. Gronroos, C. (1982), Strategic Management and Marketing in Service Sector, Marketing Science Institute, Cambridge, MA. Gronroos, C. (1983), "Seven Key Areas of Research According to the Nordic School of Service Marketing," in Emerging Perspectives on Services Marketing, American Marketing Association, Chicago, IL. Gronroos, C. (1984), "A Service Quality Model and Its Marketing Implications," European Journal of Marketing, 18 (4), 36-44. Gronroos, C. (1985), "Internal Marketing Theory and Practice," in Services Marketing in a Changing Environment, Bloch, T.M., et al., eds., American Marketing Association, Chicago, IL. Gronroos, C. (1990a), Service Management and Marketing: Managing the Moments of Truth in Service Competition, Lexington Books, Lexington, MA. Gronroos, C. (1990b), "Relationship Approach to Marketing in Service Contexts: The Marketing and Organizational Behavior Interface," Journal of Business Research, 20 (January), 3-11.

314
Gronroos, C. (1991), "The Marketing Strategy Continuum: A Marketing Concept for the 1990's," Management Decision, 29 (1), 7-13. Gronroos, C. (1994), "Quo Vadis, Marketing? Toward a Relationship Marketing Paradigm." Journal of Marketing Management, 10, 347-360. Gronroos, C. (1995), "Relationship Marketing: The Strategy Continuum," Journal of the Academy of Marketing Science, 23 (4), 252-254. Gronroos, C. (1997), "Value-driven Relational Marketing: from Products to Resources and Competencies," Journal of Marketing Management, 13, 407-419. Gronroos, C. (2001), Services Marketing and Management: A Customer Relationship Management Approach, Wiley, Chichester. Gross, R. and Nirel, N. (1998), “Quality of care and patient satisfaction in budget-holding clinics,” International Journal of Health Care Quality Assurance, 11 (3), 77-89. Grove, S.J. and Fisk, R.P. (1983), “The Dramaturgy of Services Exchange: An Analytical Framework for Services Marketing,” in Emerging Perspectives in Services Marketing, L. Berry, L. Shostack, and G.D. Upah, eds., American Marketing Association, Chicago. Guba, E.G., (1990), “The Alternative Paradigm Dialog,” in The Paradigm Dialog, E.G. Guba, Ed., Sage, Newbury Park, CA. Guba, E.G. and Lincoln, Y.S. (1989), Fourth Generation Evaluation, Sage, Newbury Park, CA. Guba, E.G. and Lincoln, Y.S. (1994), “Competing Paradigms in Qualitative Research,” in Denzin, N.K and Lincoln, Y.S. Eds., Handbook of Qualitative Research, Sage, Thousand Oaks, CA. Guest, D. (1998), “Beyond HRM: commitment and the contract culture,” in Sparrow, P. and Marchington, M., Eds., Human Resource Management: The New Agenda, Financial Times Publishing, London. Guest, D. and Conway, N. (1997), Employee Motivation and the Psychological Contract, IPD, London. Gummesson, E. (1981), "Marketing Cost Concept in Service Firms," Industrial Marketing Management, 10, 175-82. Gummesson, E. (1987a), "The New Marketing: Developing Long Term Interactive Relationships," Long Range Planning, 20, 4, 10-20. Gummesson, E. (1987b), Academic Researcher and/or Management Consultant? Chartwell-Bratt, London.

315
Gummesson, E. (1991), Qualitative Methods in Management Research, Sage, Newbury Park, CA. Gummesson, E. (1995), "Truths and Myths in Service Quality," Journal for Quality and Participation, October/November, 18-23. Gummesson, E. (1998), "Implementation Requires a Relationship Marketing Paradigm," Journal Academy of Marketing Science, 26 (3), Summer, 242-249. Gummesson, E. and Gronroos, C. (1987), "Quality of Services-Lessons from the Products Sector," in Add Value to Your Service, C.F. Surprenant, Ed., American Marketing Association, Chicago, IL. Gundlach, G. and Murphy, P. (1993), "Ethical and Legal Foundations of Relational Marketing Exchanges,' Journal of Marketing, 57 (October), 35-46. Gundlach, G., Achrol, R., and Mentzer, J. (1995), "The Structure of Commitment in Exchange," Journal of Marketing, 59 (1), 78-92. Gupta, A., McDaniel, J.C. and Herath, S.K. (2005), “Quality management in service firms: sustaining structures of total quality service,” Managing Service Quality, 15 (4), 389-402. Guseman, D.S. (1981), "Risk Perception and Risk Reduction in Consumer Services," in Marketing of Services, J.H. Donnelly and W.R. George, eds., American Marketing Association, Chicago, IL. Guseman, D. and Gillett, P.L. (1981), "Services Marketing: The Challenge of Stagflation," in Marketing of Services, J.H. Donnelly and W.R. George, eds., American Marketing Association, Chicago, IL. Gwinner, K.P., Gremler, D.D. and Bitner, M.J. (1998), "Relational Benefits in Service Industries: The Customer's Perspective," Journal of the Academy of Marketing Science, 26 (2), 101-114. Hair, J.F. Jr., Black, W.C., Babin, B.J., Anderson, R.E. and Tatham, R.L. (2006), Multivariate Data Analysis, Pearson Education, Upper Saddle River, NJ. Hair, J.F. Jr., Bush, R. P., and Ortinau, D.J. (2003), Marketing Research: Within a changing information environment, McGraw-Hill Irwin, Boston. Hallowell, R., Schlesinger, L.A. and Zornitsky, J. (1996), “Internal service quality, customer and job satisfaction: linkages and implications for management”, Human Resource Planning, 19 (6), 20-31. Halstead, D., Casavant, R. and Nixon, J. (1998), “The customer satisfaction dilemma facing managed care organisations,” Health Care Strategic Management, 16 (6), 18-20. Hansen, H., Sandvik, K. and Selnes, F. (2003), “Direct and Indirect effects of Commitment to a Service Employee on the Intention to Stay,” Journal of Service Research, 5 (May), 356-68.
316
Hansson, J. (2000), “Quality in health care: medical or managerial?” Managing Service Quality, 10 (2), 78-81. Harrison, J. and St. John, C. (1994), Strategic Management of Organizations and Stakeholders, West, St. Paul, MN. Hart, C.W.L. (1988), "The Power of Unconditional Service Guarantees," Harvard Business Review, July-August, 54-62. Hart, C.W.L. (1995), "The Power of Internal Guarantees," Harvard Business Review, January-February, 64-73. Hart, C.W.L., Heskett, J.L., and Sasser, W.E. Jr. (1990),"The Profitable Art of Service Recovery," Harvard Business Review, July-August, 148-56. Hart, C.W.L., Schlesinger, A. and Maher, D. (1992), "Guarantees Come to Professional Service Firms," Sloan Management Review, Spring, 19-29. Hartline, M.D. and Ferrell, O.C. (1996), “The management of customer contact service employees: An empirical investigation,” Journal of Marketing, 69 (October), 52-70. Harvey, R. (1991), Making it Better: Strategies for Improving the Effectiveness and Quality of Health Services in Australia, National Health Strategy Background Paper No.8, National Health Strategy Unit, October. Hasin, M.A.A., Seeluangsawat, R. and Shareef, M.A. (2001), Statistical measures of customer satisfaction for health-care quality assurance: a case study,” International Journal of Health Care Quality Assurance, 14 (1), 6-14. Hassard, J. and Sharifi, S. (1989), "Corporate Culture and Strategic Change," Journal of General Management, 15, 4-19. Hauser, J.R. and Clausing, D. (1988), "The House of Quality, "Harvard Business Review, May-June, 63-73. Headley, D., Casavant, R. and Nixon, J. (1998), “The customer satisfaction dilemma facing managed care organizations,” Health Care Strategic Management, 16 (6), 18-20. Headley, D.E. and Miller, S.J. (1993), "Measuring Service Quality and its Relationship to Future Consumer Behaviour", Journal of Health Care Marketing, 13 (Winter), 32-41. Hedrick, T. E. (1994), "The Qualitative-Qualitative Debate: Possibilities for Integration," in The Qualitative-Quantitative Debate: New Perspectives, Reichardt, C.S. and Rallis, S.F., Eds., Jossey-Bass, San Francisco, CA. Heide, J. (1994),"Interorganizational Governance in Marketing Channels," Journal of Marketing, 58 (January), 70-85.

317
Heide, J. and John, G. (1988), "The Role of Dependence Balancing in Safeguarding Transaction-Specific Assets in Conventional Channels," Journal of Marketing, 52 (January), 20-35. Heide, J. and John, G. (1990), "Alliances in Industrial Purchasing: The Determinants of Joint Action in Buyer-Supplier Relationships," Journal of Marketing Research, 27 (February), 24-36. Heide, J. and John, G. (1992), "Do Norms Matter in Marketing Relationships?" Journal of Marketing, 56 (April), 22-24. Henkoff, R. (1994), "Finding, Training and Keeping the Best Service Workers," Fortune, October 3, 110-122. Hennig-Thurau, T., Gwinner, K.P. and Gremler, D.D. (2002), “Understanding Relationship Marketing Outcomes,” Journal of Service Research, 4 (3), 230-247. Heskett, J.L. (1987), “Lessons in the service sector,” Harvard Business Review, (March-April), 118-126. Heskett, J.L., Jones, T.O., Loveman, G.W., Sasser, W.E. Jr., and Schlesinger, L.A. (1994), "Putting the Service -Profit Chain to Work," Harvard Business Review, (March/April), 164-174. Heskett, J.L., Sasser, W.E. Jr., and Schlesinger, L.A. (1997), The Service Profit-Chain: How Leading Companies Link Profit and Growth to Loyalty, Satisfaction and Value, Free Press, New York, NY. Hirschman, E.C. (1983), "Aesthetics, Ideologies, and the Limits of the Marketing Concept," Journal of Marketing, 47 (Summer), 45-55. Hirschman, E.C. (1986), “Humanistic Inquiry in Marketing Research: Philosophy, Method and Criteria,” Journal of Marketing Research, 23 (August), 237-249. Hise, R.T. (1965), "Have Manufacturing Firms Adopted the Marketing Concept," Journal of Marketing, 29 (July), 9-12. Hoffman. K.D. (2000), "Services Marketing," in Marketing Best Practices, Hoffman, K.D. ed., Dryden, Fort Worth, TX, 290-325. Holt, P. (1994), Quality Review of Australian Health Care Facilities: Results from ACHS Accreditation Surveys, The Australian Council on Healthcare Standards. Homans, G.C. (1961), Social Behaviour: Its Elementary Forms, Harcourt, Brace & World, New York. Hostage, G.M. (1975), “Quality Control in a Service Business,” Harvard Business Review, July-August, 104.

318
Houston, F.S. (1986), "The Marketing Concept: What It Is and What It Is Not," Journal of Marketing, 50 (April), 81-87. Houston, F.S. (1994), Marketing Exchange Relationships, Transactions, and Their Media, Quorum Books, Westport, CT. Houston, F.S. and Gassenheimer, J.B. (1987), "Marketing and Exchange," Journal of Marketing, 51,3-18. Howard, J.A. (1957), Marketing Management: Analysis and Decision, Irwin, Homewood, IL. Hsieh, Y.C. and Hiang, S.T. (2004), “A study of the impacts of service quality on relationship quality in search-experience-credence services,” Total Quality Management, 15 (1), 43-58. Huberman, A.M. and Miles, M.B. (1994), “Data Management and Analysis Methods.” In Handbook of Qualitative Research, Denzin, N.K. and Lincoln, Y.S. eds., Sage, Thousand Oaks, CA. Hughes, J. (1990), The Philosophy of Social Research, 2nd Edition, Longman, London. Hughey, D.W., Chawla, S.K. and Khan, Z.U. (2003), “Measuring the Quality of University Computer Labs Using SERVQUAL: A Longitudinal Study,” The Quality Management Journal, 10 (3), 33-44. Hui, M.K. and Tse, D.K. (1996), “What to Tell Consumers in Waits of Different Lengths: An Integrative Model of Service Evaluation,” Journal of Marketing, 60 (April), 81-90. Hunt, S.D. (1971), "The Morphology of Theory and the General Theory of Marketing," Journal of Marketing, 35 (April), 65-68. Hunt, S.D. (1976), "The Nature and Scope of Marketing," Journal of Marketing, 40 (July), 17-28. Hunt, S.D. (1983), "General Theories and the Fundamental Explananda of Marketing," Journal of Marketing, 47, Fall, 9-17. Hunt, S.D. (1986), “The Logical Positivists: Beliefs, Consequences and Status.” In Proceedings of the Twelfth Paul D. Converse Symposium, Sudharshan, D. and Winter, F.W. eds., American Marketing Association, Chicago, IL. Hunt, S.D (1991) Modern Marketing Theory: Critical Issues in the Philosophy of Marketing Science, South-Western Publishing Co., Ohio. Hunt, S.D. and Morgan, R.M. (1994),"Relationship Marketing in the Era of Network Competition," Marketing Management, 3 (1), 19-28. Hunt, S.D., Ray, N. and Wood, V.R. (1985),"Behavioral Dimensions of Channels of Distribution: Review and Synthesis," Journal of the Academy of Marketing Science, 13 (Summer), 1-14.

319
Huppertz, J.W., Arenson, S.J. and Evans, R.H. (1978), “An Application of Equity Theory to Buyer-Seller Exchange Situations,” Journal of Marketing research, 15 (May), 250-60. Hurley, R.F and Estelami, H. (1998), “Alternative Indexes for Monitoring Customer Perceptions of Service Quality: A Comparative evaluation in a Retail Context,” Journal of the Academy of Marketing Science, 26 (3) 209-221. Hutton, J.D. and Richardson, L.D. (1995), "Healthscapes: The Role of the Facility and Physical Environment on Consumer Attitudes, Satisfaction, Quality Assessments, and Behaviors," Health Care Management Review, 20(2), 48-61. Huq, Z. and Martin, T.N. (2000), “Workforce Cultural Factors in TQM/CQI Implementation in Hospitals,” Health Care Management Review, 25 (3), 80-93. Iacobuuci, D. and Hopkins, N. (1992), "Modeling Dyadic Interactions and Networks in Marketing," Journal of Marketing Research, 24 (February), 5-17. Iacobucci, D. and Ostrom, A. (1996), “Perceptions of Services,” Journal of Retailing and Consumer Services, 3 (4), 195-212. Iacobucci, D. and Zerrillo, P. (1997), "The Relationship Life Cycle: (i) A Network-Dyad-Network Dynamic Conceptualization, and (ii) The Application of Some Classic Psychological Theories to its Management," Research in Marketing, 13, 47-68. Ishikawa, K. (1985), What Is Total Quality Control? The Japanese Way, Prentice-Hall, Englewood Cliffs, NJ. Ireland, R.C. (1977), "Marketing: A New Opportunity for Hospital Management," in Health Care Marketing: Issues and Trends, 2nd ed., Cooper, P.D., ed., Aspen Publishers, Rockville, MD. Jacoby, J., Speller, D.E. and Kohn, C.A. (1974),"Brand Choice Behavior as a Function of Information Load," Journal of Marketing Research, 11(February), 63-69. Jandt, F. (1995), The Customer is Usually Wrong, Park Avenue Publications, Indianapolis, IN. Jankowicz, A.D. (1995), Business Research Projects, 2nd Edition, Chapman and Hall, London. Jarratt, D.G. (1996), “A comparison of two alternative interviewing techniques used within an integrated research design: a case study in outshopping using semi-structured and non-directed interviewing techniques,” Marketing Intelligence and Planning, 14 (6), 6-15. Jayasuriya, R. (1998), “Measuring Service Quality in IT Services: Using Service Encounters to Elicit Quality Dimensions,” Journal of Professional Services Marketing, 18 (1), 11-23. Jaworski, B.J. and Kohli, A. (1993), "Market Orientation: Antecedents and Consequences," Journal of Marketing, 57 (July), 53-70.

320
Jencks, S. (1995),"Measuring Quality of Care Under Medicare and Medicaid," Health Care Financing Review, 16 (Summer), 39-54. Jick, T.D. (1979), “Mixing qualitative and quantitative methods: Triangulation in action,” Administrative Science Quarterly, 24, 602-611. Jick, T.D. (1983), “Mixing qualitative and quantitative methods,” in Van Maanen, J (Ed.), Qualitative Methodology, Sage, London. John, J. (1994),"Referent Opinion and Health Care Satisfaction," Journal of Health Care Marketing, 14 (Summer), 24-30. Johnson, A.A. (1986),"Adding more P's to the Pod or-12 Essential Elements of Marketing," Marketing News, 11 April, 2. Johnson, M.D., Anderson, E.W. and Fornell, C. (1995), “Rational and Adaptive Performance Expectations in a Customer Satisfaction Framework,” Journal of Consumer Research, 21 (March), 128-140. Johnson, M.D. and Fornell, C. (1987), "The Nature and Methodological Implications of the Cognitive Representation of Products," Journal of Consumer Research, 14, (September) 214-228. Johnson, M.D., and Fornell, C. (1991), “A Framework for Comparing Customer Satisfaction Across Individuals and Product Categories,” Journal of Economic Psychology, 12, 267-286. Johnson, M.D., Lehmann, D.R., Fornell, C., and Horne, D.R. (1992), "Attribute, Abstraction, Feature-Dimensionality, and the Scaling of Product Similarities," International Journal of Research in Marketing, 9, 131-147. Johnston, R. (1995), “The determinants of service quality: satisfiers and dissatisfiers,” International Journal of Service Industry Management, 6 (5), 53-71. Johnston, R. (2004), “Towards a better understanding of service excellence,” Managing Service Quality, 14 (2/3), 129-133. Johnston, R. and Heineke, J. (1998), “Exploring the Relationship between Perception and Performance: Priorities for Action,” The Service Industries Journal, 18 (1), 101-112. Jones, C., Hesterly, W.S., and Borgatti, S.P. (1997), "A General Theory of Network Governance: Exchange Conditions and Social Mechanisms," Academy of Management Review, 22 (4), 911-945. Jones, D.G., and Monieson, D.D. (1990), "Early Developments in the Philosophy of Marketing Thought," Journal of Marketing, 54 (January), 102-113. Jones, G.R. (1990), "Governing Customer-Service Organization Exchange, Journal of Business Research, 20, January, 23-29.
321
Jones, M.A. and Suh, J. (2000), “Transaction-specific satisfaction and overall satisfaction: an empirical analysis,” Journal of Services Marketing, 14 (2), 147-159. Joseph, W.B. (1996), “Internal Marketing Builds Service Quality,” Journal of Health Care Marketing, 16 (Spring), 554-59. Judd, R.C. (1964),"The Case for Redefining Services," Journal of Marketing, 28 (January) 58-59. Jun, M., Peterson, R.T. and Zsidisin, G. (1998), "The Identification and Measurement of Quality Dimensions in Health Care: Focus Group Interview Results." Health Care Management Review, 23 (4), 81-96. Juran, J. (1964), Managerial Breakthrough, McGraw-Hill, New York, NY. Kang, G. and James, J. (2004), “Service quality dimensions: an examination of Gronroos’s service quality model,” Managing Service Quality, 14 (4), 266-277. Kang, G., James, J. and Alexandris, K. (2002), “Measurement of internal service quality: application of the SERVQUAL battery to internal service quality”, Managing Service Quality, 12 (5), 278-291. Kalwani, M. and Narayandas, N. (1995),"Long-term Manufacturer-Supplier Relationships: Do They Pay Off for Supplier Firms?" Journal of Marketing, 59, 1-16. Kanter, R. (1989), When Giants Learn to Dance, Simon and Schuster. Kanter, R. (1994),"Collaborative Advantage: The Art of Alliances," Harvard Business Review, July-August, 97-108. Kaplan, S. (1987), “Aesthetics, Affect, and Cognition: Environmental Preference from Evolutionary Perspective,” Environment and Behavior, 19 (January), 3-32. Karpin, D. (1995), Chair, Enterprising Nation: Renewing Australia's Managers To Meet The Challenges Of The Asia-Pacific Century, Report of the Industry Task Force On Leadership and Management Skills, April 1995, Australian Government Publishing Service, Canberra. Katz, K., Larson, B., and Larson, R. (1991), “Prescription for the Waiting in Line Blues,” Sloan Management Review, Winter, 44-53. Keith, J.G. (1981), "Marketing Healthcare: What the Recent Literature is Telling Us," Hospital and Health Services Administration, Special II, 67-84. Keith, R.J (1960), "The Marketing Revolution," Journal of Marketing, 24 (January), 35-38. Keely, A. (1987), "The 'New Marketing' Has Its Own Set of P's," Marketing News, 6 (November), 10-11.

322
Keller, K.L. and Staelin, R. (1987), "Effects of Quality and Quantity of Information on Decision Effectiveness," Journal of Consumer Research, 14 (September), 200-213. Kelly, S.W., Skinner, S.J., and Donnelly, J.H. (1992), "Organizational Socialization of Service Customers," Journal of Business Research, 25 (November), 197-214. Kiesler, S. and Sproull, L. (1982), "Managerial Responses to Changing Environments: Perspectives on Problem Sensing from Social Cognition," Administrative Science Quarterly, 27, 548-570. Kim, D. (1993), "The Link between Individual and Organizational Learning," Sloan Management Review, Fall, 37-50. Kingman-Brundage, J. (1989), "The ABC's of Service System Blue-printing," in Designing a Winning Service Strategy, Bitner, J. and Crosby, A., eds., American Marketing Association, Chicago, IL., 30-33. Klaus, P.G. (1985),"Quality Epiphenomenon: The Conceptual Understanding of Quality in Face-to-Face Service Encounters," in The Service Encounter, Czepiel, J.A., Solomon, M.R. and Surprenant, C.F., Eds., Lexington Books, Lexington, MA. Kohli, A.K., and Jaworski, B.J. (1990), "Market Orientation: The Construct, Research Propositions, and Managerial Implications," Journal of Marketing, 54 (April), 1-18. Kohli, A.K., Jaworski, B.J., and Kumar, A. (1993),"MARKOR: A Measure of Market Orientation," Journal of Marketing Research, 30 (November), 467-477. Kostecki, M.M. ed. (1993a), Marketing Strategies for Services, Pergamon Press, Oxford. Kostecki, M.M. (1993b),"Guidelines for Strategy Formulation in Service Firms," in Marketing Strategies for Services, M.M. Kostecki, ed., Pergamon Press, Oxford. Kotler, P. (1967), Marketing Management, Prentice-Hall, Englewood Cliffs, NJ. Kotler, P. (1972a), "A Generic Concept of Marketing," Journal of Marketing, 36 (April), 46-54. Kotler, P. (1972b), "Defining the Limits of Marketing," Marketing Education and the Real World, Becker, B.W. and Becker, H., eds., American Marketing Association, 48-56. Kotler, P. (1973), "The Major Tasks of Marketing Management," Journal of Marketing, October, 42-49. Kotler, P. (1977), "From Sales Obsession to Marketing Effectiveness," Harvard Business Review, 55 (November-December), 67-75. Kotler, P. (1986), "Megamarketing," Harvard Business Review, 64 (March/April), 117-124.

323
Kotler, P. (2000), Marketing Management: Analysis, Planning, Implementation, and Control, 11th ed., Prentice-Hall, Englewood Cliffs, New Jersey. Kotler, P. and Armstrong, G. (1994), Principles of Marketing, 6th ed., Prentice-Hall, Englewood Cliffs, N.J. Kotler, P., Chandler, P.C., Brown, L., and Adam, S. (1994), Marketing: Australia and New Zealand, Prentice-Hall, Sydney, Australia. Kotler, P. and Conner, R.A. (1977),"Marketing Professional Services," Journal of Marketing, 41 (January), 71-76. Kotler, P. and Levy, S.J. (1969a), "Broadening the Concept of Marketing," Journal of Marketing, 33 (January), 10-15. Kotler, P. and Levy, S.J. (1969b),"A New Form of Marketing Myopia: Rejoinder to Professor Luck," Journal of Marketing, 33 (July), 55-57. Kotler, P. and Levy, S.J. (1971), "Demarketing, Yes, Demarketing," Harvard Business Review, November-December, 74-80. Kotler, P. and Roberto, E.L. (1989), Social Marketing: Strategies for Changing Public Behavior, The Free Press, New York. Kotler, P. and Zaltman, G. (1971), "Social Marketing: An Approach to Planned Social Change," Journal of Marketing, 35 (July), 3-12. Krosnick, J.A. and Fabrigar, L.R. (1997), “Designing Rating Scales for Effective Measurement in Surveys,” in Survey Measurement and Process Quality, Lyberg, L. et al., eds, Wiley, New York, NY, 141-164. Kuhn, T.S. (1970), The Structure of Scientific Revolutions, University of Chicago Press, Chicago, IL. Kvale, S. (1996), Interviews: An Introduction to Qualitative Research Interviewing, Sage, Thousand Oaks, CA. Lacznik, G.R. and Michie, D.A. (1979), "The Social Disorder of the Broadened Concept of Marketing," Journal of Academy of Marketing Science, 7, 3 (Summer), 214-232. Langer, E. (1975),"The Illusion of Control," Journal of Personality and Social Psychology, 32, 311-328. Lant, T., Milliken, F. and Batra, B. (1992),"The Role of Managerial Learning and Interpretation in Strategic Persistence and Reorientation: an Empirical Exploration," Strategic Management Journal, 13, 585-608. Larson, A. (1992),"Network Dyads in Entrepreneurial Settings: A Study of Governance of Exchange Relationships," Administrative Science Quarterly, 37, 76-104.

324
Larsson, R. and Bowen, D.E. (1989),"Organization and Customer: Managing Design and Coordination of Services," Academy of Management Review, 14(2), 213-233. Lawler, E.E., Mohrman, S.A., and Ledford, G.E. (1992), Employee Involvement and Total Quality Management: Practices and Results in Fortune 1000 Companies, Jossey-Bass, San Francisco, CA. Lawler, E.E., Mohrman, S.A., and Ledford, G.E. (1995), Creating High Performance Organization: Impact of Employee Involvement and Total Quality Management, Jossey-Bass, San Francisco, CA. Lawton, L. and Parasuraman, A. (1980), "The Impact of the Marketing Concept on New Product Planning," Journal of Marketing, 44 (Winter), 19-25. Lazarus, I.R., Gregory, J.P., and Bradford, C. (1992), "Marketing Management Enhances Customer Relations," Healthcare Financial Management, October, 55-60. Lazo, H. and Corbin, A. (1961), Management in Marketing, McGraw-Hill, New York. Leenders, M., and Blenkhorn, D. (1988), Reverse Marketing: The New-Buyer-Supplier Relationship, Free Press, New York, NY. Legg, D. and Baker, J. (1987),"Advertising Strategies for Service Firms," in Add Value to Your Service, C. Surprenant, ed., American Marketing Association, Chicago, IL. Lehtinen, U. and Lehtinen, J.R. (1991),"Two Approaches to Service Quality Dimensions," The Service Industries Journal, 11 (July), 287-303. Leonard, K.J., Wilson, D. and Malott, D. (2001), “Measures of quality on long-term care facilities,” Leadership in Health Services, 14 (2), 1-8. Levin, R.I. and Rubin, D.S. (1994), Statistics for Management, Prentice-Hall, Englewood Cliffs, NJ. Levit, K., Sensenig, A., Cowan, C., et al. (1994), "National Health Expenditures, 1993," Health Care Financing Review, 16 (Fall), 247-294. Levitt, T. (1972), "Production Line Approach to Services," Harvard Business Review, 50 (September-October), 41-52. Levitt, T. (1976), "The Industrialization of Service," Harvard Business Review, 54 (September-October), 63-74. Levitt, T. (1981), "Marketing Intangible Products and Product Intangibles," Harvard Business Review, 59 (May-June), 94-102. Levitt, T. (1986), The Marketing Imagination, Free Press, New York, NY.

325
Levy, S.J. and Kotler, P. (1979), "Toward a Broader Concept of Marketing's Role in Social Order," Journal of the Academy of Marketing Science, 7, 3(Summer), 233-238. Lewins, F. (1992), Social Science Methodology, Macmillan, Melbourne, VIC. Lewis, B. (1995), "Customer Care in Services," in Understanding Services Management, Glynn, W. and Barnes. J., eds., Wiley, Chichester, 57-88. Lewis, B. R and Gabrielsen, G. O. S. (1998), “Intra-organisational aspects of service quality management: the employee’s perspective,” The Services Industries Journal, 18 (April), 64-89. Lewis, R.C. and Booms, B.H. (1983), "The Marketing Aspects of Service Quality," in Emerging Perspectives on Services Marketing, Berry, L., Shostack, G. and Upah, G., American Marketing Association, Chicago, IL. Lichtenthal, J.D. and Beik, L.L. (1984), "A History of the Definition of Marketing," Research in Marketing, 7, 133-163. Lichtenthal, J.D. and Wilson, D.T. (1992), "Becoming Market Oriented," Journal of Business Research, 24 (May), 191-207. Lim, P.C., Tang, N.K.H. and Jackson, P.M. (1999), “An innovative framework for health care performance measurement,” Managing Service Quality, 9 (6), 423-433. Lim, P.C., and Tang, N.K.H. (2000), “A study of patients’ expectations and satisfaction in Singapore hospitals,” International Journal of Health Care Quality Assurance, 13 (7), 290-299. Lincoln, Y.S. (1990), “The Making of a Constructivist: A Remembrance of Transformation Past,” in The Paradigm Dialog, E.G. Guba, Ed., Sage, Newbury Park, CA. Lings, I.N. (2000), "Internal Marketing and Supply Chain Management," Journal of Services Marketing, 14 (1), 27-43. Lings, I.N. and Brooks, R.F. (1998), “Implementing and measuring the effectiveness of internal marketing,” Journal of Marketing Management, 14, 325-351. Litman, S. (1950), "The Beginnings of Teaching Marketing in American Universities," Journal of Marketing, 24 (October), 220-223. Litsikas, M. (1989), "Purchasers Consider Supplier Partnership," Hospital Materials Management, 1 (September). Litwin, M.S. (1995), How To Measure Survey Reliability and Validity, The Survey Kit (7), Sage, Thousand Oaks, CA. Llosa, S., Chandon, J-L., Orsingher, C. (1998), "An Empirical Study of SERVQUAL's Dimensionality," The Services Industries Journal, 18 (2), 16-44. Lohr, K.N. (1988), “Outcome measurement concepts and questions,” Inquiry, 25, 37-50.

326
Lohr, K. (1990), ed., Medicare: A Strategy for Quality Assurance, Institute of Medicine, National Academy Press. Lohr, S. (1999), Sampling: Design and Analysis, Duxbury Press, Pacific Grove, CA. Lovelock, C.H. (1981), "Why Marketing Management Needs to be Different for Services," in Marketing of Services, J.H. Donnelly and W.R. George, eds., American Marketing Association, Chicago, IL. Lovelock, C.H. (1983a), "Classifying Services to Gain Strategic Marketing Insights," Journal Of Marketing, 47 (Summer), 9-20. Lovelock, C.H. (1983b), "Think Before You Leap in Services Marketing," in Emerging Perspectives on Services Marketing, L.L. Berry, G.L. Shostack, and G.D. Upah, eds., American Marketing Association, Chicago, IL. Lovelock, C.H. (1984),"Developing and Implementing New Services," in Developing New Services, W. George and C. Marshall, eds., American Marketing Association, Chicago, IL. Lovelock, C.H. (1991), Services Marketing, Prentice-Hall, Englewood Cliffs, New Jersey. Lovelock, C.H. (1992), Managing Services: Marketing, Operations, and Human Resources, Prentice-Hall, Englewood Cliffs, New Jersey. Lovelock, C.H., Langeard, E., Bateson, J.E.G. and Eiglier, P. (1981), "Some Organizational Problems Facing Marketing in the Service Sector," in Marketing of Services, J.H Donnelly and W.R. George, eds., American Marketing Association, Chicago, Ill. Lovelock, C.H. and Young, R.F. (1977), "Marketing's Potential for Improving Productivity in Service Industries," in Marketing Consumer Services: New Insights, P. Eiglier, et al., eds., Marketing Science Institute, Cambridge, MA. Luck, D.J. (1969), "Broadening the Marketing Concept-Too Far," Journal of Marketing, 33 (July), 53-55. Luck, D.J. (1974), "Social Marketing: Confusion Compounded," Journal of Marketing, 38 (October), 70-72. Luckman, T., Ed. (1978), Phenomenology and Sociology, Penguin, Harmondsworth, Middlesex. Lundstram, W.J. (1976), "The Marketing Concept: The Ultimate in Bait and Switch," Marquette Business Review, 20 (Fall), 214-30. Lusch, R.F. and Laczniak, G.R. (1987), "The Evolving Marketing Concept, Competitive Intensity and Organizational Performance," Academy of Marketing Science, 15, 3, 1-11.

327
Lyberg, L., et al., eds. (1997), Survey Measurement and Process Quality, Wiley Series in probability and statistics, John Wiley & Sons, NY. Lytle, R. and Mokwa, M. (1992), "Evaluating Health Care Quality: The Moderating Roles of Outcomes," Journal of Health Care Marketing, 1 (March), 4-14. McAlexander, J.H., Kaldenberg, D.O., and Koenig, H.F. (1994), "Service Quality Measurement," Journal of Health Care Marketing, 14 (Fall), 34-40. McAlexander, J. and Schouten, J. (1987), "To-me/For Me and The Extended Self: A Consumer-Experiential Perspective of Services," in Marketing Theory, R. Belk et al., eds., American Marketing Association, Chicago, IL. McCarthy, E.J. (1987), "How much should hospitals spend on advertising?" Healthcare Management Review, 12 (1), 47-54. McCallum, R. J. and Harrison, W. (1985), "Interdependence in the Service Encounter," in The Service Encounter: Managing Employee/Customer Interaction in Service Businesses, Czepiel, J.A., Solomon, M.R. and Surprenant, C.R., eds., Lexingtion Books, Lexington, MA, 35-48. McCarthy, J. (1960), Basic Marketing, A Managerial Approach, Irwin, Homewood, IL. McColl-Kennedy, J.R., ed. (2003), Services Marketing: a managerial approach, Wiley, Brisbane. McColl-Kennedy, J.R., and Kiel, G., (2000), Marketing: A Strategic Approach, Nelson Thomson Learning, South Melbourne. McColl-Kennedy, J.R. and Sparks, B. A. (2003), “Application of Fairness Theory to Service Failures and Service Recovery,” Journal of Service Research, 5 (3) February, 252-266. McCracken, G. (1987), "The History of Consumption: A Literature Review and Consumer Guide," Journal of Consumer Policy, 10, 139-166. McCracken, G. (1988), The Long Interview, Qualitative Research Methods Series 13, Sage, Newbury Park, CA. McCusker, J., Dendukuri, N., Cardinal, L., Katofsky, L., and Riccardi, M. (2005), “Assessment of the work environment of multidisciplinary hospital staff,” International Journal of Health Care Quality Assurance, 18 (7), 543-551. McDevitt, P. (1987), "Learning by doing: strategic marketing management in hospitals," Healthcare Management Review, 12(1), 23-30. McDonald, M. and Leppard, J. (1991),"Marketing Planning and Corporate Culture: a Conceptual Framework which Examines Management Attitudes in the Context of Marketing Planning," Journal of Marketing Management, 7, 209-212.

328
McDougall, J.H. and Levesque, T. J. (1994), “A Revised View of Service Quality Dimensions: An Empirical Investigation,” Journal of Professional Services Marketing, 11 (1), 189-209. McGee, L.W. and Spiro, R.L. (1988), "The Marketing Concept in Perspective," Business Horizons, May/June, 40-45. McIver, J.P. and Carmines, E.G. (1981), Unidimensional Scaling, Quantitative Applications in the Social Sciences Series 24, Sage, Newbury Park, CA. McKenna, R. (1991), "Marketing is Everything," Harvard Business Review, 69, January-February, 65-79. Mackoy, R. and Spreng, R. (1995), “The Dimensionality of Consumer Satisfaction/Dissatisfaction: An Empirical Examination,” Journal of Consumer Satisfaction, Dissatisfaction and Complaining Behavior, 8, 53-58. McLaughlin, C.P. and A.D. (2000), “Building Client Centered Systems of Care: Choosing a Process Direction for the Next Century,” Health Care Management Review, 25 (1), 73-82. McNamara, C.P. (1972), "The Present Status of the Marketing Concept," Journal of Marketing, 36 (January), 50-57. MacStravic, R.S. (1988), "Outcome Marketing in Health Care," Health Care Management Review, 13(2), Spring, 53-59. MacStravic, S. (1993), "Reverse and double-reverse marketing for health care organizations," Health Care Management Review, 18 (3), 53-58. Malhotra, N.K. (1999), Marketing Research: An Applied Orientation, 3rd Edition, Prentice-Hall, Upper Saddle River, NJ. Malhotra, N.K., Hall, J., Shaw, M., and Oppenheim, P. (2006), Marketing Research: An Applied Orientation, Pearson Prentice-Hall, Sydney. Mangold, W.G. and Babakus, E. (1991),"Service Quality: The Front Stage vs the Back Stage Perspective," Journal of Services Marketing, 5(Fall), 59-70. Marketing News, 1 March 1985. Marion, G. (1993), "The Marketing Management Discourse: What's New Sine the 1960's?" in Perspectives on Management, Vol. 3, M.J. Baker ed., John Wiley & Sons Ltd, West Sussex, England. Marshall, C. and Rossman, G. B. (1995), Designing qualitative research, Thousand Oaks, CA. Marshall, G.W., Baker, J. and Finn, D.W. (1998), “Exploring Internal Customer Service Quality,” Journal of Business & Industrial Marketing, 13 (4/5), 381-392.

329
Martineau, P. (1955), "Its Time to Research the Consumer," Harvard Business Review, July-August. Marquardt, M. and Reynolds, A. (1994), The Global Learning Organization, Irwin, New York, NY. Mason. B. and Mayer, M.L. (1990), Modern Retailing Theory and Practice, Irwin, Homewood, IL. Mathews, B. and Clark, M. (1997), "Quality Determinants: The Relationship Between Internal and External Services," in Marketing Service Quality, Vol III, Kunst, P. and Lemmink, J., eds., Paul Chapman Publishing, London, 11-34. Mattsson, J. (1994), "Improving Service Quality in Person-to-Person Encounters: Integrating Findings from a Multi-disciplinary Review," The Service Industries Journal, 14 (January), 45-61. Mattson, L-G. (1997), "'Relationship Marketing' and the 'Markets-as-Networks approach'—A Comparative Analysis of Two Evolving Streams of Research," Journal of Marketing Management, 13, 447-461. Mels, G., Boshoff, C. and Nel, D. (1997), “The Dimensions of Service Quality: The Original European Perspective Revisited,” The Services Industries Journal, 17 (1), 173-189. Meyer, J.P., Allen, N.J. and Smith, C.A. (1993), “Commitment to organizations and occupations: extension and test of a three-component conceptualization,” Journal of Applied Psychology, 78 (4), 538-551. Miles, E. W., Hatfield, J.D., and Huseman, R.C. (1994), “Equity sensitivity and outcome importance,” Journal of Organizational Behavior, 15 (7), 585-596. Miles, M.B. and Huberman, A.M. (1984), Qualitative data analysis: A sourcebook of new methods, Sage, Beverly Hills, CA. Miles, M.B. and Huberman, A.M. (1994), Qualitative data analysis: An expanded sourcebook, Sage, London. Miller, J. (1977), "Studying Satisfaction, Modifying Models, Eliciting Expectations, Posing Problems, and Making Meaningful Measurements," in Conceptualization and Measurement of Consumer Satisfaction and Dissatisfaction, Hunt, H.K. ed., Marketing science Institute, Cambridge, MA, 72-91. Mittal, V. and Kamakura, W.A. (2001), “Satisfaction, Repurchase Intent, and Repurchase Behavior: Investigating the Moderating Effect of Customer Characteristics,” Journal of Marketing Research, 38 (February), 131-142. Mittal, V., Kumar, P., and Tsiros, M. (1999), “Attribute-level performance, satisfaction, and behavioural intentions over time: a consumption-system approach,” Journal of Marketing, 63 (April), 88-101.

330
Mohr, L. and Bitner, M.J. (1995), “The Role of Employee Effort in Satisfaction with Service Transactions,” Journal of Business Research, 32, 239-252. Mohr, J., Fisher, R. and Nevin, J. (1996), “Collaborative Communication in Interfirm Relationships: Moderating Effects of Integration and Control,” Journal of Marketing, 60 (July), 103-115. Mohr, J. and Spekman, R. (1994),"Characteristics of Partnership Attributes, Communication Behavior, and Conflict Resolution Techniques," Strategic Management Journal, 15, 135-152. Moorman, C., Zaltman, G. and Deshpande, R. (1992),"Relationships Between Providers and Users of Market Research: The Dynamics of Trust Within and Between Organizations," Journal of Marketing Research, 29 (August), 314-328. Morgan, D.L. (1988), Focus Groups as Qualitative Research, Sage, Newbury Park, CA. Morgan, N.A. and Piercy, N.F. (1992), "Market-Led Quality," Industrial Marketing Management, 21, 111-118. Morgan, R.M. and Hunt, S.D. (1994), "The Commitment-Trust Theory of Relationship Marketing," Journal of Marketing, 58 (July), 20-38. Morse, J.M. (1991), “Approaches to qualitative-quantitative methodological triangulation,” Nursing Research, 40 (1), 120-123. Morton-Williams, J. (1985), "Making Qualitative Research Work: Aspects of Administration" in Applied Qualitative Research, R. Walker, ed., Gower, Aldershot, England. Mowen, J.C., Licata, J.W., and McPhail, J. (1993),"Waiting in the Emergency Room: How to Improve Patient Satisfaction," Journal of Health Care Marketing, Summer, 26-33. Mukherjee, A. and Nath, P. (2005), “An empirical assessment of comparative approaches to service quality measurement,” Journal of Services Marketing, 19 (3), 174-184. Murfin, D.E., Schlegelmilch, B.B. and Diamantopoulos, A. (1995), "Perceived Service Quality and Medical Outcome: an Interdisciplinary Review and Suggestions for Future Research," Journal of Marketing Management, 11, 97-117. Murphy, P. (1999), “Service performance measurement using simple techniques actually works,” Journal of Marketing Practice: Applied Marketing Science, 5 (2), 56-73. Murray, K.B. (1991), “A Test of Services Marketing Theory: Consumer Information Acquisition Activities,” Journal of Marketing, 55 (January), 10-25. Naidu, G.M. and Narayana, C.L. (1991), "How Marketing Oriented Are Hospitals in a Declining Market?" Journal of Health Care Marketing, 11 (March), 23-30.

331
Naidu, G.M., Kleimenhagen, A., and Pillari, G.D. (1992), "Organization of Marketing in U.S. Hospitals: An Empirical Investigation," Health Care Management Review, 17 (4), 29-43. Nancarrow, C., Moskin, A. and Shankar, A. (1996), “Bridging the great divide - the transfer of techniques,” Marketing Intelligence and Planning, 14 (6), 27-37. Narver, J.C. and Slater, F.S. (1990),"The Effect of a Market Orientation on Business Profitability," Journal of Marketing, 54 (October), 20-35. Nelson, E.C., Batalden, P.B., Mohr, J.J. and Plume, S.K. (1998), “Building a Quality Future,” Frontiers of Health Service Management, 15 (1), 3-32. Nelson, E.C., Rust, R.T., Zahorick, A., Rose, R.L., Batalden, P., and Siemanski, B.A. (1992), “Do Patient Perceptions of Quality Relate to Hospital Financial Performance?” Journal of Health Care Marketing, December, 6-13. Nelson, S. (1987), “Heed Consumers on Malpractice to Avoid Suites,” Hospitals, 18:64. Neuman, W. L. (2003), Social Research Methods: Qualitative and Quantitative Approaches, 5th Edition, Allyn and Bacon, Boston. Nevin, J. (1995), "Relationship Marketing and Distribution Channels: Exploring Fundamental Issues," Journal of the Academy of Marketing Science, 23 (4), 327-334. Nevis, E., DiBella, A. and Gould, J. (1995), "Understanding Organizations as Learning Systems," Sloan Management Review, 36, 73-85. Newman, K. (2001), “Interrogating SERVQUAL: A Critical Assessment of Service Quality Measurement in a High Street Retail Bank,” International Journal of Bank Marketing, 19 (3), 126-139. Nickels, W.G. (1972), "Metamarketing and Cultural Dynamics," in Marketing Education and the Real World, Becker, B.W. and Becker, H., eds., American Marketing Association, 531-534. Nickels, W.G. (1974), "Conceptual Conflicts in Marketing," Journal of Economics and Business, 27 (Winter), 140-143. Nieswiadomy, R.M. (1993), Foundations for Nursing Research 2nd Edition, Appleton and Lange, Norwalk, CT. Normann, R. and Ramirez, R. (1993), “From Value Chain to Value Constellation: Designing Interactive Strategy,” Harvard Business Review, July-August, 65-77. Novelli, W. (1983), "Can Marketing Succeed in Health Services?" Journal of Health Care Marketing, 3 (4), 5-7. Nunnally, J.C. (1970), Introduction to Psychological Measurement, McGraw-Hill, NY.

332
Nunnally, J.C., and Bernstein, I.H. (1994), Psychometric Theory, 3rd Ed., McGraw-Hill Series in Psychology, McGraw-Hill, NY. Nwankwo, S. (1995), "Developing a Customer Orientation," Journal of Consumer Marketing, 12 (5), 5-15. Nwankwo, S. and Richardson, B. (1994), "Reviewing Service Quality in the Public Sector," in Curwen, P., Richardson, B., Nwankwo, S. and Montanheiro, L. (eds.), The Public Sector in Transition, Pavic Publications, Sheffield. Oiler, C.J. (1986), “Phenomenology: The Method.” In Munhall, P.L and Oiler, C.J, eds., Nursing Research: A Qualitative Perspective, Appleton-Century-Crofts, NY. O'Connor, C.P. (1992), "Why Marketing Is Not Working in the Health Care Area," Journal of Health Care Marketing, 2, 1, 31-36. O’Connor, S.J., Shewchuk, R.M. and Bowers, M.R. (1992), “A Model of Service Quality Perceptions and Health Consumer Behavior,” Journal of Hospital Marketing, 6 (1), 69-92. O’Connor, S.J., Trinh, H.Q. and Shewchuk, R.M. (2000), “Perceptual Gaps in Understanding Patient Expectations for Health Care Service Quality,” Health Care Management Review, 25 (2), 7-23. O'Leary, D., and Walker, L. (1994), "Evolution of Quality Measurement and Improvement in Health Care," Journal of Outcomes Management, 1 (1), 3-8. Oliver, C. (1990), "Determinants of Interorganizational Relationships: Integration and Future Directions, " Academy of Management Review, 15, 241-265. Oliver, R. (1977), "Effect of Expectation and Disconfirmation on Postexposure Product Evaluations: An Alternative Interpretation, " Journal of Applied Psychology, 62, 480-486. Oliver, R. (1980), "A Cognitive Model of the Antecedents and Consequences of Satisfaction Decisions, " Journal of Marketing Research, 17, 460-469. Oliver, R. (1981), "Measurement and Evaluation of Satisfaction Processes in Retail Settings," Journal of Retailing, 57, 25-48. Oliver, R. (1989), “Processing of the Satisfaction Response in Consumption: A Suggested Framework and Research Propositions,” Journal of Consumer Satisfaction/Dissatisfaction and Complaining Behavior, 2, 1-16. Oliver, R. (1997), Satisfaction: A Behavioral Perspective of the Consumer, McGraw-Hill, New York. Oliver, R. and DeSarbo, W. (1988), "Response Determinants in Satisfaction Judgements," Journal of Consumer Research, 14, 495-507.

333
Oliver, R.L. and Swan, J.E. (1989a), “Consumer Perceptions of Interpersonal Equity and Satisfaction in Transactions: A Field Survey Approach,” Journal of Marketing, 53 (April), 21-35. Oliver, R.L. and Swan, J.E. (1989b), “Equity and Disconfirmation Perceptions as Influences on Merchant and Product Satisfaction,” Journal of Consumer Research, 16 (December), 372-83. Olsen, L.L. and Johnson, M.D. (2003), “Service Equity, Satisfaction, and Loyalty: From Transaction-Specific to Cumulative Evaluations,” Journal of Services Research, 5 (3), 184-195. O’Neill, M.A., Palmer, A.J. and Beggs, R. (1998), “The effects of survey timing on perceptions of service quality,” 8 (2), 126-132. Onkvisit, S. and Shaw, J.J. (1989), "Service Marketing: Image, Branding, and Competition," Business Horizons, 32, January/February, 13-18. Orsini, J.L. (1987), "Goods, Services, and Marketing Functions: The Need for an Update," Belk, R.W., Zaltman, G., Bagozzi, R., et al., eds., American Marketing Association, Chicago, IL. Marketing Theory Osland, G. and Yaprak, A. (1995), "Learning Through Strategic Alliances: Processes and Factors that Enhance Marketing Effectiveness," European Journal of Marketing, 29, 52-66. Oswald, S.L., Turner, D.E., Snipes, R.L., and Butler, D. (1998), "Quality Determinants and Hospital Satisfaction," Marketing Health Services, 18 (1), 18-22. Ouchi, W. (1979), "A Conceptual Framework for the Design of Organizational Control Mechanisms," Management Science, 9, 833-848. Ovretveit, J. (1997), “A comparison of hospital quality programmes: lessons for other services,” International Journal of Service Industry Management, 8 (3), 220-235. Ovretveit, J. (2000), “The economics of quality,” International Journal of Health Care Quality Assurance, 13 (5), 200-207. Page, T.J. Jr and Spreng, R.A. (2002), “Difference Scores Versus Direct Effects in Service Quality Measurement,” Journal of Service Research, 4 (3), February, 184-192. Palmer, G.R. and Short, S.D. (1994), Health Care and Public Policy: An Australian Analysis, 2nd Ed., Macmillan Education, Melbourne, Australia. Parakevas, A. (2001), “Internal Service Encounters in Hotels: An Empirical Study,” International Journal of Contemporary Hospitality Management, 13 (6), 285-292. Parasuraman, A. (1981), "Hang On to the Marketing Concept!" Business Horizons, September-October, 38-40.

334
Parasuraman, A., Berry, L.L. and Zeithaml, V.A. (1983), "Service Firms Need Marketing Skills," Business Horizons, 26 (November-December), 28-32. Parasuraman, A., Berry, L.L., and Zeithaml, V.A. (1991), "Refinement and Reassessment of the SERVQUAL Scale," Journal of Retailing, 67 (Winter), 420-450. Parasuraman, A., Berry, L.L., and Zeithaml, V.A. (1993), "More on Improving Service Quality Measurement," Journal of Retailing, 69, 1, 140-147. Parasuraman, A. and Grewal, D. (2000), "The Impact of Technology on the Quality-Value-Loyalty Chain: A Research Agenda," Journal of the Academy of Marketing Science, 28, (1), Winter, 168-174. Parasuraman, A., Zeithaml, V.A. and Berry, L.L. (1985), "A Conceptual Model of Service Quality and its Implications for Future Research," Journal of Marketing, 49 (Fall), 41-50. Parasuraman, A., Zeithaml, V.A. and Berry, L.L. (1988), "SERVQUAL: A Multiple-Item Scale for Measuring Customer Perceptions of Service Quality," Journal of Retailing, 64 (Spring), 12-40. Parasuraman, A., Zeithaml, V.A., and Berry, L.L. (1994), "Reassessment of Expectations as a Comparison Standard in Measuring Service Quality: Implications for Further Research," Journal of Marketing, 58 (January), 111-124. Parasuraman, A. and Varadarajan, P. (1988), "Future Strategic Emphasis in Services Versus Goods Businesses," Journal of Services Marketing, 2(4). Parrington, M. and Stone, B. C. (1991), "The Marketing Decade: A Desktop View," Journal of Health Care Marketing, 11 (March), 45-50. Parry, M. and Parry, A.E. (1992), "Strategy and Marketing Tactics in Nonprofit Hospitals," Health Care Management Review, 17(1), Winter, 51-61. Patterson, P.G. and Johnson, L.W. (1993), "Disconfirmation of Expectations and the Gap Model of Service Quality: An Integrated Paradigm," Journal of Consumer Satisfaction, Dissatisfaction and Complaining Behavior, 6, 90-99. Patton, M.Q. (2002), Qualitative Evaluation and Research Methods, 3rd edition, Sage, Thousand Oaks, CA. Patton, M.Q. (2002), Qualitative Evaluation and Research Methods, 2nd edition, Sage, Newbury Park, CA. Patton, M.Q. (1987), How to use qualitative methods in evaluation, Sage, Newbury Park, CA. Patton, M.Q. (1982), Practical Evaluation, Sage, Newbury Park, CA.

335
Paulin, M. and Perrien, J. (1996), "Measurement of Service Quality: The Effect of Contextuality," in Managing Service Quality Vol II, Kunst, P. and Lemmink, J., eds., Paul Chapman Publishing, London, 79-96. Pawsey, M. (1990), Quality Assurance for Health Services: A Practical Approach, NSW Department of Health. Payne, A.F. (1988), "Developing a Marketing Oriented Organization," Business Horizons, May-June, 46-53. Perakyla, A. (1998), "Reliability and Validity in Research Based on Tapes and Transcripts" in Qualitative Research: Theory, Method and Practice, Silverman, D. ed., Sage, London. Peter, J.P., Churchill, G.A. Jr., Brown, T.J. (1993), "Caution in the Use of Difference Scores in Consumer Research," Journal of Consumer Research, 19 (March), 655-662. Peters, T. and Waterman, R. (1982), In Search of Excellence, Harper Row, New York, NY. Peterson, R.A. (1995), "Relationship Marketing and the Consumer," Journal of the Academy of Marketing Science, 23 (4), 278-281. Peterson, R.A. and Wilson, W.R. (1992), "Measuring Customer Satisfaction: Fact and Artefact," Journal of the Academy of Marketing Science, 20, Winter, 61-71. Pettigrew, A. (1985), “Contextualist Research: A Natural Way to Link Theory and Practice.” In Doing Research that is Useful in Theory and Practice, Lawler, E. editor, Jossey-Bass, San Francisco, CA. Peyrot, M., Cooper, P.D., and Schnapf, D., (1993)"Consumer Satisfaction and Perceived Quality of Outpatient Health Services," Journal of Health Care Marketing, 13 (1), 24-33. Phillips, D.C. (1990), Philosophy, Science, and Social Inquiry, Pergamon Press, Oxford. Phillips, D.C. (1992), The Social Scientist’s Bestiary, Pergamon Press, Oxford. Piercy, N. (1995), "Customer Satisfaction and the Internal Market: Marketing Our Customers to Our Employees," Journal of Marketing Practice: Applied Marketing Science, 1, 22-44. Piercy, N. (1998), "Marketing Implementation: The Implications of Marketing Paradigm Weakness for the Execution Process," Journal Academy of Marketing Science, 26 (3), Summer, 222-236. Piercy, N. and Cravens, D. (1995), "The Network Paradigm and the Marketing Organization: Developing a New Management Agenda," European Journal of Marketing, 29, 7-34. Piercy, N. and Morgan, N. (1990), "Organizational Context and Behaviour Problems as Determinants of the Effectiveness of the Strategic Marketing Planning Process," Journal of Marketing Management, 6, 127-143.

336
Piercy, N., and Morgan, N. (1991), “Internal Marketing – The Missing Half of the Marketing Programme,” Long Range Planning, 24 (April), 82-93. Pinson, C.R.A., Angelmar, R. and Roberto, E.L. (1972), "An Evaluation of the General Theory of Marketing," Journal of Marketing, 66-69. Pitt, L.F. and Jeantrout, B. (1994), “Management of Customer Expectations in Service Firms: A Study and a Checklist,” The Services Industries Journal, 14 (2), 170-189. Pitt, L.F., Watson, R.T. and Kavan, B.C. (1995), “Service Quality – A Measure of Information System Effectiveness,” MIS Quarterly, 19 (2), 173-187. Pitt, L.L., Morris, M.H. and Oosthuizen, P. (1996), “Expectations of Service Quality as an Industrial Market segmentation Variable,” The Services Industries Journal, 16 (January), 1-9. Pitt, L.L., Oosthuizen, P. and Morris, M.H. (1992), “Service Quality in a High-Tech Industrial Market: An Application of SERVQUAL.” In Proceedings of American Marketing Association Summer Educators’ Conference, Leone, R. and Kumar, V. eds., American Marketing Association, Chicago, IL, 46-53. Porter, M. (1985), Competitive Advantage: Creating and Sustaining Superior Performance, Free Press, New York, NY. Potter, C., Morgan, P. and Thompson, A. (1994), “Continuous quality improvement in an acute hospital: a report of an action research project in three hospital departments,” International Journal of Health Care Quality Assurance, 7 (1), 4-29. Prabhaker, P.R. and Sauer, P. (1994), "Hierarchical Heuristics in Evaluation of Competitive Brands Based on Multiple Cues," Psychology and Marketing, 11 (3), 217-234. Preble, J. (1992), "Towards a Comprehensive System of Strategic Control," Journal of Management Studies, 29, 391-409. Press, I., Ganey, R.F., and Malone, M.P. (1991), “Satisfied Patients Can Spell Financial Well Being,” Healthcare Financial Management, 45 (2), 34-42. Price, L., Arnould, E. and Tierney, P. (1995), “Going to Extremes: Managing Service Encounters and Assessing Provider Performance,” Journal of Marketing, 59 (April), 83-97. Pride, W.M. and Ferrell, O.C. (1993), Marketing Concepts and Strategies, 8th ed., Houghton Mifflin Company, Boston, MA. Provan, K.G. and Sebastian, J.G. (1998), "Networks Within Networks: Service Link Overlap, Organizational Cliques, and Network Effectiveness," Academy of Management Journal, 41 (4), 453-463. Queensland Health (1994a), Quality Client Service: Best Practice, Corporate Policy Queensland Health (1994b), Quality Client Service: Best Practice, Handbook.

337
Queensland Health (1995), The Casemix Model for Queensland Public Hospitals, Policy Paper Phase 2- 1995/1996. Quester, P., Romaniuk, S. and Wilkinson, J. (1995), “A Test of Four Service Quality Scales: The Case of the Australian Advertising Industry,” Academy of Marketing Science World Marketing Congress, 14-133 to 14-140. Quinn, J.B. (1992), Intelligent Enterprise: A Knowledge and Service Based Paradigm for Industry, The Free Press, New York, NY. Quinn, J.B. and Paquette, P.C. (1990), "Technology in Services: Creating Organizational Revolutions," Sloan Management Review, Winter, 67-68. Quinn, J.B., Doorley, T.L., and Paquette, P.C. (1990), "Beyond Products: Service Based Strategy," Harvard Business Review, 68 (March-April), 58-68. Rachman, D. (1994), Marketing Today, Dryden Press, Orlando, FL. Rafiq, M. and Ahmed, P.K. (1993), “The scope of internal marketing: defining the boundary between marketing and human resource management,” Journal of Marketing Management, 9, 219-232. Rafiq, M. and Ahmend, P.K. (1995), “The Limits of Internal Marketing,” in Managing Service Quality, Vol I, Kunst, P. and Lemmink, J., eds., Paul Chapman Publishing, London. Rafiq, M. and Ahmed, P.K. (2000), “Advances in the internal marketing concept: definition, synthesis and extension,” Journal of Services Marketing, 14 (6), 449-462. Rands, T. (1992), “Information Technology as a service operation,” Journal of Information Technology, 7, 189-201. Rao, C.P. and Kelkar, M.M (1997), “Relative Impact of Performance and Importance Ratings on Measurement of Service Quality,” Journal of Professional Services Marketing, 15 (2), 69-86. Rapert, M.I., Garretson, J., Velliquette, A., Olson, J. and Dhodapkar, S. (1998), “Domains of Quality-Based Strategies: A Functional Perspective,” Journal of Professional Services Marketing, 17 (2), 69-82. Rathmell, J.M. (1966),"What is Meant by Service?" Journal of Marketing, 30 (October), 32-36. Ravald, A. and Gronroos, C. (1996), "The Value Concept and Relationship Marketing," European Journal of Marketing, 30 (2), 19-30. Reeves, C.A. and Bednar, D.A. (1994), "Defining Quality: Alternatives and Implications," Academy of Management Review, 19 (3), 419-445.

338
Regan, W.J. (1963), "The Service Revolution," Journal of Marketing, 27 (July), 57-62. Reichardt, C.S. and Cook, T.D. (1979), “Beyond Qualitative versus Quantitative Methods,” in Cook, T.D. and Reichardt, C.S., Eds., Qualitative and Quantitative Methods in Evaluation Research, Sage, Beverly Hills, CA. Reichardt, C.S and Rallis, S.F., Eds. (1994), The Qualitative-Quantitative Debate: New Perspectives, New Directions for Program Evaluations Number 61, Spring 1994, Jossey-Bass, San Francisco, CA. Reichheld, F.F. (1993), "Loyalty-Based Management," Harvard Business Review, (March/April), 64-73. Reichheld, F.F., and Sasser, W.E. (1990), "Zero Defections: Quality Comes to Services," Harvard Business Review, (September/October), 105-111. Reidenbach, R.E. and Sandifer-Smallwood, B. (1990), "Exploring Perceptions of Hospital Operations by a Modified SERVQUAL Approach," Journal of Health Care Marketing, 10 (December), 47-55. Reve, T. and Stern, L. (1979), "Interorganizational Relationships in Marketing Channels," Academy of Management Review, 4 (July) 405-416. Reynoso, J. and Moores, B. (1995), "Toward the Measurement of Internal Service Quality," International Journal of Service Industry Management, 6 (3), 64-83. Reynoso, J. and Moores, B. (1996), "Internal Relationships," in Relationship Marketing: Theory and Practice, Buttle, F., ed., Paul Chapman Publishing, London. Richard, M.D. and Allaway, A.W. (1993), "Service Quality Attributes and Choice Behavior," Journal of Services Marketing, 7 (1), 59-68. Ring, P. and Van de Ven, A. (1994), "Development of Processes of Cooperative Interorganizational Relationships," Academy of Management Review, 19 (1), 80-118. Roach, S.S. (1991), "Services Under Siege: The Restructuring Imperative," Harvard Business Review, (September-October), 82-91. Robinson, L.M. and Cooper, P.D. (1980), Health Care Marketing: An Annotated Bibliography, Center for Disease Control, U.S. Dept. of Health, Education and Welfare, Atlanta, GA. Robson, C. (2002), Real World Research: a resource for social scientists and practitioner-researchers, Blackwell Publishers, Oxford. Roscoe, J.T. (1975), Fundamental research statistics for the behavioural sciences, 2nd edition, Holt, Rinehart and Winston, New York, NY. Rosen, L.D., Karwan, K.R. and Schribner, L.L. (2003), “Service quality measurement and the disconfirmation model: taking care of interpretation,” Total Quality Management, 14 (1), 2003.

339
Rosenbloom, B. (2004), Marketing Channels, 7th ed., Thomson South-Western, Mason, OH. Ross, C., Fommelt, C., Hazlewood, L., and Chang, R. (1987), "The Role of Expectations in Patient Satisfaction in Medical Care," Journal of Health Care Marketing, 7 (December), 16-26. Rubin, H.J and Rubin, I. S (1995), Qualitative Interviewing: The Art of Hearing Data, Sage, Thousand Oaks, CA. Ruekert, R.W. and Churchill, G.A. Jr. (1984), “Reliability and Validity of alternative Measures of Channel Member Satisfaction,” Journal of Marketing Research, 21 (May), 226-33. Rushton, A. and Carson, D. (1985), "The Marketing of Services: Managing the Intangibles," European Journal of Marketing, 19, 3. Russo, J. and Schoemaker, J. (1991), Confident Decision Making, Piatkus, London. Rust, R.T. and Oliver, R.L. (1994), “Service Quality: Insights and Managerial Implications From the Frontier,” in Services Quality: New Directions in theory and Practice, R.T. Rust and R.L. Oliver, eds., Sage Publications, Thousand Oaks, CA., 1-19. Rust, R.T. and Oliver, R.L. (1994), Service Quality: New Directions in Theory and Practice, Sage Publications, Thousand Oaks, CA. Rust, R.T. and Zahorik, A.J. (1993), "Customer Satisfaction, Customer Retention, and Market Share," Journal of Retailing, 69 (Summer), 193-215. Rust, R.T., Zahorik, A.J. and Keiningham, T.L. (1995), “Return on Quality (ROQ): Making Service Quality Financially Accountable,” Journal of Marketing, 52 (2), 58-70. Sachdev, S.B. and Verma, H.V. (2004), “Relative importance of service quality dimensions: a multisectoral study,” Journal of Services Research, 4 (1), 93-116. Sachs, W.S. and Benson, G. (1978), "Is It Time To Discard the Marketing Concept," Business Horizons, August, 68-74. Sanchez, P.M. (1983), "Marketing in the Health Care Arena: Some Comments on O'Connor's Evaluation of the Discipline," Journal of Health Care Marketing, 3,1, 24-30. Sasser, W.E. (1976), "Match Supply and Demand in Service Industries," Harvard Business Review, 54 (November-December), 133-40. Sasser, W.E., Olsen, R.P. and Wyckoff, D.D. (1978), Management of Service Operations: Text and Cases, Allyn and Bacon, Boston, MA. Savitt, R. (1980), "Historical Research in Marketing," Journal of Marketing, 44, 52-58.
340
Schall, M., Evans, B.B., and Lottinger, A. (1998), "Evaluating Predictors and Concomitants of Patient Health Visit Satisfaction: An Empirical Study Focusing on Methodological Aspects of Satisfaction Research," Health Marketing Quarterly, 15 (3), 1-24. Sharma, A. and Mehta, V. (2005), “Service quality perceptions in financial services – a case study of banking services,” 4 (2), 205-222. Schlesinger, L. and Heskett, J.L. (1991), "Enfranchisement of Service Workers," California Management Review, 33, 88-100. Schlissel, M.R. and Chasin, J. (1991), "Pricing of Services: An Interdisciplinary Review," The Services Industries Journal, 11 (July), 271-286. Schmenner, R. (1986),"How Can Service Businesses Survive and Prosper?" Sloan Management Review, 27 (Spring), 21-32. Schmenner, R. (1995), Service Operations Management, Prentice Hall, Englewood Cliffs, NJ. Schneider, B. and Bowen, D.E. (1984), "New Services Design, Development and Implementation and the Employee," in Developing New Services, W.R. George and C. Marshall, eds., American Marketing Association, Chicago, IL. Schneider, B. and Bowen, D.E. (1993), "The Service Organization: Human Resources Management is Crucial," Organizational Dynamics, Spring, 39-52. Schurr, P. and Ozanne, J. (1985), "Influence on Exchange Processes: Buyer's Preconceptions of a Seller's Trustworthiness and Bargaining Toughness," Journal of Consumer Research, 11 (March), 939-953. Secretaries of State for Health, England, Wales, Northern Ireland and Scotland (1989), Working for Patients, HMSO, London. Sekaran, U. (1992), Research Methods for Business: A Skill Building Approach, 2nd Edition, John Wiley & Sons, New York, NY. Seidman, I. (1998), Interviewing as Qualitative Research, 2nd Edition, Teachers College Press, New York, NY. Senge, P.M. (1994), The Fifth Discipline: The Art and Practice of the Learning Organization, paperback ed., Doubleday, New York, NY. Senge, P.M., Kleiner, A., Roberts, C., Ross, R.B., and Smith, B.J. (1994), The Fifth Discipline Fieldbook: Strategies and Tools for Building a Learning Organization, Nicholas Brealey Publishing, London, England. Seth, N., Deshmukh, S.G., and Vrat, P. (2005), “Service quality models: a review,” International Journal of Quality and Reliability Management, 22 (9), 913-949.

341
Shani, D. and Chalasini, S. (1992), "Exploiting Niches Using Relationship Marketing," Journal of Consumer Marketing, 9 (3), 33-42. Shapiro, B.P. (1973), "Marketing for Nonprofit Organizations," Harvard Business Review, September-October, Shapiro, B.P. (1988), "What the Hell is 'Market Oriented'?" Harvard Business Review, 6, November-December, 119-125. Shaughnessy, P., Crisler, K., Schlenker, R., Arnold, A., Kramer, A., Powell, M., Hittle, D. (1994), "Measuring and Assuring the Quality of Home Health Care," Health Care Financing Review, 16 (Fall), 35-67. Sheaff, R. (1991), Marketing for Health Services: A framework for communications, evaluation and total quality management, Open University Press, Buckingham. Sheth, J.N., Gardner, D.M., and Garrett, D.E. (1988), Marketing Theory: Evolution and Evaluation, John Wiley & Sons, New York, NY. Sheth, J.N. and Parvatiyar, A. (1995), "Relationship Marketing in Consumer Markets: Antecedents and Consequences," Journal of the Academy of Marketing Science, 23 (4), 255-271. Shostack, G.L. (1977),"Breaking Free from Product Marketing," Journal of Marketing, 41 (April), 73-80. Shostack, G.L. (1984a), "Designing Services That Deliver," Harvard Business Review, 62 (January-February), 133-39. Shostack, G.L. (1984b), "Service Design in an Operating Environment," in Developing New Services, W.R. George and C.E. Marshall, eds., American Marketing Association, Chicago, IL. Shostack, G.L. (1985), "Planning the Service Encounter," in The Service Encounter: Managing Employee/Customer Interaction in Service Business, J.A. Czepiel, M.R. Solomon and C.F. Surprenant, eds., Lexington Books, Lexington, MS. Shostack, G.L. (1987), "Service Positioning Through Structural Change," Journal of Marketing, 51 (January), 34-43. Silverman, D., Editor (1998), Qualitative Research: Theory, Method and Practice, Sage, London. Singh, J. and Sirdeshmukh, D. (2000), “Agency and Trust Mechanisms in Consumer Satisfaction and Loyalty Judgements,” Journal Academy of Marketing Science, 28 (1), 150-167. Sinkula, J.M. (1994), "Marketing Information Processing and Organizational Learning," Journal of Marketing, 58(January), 34-45.

342
Skinner, S., Gassenheimer, J., and Kelley, S. (1992), "Cooperation in Supplier-Dealer Relations," Journal of Retailing, 68 (2), 174-193. Slater, S. and Narver, J. (1994), "Does Competitive Environment Moderate the Market Orientation-Performance Relationship," Journal of Marketing, 58, 46-55. Slater, S. and Narver, J. (1995), "Marketing Orientation and the Learning Organization," Journal of Marketing, 59 (July), 63-74. Smith, A.M. (1995), "Measuring Service Quality: is SERVQUAL now Redundant?" Journal of Marketing Management, 11, 257-276. Smith, M.L. (1994), "Qualitative Plus/Versus Quantitative: The Last Word," in The Qualitative-Qualitative Debate: New Perspectives, Reichardt, C.S. and Rallis, S.F., Eds., Jossey-Bass, San Francisco, CA. Smith, W.R. (1956), "Product Differentiation and Market Segmentation as Alternative Marketing Strategies," Journal of Marketing, XXI (July), 3-8. Smith, A. and Bolton, R. (1998), “An Experimental Investigation of Ongoing Customer reactions to Service Failure and Recovery Encounter: Paradox or Peril?” Journal of Service Research, 1 (August), 65-81. Smith, A., Bolton, R. and Wagner, J. (1999), “A Model of Customer Satisfaction with Service Encounters Involving Failure and Recovery,” Journal of Marketing Research, 36 (August), 356-72. Snell, S., and Dean, J. (1992), "Integrated Manufacturing and Human Resource Management: A Human Capital Perspective," Academy of Management Journal, 35 (2), 467-504. Solomon, M.R., Surprenant, C., Czepiel, J.A., and Gutman, E.G. (1985), "A Role Theory Perspective on Dyadic Interactions: The Service Encounter," Journal of Marketing, 49 (Winter), 99-111. Spreng, R., MacKenzie, S. and Olshavsky, R. (1996), "A Re-examination of the Determinants of Consumer Satisfaction," Journal of Marketing, 60 (July), 15-32. Spreng, R., Harrell, G. and Mackoy, R. (1995), “Service Recovery: Impact on Satisfaction and Intentions,” Journal of Services Marketing, 9 (1), 15-23. Spreng, R. and Olshavsky, R. (1993), "A Desires Congruency Model of Consumer Satisfaction," Journal of the Academy of Marketing Science, 21 (Summer), 169-177). Spreng, R.A. and Singh, A.K. (1993), “An Empirical Assessment of the SERVQUAL Scale and the Relationship Between Service Quality and Satisfaction.” In Enhancing Knowledge Development in Marketing, Cravens, D.W. and Dickson, P. eds., American Marketing Association, Chicago, IL. 1-6.

343
Stanton, W.J., Miller, K.E. and Layton, R.A. (1991), Fundamentals of Marketing, 2nd Australian Edition, McGraw-Hill, Sydney. Stanton, W.J., Miller, K.E. and Layton, R.A. (1994), Fundamentals of Marketing, 3rd Australian Ed., McGraw-Hill, Sydney. Stata, R. (1989), "Organizational Learning: the Key to Management Innovation," Sloan Management Review, 10, 803-813. Stebbing, L. (1990), Quality Management in the Service Industry, Ellis Horwood, Chichester, England. Stevenson, K., Sinfield, P., Ion, V. and Merry, M. (2004), “Involving patients to improve service quality in primary care,” International Journal of Health Care Quality Assurance, 17 (5), 275-282. Stewart, D.M. (2003), “Piecing together service quality: a framework for robust service,” Production and Operations Management, 12 (2), 246-265. Stewart, D.W. and Shamdasani, P.N. (1990), Focus Groups: Theory and Practice, Sage, Newbury Park, CA. Stidsen, B. and Schutte, T.F. (1972), "Marketing as a Communication System: The Marketing Concept Revisited," Journal of Marketing, 36 (October), 22-27. Stiles, R.A. and Mick, S.S. (1994), "Classifying Quality Initiatives: A Conceptual Paradigm for Literature Review and Policy Analysis," Hospital and Health Services Administration, 39 (Fall), 309-326. Strauss, A. and Corbin, J. (1998), Basics of Qualitative Research, 2nd Edition, Sage, Thousand Oaks, CA. Sujan, M. and Deklava, C. (1987), "Product Categorization and Inference Making: Some Implications for Comparative advertising," Journal of Consumer Research, 14 (December), 372-378. Sumrall, D.A. and Eyuboglu, N. (1989), "Policies for Hospital Sales Programs: Investigating Differences in Implementation," Journal of Health Care Marketing, 9 (December), 41-47. Surprenant, C.F. ed. (1987), Add Value to Your Service, American Marketing Association, Chicago, IL. Surprenant, C.F., and Solomon, M.R. (1987), "Predictability and Personalization in the Service Encounter," Journal of Marketing, 51 (April), 86-96. Sviokla, J.J., and Shapiro, B.P., eds. (1993), Keeping Customers, The Harvard Business Review Book Series, Harvard Business School Publishing, Boston, MA.

344
Swan, J.E. and Bowers, M.R. (1998), “Services quality and satisfaction: the process of people doing things together,” Journal of Services Marketing, 12 (1), 59-72. Swan, J.E. and Combs, L.J. (1976), "Product Performance and Consumer Satisfaction: a New Concept," Journal of Marketing, 40 (April), 26-32. Swineheart, K.D. and Smith, A.E. (2005), “Internal supply chain performance measurement,” International Journal of Health Care Quality Assurance, 18 (7), 533-542. Tadepalli, R. (1992), "Marketing Control: Reconceptualizing and Implementation Using the Feedforward Method," European Journal of Marketing, 26, 24-40. Taguchi, G., and Clausing, D. (1990),"Robust Quality," Harvard Business Review, 68 (1), 65-75. Tax, S., Brown, S. and Chandrashekaran, M. (1998), "Customer Evaluations of Service Complaint Experiences: Implications for Relationship Marketing," Journal of Marketing, 60 (April), 60-76. Taylor, S (1995), “The Effects of Filled Waiting Time and Service Provider Control over the Delay on Evaluations of Service,” Journal of the Academy of Marketing Science, 23, 1, 33-48. Taylor, S.A. (1994), "Distinguishing Service Quality from Patient Satisfaction in Developing Health Care Marketing Strategies," Hospital and Health Services Administration, 39 (Summer), 221-236. Taylor, S.A. and Baker, T.L. (1994), “An Assessment of the Relationship Between Service Quality and Customer Satisfaction in the Formation of Consumer’s Purchase Intentions,” Journal of Retailing, 70, 168-178. Taylor, S.A. and Cronin, J.J.Jr. (1994), “Modeling Patient Satisfaction and Service Quality,” Journal of Health Care Marketing, 14 (1), 34-45. Taylor, S.J and Bogdan, R. (1998), Introduction to Qualitative Research Methods: A Guidebook and Resource, 3rd Edition, John Wiley & Sons, New York, NY. Taylor, V.A. and Miyazaki, A.D. (1995), “Assessing Actual Service Performance: Incongruities Between Expectation and Evaluation Criteria.” In Advances in Consumer Research, Kardes, F.R. and Sujan, M. eds., 22, 599-605. Teas, R. K. (1993), "Expectations, Performance Evaluation, and Consumer's Perceptions of Quality," Journal of Marketing, 57 (October), 18-34. Teas, R.K. (1994), "Expectations as a Comparison Standard in Measuring Service Quality: An Assessment of a Reassessment," Journal of Marketing, 58 (January), 132-139. Teas, R. K. and Agarwal, S. (2000), “The Effects of Extrinsic Product Cues on Consumers’ Perceptions of Quality, Sacrifice, and Value,” Journal of the Academy of Marketing Science, 28 (2), 278-290.

345
Teisberg, E., Porter, M., and Brown, G. (1994), "Making Competition in Health Care Work," Harvard Business Review, 72 (July-August), 131-141. Thibaut, J.W. and Kelley, H.H. (1959), The Social Psychology of Groups, Wiley, New York. Thomas, D.R. (1978), "Strategy is Different in Service Businesses," Harvard Business Review, 56 (July-August), 158-65. Thomasma, D.C. (1996), “Promisekeeping: An Institutional Ethos for Healthcare Today,” Frontiers of Health Services Management, 13 (2), 5-34. Tjosvold, D. (1992), Team Organization: An Enduring Competitive Advantage, John Wiley. Todd, J. (1993), "Quest for Quality or Cost Containment," Frontiers of Health Services Management, 10 (Fall), 51-53. Tomes, A.E. and Ng, S.C.P. (1995), “Service quality in hospital care: the development of in-patient questionnaire,” International Journal of Health Care Quality Assurance, 8 (3), 25-33. Traynor, K. (1985), "Research Deserves Status as Marketing's Fifth 'P'," Marketing News (special marketing manager's issue), 8 November. Tremblay, M.A. (1982), “The key informant interview: a non-ethnographic application” in Burgess, R. (ed.) Field Research: a Sourcebook and Field Manual, Allen and Unwin, London. Tse, D.K. and Wilton, P.C. (1988), “Models of Consumer Satisfaction Formulation: An Extension,” Journal of Marketing Research, 24 (August), 204-212. Tse, D.K., Nocosia, F.M. and Wilton, P.C. (1990), "Consumer Satisfaction as a Process," Psychology and Marketing, 7, 177-193. Tucker, L.R., Zaremba, R.A., and Ogilvie, J.R. (1992), "Looking at Innovative Multi-hospital Systems: How Marketing Differs," Journal of Health Care Marketing, 12 (June) 8-21. Tucker, J.L. and Adams, S.R. (2001), “Incorporating patients’ assessments of satisfaction and quality: an integrative model of patients’ evaluations of their care,” Managing Service Quality, 11 (4), 272-287. Tversky, A. and Kahneman, D. (1981), “The Framing of Decisions and the Psychology of Choice," Management Science, 21, 453-458. Uhl, K.P and Upah, G.D. (1983), “The Marketing of Services: Why and How Is It Different,” in Research in Marketing, 6, J.N. Sheth, ed., Elsevier, New York. Upah, G.D. and Fulton, J.N. (1985), “Situation Creation in Services Marketing,” in The Service Encounter, J. Czepiel, M. Solomon, and C. Surprenant, eds. Lexington Books, Lexington. MA, 255-264.
346
Vandermerwe, S. and Gilbert, D. (1991), "Internal Services: Gaps in Needs/Performance and Prescriptions for Effectiveness," International Journal of Service Industry Management, 2 (1), 50-60. Van de Ven, A. (1976), "On the Nature, Formation, and Maintenance of Relationships Among Organizations," Academy of Management Review, 1, 24-36. Van der Bij, J.D. and Vissers, J.M.H. (1999), “Monitoring health-care processes: a framework for performance indicators,” International Journal of Health Care Quality Assurance, 12 (5), 214-221. Van Doren, D.C., and Spielman, A.P. (1989), "Hospital Marketing: Strategy Reassessment in a Declining Market," Journal of Health Care Marketing, 9,1 (March), 15-24. Van Maanen, J. (Ed.) (1983), Qualitative Methodology, Sage, London. Van Waterschoot, W. and Van den Bulte, C. (1992), "The 4P Classification of the Marketing Mix Revisited," Journal of Marketing, 56 (October), 83-93. Varey, R.J. (1995a), “Internal marketing: a review and some interdisciplinary research challenge,” The Journal of Service Industry Management, 6 (1), 40-63. Varey, R.J. (1995b), "A Model of Internal Marketing for Building and Sustaining a Competitive Service Advantage," Journal of Marketing Management, 11, 41-54. Varey, R.J and Lewis, B.R. (1999), "A Broadened Conception of Internal Marketing," European Journal of Marketing, 33 (9/10), 926-944. Vavra, T.G. (1992), Aftermarketing: How to Keep Customers for Life Through Relationship Marketing, Irwin, New York, NY. Venkatesan, M., Schmalensee, D.M. and Marshall, C. eds. (1986), Creativity in Services Marketing: What's New, What Works, What's Developing, American Marketing Association, Chicago, IL. Voss, M.D., Calantone, R.J., and Keller, S.B. (2005), “Internal Service Quality,” Distribution and Logistics Management, 35 (3), 161-176. Wagner, H.C., Flemming, D., Mangold, W.G., and La Forge, R. (1994), "Relationship Marketing in Healthcare," Journal of Health Care Marketing, 14 (Winter), 42-47. Walbridge, S.W. and Delene, L.M. (1993), "Measuring Physician Attitudes of Service Delivery," Journal of Health Care Marketing, Winter, 6-15. Wallendorf, M. and Brucks, M. (1993), “Introspection in Consumer Research: Implementation and Implications,” Journal of Consumer Research, 20 (December), 339-359. Walshak, H. (1991), “An internal consensus can boost external success,” Marketing News, 25 (June), 13.

347
Walster, E., Walster, G.W. and Berscheid, E. (1978), Equity: Theory and Research, Allyn and Bacon, Boston. Walters, D. and Jones, P. (2001), “Value and value chains in health-care: a quality management perspective,” The TQM Magazine, 13 (5), 319-335. Wartman, S.A., Morlock, L.L., Malitz, F.E. and Palm, E.A. (1983), “Patient Understanding and Satisfaction as Predictors of Compliance,” Medical Care, 9, 886-891. Watson, G.H. (1993), Strategic Benchmarking: How to Rate Your Company's Performance against the World's Best, John Wiley and Sons, New York, NY. Weber, R.P. (1985), Basic Content Analysis, Quantitative Applications in the Social Sciences: 49, Sage, Beverly Hills, CA. Webster, F.E. (1988), "The Rediscovery of the Marketing Concept," Business Horizons, 31, May/June, 29-39. Webster, F.E. (1992), "The Changing Role of Marketing in the Corporation," Journal of Marketing, 56 (October), 1-17. Weitz, B., and Jap, S. (1995), "Relationship Marketing and Distribution Channels," Journal of the Academy of Marketing Science, 23 (4), 305-320. Weitzel, R. (1990), "Hospitals, IS Vendors Can Learn a Valuable Lesson from Korean Businessmen," Healthcare Informatics, 7 (10), 16. Welbourne, T., Johnson, D.E., Erez, A. (1998), "The Role-Based Performance Scale: Validity Analysis of a Theory-Based Measure," Academy of Management Journal, 41 (5), 540-555. Weld, L.D.H. (1951), "Early Experiences in Teaching Courses in Marketing," Journal of Marketing, 15 (April), 380-381. Wellins, R., Byham, W. and Wilson, J. (1991), Empowering Teams, Jossey-Bass, San Francisco. Westbrook, R.A. (1981), "Sources of Consumer Satisfaction with Retail Outlets," Journal of Retailing, 57 (Fall), 68-85. Wiersema, M. and Bantell, K. (1993), "Top Management Team Turnover as an Adaption Mechanism: the Role of the Environment," Strategic Management Journal, 14, 485-504. White, J. (1986), "The Domain of Marketing-Marketing and Non-Marketing Exchanges," The Quarterly Review of Marketing, Winter. Whittington, R. and Whipp, R. (1992), "Professional Ideology and Marketing Implementation," European Journal of Marketing, 26 (1), 52-63.

348
Williamson, P.J. (1991), "Supplier Strategy and Consumer Responsiveness: Managing the Links," Business Strategy Review, Summer, 75-90. Wilkinson, I. and Young, L. (1999), “Conceptual and methodological Issues in Cross-Cultural Relationship Research: A Commentary on Paper by Ahmed et al. and Coviello,” Australasian Marketing Journal, 7, 37-40. Wilson, D. (1995), “An Integrated Model of buyer-Seller Relationships,” Journal of the Academy of Marketing Science, 23 (4), 335-345. Wisner, J.D. and Stanley, L.L. (1999), “Internal relationships and activities associated with high levels of purchasing service quality,” Journal of Supply Chain Management, 35 (3), 25-32. Woodruff, R., Cadotte, E. and Jenkins, R. (1983), "Modeling Consumer Satisfaction Processes Using experience-Based Norms," Journal of Marketing Research, 20 (August), 296-252. Woodside, A.G., Frey, L.L., and Daly, R.T. (1989), "Linking Service Quality, Customer Satisfaction, and Behavioral Intention," Journal of Health Care Marketing, 9 (4), 5-17. Workman, J. (1993), "Marketing's Limited Role in New Product Development in Computer System Firms," Journal of Marketing Research, (November), 405-421. Wren, B., LaTour, S.A. and Calder, B.J. (1994), "Differences in Perceptions of Hospital Marketing Orientation between Administrators and Marketing Officers," Hospital and Health Services Administration, Fall, 341-358. Yasin, M.M., Czuchry, A.J., Jennings, D.L. and York, C. (1999), “Managing the Quality Effort in a Health Care Setting: An Application,” Health Care Management Review, 24 (1), 45-56. Yi, Y. (1990), "A Critical Review of Consumer Satisfaction," in Review of Marketing 1990, Zeithaml, V.A. ed., American Marketing Association, Chicago, 68-123. Yin, R.K. (1994), Case Study Research: Design and Methods, 2nd Ed., Sage, Thousand Oaks, CA. Young, J., Gilbert, F. and McIntyre, F. (1996), “An Investigation of Relationalism Across a Range of Marketing Relationships and Alliances,” Journal of Business Research, 35 (February), 139-151. Young, J. A. and Varble, D. L. (1997), “Purchasing’s performance as seen by its internal customers: a study in a service organization,” International Journal of Purchasing and Materials Management, 33 (3), 36-41. Zallocco, R.L and Joseph, W.B. (1991), "Strategic Market Planning in Hospitals: Is It Done? Does It Work?" Journal of Health Care Marketing, 11 (March) 5-11. Zaltman, G. and Vertinsky, I. (1971), "Health Services Marketing: A Suggested Model," Journal of Marketing, 35 (July), 19-27.

349
Zeithaml, V.A. (1981), "How Consumer Evaluation Processes Differ Between Goods and Services," in J.H Donnelly and W.R George, eds., Marketing of Services, American Marketing Association, Chicago, IL, 186-90. Zeithaml, V.A. (1988), “Consumer Perceptions of Price, Quality, and Value: A Means-End Model and Synthesis of Evidence,” Journal of Marketing, 52 (July), 2-22. Zeithaml, V.A. (2000), "Service Quality, Profitability, and the Economic Worth of Customers: What We Know and What We Need to Learn," Journal of the Academy of Marketing Science, 28 (1), 67-85. Zeithaml, V.A., Berry, L.L., and Parasuraman, A. (1988), "Communication and Control Processes in the Delivery of Service Quality," Journal of Marketing, 52 (April), 35-48. Zeithaml, V.A., Berry, L.L., and Parasuraman, A. (1993), "The Nature and Determinates of Customer Expectations of Service," Journal of Marketing Science, 21 (Winter), 1-12. Zeithaml, V.A., Berry, L.L. and Parasuraman, A. (1996), “The Behavioral Consequences of Service Quality,” Journal of Marketing, 60 (April), 31-46. Zeithaml, V.A. and Bitner, M.J. (2003), Services Marketing: Integrating Customer Focus Across the Firm, Irwin McGraw-Hill, Boston, MA. Zeithaml, V.A., Bitner, M.J. and Gremler, D.D. (2006), Services Marketing: Integrating Customer Focus across the Firm, 4th ed., McGraw-Hill Irwin, Boston, MA. Zeithaml, V.A., Parasuraman, A., and Berry, L.L. (1985), "Problems and Strategies in Services Marketing," Journal of Marketing, 49 (Spring), 33-46. Zeithaml, V.A., Parasuraman, A., and Berry, L.L. (1990), Delivering Quality Service: Balancing Customer Perceptions and Expectations, The Free Press, New York, NY. Zemke, R. (1989), The Service Edge, Plume, New York, NY. Zikmund, W.G. (2000), Exploring Marketing Research, 7th Edition, Dryden Press, Forth Worth, TX. Zimmerman, D., Karon, S., Arling, G., et al. (1995), "Development and Testing of Nursing Home Quality Indicators," Health Care Financing Review, 16 (Summer), 107-128.