interim results - ite group
TRANSCRIPT

Interim ResultsSix months to 31 March 2019
14 May 2019
ITE Group plc

› HY19 – Delivering
Transformation and GrowthMark Shashoua
› Interim results Andrew Beach
› TAG programme update Mark Shashoua
› Q&AMark Shashoua &
Andrew Beach
Agenda
1 /
2 /
HY19 – Delivering Transformation and Growth
1 Like-for-like results are stated on a constant currency basis, after excluding events which took place in the current period but did not take place under our ownership in the comparative period and after excluding events which took place in the comparative period but did not take place under our ownership in the current period. For clarity, this excludes all: Biennial events; Timing differences (i.e. events that ran in only one of the current or comparative periods, due to changes in the event dates); Launches; Cancelled or disposed of events that did not take place under our ownership in the current year; Acquired events in the current period; and Acquired events in the comparative period that didn’t take place under our ownership in the comparative period (i.e. they took place pre-acquisition).
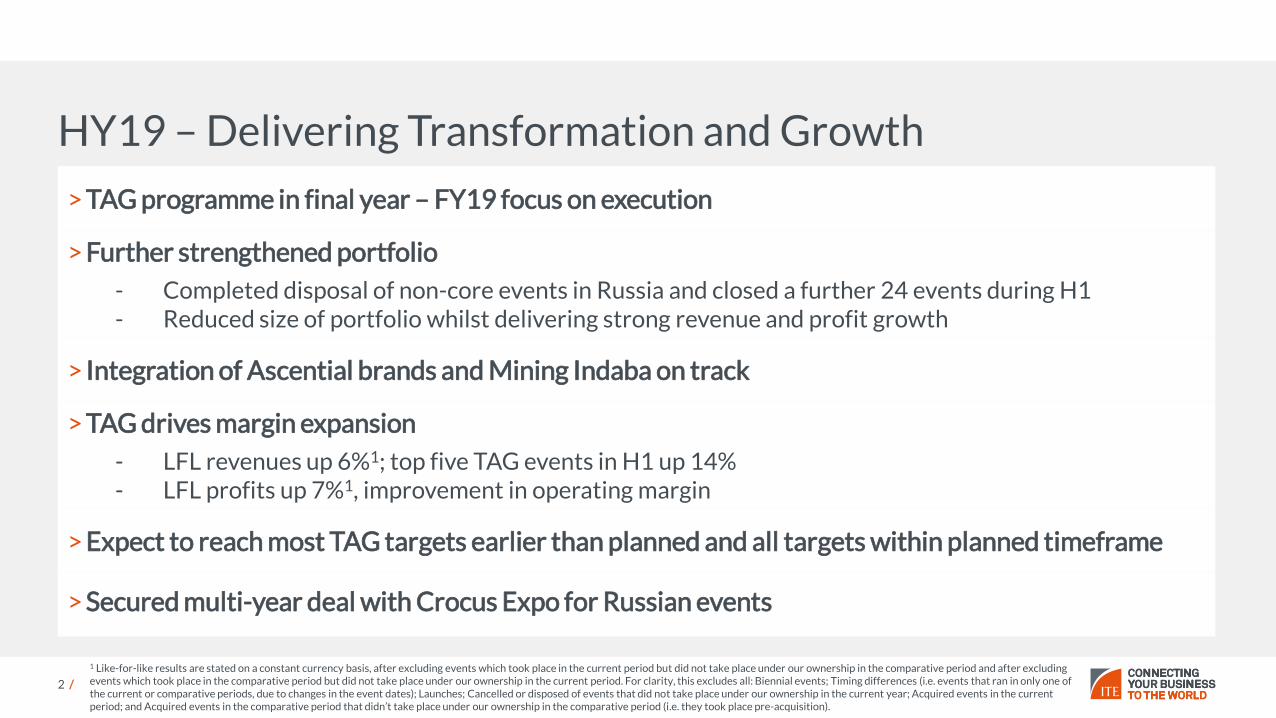
> TAG programme in final year – FY19 focus on execution
> Further strengthened portfolio
- Completed disposal of non-core events in Russia and closed a further 24 events during H1- Reduced size of portfolio whilst delivering strong revenue and profit growth
> Integration of Ascential brands and Mining Indaba on track
> TAG drives margin expansion
- LFL revenues up 6%1; top five TAG events in H1 up 14% - LFL profits up 7%1, improvement in operating margin
> Expect to reach most TAG targets earlier than planned and all targets within planned timeframe
> Secured multi-year deal with Crocus Expo for Russian events

Interim results
Andrew Beach
3 /

Financial highlights
4 /
Interim results: six months ended 31 March 2019
1 Restated for rights issue2 Pro forma basis, adjusted as if Ascential Events acquisition completed on 1 April 2018
HY19 HY18
Revenue £107.8m £75.4m LFL growth 6%; excluding Acetech Delhi 8%
Headline PBT £24.5m £16.0m LFL growth 7%; excluding Acetech Delhi 11%
Operating profit margin 25.1% 23.1% Increase of 2pp
TAG costs one-off £2.5m £2.9m
Within guidanceongoing £3.0m £2.7m
Ascential integration costs one-off £3.2m £nil Within guidance
Net debt £108.9m £51.2m <2x EBITDA2, within guidance
Headline diluted EPS 2.3p 2.3p1
Dividend 0.9p 0.9p1 In line with policy

Revenue bridge
5 /
Interim results: six months ended 31 March 2019
(£5.5m)
(£3.0m) (£2.8m)
£40.3m
£3.4m
£75.4m
£107.8m
HY18 Net Biennial& Timing
Acquisitions& Disposals
Launches &Cancellations
FX Impact UnderlyingTrading
HY19
£m
RUB (1.4)
INR (0.6)
TRY (0.6)
Other (0.2)
£m
Russia 2.3
AOW 1.2
Acetech Delhi (1.2)
Other 1.1
£m
Ascential / Mining Indaba
49.4
ITE Expo (Russia) / ECMI (SE Asia)
(9.1)

Double digit revenue growth from top five TAG events in HY19
6 /
LFL revenue growth TOTAL events
6%LFL revenue growth top five TAG events
14%
Interim results: six months ended 31 March 2019

Headline PBT bridge
7 /
Interim results: six months ended 31 March 2019
(£1.9m)
(£0.9m)(£0.9m)
(£0.3m)
£11.8m
£0.7m
£16.0m
£24.5m
HY18 Net Biennial& Timing
Acquisitions& Disposals
Launches &Cancellations
FX Impact TAG Costs UnderlyingTrading
HY19
£m
Revenue translational (2.8)
Cost translational 2.3
Trading impact (0.5)
B/S transactional HY19 0.2
B/S transactional HY18 0.6
Movement (0.4)
£m
Ascential / Mining Indaba
14.0
ITE Expo (Russia) / ECMI (SE Asia)
(2.2)

TAG costs in line with guidance
8 /
> Total TAG one-offs will be within £20m
> TAG ongoing costs tracking at £8m-£9m annualised, in line with guidance
£2.5m
£14.5m
£20m
Actual HY19 Actual to date Total Guidance
TAG one-offs(Not included in Headline results)
Interim results: six months ended 31 March 2019

Ascential integration costs also on track and within guidance
9 /
Ascential one-offs(Not included in Headline results)
Interim results: six months ended 31 March 2019
> Total Ascential one-offs will be within £11m, in line with guidance
£9m integration
£2m synergy release
Actual HY19 Actual to date Total Guidance
£6.6m
£3.2m
£11m

10 /
Ascential Events integration largely complete
IntegrationSynergies
c.£5m annualised expected(vs £4m-£5m guidance)
Investment plansto drive FY20 growth
(£2m-£2.5m annualised cost)
Interim results: six months ended 31 March 2019
On trackUpper endguidance
Largely complete

Strong revenue visibility for FY19 and FY20
11 /
£143m1
(of £158.6m2)= 90% of
total revenue
£200m3
(of £213.6m)= 94% of
consensus
LFL increase of
6%
FY19 FY20
£58m3
(of £227.0m)= 26% of
consensus
£50m1
(of £213.6m)= 23% of
consensus
LFL increase of
11%
1 Booked at 10 May 2018 at actual event FX rates2 Pro-forma total revenue excluding those relating to Ascential Events acquisition3 Booked at 10 May 2019 at actual event rates for past events and at FX rates at 9 May 2019 for future events
Interim results: six months ended 31 March 2019
FY18at May 2018
FY19at May 2019
FY19at May 2018
FY20at May 2019

Ahead of plan on most TAG targets
12 /
Interim results: six months ended 31 March 2019
TAG pillar1 Target Original plan Revised Status
1
Positive ROI FY20 FY19 Ahead
ROI>WACC FY21 FY20 Ahead
Cash payback FY21 FY21 Ahead2
1-3
High single digit LFL revenue growth FY22 FY18 Ahead
High 20s operating profit margin FY22 FY22 On track
1 TAG pillar 1 = Create a scalable platformTAG pillar 2 = Manage the portfolioTAG pillar 3 = Product-led acquisitions
2 Original plan delivery expected H2 FY21; revised to H1 FY21

On track to deliver our 3-year guidance
13 /
Interim results: six months ended 31 March 2019
FY18 FY19 FY20
Revenue growth
Margin growth
EPS growth

Financial summary
Strong LFL revenue growth; top five TAG events double digit revenue growth
Profit growth above revenue growth
Ascential Events integration largely complete
Excellent FY19/FY20 forward booking growth
Early delivery expected on most TAG targets
14 /
Operational cash flows remain strong
Interim results: six months ended 31 March 2019

TAG programme update
Mark Shashoua
15 /

Our vision
“To create the world’s leading portfolio of content-driven,
must-attend events delivering an outstanding experience and ROI for our customers.”
16 /
TAG programme update

TAG - the Transformation and Growth programme
Create a Scalable Platform
Underpinned by a performance-led culture
TAG Programme
17 /
TAG programme update – Create a scalable platform

Change Operating
Model
Drive a performance culture
Build a fit for purpose IT infrastructure & systems
Build capability & talent
Invest in show operations
Create best practice functions & teams
Create a Scalable Platform – best practice approach
18 /
TAG programme update – Create a scalable platform

19 /
Benefitting from investing in event operations
New customer service team helps exhibitors maximise success
Systematic lead generation for each core event
New business generation almost doubled
Exhibitor NPS increased 8% to +17; industry average is -17*
New high quality content attracts key visitors
Visitor NPS increased 5% to +29; industry average is +7**
TAG programme update – Create a scalable platform
*UFI & Explori, Global Exhibitor Insights, November 2017 Edition**UFI & Explori, Global Visitor Insights, 2018/19 Edition

› MosBuild moved to Crocus Expo, Russia’s largest venue,
from 2019
› Much improved content programme with Perfect Home,
VR design lab and MosBuild TV
› Volume up 15%
› Visitor numbers up 19%
› Key buyers up 19%
MosBuild 2019
20 /
TAG programme update – Create a scalable platform

Africa Oil Week 2018
21 /
TAG programme update – Create a scalable platform
› Speaker numbers increased 30%
› Government ministers attending increased 36%
› Paid delegates increased 54%
› New business more than quadrupled
› Delegate Net Promoter Score improved 18 points to +27
› Exhibitor Net Promoter Score improved 39 points to +32

FY 2017 FY 2018 FY 2019
Create ‘best practice’ functions & teams
Invest in event operations
Build a ‘fit for purpose’IT infrastructure& systems
Drive a performance culture
Build capability & talent
TAG milestones
New event content deployed
Roll out of event ‘blueprint’
Roll out of dedicated specific training programmes
Implementation of the ‘ITE way’Design of the ‘ITE way’
Setup of Customer Success team Implementation of value-based pricing methods
Setup of dedicated Content team
Review of performance structure
Development of Sales leadership
Standardisation of Performance Management
22 /
Systems design & development Systems deployed in phased waves
Launch of integrated sales and marketing systems
1st new hardware roll out Launch of ‘one view’ back office systems
Recruitment of key organisational roles
March 2019
TAG programme update – Create a scalable platform

TAG - the Transformation and Growth programme
TAG programme update – Manage the portfolio
Managethe Portfolio
Underpinned by a performance-led culture
TAG Programme
23 /
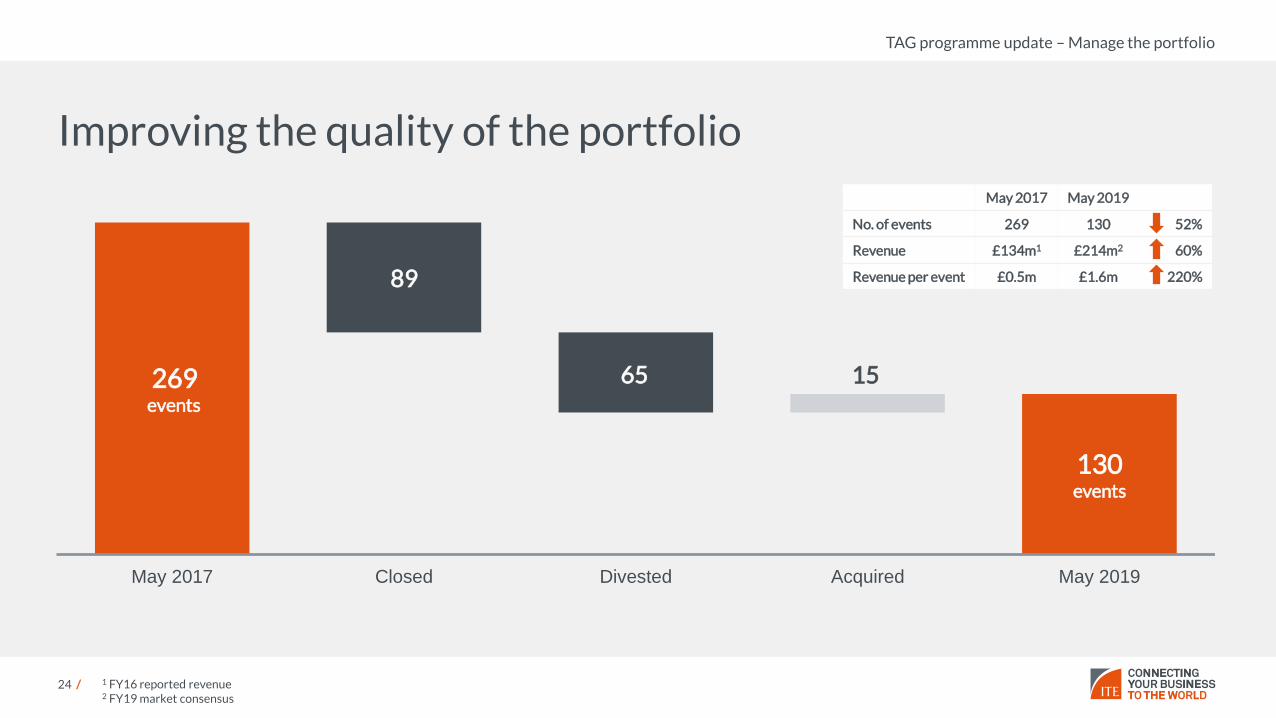
Improving the quality of the portfolio
24 /
269 events
130events
May 2017 Closed Divested Acquired May 2019
89
65 15
1 FY16 reported revenue2 FY19 market consensus
May 2017 May 2019
No. of events 269 130 52%
Revenue £134m1 £214m2 60%
Revenue per event £0.5m £1.6m 220%
TAG programme update – Manage the portfolio

TAG - the Transformation and Growth programme
TAG programme update – Product-led acquisitions
Product-led Acquisitions
Underpinned by a performance-led culture
TAG Programme
25 /

Ascential Events integration update
Integration largely complete
Synergy savings on track to meet upper end of guidance at c.£5m
Investment plans in place and best practice implementation started
26 /
TAG programme update – Product-led acquisitions

Reinvesting half of the synergies to drive growth
27 / 1 Moda was an existing ITE event
TAG programme update – Product-led acquisitions
Re-edit events and add new sectorsVisitor acquisition teams to target online and major chains
Sector expansion in GermanyRegional expansion in the US and ChinaInvestigate new markets over the longer term
Focus on customer proposition
Reinvesting half of the synergies to drive 2020 growthProduct
Re-edit events to improve customer experienceFocus on key accountsGrow international events to scale and investigate new markets
1

28 /
Mining Indaba acquisition
› Met the TAG acquisition criteria as the must-attend event in the
African mining industry
› Strong strategic rationale and complementary to Africa Oil Week
› AOW and MI teams now merged to drive synergies
› Implementation of ITE best practice will drive growth from FY20
onwards
TAG programme update – Product-led acquisitions
28 /

HY19 Summary and Outlook
6% LFL revenue growth; top five TAG events 14% revenue growth
Margins grew to 25%as we benefitted from TAG
Forward bookings for FY20 up 11% on a LFL basis
Further benefits of TAG will flow from FY20
29 /
FY19 trading in line with Board expectations
Expect to reach most TAG targets earlier than planned
Summary and Outlook

Q&A
30 /

Interim results: Appendices
Six months ended 31 March 2019
31 /

Positive ROI
Plan Within 3 years (FY20)
Update Within 2 years (FY19)
FY17 FY18 FY19 FY20 FY21 FY22
TAG plan Update
In-year net operating profit after tax (“NOPAT”)
“Create a scalable platform” targets ahead of plan
Positive ROI in FY 2019
32 /
1
1 Based on May 2017 WACC
ROI > WACC1
Plan Within 4 years (FY21)
Update Within 3 years (FY20)
Cash Payback
Plan Within 4 years (FY21)
Update Within 3.5 years (FY21)
2
3
Interim results: Appendices

33 /
Driving sustainable revenue growth and operating profit margins
Operating profit margin %
Entry Velocity 2017 Low twenties
Exit Velocity 2022 High twenties
Like-for-like revenue growth %
Entry Velocity 2017 Low single digit
Exit Velocity 2022 High single digit
-10%-12%
-8%
5%
11%
LFL revenue growth
35% 36%
29%
23% 22%25% 26%
Operating profit marginCity consensus
4
5
Interim results: Appendices

Consolidated Income Statement
34 /
Headline Results HY19 HY18
£m £m
Revenue 107.8 75.4
Gross Profit 40.2 28.1
Gross Profit Margin 37% 37%
Admin Expenses/Operating Income (20.5) (18.0)
FX 0.1 0.6
Profit from Associates 7.3 6.7
Operating Profit 27.1 17.4
Net Finance Costs (2.6) (1.4)
PBT 24.5 16.0
EPS 2.3p 2.3p1
Statutory Reconciliation HY19 HY18
£m £m
Headline PBT 24.5 16.0
Adjusting Items (22.6) (14.7)
Statutory PBT 1.9 1.3
1 Restated from HY18 EPS of 3.7p due to rights issue
Interim results: Appendices

Divisional analysis
35 /
HY19 HY18
Revenue HPBT Revenue HPBT
£m £m £m £m
Global Brands 31.7 13.4 6.7 2.6 > Ascential Events acquisition (4 events in H1)
Asia 12.4 9.5 16.7 10.6> Impact of biennial> Profit supported by strong growth from Sinostar joint venture
Central Asia 6.7 0.7 7.5 1.4> Timing differences> Some recovery from oil prices
E/S Europe 3.7 - 4.6 (0.1)> FX impact> LFL growth in revenue
Russia 24.1 8.0 35.3 11.0> Strong performance of Core events, offset by currency impact > Largest allocation of TAG investment
UK 29.2 8.7 4.6 0.8 > Ascential Events acquisition (3 events in H1)
Other Income 0.1 0.1 > Management fee income from associates
Central Costs (13.5) (9.6) > Planned TAG cost increases
FX Gain 0.1 0.6 > Balance sheet retranslation of monetary assets and liabilities
Net Finance Costs (2.5) (1.4) > Interest on bank loans and bank charges, offset by deposit income
Total 107.8 24.5 75.4 16.0
Interim results: Appendices
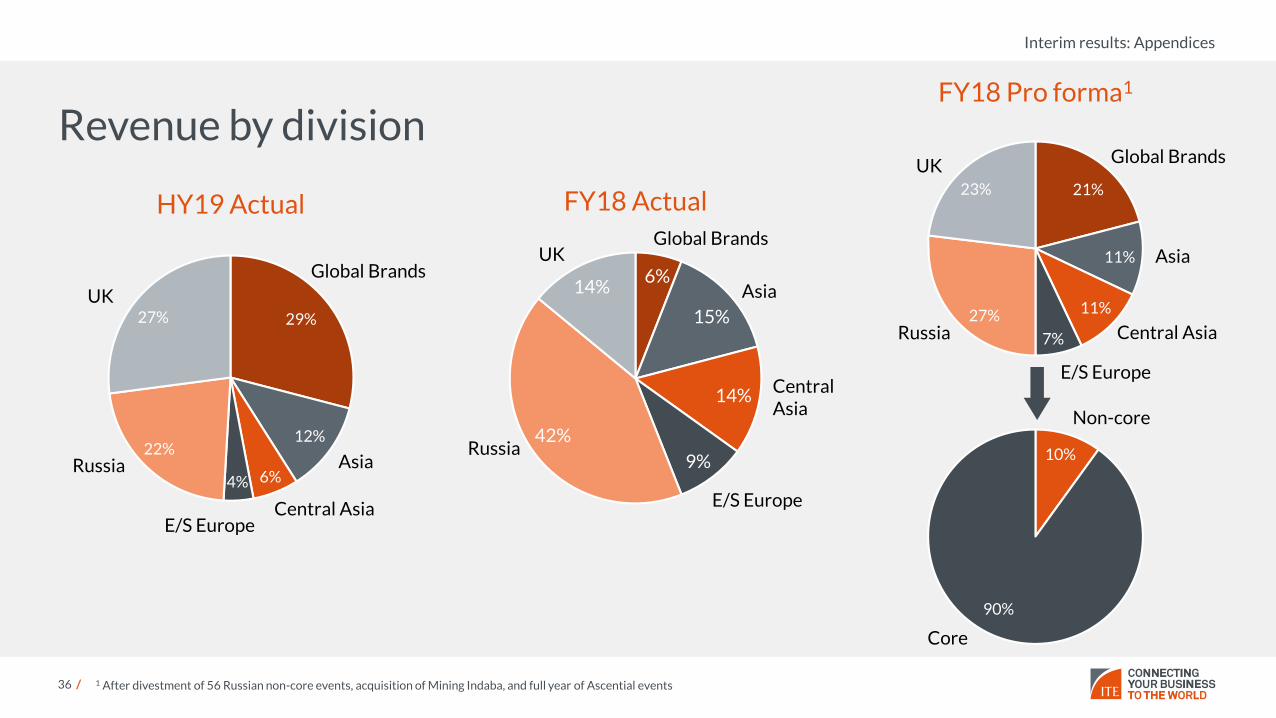
21%
11%
11%
7%
27%
23%
FY18 Pro forma1
Russia
E/S Europe
Asia
Global Brands
Central Asia
UK
6%
15%
14%
9%
42%
14%
FY18 Actual
Russia
E/S Europe
Asia
Global Brands
Central Asia
UK
36 /
Revenue by division
10%
90%
Non-core
Core
1 After divestment of 56 Russian non-core events, acquisition of Mining Indaba, and full year of Ascential events
29%
12%
6%4%
22%
27%
HY19 Actual
Russia
E/S Europe
Asia
Global Brands
Central Asia
UK
Interim results: Appendices

37 /
Revenue by sector
HY19 (HY18 figures in brackets)
19%
15%
13%
9%
9%
8%
8%
5%
5%3%
3% 3%
Retail (0%)
Build & Interiors (26%)
Education (0%)
Fashion (9%)
Travel & Tourism (13%)
Food & Packaging (12%)
Connect (1%)
Transport & Logistics (7%)
Oil, Gas & Energy (7%)
Manufacturing & Industrial Tech (12%)
Advanced Technologies (7%)
Beauty & Healthcare (6%)
Interim results: Appendices

Performance analysis
38 /
Metres Revenue Gross Profit
000s £m £m
HY18
Results from events 353 75.4 28.1
Biennial (27) (4.7) (1.7)
Timing (12) (2.1) (1.0)
Non-recurring (16) (3.0) (1.0)
Disposals (44) (9.1) (3.2)
Recurring events b 254 56.5 21.2
HY19
Acquisitions 104 49.4 19.2
Launches - - -
FX translation - (2.8) (0.9)
TAG costs - - (0.5)
LFL change a (7) 3.4 0.4
HY19
Recurring events 351 106.5 39.4
Timing 1 0.5 0.4
Biennial 2 0.8 0.4
Results from events 354 107.8 40.2
LFL growth (a/b) (3%) 6%
Interim results: Appendices

Headline diluted EPS bridge
39 /
(0.1p)
(0.1p)
(1.6p)1.6p
0.2p
2.3p1 2.3p
HY18 TAG costs Increase inunderlying profits
Decrease inNCI profits
Change in effectivetax rate
Change in no. ofshares in issue
HY19
1 Restated for rights issue
Interim results: Appendices

Adjusting items
40 /
HY19 HY18
£m £m
Operating items
Amortisation of acquired intangible assets Non-cash (12.0) (5.8)
Derecognition of goodwill on cessation of trade Non-cash - (2.2)
Loss on disposal Non-cash (2.4) -
Transaction costs Cash (1.4) (0.7)
Integration costs and costs of realising synergies Cash (3.4) -
Restructuring costs Cash (2.1) (4.1)
Tax on income from associates and joint ventures Non-cash (1.7) (1.5)
Financing items Revaluation of assets and liabilities on completed acquisitions and disposals Non-cash 0.4 (0.4)
Total (22.6) (14.7)
Interim results: Appendices

Consolidated balance sheet
41 /
HY19 HY18
£m £m
Non-current assets
Goodwill and intangible assets 491.8 143.2
Other non-current assets 57.2 59.0
549.0 202.2
Current assets
Trade debtors 35.2 39.4
Prepayments 13.2 10.6
Other current assets 17.0 12.0
65.4 62.0
Creditors
Net debt (108.9) (50.2)
Deferred revenue (93.4) (86.9)
Trade and other payables (33.6) (19.5)
Deferred consideration and equity option liabilities (21.1) (13.8)
Net deferred tax liabilities (35.0) (12.6)
Provisions (1.9) (0.8)
(293.9) (183.8)
Net assets 320.5 80.4
(78.6) (56.4)
Interim results: Appendices

Future consideration
1 Earliest financial year Puts & Calls are exercisable42 /
Deferred Consideration – Cash Settle £m Financial Year Payable
ABEC 0.8 2019
Mining Indaba 8.7 2019
9.5
Puts & Calls - Cash Settle £m Financial Years1
Fasteners 0.1 2020
Indobuild 1.6 2020
Scoop (for 5% MI) 0.1 2019
1.8
Puts & Calls - Equity Settle £m Financial Years1
ABEC 11.3 2020
11.3
Interim results: Appendices

Banking facility
43 /
£144m
£16m
At 31 March 2019
Drawn
Undrawn
› Net debt - £108.9m
› 2.0x headline EBITDA
› Available Facility – £160m (and £30m accordion)
› Drawn Facility – £144m1
› Term loan £65m amortising at £17.5m / £17.5m / £30m; balance RCF
› Interest Rate – LIBOR + 2-2.75%
› 2.5x net debt:EBITDA covenant
› Term – November 2021
1 Shown on Balance Sheet as £142m, net of capitalised refinance fees
Interim results: Appendices
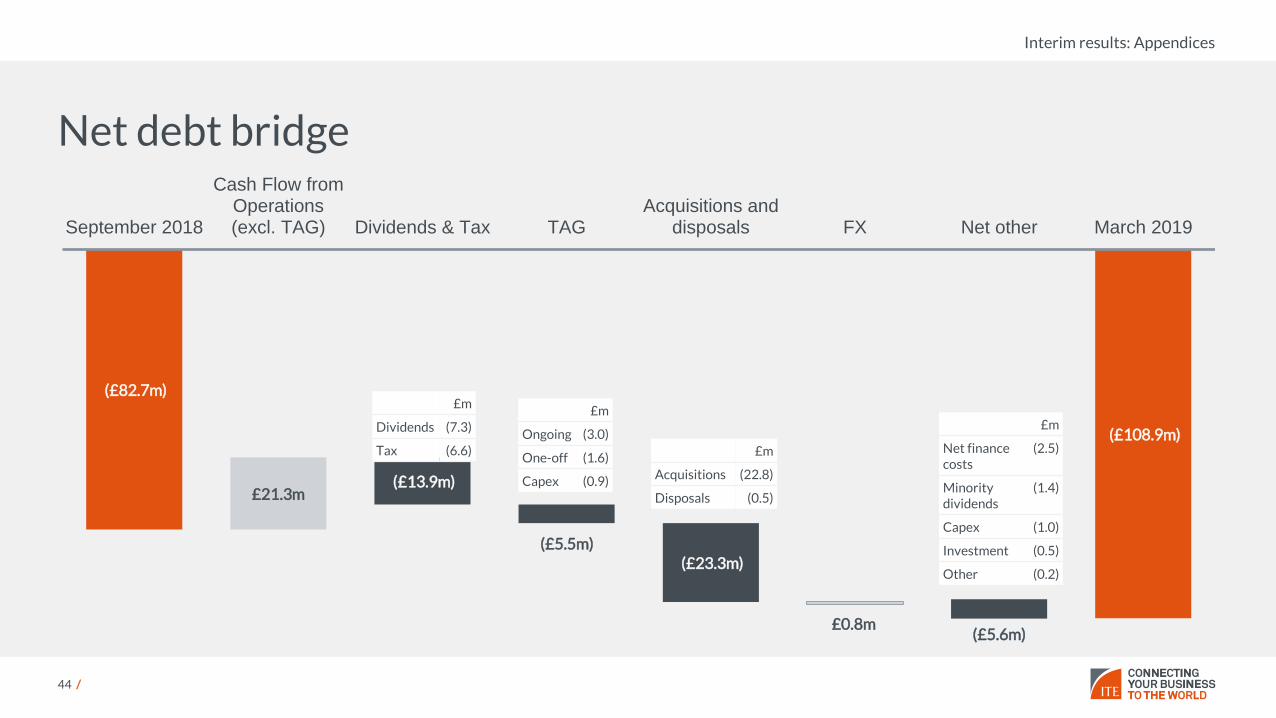
Net debt bridge
44 /
(£82.7m)
(£108.9m)
£21.3m
£0.8m
(£13.9m)
(£5.5m)(£23.3m)
(£5.6m)
September 2018
Cash Flow fromOperations(excl. TAG) Dividends & Tax TAG
Acquisitions anddisposals FX Net other March 2019
£m
Dividends (7.3)
Tax (6.6)
£m
Ongoing (3.0)
One-off (1.6)
Capex (0.9)
£m
Acquisitions (22.8)
Disposals (0.5)
£m
Net finance costs
(2.5)
Minority dividends
(1.4)
Capex (1.0)
Investment (0.5)
Other (0.2)
Interim results: Appendices

Venue relationships
45 /
Venue Loans / Prepayments HY19 HY18
£m £m
Russia 7.0 6.6
Central Asia 0.8 1.3
Total (£7.0m < 1 Yr, £0.8m > 1 Yr) 7.8 7.9
Interim results: Appendices

Cash generated from operations
46 /
HY19 HY18
£m £m
Statutory operating profit 4.0 3.1
Adjustments 10.1 4.6
Operating cash flows before movements in working capital 14.1 7.7
Working capital movements 2.5 4.4
Cash generated from operations 16.6 12.1
HY19 HY18
£m £m
Cash generated from operations 16.6 12.1
Interest received 0.3 0.4
Interest paid (2.9) (1.8)
Tax paid (6.4) (4.0)
Free cash flow from the business 7.6 6.7
Interim results: Appendices

47 /
Shareholder structure as at 30 April 2019
Country of Shareholder % of Total Shares No. of Shares (millions)
RWC Partners UK 15.3 113.5
Brandes Investment Partners USA 13.6 100.7
Fidelity Management & Research UK, USA 8.5 62.8
Bestinver Asset Management Spain 5.2 38.9
Invesco Canada 4.8 35.5
Legal & General Investment Management UK 4.3 32.2
Amiral Gestion France 3.9 28.6
JO Hambro Capital Management UK 3.8 28.1
BlackRock UK 3.8 27.9
MN Services Netherlands 3.1 22.6
Directors 0.2 1.7
Other institutions and individuals 33.5 261.8
Total Shares in Issue 100 754.3
Interim results: Appendices

48 /
Consensus forecast1
Consensus Minimum Maximum
2019
Turnover (£m) 213.6 210.0 216.8
Headline profit before tax (£m) 50.2 50.1 50.3
Headline diluted EPS (pence) 4.9 4.9 4.9
Net debt (£m) 111.5 107.4 115.0
2020
Turnover (£m) 227.0 223.6 229.9
Headline profit before tax (£m) 55.6 55.1 56.0
Headline diluted EPS (pence) 5.3 5.2 5.4
Net debt (£m) 94.4 90.0 97.7
1 Based on analyst reports to 8 May 2019
Interim results: Appendices

49 /
192175
136 134
153
176
Revenue (£m)
FY13 FY14 FY15 FY16 FY17 FY18
-11%CAGR
+9%1
CAGR
TAG
Setting the context
May 2017
› Limited organic growth
› Decentralised model
› Large, unfocused portfolio
› Underinvested
1 Excluding Ascential Events
Interim results: Appendices

50 /
Divisional structure of recently acquired events
UKEvents Acquired from
Ascential
Ascential
Ascential
Ascential
Ascential
Ascential
Ascential
Euromoney
Global Brands
Interim results: Appendices

Driving growth from Ascential events from FY20
51 /
Investment Phase Growth Phase
FY19 FY20
Jan Feb Mar Apr May Jun Jul Aug Sep Oct Nov Dec
Interim results: Appendices

35%
Top 10 as a % of our portfolio
Top 10 Other
Previous portfolio
52 /
A more balanced portfolio for the combined groupTop 10 events – May 2017
1 MosBuild Russia
2WorldFoodMoscow
Russia
3 MITT Russia
4AquaThermMoscow
Russia
5 TurkeyBuild E/S Europe
6AcetechMumbai
Asia
7 MIOGE Russia
8 RosUpack Russia
9 YugAgro Russia
10Breakbulk Europe
Global Brands
Top 10 events – May 2019
1 Spring Fair UK
2 MosBuild Russia
3 Bett UK Global Brands
4 Autumn Fair UK
5WorldFoodMoscow
Russia
6CWIEME Berlin
Global Brands
7MiningIndaba
Global Brands
8 MITT Russia
9 RosUpack Russia
10Breakbulk Europe
Global Brands
Note: Events ranked by revenue1 Bett, CWIEME and Mining Indaba classified under Global Brands; other acquired revenue under UK. Moda moved from Global Brands to UK
11%3%
20%
13%
53%
Revenue by division1
Global Brands Asia Central Asia E/S Europe Russia UK
24%
10%
7%7%
28%
24%
44%
Current portfolio
Interim results: Appendices

Phase 1 Quick screening
Phase 2Thorough analysis
Phase 3Due diligence
Phase 4Transaction
Objective “be effective” “identify pearls” “don’t miss risk” “fair deal”
Activity Screen events employing a set ofclear criteria
Assessment of concrete potential for ITE
Strategic / market DDFinancial DDSynergy estimate
Integration planning
Final price negotiationDeal structuring (e.g. earnout)
TAG programme - Product-led acquisitions
M&A funnel
Example Screening Criteria
Size
Distinct Customer Value Proposition
Structurally Attractive Market for Exhibitions
High Growth Underlying Market
Organic Revenue Growthand Profit Margin
International Roll Out Potential
ROIC
EPS Accretion
53 /
Interim results: Appendices