interim report third quarter announcement2012 norden a/s, 52, strandvejen, dk-2900 hellerup,...
TRANSCRIPT

DAMPSKIBSSELSKABET NORDEN A/S, 52, STRANDVEJEN, DK-2900 HELLERUP, DENMARK, WWW.DS-NORDEN.COM, CVR NO. 67758919 1/22
Interim report – third quarter 2012 Announcement no. 18
14 November 2012
Key figures and ratios (USD million)
Highlights:
Q3 2012
1/1-30/9 2012
Operating earnings (EBITDA) were USD 23 million (USD 36 million) in the third
quarter. Market conditions in both Dry Cargo and Tankers were significantly worse
than in the same period last year.
Cash flows from operations were USD 29 million in the third quarter.
Earnings in the Dry Cargo Department were on average 35% above the market
due to high coverage at good rate levels. EBITDA in Dry Cargo was USD 26 million
(USD 35 million) in the quarter, whereas earnings in Tankers were 7% below the
1-year T/C rates but still above the spot market. In the third quarter, the Tanker
Department realised an operating loss of USD 1 million against a profit of USD 3
million in the same period last year.
In the first 9 months of the year, NORDEN generated a total EBITDA of USD 104
million (USD 124 million). Adjusted for non-recurring income, operating earnings
are 11% down from last year.
EBITDA
Group EBITDA Dry Cargo Tankers
23
26 -1
104
96 15
EBIT (before write-downs) As a result of lower earnings and higher depreciation, NORDEN realised an
operating loss (EBIT) of USD 1 million in the third quarter. For the first 9 months
of the year, EBIT (before write-downs) amounted to USD 34 million.
Group -1 34
NORDEN continues to optimise the core fleet through sales and contracting of new
fuel efficient tonnage. Since the beginning of the third quarter, the Company has
sold 7 dry cargo vessels and contracted 2 Handysize tanker vessels and 1 ice-class
Panamax dry cargo vessel.
Theoretical NAV The market values of vessels dropped by further 6% during the third quarter.
NORDEN's total theoretical Net Asset Value (NAV) decreased by 13% to DKK 198
per share in the third quarter. However, this calculation is excluding significant
coverage contracts which are estimated at a value of USD 215 million or DKK 30
per share. If the freight rate curve and vessel prices change by 10%, the
theoretical NAV will change by 18%.
DKK per share
198
Coverage 2012 2013 In the Dry Cargo Department, coverage for 2013 has increased from 44% to 56%,
primarily in the two main vessel types Panamax and Handymax where total
coverage is now approximately 100%. In Tankers, the Company is still very
exposed to the spot market. However, it is expected that the winter market will
provide an opportunity for increasing coverage for 2013.
Dry Cargo Tankers
109% 31%
56% 12%
Outlook 2012 NORDEN maintains its expectations for a full-year EBITDA of USD 110-150 million.
EBITDA 110-150 President and CEO Carsten Mortensen in comment: "I am very pleased that
NORDEN generates a positive cash flow from operations of USD 29 million in the
third quarter despite challenging market conditions. This is what counts in times
like these. We are financially strong, and the Company continues to optimise the
fleet through i.a. contracting yet another fuel efficient vessel – this time a
Panamax ice-class vessel, which has been secured employment for 5 years."
A telephone conference will be held today at 15:30 hours
(CET) where CEO Carsten Mortensen, CFO Michael Tønnes
Jørgensen and Executive Vice President Martin Badsted will
comment on the report. By 15:25 hours (CET) at the latest,
Danish participants should dial +45 3272 8018 while partici-
pants from abroad should dial +44 (0) 145 255 5131 or +1
866 682 8490. The telephone conference can be followed live
at www.ds-norden.com where the accompanying presentation
is also available.
Further information:
CEO Carsten Mortensen, tel. +45 3315 0451.

DAMPSKIBSSELSKABET NORDEN A/S, 52, STRANDVEJEN, DK-2900 HELLERUP, DENMARK, WWW.DS-NORDEN.COM, CVR NO. 67758919 2/22
INTERIM REPORT – THIRD QUARTER 2012
Key figures and ratios for the Group
Key figures in USD ’000 2012
1/1-30/9 2011
1/1-30/9
Change
Q1-Q3
2011-2012 2011
1/1-31/12
INCOME STATEMENT
Revenue 1,611,290 1,646,445 -2% 2,272,819
Costs -1,507,640 -1,522,338 -1% -2,086,373
Profit before depreciation, etc. (EBITDA)1) 103,650 124,107 -16% 186,446
Profits from the sale of vessels, etc. -1,491 -249 - -242
Depreciation -68,169 -57,674 18% -81,185
Profit from operations (EBIT before write-downs) 34,143 66,015 -48% 104,489
Write-downs -300,000 0 - 0
Profit from operations (EBIT) -265,857 66,015 - 104,489
Fair value adjustment of certain hedging instruments -2,222 -7,920 -72% -14,897
Net financials 880 4,583 -81% 3,742
Profit before tax -267,199 62,678 - 93,334
Profit for the period -271,549 58,045 - 87,793
STATEMENT OF FINANCIAL POSITION
Non-current assets 1,325,266 1,607,386 -18% 1,634,426
Total assets 1,975,085 2,231,259 -11% 2,350,255
Equity (including minority interests) 1,692,518 1,963,381 -14% 1,994,419
Liabilities 282,567 267,878 5% 355,836
Invested capital 1,439,457 1,694,286 -15% 1,752,287
Net interest-bearing assets 253,061 269,095 -6% 242,132
Cash and securities 392,602 366,198 7% 407,192
CASH FLOWS
From operating activities 101,333 77,885 30% 120,123
From investing activities -79,316 -283,277 -72% -355,211
- hereof investments in property, equipment and vessels -124,689 -293,686 -58% -357,669
From financing activities -55,017 -56,582 -3% 18,381
Change in cash and cash equivalents for the period -33,000 -261,974 -87% -216,707
FINANCIAL AND ACCOUNTING RATIOS
Share-related key figures and financial ratios:
Number of shares of DKK 1 each (excluding treasury shares) 41,275,102 41,212,702 0% 41,213,922
Earnings per share (EPS) (DKK2)) -6.6 (-38) 1.4 (7) - 2.1 (11)
Diluted earnings per share (diluted EPS) (DKK2)) -6.6 (-38) 1.4 (7) - 2.1 (11)
Book value per share (excluding treasury shares) (DKK2)) 41.0 (236) 47.6 (263) -14% 48.4 (278)
Share price at end of period, DKK 154.8 153.9 1% 134.5
Price/book value (DKK2)) 0.65 0.59 10% 0.5
Net Asset Value per share excl. purchase options for vessels (DKK2)
) 37.4 (215) 43.3 (238) -14% 43.1 (248)
Theoretical Net Asset Value per share3) (DKK2)
) 34.3 (198) 45.2 (249) -24% 44.9 (258)
Other key figures and financial ratios:
EBITDA ratio1) 6.4% 7.5% 15% 8.2%
ROIC (before write-downs) 2.9% 5.6% -48% 6.5%
ROE -19.6% 3.9% - 4.4%
Equity ratio 85.7% 88.0% -3% 84.9%
Total no. of ship days for the Group 62,550 55,215 13% 78,526
USD/DKK rate at end of period 576.60 551.11 5% 574.56
Average USD/DKK rate 581.04 530.37 10% 536.22
USD kurs ultimo 6,4% 7,5% 15% 8,2% 1) The ratios were computed in accordance with "Recommendations and Financial Ratios 2010" published by the Danish Society of Financial Analysts except from theoretical
Net Asset Value which is not defined in the guidelines. Furthermore, "Profits from the sale of vessels, etc." has not been included in EBITDA. 2) Translated at the USD/DKK rate at end of period. 3) Please note that the calculation is subject to significant uncertainty. See "Fleet values – Valuation methods for calculating theoretical NAV" on page 15 in the consolidated
annual report for 2011 for supplementary information.

DAMPSKIBSSELSKABET NORDEN A/S, 52, STRANDVEJEN, DK-2900 HELLERUP, DENMARK, WWW.DS-NORDEN.COM, CVR NO. 67758919 3/22
INTERIM REPORT – THIRD QUARTER 2012
Comments on the development of the Group for the period
In the third quarter of 2012, NORDEN generated operating earnings before depreciation and
profits from sale of vessels (EBITDA) of USD 23 million. The result is 37% down from the
third quarter of 2011 due to weaker markets in both segments.
For the first 9 months of the year, NORDEN's EBITDA was USD 104 million against USD 124
million in the same period last year. Adjusted for non-recurring income of USD 2 million and
USD 9 million in 2012 and 2011, respectively, EBITDA dropped by 11%.
The operating loss before write-downs (EBIT) amounted to USD 1 million in the third quarter,
which is a decrease of USD 10 million from the second quarter of 2012.
Net results for the third quarter were USD 16 million (USD -21 million) and are affected by
positive fair value adjustments of hedging instruments of USD 18 million primarily as a
result of increasing bunker prices. See note 2 to the financial statements for further
specification of fair value adjustments.
Strong financial position
Cash flows from operations amounted to USD 29 million in the third quarter, while cash flows
from investments and financing amounted to USD -28 million and USD -3 million,
resepctively. In total, this results in a change in cash and cash equivalents of USD -2 million.
At the end of the third quarter, the Company had bank debt of a total of USD 139 million of
which USD 124 million is long-term (more than 1 year). The Company's debt is paid back up
until 2021. The interest payments are fixed up until 2016 at levels between 3.05% and
3.93% including margin.
NORDEN continues to be in a strong financial position to take advantage of future
investments opportunities. At the end of the quarter, the Company had cash and securities of
USD 393 million, which is an increase of USD 7 million in the quarter, and undrawn credit
facilities of USD 185 million. In comparison, there are outstanding payments on the
newbuilding programme of USD 173 million, which will fall due in the period 2012-2014.
In the quarter, the Company’s net commitments increased by USD 14 million to USD 636
million. The Company’s strong financial position is underlined by the fact that total net
commitments at the end of the quarter represented gearing of 0.37 of book equity.
Contracting of fuel
efficient Panamax vessel
In Dry Cargo, the active fleet increased by 6 vessels of which the core fleet increased by 2
vessels to 75 vessels in the third quarter. During the quarter, NORDEN entered into a
newbuilding contract of a Panamax ice-class vessel at a Japanese yard. The vessel, which will
be delivered in 2014, is fuel efficient and contracted with an agreement on 5-year coverage
with a solid counterpart. Changes in the core fleet during the quarter are shown in the table
on page 4.
In Tankers, the active core fleet counted 26 vessels at the end of the third quarter, which is
on par with the previous quarter. The number of charters without purchase option increased
by 1 vessel, and the active fleet thus increased to 46 vessels. As mentioned in the interim
report for the first half-year, NORDEN entered into agreement on 2 fuel efficient Handysize
tanker newbuildings at a Chinese yard in the third quarter. As a result, the number of vessels
for delivery to the core fleet increased by 2 vessels and thus counted 6 vessels at the end of
the quarter.
0
20
40
60
80
Q311
Q411
Q112
Q212
Q312
EBITDA (USD million)
0
15
30
45
Q311
Q411
Q112
Q212
Q312
EBIT (before write-downs)(USD million)
0
200
400
600
Q311
Q411
Q112
Q212
Q312
Cash and securities (USD million)
100140180220260
Q311
Q411
Q112
Q212
Q312
Active fleet
Dry Cargo Tankers

DAMPSKIBSSELSKABET NORDEN A/S, 52, STRANDVEJEN, DK-2900 HELLERUP, DENMARK, WWW.DS-NORDEN.COM, CVR NO. 67758919 4/22
INTERIM REPORT – THIRD QUARTER 2012
In total, NORDEN's active core fleet increased by 2 vessels to 101 vessels during the third
quarter. In addition, NORDEN had 140 chartered vessels at its disposal at the end of the third
quarter. The order book counted 18 vessels at the end of the third quarter (see note 8 to the
financial statements for an overview of deliveries to the core fleet).
After the end of the third quarter, NORDEN has sold 3 Korean built Handysize dry cargo
vessels and 2 Panamax dry cargo vessels with a considerable positive cash flow effect. The
sale will have a negative effect of USD 23.5 million on the results in the fourth quarter.
Development in the core fleet in the third quarter
Active vessels Vessels for delivery
Beginning of third quarter 99 18
Delivery of owned vessels +2 -2
2 vessels sold and converted to
long-term charter -2
Delivery of long-term charter +3 -1
Redelivery of long-term charter -1
Contracting of newbuilding +3
End of third quarter 101 18
Net Asset Value of DKK
215 per share
Theoretical Net Asset
Value of DKK 198 per
share
Impairment test
Based on valuations from 3 independent brokers, the market value of NORDEN's owned
vessels and newbuildings (including vessels in joint ventures and vessels held for sale) was
estimated at USD 1,310 million at the end of the quarter. The value of vessels owned during
the entire period decreased by 6% during the quarter as a consequence of a 6% drop in the
value of NORDEN's dry cargo vessels and a 5% drop in the value of the Company's tanker
vessels.
The theoretical value of NORDEN's 63 charter parties with purchase and extension option is
estimated at USD -127 million at the end of third quarter against USD 23 million at the end
of the second quarter.
NORDEN's total theoretical Net Asset Value (NAV) is calculated at DKK 198 per share at the
end of the third quarter against DKK 228 per share at the end of the second quarter
corresponding to a decrease of 13%. The decrease is due to a continued drop in T/C rates
and vessel prices.
The theoretical NAV is composed of book equity of DKK 236 per share, added value of owned
vessels and newbuildings of DKK -21 per share (based on valuations from 3 independent
brokers) and the value of NORDEN's charter parties with purchase and extension option of
DKK -17 per share.
The estimate of the theoretical NAV does not include the value of NORDEN’s coverage
besides a few contracts on owned vessels. Based on the forward curve at the end of the
quarter, this coverage is estimated to have a value of USD 215 million or DKK 30 per share.
The value of the theoretical NAV is sensitive to changes in freight rates and vessel prices. In
a sensitivity analysis of +/- 10% in freight rates and vessel prices, the theoretical NAV
changes to DKK 233 and DKK 162 per share corresponding to a percentage-wise change of
+/- 18%.
At the end of the third quarter, brokers estimated the net selling price of NORDEN's fleet
(excluding 2 joint venture vessels and vessels held for sale) to be USD 149 million lower than
the carrying amounts and costs of newbuildings. The difference is divided with USD -78
million in Dry Cargo and USD -71 million in Tankers. Therefore, an impairment test has been
conducted. No indication of long-term impairment was found, and there is thus no need for
additional write-downs (see note 5 "Write-down of vessels, etc." to the financial statements
for additional information).
200
220
240
260
Q311
Q411
Q112
Q212
Q312
Net Asset Value per share (DKK)
0
100
200
300
Q311
Q411
Q112
Q212
Q312
Theoretical Net Asset Value per share (DKK)

DAMPSKIBSSELSKABET NORDEN A/S, 52, STRANDVEJEN, DK-2900 HELLERUP, DENMARK, WWW.DS-NORDEN.COM, CVR NO. 67758919 5/22
INTERIM REPORT – THIRD QUARTER 2012
Segment information
Q3 2012 Q3 2011
USD ’000
Dry Cargo
Tankers
Un-
allocated
Total
Dry Cargo
Tankers
Un-
allocated
Total
Revenue – services rendered 439,515 115,708 0 555,223 458,600 78,636 0 537,236
Voyage costs -203,639 -69,031 0 -272,670 -189,822 -33,741 0 -223,563
Contribution margin I 235,876 46,677 0 282,553 268,778 44,895 0 313,673
Other operating income, net 1,654 35 0 1,689 1,371 46 0 1,417
Vessel operating costs -203,581 -46,361 0 -249,942 -225,859 -40,140 0 -265,999
Costs -7,977 -1,339 -2,299 -11,615 -8,868 -1,529 -2,703 -13,100
Profit before depreciation,
etc. (EBITDA)
25,972
-988
-2,299
22,685
35,422
3,272
-2,703
35,991
Profits from the sale of vessels,
etc.
-1,407 0 -38 -1,445 108 1 0 109
Depreciation -12,150 -8,426 -747 -21,323 -11,597 -8,513 -911 -21,021
Share of results of
joint ventures
-654
157
0
-497
70
-256
0
-186
Profit from operations
(EBIT)
11,761
-9,257
-3,084
-580
24,003
-5,496
-3,614
14,893
Fair value adjustment of
certain hedging instruments
17,897
0
0
17,897
-29,183
0
0
-29,183
Financial income 0 0 2,115 2,115 0 0 -4,760 -4,760
Financial expenses 0 0 -1,835 -1,835 0 0 -567 -567
Tax for the period -1,211 -169 -79 -1,459 -1,307 -176 -1 -1,484
Profit for the period 28,447 -9,426 -2,883 16,138 -6,487 -5,672 -8,942 -21,101

DAMPSKIBSSELSKABET NORDEN A/S, 52, STRANDVEJEN, DK-2900 HELLERUP, DENMARK, WWW.DS-NORDEN.COM, CVR NO. 67758919 6/22
INTERIM REPORT – THIRD QUARTER 2012
Segment information – continued
Q1-Q3 2012 Q1-Q3 2011
USD ’000
Dry Cargo
Tankers
Un-
allocated
Total
Dry Cargo
Tankers
Un-
allocated
Total
Revenue – services rendered 1,312,966 298,324 0 1,611,290 1,399,143 247,302 0 1,646,445
Voyage costs -610,550 -145,682 0 -756,232 -548,134 -96,521 0 -644,655
Contribution margin I 702,416 152,642 0 855,058 851,009 150,781 0 1,001,790
Other operating income, net 4,512 90 0 4,602 3,598 134 0 3,732
Vessel operating costs -586,109 -133,171 0 -719,280 -716,423 -124,237 0 -840,660
Costs -24,873 -4,458 -7,399 -36,730 -27,323 -4,751 -8,681 -40,755
Profit before depreciation,
etc. (EBITDA)
95,946
15,103
-7,399
103,650
110,861
21,927
-8,681
124,107
Profits from the sale of vessels,
etc. -1,366 0 -125 -1,491 187 -449 13 -249
Depreciation -39,405 -25,643 -3,121 -68,169 -31,162 -24,045 -2,467 -57,674
Share of results of
joint ventures
-486
639
0
153
29
-198
0
-169
Profit from operations
before write-downs
54,689
-9,901
-10,645
34,143
79,915
-2,765
-11,135
66,015
Write-downs of vessels and
newbuildings
-250,000
-40,000
0
-290,000
0
0
0
0
Write-downs of joint ventures -10,000 0 0 -10,000 0 0 0 0
Profit from operations (EBIT) -205,311 -49,901 -10,645 -265,857 79,915 -2,765 -11,135 66,015
Fair value adjustment of
certain hedging instruments
-2,222
0
0
-2,222
-7,920
0
0
-7,920
Financial income 0 0 7,297 7,297 0 0 8,704 8,704
Financial expenses 0 0 -6,417 -6,417 0 0 -4,121 -4,121
Tax for the period -3,668 -516 -166 -4,350 -3,987 -534 -112 -4,633
Profit for the period -211,201 -50,417 -9,931 -271,549 68,008 -3,299 -6,664 58,045
Q1-Q3 2012 Q1-Q3 2011
USD'000
Dry Cargo
Tankers
Un-
allocated
Total
Dry Cargo
Tankers
Un-
allocated
Total
Vessels 701,690 454,767 0 1,156,457 729,464 515,895 0 1,245,359
Prepayments on vessels and
newbuildings
25,488
73,486
0
98,974
213,197
58,657
0
271,854
Other tangible assets 983 0 54,944 55,927 1,379 0 54,503 55,882
Investments in joint ventures 10,494 3,414 0 13,908 2,955 31,336 0 34,291
Non-current assets 738,655 531,667 54,944 1,325,266 946,995 605,888 54,503 1,607,386
Current assets 209,594 47,623 392,602 649,819 218,971 38,704 366,198 623,873
Total assets 948,249 579,290 447,546 1,975,085 1,165,966 644,592 420,701 2,231,259

DAMPSKIBSSELSKABET NORDEN A/S, 52, STRANDVEJEN, DK-2900 HELLERUP, DENMARK, WWW.DS-NORDEN.COM, CVR NO. 67758919 7/22
INTERIM REPORT – THIRD QUARTER 2012
Dry Cargo
T/C earnings above the
market The Dry Cargo Department realised an EBITDA of USD 26 million in the third quarter, which
was in line with expectations. Earnings were supported by high coverage in an otherwise
very depressed spot market. Dry Cargo produced T/C earnings approximately 35% above
the average 1-year T/C rates.
Weak market in the
large vessel types After a severe drop in market rates in the first half of the year, market conditions continued
to be challenging in the third quarter reflecting the significant oversupply of vessels. The
Baltic Dry Index (BDI) posted its lowest average since the third quarter of 1998, dropping
24% in the third quarter and taking the decrease in BDI to 56% during the first 9 months of
the year. The market weakness was most apparent in the large vessel sizes with Capesize
spot rates averaging around USD 4,800 per day during the quarter, while Handymax and
Handysize spot rates averaged around USD 10,300 and USD 8,000 per day, respectively.
After the end of the quarter, Capesize rates have increased, while rates for smaller vessel
sizes remain under pressure. The increase in Capesize rates has primarily been driven by
iron ore inventory build-up in China and higher share of Chinese iron ore imports being
sourced from Brazil resulting in a positive ton-mile effect (source: R.S. Platou).
Reasonable demand in
dry cargo Despite difficult economic conditions in many of the world’s largest economies in recent
quarters, dry cargo demand has been relatively reasonable. According to R.S. Platou, dry
cargo demand grew by around 8% in the first half of 2012 and is expected to grow by
around 7% for the full year. China has continued to drive the market, increasing its imports
of dry cargo by 14% in the first 9 months of the year compared to the same period last year.
Fewer deliveries to the
global dry cargo fleet Deliveries to the global dry cargo fleet slowed considerably compared to the previous 2
quarters. Approximately 20 million dwt. were delivered during the period, which is the lowest
amount delivered in a single quarter since the second quarter of 2010. This indicates that the
delivery of new vessels has peaked as deliveries in the previous 4 quarters were on average
around 28 million dwt. per quarter.
Scrapping on a continued
high level Scrapping remained high in the quarter with 8 million dwt. scrapped, and total scrapping for
the first 9 months of the year reached 26 million dwt. Despite a high degree of scrapping this
year, there is still considerable potential for further scrapping since approximately 19% of
the fleet is older than 20 years. As long as freight rates continue to be under pressure and
bunker prices are high, many older vessels will be unable to compete with modern vessels,
forcing owners to lay them up or scrapping the vessels.
Lower fleet growth in
2013 After accounting for scrapping, the dry cargo fleet grew by 8.9% net in the first 9 months of
the year, equal to 11.9% on an annual basis. Given the current order book and the low
degree of new contracting this year, fleet supply is expected to slow in the coming quarters,
and with a continued positive development in demand, this may result in an improvement in
the balance between supply and demand towards the end of 2013.
Employment and rates, Dry Cargo, third quarter 2012
Vessel type Capesize Post-Panamax Panamax Handymax Handysize Total**
NORDEN ship days 368 736 6,025 8,226 2,525 17,880
NORDEN T/C (USD per day) 26,491 5,746 12,460 13,466 10,315 12,632
1-year T/C (USD per day)* 11,394 8,858 9,067 9,865 8,346 9,372
NORDEN vs. 1-year T/C +132% -35% +37% +37% +24% +35%
* Source: Clarksons
** Weighted average
DAMPSKIBSSELSKABET NORDEN A/S, 52, STRANDVEJEN, DK-2900 HELLERUP, DENMARK, WWW.DS-NORDEN.COM, CVR NO. 67758919 8/22
INTERIM REPORT – THIRD QUARTER 2012
Dry Cargo fleet and
values
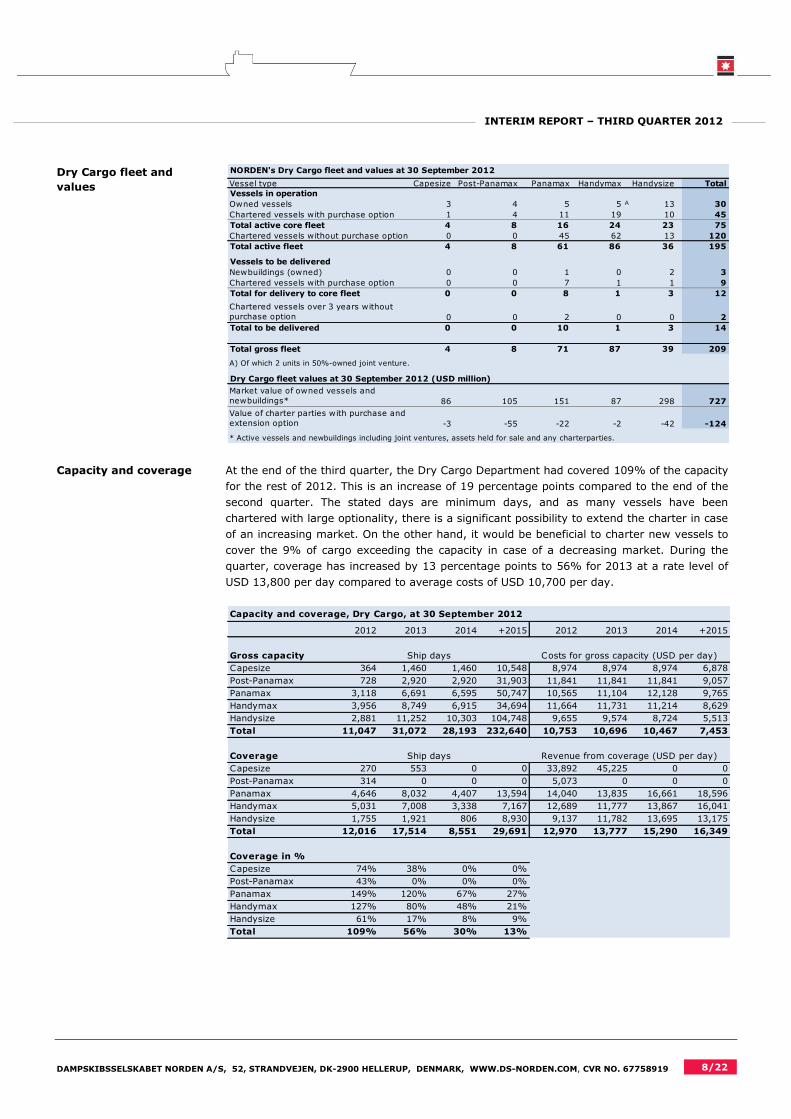
Capacity and coverage At the end of the third quarter, the Dry Cargo Department had covered 109% of the capacity
for the rest of 2012. This is an increase of 19 percentage points compared to the end of the
second quarter. The stated days are minimum days, and as many vessels have been
chartered with large optionality, there is a significant possibility to extend the charter in case
of an increasing market. On the other hand, it would be beneficial to charter new vessels to
cover the 9% of cargo exceeding the capacity in case of a decreasing market. During the
quarter, coverage has increased by 13 percentage points to 56% for 2013 at a rate level of
USD 13,800 per day compared to average costs of USD 10,700 per day.
Capacity and coverage, Dry Cargo, at 30 September 2012
2012 2013 2014 +2015 2012 2013 2014 +2015
Gross capacity
Capesize 364 1,460 1,460 10,548 8,974 8,974 8,974 6,878
Post-Panamax 728 2,920 2,920 31,903 11,841 11,841 11,841 9,057
Panamax 3,118 6,691 6,595 50,747 10,565 11,104 12,128 9,765
Handymax 3,956 8,749 6,915 34,694 11,664 11,731 11,214 8,629
Handysize 2,881 11,252 10,303 104,748 9,655 9,574 8,724 5,513
Total 11,047 31,072 28,193 232,640 10,753 10,696 10,467 7,453
Coverage
Capesize 270 553 0 0 33,892 45,225 0 0
Post-Panamax 314 0 0 0 5,073 0 0 0
Panamax 4,646 8,032 4,407 13,594 14,040 13,835 16,661 18,596
Handymax 5,031 7,008 3,338 7,167 12,689 11,777 13,867 16,041
Handysize 1,755 1,921 806 8,930 9,137 11,782 13,695 13,175
Total 12,016 17,514 8,551 29,691 12,970 13,777 15,290 16,349
Coverage in %
Capesize 74% 38% 0% 0%
Post-Panamax 43% 0% 0% 0%
Panamax 149% 120% 67% 27%
Handymax 127% 80% 48% 21%
Handysize 61% 17% 8% 9%
Total 109% 56% 30% 13%
Ship days Costs for gross capacity (USD per day)
Ship days Revenue from coverage (USD per day)
NORDEN's Dry Cargo fleet and values at 30 September 2012
Vessel type Capesize Post-Panamax Panamax Handymax Handysize Total
Vessels in operation
Owned vessels 3 4 5 5 A 13 30
Chartered vessels with purchase option 1 4 11 19 10 45
Total active core fleet 4 8 16 24 23 75
Chartered vessels without purchase option 0 0 45 62 13 120
Total active fleet 4 8 61 86 36 195
Vessels to be delivered
Newbuildings (owned) 0 0 1 0 2 3
Chartered vessels with purchase option 0 0 7 1 1 9
Total for delivery to core fleet 0 0 8 1 3 12
Chartered vessels over 3 years without
purchase option 0 0 2 0 0 2
Total to be delivered 0 0 10 1 3 14
Total gross fleet 4 8 71 87 39 209
A) Of which 2 units in 50%-owned joint venture.
Dry Cargo fleet values at 30 September 2012 (USD million)
Market value of owned vessels and
newbuildings* 86 105 151 87 298 727
Value of charter parties with purchase and
extension option -3 -55 -22 -2 -42 -124
* Active vessels and newbuildings including joint ventures, assets held for sale and any charterparties.

DAMPSKIBSSELSKABET NORDEN A/S, 52, STRANDVEJEN, DK-2900 HELLERUP, DENMARK, WWW.DS-NORDEN.COM, CVR NO. 67758919 9/22
INTERIM REPORT – THIRD QUARTER 2012
Tankers
Lower earnings due to a
low spot market
In the third quarter of 2012, the Tanker Department generated an EBITDA of USD -1 million.
Earnings were 7% below the 1-year T/C rates, which was due to a very low spot market as a
consequence of the continued weak global economic growth. NORDEN had average earnings
of USD 11,787 per day in the third quarter, which is significantly above the spot market.
NORDEN's two primary vessel types, MR and Handysize, generated earnings of USD 12,084
and USD 11,768 per day.
Supply disruptions
resulted in decreasing
rates
The fire on one of the world's largest refineries in Amuay Bay in Venezuela and the hurricane
Isaac's effect on the refinery sector around the U.S. Gulf led to a reduced supply of oil
products for export, and the decreasing activity resulted in lower rates in the third quarter.
Thus, BCTI (Baltic Clean Tanker Index) ended on average for the quarter 14% below the same
period last year but improved somewhat towards the end of the quarter.
European refineries
benefited from low-
sulphur crude oil
Lower export volumes from especially the Black Sea and the Baltic States (Russia) to Europe
and less stock building of oil products before the winter in Europe compared to the same
period last year had a negative effect on the market. Europe's import of oil products generally
decreased in the third quarter as the European refineries increased their own refining due to
access to cheap low-sulphur West African crude oil which there was no longer a demand for in
the USA. In the USA, the refineries increasingly used their own shale oil instead of importing
West African crude oil.
USA net exporter of
product oil
Over the last year, the USA has changed its status to a net exporter of product oil. The USA’s
total product oil export has almost doubled compared to the same period last year, and until
now, the net export in 2012 has been above 900,000 barrels per day (bpd). The primary
receiver of USA’s export of oil products is Latin Amerika, which reached almost 600,000 bpd in
July (+44% year-on-year), while European import from the USA has increased by 100,000
bpd to 375,000 bpd (source: JBC Energy).
Increased refinery
capacity
An essential element in the ton-mile demand in the product tanker market is the expansion of
the export oriented refinery capacity in the Middle East and Asia. The refinery capacity is
expected to be expanded by 5.4 million bpd until 2017 in these areas, which may lead to
longer distances per transported ton (source: IEA). During 2012, India has increased its
export of oil products to Europe and the USA by 5% and 8%, respectively, and in total, India
has increased its export by 9% corresponding to 6 million tons of which the main part,
however, continues to be exported to other Asian countries (source: Danish Shipfinance).
Low growth in the global
fleet
As in previous quarters, there was very limited growth in the global product tanker fleet. In
total, the fleet grew by 0.5% in NORDEN's two primary vessel types in the third quarter,
distributed with 1% fleet growth in MR and a reduction of 0.8% in Handysize. At the end of
the quarter, the order book comprised 15% of the existing MR fleet and only 4% of the
Handysize fleet (source: SSY).
Employment and rates, Tankers, third quarter 2012
Vessel type LR-1 MR Handysize Total**
NORDEN ship days 183 2,147 1,689 4,019
NORDEN T/C (USD per day) 8,472 12,084 11,768 11,787
1-year T/C (USD per day)* 12,827 12,962 12,250 12,657
NORDEN vs. 1-year T/C -34% -7% -4% -7%
* Source: Clarksons
** Weighted average
DAMPSKIBSSELSKABET NORDEN A/S, 52, STRANDVEJEN, DK-2900 HELLERUP, DENMARK, WWW.DS-NORDEN.COM, CVR NO. 67758919 10/22
INTERIM REPORT – THIRD QUARTER 2012
Tanker fleet and values
Capacity and coverage
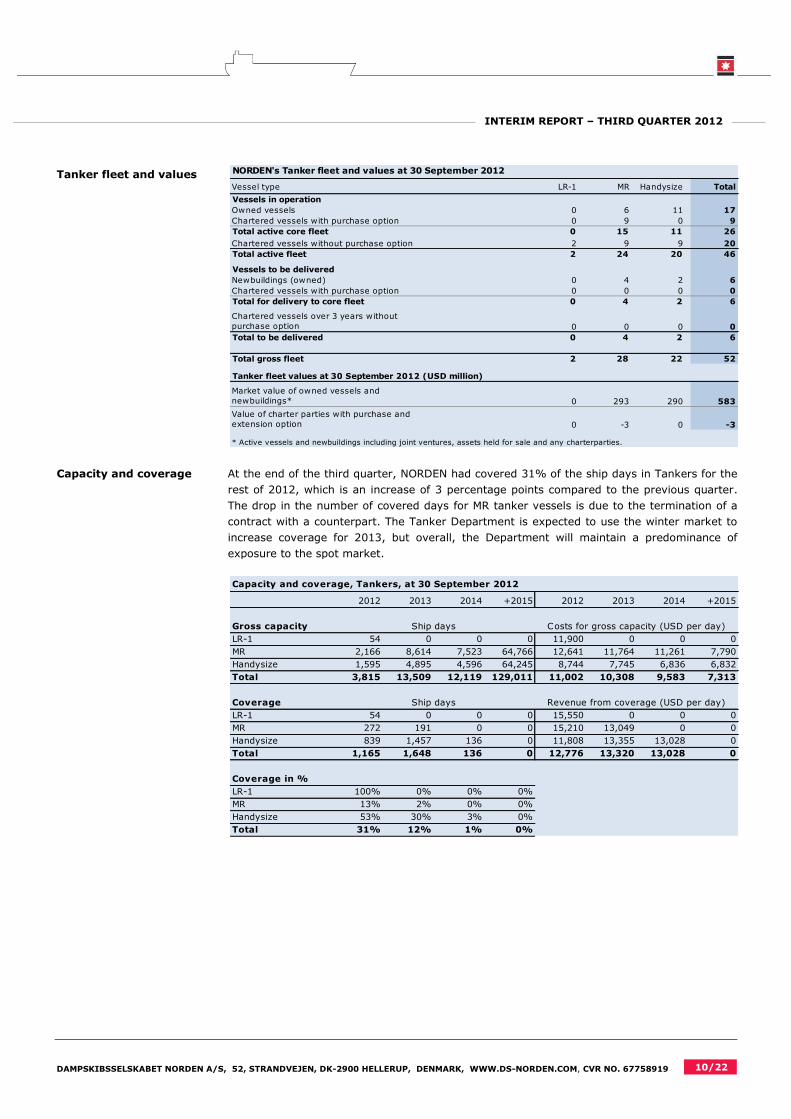
At the end of the third quarter, NORDEN had covered 31% of the ship days in Tankers for the
rest of 2012, which is an increase of 3 percentage points compared to the previous quarter.
The drop in the number of covered days for MR tanker vessels is due to the termination of a
contract with a counterpart. The Tanker Department is expected to use the winter market to
increase coverage for 2013, but overall, the Department will maintain a predominance of
exposure to the spot market.
NORDEN's Tanker fleet and values at 30 September 2012
Vessel type LR-1 MR Handysize Total
Vessels in operation
Owned vessels 0 6 11 17
Chartered vessels with purchase option 0 9 0 9
Total active core fleet 0 15 11 26
Chartered vessels without purchase option 2 9 9 20
Total active fleet 2 24 20 46
Vessels to be delivered
Newbuildings (owned) 0 4 2 6
Chartered vessels with purchase option 0 0 0 0
Total for delivery to core fleet 0 4 2 6
Chartered vessels over 3 years without
purchase option 0 0 0 0
Total to be delivered 0 4 2 6
Total gross fleet 2 28 22 52
Tanker fleet values at 30 September 2012 (USD million)
Market value of owned vessels and
newbuildings* 0 293 290 583
Value of charter parties with purchase and
extension option 0 -3 0 -3
* Active vessels and newbuildings including joint ventures, assets held for sale and any charterparties.
Capacity and coverage, Tankers, at 30 September 2012
2012 2013 2014 +2015 2012 2013 2014 +2015
Gross capacity
LR-1 54 0 0 0 11,900 0 0 0
MR 2,166 8,614 7,523 64,766 12,641 11,764 11,261 7,790
Handysize 1,595 4,895 4,596 64,245 8,744 7,745 6,836 6,832
Total 3,815 13,509 12,119 129,011 11,002 10,308 9,583 7,313
Coverage
LR-1 54 0 0 0 15,550 0 0 0
MR 272 191 0 0 15,210 13,049 0 0
Handysize 839 1,457 136 0 11,808 13,355 13,028 0
Total 1,165 1,648 136 0 12,776 13,320 13,028 0
Coverage in %
LR-1 100% 0% 0% 0%
MR 13% 2% 0% 0%
Handysize 53% 30% 3% 0%
Total 31% 12% 1% 0%
Ship days Costs for gross capacity (USD per day)
Ship days Revenue from coverage (USD per day)

DAMPSKIBSSELSKABET NORDEN A/S, 52, STRANDVEJEN, DK-2900 HELLERUP, DENMARK, WWW.DS-NORDEN.COM, CVR NO. 67758919 11/22
INTERIM REPORT – THIRD QUARTER 2012
Expectations for 2012
NORDEN maintains its
full-year estimate
NORDEN maintains is expectations for operating earnings (EBITDA) of USD 110-150 million.
With a total EBITDA of USD 104 million in the first 9 months of the year, NORDEN's earnings
are in line with expectations. Earnings in Dry Cargo were USD 96 million, while they
amounted to USD 15 million in Tankers.
For the full year, earnings in Dry Cargo are expected to be USD 105-125 million and thus in
the high end of the previous interval (USD 85-125 million), where expectations for Tankers
are reduced to USD 15-25 million (USD 25-45 million).
Expectations for the full
year
Expectations for 2012
USD million
Dry Cargo Tankers Total
EBITDA 105-125 15-25 110-150
Ordinary depreciation 90-95
Realised profits from the sale of vessels -25
CAPEX 10-20
Sale of vessels After the sale of 5 Handysize and 2 Panamax dry cargo vessels with a loss of USD 8 million
and USD 17 million, respectively, in and after the quarter, a total loss of USD 25 million from
sale of vessels is now expected. The positive cash flow effect from the sales will cover a
considerable part of newbuilding installments in 2012, and CAPEX (net) is now expected to
be USD 10-20 million (against previous USD 80-100 million).
The expectations do not include additional sale of vessels.
Risks and uncertainties The uncertainty regarding earnings in Dry Cargo in the fourth quarter relates to changes in
rate levels during the fourth quarter. Handymax and Panamax are excessively covered with
49% and 27%, respectively, compared to minimum capacity. To a significant extent,
NORDEN has the possibility of extending chartered tonnage so that contractual coverage can
be met at previously agreed rate levels, and thus, the exposure to increasing rates in these
vessel types is limited.
Earnings expectations in Tankers primarily depend on the development in the spot market.
Based on 2,600 open ship days in Tankers, a change of USD 1,000 per day would mean a
change in earnings of approximately USD 2-3 million.
Forward-looking statements
This report includes forward-looking statements reflecting management's current perception of future trends and financial
performance. The statements for the rest of 2012 and the years to come naturally carry some uncertainty, and NORDEN's actual
results may therefore differ from expectations. Factors that may cause the results achieved to differ from the expectations are,
among other things, but not exclusively, changes in the macroeconomic and political conditions – especially in the Company's key
markets – changes in NORDEN's assumptions of rate development and operating costs, volatility in rates and vessel prices,
changes in legislation, possible interruptions in traffic and operations as a result of external events, etc.

DAMPSKIBSSELSKABET NORDEN A/S, 52, STRANDVEJEN, DK-2900 HELLERUP, DENMARK, WWW.DS-NORDEN.COM, CVR NO. 67758919 12/22
INTERIM REPORT – THIRD QUARTER 2012
INTERIM REPORT FOR THE THIRD QUARTER OF 2012 – THE GROUP
Statement
The Board of Directors and the Executive Management today reviewed and approved the interim report for the third quarter of 2012
of Dampskibsselskabet NORDEN A/S.
The interim report is prepared in accordance with the International Financial Reporting Standard IAS 34 on interim reports and the
general Danish financial disclosure requirements for listed companies. In line with previous policies, the interim report is not audited
or reviewed by the auditors.
We consider the accounting policies applied to be appropriate and the accounting estimates made to be adequate. Furthermore, we
find the overall presentation of the interim report to present a true and fair view.
Besides what has been disclosed in the interim report, no other significant changes in the Company's risks and uncertainties have
occurred relative to what was disclosed in the consolidated annual report for 2011.
In our opinion, the interim report gives a true and fair view of the Group's assets, equity and liabilities, the financial position as well
as the result of the Group's activities and cash flows for the interim period.
Furthermore, the management commentary gives a faithful representation of the Group's activities and financial position as well as a
description of the material risks and uncertainties which the Group is facing.
Hellerup, 14 November 2012
Executive Management
Carsten Mortensen Michael Tønnes Jørgensen Lars Bagge Christensen
President & CEO Executive Vice President & CFO Executive Vice President
Martin Badsted Ejner Bonderup
Executive Vice President Executive Vice President
Board of Directors
Mogens Hugo Alison J. F. Riegels Erling Højsgaard
Chairman Vice Chairman
Karsten Knudsen Arvid Grundekjøn Klaus Nyborg
Benn Pyrmont Johansen Ole Clausen Jacob Koch Nielsen
DAMPSKIBSSELSKABET NORDEN A/S, 52, STRANDVEJEN, DK-2900 HELLERUP, DENMARK, WWW.DS-NORDEN.COM, CVR NO. 67758919 13/22
INTERIM REPORT – THIRD QUARTER 2012
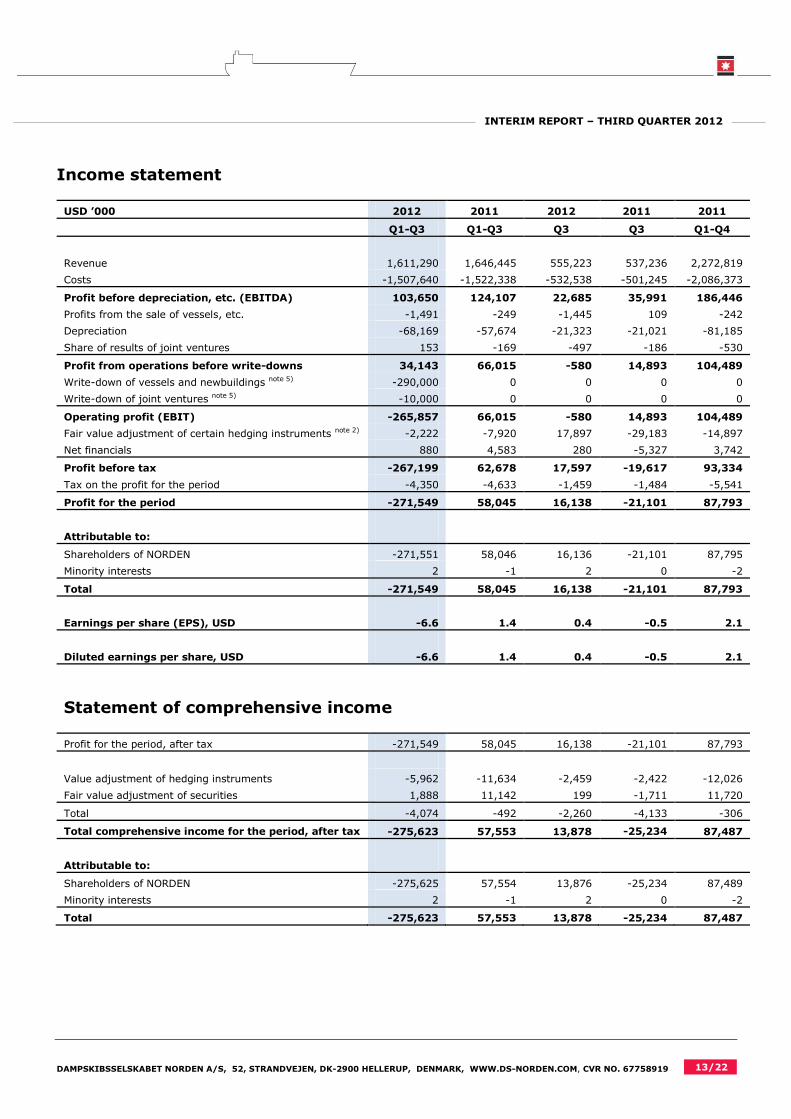
Income statement
USD ’000 2012 2011 2012 2011 2011
Q1-Q3 Q1-Q3 Q3 Q3 Q1-Q4
Revenue 1,611,290 1,646,445 555,223 537,236 2,272,819
Costs -1,507,640 -1,522,338 -532,538 -501,245 -2,086,373
Profit before depreciation, etc. (EBITDA) 103,650 124,107 22,685 35,991 186,446
Profits from the sale of vessels, etc. -1,491 -249 -1,445 109 -242
Depreciation -68,169 -57,674 -21,323 -21,021 -81,185
Share of results of joint ventures 153 -169 -497 -186 -530
Profit from operations before write-downs 34,143 66,015 -580 14,893 104,489
Write-down of vessels and newbuildings note 5) -290,000 0 0 0 0
Write-down of joint ventures note 5) -10,000 0 0 0 0
Operating profit (EBIT) -265,857 66,015 -580 14,893 104,489
Fair value adjustment of certain hedging instruments note 2) -2,222 -7,920 17,897 -29,183 -14,897
Net financials 880 4,583 280 -5,327 3,742
Profit before tax -267,199 62,678 17,597 -19,617 93,334
Tax on the profit for the period -4,350 -4,633 -1,459 -1,484 -5,541
Profit for the period -271,549 58,045 16,138 -21,101 87,793
Attributable to:
Shareholders of NORDEN -271,551 58,046 16,136 -21,101 87,795
Minority interests 2 -1 2 0 -2
Total -271,549 58,045 16,138 -21,101 87,793
Earnings per share (EPS), USD -6.6 1.4 0.4 -0.5 2.1
Diluted earnings per share, USD -6.6 1.4 0.4 -0.5 2.1
Statement of comprehensive income
Profit for the period, after tax -271,549 58,045 16,138 -21,101 87,793
Value adjustment of hedging instruments -5,962 -11,634 -2,459 -2,422 -12,026
Fair value adjustment of securities 1,888 11,142 199 -1,711 11,720
Total -4,074 -492 -2,260 -4,133 -306
Total comprehensive income for the period, after tax -275,623 57,553 13,878 -25,234 87,487
Attributable to:
Shareholders of NORDEN -275,625 57,554 13,876 -25,234 87,489
Minority interests 2 -1 2 0 -2
Total -275,623 57,553 13,878 -25,234 87,487

DAMPSKIBSSELSKABET NORDEN A/S, 52, STRANDVEJEN, DK-2900 HELLERUP, DENMARK, WWW.DS-NORDEN.COM, CVR NO. 67758919 14/22
INTERIM REPORT – THIRD QUARTER 2012
Income statement by quarter
USD ’000 2012 2012 2012 2011 2011
Q3 Q2 Q1 Q4 Q3
Revenue 555,223 523,460 532,607 626,374 537,236
Costs -532,538 -492,125 -482,977 -564,035 -501,245
Profit before depreciation, etc, (EBITDA) 22,685 31,335 49,630 62,339 35,991
Profits from the sale of vessels, etc. -1,445 -260 214 7 109
Depreciation -21,323 -21,688 -25,158 -23,511 -21,021
Share of results of joint ventures -497 231 419 -361 -186
Profit from operations before write-downs -580 9,618 25,105 38,474 14,893
Write-down of vessels and newbuildings note 5) 0 0 -290,000 0 0
Write-down of joint ventures note 5) 0 0 -10,000 0 0
Operating profit (EBIT) -580 9,618 -274,895 38,474 14,893
Fair value adjustment of certain hedging instruments note 2) 17,897 -39,850 19,731 -6,977 -29,183
Net financials 280 -137 737 -841 -5,327
Profit before tax 17,597 -30,369 -254,427 30,656 -19,617
Tax on the profit for the period -1,459 -1,410 -1,481 -908 -1,484
Profit for the period 16,138 -31,779 -255,908 29,748 -21,101
Attributable to:
Shareholders of NORDEN 16,136 -31,779 -255,908 29,749 -21,101
Minority interests 2 0 0 -1 0
Total 16,138 -31,779 -255,908 29,748 -21,101
Earnings per share (EPS), USD 0.4 -0.8 -6.2 0.7 -0.5
Diluted earnings per share, USD 0.4 -0.8 -6.2 0.7 -0.5
Statement of comprehensive income by quarter
Profit for the period, after tax 16,138 -31,779 -255,908 29,748 -21,101
Value adjustment of hedging instruments -2,459 -2,955 -548 -392 -2,422
Fair value adjustment of securities 199 85 1,604 578 -1,711
Total -2,260 -2,870 1,056 186 -4,133
Total comprehensive income for the period, after tax 13,878 -34,649 -254,852 29,934 -25,234
Attributable to:
Shareholders of NORDEN 13,876 -34,649 -254,852 29,935 -25,234
Minority interests 2 0 0 -1 0
Total 13,878 -34,649 -254,852 29,934 -25,234

DAMPSKIBSSELSKABET NORDEN A/S, 52, STRANDVEJEN, DK-2900 HELLERUP, DENMARK, WWW.DS-NORDEN.COM, CVR NO. 67758919 15/22
INTERIM REPORT – THIRD QUARTER 2012
Statement of financial position
USD ’000 2012 2011 2011
30/9 30/9 31/12
ASSETS
Property and equipment 55,927 55,882 55,937
Vessels note 3) 1,156,457 1,245,359 1,387,189
Prepayments on vessels and newbuildings note 4) 98,974 271,854 170,025
Investments in joint ventures 13,908 34,291 21,275
Non-current assets 1,325,266 1,607,386 1,634,426
Inventories 78,349 70,581 89,280
Receivables and prepayments 176,745 187,094 213,040
Receivables from joint ventures 2,123 0 6,317
Securities 68,323 72,268 71,324
Cash and cash equivalents 324,279 293,930 335,868
Current assets 649,819 623,873 715,829
Total assets 1,975,085 2,231,259 2,350,255
EQUITY AND LIABILITIES
Share capital 6,833 6,833 6,833
Reserves 2,624 6,512 6,698
Retained earnings 1,682,993 1,949,969 1,980,822
Equity (NORDEN's shareholders) 1,692,450 1,963,314 1,994,353
Minority interests 68 67 66
Equity 1,692,518 1,963,381 1,994,419
Bank debt 124,098 73,759 135,017
Non-current liabilities 124,098 73,759 135,017
Current portion of non-current debt within 1 year 15,443 23,344 30,043
Trade payables 85,154 91,127 135,672
Liabilities with joint ventures 0 31,890 0
Other payables and deferred income 57,872 47,758 55,104
Current liabilities 158,469 194,119 220,819
Liabilities 282,567 267,878 355,836
Total equity and liabilities 1,975,085 2,231,259 2,350,255

DAMPSKIBSSELSKABET NORDEN A/S, 52, STRANDVEJEN, DK-2900 HELLERUP, DENMARK, WWW.DS-NORDEN.COM, CVR NO. 67758919 16/22
INTERIM REPORT – THIRD QUARTER 2012
Statement of cash flows
USD ’000 2012 2011 2012 2011 2011
Q1-Q3 Q1-Q3 Q3 Q3 Q1-Q4
Profit for the period -271,549 58,045 16,138 -21,101 87,793
Reversal of items without effect on cash flow 373,974 91,250 7,338 75,599 95,969
Cash flows before change in working capital 102,425 149,295 23,476 54,498 183,762
Change in working capital -1,092 -71,410
5,667
-42,936 -63,639
Cash flows from operating activities 101,333 77,885 29,143 11,562 120,123
Investments in vessels, etc. -11,426 -61,203
-3,541
-7,546 -64,327
Additions in prepayments on newbuildings -113,263 -232,495 -71,004 -92,187 -293,354
Additions in prepayments received on sold vessels 0 0 0 0 -7,324
Investments in associates -2,500 0 0 0 0
Acquisition of securities -42,548 -29,631 -8,296 0 -35,010
Sale of securities 48,173 4,815 12,543 0 9,595
Proceeds from the sale of vessels, etc. 42,248 35,237 41,976 190 35,209
Cash flows from investing activities -79,316 -283,277 -28,322 -99,543 -355,211
Dividend paid to shareholders -29,146 -63,706
0
0 -63,706
Acquisition of treasury shares 0 -31,556 0 0 -31,556
Installments on/payment of non-current debt -25,871 -48,095 -3,118 -19,672 -48,095
Additions of non-current debt 0 86,775 0 0 161,738
Cash flows from financing activities -55,017 -56,582 -3,118 -19,672 18,381
Change in cash and cash equivalents
for the period -33,000 -261,974
-2,297
-107,653 -216,707
Cash and cash equivalents at beginning of period 335,868 574,571
314,356
421,536 574,571
Exchange rate adjustments 21,411 -18,667 12,220 -19,953 -21,996
Change in cash and cash equivalents for the period -33,000 -261,974 -2,297 -107,653 -216,707
Cash and cash equivalents according to the
statement of financial position 324,279 293,930
324,279
293,930 335,868

DAMPSKIBSSELSKABET NORDEN A/S, 52, STRANDVEJEN, DK-2900 HELLERUP, DENMARK, WWW.DS-NORDEN.COM, CVR NO. 67758919 17/22
INTERIM REPORT – THIRD QUARTER 2012
Statement of changes in equity
USD ’000 Share
capital
Reserves Retained
earnings
Equity
(NORDEN's
shareholders)
Minority
interests
Group
equity
Equity at 1 January 2012 6,833 6,698 1,980,822 1,994,353 66 1,994,419
Total comprehensive income for the period 0 -4,074 -271,551 -275,625 2 -275,623
Distributed dividends 0 0 -30,368 -30,368 0 -30,368
Dividends, treasury shares 0 0 1,222 1,222 0 1,222
Share-based payment 0 0 2,868 2,868 0 2,868
Changes in equity 0 -4,074 -297,829 -301,903 2 -301,901
Equity at 30 September 2012
6,833
2,624
1,682,993
1,692,450
68
1,692,518
Equity at 1 January 2011 7,087 7,004 1,983,894 1,997,985 68 1,998,053
Total comprehensive income for the period 0 -492 58,046 57,554 -1 57,553
Acquisition of treasury shares 0 0 -31,556 -31,556 0 -31,556
Distributed dividends 0 0 -68,946 -68,946 0 -68,946
Dividends, treasury shares 0 0 5,240 5,240 0 5,240
Capital reduction -254 0 254 0 0 0
Share-based payment 0 0 3,037 3,037 0 3,037
Changes in equity -254 -492 -33,925 -34,671 -1 -34,672
Equity at 30 September 2011
6,833
6,512
1,949,969
1,963,314
67
1,963,381
Equity at 1 January 2011 7,087 7,004 1,983,894 1,997,985 68 1,998,053
Total comprehensive income for the period 0 -306 87,795 87,489 -2 87,487
Acquisition of treasury shares 0 0 -31,556 -31,556 0 -31,556
Distributed dividends 0 0 -68,946 -68,946 0 -68,946
Dividends, treasury shares 0 0 5,240 5,240 0 5,240
Capital reduction -254 0 254 0 0 0
Share-based payment 0 0 4,141 4,141 0 4,141
Changes in equity -254 -306 -3,072 -3,632 -2 -3,634
Equity at 31 December 2011
6,833
6,698
1,980,822
1,994,353
66
1,994,419

DAMPSKIBSSELSKABET NORDEN A/S, 52, STRANDVEJEN, DK-2900 HELLERUP, DENMARK, WWW.DS-NORDEN.COM, CVR NO. 67758919 18/22
INTERIM REPORT – THIRD QUARTER 2012
Notes to the financial statements
1. Significant accounting policies Basis of accounting
The interim report comprises the summarised consolidated financial statements of Dampskibsselskabet NORDEN A/S.
Accounting policies
The interim report has been prepared in accordance with the international financial reporting standard IAS 34 on interim reports and
additional Danish disclosure requirements for the financial statements of listed companies.
The consolidated annual report for 2011 has been prepared in accordance with the International Financial Reporting Standards (IFRS).
Accounting policies have not changed in relation to this.
For a complete description of accounting policies, see also pages 55-63 in the consolidated annual report for 2011.
New IAS/IFRSs
NORDEN has implemented the new financial reporting standards or interpretations which were effective from 1 January 2012. The
changes relate to some of IFRS 7's information requirements and are of no importance to NORDEN's results or equity in the interim
report.
New financial reporting standards
For a description of the IFRS and IFRIC which became effective on 1 January 2012 or later, see page 55 of the consolidated annual
report for 2011. No new or changed standards have been issued besides those mentioned in the consolidated annual report for 2011.
The standards have still yet to be adopted by the EU. NORDEN will assess the effect on the financial statements but has at the time of
writing not completed this assessment.
Significant choices and assessments in the accounting policies and significant accounting estimates
Management's choices and assessments in the accounting policies in respect of vessel leases, recognition of revenue and voyage
costs, impairment test and onerous contracts are significant. Management's accounting estimates of receivables, contingent assets
and liabilities and useful lives and residual values of tangible assets are also significant. For a description of these, see pages 56-57 of
the consolidated annual report for 2011.

DAMPSKIBSSELSKABET NORDEN A/S, 52, STRANDVEJEN, DK-2900 HELLERUP, DENMARK, WWW.DS-NORDEN.COM, CVR NO. 67758919 19/22
INTERIM REPORT – THIRD QUARTER 2012
2. Fair value adjustment of certain hedging instruments
USD ’000 2012 2011 2012 2011 2011
Q1-Q3 Q1-Q3 Q3 Q3 Q1-Q4
Bunker hedging:
Fair value adjustment for:
2011 0 27,869 0 -412 31,440
2012 11,488 3,515 11,225 -3,980 6,746
2013 4,202 64 6,703 -1,123 370
2014 1,254 54 2,214 -284 41
2015 26 0 164 0 -32
2016 47 0 88 0 -41
2017 43 0 55 0 -44
2018 43 0 55 0 -48
17,103 31,502 20,504 -5,799 38,432
Realised fair value adjustment reclassified to
"Vessel operating costs"*
-17,715
-30,454
-2,350
-10,557
-39,636
Total -612 1,048 18,154 -16,356 -1,204
Forward Freight Agreements:
Fair value adjustment for:
2011 0 33,550 0 -5,030 32,193
2012 9,209 1,859 1,659 84 1,979
2013 1,437 181 624 77 474
10,646 35,590 2,283 -4,869 34,646
Realised fair value adjustment reclassified to
"Revenue"*
-12,256
-44,558
-2,540
-7,958
-48,339
Total -1,610 -8,968 -257 -12,827 -13,693
Total -2,222 -7,920 17,897 -29,183 -14,897
* As the hedging instruments are realised, the accumulated fair value adjustments are reclassified to operations in the same item as
the hedged transaction. For further information, see the section "Significant accounting policies" in the consolidated annual report
for 2011.

DAMPSKIBSSELSKABET NORDEN A/S, 52, STRANDVEJEN, DK-2900 HELLERUP, DENMARK, WWW.DS-NORDEN.COM, CVR NO. 67758919 20/22
INTERIM REPORT – THIRD QUARTER 2012
3. Vessels
USD ’000 2012 2011 2011
30/9 30/9 31/12
Cost at 1 January 1,566,925 982,875 982,875
Transferred during the period from prepayments on vessels and newbuildings 128,114 361,868 524,102
Transferred during the period to tangible assets held for sale 0 0 0
Additions for the period 7,629 58,064 59,948
Disposals for the period -62,250 0 0
Cost 1,640,418 1,402,807 1,566,925
Depreciation at 1 January -179,736 -102,545 -102,545
Depreciation for the period -64,876 -54,903 -77,191
Reversed depreciation of disposed vessels 3,568 0 0
Reversed depreciation of tangible assets held for sale 0 0 0
Depreciation -241,044 -157,448 -179,736
Write-downs at 1 January 0 0 0
Write-downs for the period -258,374 0 0
Reversed write-downs of disposed vessels 15,457 0 0
Write-downs -242,917 0 0
Carrying amount 1,156,457 1,245,359 1,387,189
For the development of the fleet and added value, see the interim review.
4. Prepayments on vessels and newbuildings
USD ’000 2012 2011 2011
30/9 30/9 31/12
Cost at 1 January 170,025 401,884 401,884
Additions for the period 113,263 232,495 293,354
Transferred during the period to vessels -128,114 -361,868 -524,102
Transferred during the period to other items -24,574 -657 -1,111
Transferred during the period to tangible assets held for sale 0 0 0
Costs 130,600 271,854 170,025
Write-downs at 1 January 0 0 0
Write-downs for the period -31,626 0 0
Write-downs -31,626 0 0
Carrying amount 98,974 271,854 170,025

DAMPSKIBSSELSKABET NORDEN A/S, 52, STRANDVEJEN, DK-2900 HELLERUP, DENMARK, WWW.DS-NORDEN.COM, CVR NO. 67758919 21/22
INTERIM REPORT – THIRD QUARTER 2012
5. Write-down of vessels, etc.
Management's assessment of the need for write-downs of vessels and prepayments on newbuildings is based on the cash-generating
units (CGU), which include vessels, etc. NORDEN has divided its fleet into 3 CGUs (Dry Cargo, Tankers and a joint venture). An
impairment test must be performed if there is indication that the carrying amounts of vessels, etc. exceed the recoverable amounts.
The recoverable amount is the higher of the net selling price of the vessels, etc. (the market value of the fleet) and the value in use of
future cash flows from the vessels, etc.
Based on estimates from 3 independent brokers, the market value of NORDEN's fleet (net selling price excluding COAs) including
vessels in joint venture is estimated at USD 151 million below the carrying amounts at the end of the quarter. The difference is
divided between NORDEN's 3 CGUs, Dry Cargo, Tankers and a joint venture, with negative USD 78 million, negative USD 71 million
and negative USD 2 million, respectively.
Accordingly, an impairment test has been conducted for all 3 CGUs by estimating the value in use.
The impairment test is conducted by comparing the carrying amounts with the value in use of the fleet of the 3 CGUs. Value in use is
calculated as the present value of total expected cash flows over the remaining useful lives of the vessels, including time charter fleet,
coverage and estimated rates for uncovered capacity.
As part of the basis for estimation of the long-term values, the value in use of the 3 CGUs has been estimated by applying
"normalised" 20-year average rates, where the 3 and 4 best and worst years have been excluded. The normalisation of rates is new in
relation to the consolidated annual report 2011 (see note 5 to the financial statements in the interim report for the first quarter of
2012 for additional information).
Except from the updated freight rate scenarios, other assumptions in the impairment test for the period, including the discount factor
of 8%, are unchanged in relation to the consolidated annual report for 2011.
Based on the impairment test at the end of the first quarter, management estimated that there was need for write-downs of the total
fleet of USD 300 million. The write-downs totalling USD 300 million based on value in use were distributed with USD 250 million in
Dry Cargo, USD 40 million in Tankers and USD 10 million in a joint venture. In company announcement no. 11 of 15 May 2012
regarding the interim report for the first quarter of 2012, reasons for the write-downs etc. have been further accounted for.
On the basis of the impairment test conducted at the end of the third quarter, management estimates that there is no need for further
write-downs.
Due to the large number of open ship days, the value in use calculation is very sensitive to even small fluctuations in freight rates. As
an indication of this sensitivity, a fluctuation of USD 1,000 per day in long-term freight rates would change the CGU values by USD
131 million in Dry Cargo and USD 91 million in Tankers.
6. Related party transactions
No significant changes have occurred to closely related parties or types and scale of transactions with these parties other than what is
disclosed in the consolidated annual report for 2011.
7. Contingent assets and liabilities
Since the end of 2011, no significant changes have occurred to contingent assets and liabilities other than those referred to in this
interim report.

DAMPSKIBSSELSKABET NORDEN A/S, 52, STRANDVEJEN, DK-2900 HELLERUP, DENMARK, WWW.DS-NORDEN.COM, CVR NO. 67758919 22/22
INTERIM REPORT – THIRD QUARTER 2012
8. Overview of deliveries to the core fleet and fleet values
9. Significant events after the reporting date
Between the end of the quarter and the publication of this interim report, other than the developments disclosed in the interim
review, no significant events have occurred which have not been recognised and adequately disclosed and which materially affect the
profit for the period or the statement of financial position.
Expected delivery of the Company's core fleet at 30 September 2012
2012 Total
Q4 Q1 Q2 Q3 Q4 Q1 Q2 Q3 Q4
Dry Cargo
Post-Panamax 0
Panamax (1) (1) (2) (2) 1 (1) 8
Handymax (1) 1
Handysize 1 1 (1) 3
Tanker
MR 3 1 4
Handysize 1 1 2
Total 2 3 3 0 1 1 4 2 2 18
2013 2014
Note: Figures in brackets are deliveries of chartered vessels with purchase option, whereas deliveries from
the Company's newbuilding programme are stated without brackets. Totals have been calculated for the core
fleet as a whole.
Fleet values (before tax) at 30 September 2012
Dry Cargo Number
Carrying
amount/
cost
Market
value* Added value Number
Charter
party
Purchase and
extension
option
Value of
charter party
and purchase
option
Capesize 3 81 86 5 1 -4 1 -3
Post-Panamax 4 134 105 -29 4 -56 1 -55
Panamax 6 144 151 7 18 -46 24 -22
Handymax 5 92 87 -5 20 -39 37 -2
Handysize 15 356 298 -58 11 -45 3 -42
Tankers
MR 10 333 293 -40 9 -14 11 -3
Handysize 13 321 290 -31 0 0 0 0
Total 56 1,461 1,310 -151 63 -204 77 -127
Net Asset Value (NAV) at 30 September 2012 USD million DKK per share +10% -10%
Equity excl. minority interests per share 1,692 236 236 236
Added value own fleet -151 -21 -3 -39
NAV 1,541 215 233 197
Calculated value of charter parties with purchase and extension option -127 -17 0 -35
Total theoretical NAV 1,414 198 233 162
Note: *Including joint ventures, assets held for sale and any charterparties.
Calculated value of charter parties with purchase and
extension optionUSD million Owned (active and newbuildings)
Sensitivity