interim report first quarter 2021 - pse
TRANSCRIPT

Interim Report First Quarter 2021

Key financial data Income statement
in EUR million Q1 20 Q4 20 Q1 21 1-3 20 1-3 21
Net interest income 1,229.0 1,185.6 1,172.1 1,229.0 1,172.1
Net fee and commission income 504.2 528.5 540.0 504.2 540.0
Net trading result and gains/losses from financial instruments at FVPL -119.9 109.2 66.4 -119.9 66.4
Operating income 1,663.0 1,869.3 1,828.6 1,663.0 1,828.6
Operating expenses -1,111.2 -1,097.3 -1,103.3 -1,111.2 -1,103.3
Operating result 551.7 771.9 725.3 551.7 725.3
Impairment result from financial instruments -61.7 -424.7 -35.7 -61.7 -35.7
Post-provision operating result 490.0 347.3 689.6 490.0 689.6
Other operating result -127.6 -64.6 -126.7 -127.6 -126.7
Levies on banking activities -49.9 -17.4 -33.2 -49.9 -33.2
Pre-tax result from continuing operations 361.3 289.6 565.1 361.3 565.1
Taxes on income -103.0 -78.3 -124.3 -103.0 -124.3
Net result for the period 258.3 211.3 440.8 258.3 440.8
Net result attributable to non-controlling interests 23.0 65.2 85.7 23.0 85.7
Net result attributable to owners of the parent 235.3 146.0 355.1 235.3 355.1
Earnings per share 0.55 0.19 0.83 0.55 0.83
Return on equity 6.6% 2.3% 9.6% 6.6% 9.6%
Net interest margin (on average interest-bearing assets) 2.18% 2.05% 1.99% 2.18% 1.99%
Cost/income ratio 66.8% 58.7% 60.3% 66.8% 60.3%
Provisioning ratio (on average gross customer loans) 0.15% 1.00% 0.08% 0.15% 0.08%
Tax rate 28.5% 27.0% 22.0% 28.5% 22.0%
Balance sheet
in EUR million Mar 20 Dec 20 Mar 21 Dec 20 Mar 21
Cash and cash balances 23,031 35,839 53,954 35,839 53,954
Trading, financial assets 46,970 46,849 48,381 46,849 48,381
Loans and advances to banks 24,264 21,466 27,477 21,466 27,477
Loans and advances to customers 161,119 166,050 167,839 166,050 167,839
Intangible assets 1,322 1,359 1,332 1,359 1,332
Miscellaneous assets 6,193 5,830 5,985 5,830 5,985
Total assets 262,898 277,394 304,969 277,394 304,969
Financial liabilities held for trading 3,322 2,625 2,192 2,625 2,192
Deposits from banks 20,703 24,771 35,288 24,771 35,288
Deposits from customers 181,691 191,070 205,374 191,070 205,374
Debt securities issued 29,413 30,676 32,516 30,676 32,516
Miscellaneous liabilities 6,716 5,840 6,827 5,840 6,827
Total equity 21,053 22,410 22,771 22,410 22,771
Total liabilities and equity 262,898 277,394 304,969 277,394 304,969
Loan/deposit ratio 88.7% 86.9% 81.7% 86.9% 81.7%
NPL ratio 2.4% 2.7% 2.6% 2.7% 2.6%
NPL coverage ratio (based on AC loans, ex collateral) 80.9% 88.6% 89.5% 88.6% 89.5%
CET1 ratio (final) 13.1% 14.2% 14.0% 14.2% 14.0%
Ratings Mar 20 Dec 20 Mar 21
Fitch
Long-term A A A
Short-term F1 F1 F1
Outlook RWN Negative Negative
Moody´s
Long-term A2 A2 A2
Short-term P-1 P-1 P-1
Outlook Positive Stable Stable
Standard & Poor´s
Long-term A A A
Short-term A-1 A-1 A-1
Outlook Positive Stable Stable

1
Dear shareholders, Erste Group had a successful start to the new financial year posting a first-quarter net profit of EUR 355.1 million even though a restrictive environment caused by the Covid 19-pandemic delayed the economic recovery also in our core markets. Operating income was, overall, solid: while net interest income was lower than in the previous year, as expected, due to low interest rates and – compared with pre-Covid 19 periods – still subdued credit demand, the trend in net fee and commission income remained positive on the back of the continuing strong performance of the securities and asset management business. Building on an improved net trading and fair value result and rigorous cost discipline we achieved a significant improvement in the operating result. Another positive contribution to net profit came from moderate risk costs: at 8 basis points of gross loan volume, these were considerably lower than in previous quarters, which had been impacted by Covid-19-induced provisions for potential future developments. How did the economic environment develop in the first three months of the year? There was nothing close to a return to what used to be normalcy. Economic and social life in the CEE region continued to be curbed by the administrative measures imposed amid the Covid-19 pandemic. A variety of regional or national administrative restrictions was still adversely affecting a large number of industries, most notably the hospitality industry, tourism and trade. At the same time, positive momentum came from the manufacturing sector. As vaccination rollout accelerates, permitting a re-opening of the economy, our core markets are expected to grow at rates of 2.8% to 4.5% in 2021. Unemployment rates are likely to come down with a time lag, from 2022. Lower tax revenues and increased social spending will, however, continue to have a negative impact on national budgets. It is last but not least due to continuing government support for businesses that the Covid-19 crisis has not triggered a wave of insolvencies yet. This is also reflected in the Erste Group’s NPL ratio, which stood at 2.6% at the end of March 2021. The key driver of our strong operating performance is the trust that our clients place in us. In the retail business, demand for mortgage loans remained very strong while interest in consumer loans was still subdued. The inflow of deposits was again robust. Prosperity advice – Erste Group’s financial advisory service designed to help our clients achieve and maintain prosperity – has been enjoying increasing popularity in the persistent low-interest-rate environment. Favourable market conditions supported the positive trend in the securities business and in asset management. Our digital platform George is now available in all of our core markets, with the exception of Serbia, and recording a steady rise in the number of digital users and digital transactions. The development of customer satisfaction is gratifying. In the corporate segment, loan growth is seen mainly in the large corporates business as investment activity is picking up again. Deposits were likewise up in this segment. Interest in advisory services has been increasing also in connection with considerations concerning sustainability. These developments have also had an impact on our balance sheet. The strong rise in retail and corporate customers’ deposits reduced the loan-to-deposit ratio to 81.7%. In view of the ECB’s continuing recommendation to restrict dividend payments it is important to me to highlight Erste Group’s strong capital position. At the end of March 2021, the common equity tier 1 ratio (final) was again at an excellent level at 14.0%. It is thus substantially above our target of 13.5% and far above the regulatory minimum requirement. As always, first-quarter net earnings were not included in the above figures. We thus have a substantial cushion to offset worse-than-expected economic developments. As previously announced, the management board and the supervisory board will propose the distribution of a cash dividend of EUR 0.5 per share for the financial year 2020 at the annual general meeting, which will be held virtually on 19 May 2021. In addition, EUR 1 per share has been set aside for a potential additional dividend to be paid out at a later date. Overall, our outlook on the future is optimistic as vaccination rates are rising rapidly and the economy is gradually re-opening. With our highly skilled and committed employees and subsidiaries in CEE we are excellently positioned to support people, businesses and the public sector and contribute to the recovery of the economy. The three key pillars of Erste Group’s strategy – efficiency, digital transformation and growth – form the sound basis on which we fulfil the purpose of our business as it has been for more than 200 years: to spread and secure prosperity across the region. We are looking forward to keep pursuing our core business in a socially and environmentally responsible manner while also achieving economic success. Bernhard Spalt m.p.
Letter from the CEO

2
EQUITY MARKET REVIEW In the first quarter, international financial markets continued the rally seen in the final months of the previous year. Economic growth is expected to accelerate in 2021 despite the persistently large number of corona cases and extended lockdowns. This is attributable, on the one hand, to the rollout of vaccinations launched across the globe and, on the other, to the fact that corporate earnings last year were down less sharply than expected and the outlook for revenues and earnings this year and next has been revised upwards. The central banks’ continuing expansionary policies with low key interest rates and sovereign bond purchases supported positive stock market sentiment. Buoyed up by a significantly better-than-expected reporting season in the US and in Europe together with further improvements in the revenues and earnings forecasts for the quarters ahead, the stock markets covered posted gains. The US indices registered new record highs. The Dow Jones Industrials Index rose 7.8% to 32,981.55 points, the Standard & Poor’s 500 Index 5.8% to 3,972.90 points. The broader European Stoxx 600 Index closed the first quarter up 7.7% at 429,60 points. Supported by globally upbeat investor sentiment and its strong weighting of financials and cyclicals, the Austrian Traded Index (ATX) surpassed the 3,000-point mark and returned to its pre-corona-crisis levels. At 3,159.77 points and with a gain of 13.6% at the end of the quarter, the index outperformed the other stock markets covered. The Euro Stoxx Banks Index, which is composed of the leading European bank shares, finished the reporting period with a double-digit gain, having moved in tandem with the rebound in the share prices of global banks that are likely to benefit from the expected upturn of the economy. After shedding almost 24% last year, the European banking index ended the quarter up 19.4% at 88.07 points. In addition to positive news on economic growth and corporate earnings, the market environment is being impacted by the continuing activities of central banks that expand their balance sheets for an extended period of time. The US central bank (Fed) is planning to purchase bonds at a monthly rate of USD 120 billion. The Fed’s entire stimulus package is worth USD 1.9 trillion. The European Central Bank (ECB) already increased its flexible Corona pandemic emergency purchase programme (PEPP) for sovereign bonds and corporate bonds) in De-cember 2020 by EUR 500 billion to EUR 1.85 billion and extended the programme until the end of March 2022. As a result, the financial markets will be supplied with vast amounts of liquidity, which will cap the rise in yields. SHARE PERFORMANCE The Erste Group share advanced significantly in the first quarter, in lockstep with the upward trend and the recovery of European banking shares. After declining by more than 25% in the year ended, the share closed the reporting period up 16.0% at EUR 28.92. During the reporting period, the Erste Group share marked its low at EUR 24.80 and its high at EUR 29.27. This development was supported by an operating result and a capitalisation rate for the year 2020 that exceeded analysts’ expectations. Investors and nalysts also focused on the development and the outlook for 2021, including in particular lending growth, net interest income, net fee and commission income, operating expenses and risk costs. At the annual general meeting to be held in May, it will be proposed to pay a dividend of EUR 0.50 per share. In addition, EUR 1 per share has been set aside for potential payout at a later date. The Erste Group share is traded on the stock exchanges of Vienna, Prague and Bucharest. In the first quarter of 2021, trading volume on these stock exchanges averaged 875,020 shares per day and accounted for about 58% of total trading volume in Erste Group shares. FUNDING AND INVESTOR RELATIONS On the issue side, the current financial year began with the successful placement of a 10-year senior preferred note in the amount of EUR 500 million at MS+55bps, and seamlessly followed on from the issuing activities in November of the previous year, which are to been as prefunding for the current financial year. The total refinancing volume for 2021 is at previous year's level, with a clear focus on senior preferred instruments. Against the backdrop of the Covid-19 induced restrictions, banking and investor conferences were again held exclusively as virtual events in the first quarter of 2021. Conferences were organised by BoAML, JP Morgan, HSBC, PKO, Unicredit, Morgan Stanley and Wood. In addition, the management and the investor relations team of Erste Group conducted a large number of one-on-one and group meetings as phone and video conferences, in which questions raised by investors and analysts were answered.
Erste Group on the capital markets

3
In the interim management report, financial results from January- March 2021 are compared with those from January-March 2020 and balance sheet positions as of 31 March 2021 with those as of 31 December 2020. EARNINGS PERFORMANCE IN BRIEF Net interest income declined – mainly in the Czech Republic and Austria – to EUR 1,172.1 million (-4.6%; EUR 1,229.0 million). Net fee and commission income rose to EUR 540.0 million (+7.1%; EUR 504.2 million) as increases were recorded in all fee and commission income categories, most notably in the securities business and in asset management. Net trading result improved significantly to EUR 9.5 million (EUR -157.4 million); gains/losses from financial instruments measured at fair value through profit or loss were up at EUR 56.9 million (EUR 37.5 million). Both line items were driven mostly by valuation effects. As a result, operating income increased to EUR 1,828.6 million (+10.0%; EUR 1,663.0 million). General administrative expenses declined to EUR 1,103.3 million (-0.7%; EUR 1,111.2 million). Personnel expenses were lower at EUR 622.4 million (-1.2%; EUR 630.0 million). Other administrative expenses were nearly unchanged at EUR 345.8 million (+0.3%; EUR 344.8 million) despite a significant rise in payments into deposit insurance schemes to EUR 107.6 million (EUR 88.3 million). Most of the contributions expected for 2021 have already been posted upfront. Amortisation and depreciation amounted to EUR 135.1 million (EUR 136.5 million). Overall, the operating result increased to EUR 725.3 million (+31.5%; EUR 551.7 million) and the cost/income ratio improved to 60.3% (66.8%). Due to net allocations, the impairment result from financial instruments amounted to EUR -35.7 million or 8 basis points of average gross customers loans (EUR -61.7 million or 15 basis points). Positive contributions came primarily from the release of provisions for loans in Austria and Romania and the recovery of loans already written off in Hungary and Austria. Net allocations to provisions for commitments and guarantees given were likewise lower. The NPL ratio based on gross customer loans improved to 2.6% (2.7%). The NPL coverage
ratio increased to 89.5% (88.6%). Other operating result amounted to EUR -126.7 million (EUR -127.6 million). Expenses for the annual contributions to resolution funds for the full year 2021 included in this line item rose – most strongly in Austria and Romania – to EUR 100.3 million (EUR 84.0 million). The decline in banking levies to EUR 33.2 million (EUR 49.9 million) is primarily attributable to the abolition of banking tax in Slovakia. At present, banking levies are payable in two core markets: in Hungary, banking tax for the full year amounted to EUR 14.7 million (EUR 14.2 million) and transaction tax for the quarter to another EUR 11.6 million (EUR 12.5 million). In Austria, banking tax equalled EUR 7.0 million (EUR 6.3 million). Taxes on income increased to EUR 124.3 million (EUR 103.0 million). The minority charge improved to EUR 85.7 million (EUR 23.0 million) due to significantly higher earnings contributions of the savings banks. The net result attributable to owners of the parent rose to EUR 355.1 million (+50.9%; EUR 235.3 million). Total equity not including AT1 instruments rose to EUR 20.0 billion (EUR 19.7 billion). After regulatory deductions and filtering in accordance with the CRR, common equity tier 1 capital (CET1, final) was broadly unchanged at EUR 17.0 billion (EUR 17.1 billion), as were total own funds (final) at EUR 23.4 billion (EUR 23.6 billion). The above figures do not include interim profit, while risk costs were deducted. Total risk – risk-weighted assets including credit, market and operational risk (CRR, final) – increased moderately to EUR 121.0 billion (EUR 120.2 billion). The common equity tier 1 ratio (CET1, final) stood at 14.0% (14.2%), the total capital ratio at 19.4% (19.7%). Total assets increased to EUR 305.0 billion (+9.9%; EUR 277.4 billion). On the asset side, cash and cash balances rose, most notably in Austria, to EUR 54.0 billion (EUR 35.8 billion), loans and advances to banks to EUR 27.5 billion (EUR 21.5 billion). Loans and ad-
vances to customers increased to EUR 167.8 billion (+1.1%; EUR 166.1 billion). On the liability side, deposits from banks grew signif-icantly to EUR 35.3 billion (EUR 24.8 billion) as a result of increased ECB refinancing (TLTRO). Customer deposits rose again in all core markets – most strongly in the Czech Republic and Austria – to EUR 205.4 billion (+7.5%; EUR 191.1 billion). The loan-to-deposit
ratio declined significantly to 81.7% (86.9%).
Interim management report

4
OUTLOOK Erste Group’s goal for 2021 is to increase net profit. Among the factors that will support achievement of this goal are a recovery of the economies of all core markets – the Czech Republic, Slovakia, Hungary, Romania, Croatia, Serbia and Austria – and, on this basis, a reduction of risk costs and an improvement in the operating result. A continuation or further escalation of Covid-19 measures by govern-ments as well as potential – and as yet un-quantifiable – political, regulatory or economic risks may render meeting this goal more chal-lenging. In 2021, the positive development of the economy should be reflected in growth rates (real GDP growth) of between 2.8% and 4.5% in Erste Group’s CEE core markets. The development of other economic indicators should vary depending on Covid-19 policy measures imposed by authorities and/or the phasing out of state support. Unemployment rates are expected to rise but, in the Czech Republic and Hungary, should remain among the lowest in the EU. Inflation rates are forecast to decline in the Czech Republic and Slovakia while the other core markets are likely to see a slight acceleration. In most countries, sustained competitiveness should again result in solid and, in Slovakia and Romania, stronger current account balances. The fiscal situation should likewise improve again after the significant budget deficits posted in the year 2020. Public debt is projected to remain largely stable, albeit at a significantly elevated level. Against this backdrop, Erste Group expects net loan growth in the low to mid-single digit range. This performance should keep net interest income stable despite negative interest rates in the euro zone. The second most important income component – net fee and commission income – is expected to rise in mid single digits with upside potential. As in 2020, positive momentum should again come from fund management, the securities business and insurance brokerage. Given the average result seen in 2020, the net trading and fair value result is expected to come in higher. This, however, will depend substantially on the financial market environment. The remaining income compo-nents are forecast to remain, by and large, stable. Overall, operating income should increase again in 2021. Operating expenses are expected to rise slightly in 2021, partly due to re-emerging wage pressure across all Erste Group markets. In addition, Erste Group will continue to invest in IT in 2021 and thus strengthening its competitive position, with a focus on progressive IT modernisation, backoffice digitalisation and expansion of the digital platform George. The rollout of George in Hungary and Croatia should be completed in 2021, as a result of which customers will be able to access George in the six largest core markets. Though faced with more challenges in a largely unpredictable environment, Erste Group is striving to make operating income grow faster than costs. This leads Erste Group to project a rise in the operating result in 2021. Based on the scenario described above, risks costs should decline again in 2021. While precise forecasting is hard in the current Covid-19 environment, Erste Group believes that in 2021 risk costs will not exceed 65 basis points of average gross customer loans. A review of this guidance will be dependent on vaccination progress, effectiveness of state support measures and magnitude of the economic recovery. Due to the expected expiry of state support schemes a rise of the NPL ratio to 3 - 4% is expected, though. Other operating result is expected to remain unchanged in the absence of significant one-off effects. Assuming a tax rate of below 25% and a similar level of minority charges as in the previous year, Erste Group aims to achieve an improvement in net profit. Erste Group’s CET1 ratio is expected to remain strong. The management board proposes to the annual general meeting in May – in line with ECB recommen-dation – a dividend for 2020 of EUR 0.5 per share. An additional EUR 1/share has been reserved for a potential later payment. Potential risks to the guidance are besides other than expected (geo)political, economic (monetary and fiscal policies) and regulatory measures and developments also global health risks and changes to the competitive environment. In addition, given the Covid-19 govern-mental measures and their impact on the economic development, financial forecasts are still subject to an elevated level of uncertainty. Erste Group is moreover exposed to non-financial and legal risks that may materialise regardless of the economic environment. Worse than expected economic development may put goodwill at risk.

5
PERFORMANCE IN DETAIL
in EUR million 1-3 20 1-3 21 Change
Net interest income 1,229.0 1,172.1 -4.6%
Net fee and commission income 504.2 540.0 7.1%
Net trading result and gains/losses from financial instruments at FVPL -119.9 66.4 n/a
Operating income 1,663.0 1,828.6 10.0%
Operating expenses -1,111.2 -1,103.3 -0.7%
Operating result 551.7 725.3 31.5%
Impairment result from financial instruments -61.7 -35.7 -42.1%
Other operating result -127.6 -126.7 -0.7%
Levies on banking activities -49.9 -33.2 -33.4%
Pre-tax result from continuing operations 361.3 565.1 56.4%
Taxes on income -103.0 -124.3 20.7%
Net result for the period 258.3 440.8 70.6%
Net result attributable to non-controlling interests 23.0 85.7 >100.0%
Net result attributable to owners of the parent 235.3 355.1 50.9%
Net interest income Net interest income decreased to EUR 1,172.1 million (EUR 1,229.0 million). Except for an increase in Hungary and Serbia, lower interest rates resulted in a reduction of net interest income in all other core markets, most notably in the Czech Republic and Austria. The net interest margin (calculated as the annualised sum of net interest income, dividend income and net result from equity method investments over average interest-bearing assets) stood at 1.99% (2.18%). Net fee and commission income Net fee and commission income increased to EUR 540.0 million (EUR 504.2 million). While the strongest income growth was registered in the securities business and in asset management, particularly in Austria, other net fee and commission income, such as insurance brokerage commis-sions, also developed positively. All markets – with the exception of Croatia – saw solid growth. Net trading result & gains/losses from financial instruments measured at fair value through profit or loss Valuation effects have a substantial impact on the net trading result as well as on the line item gains/losses from financial instruments measured at fair value through profit or loss. Debt securities issued measured at FV through profit or loss are particularly impacted – related valuation results are shown in the line item gains/losses from financial instruments measured at fair value through profit or loss, while the valuation results of corresponding hedges are shown in net trading result – as are financial assets in the fair value and trading portfolios. Due to valuation effects resulting from interest rate developments in the derivatives business as well as growth in foreign exchange trading, net trading result improved significantly to EUR 9.5 million (EUR -157.4 million). Gains/losses from financial instruments measured at fair value through profit or loss increased to EUR 56.9 million (EUR 37.5 million). With long-term interest rates up, small losses from the valua-tion of the securities and loan portfolios measured at fair value were offset by significantly higher gains from the valuation of debt securities in issue. General administrative expenses in EUR million 1-3 20 1-3 21 Change
Personnel expenses 630.0 622.4 -1.2%
Other administrative expenses 344.8 345.8 0.3%
Depreciation and amortisation 136.5 135.1 -1.0%
General administrative expenses 1,111.2 1,103.3 -0.7%
General administrative expenses decreased to EUR 1,103.3 million (EUR 1,111.2 million). Personnel expenses declined to EUR 622.4 million (EUR 630.0 million). On the back of lower average headcounts, cost reductions were achieved primarily in Austria and Romania. Other administrative expenses were nearly unchanged at EUR 345.8 million (EUR 344.8 million). Declines were seen in marketing and IT expenses. Contributions to deposit insurance systems – except for Serbia, already for the full year – were substantially higher at EUR 107.6 million (EUR 88.3 million). Contributions were up sharply in Austria, at EUR 75.9 million (EUR 62.2 million) and in Slovakia, at EUR 9.4 million (EUR 1.1 million). No further payments are currently due in Croatia. Amortisation and depreciation amounted to EUR 135.1 million (EUR 136.5 million).

6
Headcount as of end of the period Dec 20 Mar 21 Change
Austria 15,942 15,922 -0.1%
Erste Group, EB Oesterreich and subsidiaries 8,866 8,902 0.4%
Haftungsverbund savings banks 7,076 7,020 -0.8%
Outside Austria 29,748 29,489 -0.9%
Česká spořitelna Group 9,820 9,803 -0.2%
Banca Comercială Română Group 5,645 5,567 -1.4%
Slovenská sporiteľňa Group 3,770 3,753 -0.4%
Erste Bank Hungary Group 3,227 3,215 -0.4%
Erste Bank Croatia Group 3,252 3,227 -0.8%
Erste Bank Serbia Group 1,198 1,207 0.8%
Savings banks subsidiaries 1,625 1,495 -8.0%
Other subsidiaries and foreign branch offices 1,213 1,222 0.7%
Total 45,690 45,411 -0.6%
Operating result Operating income increased to EUR 1,828.6 million (+10.0%; EUR 1,663.0 million) driven by a significant rise in the net trading and fair value result and net fee and commission income. General administrative expenses declined moderately to EUR 1,103.3 million (-0.7%; EUR 1,111.2 million) on the back of lower personnel expenses. The operating result rose to EUR 725.3 million (+31.5%; EUR 551.7 mil-lion). The cost/income ratio improved to 60.3% (66.8%). Gains/losses from derecognition of financial instruments not measured at fair value through profit or loss Gains from derecognition of financial instruments not measured at fair value through profit or loss amounted to EUR 2.2 million (losses of EUR -1.2 million). This line item includes primarily gains/losses from the sale of securities. Impairment result from financial instruments Due to net allocations, the impairment result from financial instruments amounted to EUR-35.7 million (EUR -61.7 million). Net allo-cations to provisions for commitments and guarantees given declined to EUR 9.6 million (EUR 37.9 million). Positive contributions came from the release of provisions for loans in Austria and Romania as well as from income from the recovery of loans already written off – primarily in Hungary and Austria – in the amount of EUR 21.0 million (EUR 65.1 million). Other operating result Other operating result came in at EUR -126.7 million (EUR -127.6 million). Levies on banking activities declined to EUR 33.2 million (EUR 49.9 million). This decline is attributable to the abolition of banking levies in Slovakia, which had amounted to EUR 16.9 million in the comparative period. Banking levies payable in Austria were slightly up at EUR 7.0 million (EUR 6.3 million). Hungarian banking tax – already posted upfront for the full year 2021 – rose to EUR 14.7 million (EUR 14.2 million). Together with the financial transaction tax of EUR 11.6 million (EUR 12.5 million), banking levies in Hungary totalled EUR 26.2 million (EUR 26.8 million). The balance of allocations/releases of other provisions improved to EUR 8.2 million (EUR -22.8 million). Other operating result also re-flects the annual contributions to resolution funds in the amount of EUR 100.3 million (EUR 84.0 million). Increases were recorded above all in Austria, to EUR 44.7 million (EUR 34.8 million), and in Romania, to EUR 11.2 million (EUR 7.8 million). Net result The pre-tax result from continuing operations amounted to EUR 565,1 million (EUR 361.3 million). Taxes on income rose to EUR 124.3 million (EUR 103.0 million). The minority charge increased to EUR 85.7 million (EUR 23.0 million) due to significantly higher earnings contributions of the savings banks. The net result attributable to owners of the parent rose to EUR 355.1 million (EUR 235.3 million).

7
FINANCIAL RESULTS – QUARTER-ON-QUARTER COMPARISON Financial results from the first quarter of 2021 are compared with those from the fourth quarter of 2020.
in EUR million Q1 20 Q2 20 Q3 20 Q4 20 Q1 21
Income statement
Net interest income 1,229.0 1,167.9 1,192.4 1,185.6 1,172.1
Net fee and commission income 504.2 452.5 491.6 528.5 540.0
Dividend income 1.5 13.3 0.9 4.3 4.8
Net trading result -157.4 138.2 28.2 128.6 9.5
Gains/losses from financial instruments measured at fair value through profit or loss 37.5 -8.9 52.9 -19.4 56.9
Net result from equity method investments 3.3 2.6 4.0 0.5 1.5
Rental income from investment properties & other operating leases 44.8 43.5 44.0 41.3 43.7
Personnel expenses -630.0 -635.5 -636.7 -618.5 -622.4
Other administrative expenses -344.8 -238.6 -235.6 -339.9 -345.8
Depreciation and amortisation -136.5 -129.4 -136.1 -138.9 -135.1
Gains/losses from derecognition of financial assets at AC 0.4 -0.1 -0.1 6.6 2.5
Other gains/losses from derecognition of financial instruments not at FVPL -1.7 -0.5 1.4 0.3 -0.3
Impairment result from financial instruments -61.7 -613.7 -194.7 -424.7 -35.7
Other operating result -127.6 -42.3 -43.8 -64.6 -126.7
Levies on banking activities -49.9 -33.1 -17.3 -17.4 -33.2
Pre-tax result from continuing operations 361.3 148.8 568.3 289.6 565.1
Taxes on income -103.0 -37.3 -123.9 -78.3 -124.3
Net result for the period 258.3 111.5 444.4 211.3 440.8
Net result attributable to non-controlling interests 23.0 53.0 101.0 65.2 85.7
Net result attributable to owners of the parent 235.3 58.5 343.3 146.0 355.1
Net interest income declined to EUR 1,172.1 million (EUR 1,185.6 million). Increases in Hungary as well as in the Czech Republic and in Serbia were offset by declines in Austria and Slovakia. Net fee and commission income rose to EUR 540.0 million (+2.2%; EUR 528.5 million). Increases were recorded most notably in Austria and the Czech Republic, primarily in the securities business and in asset manage-ment. Dividend income amounted to EUR 4.8 million (EUR 4.3 million). The decline in net trading result to EUR 9.5 million (EUR 128.6 million) is attributable to valuation effects in the derivatives and securities business resulting from interest rate developments. Gains/losses from financial instruments measured at fair value through profit or loss rose to EUR 56.9 million (EUR -19.4 million), primarily due to valuation gains of debt securities in issue driven by interest rate developments. General administrative expenses were nearly unchanged, amounting to EUR 1,103.3 million (+0.5%; EUR 1,097.3 million). Personnel expenses rose to EUR 622.4 million (+0.6%; EUR 618.5 million). Other administrative expenses increased to EUR 345.8 million (+1.7%; EUR 339.9 million). Depreciation and amortisation decreased to EUR 135.1 million (EUR 138.9 million). The cost/income ratio stood at 60.3% (58.7%). Gains/losses from derecognition of financial instruments not measured at fair value through profit or loss amounted to EUR 2.2 million (EUR 7.0 million). The impairment result from financial instruments improved significantly to EUR -35.7 million (EUR -424.7 million). In the previous quarter, the negative balance of allocations/releases of provisions for the lending business was impacted by the deterioration in the macro-economic outlook due to Covid-19. Other operating result declined to EUR -126.7 million (EUR -64.6 million). Levies on banking activities amounted to EUR 33.2 million (EUR 17.4 million). Thereof, EUR 26.2 million (EUR 10.9 million) were charged in Hungary, including the upfront posting of the total banking tax for 2021 in the amount of EUR 14.7 million and the financial transaction tax of EUR 11.6 million, and EUR 7.0 million (EUR 6.5 million) in Austria. This line item also included all contributions to resolution funds expected to be payable in 2021 in the amount of EUR 100.3 million. The pre-tax result increased to EUR 565.1 million (EUR 289.6 million). Taxes on income amounted to EUR 124.3 million (EUR 78.3 million). The minority charge rose to EUR 85.7 million (EUR 65.2 million). As a result, the net result attributable to owners of the
parent improved to EUR 355.1 million (EUR 146.0 million).

8
DEVELOPMENT OF THE BALANCE SHEET
in EUR million Dec 20 Mar 21 Change
Assets
Cash and cash balances 35,839 53,954 50.5%
Trading, financial assets 46,849 48,381 3.3%
Loans and advances to banks 21,466 27,477 28.0%
Loans and advances to customers 166,050 167,839 1.1%
Intangible assets 1,359 1,332 -2.0%
Miscellaneous assets 5,830 5,985 2.7%
Total assets 277,394 304,969 9.9%
Liabilities and equity
Financial liabilities held for trading 2,625 2,192 -16.5%
Deposits from banks 24,771 35,288 42.5%
Deposits from customers 191,070 205,374 7.5%
Debt securities issued 30,676 32,516 6.0%
Miscellaneous liabilities 5,840 6,827 16.9%
Total equity 22,410 22,771 1.6%
Total liabilities and equity 277,394 304,969 9.9%
The rise in cash and cash balances to EUR 54.0 billion (EUR 35.8 billion) was primarily due to large cash balances held at central banks, not least due to increased TLTRO funds. Trading and investment securities held in various categories of financial assets increased to EUR 48.4 billion (EUR 46.8 billion). Loans and advances to credit institutions (net), including demand deposits other than overnight deposits, increased primarily in the Czech Republic, to EUR 27.5 billion (EUR 21.5 billion). Loans and advances to customers (net) rose – most notably in Austria and the Czech Republic – to EUR 167.8 billion (EUR 166.1 billion) driven by retail and corporate loan growth. Loan loss allowances for loans to customers were unchanged at EUR 4.0 billion (EUR 4.0 billion). The NPL ratio – non–performing loans as a percentage of gross customer loans – improved to 2.6% (2.7%), the NPL coverage ratio (based on gross customer loans) to 89.5% (88.6%). Intangible assets remained nearly unchanged at EUR 1.3 billion (EUR 1.4 billion). Miscellaneous assets amounted to EUR 6.0 billion (EUR 5.8 billion). Financial liabilities – held for trading declined to EUR 2.2 billion (EUR 2.6 billion). Deposits from banks, primarily in the form of term deposits, rose to EUR 35.3 billion (EUR 24.8 billion), including EUR 18.1 billion in TLTRO III funds as of the end of March 2021; deposits from customers increased to EUR 205.4 billion (EUR 191.1 billion) due to strong growth in overnight deposits as well as in term deposits and repurchase transactions (leasing liabilities of EUR 0.6 billion are not included in this position). The loan-to-deposit
ratio declined significantly to 81.7% (86.9%). Debt securities in issue rose to EUR 32.5 billion (EUR 30.7 billion). Miscellaneous
liabilities amounted to EUR 6.8 billion (EUR 5.8 billion). Total assets rose to EUR 305.0 billion (EUR 277.4 billion). Total equity increased to EUR 22.8 billion (EUR 22.4 billion). This includes AT1 instruments in the amount of EUR 2,733.0 million from five issuances (June 2016, April 2017, March 2019, January 2020 and No-vember 2020). After regulatory deductions and filtering according to the Capital Requirements Regulation (CRR) common equity tier 1
capital (CET1, CRR final) was broadly unchanged at EUR 17.0 billion (EUR 17.1 billion) as were total own funds (CRR final) at EUR 23.4 billion (EUR 23.6 billion). The above figures do not include interim profit, while risk costs are deducted. Total risk – risk-weighted
assets including credit, market and operational risk (CRR final) – increased moderately to EUR 121.0 billion (EUR 120.2 billion). The total capital ratio, total eligible qualifying capital in relation to total risk (CRR final), stood at 19.4% (19.7%), well above the legal minimum requirement. The tier 1 ratio stood at 16.3% (16.5%), the common equity tier 1 ratio at 14.0% (14.2%) (both ratios CRR final).

9
SEGMENT REPORTING January-March 2021 compared with January-March 2020 Erste Group’s segment reporting is based on a matrix organisation. It provides comprehensive information to assess the performance of geographical (operating) segments as well as business segments. The tables and information below provide a brief overview and focus on selected and summarised items. For more details please see Note 28. At www.erstegroup.com/investorrelations additional information is available in Excel format. Operating income consists of net interest income, net fee and commission income, net trading result, gains/losses from financial instruments measured at fair value through profit or loss, dividend income, net result from equity method investments and rental income from investment properties & other operating leases. The latter three listed items are not disclosed in the tables below. Net trading result and gains/losses from financial instruments measured at fair value through profit or loss are summarized under one position. Operating expenses correspond to the position general administrative expenses. Operating result is the net amount of operating income and operating expenses. Risk pro-visions for loans and receivables are included in the position impairment result from financial instruments. Other result summarises the positions other operating result and gains/losses from financial instruments not measured at fair value through profit or loss, net. The cost/income ratio is calculated as operating expenses in relation to operating income. The return on allocated capital is defined as the net result after tax/before minorities in relation to the average allocated capital. GEOGRAPHICAL (OPERATING) SEGMENTS Erste Bank Oesterreich & Subsidiaries in EUR million 1-3 20 1-3 21 Change
Net interest income 161.1 149.3 -7.3%
Net fee and commission income 106.1 110.8 4.4%
Net trading result and gains/losses from financial instruments at FVPL -0.2 4.4 n/a
Operating income 281.4 280.0 -0.5%
Operating expenses -188.8 -191.5 1.4%
Operating result 92.6 88.5 -4.4%
Cost/income ratio 67.1% 68.4%
Impairment result from financial instruments -21.7 5.1 n/a
Other result -17.0 -16.3 -3.8%
Net result attributable to owners of the parent 36.1 49.1 35.8%
Return on allocated capital 9.0% 12.5%
The Erste Bank Oesterreich & Subsidiaries (EBOe & Subsidiaries) segment comprises Erste Bank der oesterreichischen Sparkassen AG (Erste Bank Oesterreich) and its main subsidiaries (e.g. sBausparkasse, Salzburger Sparkasse, Tiroler Sparkasse, Sparkasse Hainburg). Net interest income decreased due to lower margins for customer loans and higher interest expense from placement of excess liquidity, which could not be compensated by higher loan volumes. Net fee and commission income rose on the back of higher income from securities fees. The improvement in net trading result and gains/losses from financial instruments at FVPL was driven by valuation effects. Operating expenses went up mainly due an increase of the deposit insurance contribution to EUR 32.3 million (EUR 27.7 million) due to higher deposit volumes only partially compensated by lower marketing costs. Consequently, operating result decreased and the cost/income ratio worsened. The improvement of impairment result from financial instruments was driven by improvement of credit ratings in retail business and reduction of exposure in corporate business. Other result remained largely stable, since the higher payments into the resolution fund in the amount of EUR 11.2 million (EUR 8.2 million) were offset by higher selling gains for real estate and lower provisions for legal expenses. Banking tax amounted to EUR 1.1 million (EUR 0.9 million). Overall, the net result attributable to owners of the parent improved.
10
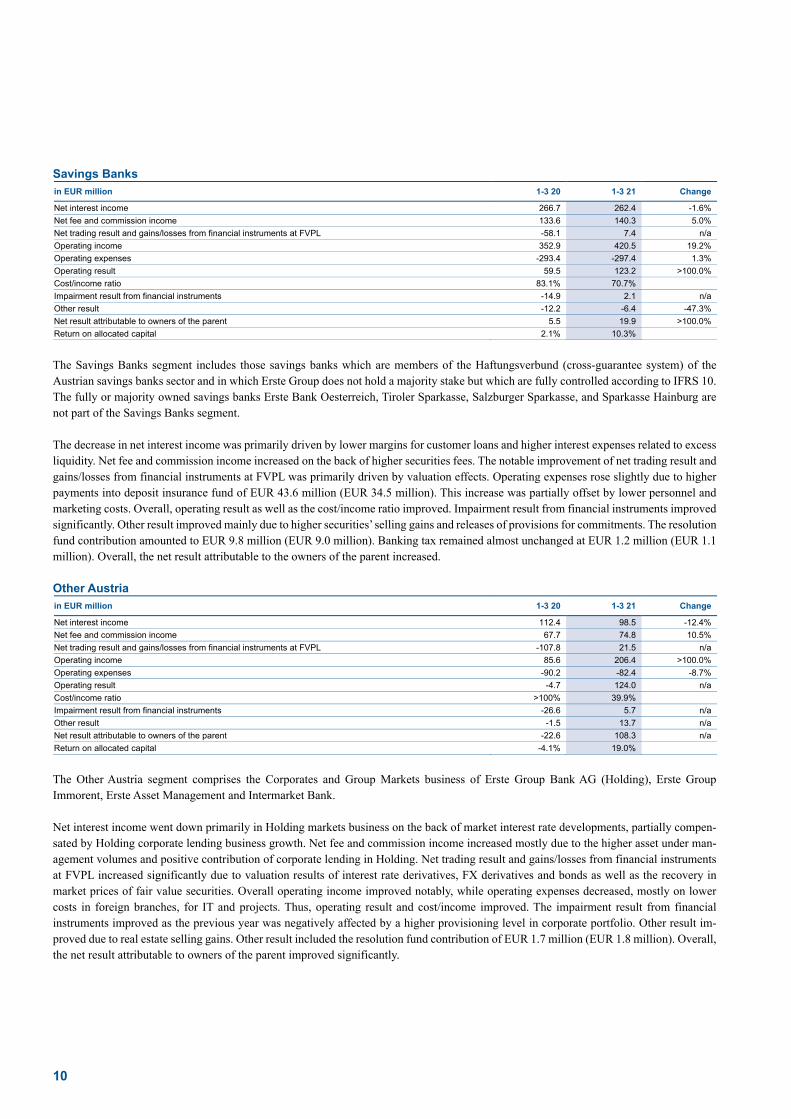
Savings Banks in EUR million 1-3 20 1-3 21 Change
Net interest income 266.7 262.4 -1.6%
Net fee and commission income 133.6 140.3 5.0%
Net trading result and gains/losses from financial instruments at FVPL -58.1 7.4 n/a
Operating income 352.9 420.5 19.2%
Operating expenses -293.4 -297.4 1.3%
Operating result 59.5 123.2 >100.0%
Cost/income ratio 83.1% 70.7%
Impairment result from financial instruments -14.9 2.1 n/a
Other result -12.2 -6.4 -47.3%
Net result attributable to owners of the parent 5.5 19.9 >100.0%
Return on allocated capital 2.1% 10.3%
The Savings Banks segment includes those savings banks which are members of the Haftungsverbund (cross-guarantee system) of the Austrian savings banks sector and in which Erste Group does not hold a majority stake but which are fully controlled according to IFRS 10. The fully or majority owned savings banks Erste Bank Oesterreich, Tiroler Sparkasse, Salzburger Sparkasse, and Sparkasse Hainburg are not part of the Savings Banks segment. The decrease in net interest income was primarily driven by lower margins for customer loans and higher interest expenses related to excess liquidity. Net fee and commission income increased on the back of higher securities fees. The notable improvement of net trading result and gains/losses from financial instruments at FVPL was primarily driven by valuation effects. Operating expenses rose slightly due to higher payments into deposit insurance fund of EUR 43.6 million (EUR 34.5 million). This increase was partially offset by lower personnel and marketing costs. Overall, operating result as well as the cost/income ratio improved. Impairment result from financial instruments improved significantly. Other result improved mainly due to higher securities’ selling gains and releases of provisions for commitments. The resolution fund contribution amounted to EUR 9.8 million (EUR 9.0 million). Banking tax remained almost unchanged at EUR 1.2 million (EUR 1.1 million). Overall, the net result attributable to the owners of the parent increased. Other Austria in EUR million 1-3 20 1-3 21 Change
Net interest income 112.4 98.5 -12.4%
Net fee and commission income 67.7 74.8 10.5%
Net trading result and gains/losses from financial instruments at FVPL -107.8 21.5 n/a
Operating income 85.6 206.4 >100.0%
Operating expenses -90.2 -82.4 -8.7%
Operating result -4.7 124.0 n/a
Cost/income ratio >100% 39.9%
Impairment result from financial instruments -26.6 5.7 n/a
Other result -1.5 13.7 n/a
Net result attributable to owners of the parent -22.6 108.3 n/a
Return on allocated capital -4.1% 19.0%
The Other Austria segment comprises the Corporates and Group Markets business of Erste Group Bank AG (Holding), Erste Group Immorent, Erste Asset Management and Intermarket Bank. Net interest income went down primarily in Holding markets business on the back of market interest rate developments, partially compen-sated by Holding corporate lending business growth. Net fee and commission income increased mostly due to the higher asset under man-agement volumes and positive contribution of corporate lending in Holding. Net trading result and gains/losses from financial instruments at FVPL increased significantly due to valuation results of interest rate derivatives, FX derivatives and bonds as well as the recovery in market prices of fair value securities. Overall operating income improved notably, while operating expenses decreased, mostly on lower costs in foreign branches, for IT and projects. Thus, operating result and cost/income improved. The impairment result from financial instruments improved as the previous year was negatively affected by a higher provisioning level in corporate portfolio. Other result im-proved due to real estate selling gains. Other result included the resolution fund contribution of EUR 1.7 million (EUR 1.8 million). Overall, the net result attributable to owners of the parent improved significantly.

11
Czech Republic in EUR million 1-3 20 1-3 21 Change
Net interest income 291.9 267.4 -8.4%
Net fee and commission income 82.2 87.6 6.5%
Net trading result and gains/losses from financial instruments at FVPL 13.9 19.7 42.3%
Operating income 390.7 375.9 -3.8%
Operating expenses -195.3 -197.3 1.1%
Operating result 195.5 178.6 -8.7%
Cost/income ratio 50.0% 52.5%
Impairment result from financial instruments -24.3 -26.5 9.3%
Other result -28.5 -34.0 19.4%
Net result attributable to owners of the parent 113.9 94.0 -17.5%
Return on allocated capital 18.1% 13.1%
The segment analysis is done on a constant currency basis. The CZK depreciated by 1.7% against the EUR in the reporting period. Net interest income in the Czech Republic segment (comprising Česká spořitelna Group) decreased on the back of significantly lower interest rates not compensated by volume growth in retail deposits and housing loans. Net fee and commission income increased due to higher security and insurance brokerage fees. The higher net trading result and gains/losses from financial instruments at FVPL was attributable to an improved contribution of money market business and bond trading as well as positive valuation effects. Operating expenses increased due to higher personnel costs and a higher contribution into the deposit insurance fund EUR 11.3 million (EUR 10.6 million). Consequently, the operating result declined and the cost/income ratio worsened. Impairment result from financial instruments deteriorated slightly because of higher defaults in retail business which were partially compensated by releases in corporate business. Other result deteriorated mainly due to higher contributions to the resolution fund of EUR 31.3 million (EUR 29.3 million) and lower income after the sale of a subsidiary. Altogether, these developments led to a decrease in the net result attributable to the owners of the parent. Slovakia in EUR million 1-3 20 1-3 21 Change
Net interest income 110.7 105.0 -5.1%
Net fee and commission income 34.5 37.0 7.3%
Net trading result and gains/losses from financial instruments at FVPL -4.5 3.1 n/a
Operating income 142.1 147.1 3.5%
Operating expenses -73.0 -78.4 7.4%
Operating result 69.1 68.6 -0.7%
Cost/income ratio 51.4% 53.3%
Impairment result from financial instruments -11.3 -17.7 57.0%
Other result -22.5 -7.7 -65.9%
Net result attributable to owners of the parent 28.0 33.8 20.9%
Return on allocated capital 10.2% 11.2%
Net interest income in the Slovakia segment (comprising Slovenská sporitel’ňa Group) decreased mainly due to lower volume of consumer loans and lower margins for housing loans in the retail business. Net fee and commission income increased on the back of higher income from securities. Net trading result and gains/losses from financial instruments at FVPL improved due to valuation effects. Operating ex-penses increased due to a higher deposit insurance contribution of EUR 9.4 million (EUR 1.1 million) on the back of a methodology change. This increase was partially compensated by lower depreciation. Consequently, operating result decreased slightly and the cost/income ratio worsened. Impairment result from financial instruments deteriorated as higher defaults in corporate business were only partially compen-sated by releases in retail business. Other result improved due to the abolition of the banking tax in the second half of last year (EUR 16.9 million in the first quarter of 2020). Payment into the resolution fund remained unchanged at EUR 5.0 million (EUR 5.0 million). Overall, the net result attributable to the owners of the parent increased.

12
Romania in EUR million 1-3 20 1-3 21 Change
Net interest income 111.7 107.6 -3.7%
Net fee and commission income 34.1 37.4 9.7%
Net trading result and gains/losses from financial instruments at FVPL 13.4 16.4 22.0%
Operating income 164.7 166.9 1.3%
Operating expenses -85.9 -81.1 -5.5%
Operating result 78.8 85.8 8.8%
Cost/income ratio 52.1% 48.6%
Impairment result from financial instruments 44.2 7.1 -83.9%
Other result -13.1 -2.3 -82.5%
Net result attributable to owners of the parent 78.3 75.1 -4.1%
Return on allocated capital 22.8% 17.8%
The segment analysis is done on a constant currency basis. The RON depreciated by 1.7% against the EUR in the reporting period. The decline in net interest income in the Romania segment (comprising Banca Comercială Română Group) was primarily driven by the lower interest rate environment. Net fee and commission income improved mainly due to higher payment fees in retail and corporate business. Insurance brokerage and lending fees went up as well. Net trading result and gains/losses from financial instruments at FVPL was attribut-able to improved contribution of money market business and bond trading. Operating expenses decreased mainly due to lower personnel expenses driven by deconsolidation of a subsidiary as well as a lower deposit insurance contribution of EUR 3.4 million (EUR 4.4 million). Overall, operating result increased and the cost/income ratio improved. Impairment result from financial instruments showed lower net releases after last year’s sale of a non-performing loan portfolio in the corporate business. Real estate selling gains led to an improvement of the other result. The resolution fund contribution increased to EUR 11.2 million (EUR 7.8 million). The net result attributable to the owners of the parent decreased. Hungary in EUR million 1-3 20 1-3 21 Change
Net interest income 55.1 66.1 20.0%
Net fee and commission income 45.5 49.2 8.0%
Net trading result and gains/losses from financial instruments at FVPL 5.7 9.6 68.8%
Operating income 108.4 126.8 17.0%
Operating expenses -58.7 -58.6 -0.2%
Operating result 49.6 68.2 37.5%
Cost/income ratio 54.2% 46.2%
Impairment result from financial instruments 3.9 -2.3 n/a
Other result -41.2 -21.2 -48.5%
Net result attributable to owners of the parent 9.1 40.1 >100.0%
Return on allocated capital 3.9% 14.3%
The segment analysis is done on a constant currency basis. The HUF depreciated by 6.5% against the EUR in the reporting period. Net interest income in the Hungary segment (comprising Erste Bank Hungary Group) increased driven by higher customer loan and deposit volumes as well as a positive contribution from securities and money market placements. Net fee and commission income rose predomi-nantly due to higher income from securities fees. Net trading result and gains/losses from financial instruments at FVPL increased on a higher result from derivatives. Operating expenses went up in local currency terms on the back of higher marketing and personnel costs as well as depreciation . Deposit insurance contributions remained unchanged at EUR 6.3 million. Overall, operating result and the cost/income ratio improved. Impairment result reflected allocations in the retail business compared to last year’s net releases. Other result improved significantly on the non-recurrence of the last year’s modification losses related to moratoria on loan repayments which were transferred to the net interest income and impairment line in the subsequent quarters of 2020. This line item also included the banking tax of EUR 14.7 million (EUR 14.2 million), transaction tax of EUR 11.6 million (EUR 12.5 million) and the contribution to the resolution fund of EUR 4.0 million (EUR 3.1 million). Consequently, the net result attributable to the owners of the parent increased notably.

13
Croatia in EUR million 1-3 20 1-3 21 Change
Net interest income 68.5 67.3 -1.8%
Net fee and commission income 23.4 21.0 -10.6%
Net trading result and gains/losses from financial instruments at FVPL 2.3 4.1 75.1%
Operating income 97.7 95.0 -2.7%
Operating expenses -56.7 -51.7 -8.8%
Operating result 40.9 43.3 5.7%
Cost/income ratio 58.1% 54.5%
Impairment result from financial instruments -12.1 -1.5 -88.0%
Other result -6.4 -5.5 -14.4%
Net result attributable to owners of the parent 12.5 20.6 65.0%
Return on allocated capital 8.8% 13.0%
The segment analysis is done on a constant currency basis. The HRK depreciated by 1.1% against the EUR in the reporting period. Net interest income in the Croatia segment (comprising Erste Bank Croatia Group) decreased primarily due to lower interest rates. Net fee and commission income decreased on the back of lower income from securities fees. Net trading result and gains/losses from financial instru-ments at FVPL improved due to valuation effects. Operating expenses decreased on the back of a lower deposit insurance contribution of EUR 0.3 million (EUR 3.0 million) as well as lower marketing and personnel costs. Overall, operating result and the cost/income ratio improved. The improvement of impairment result from financial instruments was driven by releases due to upgrades. Other result improved mainly due to lower provisions for legal expenses. This line item included the unchanged resolution fund contribution of EUR 4.0 million (EUR 4.0 million). Consequently, the net result attributable to the owners of the parent increased. Serbia in EUR million 1-3 20 1-3 21 Change
Net interest income 15.3 17.1 11.9%
Net fee and commission income 3.8 4.2 8.9%
Net trading result and gains/losses from financial instruments at FVPL 0.8 1.3 59.6%
Operating income 20.0 22.7 13.3%
Operating expenses -12.8 -14.0 8.8%
Operating result 7.2 8.7 21.4%
Cost/income ratio 64.1% 61.5%
Impairment result from financial instruments -1.8 -2.0 14.6%
Other result -0.1 -0.2 >100.0%
Net result attributable to owners of the parent 4.2 5.2 21.6%
Return on allocated capital 9.7% 10.3%
The segment analysis is done on a constant currency basis. The Serbian Dinar (RSD) remained stable against the EUR in the reporting period. Net interest income in the Serbia segment (comprising Erste Bank Serbia Group) increased mainly due to higher loan and deposit volumes in retail and corporate business. Net fee and commission income went up moderately due to higher payment fee income. Net trading result and gains/losses from financial instruments at FVPL increased driven by a higher result from foreign currency transactions. Operating expenses rose due to higher IT costs and deposit insurance contribution of EUR 1.0 million (EUR 0.8 million). Personnel costs went up as well due to an increase in full time employees. Operating result increased and the cost/income ratio improved. Impairment result from financial instruments deteriorated slightly due to additional provisions in corporate business. Other result remained stable. Overall, the net result attributable to owners of the parent increased.

14
Other in EUR million 1-3 20 1-3 21 Change
Net interest income 35.4 31.3 -11.6%
Net fee and commission income -26.8 -22.2 -17.1%
Net trading result and gains/losses from financial instruments at FVPL 14.5 -21.3 n/a
Operating income 19.4 -12.7 n/a
Operating expenses -56.3 -50.9 -9.6%
Operating result -36.9 -63.6 72.5%
Cost/income ratio >100.0% >100.0%
Impairment result from financial instruments 2.8 -5.7 n/a
Other result 13.7 -44.6 n/a
Net result attributable to owners of the parent -29.8 -90.9 >100.0%
Return on allocated capital -1.7% -5.3%
The residual segment Other consists mainly of internal service providers, the Group Asset/Liability Management and the Corporate Center of Erste Group Bank AG as well as the reconciliation to the consolidated accounting result (e.g. intercompany elimination, dividend elimi-nation) and free capital. Operating income decreased on lower net trading result and gains/losses from financial instruments at FVPL due to valuation effects. As operating expenses decreased only slightly, operating result went down. Other result deteriorated on the back of negative valuation effects. Consequently, Net result attributable to owners of the parent deteriorated. BUSINESS SEGMENTS Retail in EUR million 1-3 20 1-3 21 Change
Net interest income 558.8 509.4 -8.8%
Net fee and commission income 265.6 281.0 5.8%
Net trading result and gains/losses from financial instruments at FVPL 26.0 22.5 -13.5%
Operating income 857.8 820.9 -4.3%
Operating expenses -521.9 -524.0 0.4%
Operating result 335.9 296.9 -11.6%
Cost/income ratio 60.8% 63.8%
Impairment result from financial instruments -40.4 -39.6 -1.8%
Other result -24.6 -14.7 -40.2%
Net result attributable to owners of the parent 221.6 182.7 -17.5%
Return on allocated capital 28.1% 21.6%
The Retail segment comprises the entire business with private individuals, free professionals and micros in the responsibility of account managers in the retail network of the local banks cooperating with their specialised subsidiaries (such as leasing and asset management companies). The decrease in net interest income was driven by a change of transfer prices in deposit business as a response to the lower interest rate environment leading to a negative impact in the retail segment and a corresponding positive effect in ALM & Local Corporate Center. Contributions from the lending business in Slovakia and Austria declined primarily due to lower market rates. These negative effects were partially mitigated by the growth of customer loan volumes across all markets. Net fee and commission income increased due to higher fees from securities business in Austria, the Czech Republic, Hungary and Slovakia and improved fees from insurance brokerage mostly in the Czech Republic and Hungary, which were partially offset by lower fees from payments mainly in the Czech Republic and lower lending fees in the Czech Republic, Austria and Hungary. Net trading result and gains/losses from financial instruments FVPL decreased due to lower foreign currency transactions in the Czech Republic. Operating expenses increased slightly mainly in Slovakia due to a higher deposit insurance contribution and personnel expenses as well as higher IT expenses in Romania. Consequently, operating result declined and the cost/income ratio worsened. The impairment result from financial instruments improved slightly primarily due to rating upgrades in Austria, partially offset by higher provisions in the Czech Republic. The abolition of the banking tax in Slovakia in second half of last year led to an improvement in other result. Overall, the net result attributable to the owners of the parent decreased.
15
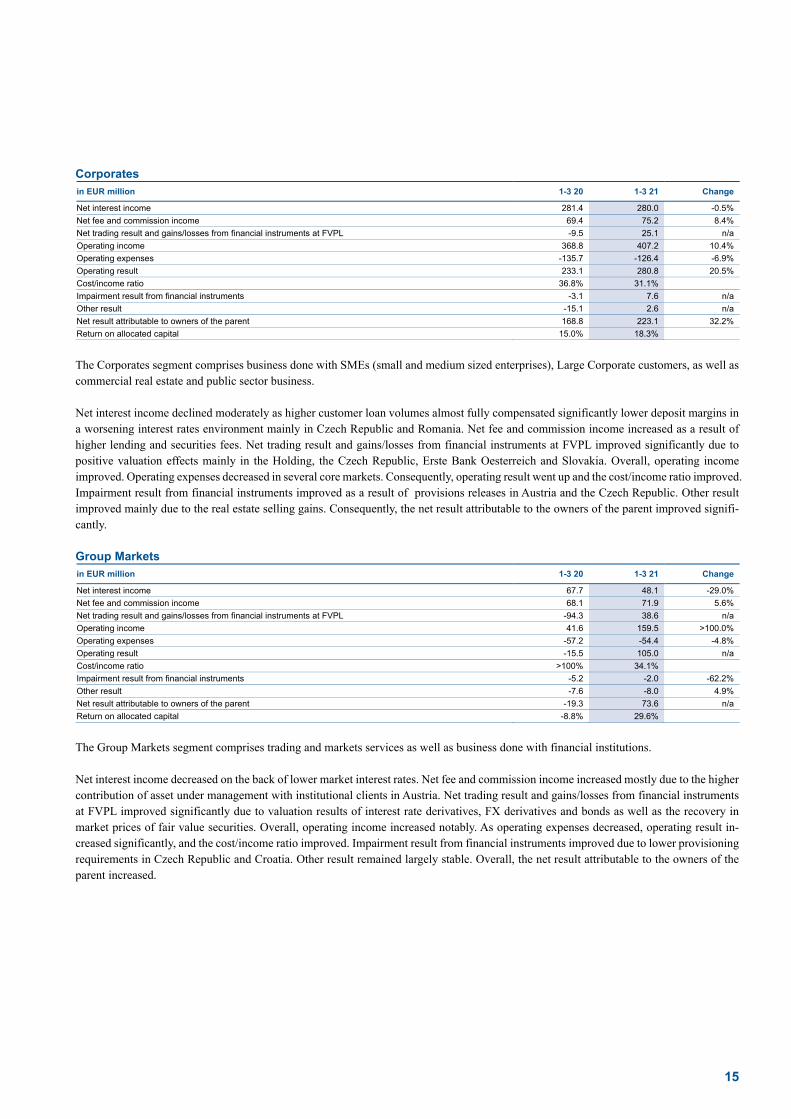
Corporates in EUR million 1-3 20 1-3 21 Change
Net interest income 281.4 280.0 -0.5%
Net fee and commission income 69.4 75.2 8.4%
Net trading result and gains/losses from financial instruments at FVPL -9.5 25.1 n/a
Operating income 368.8 407.2 10.4%
Operating expenses -135.7 -126.4 -6.9%
Operating result 233.1 280.8 20.5%
Cost/income ratio 36.8% 31.1%
Impairment result from financial instruments -3.1 7.6 n/a
Other result -15.1 2.6 n/a
Net result attributable to owners of the parent 168.8 223.1 32.2%
Return on allocated capital 15.0% 18.3%
The Corporates segment comprises business done with SMEs (small and medium sized enterprises), Large Corporate customers, as well as commercial real estate and public sector business. Net interest income declined moderately as higher customer loan volumes almost fully compensated significantly lower deposit margins in a worsening interest rates environment mainly in Czech Republic and Romania. Net fee and commission income increased as a result of higher lending and securities fees. Net trading result and gains/losses from financial instruments at FVPL improved significantly due to positive valuation effects mainly in the Holding, the Czech Republic, Erste Bank Oesterreich and Slovakia. Overall, operating income improved. Operating expenses decreased in several core markets. Consequently, operating result went up and the cost/income ratio improved. Impairment result from financial instruments improved as a result of provisions releases in Austria and the Czech Republic. Other result improved mainly due to the real estate selling gains. Consequently, the net result attributable to the owners of the parent improved signifi-cantly. Group Markets in EUR million 1-3 20 1-3 21 Change
Net interest income 67.7 48.1 -29.0%
Net fee and commission income 68.1 71.9 5.6%
Net trading result and gains/losses from financial instruments at FVPL -94.3 38.6 n/a
Operating income 41.6 159.5 >100.0%
Operating expenses -57.2 -54.4 -4.8%
Operating result -15.5 105.0 n/a
Cost/income ratio >100% 34.1%
Impairment result from financial instruments -5.2 -2.0 -62.2%
Other result -7.6 -8.0 4.9%
Net result attributable to owners of the parent -19.3 73.6 n/a
Return on allocated capital -8.8% 29.6%
The Group Markets segment comprises trading and markets services as well as business done with financial institutions. Net interest income decreased on the back of lower market interest rates. Net fee and commission income increased mostly due to the higher contribution of asset under management with institutional clients in Austria. Net trading result and gains/losses from financial instruments at FVPL improved significantly due to valuation results of interest rate derivatives, FX derivatives and bonds as well as the recovery in market prices of fair value securities. Overall, operating income increased notably. As operating expenses decreased, operating result in-creased significantly, and the cost/income ratio improved. Impairment result from financial instruments improved due to lower provisioning requirements in Czech Republic and Croatia. Other result remained largely stable. Overall, the net result attributable to the owners of the parent increased.

16
Asset/Liability Management & Local Corporate Center in EUR million 1-3 20 1-3 21 Change
Net interest income 2.7 32.1 >100.0%
Net fee and commission income -21.2 -20.4 -3.8%
Net trading result and gains/losses from financial instruments at FVPL 3.3 3.4 4.6%
Operating income -7.0 20.3 n/a
Operating expenses -52.5 -55.4 5.6%
Operating result -59.5 -35.2 -40.9%
Cost/income ratio >100% >100%
Impairment result from financial instruments -0.7 1.2 n/a
Other result -85.7 -57.5 -32.9%
Net result attributable to owners of the parent -139.7 -70.8 -49.3%
Return on allocated capital -19.0% -7.4%
The ALM & LCC segment includes all asset/liability management functions – local and of Erste Group Bank AG (Holding) – as well as the local corporate centers which comprise internal service providers and reconciliation items to local entity results. Net interest income improved primarily due to lower transfer prices that led to a negative impact in the retail segment and a corresponding positive effect in ALM & LCC as well as lower refinancing costs in the Holding and higher income from investments in Hungary. These effects were partially offset by higher interest expense from the placement of excess liquidity. Net fee and commission income as well as net trading result and gains/losses from financial instruments at FVPL remained largely stable. Operating expenses increased mainly due to higher deposit insurance contributions in Erste Bank Oesterreich and Slovakia which were partially compensated by methodological changes resulting in cost allocations to other business segments in Slovakia and Romania. Overall, operating result improved. Other result improved primarily due to real estate selling gains in Romania and the non-recurrence of modification losses related to moratoria on loan repayments in Hungary. Consequently, the net result attributable to the owners of the parent improved substantially. Savings Banks The business segment Savings Banks is identical to the geographical (operating) segment Savings Banks. Group Corporate Center in EUR million 1-3 20 1-3 21 Change
Net interest income 22.0 21.8 -1.1%
Net fee and commission income -1.5 1.5 n/a
Net trading result and gains/losses from financial instruments at FVPL 37.2 -18.3 n/a
Operating income 53.4 3.9 -92.7%
Operating expenses -248.8 -241.9 -2.8%
Operating result -195.5 -238.0 21.8%
Cost/income ratio >100.0% >100.0%
Impairment result from financial instruments 2.5 -5.0 n/a
Other result 210.1 152.1 -27.6%
Net result attributable to owners of the parent -1.7 -73.5 >100.0%
Return on allocated capital 0.0% -5.4%
The Group Corporate Center segment covers mainly centrally managed activities and items that are not directly allocated to other segments. It includes the Corporate Center of Erste Group Bank AG as well as internal service providers, therefore in particular the line items “other operating result” and “general administrative expenses” should be considered together with intragroup eliminations. Furthermore, the free capital of Erste Group is included. Operating income decreased on lower net trading result and gains/losses from financial instruments at FVPL due to valuation effects. As operating expenses decreased only slightly, operating result went down. Other result deteriorated on the back of negative valuation effects. Net result attributable to owners of the parent deteriorated.

17
Interim report – 1 January to 31 March 2021
Consolidated statement of income
in EUR thousand Notes 1-3 20 1-3 21
Net interest income 1 1,229,004 1,172,127
Interest income 1 1,391,687 1,207,991
Other similar income 1 395,095 339,048
Interest expenses 1 -230,968 -104,353
Other similar expenses 1 -326,811 -270,558
Net fee and commission income 2 504,243 539,989
Fee and commission income 2 604,610 638,214
Fee and commission expenses 2 -100,367 -98,225
Dividend income 3 1,524 4,833
Net trading result 4 -157,356 9,476
Gains/losses from financial instruments measured at fair value through profit or loss 5 37,459 56,933
Net result from equity method investments 3,289 1,481
Rental income from investment properties & other operating leases 6 44,793 43,748
Personnel expenses 7 -629,960 -622,393
Other administrative expenses 7 -344,795 -345,816
Depreciation and amortisation 7 -136,472 -135,073
Gains/losses from derecognition of financial assets measured at amortised cost 8 429 2,485
Other gains/losses from derecognition of financial instruments not measured at fair value through profit or loss 9 -1,652 -287
Impairment result from financial instruments 10 -61,682 -35,685
Other operating result 11 -127,561 -126,731
Levies on banking activities 11 -49,906 -33,214
Pre-tax result from continuing operations 361,263 565,088
Taxes on income 12 -102,960 -124,319
Net result for the period 258,303 440,769
Net result attributable to non-controlling interests 23,039 85,663
Net result attributable to owners of the parent 235,264 355,106
Earnings per share 1-3 20 1-3 21
Net result attributable to owners of the parent in EUR thousand 235,264 355,106
Dividend on AT1 capital in EUR thousand 0 0
Net result for the period attributable to owners of the parent after deduction of AT1 capital dividend in EUR thousand 235,264 355,106
Weighted average number of outstanding shares 426,499,141 426,246,662
Earnings per share in EUR 0.55 0.83
Weighted average diluted number of outstanding shares 426,499,141 426,246,662
Diluted earnings per share in EUR 0.55 0.83
Development of the number of shares 1-3 20 1-3 21
Shares outstanding at the beginning of the period 408,127,137 405,470,710
Acquisition of treasury shares -1,733,352 -1,379,806
Disposal of treasury shares 827,852 1,379,806
Shares outstanding at the end of the period 407,221,637 405,470,710
Treasury shares 22,578,363 24,329,290
Number of shares issued at the end of the period 429,800,000 429,800,000
Weighted average number of outstanding shares 426,499,141 426,246,662
Weighted average diluted number of outstanding shares 426,499,141 426,246,662
Condensed interim consolidated financial statements
18
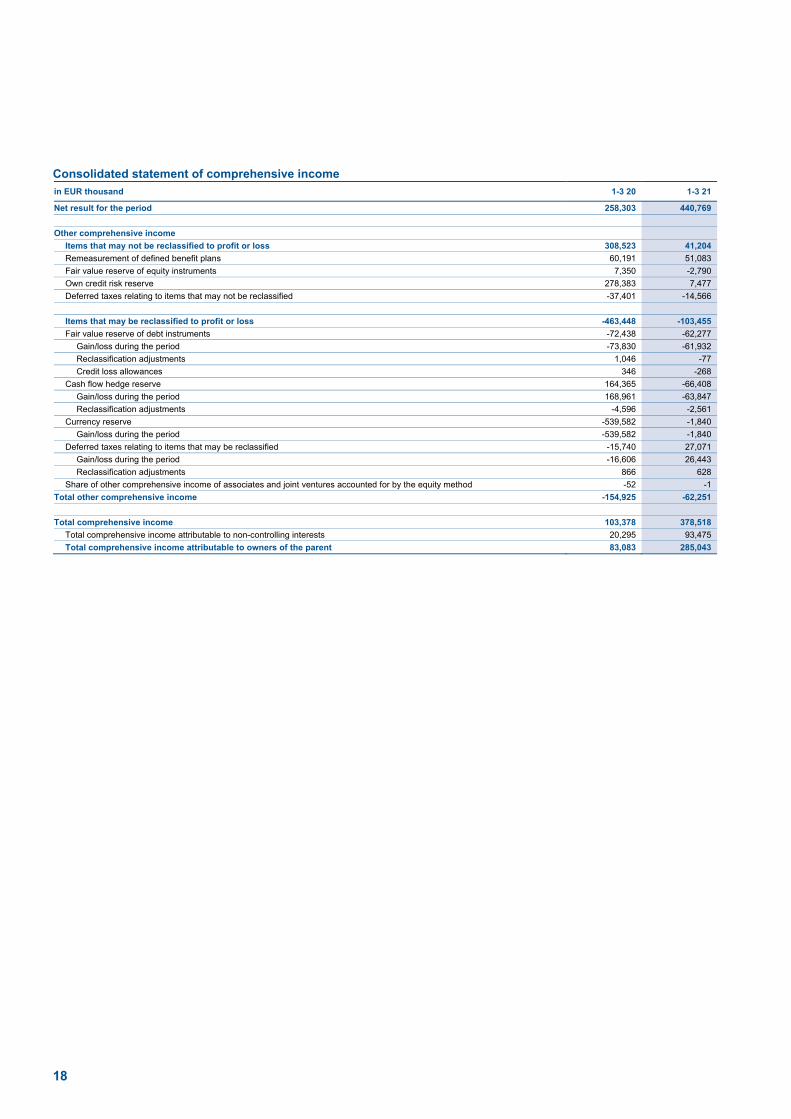
Consolidated statement of comprehensive income in EUR thousand 1-3 20 1-3 21
Net result for the period 258,303 440,769
Other comprehensive income
Items that may not be reclassified to profit or loss 308,523 41,204
Remeasurement of defined benefit plans 60,191 51,083
Fair value reserve of equity instruments 7,350 -2,790
Own credit risk reserve 278,383 7,477
Deferred taxes relating to items that may not be reclassified -37,401 -14,566
Items that may be reclassified to profit or loss -463,448 -103,455
Fair value reserve of debt instruments -72,438 -62,277
Gain/loss during the period -73,830 -61,932
Reclassification adjustments 1,046 -77
Credit loss allowances 346 -268
Cash flow hedge reserve 164,365 -66,408
Gain/loss during the period 168,961 -63,847
Reclassification adjustments -4,596 -2,561
Currency reserve -539,582 -1,840
Gain/loss during the period -539,582 -1,840
Deferred taxes relating to items that may be reclassified -15,740 27,071
Gain/loss during the period -16,606 26,443
Reclassification adjustments 866 628
Share of other comprehensive income of associates and joint ventures accounted for by the equity method -52 -1
Total other comprehensive income -154,925 -62,251
Total comprehensive income 103,378 378,518
Total comprehensive income attributable to non-controlling interests 20,295 93,475
Total comprehensive income attributable to owners of the parent 83,083 285,043

19
Quarterly results in EUR million Q1 20 Q2 20 Q3 20 Q4 20 Q1 21
Income statement
Net interest income 1,229.0 1,167.9 1,192.4 1,185.6 1,172.1
Interest income 1,391.7 1,253.5 1,237.7 1,225.0 1,208.0
Other similar income 395.1 364.2 344.6 357.9 339.0
Interest expenses -231.0 -147.9 -122.1 -120.3 -104.4
Other similar expenses -326.8 -302.0 -267.8 -277.0 -270.6
Net fee and commission income 504.2 452.5 491.6 528.5 540.0
Fee and commission income 604.6 541.4 587.3 621.2 638.2
Fee and commission expenses -100.4 -88.9 -95.7 -92.7 -98.2
Dividend income 1.5 13.3 0.9 4.3 4.8
Net trading result -157.4 138.2 28.2 128.6 9.5
Gains/losses from financial instruments measured at fair value through profit or loss 37.5 -8.9 52.9 -19.4 56.9
Net result from equity method investments 3.3 2.6 4.0 0.5 1.5
Rental income from investment properties & other operating leases 44.8 43.5 44.0 41.3 43.7
Personnel expenses -630.0 -635.5 -636.7 -618.5 -622.4
Other administrative expenses -344.8 -238.6 -235.6 -339.9 -345.8
Depreciation and amortisation -136.5 -129.4 -136.1 -138.9 -135.1
Gains/losses from derecognition of financial assets at AC 0.4 -0.1 -0.1 6.6 2.5
Other gains/losses from derecognition of financial instruments not at FVPL -1.7 -0.5 1.4 0.3 -0.3
Impairment result from financial instruments -61.7 -613.7 -194.7 -424.7 -35.7
Other operating result -127.6 -42.3 -43.8 -64.6 -126.7
Levies on banking activities -49.9 -33.1 -17.3 -17.4 -33.2
Pre-tax result from continuing operations 361.3 148.8 568.3 289.6 565.1
Taxes on income -103.0 -37.3 -123.9 -78.3 -124.3
Net result for the period 258.3 111.5 444.4 211.3 440.8
Net result attributable to non-controlling interests 23.0 53.0 101.0 65.2 85.7
Net result attributable to owners of the parent 235.3 58.5 343.3 146.0 355.1
Statement of comprehensive income
Net result for the period 258.3 111.5 444.4 211.3 440.8
Other comprehensive income
Items that may not be reclassified to profit or loss 308.5 -90.7 -56.7 -99.2 41.2
Remeasurement of defined benefit plans 60.2 -55.7 -0.7 -64.8 51.1
Fair value reserve of equity instruments 7.3 -8.9 0.9 6.5 -2.8
Own credit risk reserve 278.4 -44.3 -57.1 -49.4 7.5
Deferred taxes relating to items that may not be reclassified -37.4 18.3 0.3 8.6 -14.6
Items that may be reclassified to profit or loss -463.4 199.7 -147.6 188.0 -103.5
Fair value reserve of debt instruments -72.4 65.4 20.6 30.7 -62.3
Gain/loss during the period -73.8 58.9 23.9 25.8 -61.9
Reclassification adjustments 1.0 -0.2 -1.6 -0.5 -0.1
Credit loss allowances 0.3 6.7 -1.7 5.5 -0.3
Cash flow hedge reserve 164.4 20.3 -26.4 -59.1 -66.4
Gain/loss during the period 169.0 24.3 -23.3 -56.5 -63.8
Reclassification adjustments -4.6 -4.0 -3.0 -2.6 -2.6
Currency reserve -539.6 132.9 -141.4 209.7 -1.8
Gain/loss during the period -539.6 132.9 -141.4 209.7 -1.8
Deferred taxes relating to items that may be reclassified -15.7 -18.9 -0.5 6.6 27.1
Gain/loss during the period -16.6 -19.9 -1.5 5.8 26.4
Reclassification adjustments 0.9 1.0 1.1 0.7 0.6
Share of other comprehensive income of associates and joint ventures accounted for by the equity method -0.1 0.0 0.0 0.0 0.0
Total -154.9 109.0 -204.2 88.8 -62.3
Total comprehensive income 103.4 220.5 240.1 300.1 378.5
Total comprehensive income attributable to non-controlling interests 20.3 42.9 102.0 49.8 93.5
Total comprehensive income attributable to owners of the parent 83.1 177.6 138.1 250.3 285.0

20
Consolidated balance sheet
in EUR thousand Notes Dec 20 Mar 21
Assets
Cash and cash balances 13 35,838,532 53,954,317
Financial assets held for trading 6,356,017 6,463,565
Derivatives 14 2,954,359 2,551,287
Other financial assets held for trading 15 3,401,658 3,912,278
Pledged as collateral 67,952 142,748
Non-trading financial assets at fair value through profit and loss 16 3,082,818 3,095,904
Pledged as collateral 7,950 4,009
Equity instruments 347,312 325,171
Debt securities 2,048,457 2,035,864
Loans and advances to customers 687,049 734,869
Financial assets at fair value through other comprehensive income 17 8,518,771 8,547,179
Pledged as collateral 49,995 1,101,442
Equity instruments 129,756 127,055
Debt securities 8,389,015 8,420,124
Financial assets at amortised cost 18 210,940,419 219,900,703
Pledged as collateral 1,898,545 3,082,639
Debt securities 29,578,919 31,008,992
Loans and advances to banks 21,466,188 27,477,334
Loans and advances to customers 159,895,312 161,414,377
Finance lease receivables 19 4,127,083 4,093,843
Hedge accounting derivatives 20 205,174 149,442
Fair value changes of hedged items in portfolio hedge of interest rate risk 5,271 937
Property and equipment 2,552,076 2,526,088
Investment properties 1,280,412 1,311,591
Intangible assets 1,358,911 1,332,245
Investments in associates and joint ventures 190,073 191,949
Current tax assets 174,657 183,225
Deferred tax assets 460,128 445,984
Assets held for sale 211,815 165,211
Trade and other receivables 21 1,340,979 1,595,995
Other assets 22 750,572 1,010,397
Total assets 277,393,709 304,968,574
Liabilities and equity
Financial liabilities held for trading 2,625,045 2,191,809
Derivatives 14 2,037,466 1,630,675
Other financial liabilities held for trading 23 587,578 561,133
Financial liabilities at fair value through profit or loss 12,091,012 11,383,388
Deposits from customers 254,005 229,632
Debt securities issued 24 11,656,648 10,981,584
Other financial liabilities 180,360 172,173
Financial liabilities at amortised cost 235,125,299 262,669,264
Deposits from banks 25 24,771,349 35,287,940
Deposits from customers 25 190,816,425 205,144,388
Debt securities issued 25 19,019,787 21,534,834
Other financial liabilities 517,738 702,101
Lease liabilities 559,720 557,423
Hedge accounting derivatives 20 188,662 191,292
Fair value changes of hedged items in portfolio hedge of interest rate risk 57 40
Provisions 26 2,081,947 2,195,915
Current tax liabilities 58,485 67,779
Deferred tax liabilities 20,044 25,262
Liabilities associated with assets held for sale 1,403 1,428
Other liabilities 27 2,231,756 2,913,538
Total equity 22,410,280 22,771,437
Equity attributable to non-controlling interests 5,073,100 5,162,880
Additional equity instruments 2,732,965 2,732,966
Equity attributable to owners of the parent 14,604,214 14,875,591
Subscribed capital 859,600 859,600
Additional paid-in capital 1,477,719 1,477,719
Retained earnings and other reserves 12,266,895 12,538,272
Total liabilities and equity 277,393,709 304,968,574

21
Consolidated statement of changes in equity
in EUR million Subscribed
capital
Additional paid-in capital
Retained earnings
Cash flow hedge
reserve Fair value
reserve
Own credit risk
reserve Currency
reserve
Remeasure-ment of defined
benefit plans
Equity attributable
to owners of the parent
Additional equity
instruments
Equity attributable
to non-controlling
interests Total equity
As of 1 January 2021 860 1,478 13,773 36 239 -290 -941 -549 14,604 2,733 5,073 22,410
Changes in treasury shares 0 0 -4 0 0 0 0 0 -4 0 0 -4
Dividends paid 0 0 0 0 0 0 0 0 0 0 -14 -14
capital increase/decrease 0 0 0 0 0 0 0 0 0 0 0 0
Changes in scope of consolidation and ownership interest 0 0 0 0 0 0 0 0 0 0 0 0
Reclassification from other comprehensive income to retained earnings 0 0 -2 0 0 2 0 0 0 0 0 0
Other changes 0 0 -10 0 0 0 0 0 -10 0 10 0
Total comprehensive income 0 0 355 -54 -42 -1 -1 28 285 0 93 379
Net result for the period 0 0 355 0 0 0 0 0 355 0 86 441
Other comprehensive income 0 0 0 -54 -42 -1 -1 28 -70 0 8 -62
Change from remeasurement of defined benefit plans 0 0 0 0 0 0 0 28 28 0 17 45
Change in fair value reserve 0 0 0 0 -42 0 0 0 -42 0 -8 -50
Change in cash flow hedge reserve 0 0 0 -54 0 0 0 0 -54 0 0 -54
Change in currency reserve 0 0 0 0 0 0 -1 0 -1 0 -1 -2
Change in own credit risk reserve 0 0 0 0 0 -1 0 0 -1 0 0 -2
As of 31 March 2021 860 1,478 14,113 -18 197 -290 -942 -521 14,876 2,733 5,163 22,771
As of 1 January 2020 860 1,478 13,095 -45 260 -399 -610 -509 14,129 1,490 4,857 20,477
Changes in treasury shares 0 0 -22 0 0 0 0 0 -22 0 0 -22
Dividends paid 0 0 0 0 0 0 0 0 0 0 -3 -3
capital increase/decrease 0 0 0 0 0 0 0 0 0 497 0 497
Changes in scope of consolidation and ownership interest 0 0 0 0 0 0 0 0 0 0 0 0
Reclassification from other comprehensive income to retained earnings 0 0 61 0 -62 2 0 0 0 0 0 0
Total comprehensive income 0 0 235 133 -32 243 -529 33 83 0 20 103
Net result for the period 0 0 235 0 0 0 0 0 235 0 23 258
Other comprehensive income 0 0 0 133 -32 243 -529 33 -152 0 -3 -155
Change from remeasurement of defined benefit plans 0 0 0 0 0 0 0 33 33 0 20 53
Change in fair value reserve 0 0 0 0 -32 0 0 0 -32 0 -19 -51
Change in cash flow hedge reserve 0 0 0 133 0 0 0 0 133 0 0 133
Change in currency reserve 0 0 0 0 0 0 -529 0 -529 0 -10 -540
Change in own credit risk reserve 0 0 0 0 0 243 0 0 243 0 7 250
As of 31 March 2020 860 1,478 13,368 88 166 -154 -1,139 -477 14,190 1,987 4,875 21,053

22
Consolidated statement of cash flows
in EUR million 1-3 20 1-3 21
Net result for the period 258 441
Non-cash adjustments for items in net profit/loss for the year
Depreciation, amortisation and net impairment of non-financial assets 140 137
Net allocation to credit loss allowances and other provisions 151 43
Gains/losses from measurement and derecognition of financial assets and financial liabilities -319 -115
Other adjustments -305 86
Changes in assets and liabilities from operating activities after adjustment for non-cash components
Financial assets held for trading -1,981 -124
Non-trading financial assets at fair value through profit and loss
Equity instruments 29 22
Debt securities 7 6
Loans and advances to customers -36 -51
Financial assets at fair value through other comprehensive income: debt securities -12 -72
Financial assets at amortised cost
Debt securities -937 -1,428
Loans and advances to banks -1,209 -6,015
Loans and advances to customers -910 -1,560
Finance lease receivables -10 32
Hedge accounting derivatives 38 2
Other assets from operating activities -134 -453
Financial liabilities held for trading 1,195 -370
Financial liabilities at fair value through profit or loss -531 -642
Financial liabilities at amortised cost
Deposits from banks 7,563 10,517
Deposits from customers 8,373 14,328
Debt securities issued -75 2,515
Other financial liabilities -17 184
Hedge accounting derivatives -62 3
Other liabilities from operating activities 798 747
Cash flow from operating activities 12,013 18,233
Proceeds of disposal
Financial assets at fair value through other comprehensive income: equity instruments 53 0
Investments in associates and joint ventures 1 0
Property and equipment and intangible assets 10 13
Investment properties 2 1
Acquisition of
Financial assets at fair value through other comprehensive income: equity instruments 0 0
Investments in associates and joint ventures 0 0
Property and equipment and intangible assets -59 -93
Investment properties -5 -6
Acquisition of subsidiaries (net of cash and cash equivalents acquired) 0 0
Disposal of subsidiaries 0 0
Cash flow from investing activities 2 -86
Capital increases 497 0
Capital decrease 0 0
Acquisition of non-controlling interest 0 0
Dividends paid to equity holders of the parent 0 0
Dividends paid to non-controlling interests -3 -14
Cash flow from financing activities 494 -14
Cash and cash equivalents at the beginning of the period 10,693 35,839
Cash flow from operating activities 12,013 18,233
Cash flow from investing activities 2 -86
Cash flow from financing activities 494 -14
Effect of currency translation -172 -17
Cash and cash equivalents at the end of period 23,031 53,954
Cash flows related to taxes, interest and dividends (included in cash flow from operating activities) 1,128 1,129
Payments for taxes on income -100 -100
Interest received 2,010 1,868
Dividends received 2 5
Interest paid -783 -644
Cash and cash equivalents are equal to cash in hand, cash balances at central banks and other demand deposits.

23
Condensed notes to the interim consolidated financial statements 1 January to 31 March 2021
BASIS OF PREPARATION The condensed consolidated interim financial statements (”interim financial statements”) of the group of Erste Group Bank AG (“Erste Group”) for the period from 1 January to 31 March 2021 were prepared in accordance with International Financial Reporting Standards (“IFRS”) as adopted by the European Union (“EU”) and are presented in accordance with the requirements of IAS 34 “Interim Financial Reporting”. These interim financial statements were neither audited nor reviewed by an auditor. BASIS OF CONSOLIDATION Subsidiaries are consolidated from the date when control is obtained until the date when control is lost. Control is achieved when Erste Group is exposed to, or has rights to, variable returns from its involvement with the investee and has the ability to affect those returns through its power to direct the relevant activities of the investee. Relevant activities are those which most significantly affect the variable returns of an entity. IFRS consolidation scope - evolvement of number of entities and funds included As of 31 December 2020 353
Additions
Entities newly added to the scope of consolidation 0
Disposals
Companies sold or liquidated -2
Mergers 0
As of 31 March 2021 351
COVID-19 DISCLOSURES In the condensed interim consolidated financial statements of Erste Group, considerations and significant impacts of the Covid-19 outbreak are presented in those chapters to which they can be assigned thematically. An overview about these disclosures is presented in the following:
_ The chapter “Accounting treatment of issues related to Covid-19” discusses the accounting and measurement methods used for public moratoria and payment holidays, public guarantees and non-financial assets impairment testing.
_ Note 29 Risk Management contains a separate sub-chapter “Covid-19” which explains the considerations of the pandemic on the ECL measurement, sensitivity analyses and information on credit exposures subject to certain Covid-19 measures.
_ Note 34 Own funds and capital requirements discusses the adjustments to the regulatory framework due to the current Covid-19 crisis. ACCOUNTING AND MEASUREMENT METHODS The interim financial statements have been prepared in accordance with IAS 34 “Interim Financial Reporting” and are presented in euro, which is the functional currency of the parent company. The interim financial statements do not include all the information and disclosures required in the annual consolidated financial statements. Therefore, the interim financial statements should be read in conjunction with Erste Group’s consolidated financial statements as of 31 December 2020. When preparing the interim financial statements, management undertakes a number of judgements, estimates and assumptions about recog-nition and measurement of assets, liabilities, income and expenses. The actual results may differ from the judgements, estimates and as-sumptions made by management, and will seldom equal the estimated results. Judgements, estimates and assumptions applied in the interim financial statements, including the key sources of estimation uncertainty, were the same as those applied in the group’s last annual financial statements for the year ended 31 December 2020, with the exception of the calculation of the current income taxes for the interim reporting period for which the estimated effective tax rate for the group is applied. Regarding the Covid-19 pandemic uncertainties, all negative effects that could be reasonable estimated were recognised in the first quarter of 2021. Erste Group will continue to follow the developments closely and will recognise any effects as the situation further unfolds.

24
ACCOUNTING TREATMENT OF ISSUES RELATED TO COVID-19 Accounting and measurement methods Public moratoria and payment holidays In light of the spread of Covid-19, a variety of measures have been taken by governments in Erste Group’s region aimed at addressing the economic consequences of the outbreak on individuals, households and businesses. Such measures include public moratoria on repayment of loans, overdraft facilities and mortgages. Further, Erste Group banks are offering renegotiations of repayment schedules and payment holidays on a voluntary basis to customers facing liquidity shortages. The public moratoria in general relate to customers which were performing and to their exposures existing before the outbreak of Covid-19 pandemic. None of the existing public moratoria extends beyond the 2021 end. In most cases interest continues to accrue on the outstanding balance during the moratorium period. Nevertheless, in many cases an economic loss is incurred and modification losses are recognised from accounting perspective. This results from the fact that the interest accrued, instead of being repaid or capitalised at the end of the moratorium, is repaid over the period after the moratorium. Regarding accounting policies for recognition of modification gain or loss, derecognition and the assessment of significant increases in credit risk in relation to public moratoria and payment holidays please refer to the group’s last annual financial statements for the year ended 31 December 2020. Despite the fact that some new public moratoria and extensions of the existing ones occurred in the first quarter of 2021 no material modi-fication losses were recognised in this period. Public guarantees Regarding accounting policy for recognition of Covid-19 related public guarantees on Erste Group’s exposures please refer to the group’s last annual financial statements for the year ended 31 December 2020. Impairment of non-financial assets Following the thorough analysis of potential impairment of Erste Group’s non-financial assets, including goodwill, performed for the 2020 year end no additional impairment indicators which would lead to impairment testing have been identified. As a result, no Covid-19 related impairments on non-financial assets were recognised in the first quarter of 2021.

25
1. Net interest income
in EUR million 1-3 20 1-3 21
Financial assets at AC 1,342.5 1,165.3
Financial assets at FVOCI 49.2 42.7
Interest income 1,391.7 1,208.0
Non-trading financial assets at FVPL 16.6 13.6
Financial assets HfT 342.0 255.9
Derivatives - hedge accounting, interest rate risk -14.5 -1.8
Other assets 32.4 28.6
Negative interest from financial liabilities 18.5 42.7
Other similar income 395.1 339.0
Interest and other similar income 1,786.8 1,547.0
Financial liabilities at AC -231.0 -104.4
Interest expenses -231.0 -104.4
Financial liabilities at FVPL -92.9 -75.4
Financial liabilities HfT -249.7 -182.0
Derivatives - hedge accounting, interest rate risk 36.0 30.9
Other liabilities -6.6 -5.0
Negative Interest from financial assets -13.6 -39.0
Other similar expenses -326.8 -270.6
Interest and other similar expenses -557.8 -374.9
Net interest income 1,229.0 1,172.1
In the reporting period an amount of EUR 19.5 million (EUR 20.3 million) relating to impaired financial assets is included in various line items of net interest income. In addition, the line item “Financial assets at AC” includes modification gains or losses of financial instruments which are allocated to the Stage 1 of EUR -1.2 million (EUR -2.2 million). 2. Net fee and commission income
1-3 20 1-3 21
in EUR million Income Expenses Income Expenses
Securities 73.1 -11.3 85.2 -12.0
Issues 11.4 -0.2 12.5 -0.2
Transfer orders 58.3 -10.7 66.5 -11.4
Other 3.5 -0.4 6.2 -0.4
Clearing and settlement 0.8 -0.7 0.2 -0.8
Asset management 102.3 -9.9 117.9 -12.4
Custody 24.2 -5.3 26.5 -4.9
Fiduciary transactions 0.4 0.0 0.4 0.0
Payment services 272.0 -52.9 271.7 -51.7
Card business 84.8 -43.2 80.2 -41.6
Other 187.2 -9.7 191.5 -10.1
Customer resources distributed but not managed 60.0 -3.4 61.5 -1.8
Collective investment 2.2 -0.5 4.0 -0.4
Insurance products 47.1 -0.6 50.3 -0.4
Building society brokerage 4.1 -1.5 0.2 -0.2
Foreign exchange transactions 6.4 -0.4 6.3 -0.4
Other 0.2 -0.4 0.7 -0.3
Structured finance 0.0 0.0 0.1 0.0
Servicing fees from securitization activities 0.0 -0.5 0.0 -0.4
Lending business 47.1 -9.3 48.7 -9.7
Guarantees given, guarantees received 18.9 -0.8 18.8 -0.8
Loan commitments given, loan commitments received 5.5 -0.2 8.6 -0.3
Other lending business 22.8 -8.3 21.2 -8.6
Other 24.6 -7.1 26.0 -4.6
Total fee and commission income and expenses 604.6 -100.4 638.2 -98.2
Net fee and commission income 504.2 540.0
Asset management, custody and fiduciary transactions fees relate to fees earned by Erste Group on trust and fiduciary activities in which Erste Group holds or invests assets on behalf of its customers.

26
3. Dividend income
in EUR million 1-3 20 1-3 21
Financial assets HfT 0.2 0.1
Non-trading financial assets at FVPL 1.2 4.7
Financial assets at FVOCI 0.1 0.0
Dividend income 1.5 4.8
4. Net trading result
in EUR million 1-3 20 1-3 21
Securities and derivatives trading -142.0 -29.5
Foreign exchange transactions -13.5 43.3
Result from hedge accounting -1.9 -4.3
Net trading result -157.4 9.5
5. Gains/losses from financial instruments measured at fair value through profit or loss in EUR million 1-3 20 1-3 21
Result from measurement/sale of financial assets designated at FVPL -4.6 -2.8
Result from measurement/repurchase of financial liabilities designated at FVPL 129.5 66.7
Result from financial assets and liabilities designated at FVPL 124.9 63.9
Result from measurement/sale of financial assets mandatorily at FVPL -87.4 -7.0
Gains/losses from financial instruments measured at fair value through profit or loss 37.5 56.9
6. Rental income from investment properties & other operating leases in EUR million 1-3 20 1-3 21
Investment properties 24.6 24.1
Other operating leases 20.2 19.6
Rental income from investment properties & other operating leases 44.8 43.7
7. General administrative expenses
in EUR million 1-3 20 1-3 21
Personnel expenses -630.0 -622.4
Wages and salaries -481.0 -476.9
Compulsory social security -119.7 -119.6
Long-term employee provisions -2.9 -2.4
Other personnel expenses -26.3 -23.4
Other administrative expenses -344.8 -345.8
Deposit insurance contribution -88.3 -107.6
IT expenses -105.9 -103.3
Expenses for office space -41.5 -40.6
Office operating expenses -28.9 -28.0
Advertising/marketing -36.2 -30.3
Legal and consulting costs -25.1 -24.2
Sundry administrative expenses -18.8 -11.7
Depreciation and amortisation -136.5 -135.1
Software and other intangible assets -46.4 -48.0
Owner occupied real estate -38.6 -37.3
Investment properties -7.1 -6.8
Customer relationships -2.0 -1.9
Office furniture and equipment and sundry property and equipment -42.5 -41.1
General administrative expenses -1,111.2 -1,103.3
Employee Share Program and Erste Mitarbeiterbeteiligung Privatstiftung. In 2021, Erste Mitarbeiterbeteiligung Privatstiftung has received 6,452 treasury shares under an escrow agreement for employees of a subsidiary. It was agreed that employees shall not have access to the shares for a certain period. The majority of the shares have been purchased with a payment of EUR 0.2 million made by the subsidiary to settle an obligation under a defined benefit plan. The settlement did not result in a gain or loss.

27
8. Gains/losses from derecognition of financial assets measured at amortised cost
in EUR million 1-3 20 1-3 21
Gains from sale of financial assets at AC 0.6 2.5
Losses from sale of financial assets at AC -0.1 0.0
Gains/losses from derecognition of financial assets measured at amortised cost 0.4 2.5
9. Other gains/losses from derecognition of financial instruments not measured at fair value through profit or loss in EUR million 1-3 20 1-3 21
Sale of financial assets at FVOCI -1.0 0.1
Sale of financial lease receivables 0.0 0.0
Derecognition of financial liabilities at AC -0.6 -0.4
Other gains/losses from derecognition of financial instruments not measured at fair value through profit or loss -1.7 -0.3
10. Impairment result from financial instruments
in EUR million 1-3 20 1-3 21
Financial assets at FVOCI -0.3 0.3
Financial assets at AC -21.1 -25.9
Net allocation to credit loss allowances -83.8 -37.9
Direct write-offs -3.4 -5.0
Recoveries recorded directly to the income statement 65.1 21.0
Modification gains or losses 0.9 -4.0
Lease receivables -2.4 -0.5
Net allocation of provisions for commitments and guarantees given -37.9 -9.6
Impairment result from financial instruments -61.7 -35.7
11. Other operating result
in EUR million 1-3 20 1-3 21
Other operating expenses -178.4 -160.0
Allocation to other provisions -40.6 -22.8
Levies on banking activities -49.9 -33.2
Banking tax -37.3 -21.6
Financial transaction tax -12.6 -11.6
Other taxes -3.9 -3.8
Recovery and resolution fund contributions -84.0 -100.3
Other operating income 17.8 31.0
Release of other provisions 17.8 31.0
Result from properties/movables/other intangible assets other than goodwill -4.1 1.2
Result from other operating expenses/income 37.1 1.2
Other operating result -127.6 -126.7
12. Taxes on income The consolidated net tax expense for the reporting period amounted to EUR 124.3 million (EUR 103.0 million), thereof EUR 32.0 million deferred tax expense (EUR 6.5 million deferred tax income). 13. Cash and cash balances
in EUR million Dec 20 Mar 21
Cash on hand 7,694 7,641
Cash balances at central banks 27,006 44,683
Other demand deposits at credit institutions 1,139 1,630
Cash and cash balances 35,839 53,954

28
14. Derivatives held for trading
Dec 20 Mar 21
in EUR million Notional
value Positive
fair value Negative fair value
Notional value
Positive fair value
Negative fair value
Derivatives held in the trading book 206,411 3,524 3,606 210,910 3,138 3,004
Interest rate 139,393 2,742 2,829 138,087 2,351 2,375
Equity 435 4 3 430 7 7
Foreign exchange 65,541 740 748 71,601 749 601
Credit 820 15 25 566 9 21
Commodity 16 0 0 22 0 0
Other 205 23 0 205 22 0
Derivatives held in the banking book 27,229 1,330 409 26,010 1,121 328
Interest rate 16,836 1,233 246 16,175 1,020 197
Equity 5,202 41 64 4,801 50 32
Foreign exchange 4,742 52 98 4,599 48 98
Credit 305 4 1 292 4 1
Commodity 0 0 0 0 0 0
Other 144 0 0 144 0 0
Total gross amounts 233,640 4,854 4,015 236,920 4,259 3,331
Offset -1,900 -1,977 -1,708 -1,701
Total 2,954 2,037 2,551 1,631
Erste Group undertakes a part of interest rate derivative and credit derivative transactions via clearing houses. These derivatives and related cash margin balances fulfil the requirements for balance sheet offsetting. 15. Other financial assets held for trading in EUR million Dec 20 Mar 21
Equity instruments 34 77
Debt securities 3,368 3,835
General governments 2,628 2,967
Credit institutions 606 686
Other financial corporations 57 94
Non-financial corporations 76 88
Other financial assets held for trading 3,402 3,912
16. Non-trading financial assets at fair value through profit or loss
Dec 20 Mar 21
in EUR million Designated Mandatorily Designated Mandatorily
Equity instruments 0 347 0 325
Debt securities 603 1,446 582 1,454
General governments 63 214 63 185
Credit institutions 524 101 503 97
Other financial corporations 16 983 16 1,030
Non-financial corporations 0 148 0 141
Loans and advances to customers 0 687 0 735
General governments 0 1 0 1
Other financial corporations 0 0 0 0
Non-financial corporations 0 107 0 103
Households 0 579 0 631
Financial assets designated and mandatorily at FVPL 603 2,480 582 2,514
Non-trading financial assets at fair value through profit and loss 3,083 3,096

29
17. Financial assets at fair value through other comprehensive income Equity Instruments The carrying amount of Erste Group’s equity instruments FVOCI as of 31 March 2021amounted to EUR 127.1 million (EUR 138.6 million), the cumulative fair value change for equity instruments FVOCI before taxes recognized in other comprehensive income amounted to EUR 83.1 million (EUR 94.6 million). Debt Instruments Debt securities
Gross carrying amount Credit loss allowances
in EUR million Stage 1 Stage 2 Stage 3 Total Stage 1 Stage 2 Stage 3 Total Amortised costAccumulated OCI changes Fair value
Mar 21
Central banks 6 0 0 6 0 0 0 0 6 0 6
General governments 5,786 191 0 5,976 -3 -7 0 -10 5,966 178 6,154
Credit institutions 982 1 0 982 -3 0 0 -3 980 17 999
Other financial corporations 148 70 0 218 0 -2 0 -3 215 8 226
Non-financial corporations 669 350 0 1,019 -3 -6 0 -9 1,010 39 1,058
Total 7,590 612 0 8,202 -9 -15 0 -25 8,177 243 8,445
Dec 20
Central banks 5 0 0 5 0 0 0 0 5 0 5
General governments 5,757 241 0 5,998 -3 -5 0 -9 5,989 212 6,210
Credit institutions 944 0 0 944 -3 0 0 -3 941 43 987
Other financial corporations 122 83 0 205 0 -4 0 -4 201 10 216
Non-financial corporations 655 301 0 957 -3 -7 0 -9 947 39 996
Total 7,483 626 0 8,109 -9 -16 0 -25 8,084 305 8,414
As defined in IFRS 9, the gross carrying amount of debt instruments at FVOCI equals the amortised cost before deducting any credit loss allowances. As of 31 March 2021, there were no purchased or originated credit-impaired (POCI) debt securities at FVOCI. Development of credit loss allowances
in EUR million As of Additions Derecognitions Transfer
between stages Other changes in
credit risk (net) Other As of
Jan 21 Mar 21
Stage 1 -9 -1 1 2 -2 0 -9
Stage 2 -16 0 0 -3 4 0 -15
Stage 3 0 0 0 0 0 0 0
Total -25 -1 1 -1 1 0 -25
Jan 20 Mar 20
Stage 1 -6 -1 0 0 1 0 -6
Stage 2 -8 0 0 0 0 0 -8
Stage 3 0 0 0 0 0 0 0
Total -14 -1 0 0 1 0 -14

30
18. Financial assets at amortised cost Debt securities
Gross carrying amount Credit loss allowances
in EUR million Stage 1 Stage 2 Stage 3 Total Stage 1 Stage 2 Stage 3 Total Carrying amount
Mar 21
Central banks 14 0 0 14 0 0 0 0 14
General governments 26,425 11 0 26,436 -7 0 0 -8 26,429
Credit institutions 3,720 0 0 3,720 -2 0 0 -2 3,718
Other financial corporations 159 8 0 168 0 0 0 -1 167
Non-financial corporations 650 34 2 686 -1 -3 -1 -5 681
Total 30,968 53 3 31,024 -10 -3 -1 -15 31,009
Dec 20
Central banks 14 0 0 14 0 0 0 0 14
General governments 25,215 11 0 25,227 -7 0 0 -7 25,220
Credit institutions 3,490 19 0 3,510 -2 0 0 -2 3,508
Other financial corporations 135 11 0 146 0 -1 0 -1 145
Non-financial corporations 667 28 3 698 -1 -2 -1 -5 693
Total 29,521 70 3 29,594 -10 -3 -2 -15 29,579
There were no purchased or originated credit-impaired (POCI) debt securities at amortised cost as of 31 March 2021. Development of credit loss allowances for debt securities
in EUR million As of Additions Derecognitions Transfer
between stages Other changes in
credit risk (net) Other As of
Jan 21 Mar 21
Stage 1 -11 -2 1 0 0 0 -10
Stage 2 -3 0 0 -1 1 0 -3
Stage 3 -2 0 0 0 0 0 -1
Total -15 -2 1 -1 1 0 -15
Jan 20 Mar 20
Stage 1 -7 -1 0 0 1 0 -7
Stage 2 -2 0 0 0 1 0 -2
Stage 3 -2 0 0 0 0 0 -2
Total -11 -1 0 0 2 0 -10

31
Loans and advances to banks
Gross carrying amount Credit loss allowances
in EUR million Stage 1 Stage 2 Stage 3 Total Stage 1 Stage 2 Stage 3 Total Carrying amount
Mar 21
Central banks 21,869 0 0 21,869 -1 0 0 -1 21,868
Credit institutions 5,308 309 0 5,618 -5 -4 0 -9 5,609
Total 27,178 309 0 27,487 -6 -4 0 -9 27,477
Dec 20
Central banks 16,763 0 0 16,763 -1 0 0 -1 16,762
Credit institutions 4,669 38 0 4,707 -2 0 0 -3 4,704
Total 21,432 38 0 21,469 -3 0 0 -3 21,466
There were no purchased or originated credit-impaired (POCI) AC loans and advances to banks as of 31 March 2021. Development of credit loss allowances for loans and advances to banks
in EUR million As of Additions Derecognitions Transfer
between stages Other changes in
credit risk (net) Other As of
Jan 21 Mar 21
Stage 1 -3 -4 4 0 -3 0 -6
Stage 2 0 0 0 -2 -2 0 -4
Stage 3 0 0 0 0 0 0 0
Total -3 -4 4 -1 -5 0 -9
Jan 20 Mar 20
Stage 1 -7 -8 5 0 3 0 -8
Stage 2 0 0 0 0 -1 0 -1
Stage 3 -2 -1 0 0 1 0 -2
Total -9 -10 5 0 3 0 -11

32
Loans and advances to customers
Gross carrying amount Credit loss allowances
in EUR million Stage 1 Stage 2 Stage 3 POCIt Total Stage 1 Stage 2 Stage 3 POCI Total Carrying amount
Mar 21
General governments 6,308 376 2 3 6,688 -4 -10 -2 0 -16 6,672
Other financial corporations 2,890 752 16 11 3,670 -10 -35 -6 0 -50 3,620
Non-financial corporations 51,317 18,849 2,019 235 72,419 -189 -676 -1,123 -90 -2,077 70,342
Households 69,569 10,822 1,932 124 82,447 -136 -473 -1,029 -30 -1,667 80,780
Total 130,084 30,799 3,970 373 165,225 -339 -1,193 -2,159 -120 -3,811 161,414
Dec 20
General governments 6,455 330 3 3 6,791 -4 -4 -2 -1 -11 6,779
Other financial corporations 2,860 836 19 11 3,727 -8 -38 -6 0 -51 3,676
Non-financial corporations 50,673 18,379 2,075 227 71,354 -186 -657 -1,172 -92 -2,107 69,247
Households 69,241 10,554 1,935 125 81,855 -136 -472 -1,021 -33 -1,662 80,193
Total 129,229 30,100 4,031 367 163,727 -335 -1,171 -2,201 -125 -3,831 159,895
Development of credit loss allowances for loans and advances to customers
in EUR million As of Additions Derecognitions
Transfer between
stages
Other changes in credit risk
(net)
Insignificant modifications
(net) Write-offs Other As of
Jan 21 Mar 21
Stage 1 -335 -63 18 119 -77 0 0 -1 -339
General governments -4 0 0 0 0 0 0 0 -4
Other financial corporations -8 -2 1 2 -2 0 0 0 -10
Non-financial corporations -186 -39 12 36 -11 0 0 0 -189
Households -136 -22 5 80 -63 0 0 0 -136
Stage 2 -1,171 -32 36 -193 167 0 0 -1 -1,193
General governments -4 0 0 -3 -3 0 0 0 -10
Other financial corporations -38 0 1 -9 12 0 0 -1 -35
Non-financial corporations -657 -24 20 -68 54 0 0 -1 -676
Households -472 -7 15 -113 103 1 0 1 -473
Stage 3 -2,201 -19 43 -20 -32 2 70 -3 -2,159
General governments -2 0 0 0 0 0 0 0 -2
Other financial corporations -6 0 0 0 -1 0 1 0 -6
Non-financial corporations -1,172 -9 20 -8 24 1 25 -3 -1,123
Households -1,021 -10 23 -11 -55 1 44 0 -1,029
POCI -125 0 3 0 2 0 1 0 -120
General governments -1 0 0 0 1 0 0 0 0
Other financial corporations 0 0 0 0 0 0 0 0 0
Non-financial corporations -92 0 2 0 0 0 0 0 -90
Households -33 0 1 0 1 0 0 0 -30
Total -3,831 -114 99 -94 59 2 71 -4 -3,811
Jan 20 Mar 20
Stage 1 -320 -54 16 94 -42 0 0 5 -299
General governments -17 -1 0 0 0 0 0 0 -17
Other financial corporations -5 -2 0 2 -2 0 0 0 -6
Non-financial corporations -176 -35 11 38 -8 0 0 2 -167
Households -122 -16 5 54 -32 0 0 2 -109
Stage 2 -506 -16 20 -191 92 0 0 9 -591
General governments -3 0 0 0 0 0 0 0 -4
Other financial corporations -9 -1 0 -4 3 0 0 0 -10
Non-financial corporations -243 -6 11 -82 20 0 0 3 -296
Households -251 -9 9 -105 69 0 0 6 -281
Stage 3 -2,003 -21 72 -22 -67 -1 58 26 -1,958
General governments -2 0 0 0 0 0 0 0 -2
Other financial corporations -8 0 0 0 0 0 1 0 -8
Non-financial corporations -965 -10 29 -8 -26 -1 31 10 -940
Households -1,029 -10 42 -14 -41 0 27 16 -1,009
POCI -139 0 7 0 5 0 1 2 -124
General governments -1 0 0 0 0 0 0 0 -1
Other financial corporations 0 0 0 0 0 0 0 0 0
Non-financial corporations -96 0 6 0 3 0 0 1 -85
Households -43 0 1 0 2 0 1 2 -38
Total -2,969 -90 115 -119 -11 0 60 42 -2,973

33
19. Finance lease receivables
Gross carrying amount Credit loss allowances
in EUR million Stage 1 Stage 2 Stage 3 POCI Total Stage 1 Stage 2 Stage 3 POCI Total Carrying amount
Mar 21
General governments 351 2 13 0 365 -2 0 -2 0 -4 361
Credit institutions 4 0 0 0 4 0 0 0 0 0 4
Other financial corporations 70 1 0 0 71 0 0 0 0 0 70
Non-financial corporations 2,296 483 168 0 2,947 -11 -12 -70 0 -93 2,854
Households 750 52 14 0 816 -3 -2 -6 0 -11 805
Total 3,470 537 195 0 4,202 -16 -14 -78 0 -108 4,094
Dec 20
General governments 358 1 16 0 374 -3 0 -2 0 -4 370
Credit institutions 4 0 0 0 4 0 0 0 0 0 4
Other financial corporations 66 7 0 0 73 0 0 0 0 0 73
Non-financial corporations 2,319 484 171 0 2,974 -11 -10 -70 0 -91 2,883
Households 739 56 15 0 810 -3 -2 -7 0 -12 798
Total 3,485 548 201 0 4,235 -17 -12 -78 0 -108 4,127
Development of credit loss allowances for finance lease receivables
in EUR million As of Additions Derecognitions
Transfer between
stages
Other changes in credit risk
(net)
Insignificant modifications
(net) Write-offs Other As of
Jan 21 Mar 21
Stage 1 -17 -1 0 3 0 0 0 0 -16
Stage 2 -12 0 0 -2 0 0 0 0 -14
Stage 3 -78 0 0 -1 1 0 1 0 -78
POCI 0 0 0 0 0 0 0 0 0
Total -108 -2 0 -1 0 0 1 0 -108
Jan 20 Mar 20
Stage 1 -15 -1 0 2 0 0 0 0 -14
Stage 2 -5 0 0 -2 -4 0 0 0 -10
Stage 3 -114 0 0 -3 4 0 2 6 -105
POCI 0 0 0 0 0 0 0 0 0
Total -134 -1 0 -2 -1 0 2 6 -130
20. Hedge accounting derivatives
Dec 20 Mar 21
in EUR million Notional
value Positive
fair value Negative fair value
Notional value
Positive fair value
Negative fair value
Fair value hedges 13,540 537 291 12,937 397 286
Interest rate 13,540 537 291 12,937 397 286
Equity 0 0 0 0 0 0
Foreign exchange 0 0 0 0 0 0
Credit 0 0 0 0 0 0
Commodity 0 0 0 0 0 0
Other 0 0 0 0 0 0
Cash flow hedges 3,300 86 15 3,441 50 38
Interest rate 2,704 83 8 2,656 48 11
Equity 0 0 0 0 0 0
Foreign exchange 596 2 7 784 2 26
Credit 0 0 0 0 0 0
Commodity 0 0 0 0 0 0
Other 0 0 0 0 0 0
Total gross amounts 16,840 623 306 16,378 446 324
Offset 0 -418 -117 -297 -133
Total 205 189 149 191
Erste Group undertakes a part of interest rate derivative and credit derivative transactions via clearing houses. These derivatives and related cash margin balances fulfil the requirements for balance sheet offsetting.

34
21. Trade and other receivables
Gross carrying amount Credit loss allowances
in EUR million Stage 1 Stage 2 Stage 3 POCI Total Stage 1 Stage 2 Stage 3 POCI Total Carrying amount
Mar 21
Central banks 0 0 0 0 0 0 0 0 0 0 0
General governments 112 25 0 0 137 0 0 0 0 0 136
Credit institutions 25 4 0 0 29 0 -1 0 0 -1 28
Other financial corporations 13 3 0 0 16 0 0 0 0 0 16
Non-financial corporations 623 696 61 0 1,380 -5 -4 -52 0 -60 1,320
Households 84 14 22 0 120 -2 -4 -18 0 -25 95
Total 857 742 83 0 1,682 -7 -9 -70 0 -86 1,596
Dec 20
Central banks 1 0 0 0 1 0 0 0 0 0 1
General governments 35 20 0 0 55 0 0 0 0 0 55
Credit institutions 27 2 0 0 29 0 0 0 0 -1 29
Other financial corporations 25 2 0 0 28 0 0 0 0 0 27
Non-financial corporations 484 639 39 0 1,162 -4 -5 -29 0 -38 1,124
Households 88 21 21 0 130 -2 -5 -18 0 -24 106
Total 660 684 61 0 1,405 -6 -10 -47 0 -64 1,341
Development of credit loss allowances for trade and other receivables
in EUR million As of Additions Derecognitions
Transfer between
stages
Other changes in credit risk
(net)
Insignificant modifications
(net) Write-offs Other As of
Jan 21 Mar 21
Stage 1 -6 -3 1 2 -1 0 0 0 -7
Stage 2 -10 0 0 -2 3 0 0 0 -9
Stage 3 -47 0 1 -2 -23 0 0 0 -70
POCI 0 0 0 0 0 0 0 0 0
Total -64 -3 3 -2 -21 0 1 0 -86
Jan 20 Mar 20
Stage 1 -6 -1 0 0 2 0 0 0 -5
Stage 2 -10 0 1 -1 0 0 0 0 -10
Stage 3 -55 0 0 0 -2 0 2 1 -54
POCI -1 0 1 0 0 0 0 0 0
Total -72 -1 2 -1 -1 0 2 2 -69
22. Other assets in EUR million Dec 20 Mar 21
Prepayments 124 161
Inventories 171 157
Sundry assets 456 693
Other assets 751 1,010
23. Other financial liabilities held for trading
in EUR million Dec 20 Mar 21
Short positions 521 496
Equity instruments 135 41
Debt securities 386 455
Debt securities issued 66 65
Other financial liabilities held for trading 588 561

35
24. Financial liabilities at fair value through profit and loss Debt securities issued in EUR million Dec 20 Mar 21
Subordinated debt securities issued 3,944 3,788
Other debt securities issued 7,713 7,194
Bonds 4,784 4,590
Other certificates of deposits/name certificates 854 858
Mortgage covered bonds 1,858 1,532
Public sector covered bonds 216 213
Debt securities issued 11,657 10,982
25. Financial liabilities at amortised costs Deposits from banks in EUR million Dec 20 Mar 21
Overnight deposits 2,115 4,474
Term deposits 21,728 28,119
Repurchase agreements 927 2,696
Deposits from banks 24,771 35,288
Deposits from customers in EUR million Dec 20 Mar 21
Overnight deposits 144,864 153,773
Savings deposits 37,265 38,986
Other financial corporations 185 214
Non-financial corporations 2,457 2,285
Households 34,623 36,486
Non-savings deposits 107,599 114,787
General governments 5,806 8,030
Other financial corporations 6,936 7,752
Non-financial corporations 33,312 35,144
Households 61,544 63,861
Term deposits 44,684 47,449
Deposits with agreed maturity 38,142 41,460
Savings deposits 25,996 25,135
Other financial corporations 1,050 729
Non-financial corporations 1,331 1,551
Households 23,615 22,854
Non-savings deposits 12,146 16,326
General governments 2,832 3,117
Other financial corporations 1,890 5,140
Non-financial corporations 2,285 2,533
Households 5,140 5,536
Deposits redeemable at notice 6,543 5,989
General governments 1 12
Other financial corporations 110 101
Non-financial corporations 256 282
Households 6,175 5,594
Repurchase agreements 1,269 3,922
General governments 2 1,917
Other financial corporations 1,260 2,006
Non-financial corporations 6 0
Deposits from customers 190,816 205,144
General governments 8,642 13,075
Other financial corporations 11,431 15,943
Non-financial corporations 39,648 41,795
Households 131,097 134,331
The carrying amount of the TLTRO III liabilities as of 31 March 2021 was EUR 18.1 billion (EUR 14.1 billion). No catch-up adjustments were recognised in the first quarter of 2021 since the expectations of reaching the given credit lending thresholds remained unchanged.

36
Debt securities issued in EUR million Dec 20 Mar 21
Subordinated debt securities issued 1,477 1,467
Senior non-preferred bonds 669 667
Other debt securities issued 16,874 19,401
Bonds 4,680 5,025
Certificates of deposit 520 639
Other certificates of deposits/name certificates 178 175
Mortgage covered bonds 10,977 9,719
Public sector covered bonds 0 0
Other 519 3,844
Debt securities issued 19,020 21,535
26. Provisions
in EUR million Dec 20 Mar 21
Long-term employee provisions 1,042 978
Pending legal issues and tax litigation 359 352
Commitments and guarantees given 399 384
Provisions for commitments and financial guarantees in Stage 1 83 83
Provisions for commitments and financial guarantees in Stage 2 211 207
Provisions for commitments and financial guarantees - Defaulted 104 94
Other provisions 282 482
Provisions for onerous contracts 3 3
Other 279 480
Provisions 2,082 2,196
Effects from the change in material valuation parameters For the calculation of the defined benefit obligation for pension and severance payment provisions as well as for jubilee provisions, the interest rate used has been increased to 0.94% p.a. as of 31 March 2021 (31 December 2020: 0.50% p.a.) to reflect the actual interest rate levels. Furthermore, the collective agreement trend remained unchanged at 1.90% p.a. (31 December 2020: 1.90% p.a.) as well as the ASVG trend at 1.70% p.a. (31 December 2020: 1.70% p.a.). According to IAS 19 the resulting measurement adjustment for pension and severance payment provisions amounting to EUR 51.1 million (before tax) has been recognised in other comprehensive income those for jubilee provisions, an amount of EUR 6.0 million has been considered in the income statement. 27. Other liabilities in EUR million Dec 20 Mar 21
Deferred income 117 120
Sundry liabilities 2,115 2,794
Other liabilities 2,232 2,914

37
28. Segment reporting Erste Group’s segment reporting is based on IFRS 8 Operating Segments, which adopts the management approach. Accordingly, segment information is prepared on the basis of internal management reporting that is regularly reviewed by the chief operating decision maker to assess the performance of the segments and make decisions regarding the allocation of resources. Within Erste Group the function of the chief operating decision maker is exercised by the management board. Erste Group uses a matrix organisational structure with geographical segmentation and business segments. Since the chief operating decision maker performs the steering primarily based on geographical seg-ments, those are defined as operating segments according to IFRS 8. In order to provide more comprehensive information, the performance of the business segments is reported additionally. Geographical segmentation (operating segments) For the purpose of segment reporting geographical segments are defined as operating segments, for which the information is presented on the basis of the booking entity's location (not the country of risk). In case of information regarding a partial group, the allocation is based on the location of the respective parent entity according to the local management responsibility. Geographical areas are defined according to the core markets in which Erste Group operates. Based on the locations of the banking and other financial institution participations, the geographical areas consist of two core markets, Austria and Central and Eastern Europe and a residual segment Other that comprises the remaining business activities of Erste Group outside its core markets as well as the reconciliation to the consolidated accounting result.
The geographical area Austria consists of the following three operating segments:
_ The Erste Bank Oesterreich & Subsidiaries (EBOe & Subsidiaries) segment comprises Erste Bank der oesterreichischen Sparkassen AG (Erste Bank Oesterreich) and its main subsidiaries (e.g. sBausparkasse, Salzburger Sparkasse, Tiroler Sparkasse, Sparkasse Hainburg).
_ The Savings banks segment includes those savings banks which are members of the Haftungsverbund (cross-guarantee system) of the Austrian savings banks sector and in which Erste Group does not hold a majority stake but which are fully controlled according to IFRS 10. The fully or majority owned Erste Bank Oesterreich, Tiroler Sparkasse, Salzburger Sparkasse, and Sparkasse Hainburg are not part of the Savings Banks segment.
_ The Other Austria segment comprises Erste Group Bank AG (Holding) with its Corporates and Group Markets business, Erste Group Immorent GmbH, Erste Asset Management GmbH and Intermarket Bank AG.
The geographical area Central and Eastern Europe (CEE) consists of six operating segments covering Erste Group’s banking subsidiaries located in the respective CEE countries:
_ Czech Republic (comprising Česká spořitelna Group) _ Slovakia (comprising Slovenská sporitel’ňa Group) _ Romania (comprising Banca Comercială Română Group) _ Hungary (comprising Erste Bank Hungary Group) _ Croatia (comprising Erste Bank Croatia Group) _ Serbia (comprising Erste Bank Serbia Group).
The residual segment Other covers mainly centrally managed activities and items that are not directly allocated to other segments. It com-prises the corporate center of Erste Group Bank AG (and thus dividends and the refinancing costs from participations, general administrative expenses), internal service providers (facility management, IT, procurement), the banking tax of Erste Group Bank AG as well as free capital of Erste Group (defined as the difference of the total average IFRS equity and the average economical equity allocated to the segments). Asset/Liability Management of Erste Group Bank AG as well as the reconciliation to the consolidated accounting result (e.g. intercompany eliminations, dividend eliminations) are also part of the segment Other.
Erste Group – geographical segmentation - operating segments
Austria Central and Eastern Europe Other
EBOe & Subsidiaries
SavingsBanks
OtherAustria
Czech Republic
Slovakia Romania Hungary Croatia Serbia

38
Business segmentation Apart from geographical segments, which are Erste Group's operating segments, business segments are reported as well.
Retail. The Retail segment comprises the business with private individuals, micros and free professionals within the responsibility of account managers in the retail network. This business is operated by the local banks in cooperation with their subsidiaries such as leasing and asset management companies with a focus on simple products ranging from mortgage and consumer loans, investment products, current accounts, savings products to credit cards and cross selling products such as leasing, insurance and building society products. Corporates. The Corporates segment comprises business done with corporate customers of different turnover size (small and medium-sized enterprises and Large Corporate customers) as well as commercial real estate and public sector business. Group Markets. The Group Markets (GM) segment comprises trading and markets services as well as customer business with financial institutions. It includes all activities related to the trading books of Erste Group, including the execution of trade, market making and short-term liquidity management. In addition, it comprises business connected with servicing financial institutions as clients. Asset/Liability Management & Local Corporate Center. The Asset/Liability Management & Local Corporate Center (ALM & LCC) segment includes all asset/liability management functions – local and of Erste Group Bank AG (Holding) – as well as the local corporate centers which comprise all non-core banking business activities such as internal service providers and reconciliation items to local entity results. The corporate center of Erste Group Bank AG is included in the Group Corporate Center segment. Savings Banks. The Savings Banks segment is identical to the operating segment Savings banks. Group Corporate Center. The Group Corporate Center (GCC) segment covers mainly centrally managed activities and items that are not directly allocated to other segments. It comprises the corporate center of Erste Group Bank AG (and thus dividends and the refinancing costs from participations, general administrative expenses), internal service providers (facility management, IT, procurement), the banking tax of Erste Group Bank AG as well as free capital of Erste Group (defined as the difference of the total average IFRS equity and the average economical equity allocated to the segments). Intragroup Elimination. Intragroup Elimination (IC) is not defined as a segment but is the reconciliation to the consolidated accounting result. It includes intragroup eliminations between participations of Erste Group (e.g. intragroup funding, internal cost charges). Intragroup eliminations within partial groups are disclosed in the respective segments. Dividend elimination between Erste Group Bank AG and its fully consolidated subsidiaries is performed in Group Corporate Center. Con-solidation differences arising between the segments, which are eliminated over the lifespan of the underlying transaction, are part of Group Corporate Center. Measurement The profit and loss statement of the segment report is based on the measures reported to the Erste Group management board for the purpose of allocating resources to the segments and assessing their performance. Management reporting as well as the segment report of Erste Group are based on IFRS. Accounting standards and methods as well as measurements used in segment reporting are the same as for the consolidated financial statements of accounting. Interest revenues are not reported separately from interest expenses for each reportable segment. Those measures are reported on the net basis within the position ‘Net interest income’ as interest revenues and interest expenses are neither included into the measure of segment profit or loss reviewed by the chief operating decision maker nor otherwise regularly provided to the chief operating decision maker. Chief operating decision maker relies solely on net interest income to assess the performance of the segments and make decisions about resources
Retail
Erste Group – business segments
CorporatesGroup
Markets
Asset/LiabilityManagement &Local Corporate
Center
Savings Banks
Group CorporateCenter
IntragroupElimination

39
to be allocated to the segments. Net fee and commission income and Other operating result are reported on a net basis according to the regular reporting to the chief operating decision maker. Capital consumption per segment is regularly reviewed by the management of Erste Group to assess the performance of the segments. The average allocated capital is determined by the credit risk, market risk, operational risk and business strategic risk. According to the regular internal reporting to Erste Group management board, total assets and total liabilities as well as risk weighted assets and allocated capital are disclosed per segment. Total average allocated capital for the Group equals average total equity of the Group. For measuring and assessing the profitability of segments within Erste Group, such key measures as return on allocated capital and cost/income ratio are used. Return on allocated capital is defined as net result for the period before minorities in relation to the average allocated capital of the respective segment. Cost/income ratio is defined as operating expenses (general administrative expenses) in relation to operating income (total of net interest income, net fee and commission income, dividend income, net trading result, gains/losses from financial instruments measured at fair value through profit or loss, net result from equity method investments, rental income from investment properties and other operating lease).

40
Operating segments: Geographical segmentation – overview
Austria Central and Eastern Europe Other Total Group
in EUR million 1-3 20 1-3 21 1-3 20 1-3 21 1-3 20 1-3 21 1-3 20 1-3 21
Net interest income 540.3 510.1 653.3 630.6 35.4 31.3 1,229.0 1,172.1
Net fee and commission income 307.4 325.9 223.7 236.3 -26.8 -22.2 504.2 540.0
Dividend income 1.3 1.5 0.1 0.0 0.0 3.3 1.5 4.8
Net trading result -79.7 11.3 34.3 56.2 -111.9 -58.1 -157.4 9.5
Gains/losses from financial instruments at FVPL -86.3 22.1 -2.6 -1.9 126.4 36.8 37.5 56.9
Net result from equity method investments 0.3 0.1 1.9 1.0 1.0 0.4 3.3 1.5
Rental income from investment properties & other operating leases 36.6 35.9 12.9 12.0 -4.7 -4.2 44.8 43.7
General administrative expenses -572.5 -571.2 -482.4 -481.2 -56.3 -50.9 -1,111.2 -1,103.3
Gains/losses from derecognition of financial assets at AC 0.0 1.2 0.4 1.3 0.0 0.0 0.4 2.5
Other gains/losses from derecognition of financial instruments not at FVPL -1.5 -0.4 0.1 -0.1 -0.3 0.2 -1.7 -0.3
Impairment result from financial instruments -63.2 13.0 -1.3 -43.0 2.8 -5.7 -61.7 -35.7
Other operating result -29.3 -9.9 -112.2 -72.0 14.0 -44.9 -127.6 -126.7
Levies on banking activities -2.0 -2.3 -43.6 -26.2 -4.3 -4.6 -49.9 -33.2
Pre-tax result from continuing operations 53.5 339.6 328.2 339.4 -20.4 -113.9 361.3 565.1
Taxes on income -19.6 -88.7 -75.1 -59.8 -8.3 24.2 -103.0 -124.3
Net result for the period 33.9 250.9 253.1 279.6 -28.7 -89.7 258.3 440.8
Net result attributable to non-controlling interests 14.9 73.6 7.1 10.9 1.0 1.2 23.0 85.7
Net result attributable to owners of the parent 19.0 177.3 246.0 268.7 -29.8 -90.9 235.3 355.1
Operating income 719.9 906.9 923.6 934.4 19.4 -12.7 1,663.0 1,828.6
Operating expenses -572.5 -571.2 -482.4 -481.2 -56.3 -50.9 -1,111.2 -1,103.3
Operating result 147.4 335.7 441.2 453.2 -36.9 -63.6 551.7 725.3
Risk-weighted assets (credit risk, eop) 53,396 53,033 43,320 43,834 2,198 2,888 98,914 99,755
Average allocated capital 6,983 7,508 7,029 8,168 6,987 6,893 20,998 22,570
Cost/income ratio 79.5% 63.0% 52.2% 51.5% >100% >100% 66.8% 60.3%
Return on allocated capital 2.0% 13.6% 14.5% 13.9% -1.7% -5.3% 4.9% 7.9%
Total assets (eop) 171,607 202,104 118,882 130,144 -27,591 -27,279 262,898 304,969
Total liabilities excluding equity (eop) 137,963 165,565 107,359 117,737 -3,477 -1,105 241,846 282,197
Impairments -63.2 13.0 -5.1 -44.8 0.7 -5.7 -67.7 -37.5
Net impairment loss on financial assets AC/FVOCI and finance lease receivables -55.6 13.4 27.1 -37.0 4.7 -2.5 -23.8 -26.1
Net impairment loss on commitments and guarantees given -7.6 -0.5 -28.4 -6.0 -1.9 -3.1 -37.9 -9.6
Impairment of goodwill 0.0 0.0 0.0 0.0 0.0 0.0 0.0 0.0
Net impairment on investments in subsidiaries, joint ventures and associates 0.0 0.0 0.0 0.0 -2.1 0.0 -2.1 0.0
Net impairment on other non-financial assets 0.0 0.0 -3.9 -1.8 0.0 0.0 -3.9 -1.8

41
Operating segments: Geographical area – Austria
EBOe & Subsidiaries Savings Banks Other Austria Austria
in EUR million 1-3 20 1-3 21 1-3 20 1-3 21 1-3 20 1-3 21 1-3 20 1-3 21
Net interest income 161.1 149.3 266.7 262.4 112.4 98.5 540.3 510.1
Net fee and commission income 106.1 110.8 133.6 140.3 67.7 74.8 307.4 325.9
Dividend income 0.0 0.0 0.6 0.2 0.7 1.2 1.3 1.5
Net trading result 5.2 -6.8 -4.7 -6.6 -80.2 24.7 -79.7 11.3
Gains/losses from financial instruments at FVPL -5.3 11.2 -53.4 14.0 -27.6 -3.1 -86.3 22.1
Net result from equity method investments 0.2 0.4 0.0 0.0 0.2 -0.3 0.3 0.1
Rental income from investment properties & other operating leases 14.1 15.1 10.1 10.2 12.4 10.6 36.6 35.9
General administrative expenses -188.8 -191.5 -293.4 -297.4 -90.2 -82.4 -572.5 -571.2
Gains/losses from derecognition of financial assets at AC 0.0 0.0 0.0 1.2 0.1 0.0 0.0 1.2
Other gains/losses from derecognition of financial instruments not at FVPL -0.1 0.0 -1.4 -0.3 0.0 -0.1 -1.5 -0.4
Impairment result from financial instruments -21.7 5.1 -14.9 2.1 -26.6 5.7 -63.2 13.0
Other operating result -16.9 -16.3 -10.9 -7.3 -1.6 13.8 -29.3 -9.9
Levies on banking activities -0.9 -1.1 -1.1 -1.2 0.0 0.0 -2.0 -2.3
Pre-tax result from continuing operations 53.9 77.3 32.4 118.8 -32.8 143.4 53.5 339.6
Taxes on income -15.2 -21.8 -16.1 -34.0 11.7 -33.0 -19.6 -88.7
Net result for the period 38.7 55.6 16.3 84.9 -21.1 110.5 33.9 250.9
Net result attributable to non-controlling interests 2.6 6.5 10.8 65.0 1.6 2.2 14.9 73.6
Net result attributable to owners of the parent 36.1 49.1 5.5 19.9 -22.6 108.3 19.0 177.3
Operating income 281.4 280.0 352.9 420.5 85.6 206.4 719.9 906.9
Operating expenses -188.8 -191.5 -293.4 -297.4 -90.2 -82.4 -572.5 -571.2
Operating result 92.6 88.5 59.5 123.2 -4.7 124.0 147.4 335.7
Risk-weighted assets (credit risk, eop) 12,991 13,120 25,109 24,474 15,295 15,439 53,396 53,033
Average allocated capital 1,728 1,797 3,198 3,352 2,058 2,359 6,983 7,508
Cost/income ratio 67.1% 68.4% 83.1% 70.7% >100% 39.9% 79.5% 63.0%
Return on allocated capital 9.0% 12.5% 2.1% 10.3% -4.1% 19.0% 2.0% 13.6%
Total assets (eop) 48,131 55,614 67,771 73,547 55,705 72,943 171,607 202,104
Total liabilities excluding equity (eop) 45,893 53,333 62,676 68,215 29,394 44,017 137,963 165,565
Impairments -21.7 5.1 -14.9 2.1 -26.6 5.7 -63.2 13.0
Net impairment loss on financial assets AC/FVOCI and finance lease receivables -19.6 -0.1 -17.1 3.7 -18.9 9.8 -55.6 13.4
Net impairment loss on commitments and guarantees given -2.1 5.2 2.2 -1.6 -7.7 -4.1 -7.6 -0.5
Impairment of goodwill 0.0 0.0 0.0 0.0 0.0 0.0 0.0 0.0
Net impairment on investments in subsidiaries, joint ventures and associates 0.0 0.0 0.0 0.0 0.0 0.0 0.0 0.0
Net impairment on other non-financial assets 0.0 0.0 0.0 0.0 0.0 0.0 0.0 0.0

42
Operating segments: Geographical area – Central and Eastern Europe
Czech Republic Slovakia Romania Hungary Croatia Serbia Central and Eastern
Europe
in EUR million 1-3 20 1-3 21 1-3 20 1-3 21 1-3 20 1-3 21 1-3 20 1-3 21 1-3 20 1-3 21 1-3 20 1-3 21 1-3 20 1-3 21
Net interest income 291.9 267.4 110.7 105.0 111.7 107.6 55.1 66.1 68.5 67.3 15.3 17.1 653.3 630.6
Net fee and commission income 82.2 87.6 34.5 37.0 34.1 37.4 45.5 49.2 23.4 21.0 3.8 4.2 223.7 236.3
Dividend income 0.0 0.0 0.1 0.0 0.0 0.0 0.0 0.0 0.0 0.0 0.0 0.0 0.1 0.0
Net trading result 9.3 19.4 -0.4 3.3 14.2 16.8 6.0 10.7 4.3 4.7 0.8 1.3 34.3 56.2
Gains/losses from financial instruments at FVPL 4.6 0.3 -4.1 -0.2 -0.8 -0.4 -0.3 -1.1 -2.0 -0.6 0.0 0.0 -2.6 -1.9
Net result from equity method investments 0.7 -0.9 1.2 1.8 -0.2 -0.2 0.0 0.0 0.2 0.3 0.0 0.0 1.9 1.0
Rental income from investment properties & other operating leases 2.1 2.0 0.1 0.1 5.6 5.7 2.0 1.9 3.1 2.3 0.0 0.0 12.9 12.0
General administrative expenses -195.3 -197.3 -73.0 -78.4 -85.9 -81.1 -58.7 -58.6 -56.7 -51.7 -12.8 -14.0 -482.4 -481.2
Gains/losses from derecognition of financial assets at AC 0.0 0.0 0.0 0.0 0.0 0.0 0.4 1.3 0.0 0.0 0.0 0.0 0.4 1.3
Other gains/losses from derecognition of financial instruments not at FVPL 0.0 0.0 0.0 -0.3 0.0 0.0 0.1 0.2 0.0 0.0 0.0 0.0 0.1 -0.1
Impairment result from financial instruments -24.3 -26.5 -11.3 -17.7 44.2 7.1 3.9 -2.3 -12.1 -1.5 -1.8 -2.0 -1.3 -43.0
Other operating result -28.5 -34.0 -22.5 -7.4 -13.1 -2.3 -41.6 -22.7 -6.4 -5.5 -0.1 -0.1 -112.2 -72.0
Levies on banking activities 0.0 0.0 -16.9 0.0 0.0 0.0 -26.8 -26.2 0.0 0.0 0.0 0.0 -43.6 -26.2
Pre-tax result from continuing operations 142.7 118.0 35.3 43.2 110.0 90.6 12.4 44.7 22.5 36.4 5.3 6.5 328.2 339.4
Taxes on income -28.8 -24.1 -7.3 -9.4 -31.5 -15.4 -3.3 -4.6 -4.1 -6.3 0.0 0.0 -75.1 -59.8
Net result for the period 113.9 93.9 28.0 33.8 78.4 75.2 9.1 40.1 18.4 30.1 5.3 6.5 253.1 279.6
Net result attributable to non-controlling interests 0.0 0.0 0.0 0.0 0.1 0.1 0.0 0.0 5.9 9.5 1.1 1.4 7.1 10.9
Net result attributable to owners of the parent 113.9 94.0 28.0 33.8 78.3 75.1 9.1 40.1 12.5 20.6 4.2 5.2 246.0 268.7
Operating income 390.7 375.9 142.1 147.1 164.7 166.9 108.4 126.8 97.7 95.0 20.0 22.7 923.6 934.4
Operating expenses -195.3 -197.3 -73.0 -78.4 -85.9 -81.1 -58.7 -58.6 -56.7 -51.7 -12.8 -14.0 -482.4 -481.2
Operating result 195.5 178.6 69.1 68.6 78.8 85.8 49.6 68.2 40.9 43.3 7.2 8.7 441.2 453.2
Risk-weighted assets (credit risk, eop) 17,834 18,193 7,056 7,549 7,190 6,816 4,203 3,961 5,611 5,818 1,427 1,497 43,320 43,834
Average allocated capital 2,538 2,904 1,107 1,219 1,384 1,712 936 1,137 843 939 221 257 7,029 8,168
Cost/income ratio 50.0% 52.5% 51.4% 53.3% 52.1% 48.6% 54.2% 46.2% 58.1% 54.5% 64.1% 61.5% 52.2% 51.5%
Return on allocated capital 18.1% 13.1% 10.2% 11.2% 22.8% 17.8% 3.9% 14.3% 8.8% 13.0% 9.7% 10.3% 14.5% 13.9%
Total assets (eop) 61,814 65,643 18,721 22,360 16,236 16,952 9,426 10,860 10,401 11,675 2,284 2,654 118,882 130,144
Total liabilities excluding equity (eop) 56,523 59,895 16,999 20,580 14,402 14,964 8,307 9,656 9,124 10,301 2,004 2,341 107,359 117,737
Impairments -24.3 -26.1 -11.0 -17.7 40.2 4.8 4.0 -2.3 -12.3 -1.5 -1.8 -2.0 -5.1 -44.8
Net impairment loss on financial assets AC/FVOCI and finance lease receivables -22.8 -21.8 -11.2 -17.7 70.2 7.9 3.3 -2.3 -10.4 -1.0 -2.0 -2.0 27.1 -37.0
Net impairment loss on commitments and guarantees given -1.5 -4.7 -0.1 0.0 -25.9 -0.8 0.7 0.0 -1.7 -0.4 0.2 0.0 -28.4 -6.0
Impairment of goodwill 0.0 0.0 0.0 0.0 0.0 0.0 0.0 0.0 0.0 0.0 0.0 0.0 0.0 0.0
Net impairment on investments in subsidiaries, joint ventures and associates 0.0 0.0 0.0 0.0 0.0 0.0 0.0 0.0 0.0 0.0 0.0 0.0 0.0 0.0
Net impairment on other non-financial assets 0.0 0.4 0.3 0.1 -4.0 -2.3 0.0 0.0 -0.2 0.0 0.0 0.0 -3.9 -1.8

43
Business segments (1)
Retail Corporates Group Markets ALM&LCC
in EUR million 1-3 20 1-3 21 1-3 20 1-3 21 1-3 20 1-3 21 1-3 20 1-3 21
Net interest income 558.8 509.4 281.4 280.0 67.7 48.1 2.7 32.1
Net fee and commission income 265.6 281.0 69.4 75.2 68.1 71.9 -21.2 -20.4
Dividend income 0.0 0.0 0.5 0.4 0.2 0.8 0.1 0.1
Net trading result 27.8 24.2 -5.5 25.0 -69.7 42.0 -117.6 -50.0
Gains/losses from financial instruments at FVPL -1.8 -1.7 -4.0 0.1 -24.6 -3.4 120.9 53.4
Net result from equity method investments 1.4 2.1 0.0 0.0 0.0 0.0 0.8 -1.0
Rental income from investment properties & other operating leases 6.0 5.9 27.1 26.4 0.0 0.1 7.2 6.0
General administrative expenses -521.9 -524.0 -135.7 -126.4 -57.2 -54.4 -52.5 -55.4
Gains/losses from derecognition of financial assets at AC 0.0 0.0 0.1 0.0 0.0 0.0 0.1 1.3
Other gains/losses from derecognition of financial instruments not at FVPL 0.0 0.0 0.1 0.0 0.0 -0.1 -0.1 -0.1
Impairment result from financial instruments -40.4 -39.6 -3.1 7.6 -5.2 -2.0 -0.7 1.2
Other operating result -24.6 -14.7 -15.3 2.6 -7.6 -7.9 -85.8 -58.7
Levies on banking activities -22.0 -9.3 -6.5 -5.1 -1.4 -1.2 -14.7 -11.7
Pre-tax result from continuing operations 271.0 242.6 214.9 291.0 -28.3 95.1 -145.9 -91.4
Taxes on income -44.2 -51.9 -38.0 -56.4 9.1 -20.2 4.1 19.4
Net result for the period 226.8 190.6 177.0 234.6 -19.3 74.9 -141.8 -72.0
Net result attributable to non-controlling interests 5.1 7.9 8.2 11.6 0.0 1.3 -2.2 -1.2
Net result attributable to owners of the parent 221.6 182.7 168.8 223.1 -19.3 73.6 -139.7 -70.8
Operating income 857.8 820.9 368.8 407.2 41.6 159.5 -7.0 20.3
Operating expenses -521.9 -524.0 -135.7 -126.4 -57.2 -54.4 -52.5 -55.4
Operating result 335.9 296.9 233.1 280.8 -15.5 105.0 -59.5 -35.2
Risk-weighted assets (credit risk, eop) 17,741 18,693 44,004 43,530 4,315 2,940 6,266 7,512
Average allocated capital 3,240 3,583 4,751 5,209 881 1,025 2,996 3,963
Cost/income ratio 60.8% 63.8% 36.8% 31.1% >100% 34.1% >100% >100%
Return on allocated capital 28.1% 21.6% 15.0% 18.3% -8.8% 29.6% -19.0% -7.4%
Total assets (eop) 62,977 65,835 58,819 60,108 43,089 66,356 68,626 77,575
Total liabilities excluding equity (eop) 90,448 103,036 32,129 36,951 42,763 55,400 53,769 58,138
Impairments -40.5 -39.6 -6.7 5.9 -5.2 -2.0 -0.8 1.1
Net impairment loss on financial assets AC/FVOCI and finance lease receivables -41.2 -39.1 36.5 14.4 -4.6 -1.8 -1.8 -1.3
Net impairment loss on commitments and guarantees given 0.8 -0.5 -39.6 -6.8 -0.6 -0.2 1.1 2.5
Impairment of goodwill 0.0 0.0 0.0 0.0 0.0 0.0 0.0 0.0
Net impairment on investments in subsidiaries, joint ventures and associates 0.0 0.0 0.0 0.0 0.0 0.0 0.0 0.0
Net impairment on other non-financial assets -0.1 0.1 -3.6 -1.8 0.0 0.0 -0.1 -0.2

44
Business segments (2)
Savings Banks Group Corporate Center Intragroup Elimination Total Group
in EUR million 1-3 20 1-3 21 1-3 20 1-3 21 1-3 20 1-3 21 1-3 20 1-3 21
Net interest income 266.7 262.4 22.0 21.8 29.7 18.4 1,229.0 1,172.1
Net fee and commission income 133.6 140.3 -1.5 1.5 -9.8 -9.6 504.2 540.0
Dividend income 0.6 0.2 0.0 3.3 0.0 0.0 1.5 4.8
Net trading result -4.7 -6.6 36.9 -12.9 -24.4 -12.3 -157.4 9.5
Gains/losses from financial instruments at FVPL -53.4 14.0 0.3 -5.4 0.0 0.0 37.5 56.9
Net result from equity method investments 0.0 0.0 1.0 0.4 0.0 0.0 3.3 1.5
Rental income from investment properties & other operating leases 10.1 10.2 -5.5 -4.8 -0.1 -0.1 44.8 43.7
General administrative expenses -293.4 -297.4 -248.8 -241.9 198.4 196.3 -1,111.2 -1,103.3
Gains/losses from derecognition of financial assets at AC 0.0 1.2 0.3 0.1 0.0 -0.1 0.4 2.5
Other gains/losses from derecognition of financial instruments not at FVPL -1.4 -0.3 -0.3 0.1 0.0 0.1 -1.7 -0.3
Impairment result from financial instruments -14.9 2.1 2.5 -5.0 0.0 0.0 -61.7 -35.7
Other operating result -10.9 -7.3 210.2 151.8 -193.7 -192.6 -127.6 -126.7
Levies on banking activities -1.1 -1.2 -4.3 -4.6 0.0 0.0 -49.9 -33.2
Pre-tax result from continuing operations 32.4 118.8 17.2 -91.0 0.0 0.0 361.3 565.1
Taxes on income -16.1 -34.0 -17.8 18.7 0.0 0.0 -103.0 -124.3
Net result for the period 16.3 84.9 -0.6 -72.3 0.0 0.0 258.3 440.8
Net result attributable to non-controlling interests 10.8 65.0 1.0 1.2 0.0 0.0 23.0 85.7
Net result attributable to owners of the parent 5.5 19.9 -1.7 -73.5 0.0 0.0 235.3 355.1
Operating income 352.9 420.5 53.4 3.9 -4.7 -3.6 1,663.0 1,828.6
Operating expenses -293.4 -297.4 -248.8 -241.9 198.4 196.3 -1,111.2 -1,103.3
Operating result 59.5 123.2 -195.5 -238.0 193.7 192.6 551.7 725.3
Risk-weighted assets (credit risk, eop) 25,109 24,474 1,479 2,607 0 0 98,914 99,755
Average allocated capital 3,198 3,352 5,931 5,438 0 0 20,998 22,570
Cost/income ratio 83.1% 70.7% >100% >100% >100% >100% 66.8% 60.3%
Return on allocated capital 2.1% 10.3% 0.0% -5.4% 4.9% 7.9%
Total assets (eop) 67,771 73,547 3,627 6,426 -42,011 -44,878 262,898 304,969
Total liabilities excluding equity (eop) 62,676 68,215 2,105 5,370 -42,044 -44,914 241,846 282,197
Impairments -14.9 2.1 0.4 -5.0 0.0 0.0 -67.7 -37.5
Net impairment loss on financial assets AC/FVOCI and finance lease receivables -17.1 3.7 4.4 -2.0 0.0 0.0 -23.8 -26.1
Net impairment loss on commitments and guarantees given 2.2 -1.6 -1.9 -3.0 0.0 0.0 -37.9 -9.6
Impairment of goodwill 0.0 0.0 0.0 0.0 0.0 0.0 0.0 0.0
Net impairment on investments in subsidiaries, joint ventures and associates 0.0 0.0 -2.1 0.0 0.0 0.0 -2.1 0.0
Net impairment on other non-financial assets 0.0 0.0 0.0 0.0 0.0 0.0 -3.9 -1.8
45
29. Risk management A core function of a bank is taking risks in a conscious and selective manner and professionally steering those risks. Adequate risk policy and risk strategy is essential to a bank’s fundamental financial health and operational business success. Concerning risk policy and strategy as well as regarding risk management organisation, reference is made to the note of the same name in the annual report 2020. Credit risk For the disclosure of asset quality Erste Group assigns each customer to one of the following four risk categories: Low risk. Typically regional customers with well-established and rather long-standing relationships with Erste Group or large internation-ally recognised customers. Very good to satisfactory financial position and low likelihood of financial difficulties relative to the respective market in which the customers operate. Retail clients having long relationships with the bank, or clients with a wide product pool use. No relevant late payments currently or in the most recent 12 months. New business is generally with clients in this risk category. Management attention. Vulnerable non-retail clients, which may have overdue payments or defaults in their credit history or may en-counter debt repayment difficulties in the medium term. Retail clients with possible payment problems in the past triggering early collection reminders. These clients typically have a good recent payment history. Substandard. The borrower is vulnerable to short term negative financial and economic developments and shows an elevated probability of failure. In some cases, restructuring measures are possible or already in place. As a rule, such loans are managed in specialised risk management departments. Non-performing. One or more of the default criteria under Article 178 of the CRR are met: among others, full repayment unlikely, interest or principal payments on a material exposure more than 90 days past due, restructuring resulting in a loss to the lender, realisation of a loan loss, or initiation of bankruptcy proceedings. Erste Group applies the customer view for all customer segments, including retail clients; if an obligor defaults on one deal then the customer’s performing transactions are classified as non-performing as well. Furthermore, non-performing exposures also comprise non-performing forborne transactions even in cases where the client has not defaulted. Credit risk exposure Credit risk exposure relates to the sum of the following balance sheet items:
_ cash and cash balances - demand deposits to credit institutions; _ debt instruments held for trading; _ non-trading debt instruments at fair value through profit or loss (FVPL); _ debt instruments at fair value through other comprehensive income (FVOCI); _ debt instruments at amortised cost (AC), other than trade and other receivables; _ trade and other receivables (for disclosure purposes in the tabular summaries below, any contract assets are also included in this category); _ finance lease receivables; _ debt instruments held for sale in disposal groups; _ positive fair value of hedge accounting derivatives; _ off-balance sheet credit risks (primarily financial guarantees and undrawn loan commitments).
The credit risk exposure equates the gross carrying amount (or nominal value in the case of off-balance sheet positions) excluding:
_ credit loss allowances for financial assets; _ credit loss allowances for loan commitments and financial guarantees; _ provisions for other commitments; _ any collateral held (including risk transfer to guarantors); _ netting effects; _ other credit enhancements; _ credit risk mitigating transactions.

46
The credit risk exposure increased in the reporting period to EUR 299.1 billion (+4.3%; EUR 286.7 billion). Reconciliation between gross carrying amount and carrying amount of the credit risk exposure components
in EUR million Credit risk exposure Allowances Adjustments
Carrying amount
Mar 21
Cash and cash balances - demand deposits to credit institutions 1,632 -1 0 1,630
Debt instruments HfT 6,387 0 0 6,387
Non-trading debt instruments at FVPL 2,771 0 0 2,771
Debt securities 2,036 0 0 2,036
Loans and advances to banks 0 0 0 0
Loans and advances to customers 735 0 0 735
Debt instruments at FVOCI 8,202 -25 218 8,420
Debt securities 8,202 -25 218 8,420
Loans and advances to banks 0 0 0 0
Loans and advances to customers 0 0 0 0
Debt instruments at AC 223,736 -3,835 0 219,901
Debt securities 31,024 -15 0 31,009
Loans and advances to banks 27,487 -9 0 27,477
Loans and advances to customers 165,225 -3,811 0 161,414
Trade and other receivables 1,682 -86 0 1,596
Finance lease receivables 4,202 -108 0 4,094
Debt instruments held for sale in disposal groups 0 0 0 0
Positive fair value of hedge accounting derivatives 149 0 0 149
Off balance-sheet exposures 50,389 -472 0 -
Total 299,149 -4,528 218 244,948
Dec 20
Cash and cash balances - demand deposits to credit institutions 1,140 -1 0 1,139
Debt instruments HfT 6,322 0 0 6,322
Non-trading debt instruments at FVPL 2,736 0 0 2,736
Debt securities 2,048 0 0 2,048
Loans and advances to banks 0 0 0 0
Loans and advances to customers 687 0 0 687
Debt instruments at FVOCI 8,109 -25 280 8,389
Debt securities 8,109 -25 280 8,389
Loans and advances to banks 0 0 0 0
Loans and advances to customers 0 0 0 0
Debt instruments at AC 214,790 -3,850 0 210,940
Debt securities 29,594 -15 0 29,579
Loans and advances to banks 21,469 -3 0 21,466
Loans and advances to customers 163,727 -3,831 0 159,895
Trade and other receivables 1,405 -64 0 1,341
Finance lease receivables 4,235 -108 0 4,127
Debt instruments held for sale in disposal groups 0 0 0 0
Positive fair value of hedge accounting derivatives 205 0 0 205
Off balance-sheet exposures 47,758 -474 0 -
Total 286,699 -4,522 280 235,199
Credit loss allowances comprise impairments for financial assets measured at amortised cost (including finance lease and trade and other receivables) and at fair value through other comprehensive income (FVOCI), as well as credit loss allowances and provisions for off-balance sheet exposures. Adjustments refer to the fair value changes of the carrying amount for debt instruments at FVOCI. Credit risk volume is presented by:
_ counterparty sector and financial instrument; _ industry and risk category; _ region and risk category; _ business segment and risk category; _ business segment and IFRS 9 treatment; _ geographical segment and risk category; _ geographical segment and IFRS 9 treatment.

47
Credit risk exposure by counterparty sector and financial instrument
At amortised cost
in EUR million
Cash and cashbalances - demand
deposits to creditinstitutions
Debt instruments
HfT
Non-trading debt
instruments at FVPL
Debt instruments
at FVOCI Debt
securities
Loans and advances to banks
Loans and advances
to customers
Finance lease
receivables
Positive fair value of
derivatives
Trade and other
receivables
Off balance-sheet
exposures Total
Mar 21
Central banks 0 36 0 38 35 21,869 0 0 0 0 0 21,980
General governments 0 3,082 250 5,944 26,415 0 6,688 365 0 137 3,322 46,203
Credit institutions 1,632 2,579 600 982 3,720 5,618 0 4 146 29 884 16,192
Other financial corporations 0 314 1,047 218 168 0 3,670 71 3 16 2,372 7,879
Non-financial corporations 0 373 244 1,019 686 0 72,419 2,947 0 1,380 31,006 110,074
Households 0 1 631 0 0 0 82,447 816 0 120 12,806 96,821
Total 1,632 6,387 2,771 8,202 31,024 27,487 165,225 4,202 149 1,682 50,389 299,149
Dec 20
Central banks 0 38 0 42 35 16,763 0 0 0 1 0 16,878
General governments 0 2,806 278 5,961 25,206 0 6,791 374 0 55 3,154 44,625
Credit institutions 1,140 2,914 625 944 3,510 4,707 0 4 204 29 852 14,928
Other financial corporations 0 146 999 205 146 0 3,727 73 1 28 2,235 7,560
Non-financial corporations 0 418 254 957 698 0 71,324 2,974 0 1,162 29,595 107,381
Households 0 1 579 0 0 0 81,885 810 0 130 11,922 95,327
Total 1,140 6,322 2,736 8,109 29,594 21,469 163,727 4,235 205 1,405 47,758 286,699

48
Credit risk exposure by industry and risk category
in EUR million Low risk Management
attention Substandard Non-
performing Total
Mar 21
Agriculture and forestry 2,042 922 272 128 3,363
Mining 695 88 5 24 811
Manufacturing 16,681 3,041 742 679 21,144
Energy and water supply 3,759 751 232 64 4,806
Construction 9,606 2,795 496 326 13,223
Trade 10,859 2,983 640 493 14,976
Transport and communication 6,505 1,318 251 194 8,268
Hotels and restaurants 3,453 1,674 404 341 5,871
Financial and insurance services 44,320 1,722 354 37 46,432
Real estate and housing 26,492 5,053 1,507 368 33,419
Services 12,094 1,870 442 472 14,877
Public administration 43,385 504 148 1 44,038
Education, health and art 2,911 615 150 98 3,773
Households 75,641 4,740 1,768 1,594 83,742
Other 312 1 92 0 405
Total 258,752 28,077 7,503 4,818 299,149
Dec 20
Agriculture and forestry 2,080 830 253 125 3,289
Mining 742 63 4 23 832
Manufacturing 15,950 2,966 676 634 20,226
Energy and water supply 3,940 655 233 64 4,893
Construction 9,594 2,284 435 331 12,645
Trade 10,754 2,702 575 513 14,544
Transport and communication 6,555 1,368 189 202 8,313
Hotels and restaurants 3,618 1,442 294 343 5,697
Financial and insurance services 37,653 1,557 364 37 39,611
Real estate and housing 26,262 4,982 1,344 377 32,965
Services 12,086 1,719 375 495 14,675
Public administration 41,937 387 46 1 42,370
Education, health and art 2,877 620 77 103 3,677
Households 74,640 4,507 1,662 1,593 82,403
Other 352 3 203 0 558
Total 249,041 26,086 6,731 4,841 286,699

49
Credit risk exposure by region and risk category
in EUR million Low risk Management
attention Substandard Non-
performing Total
Mar 21
Core markets 224,513 25,099 6,651 4,247 260,511
Austria 107,049 11,372 1,774 1,872 122,067
Czech Republic 59,355 5,945 1,482 687 67,469
Romania 16,837 1,815 380 445 19,477
Slovakia 20,707 1,371 1,775 444 24,297
Hungary 11,216 1,114 619 181 13,130
Croatia 6,665 3,116 511 589 10,880
Serbia 2,684 367 110 30 3,191
Other EU 22,283 1,258 368 339 24,249
Other industrialised countries 7,105 441 130 67 7,743
Emerging markets 4,850 1,278 353 164 6,646
Southeastern Europe/CIS 2,603 738 216 125 3,683
Asia 1,869 129 30 29 2,057
Latin America 119 11 7 9 146
Middle East/Africa 259 400 100 2 761
Total 258,752 28,077 7,503 4,818 299,149
Dec 20
Core markets 216,858 23,219 5,981 4,163 250,221
Austria 104,551 10,786 1,839 1,826 119,002
Czech Republic 52,874 6,075 1,194 642 60,784
Romania 17,217 1,837 397 455 19,905
Slovakia 20,738 1,487 1,594 409 24,229
Hungary 10,394 1,147 539 181 12,262
Croatia 8,446 1,513 305 622 10,885
Serbia 2,637 376 114 27 3,154
Other EU 20,704 1,153 311 463 22,631
Other industrialised countries 6,855 662 89 66 7,671
Emerging markets 4,624 1,053 350 149 6,175
Southeastern Europe/CIS 2,771 650 119 120 3,660
Asia 1,450 124 26 27 1,626
Latin America 138 12 8 1 159
Middle East/Africa 265 268 197 1 730
Total 249,041 26,086 6,731 4,841 286,699
The geographic analysis of credit exposure is based on the country of risk of borrowers and counterparties and also includes obligors domiciled in other countries if the economic risk exists in the respective country of risk. Accordingly, the distribution by regions differs from the composition of the credit risk exposure by geographical segments of Erste Group.

50
Credit risk exposure by reporting segment and risk category The segment reporting of Erste Group is based on the matrix organisation by business segment as well as by geographical segment. The geographical segmentation follows the country markets in which Erste Group operates and the locations of the banking and other financial institutions participations. Credit risk exposure by business segment and risk category
in EUR million Low risk Management
attention Substandard Non-
performing Total
Mar 21
Retail 60,964 5,767 2,324 1,538 70,593
Corporates 66,356 12,908 3,581 1,800 84,645
Group Markets 19,172 740 105 1 20,017
ALM & LCC 49,966 284 161 19 50,430
Savings Banks 61,978 8,342 1,268 1,429 73,017
GCC 316 37 63 31 446
Total 258,752 28,077 7,503 4,818 299,149
Dec 20
Retail 60,580 5,596 2,143 1,514 69,833
Corporates 66,644 11,727 2,747 1,819 82,936
Group Markets 16,522 384 224 1 17,131
ALM & LCC 44,527 223 155 20 44,925
Savings Banks 60,446 8,111 1,221 1,470 71,249
GCC 320 46 242 17 625
Total 249,041 26,086 6,731 4,841 286,699
Credit risk exposure by business segment and IFRS 9 treatment
in EUR million Stage 1 Stage 2 Stage 3 POCI
Not subject to IFRS 9
impairment Total
Mar 21
Retail 59,256 8,821 1,488 117 910 70,593
Corporates 61,016 17,020 1,502 264 4,844 84,645
Group Markets 12,748 372 0 0 6,897 20,017
ALM & LCC 49,922 230 19 0 259 50,430
Savings Banks 55,364 12,975 1,392 49 3,238 73,017
GCC 268 4 31 0 143 446
Total 238,574 39,422 4,431 430 16,292 299,149
Dec 20
Retail 59,028 8,461 1,461 118 763 69,833
Corporates 60,296 16,931 1,551 251 3,907 82,936
Group Markets 10,273 116 1 0 6,741 17,131
ALM & LCC 44,273 308 19 0 326 44,925
Savings Banks 53,972 12,669 1,431 50 3,126 71,249
GCC 357 169 17 0 82 625
Total 228,200 38,655 4,480 419 14,945 286,699
Stage 1 and Stage 2 comprise not impaired credit risks, while Stage 3 includes impaired credit risks. POCI (purchased or originated credit impaired) exposure consists of credit risks already impaired when purchased or originated. The defaulted part of POCI amounted to 282 million (EUR 274 million), the non-defaulted part to EUR 148 million (EUR 145 million).

51
Credit risk exposure by geographical segment and risk category
in EUR million Low risk Management
attention Substandard Non-
performing Total
Mar 21
Austria 140,270 14,254 2,242 2,450 159,215
EBOe & Subsidiaries 42,679 3,686 611 603 47,579
Savings Banks 61,978 8,342 1,268 1,429 73,017
Other Austria 35,612 2,226 363 418 38,619
Central and Eastern Europe 111,590 13,773 5,177 2,338 132,878
Czech Republic 59,766 5,999 1,849 722 68,337
Romania 15,375 1,688 379 472 17,915
Slovakia 17,715 1,332 1,639 446 21,132
Hungary 9,675 1,045 563 162 11,445
Croatia 6,937 3,345 637 506 11,426
Serbia 2,122 363 110 29 2,624
Other 6,892 50 84 31 7,056
Total 258,752 28,077 7,503 4,818 299,149
Dec 20
Austria 135,415 13,923 2,200 2,533 154,072
EBOe & Subsidiaries 41,761 3,512 566 615 46,455
Savings Banks 60,446 8,111 1,221 1,470 71,249
Other Austria 33,208 2,299 413 448 36,368
Central and Eastern Europe 106,783 12,115 4,289 2,291 125,478
Czech Republic 53,910 6,034 1,405 684 62,033
Romania 15,361 1,737 396 481 17,975
Slovakia 17,707 1,439 1,455 411 21,012
Hungary 8,834 1,007 539 160 10,539
Croatia 8,907 1,535 380 529 11,351
Serbia 2,064 364 114 26 2,568
Other 6,842 48 242 17 7,149
Total 249,041 26,086 6,731 4,841 286,699
Credit risk exposure by geographical segment and IFRS 9 treatment
in EUR million Stage 1 Stage 2 Stage 3 POCI
Not subject to IFRS 9
impairment Total
Mar 21
Austria 118,202 26,584 2,374 72 11,982 159,215
EBOe & Subsidiaries 38,304 7,633 592 7 1,044 47,579
Savings Banks 55,364 12,975 1,392 49 3,238 73,017
Other Austria 24,535 5,977 391 17 7,700 38,619
Central and Eastern Europe 113,628 12,726 2,026 358 4,140 132,878
Czech Republic 61,503 5,046 660 54 1,074 68,337
Romania 13,811 2,395 398 67 1,243 17,915
Slovakia 17,410 2,796 324 133 469 21,132
Hungary 9,128 1,046 129 81 1,061 11,445
Croatia 9,642 1,248 488 21 27 11,426
Serbia 2,134 196 26 2 266 2,624
Other 6,744 111 31 0 170 7,056
Total 238,574 39,422 4,431 430 16,292 299,149
Dec 20
Austria 114,235 26,033 2,452 72 11,278 154,072
EBOe & Subsidiaries 37,174 7,633 603 6 1,038 46,455
Savings Banks 53,972 12,669 1,431 50 3,126 71,249
Other Austria 23,089 5,731 418 17 7,114 36,368
Central and Eastern Europe 107,204 12,351 2,011 347 3,565 125,478
Czech Republic 56,144 4,793 642 47 408 62,033
Romania 13,775 2,430 403 69 1,298 17,975
Slovakia 17,413 2,709 302 130 459 21,012
Hungary 8,307 919 130 77 1,106 10,539
Croatia 9,468 1,317 511 22 33 11,351
Serbia 2,098 183 24 2 262 2,568
Other 6,760 271 17 0 101 7,149
Total 228,200 38,655 4,480 419 14,945 286,699

52
Expected credit loss measurement The general principles and standards for credit loss allowances are governed by internal policies in Erste Group. According to IFRS 9, credit loss allowances are calculated for all components of credit risk exposures which are measured at amortised cost (AC) or at fair value through other comprehensive income. They include debt securities, loans and advances, demand deposits on nostro accounts with commercial banks as well as finance lease and trade receivables. In addition, credit loss allowances are calculated for loan commitments and financial guaran-tees if they meet the applicable IFRS 9 definitions. Classification into stages and definition of credit-impaired financial instruments There are three main stages outlined for expected credit loss (ECL) determination. The stages approach applies to financial instruments within the scope of the impairment requirements of IFRS 9 and those that are not categorised as purchased or originated credit impaired financial assets (POCI), which form a category of their own. Depending on the impairment status and the assessment of the development of credit risk, these financial instruments are assigned to one of the three stages. Stage 1 includes not credit-impaired financial instruments at initial recognition and not credit-impaired financial instruments without a significant increase in credit risk (SICR) since initial recognition, irrespective of their credit quality, or subject to the ‘low risk exemption’ allowed by IFRS 9. Financial instruments in Stage 1 have their ECL measured at an amount equal to the portion of lifetime expected credit losses that result from default events possible within the next 12 months. Stage 2 includes not credit-impaired financial instruments with a significant increase in credit risk since initial recognition and not subject to the ‘low credit risk exemption’ allowed by IFRS 9. Also, Stage 2 includes trade receivables without significant financing component to which the ‘simplified approach’ is applied mandatorily based on IFRS 9 requirements. In stage 2, the credit loss allowances are calculated as lifetime ECL. In the case of drawings by non-defaulted customers on previously committed credit lines, the whole exposure (on-balance and off-balance) is categorised as either Stage 1 or Stage 2, depending on the development of credit risk between the commitment date and the drawing date. Stage 3 includes financial instruments that are credit-impaired at the reporting date but were not credit-impaired at initial recognition. In prin-ciple, a financial instrument becomes credit-impaired when the customer defaults. The default definition applied in Erste Group has been de-veloped in accordance with EBA/GL/2016/07 ‘Guidelines on the application of the definition of default under Article 178 of Regulation (EU) No 575/2013’ and ‘Commission Delegated Regulation (EU) 2018/171 of 19 October 2017 on supplementing Regulation (EU) No 575/2013 of the European Parliament and of the Council with regard to regulatory technical standards for the materiality threshold for credit obligations past due’. The definition specifies the rules for default contagion across groups of connected clients and clarifies the concept of technical default. Erste Group generally applies a customer view in applying the default definition, which leads to an impairment of all claims even if the customer defaults only on one of several transactions (‘pulling effect’). On the other hand, an upgrade to a non-defaulted rating grade implies that the total exposure ceases to be impaired. In stage 3, credit loss allowances are calculated as lifetime ECLs. POCI includes financial instruments that were credit-impaired at initial recognition, irrespective of whether they are still credit-impaired at the reporting date. Expected credit losses against POCI exposures are always calculated on a lifetime basis (cumulative changes in lifetime ECL since initial recognition), and are reflected in the credit-adjusted effective interest rate at initial recognition. As a result, no loss allow-ance is recognised at inception. Subsequently, only adverse changes in lifetime expected credit losses after the initial recognition are recog-nised as loss allowance, whilst favourable changes are recognised as impairment gains increasing the gross carrying amount of the POCI financial assets. Significant increase in credit risk determination Assessment of significant increase in credit risk (SICR) of financial instruments as at the reporting date since initial recognition is one of the key drivers affecting the amount of the ECL recognised based on IFRS 9 requirements. In this respect, across portfolios and product types, quantitative and qualitative indicators are defined for assessing SICR, including the indicator of 30 days-past-due (DPD). Quantitative criteria. Quantitative SICR indicators include adverse changes in annualised lifetime probability of default and in lifetime probability of default with significance being assessed by reference to a mix of relative and absolute change thresholds. The bank has established thresholds for significant increases in credit risk based on both a percentage (relative) and absolute change in PD compared to initial recognition. In order for the SICR to occur for a particular financial instrument, both the relative and absolute thresholds need to be breached.

53
The relative measure is calculated as a ratio between current annualised PD and annualised PD value on initial recognition. The breach means that such ratio has reached or is higher than the established threshold. These relative thresholds for SICR assessment are established at PD segment level or client rating level for each consolidated entity, as necessary, and are subject to initial and on-going validation. Relative thresholds for SICR assessment by geographical segment
Threshold interval (x times)
Min Max
Mar 21
Austria 1.13 2.37
EBOe & Subs. 1.13 2.37
Savings Banks 1.13 2.37
Other Austria 1.13 2.37
CEE 1.03 4.08
Czech Republic 1.13 3.59
Slovakia 1.13 4.08
Romania 1.13 3.37
Hungary 1.13 3.21
Croatia 1.13 3.13
Serbia 1.03 3.47
Total 1.03 4.08
Dec 20
Austria 1.13 2.37
EBOe & Subs. 1.13 2.37
Savings Banks 1.13 2.37
Other Austria 1.13 2.37
CEE 1.03 4.08
Czech Republic 1.13 3.59
Slovakia 1.13 4.08
Romania 1.13 3.37
Hungary 1.13 3.21
Croatia 1.13 3.13
Serbia 1.03 3.47
Total 1.03 4.08
Thresholds might seem to show high dispersion, but they are driven mainly by regional and rating diversity. Regions with higher credit quality portfolios have lower thresholds than those with lower credit quality portfolios. The minimal threshold in almost all regions of 1.13 refers to sovereign rating classes that are centrally established. The average threshold of the Group is between 2 and 3. There are certain portfolios where SICR quantitative criteria are assessed based on the ratings rather than PDs. The main rule in those cases is that downgrading of the ratings would lead to a positive conclusion on SICR. These rules are applied primarily to leasing and factoring business receivables. Erste Group has not significantly recalibrated relative thresholds since IFRS9 implementation. They are kept stable as one of the most significant estimate in ECL measurement, therefore can be changed as a result of validation or after significant change of PD models. There were reestimations for individual entities and portfolios. For migration back to Stage 1 there are no additional cure periods established for quantitative criteria other than those already established in general credit risk practice (e.g. for rating improvement). The absolute threshold refers to difference of LT PD on initial recognition and current LT PD. It is set to a maximum of 50 bps and serves as a back-stop for migrations between the best ratings (LT PDs considered for remaining maturity). In such cases, relative thresholds may be breached, however overall LT PD is very low, and therefore SICR is not positively concluded. Qualitative criteria. Qualitative SICR indicators include forbearance-type flags (identification of regulatory forbearance), work-out trans-fer flags (when the account starts being monitored by the work-out department), information from the early-warning system (if it is not sufficiently considered in the rating) and fraud indicators. The assignment of some of the qualitative indicators inherently relies on experi-enced credit risk judgment being exercised adequately and in a timely manner. The related group-wide and entity-level credit risk controlling policies and procedures (adapted as necessary in the light of transition to IFRS 9) ensure the necessary governance framework. These

54
indicators are used internally for identification of insolvency or increased probability that a borrower will enter bankruptcy and there is increased risk of default in the foreseeable future. Besides the qualitative indicators defined on a client level, the assessment of a significant increase in credit risk is performed on a portfolio level if the increase in credit risk on individual instruments or at a client level is available only with a certain time lag or is observable exclusively on a portfolio level. We have introduced additional portfolio level SICR assessment criteria due to COVID-19 pandemic and related economic impacts. Please see Covid-19 disclosures starting on page 57. Examples are stage 2 overrides for parts of Swiss franc retail portfolio or in case of high LTV loans resulting from a specific law in Romania (clients are allowed to give up on real estate collateral against waiver of principal). For migration back to Stage 1 there are no additional cure periods established for qualitative criteria other than those already established in general credit risk practice for the above-mentioned flags (forbearance, watch lists). Backstop. A backstop is applied and the financial instruments are considered to have experienced a SICR if the borrower is more than 30 days past due on contractual payments. As observed during validation, this does not represent a major trigger for Stage 2 classification. Low credit risk exemption. The ‘low credit risk exemption’ allowed by IFRS 9 for ‘investment grade’ assets or other assets deemed ‘low risk’ (and resulting in 12 months expected credit losses being calculated irrespective of SICR quantitative measures) has been implemented with limitations in Erste Group. Thus, the potential activation of this exemption is limited to particular types of debt instruments and coun-terparty categories, and only if supported by sufficient ‘low risk’ evidence. On this basis, the ‘low risk exemption’ is applied only occasion-ally to some debt security exposures and only exceptionally to loans. Measuring ECL – explanation of inputs and measurement Credit loss allowances are calculated individually or collectively. The individual calculation approach is applied in case of exposures to significant defaulted customers in Stage 3 or POCI. It consists in the individual assessment of the difference between the gross carrying amount and the present value of the expected cash flows, which are estimated by workout or risk managers. The discounting of the cash flows is based on the effective interest rate (POCI: credit-adjusted effective interest rate). However, the discount rate for financial guarantees shall reflect the current market assessment of the time value of money and the risks that are specific to the cash flows which in Erste Group’s implementation means using a risk free rate as a proxy. A defaulted customer is classified as individually significant if the total on- and off-balance exposure exceeds a predefined materiality limit. Otherwise, the customer is considered insignificant and a rule-based (collective) approach is used for the calculation of the related credit loss allowance as the product of gross carrying amount and LGD, where the LGD depends on characteristics such as time in default or the stage of the workout process. For exposures to non-defaulted customers (i.e. in Stage 1 and Stage 2), collective allowances are calculated according to a rule-based approach irrespective of the significance of the customer. The calculation of collective allowances requires grouping the related exposures into homogenous clusters on the basis of shared risk characteristics. The grouping criteria may differ based on the customer segment (retail, corporate) and include product type, collateral type, repayment type, loan to value band, and credit rating band. The calculation of credit loss allowances is done on a monthly basis on a single exposure level and in the contractual currency of the exposure. To compute the collective credit loss allowance, Erste Group applies an expected credit loss (ECL) model based on a three-stage approach that leads to either a 12-month ECL or to a lifetime ECL. ECL is the discounted product of exposure at default (EAD) that also includes a credit conversion factor in the case of off-balance sheet exposures, probability of default (PD) and loss given default (LGD), defined as follows:
_ PD represents the likelihood of a borrower defaulting on its financial obligation (per definition of default below), either over next 12 months (1Y PD) for Stage 1 exposures or over the remaining lifetime (LT PD) for Stage 2 and 3 and POCI exposures.
_ EAD is based on the amounts Erste Group expects to be owed at the time of default, over next 12 months (1Y EAD) for Stage 1 exposures, or over the remaining lifetime (LT EAD) for Stage 2 and 3 and POCI exposures. The estimation includes current balance, expected repayments and expected drawings up to the current contractual limit by the time of default.
_ LGD represents the Erste Group’s expectation of the extent of loss on a defaulted exposure. LGD varies by type of counterparty, type and seniority of claim and availability of collateral or other credit support. LGD is expressed as a percentage loss per unit exposure at the time of default (EAD).

55
Life-time parameters The LT PD is developed through observation of historical defaults from initial recognition through the life-time of the loans. It is assumed to be the same across all assets in the same portfolio and rating band. The 1Y and LT EADs are determined based on the expected payment profiles, which vary by product type. The LT EAD calculation utilises repayment schedule or repayment type (annuity, linear, bullet). In the case of undrawn commitments, credit conversion factor is estimated for reflecting the expected credit exposure in the EAD. The LGD is estimated as a lifetime curve for any point in time, based on historical loss observations. The risk parameters used in the ECL calculation take into account available information at the reporting date about past events, current conditions and forecasts on future economic trends. Generally, the risk parameters applied in the calculation of collective allowances differ from the risk parameters compliant with capital requirement regulations, calculated on a through-the-cycle basis, if the characteristics of the respective portfolio in combination with IFRS standards necessitate this. Incorporation of forward-looking information Parameters are determined to reflect the risk as a ‘point-in-time’ measure and with consideration of forward-looking information (FLI). This results in using a baseline forecast and a number of alternative scenarios for selected macroeconomic variables. The alternative scenarios are derived, together with their probabilities of occurrence, as a deviation from baseline forecasts, where the baseline forecasts are, with a few exceptions, internally determined by Erste Group’s research department. Given multiple scenarios, the ‘neutral’ PDs (and, with a few excep-tions, also LGDs) are adjusted using macro models that link relevant macroeconomic variables with risk drivers. The same macro-shift models as for external and internal stress test are used. Forward-looking information is incorporated for first three years of ECL measurement. Meas-urement of the parameters for the remaining lifetime returns back to through-the-cycle observations immediately in year four. Specific situation of the Covid-19 pandemic and extensive supporting measures, mainly moratoria, lead to the lagging of the macroeconomic reflection in credit risk parameters. Therefore, macroeconomic variables of 2020 were included as additional predictors for future values of credit risk parameters. Variables in year 2020 have same values across all three scenarios. Thus, the unbiased probability-weighted ECL considering FLI is derived using the weights representing the probability of occurrence of each macroeconomic scenario. Typical macroeconomic variables may include real gross domestic product, unemployment rate, inflation rate, production index as well as market interest rates. The selection of variables also depends on the availability of reliable forecasts for the given local market. Nevertheless, the main indication of estimated economic development is the GDP development. We are disclosing sensitivity of the staging and ECL on macro scenarios in the Covid-19 section below. Although mildly positive signs in development of macroeconomic variables were observed in 2021, for parameter estimation the FLI shifts calculated based on the December 2020 scenarios, weights and GDP values as well, are applied also in March 2021.

56
Baseline, upside and downside scenarios of GDP growth by geographical segment
Probability weights GDP growth in %
Scenario 2021-2023 2020 2021 2022 2023
Dec 20
Upside 1% -7.6 5.0 3.9 3.3
Austria Baseline 40% -7.6 3.4 2.3 1.7
Downside 59% -7.6 -2.1 1.0 -0.1
Upside 4% -7.7 5.5 7.3 6.4
Czech Republic Baseline 40% -7.7 3.9 5.7 4.8
Downside 56% -7.7 -1.7 1.2 1.7
Upside 25% -7.1 8.2 6.7 6.4
Slovakia Baseline 35% -7.1 6.0 4.5 4.2
Downside 40% -7.1 -1.2 -0.0 0.9
Upside 18% -5.9 5.3 7.1 7.3
Romania Baseline 40% -5.9 2.7 4.5 4.7
Downside 42% -5.9 -3.6 -0.2 1.9
Upside 6% -6.4 5.1 6.6 5.2
Hungary Baseline 40% -6.4 3.9 5.4 4.0
Downside 54% -6.4 -1.3 1.6 2.0
Upside 8% -9.9 8.2 9.0 9.1
Croatia Baseline 40% -9.9 5.2 3.6 4.0
Downside 52% -9.9 -2.5 -1.4 0.9
Upside 15% -1.3 6.3 5.3 5.8
Serbia Baseline 40% -1.3 5.0 4.0 4.5
Downside 45% -1.3 -0.5 0.9 2.6
The growth rates for the year 2020 correspond to estimated values. In order to reflect on the higher volatility of macro-economic variables estimates and significantly higher downward risk of macro-economic recovery due to current developments of the Covid-19 pandemics we have introduced a conservative downside scenario with relatively high probability of occurrence as shown in the GDP overview table above. Covid-19 The Covid-19 pandemic has been causing high uncertainty in the global economy and on the global markets. Social distancing rules and lockdown restrictions imposed by governments led to economic slow-down and a significant drop of revenues across industries. Unprece-dented state aid packages (e.g. state guarantees, bridge financing, the state temporarily paying workers’ salaries to avoid redundancies, hardship funds for one-person and micro businesses) and moratoria programs were introduced in all of Erste Group’s core markets to support citizens and companies. While such measures mitigate the negative economic effects, they complicate a timely reflection of a potential deterioration of the loan portfolios. Effect on customers Immediately upon the crisis showing severe economic impacts in our region (governmental decisions on lockdowns in countries of Erste Group perimeter), initiatives were started aiming to, on the one hand support Erste Group´s clients to the utmost extent, and on the other hand, manage the respective risks and bearing the responsibility of Erste Group towards all stakeholders in mind. The measures differed from country to country as they had to be based on the legislative steps taken by the respective governments. Nev-ertheless, Erste Group gave a guidance to the entities in respect of underwriting, reporting and classification processes. Whereas overall valid state-moratoria were applied only in some countries, as e.g. in Hungary and Serbia, other measures like short-term deferrals or financial support schemes with public or state guarantees were offered in all countries. In addition to programmes with standard parameters that were defined at a very early stage of the crisis and should support an efficient processing, also individual solutions were agreed with clients that did not meet all predefined requirements.

57
Credit risk exposure of non-financial corporations by industry – measures applied in response to the Covid-19 crisis
in EUR million Loans and advances
subject to EBA-compliant moratoria
Other loans and advances subject to Covid-19-related
forbearance measures
Newly originated loans and advances subject to public guarantee schemes
in the context of Covid-19
Mar 21
Agriculture and forestry 7 3 41
Mining 5 - 7
Manufacturing 37 10 634
Energy and water supply 7 - 19
Construction 11 9 143
Trade 53 9 499
Transport and communication 64 6 297
Hotels and restaurants 370 43 187
Financial and insurance services 4 - 0
Real estate and housing 179 38 16
Services 53 4 190
Public administration 0 - -
Education, health and art 8 0 44
Total 797 122 2,079
Dec 20
Agriculture and forestry 54 1 31
Mining 0 - 5
Manufacturing 274 15 514
Energy and water supply 9 - 19
Construction 45 12 125
Trade 116 22 416
Transport and communication 96 4 235
Hotels and restaurants 497 17 164
Financial and insurance services 17 - 0
Real estate and housing 369 63 14
Services 90 1 181
Public administration 0 - -
Education, health and art 17 18 35
Total 1,583 155 1,739
Loans and advances of non-financial corporations to which measures applied in the response to Covid-19 were granted and are currently valid (have not expired) amounted to EUR 2,998 million (31 December 2020: EUR 3,477 million). The manufacturing and the hotels and restaurants industries, followed by trade and real estate and housing, accounted for the highest volumes. Loans and advances of households to which the measures applied in the response to Covid-19 were granted and are currently valid (have not expired), amounted to EUR 916 million (EUR 3,270 million). Besides the measures disclosed in the table above, additional measures that do not meet the forbearance criteria amounting to EUR 5,491 million (EUR 3,582 million) were approved as a direct response to the Covid-19 crisis. Effect on business In March 2020, risk management and business divisions started a joint initiative aiming to quickly provide a harmonised guidance for a focused industry approach within Erste Group, reflecting the changed economic environment. Industries and sub-industries were categorised into critical, high, medium or low risk according to the expected impacts from Covid-19 based on a combination of research material, feedback collected from client meetings and single name analyses, both centrally as well as in the entities. Main driver for assigning an industry classification was the assessment of impacts of the crisis on the specific (sub)industry. The classifica-tions are regularly reviewed on a 12-month rolling forecast basis to take current developments into account. A respective business and risk strategy for the (sub)industries was formulated based on the assessment. The assessed risk for the specific (sub)industry can lead to strategic recommendations (e.g. to temporarily limit financing for specific categories to existing clients only) and/or the revision of underwriting standards. This approach was aligned with all affected entities and business lines and approved by the respective governance bodies of Erste Group. Exposures in particular industries that belong to critical or high risk sub-industries are referred to as significant risk in the following tables.

58
Credit risk exposure and credit loss allowances by industry and IFRS9 treatment – industry heatmap
in EUR million Stage 1 Stage 2 Stage 3 POCI
Credit risk exposure
(AC and FVOCI)
Not subject to IFRS 9
impairment Total Credit loss allowances
Mar 21
Agriculture and forestry 2,601 588 123 5 3,318 45 3,363 -100
of which significant risk 6 7 0 - 13 0 13 -0
Mining 569 43 14 5 631 180 811 -19
of which significant risk 55 1 0 - 57 2 58 -0
Manufacturing 13,849 5,215 614 47 19,726 1,418 21,144 -593
of which significant risk 3,236 3,547 295 30 7,109 479 7,588 -291
Energy and water supply 3,975 577 57 6 4,615 191 4,806 -98
of which significant risk 18 4 0 - 22 0 23 -0
Construction 9,466 1,764 278 15 11,523 1,700 13,223 -316
of which significant risk 31 18 3 0 52 4 56 -3
Trade 9,576 3,815 454 44 13,888 1,087 14,976 -432
of which significant risk 1,910 2,204 199 10 4,323 174 4,497 -176
Transport and communication 5,681 2,131 178 16 8,006 261 8,268 -174
of which significant risk 567 1,162 25 8 1,762 17 1,779 -46
Hotels and restaurants 1,282 4,158 329 29 5,798 73 5,871 -287
of which significant risk 1,217 4,103 314 29 5,663 73 5,736 -275
Financial and insurance services 39,906 1,428 29 11 41,374 5,058 46,432 -105
Real estate and housing 26,539 5,652 254 129 32,573 846 33,419 -385
of which significant risk 229 437 22 0 688 13 701 -26
Services 9,445 4,174 462 6 14,087 790 14,877 -413
of which significant risk 1,854 2,809 337 6 5,006 185 5,191 -254
Public administration 39,934 624 1 2 40,562 3,476 44,038 -45
Education, health and art 2,648 934 94 1 3,677 96 3,773 -97
of which significant risk 281 473 55 0 810 43 853 -59
Private households 72,766 8,313 1,544 113 82,737 1,006 83,742 -1,461
Other 338 4 0 0 342 63 405 -1
Total 238,574 39,422 4,431 430 282,857 16,292 299,149 -4,528
Dec 20
Agriculture and forestry 2,550 593 122 5 3,270 19 3,289 -101
of which significant risk 6 8 0 - 14 0 14 -0
Mining 544 64 16 2 626 207 832 -20
of which significant risk 382 10 8 2 401 199 601 -13
Manufacturing 13,658 4,914 585 46 19,202 1,023 20,226 -587
of which significant risk 3,838 3,264 268 22 7,392 434 7,826 -278
Energy and water supply 4,054 577 56 8 4,695 198 4,893 -97
of which significant risk 0 3 - - 3 0 3 -0
Construction 9,330 1,789 279 16 11,414 1,231 12,645 -320
of which significant risk 23 13 4 0 40 2 43 -3
Trade 9,251 3,758 472 44 13,525 1,019 14,544 -441
of which significant risk 2,169 2,244 193 10 4,617 213 4,830 -172
Transport and communication 5,759 1,993 196 4 7,952 361 8,313 -182
of which significant risk 977 1,192 29 1 2,199 60 2,259 -48
Hotels and restaurants 1,281 3,977 331 29 5,618 79 5,697 -271
of which significant risk 1,225 3,933 312 29 5,500 73 5,573 -255
Financial and insurance services 32,797 1,714 30 12 34,551 5,060 39,611 -110
Real estate and housing 25,893 5,824 262 129 32,108 857 32,965 -390
of which significant risk 242 340 17 0 599 4 603 -21
Services 9,461 3,976 488 5 13,930 745 14,675 -426
of which significant risk 2,395 2,688 341 5 5,430 173 5,603 -263
Public administration 38,571 560 1 3 39,135 3,235 42,370 -25
Education, health and art 2,604 932 102 1 3,638 38 3,677 -99
of which significant risk 280 465 60 0 806 8 814 -58
Private households 71,994 7,967 1,541 116 81,619 784 82,403 -1,452
Other 452 19 0 0 471 88 558 -1
Total 228,200 38,655 4,480 419 271,754 14,945 286,699 -4,522

59
Effect on Expected Credit Loss As described above, an increase of the ECL might result from a re-assessment of the credit risk parameters and a migration to worse stages either via significant increase in credit risk (SICR) or a default. We have concluded so far that the majority of moratoria introduced in our core markets due to the Covid-19 pandemic fulfil the conditions as defined in the EBA guidelines published during the year 2020. Relief offered to credit owners thus did not result in an automatic transfers from Stage 1 to Stage 2. However, Erste Group continues to perform individual assessments whether there are other circumstances that would lead to forbearance or default classification. We have re-assessed credit risk parameters based on the new macro-scenarios FLI overlay in December 2020. We continued in monitoring of the macro and macro-prediction development in order to reflect up-to-date information in our credit risk parameters. GDP scenarios and weights are shown in the table displayed within Incorporation of forward looking information section above. The effect of the FLI in the ECL calculation as of 31 March 2021 amounted to EUR 536 million. The increase of EUR 419 million (thereof EUR 9 million in the first quarter of 2021) in comparison with EUR 117 million as of 31 December 2019 can be directly attributed to the Covid-19 situation. Erste Group has addressed expected SICR by introducing Covid-19 portfolio overlays. We divided the portfolio in private individuals (PIs) and non-private individuals (non-PIs) and assessed the customers by taking into account any Covid-19 related relief measure granted as well as the internal industry heat-map and corresponding customer-specific one-year IFRS PD levels. Based on this assessment and indi-vidual reviews, customers were migrated to stage 2, i.e. lifetime ECL measure. The industry heat map and the portfolio overlays are subject to regular reviews. The effect of Covid-19 portfolio overlays in the ECL calculation as of 31 March 2021 amounted to EUR 241 million. Erste Group will assess releases of Covid-19 portfolio overlays for PI portfolios once the moratoria are lifted. When moratoria do no longer distort DPD information, behavioural scoring will allow an unbiased SICR assessment. In case of non-PI portfolios, release of the overlays will be assessed after expiration of the measures enables a proper re-rating. Release will follow in combination with a consistent improve-ment of the macro indicators. Erste Group expects an increase in defaults especially after state aid measures, in particular moratoria, are lifted. The analysis tables below present staging splits of the current performing exposure and ECL. Movements of exposures between performing stages and resulting changes in ECL triggered by effect of Covid-19 SICR overlays and FLI macro overlays is shown. Effects on industry segments, high risk industry subsegments and geographical segment are disclosed. Analysis shows that out of a EUR 39,422 million exposure in Stage 2 EUR 14,557 million were migrated due to Covid-19 overlays, resulting in an increase of ECL of 241 million. Further EUR 5,414 million were migrated to Stage 2 due to FLI overlay, resulting in an ECL increase of EUR 419 million (the difference between the FLI effect of EUR 536 million as of 31 March 2021 and EUR 117 million as of 31 December 2019). For the ECL change a positive sign (+) equals a release while a negative sign (-) equals an allocation. Values presented as sensitivities are results of internal simulations.

60
Forward looking information (FLI) and stage overlays due to the Covid-19 pandemic Impact on credit risk exposure by geographical segment
Current status - parameters (FLI shifted)
Effect of stage overlays due to Covid-19 Effect of FLI shifts
in EUR million Stage 1 Stage 2 Stage 1 Stage 2 Stage 1 Stage 2
Mar 21
Austria 118,202 26,584 +9,509.2 -9,509.2 +4,087.8 -4,087.8
EBOe & Subs. 38,304 7,633 +2,605.6 -2,605.6 +1,134.6 -1,134.6
Savings Banks 55,364 12,975 +5,006.1 -5,006.1 +1,920.2 -1,920.2
Other Austria 24,535 5,977 +1,897.5 -1,897.5 +1,032.9 -1,032.9
CEE 113,628 12,726 +5,047.9 -5,047.9 +1,325.9 -1,325.9
Czech Republic 61,503 5,046 +1,595.4 -1,595.4 +557.2 -557.2
Slovakia 17,410 2,796 +1,698.7 -1,698.7 +106.1 -106.1
Romania 13,811 2,395 +820.0 -820.0 +451.1 -451.1
Hungary 9,128 1,046 +379.0 -379.0 +148.9 -148.9
Croatia 9,642 1,248 +439.6 -439.6 +49.0 -49.0
Serbia 2,134 196 +115.2 -115.2 +13.6 -13.6
Other 6,744 111 +0.0 +0.0 +0.0 +0.0
Total 238,574 39,422 +14,557.1 -14,557.1 +5,413.7 -5,413.7
Dec 20
Austria 114,235 26,033 +9,496.9 -9,496.9 +4,519.9 -4,519.9
EBOe & Subs. 37,174 7,633 +2,635.1 -2,635.1 +1,305.2 -1,305.2
Savings Banks 53,972 12,669 +5,007.5 -5,007.5 +2,042.6 -2,042.6
Other Austria 23,089 5,731 +1,854.4 -1,854.4 +1,172.1 -1,172.1
CEE 107,204 12,351 +4,922.6 -4,922.6 +1,363.7 -1,363.7
Czech Republic 56,144 4,793 +1,576.0 -1,576.0 +534.2 -534.2
Slovakia 17,413 2,709 +1,535.5 -1,535.5 +103.1 -103.1
Romania 13,775 2,430 +793.4 -793.4 +480.2 -480.2
Hungary 8,307 919 +468.0 -468.0 +162.2 -162.2
Croatia 9,468 1,317 +455.8 -455.8 +66.7 -66.7
Serbia 2,098 183 +93.9 -93.9 +17.3 -17.3
Other 6,760 271 +0.0 +0.0 +0.0 +0.0
Total 228,200 38,655 +14,419.5 -14,419.5 +5,883.6 -5,883.6
Impact on credit loss allowances by geographical segment
Current status - parameters (FLI shifted)
Effect of stage overlays due to Covid-19 Effect of FLI shifts
in EUR million Stage 1 Stage 2 Stage 1 Stage 2 Stage 1 Stage 2
Mar 21
Austria -190 -696 -43.5 +157.3 +72.1 +199.5
EBOe & Subs. -42 -154 -9.7 +39.4 +18.1 +38.4
Savings Banks -118 -382 -28.0 +92.7 +43.7 +98.0
Other Austria -30 -160 -5.9 +25.3 +10.3 +63.2
CEE -281 -748 -64.7 +191.6 +100.0 +164.4
Czech Republic -101 -261 -20.3 +48.1 +42.5 +57.9
Slovakia -34 -139 -15.0 +52.9 +13.6 +7.6
Romania -53 -178 -13.0 +41.3 +6.5 +57.2
Hungary -23 -70 -4.4 +14.1 +12.2 +31.1
Croatia -59 -86 -9.8 +29.6 +21.6 +8.5
Serbia -12 -13 -2.2 +5.6 +3.5 +2.1
Other -1 -2 +0.0 +0.0 +0.0 +0.0
Total -472 -1,445 -108.2 +349.0 +172.1 +363.9
Dec 20
Austria -183 -685 -43.6 +158.4 +68.6 +202.3
EBOe & Subs. -41 -152 -10.2 +39.8 +17.8 +39.1
Savings Banks -119 -371 -28.6 +95.2 +42.9 +94.2
Other Austria -23 -162 -4.8 +23.4 +7.8 +69.0
CEE -280 -737 -66.0 +196.2 +97.6 +159.1
Czech Republic -100 -252 -20.6 +50.4 +40.9 +56.3
Slovakia -35 -140 -13.7 +51.4 +12.7 +3.1
Romania -53 -183 -12.9 +39.7 +6.2 +62.1
Hungary -22 -64 -6.5 +19.1 +14.3 +25.6
Croatia -57 -86 -10.2 +30.5 +20.2 +9.6
Serbia -12 -13 -2.1 +5.2 +3.3 +2.5
Other -1 -1 +0.0 +0.0 +0.0 +0.0
Total -464 -1,424 -109.5 +354.6 +166.2 +361.4

61
Impact on credit risk exposure by industry
Current status - parameters (FLI shifted)
Effect of stage overlays due to Covid-19 Effect of FLI shifts
in EUR million Stage 1 Stage 2 Stage 1 Stage 2 Stage 1 Stage 2
Mar 21
Agriculture and forestry 2,601 588 +142.0 -142.0 +84.8 -84.8
of which significant risk 6 7 +1.0 -1.0 +0.0 -0.0
Mining 569 43 +17.9 -17.9 +7.2 -7.2
of which significant risk 55 1 +5.1 -5.1 +0.0 +0.0
Manufacturing 13,849 5,215 +3,253.6 -3,253.6 +605.4 -605.4
of which significant risk 3,236 3,547 +2,756.6 -2,756.6 +232.1 -232.1
Energy and water supply 3,975 577 +18.5 -18.5 +90.7 -90.7
of which significant risk 18 4 +0.0 +0.0 +0.0 +0.0
Construction 9,466 1,764 +197.1 -197.1 +845.5 -845.5
of which significant risk 31 18 +11.2 -11.2 +0.6 -0.6
Trade 9,576 3,815 +1,934.8 -1,934.8 +340.6 -340.6
of which significant risk 1,910 2,204 +1,671.5 -1,671.5 +65.0 -65.0
Transport and communication 5,681 2,131 +1,022.9 -1,022.9 +189.3 -189.3
of which significant risk 567 1,162 +827.7 -827.7 +6.2 -6.2
Hotels and restaurants 1,282 4,158 +2,974.6 -2,974.6 +38.0 -38.0
of which significant risk 1,217 4,103 +2,937.9 -2,937.9 +37.6 -37.6
Financial and insurance services 39,906 1,428 +54.4 -54.4 +72.9 -72.9
Real estate and housing 26,539 5,652 +1,397.0 -1,397.0 +1,792.7 -1,792.7
of which significant risk 229 437 +333.5 -333.5 +15.0 -15.0
Services 9,445 4,174 +1,980.0 -1,980.0 +171.1 -171.1
of which significant risk 1,854 2,809 +1,947.0 -1,947.0 +86.3 -86.3
Public administration 39,934 624 +5.9 -5.9 +212.2 -212.2
Education, health and art 2,648 934 +579.7 -579.7 +147.8 -147.8
of which significant risk 281 473 +332.9 -332.9 +56.8 -56.8
Households 72,766 8,313 +978.8 -978.8 +814.2 -814.2
Other 338 4 +0.0 +0.0 +1.3 -1.3
Total 238,574 39,422 +14,557.1 -14,557.1 +5,413.7 -5,413.7
Dec 20
Agriculture and forestry 2,550 593 +145.9 -145.9 +88.3 -88.3
of which significant risk 6 8 +0.4 -0.4 +0.0 -0.0
Mining 544 64 +16.4 -16.4 +8.7 -8.7
of which significant risk 382 10 +5.9 -5.9 +0.1 -0.1
Manufacturing 13,658 4,914 +3,199.3 -3,199.3 +1,020.0 -1,020.0
of which significant risk 3,838 3,264 +2,737.2 -2,737.2 +236.2 -236.2
Energy and water supply 4,054 577 +6.5 -6.5 +84.7 -84.7
of which significant risk 0 3 +0.0 +0.0 +0.0 +0.0
Construction 9,330 1,789 +186.3 -186.3 +848.6 -848.6
of which significant risk 23 13 +103.6 -103.6 +0.0 +0.0
Trade 9,251 3,758 +1,861.1 -1,861.1 +386.5 -386.5
of which significant risk 2,169 2,244 +1,600.7 -1,600.7 +72.0 -72.0
Transport and communication 5,759 1,993 +1,178.8 -1,178.8 +201.2 -201.2
of which significant risk 977 1,192 +989.0 -989.0 +10.8 -10.8
Hotels and restaurants 1,281 3,977 +2,935.3 -2,935.3 +100.9 -100.9
of which significant risk 1,225 3,933 +2,898.5 -2,898.5 +100.9 -100.9
Financial and insurance services 32,797 1,714 +13.0 -13.0 +137.3 -137.3
Real estate and housing 25,893 5,824 +1,415.7 -1,415.7 +1,715.3 -1,715.3
of which significant risk 242 340 +240.3 -240.3 +6.1 -6.1
Services 9,461 3,976 +1,916.4 -1,916.4 +173.4 -173.4
of which significant risk 2,395 2,688 +1,891.4 -1,891.4 +92.6 -92.6
Public administration 38,571 560 +1.3 -1.3 +253.8 -253.8
Education, health and art 2,604 932 +572.5 -572.5 +117.7 -117.7
of which significant risk 280 465 +336.0 -336.0 +7.6 -7.6
Households 71,994 7,967 +971.0 -971.0 +745.7 -745.7
Other 452 19 +0.0 -0.0 +1.4 -1.4
Total 228,200 38,655 +14,419.5 -14,419.5 +5,883.6 -5,883.6

62
Impact on credit loss allowances by industry
Current status - parameters (FLI shifted)
Effect of stage overlays due to Covid-19 Effect of FLI shifts
in EUR million All stages Stage 1 Stage 2 Stage 1 Stage 2
Mar 21
Agriculture and forestry -100 -2.3 +5.5 +4.6 +15.4
of which significant risk -0 -0.0 +0.0 +0.1 +0.2
Mining -19 -0.1 +0.3 +0.2 +0.3
of which significant risk -0 -0.0 +0.1 +0.1 +0.0
Manufacturing -593 -25.3 +62.8 +23.1 +60.0
of which significant risk -291 -19.2 +47.8 +11.1 +29.3
Energy and water supply -98 -0.2 +0.7 +7.5 +7.9
of which significant risk -0 +0.0 +0.0 +0.0 +0.0
Construction -316 -1.5 +4.1 +14.0 +29.2
of which significant risk -3 -0.1 +0.2 +0.3 +0.3
Trade -432 -15.5 +36.2 +17.7 +29.1
of which significant risk -176 -11.5 +26.6 +7.3 +10.1
Transport and communication -174 -7.3 +26.8 +9.1 +16.8
of which significant risk -46 -4.8 +20.0 +3.0 +3.9
Hotels and restaurants -287 -20.1 +77.8 +10.4 +17.1
of which significant risk -275 -20.0 +77.0 +10.3 +17.0
Financial and insurance services -105 -0.2 +0.5 +6.8 +6.1
Real estate and housing -385 -10.8 +44.7 +24.0 +45.9
of which significant risk -26 -2.6 +10.7 +1.3 +1.2
Services -413 -8.7 +32.9 +7.1 +16.8
of which significant risk -254 -8.3 +31.9 +4.0 +9.0
Public administration -45 -0.0 +0.0 +0.3 +0.3
Education, health and art -97 -3.4 +10.5 +4.2 +10.2
of which significant risk -59 -1.9 +6.0 +1.9 +4.8
Households -1,461 -12.8 +46.1 +42.9 +107.9
Other -1 +0.0 +0.0 +0.2 +0.8
Total -4,528 -108.2 +349.0 +172.1 +363.9
Dec 20
Agriculture and forestry -101 -2.4 +5.3 +4.4 +15.9
of which significant risk 0 -0.0 +0.0 +0.1 +0.0
Mining -20 -0.1 +0.3 +0.3 +0.4
of which significant risk -13 -0.0 +0.1 +0.2 +0.1
Manufacturing -587 -26.2 +64.8 +20.9 +65.2
of which significant risk -278 -20.6 +51.4 +11.7 +22.4
Energy and water supply -97 -0.1 +0.2 +5.4 +8.2
of which significant risk 0 +0.0 +0.0 +0.0 +0.0
Construction -320 -1.7 +4.5 +12.6 +29.4
of which significant risk -3 -0.7 +1.1 +0.4 +0.2
Trade -441 -14.0 +35.1 +16.3 +29.7
of which significant risk -172 -9.6 +25.3 +6.2 +10.3
Transport and communication -182 -6.9 +26.9 +8.3 +15.8
of which significant risk -48 -4.5 +20.0 +2.8 +3.4
Hotels and restaurants -271 -19.1 +72.5 +9.7 +15.7
of which significant risk -255 -18.9 +71.7 +9.6 +15.7
Financial and insurance services -110 -0.1 +0.4 +5.8 +8.5
Real estate and housing -390 -10.8 +44.5 +24.1 +46.0
of which significant risk -21 -1.8 +7.6 +0.1 +0.2
Services -426 -8.7 +32.0 +7.2 +15.0
of which significant risk -263 -8.5 +31.4 +4.1 +8.2
Public administration -25 -0.0 +0.0 +2.7 +0.3
Education, health and art -99 -7.5 +18.8 +18.8 +22.2
of which significant risk -58 -1.9 +6.1 +2.2 +2.4
Households -1,452 -11.9 +49.2 +29.5 +88.1
Other -1 -0.0 +0.0 +0.2 +0.9
Total -4,522 -109.5 +354.6 +166.2 +361.4

63
The following tables present sensitivity analyses taking into consideration only changes due to the different values of PDs according to the baseline, upside and downside FLI scenarios. Covid-19 SICR overlays are ignored. Sensitivities of these particular scenarios are calculated in comparison to current production - weighted scenarios FLI shifted - PDs (weights and scenarios are disclosed in the “Incorporation of forward-looking information” section above). The staging and ECL results if each baseline, upside or downside scenario were of 100% weight are shown in industry and geographical segmentation. The analyses confirm that the FLI macro shift due to the Covid-19 induced macro situation is comparable in both exposure and ECL as of 31 December 2020 and as of 31 March 2021. Credit risk exposure in an amount of EUR 5,414 million was in Stage 2 due to the FLI shift as of 31 March 2021 compared to EUR 5,884 million as of 31 December 2020. The ECL increased by EUR 9 million to EUR 536 million as of 31 March 2021 from EUR 527 million as of 31 December 2020. Our conservative probability weighted scenario results in higher Stage 2 migrations than the pure baseline scenario. That would lead to a decrease of Stage 2 exposure by EUR 1,710 million resulting in an ECL drop by EUR 98 million (EUR 104 million release from stage 2 and EUR 6 million allocation in Stage 1). The downside scenario would lead to additional EUR 1,783 million of exposure migration to Stage 2, resulting in ECL increase of EUR 104 million. Differences between the scenarios are rather mild. The biggest effect is caused by the incorporation of the 2020 macroeconomic variables relating to the Covid-19 induced crisis into the scenarios. These variables are however taken into account in each scenario with the same value. The differences among the scenarios are therefore caused by differences in the recovery estimates for the years 2021-2023. Scenario analysis – Different probabilities of default (PD) Impact of different scenarios on credit risk exposure by geographical segment
Point in time (effect of FLI shifts) Upside scenario Baseline scenario Downside scenario
in EUR million Stage 1 Stage 2 Stage 1 Stage 2 Stage 1 Stage 2 Stage 1 Stage 2
Mar 21
Austria +4,087.8 -4,087.8 +2,096.5 -2,096.5 +1,318.1 -1,318.1 -1,284.5 +1,284.5
EBOe & Subs. +1,134.6 -1,134.6 +582.3 -582.3 +437.1 -437.1 -293.8 +293.8
Savings Banks +1,920.2 -1,920.2 +847.4 -847.4 +575.6 -575.6 -474.7 +474.7
Other Austria +1,032.9 -1,032.9 +666.7 -666.7 +305.5 -305.5 -515.9 +515.9
CEE +1,325.9 -1,325.9 +762.0 -762.0 +391.3 -391.3 -498.2 +498.2
Czech Republic +557.2 -557.2 +398.8 -398.8 +229.2 -229.2 -177.4 +177.4
Slovakia +106.1 -106.1 +7.4 -7.4 +3.4 -3.4 -5.3 +5.3
Romania +451.1 -451.1 +305.9 -305.9 +127.3 -127.3 -227.3 +227.3
Hungary +148.9 -148.9 +22.5 -22.5 +11.7 -11.7 -44.6 +44.6
Croatia +49.0 -49.0 +22.1 -22.1 +15.9 -15.9 -20.5 +20.5
Serbia +13.6 -13.6 +5.3 -5.3 +3.9 -3.9 -23.2 +23.2
Other +0.0 +0.0 +0.0 +0.0 +0.0 +0.0 +0.0 +0.0
Total +5,413.7 -5,413.7 +2,858.5 -2,858.5 +1,709.5 -1,709.5 -1,782.7 +1,782.7
Dec 20
Austria +4,519.9 -4,519.9 +2,187.5 -2,187.5 +1,537.0 -1,537.0 -1,131.9 +1,131.9
EBOe & Subs. +1,305.2 -1,305.2 +730.6 -730.6 +569.4 -569.4 -269.3 +269.3
Savings Banks +2,042.6 -2,042.6 +911.6 -911.6 +597.5 -597.5 -509.4 +509.4
Other Austria +1,172.1 -1,172.1 +545.4 -545.4 +370.1 -370.1 -353.2 +353.2
CEE +1,363.7 -1,363.7 +688.1 -688.1 +330.0 -330.0 -458.1 +458.1
Czech Republic +534.2 -534.2 +305.0 -305.0 +164.1 -164.1 -164.1 +164.1
Slovakia +103.1 -103.1 +8.5 -8.5 +4.8 -4.8 -5.3 +5.3
Romania +480.2 -480.2 +315.0 -315.0 +129.2 -129.2 -247.6 +247.6
Hungary +162.2 -162.2 +20.6 -20.6 +9.2 -9.2 -8.0 +8.0
Croatia +66.7 -66.7 +30.5 -30.5 +15.9 -15.9 -15.0 +15.0
Serbia +17.3 -17.3 +8.5 -8.5 +6.8 -6.8 -18.1 +18.1
Other +0.0 +0.0 +0.0 +0.0 +0.0 +0.0 +0.0 +0.0
Total +5,883.6 -5,883.6 +2,875.7 -2,875.7 +1,867.1 -1,867.1 -1,590.0 +1,590.0

64
Impact of different scenarios on credit loss allowances by geographical segment
Point in time (effect of FLI shifts) Upside scenario Baseline scenario Downside scenario
in EUR million Stage 1 Stage 2 Stage 1 Stage 2 Stage 1 Stage 2 Stage 1 Stage 2
Mar 21
Austria +72.1 +199.5 -11.3 +99.5 -7.3 +66.0 +6.5 -55.3
EBOe & Subs. +18.1 +38.4 -2.3 +19.2 -1.4 +12.6 +1.3 -9.4
Savings Banks +43.7 +98.0 -5.5 +43.6 -3.3 +27.6 +3.3 -23.9
Other Austria +10.3 +63.2 -3.5 +36.7 -2.5 +25.9 +2.0 -22.0
CEE +100.0 +164.4 +1.5 +66.3 +1.6 +37.6 -2.6 -52.4
Czech Republic +42.5 +57.9 +0.1 +29.1 +0.5 +19.5 -0.9 -15.4
Slovakia +13.6 +7.6 +2.6 +1.9 +1.5 +1.0 -2.9 -1.9
Romania +6.5 +57.2 -2.9 +28.8 -1.2 +13.3 +1.7 -27.1
Hungary +12.2 +31.1 -0.4 +2.8 -0.2 +1.4 +0.6 -4.3
Croatia +21.6 +8.5 -0.7 +3.1 -0.5 +2.1 +0.6 -2.5
Serbia +3.5 +2.1 +2.8 +0.6 +1.7 +0.3 -1.7 -1.2
Other +0.0 +0.0 +0.0 +0.0 +0.0 +0.0 +0.0 +0.0
Total +172.1 +363.9 -9.8 +165.8 -5.6 +103.7 +4.0 -107.7
Dec 20
Austria +68.6 +202.3 -11.8 +100.8 -7.5 +66.2 +6.2 -52.6
EBOe & Subs. +17.8 +39.1 -2.8 +20.6 -2.0 +14.2 +1.7 -10.1
Savings Banks +42.9 +94.2 -6.2 +43.6 -3.4 +26.7 +3.4 -24.5
Other Austria +7.8 +69.0 -2.9 +36.7 -2.1 +25.3 +1.1 -18.1
CEE +97.6 +159.1 +2.4 +64.8 +1.9 +36.3 -2.6 -51.3
Czech Republic +40.9 +56.3 +1.5 +25.4 +1.0 +17.4 -0.2 -16.3
Slovakia +12.7 +3.1 +2.8 +1.8 +1.6 +1.0 -3.2 -1.7
Romania +6.2 +62.1 -3.2 +30.7 -1.5 +14.3 +1.8 -29.3
Hungary +14.3 +25.6 -0.4 +2.3 -0.2 +1.2 +0.2 -0.9
Croatia +20.2 +9.6 -1.0 +3.9 -0.5 +2.1 +0.4 -1.8
Serbia +3.3 +2.5 +2.6 +0.6 +1.5 +0.4 -1.6 -1.2
Other +0.0 +0.0 +0.0 +0.0 +0.0 +0.0 +0.0 +0.0
Total +166.2 +361.4 -9.4 +165.6 -5.6 +102.5 +3.6 -103.9

65
Impact of different scenarios on credit risk exposure by industry
Point in time (effect of FLI shifts) Upside scenario Baseline scenario Downside scenario
in EUR million Stage 1 Stage 2 Stage 1 Stage 2 Stage 1 Stage 2 Stage 1 Stage 2
Mar 21
Agriculture and forestry +84.8 -84.8 +26.0 -26.0 +11.2 -11.2 -8.4 +8.4
of which significant risk +0.0 -0.0 +0.0 -0.0 +0.0 -0.0 -0.0 +0.0
Mining +7.2 -7.2 +4.9 -4.9 +4.7 -4.7 -12.6 +12.6
of which significant risk +0.0 +0.0 +0.0 +0.0 +0.0 +0.0 -2.5 +2.5
Manufacturing +605.4 -605.4 +305.6 -305.6 +224.2 -224.2 -317.0 +317.0
of which significant risk +232.1 -232.1 +139.9 -139.9 +115.6 -115.6 -143.8 +143.8
Energy and water supply +90.7 -90.7 +57.7 -57.7 +48.4 -48.4 -9.4 +9.4
of which significant risk +0.0 +0.0 +0.0 +0.0 +0.0 +0.0 +0.0 +0.0
Construction +845.5 -845.5 +279.6 -279.6 +177.0 -177.0 -131.3 +131.3
of which significant risk +0.6 -0.6 +0.6 -0.6 +0.5 -0.5 -0.1 +0.1
Trade +340.6 -340.6 +94.2 -94.2 +53.4 -53.4 -101.6 +101.6
of which significant risk +65.0 -65.0 +21.4 -21.4 +8.6 -8.6 -45.6 +45.6
Transport, communication +189.3 -189.3 +114.8 -114.8 +100.4 -100.4 -85.2 +85.2
of which significant risk +6.2 -6.2 +1.7 -1.7 +0.3 -0.3 -22.8 +22.8
Hotels and restaurants +38.0 -38.0 +25.2 -25.2 +10.9 -10.9 -86.0 +86.0
of which significant risk +37.6 -37.6 +24.9 -24.9 +10.6 -10.6 -86.0 +86.0
Financial and insurance services +72.9 -72.9 +34.4 -34.4 +25.8 -25.8 -44.8 +44.8
Real estate and housing +1,792.7 -1,792.7 +1,037.5 -1,037.5 +557.5 -557.5 -454.3 +454.3
of which significant risk +15.0 -15.0 +0.0 -0.0 +0.0 -0.0 -8.6 +8.6
Services +171.1 -171.1 +31.9 -31.9 +8.9 -8.9 -96.1 +96.1
of which significant risk +86.3 -86.3 +12.1 -12.1 +1.4 -1.4 -90.1 +90.1
Public administration +212.2 -212.2 +131.0 -131.0 +130.8 -130.8 -41.3 +41.3
Education, health and art +147.8 -147.8 +101.6 -101.6 +58.7 -58.7 -76.3 +76.3
of which significant risk +56.8 -56.8 +49.3 -49.3 +48.7 -48.7 -67.2 +67.2
Households +814.2 -814.2 +613.1 -613.1 +297.3 -297.3 -318.3 +318.3
Other +1.3 -1.3 +0.8 -0.8 +0.3 -0.3 -0.3 +0.3
Total +5,413.7 -5,413.7 +2,858.5 -2,858.5 +1,709.5 -1,709.5 -1,782.7 +1,782.7
Dec 20
Agriculture and forestry +88.3 -88.3 +20.5 -20.5 +13.7 -13.7 -12.6 +12.6
of which significant risk +0.0 -0.0 +0.0 -0.0 +0.0 -0.0 -0.0 +0.0
Mining +8.7 -8.7 +6.5 -6.5 +3.6 -3.6 -37.1 +37.1
of which significant risk +0.1 -0.1 +0.0 +0.0 +0.0 +0.0 -27.0 +27.0
Manufacturing +1,020.0 -1,020.0 +367.1 -367.1 +265.3 -265.3 -281.0 +281.0
of which significant risk +236.2 -236.2 +147.4 -147.4 +116.4 -116.4 -164.7 +164.7
Energy and water supply +84.7 -84.7 +50.6 -50.6 +43.1 -43.1 -16.3 +16.3
of which significant risk +0.0 +0.0 +0.0 +0.0 +0.0 +0.0 +0.0 +0.0
Construction +848.6 -848.6 +320.9 -320.9 +228.0 -228.0 -104.4 +104.4
of which significant risk +0.0 +0.0 +0.0 +0.0 +0.0 +0.0 +0.0 +0.0
Trade +386.5 -386.5 +110.1 -110.1 +60.4 -60.4 -125.9 +125.9
of which significant risk +72.0 -72.0 +17.2 -17.2 +9.7 -9.7 -66.0 +66.0
Transport, communication +201.2 -201.2 +127.5 -127.5 +110.5 -110.5 -74.8 +74.8
of which significant risk +10.8 -10.8 +6.2 -6.2 +5.4 -5.4 -17.5 +17.5
Hotels and restaurants +100.9 -100.9 +79.8 -79.8 +29.3 -29.3 -78.6 +78.6
of which significant risk +100.9 -100.9 +79.8 -79.8 +29.3 -29.3 -78.6 +78.6
Financial and insurance services +137.3 -137.3 +64.3 -64.3 +56.3 -56.3 -25.3 +25.3
Real estate and housing +1,715.3 -1,715.3 +959.7 -959.7 +624.1 -624.1 -425.2 +425.2
of which significant risk +6.1 -6.1 +0.3 -0.3 +0.2 -0.2 -6.9 +6.9
Services +173.4 -173.4 +34.3 -34.3 +10.8 -10.8 -42.7 +42.7
of which significant risk +92.6 -92.6 +13.7 -13.7 +1.5 -1.5 -35.9 +35.9
Public administration +253.8 -253.8 +172.7 -172.7 +171.8 -171.8 -3.0 +3.0
Education, health and art +117.7 -117.7 +110.4 -110.4 +58.0 -58.0 -65.6 +65.6
of which significant risk +7.6 -7.6 +6.3 -6.3 +6.2 -6.2 -4.6 +4.6
Households +745.7 -745.7 +450.4 -450.4 +191.9 -191.9 -289.8 +289.8
Other +1.4 -1.4 +0.7 -0.7 +0.2 -0.2 -7.7 +7.7
Total +5,883.6 -5,883.6 +2,875.7 -2,875.7 +1,867.1 -1,867.1 -1,590.0 +1,590.0

66
Impact of different scenarios on credit loss allowances by industry
Point in time (effect of FLI shifts) Upside scenario Baseline scenario Downside scenario
in EUR million Stage 1 Stage 2 Stage 1 Stage 2 Stage 1 Stage 2 Stage 1 Stage 2
Mar 21
Agriculture and forestry +4.6 +15.4 -0.0 +3.4 +0.0 +2.0 -0.1 -1.7
of which significant risk +0.1 +0.2 +0.1 +0.1 +0.1 +0.1 -0.1 -0.1
Mining +0.2 +0.3 +0.0 +0.2 +0.0 +0.1 +0.0 -0.2
of which significant risk +0.1 +0.0 +0.0 +0.0 +0.0 +0.0 +0.0 -0.1
Manufacturing +23.1 +60.0 -1.1 +28.4 -1.0 +19.9 +1.2 -17.7
of which significant risk +11.1 +29.3 -0.5 +14.9 -0.6 +11.0 +0.5 -8.7
Energy and water supply +7.5 +7.9 -0.3 +4.0 -0.2 +2.7 -0.1 -1.7
of which significant risk +0.0 +0.0 +0.0 +0.0 +0.0 +0.0 +0.0 +0.0
Construction +14.0 +29.2 -1.5 +11.5 -1.1 +7.8 +0.6 -5.7
of which significant risk +0.3 +0.3 +0.0 +0.1 +0.0 +0.0 -0.0 -0.0
Trade +17.7 +29.1 +0.4 +9.4 +0.4 +5.7 +0.5 -6.9
of which significant risk +7.3 +10.1 +0.5 +3.4 +0.3 +2.1 +0.2 -2.9
Transport, communication +9.1 +16.8 -0.3 +9.7 -0.4 +7.2 +0.2 -7.2
of which significant risk +3.0 +3.9 +0.3 +2.1 +0.2 +1.3 -0.0 -1.9
Hotels and restaurants +10.4 +17.1 -0.2 +7.8 -0.0 +4.8 +0.6 -5.9
of which significant risk +10.3 +17.0 -0.2 +7.8 -0.0 +4.7 +0.6 -5.9
Financial and insurance services +6.8 +6.1 -0.1 +3.3 -0.1 +2.3 +0.2 -2.0
Real estate and housing +24.0 +45.9 -4.1 +24.2 -2.6 +16.9 +1.6 -12.0
of which significant risk +1.3 +1.2 +0.0 +0.2 +0.0 +0.1 +0.1 -0.4
Services +7.1 +16.8 -0.0 +5.3 +0.1 +2.9 +0.8 -6.9
of which significant risk +4.0 +9.0 -0.0 +2.9 +0.0 +1.6 +0.8 -5.8
Public administration +0.3 +0.3 -0.0 +0.3 -0.0 +0.3 +0.0 -0.1
Education, health and art +4.2 +10.2 -1.0 +6.6 -0.6 +4.2 +0.3 -3.8
of which significant risk +1.9 +4.8 -0.5 +3.6 -0.6 +3.1 +0.2 -2.8
Households +42.9 +107.9 -1.6 +51.4 -0.1 +26.6 -2.0 -35.6
Other +0.2 +0.8 -0.0 +0.3 -0.0 +0.1 +0.0 -0.2
Total +172.1 +363.9 -9.8 +165.8 -5.6 +103.7 +4.0 -107.7
Dec 20
Agriculture and forestry +4.4 +15.9 +0.1 +4.3 +0.0 +2.7 -0.1 -2.1
of which significant risk +0.1 +0.0 +0.1 +0.0 +0.1 +0.0 -0.1 -0.0
Mining +0.3 +0.4 -0.0 +0.2 -0.0 +0.1 +0.1 -0.9
of which significant risk +0.2 +0.1 +0.0 +0.0 +0.0 +0.0 +0.1 -0.7
Manufacturing +20.9 +65.2 -1.4 +28.7 -1.1 +19.5 +0.9 -16.8
of which significant risk +11.7 +22.4 -0.5 +11.3 -0.6 +8.5 +0.4 -7.3
Energy and water supply +5.4 +8.2 -0.3 +4.2 -0.3 +3.1 -0.1 -2.0
of which significant risk +0.0 +0.0 +0.0 +0.0 +0.0 +0.0 +0.0 +0.0
Construction +12.6 +29.4 -2.0 +12.2 -1.3 +8.0 +0.7 -5.5
of which significant risk +0.4 +0.2 +0.0 +0.0 +0.0 +0.0 +0.0 -0.0
Trade +16.3 +29.7 +0.0 +10.4 +0.1 +6.3 +0.5 -6.9
of which significant risk +6.2 +10.3 +0.4 +3.5 +0.2 +2.2 +0.5 -3.5
Transport, communication +8.3 +15.8 -0.3 +9.4 -0.4 +7.2 -0.1 -4.8
of which significant risk +2.8 +3.4 +0.2 +1.8 +0.1 +1.2 -0.1 -1.2
Hotels and restaurants +9.7 +15.7 -0.4 +7.6 -0.0 +4.3 +0.8 -6.2
of which significant risk +9.6 +15.7 -0.4 +7.6 -0.0 +4.3 +0.8 -6.2
Financial and insurance services +5.8 +8.5 -0.2 +4.8 -0.2 +3.3 +0.1 -2.3
Real estate and housing +24.1 +46.0 -4.3 +25.0 -2.8 +17.3 +2.0 -12.3
of which significant risk +0.1 +0.2 +0.0 +0.2 +0.0 +0.1 +0.1 -0.3
Services +7.2 +15.0 -0.0 +5.0 +0.1 +2.8 +0.2 -3.2
of which significant risk +4.1 +8.2 -0.0 +3.0 +0.0 +1.7 +0.3 -2.2
Public administration +2.7 +0.3 -0.0 +0.3 -0.0 +0.3 +0.0 -0.1
Education, health and art +18.8 +22.2 +0.4 +12.9 +0.4 +8.2 -0.4 -6.9
of which significant risk +2.2 +2.4 +0.0 +1.3 -0.0 +1.0 +0.0 -0.6
Households +29.5 +88.1 -1.1 +40.4 -0.1 +19.2 -1.1 -33.4
Other +0.2 +0.9 +0.0 +0.3 +0.0 +0.1 +0.0 -0.5
Total +166.2 +361.4 -9.4 +165.6 -5.6 +102.5 +3.6 -103.9

67
Loans and advances to customers The following tables present the structure of the customer loan book, excluding loans to central banks and credit institutions broken-down by different categories. The presentation is by gross carrying amount excluding loan loss allowances and collateral. Loans and advances to customers comprise:
_ loans and advances to customers at FVPL _ loans and advances to customers at AC _ finance lease receivables and _ trade and other receivables.
On the next pages loans and advances to customers are presented by: _ business segment and risk category; _ business segment and IFRS 9 treatment; _ geographical segment and risk category; _ geographical segment and IFRS 9 treatment; _ business segment and coverage of non-performing loans and advances to customers by loan loss allowances and collateral; _ business segment and coverage by loan loss allowances and IFRS 9 treatment; _ geographical segment and coverage of non-performing loans and advances to customers by loan loss allowances and collateral; _ geographical segment and coverage by loan loss allowances and IFRS 9 treatment; _ geographical segment and currency.
Loans and advances to customers by business segment and risk category
in EUR million Low risk Management
attention Substandard Non-
performing Total
Mar 21
Retail 52,732 5,153 2,166 1,519 61,569
Corporates 44,158 9,878 2,881 1,592 58,510
Group Markets 360 136 23 0 519
ALM & LCC 56 30 101 4 191
Savings Banks 42,026 6,493 1,053 1,343 50,914
GCC 25 8 43 31 108
Total 139,357 21,699 6,267 4,489 171,811
Dec 20
Retail 52,511 5,013 2,007 1,495 61,025
Corporates 44,961 8,735 2,247 1,624 57,567
Group Markets 565 10 1 1 577
ALM & LCC 65 50 124 4 243
Savings Banks 41,535 6,449 1,016 1,394 50,393
GCC 23 17 158 17 215
Total 139,660 20,275 5,552 4,533 170,021
Loans and advances to customers by business segment and IFRS 9 treatment
in EUR million Stage 1 Stage 2 Stage 3 POCI Customer
loans (AC)
Not subject to IFRS 9
impairment Total
Mar 21
Retail 51,395 7,964 1,470 114 60,943 626 61,569
Corporates 43,129 13,643 1,430 210 58,413 97 58,510
Group Markets 487 32 0 0 519 0 519
ALM & LCC 166 21 4 0 190 0 192
Savings Banks 39,135 10,410 1,312 48 50,906 9 50,914
GCC 70 4 31 0 104 4 108
Total 134,382 32,074 4,247 373 171,076 735 171,811
Dec 20
Retail 51,256 7,638 1,443 115 60,452 573 61,025
Corporates 42,700 13,097 1,466 203 57,466 100 57,567
Group Markets 532 44 1 0 577 0 577
ALM & LCC 213 26 4 0 243 0 243
Savings Banks 38,616 10,355 1,363 49 50,383 10 50,393
GCC 26 169 17 0 211 4 215
Total 133,343 31,329 4,293 368 169,333 687 170,021

68
Loans and advances to customers by geographical segment and risk category
in EUR million Low risk Management
attention Substandard Non-
performing Total
Mar 21
Austria 87,353 10,784 1,832 2,301 102,271
EBOe & Subsidiaries 31,875 3,041 528 566 36,010
Savings Banks 42,026 6,493 1,053 1,343 50,914
Other Austria 13,452 1,250 251 392 15,346
Central and Eastern Europe 51,958 10,894 4,391 2,157 69,400
Czech Republic 23,389 4,692 1,590 691 30,362
Romania 7,479 1,201 338 413 9,430
Slovakia 12,416 1,135 1,342 386 15,279
Hungary 3,498 892 449 147 4,985
Croatia 3,874 2,651 564 492 7,581
Serbia 1,302 325 108 28 1,763
Other 46 20 43 31 141
Total 139,357 21,699 6,267 4,489 171,811
Dec 20
Austria 86,658 10,610 1,708 2,401 101,376
Erste Bank Oesterreich & Subsidiaries 31,623 2,928 504 578 35,634
Savings Banks 41,535 6,449 1,016 1,394 50,393
Other Austria 13,500 1,233 188 428 15,349
Central and Eastern Europe 52,956 9,645 3,687 2,116 68,404
Czech Republic 22,899 4,771 1,275 651 29,597
Romania 7,317 1,231 349 419 9,316
Slovakia 12,481 1,227 1,216 364 15,289
Hungary 3,512 851 433 151 4,947
Croatia 5,465 1,237 303 506 7,511
Serbia 1,281 327 110 25 1,744
Other 46 20 158 17 240
Total 139,660 20,275 5,552 4,533 170,021
Loans and advances to customers by geographical segment and IFRS 9 treatment
in EUR million Stage 1 Stage 2 Stage 3 POCI Customer
loans (AC)
Not subject to IFRS 9
impairment Total
Mar 21
Austria 78,735 21,118 2,241 71 102,166 105 102,271
EBOe & Subsidiaries 29,176 6,254 563 7 36,000 11 36,010
Savings Banks 39,135 10,410 1,312 48 50,906 9 50,914
Other Austria 10,424 4,454 366 16 15,260 86 15,346
Central and Eastern Europe 55,555 10,941 1,976 302 68,774 626 69,400
Czech Republic 25,407 4,257 645 53 30,362 0 30,362
Romania 6,938 2,045 382 64 9,430 0 9,430
Slovakia 12,387 2,483 323 87 15,279 0 15,279
Hungary 3,211 950 123 74 4,359 626 4,985
Croatia 6,064 1,020 476 21 7,581 0 7,581
Serbia 1,548 186 26 2 1,763 0 1,763
Other 91 16 31 0 137 4 141
Total 134,382 32,074 4,247 373 171,076 735 171,811
Dec 20
Austria 78,106 20,748 2,341 71 101,267 109 101,376
EBOe & Subsidiaries 28,688 6,352 575 6 35,622 12 35,634
Savings Banks 38,616 10,355 1,363 49 50,383 10 50,393
Other Austria 10,803 4,041 403 16 15,262 87 15,349
Central and Eastern Europe 55,187 10,410 1,935 296 67,829 575 68,404
Czech Republic 24,980 3,958 611 47 29,596 2 29,597
Romania 6,818 2,044 387 66 9,316 0 9,316
Slovakia 12,514 2,390 301 84 15,289 0 15,289
Hungary 3,354 820 124 76 4,374 573 4,947
Croatia 5,973 1,028 489 22 7,511 0 7,511
Serbia 1,548 171 23 2 1,744 0 1,744
Other 49 171 17 0 237 4 240
Total 133,343 31,329 4,293 368 169,333 687 170,021

69
Stage 1 and Stage 2 comprise not credit impaired loans and advances while Stage 3 includes credit impaired loans and advances. POCI (purchased or originated credit impaired) loans are loans already credit impaired when purchased or originated. The defaulted part of POCI loans amounted to EUR 227 million (EUR 226 million), the non-defaulted part to EUR 145 million (EUR 142 million). In the following tables, the non-performing loans and advances to customers divided by reporting segment are contrasted with allowances for customer loans (all allowances for loans and advances to customers within the scope of IFRS 9) and the collateral for non-performing loans (NPL). The NPL ratio, the NPL coverage ratio (excluding collateral), and the NPL collateralisation ratio are also included. Customer loans, non-performing loans and collateral include both AC and FVPL portfolios. Non-performing loans and advances to customers by business segment and coverage by loan loss allowances and collateral
Non-performing Customer loans Allowances Collateral for NPL NPL ratio
NPL coverage ratio (exc collateral)
NPL collateralisation ratio
in EUR million Total AC Total AC AC Total AC Total AC AC Total AC
Mar 21
Retail 1,519 1,518 61,569 60,943 -1,489 578 577 2.5% 2.5% 98.1% 38.1% 38.0%
Corporates 1,592 1,582 58,510 58,414 -1,516 622 622 2.7% 2.7% 95.8% 39.1% 39.3%
Group Markets 0 0 519 519 -1 0 0 0.1% 0.1% 491.8% 0.0% 0.0%
ALM & LCC 4 4 192 190 -11 0 0 2.1% 2.1% 266.7% 1.7% 1.7%
Savings Banks 1,343 1,341 50,914 50,906 -967 717 715 2.6% 2.6% 72.1% 53.4% 53.3%
GCC 31 28 108 104 -21 17 15 28.4% 27.1% 72.8% 55.8% 52.2%
Total 4,489 4,473 171,811 171,076 -4,004 1,934 1,928 2.6% 2.6% 89.5% 43.1% 43.1%
Dec 20
Retail 1,495 1,494 61,025 60,452 -1,466 599 599 2.4% 2.5% 98.2% 40.1% 40.1%
Corporates 1,624 1,614 57,567 57,466 -1,530 631 630 2.8% 2.8% 94.8% 38.9% 39.1%
Group Markets 1 1 577 577 -3 0 0 0.1% 0.1% 378.4% 0.0% 0.0%
ALM & LCC 4 4 243 243 -11 0 0 1.6% 1.6% 278.6% 1.8% 1.8%
Savings Banks 1,394 1,391 50,393 50,383 -976 732 729 2.8% 2.8% 70.2% 52.5% 52.4%
GCC 17 15 215 211 -16 8 6 7.8% 6.9% 111.4% 47.3% 39.4%
Total 4,533 4,518 170,021 169,333 -4,002 1,970 1,964 2.7% 2.7% 88.6% 43.5% 43.5%
Loans and advances to customers at AC and coverage by loan loss allowances by business segment and IFRS 9 treatment
Loans to customers Allowances Coverage ratio
in EUR million Stage 1 Stage 2 Stage 3 POCI Stage 1 Stage 2 Stage 3 POCI Stage 2 Stage 3 POCI
Mar 21
Retail 51,395 7,964 1,470 114 -129 -458 -870 -32 5.8% 59.2% 27.6%
Corporates 43,129 13,643 1,430 210 -138 -455 -839 -85 3.3% 58.6% 40.3%
Group Markets 487 32 0 0 -1 0 0 0 1.4% 16.1% 0.0%
ALM & LCC 166 21 4 0 -2 -5 -4 0 23.3% 103.1% 0.0%
Savings Banks 39,135 10,410 1,312 48 -92 -297 -574 -4 2.9% 43.7% 7.7%
GCC 70 4 31 0 0 0 -20 0 2.0% 65.5% 0.0%
Total 134,382 32,074 4,247 373 -362 -1,216 -2,307 -120 3.8% 54.3% 32.2%
Dec 20
Retail 51,256 7,638 1,443 115 -129 -455 -849 -34 6.0% 58.8% 29.4%
Corporates 42,700 13,097 1,466 203 -135 -443 -865 -88 3.4% 59.0% 43.2%
Group Markets 532 44 1 0 -1 -2 0 0 4.5% 5.3% 100.0%
ALM & LCC 213 26 4 0 -1 -6 -4 0 21.7% 115.2%
Savings Banks 38,616 10,355 1,363 49 -93 -287 -592 -4 2.8% 43.5% 7.6%
GCC 26 169 17 0 0 0 -16 0 0.1% 93.7% 0.0%
Total 133,343 31,329 4,293 368 -358 -1,193 -2,326 -125 3.8% 54.2% 34.1%

70
Non-performing loans and advances to customers by geographical segment and coverage by loan loss allowances and collateral
Non-performing Customer loans Allowances Collateral for NPL NPL ratio
NPL coverage ratio (exc collateral)
NPL collateralisation ratio
in EUR million Total AC Total AC AC Total AC Total AC AC Total AC
Mar 21
Austria 2,301 2,290 102,271 102,166 -1,642 1,170 1,168 2.3% 2.2% 71.7% 50.9% 51.0%
EBOe & Subs 566 566 36,010 36,000 -364 308 308 1.6% 1.6% 64.3% 54.4% 54.4%
Savings Banks 1,343 1,341 50,914 50,906 -967 717 715 2.6% 2.6% 72.1% 53.4% 53.3%
Other Austria 392 382 15,346 15,260 -311 146 145 2.6% 2.5% 81.3% 37.2% 38.0%
CEE 2,157 2,156 69,400 68,774 -2,342 747 746 3.1% 3.1% 108.6% 34.6% 34.6%
Czech Republic 691 691 30,362 30,362 -774 159 159 2.3% 2.3% 112.1% 23.0% 23.0%
Romania 413 412 9,430 9,430 -504 148 147 4.4% 4.4% 122.3% 35.7% 35.7%
Slovakia 386 386 15,279 15,279 -394 153 153 2.5% 2.5% 102.1% 39.6% 39.6%
Hungary 147 146 4,985 4,359 -171 86 85 2.9% 3.3% 117.2% 58.3% 58.1%
Croatia 492 492 7,581 7,581 -454 198 198 6.5% 6.5% 92.3% 40.2% 40.2%
Serbia 28 28 1,763 1,763 -44 4 4 1.6% 1.6% 156.5% 12.8% 12.8%
Other 31 28 141 137 -21 17 15 21.7% 20.6% 72.8% 55.8% 52.2%
Total 4,489 4,473 171,811 171,076 -4,004 1,934 1,928 2.6% 2.6% 89.5% 43.1% 43.1%
Dec 20
Austria 2,401 2,388 101,376 101,267 -1,670 1,182 1,179 2.4% 2.4% 69.9% 49.2% 49.4%
EBOe & Subs 578 578 35,634 35,622 -367 318 318 1.6% 1.6% 63.4% 54.9% 54.9%
Savings Banks 1,394 1,391 50,393 50,383 -976 732 729 2.8% 2.8% 70.2% 52.5% 52.4%
Other Austria 428 419 15,349 15,262 -327 132 132 2.8% 2.7% 78.1% 30.9% 31.5%
CEE 2,116 2,115 68,404 67,829 -2,317 780 779 3.1% 3.1% 109.5% 36.9% 36.8%
Czech Republic 651 651 29,597 29,596 -750 178 178 2.2% 2.2% 115.1% 27.3% 27.3%
Romania 419 418 9,316 9,316 -512 154 154 4.5% 4.5% 122.5% 36.7% 36.7%
Slovakia 364 364 15,289 15,289 -391 145 145 2.4% 2.4% 107.4% 39.8% 39.8%
Hungary 151 150 4,947 4,374 -167 90 89 3.0% 3.4% 111.4% 59.8% 59.6%
Croatia 506 506 7,511 7,511 -454 210 210 6.7% 6.7% 89.7% 41.5% 41.5%
Serbia 25 25 1,744 1,744 -43 4 4 1.5% 1.5% 168.2% 14.1% 14.1%
Other 17 15 240 237 -16 8 6 7.0% 6.1% 111.4% 47.3% 39.4%
Total 4,533 4,518 170,021 169,333 -4,002 1,970 1,964 2.7% 2.7% 88.6% 43.5% 43.5%

71
Loans and advances to customers at AC and coverage by loan loss allowances by geographical segment and IFRS 9 treatment
Loans to customers Allowances Coverage ratio
in EUR million Stage 1 Stage 2 Stage 3 POCI Stage 1 Stage 2 Stage 3 POCI Stage 2 Stage 3 POCI
Mar 21
Austria 78,735 21,118 2,241 71 -139 -526 -973 -4 2.5% 43.4% 5.2%
EBOe & Subs 29,176 6,254 563 7 -32 -122 -211 0 1.9% 37.5% 0.1%
Savings Banks 39,135 10,410 1,312 48 -92 -297 -574 -4 2.9% 43.7% 7.7%
Other AT 10,424 4,454 366 16 -15 -107 -189 0 2.4% 51.6% 0.0%
CEE 55,555 10,941 1,976 302 -223 -690 -1,313 -116 6.3% 66.5% 38.5%
Czech Republic 25,407 4,257 645 53 -86 -242 -426 -20 5.7% 66.0% 36.7%
Romania 6,938 2,045 382 64 -39 -165 -286 -15 8.0% 74.9% 22.9%
Slovakia 12,387 2,483 323 87 -30 -128 -179 -57 5.2% 55.4% 66.1%
Hungary 3,211 950 123 74 -16 -65 -75 -15 6.8% 61.4% 19.9%
Croatia 6,064 1,020 476 21 -42 -77 -326 -9 7.6% 68.6% 43.5%
Serbia 1,548 186 26 2 -10 -13 -20 -1 7.2% 76.2% 32.0%
Other 91 16 31 0 0 0 -20 0 0.5% 65.5% 0.0%
Total 134,382 32,074 4,247 373 -362 -1,216 -2,307 -120 3.8% 54.3% 32.2%
Dec 20
Austria 78,106 20,748 2,341 71 -139 -514 -1,014 -4 2.5% 43.3% 5.3%
EBOe & Subs 28,688 6,352 575 6 -31 -119 -217 0 1.9% 37.6% 0.1%
Savings Banks 38,616 10,355 1,363 49 -93 -287 -592 -4 2.8% 43.5% 7.6%
Other AT 10,803 4,041 403 16 -15 -107 -205 0 2.7% 50.8% 0.0%
CEE 55,187 10,410 1,935 296 -219 -679 -1,297 -122 6.5% 67.0% 41.1%
Czech Republic 24,980 3,958 611 47 -83 -232 -413 -22 5.9% 67.6% 46.1%
Romania 6,818 2,044 387 66 -38 -170 -287 -17 8.3% 74.3% 25.1%
Slovakia 12,514 2,390 301 84 -31 -128 -175 -57 5.4% 58.1% 68.5%
Hungary 3,354 820 124 76 -16 -59 -76 -16 7.2% 61.5% 21.2%
Croatia 5,973 1,028 489 22 -41 -76 -327 -9 7.4% 66.8% 43.5%
Serbia 1,548 171 23 2 -10 -13 -18 -1 7.8% 78.6% 35.5%
Other 49 171 17 0 0 0 -16 0 0.1% 93.7% 0.0%
Total 133,343 31,329 4,293 368 -358 -1,193 -2,326 -125 3.8% 54.2% 34.1%
Loans and advances to customers by geographical segment and currency in EUR million EUR CEE-LCY CHF USD Other Total
Mar 21
Austria 95,026 0 2,354 2,886 2,005 102,271
Erste Bank Oesterreich & Subsidiaries 34,894 0 983 58 76 36,010
Savings Banks 48,490 0 1,332 71 1,022 50,914
Other Austria 11,642 0 39 2,758 908 15,346
Central and Eastern Europe 29,641 39,497 21 183 57 69,400
Czech Republic 4,082 26,186 0 64 30 30,362
Romania 3,075 6,273 0 82 0 9,430
Slovakia 15,247 0 0 5 27 15,279
Hungary 1,226 3,730 3 26 0 4,985
Croatia 4,690 2,870 18 2 0 7,581
Serbia 1,320 439 0 3 0 1,763
Other 75 45 4 17 0 141
Total 124,742 39,542 2,379 3,085 2,063 171,811
Dec 20
Austria 93,915 0 2,672 2,518 2,272 101,376
Erste Bank Oesterreich & Subsidiaries 34,395 0 1,124 41 73 35,634
Savings Banks 47,503 0 1,505 57 1,329 50,393
Other Austria 12,017 0 43 2,420 869 15,349
Central and Eastern Europe 29,657 38,515 22 154 56 68,404
Czech Republic 4,069 25,446 0 41 40 29,597
Romania 3,108 6,130 0 78 0 9,316
Slovakia 15,269 0 0 3 16 15,289
Hungary 1,277 3,643 3 23 0 4,947
Croatia 4,624 2,864 19 4 0 7,511
Serbia 1,310 431 0 3 0 1,744
Other 175 45 4 16 0 240
Total 123,747 38,560 2,698 2,687 2,328 170,021

72
Market risk The following table shows the value at risk of the trading book at the 99% confidence level using equally weighted market data and with a holding period of one day.
in EUR million Dec 20 Mar 21
Interest 3.4 3.2
Currency 1.6 3.1
Shares 1.4 0.9
Commodity 0.5 0.3
Volatility 0.5 1.0
Total 3.5 3.3
The method used is subject to limitations that may result in the information not fully reflecting the fair value of the assets and liabilities involved. This restriction applies to the inclusion of credit spreads in the calculation of the VaR. Issuer specific spreads are applied to sovereign issuers, while sector specific spreads are applied to non-sovereign issuers. Liquidity risk Taking into account the favourable liquidity position and the usage of the TLTRO II and III programmes (Targeted Longer-Term Refinancing Operations) of the European Central Bank, Erste Group Bank AG has budgeted long term issuance for 2021 in the amount of EUR 2.8 billion. In the first three months of the year, Erste Group issued about EUR 700 million (net of EUR 3 million buybacks), including a senior preferred EUR benchmark transaction. The liquidity situation remained stable also in the CEE entities and did not show any negative impacts due to the Covid-19 situation in the first quarter of 2021. On group level, Erste Group’s total TLTRO participation amounted to EUR 18.1 billion. Leverage ratio The leverage ratio represents the relationship between core capital (tier 1) and the leverage exposure according to Article 429 Capital Requirements Regulation (CRR). Essentially, the leverage exposure represents the sum of unweighted on- and off-balance-sheet positions considering valuation and risk adjustments as defined within the CRR. As of 31 March 2021, the leverage ratio for Erste Group Bank AG at consolidated level amounted to 6.2%, comfortably above the 3.0% minimum requirement defined in Article 92 Capital Requirements Regulation (CRR). Tier 1 capital amounted to EUR 19.7 billion at the reference date, while total leverage exposure stood at EUR 320.8 billion. The calculation and disclosure of the leverage ratio are based on the European Commission’s delegated regulation ((EU) 2015/62 of 10 October 2014), which was published in the Official Journal of the European Union on 17 January 2015. 30. Related party transactions The foundation DIE ERSTE oesterreichische Spar-Casse Privatstiftung (Privatstiftung) controls a total of 31.17% interest in Erste Group Bank AG. Privatstiftung is the largest single investor in Erste Group Bank AG. At the end of the reporting period, Erste Group had, in relation to Privatstiftung, accounts payable of EUR 2.5 million (EUR 10.7 million) and no accounts receivable. At the end of the reporting period, Privatstiftung held bonds issued by Erste Group Bank AG of EUR 7.2 million (EUR 7.2 million). In the reporting period interest expenses amounted to EUR 0.1 million (EUR 0.2 million), resulting from the above mentioned accounts payable. 31. Contingent liabilities – legal proceedings There have not been any material changes since year-end 2020 in the assessment of the influence of the outcome of the litigation cases in which Erste Group Bank AG and some of its subsidiaries are involved with respect of the financial and/or earnings situation of Erste Group.

73
32. Fair value of financial instruments Where the fair values of financial assets and financial liabilities recorded on the balance sheet cannot be derived from active markets, they are determined using a variety of valuation techniques that include the use of mathematical models. The inputs to these models are derived from observable market data where possible, but where observable market data is not available judgement is required to establish fair values. Using of unobservable inputs is particularly relevant for models used for valuations of loans and unquoted equity investments. Disclosures on valuation models, the fair value hierarchy and fair values of financial instruments can be found subsequently. Based on an analysis carried out by Erste Group it was decided that for the valuation of OTC derivatives no Funding Value Adjustment (FVA) would be considered. For all financial instruments the fair value is measured on recurring basis. Financial instruments carried at fair value The measurement of fair value at Erste Group is based primarily on external sources of data (stock market prices or broker quotes in highly liquid market segments). Financial instruments for which the fair value is determined on the basis of quoted market prices are mainly listed securities and derivatives as well as liquid OTC bonds. Description of valuation models and parameters Erste Group uses valuation models that have been tested internally and for which the valuation parameters (such as interest rates, exchange rates, volatilities and credit spreads) have been determined independently. In 2015, as a consequence of the negative interest environment, valuation models of interest rate options for the respective currencies were adjusted. Log-normal valuation models were replaced by standard market models which are based on a shifted log-normal distribution or a standard distribution. For such models negative interest rates are no restriction. Loans. Not SPPI (solely payments of principal and interest) compliant loans are to be valued at fair value. The methodology to compute fair value of these loans corresponds to the basic present value technique where expected cash flows of assets are discounted by the full rate including risk premium required for non-market risk based part of the interest rate to be compliant with fair value definition. The credit risk is recognized by adjusting contractual cash flows to come to expected cash flows accounting for customer’s probability of default and loss given default. These adjusted cash flows are then discounted by a yield curve which consists of a risk free rate and a funding spread. For a limited number of profit-participating loans, the expected cash flows are discounted using a risk-adjusted discount rate. This risk-adjusted rate is determined applying the Capital Assets Pricing Model (CAPM) on the basis of comparable listed entities. Debt securities. For plain vanilla (fixed and floating rate) debt securities the fair value is calculated by discounting the future cash flows using a discounting curve depending on the interest rate for the respective issuance currency and a spread adjustment. The spread adjustment is usually derived from the credit spread curve of the issuer. If no issuer curve is available the spread is derived from a proxy instrument and adjusted for differences in the risk profile of the instruments. If no close proxy is available, the spread adjustment is estimated using other information, including estimation of the credit spread based on internal ratings and PDs or management judgment. For more complex debt securities (e.g. including option-like features such as callable, cap/floor, index-linked) the fair value is determined using combinations of discounted cash flow models and more sophisticated modeling techniques including methods described for OTC-derivatives. Equity instruments. Non-trading equity instruments which have quoted market prices in an active market are valued by using the quoted market price. For other investments in non-trading equity instruments the fair value is determined by standard valuation models using also unobservable input parameters. These models include the adjusted net asset value method, the simplified income approach, the dividend discount model and the comparable company multiple method. The adjusted net asset method requires an investor to measure the fair value of the individual assets and liabilities recognized in an investee’s statement of financial position as well as the fair value of any unrecognized assets and liabilities at the measurement date. The resulting fair values of the recognized and unrecognized assets and liabilities should therefore represent the fair value of the investee’s equity. The dividend discount model assumes that the price of equity instruments issued by an entity equals the present value of all its expected future dividends in perpetuity. Similar to the dividend discount model, the simplified income approach estimates the fair value based on the future income. However, it can be used also when only one year planned income is available. The simplified income approach and the dividend discount model discount future income and dividends using the cost of equity. The cost of equity is dependent on the risk-free rate, the market risk premium, the relevered beta and the country risk premium. The relevered beta is derived from the industry classification which is published and maintained by Damodaran. In rare cases, techniques for non-trading equity instruments may also include models based on multiples. The comparable company multiple method is a valuation technique within the market approach that uses prices and other relevant information generated by market transactions involving comparable company peers of an investee to derive a valuation multiple from which the indicated fair value of the investee’s equity or enterprise value can be inferred.

74
Liabilities. The fair value of financial liabilities designated at fair value through profit or loss under the fair value option is determined based on quoted prices in active markets, if available. For issued securities where the fair value cannot be retrieved from quoted market prices, the fair value is calculated by discounting the future cash flows. Significant input factors for the spread adjustment of Erste Group’s own credit risk for the respective seniority class are credit spreads derived from liquid benchmark bonds and additional indications from external investments banks, which are provided on a regular basis. The applied spreads are validated on a regular basis from an independent Risk Management unit. Moreover optionality is taken into account when calculating the fair value. OTC-derivative financial instruments. Derivative instruments traded in liquid markets (e.g. interest rate swaps and options, foreign exchange forward and options, options on listed securities and indices, credit default swaps and commodity swaps) are valued by using standard valuation models. These models include discounting cash flow models, option models of the Black-Scholes and Hull-White type as well as hazard rate models. Models are calibrated on quoted market data (including implied volatilities). Valuation models for more complex instruments also use Monte-Carlo simulation. For instruments in less liquid markets, data obtained from less frequent transactions or extrapolation techniques are used. For determining the fair value of derivatives collateralised in EURO a discounting interest rate reflect-ing the interest rate of the corresponding cash collateral is used. As a result of the IBOR reform it has been decided that the so far used EONIA (Euro Over Night Index Average) will be replaced by ESTER (Euro Short-Term Rate) with a transition phase until 31 December 2021. In Erste Group all contracts with CCP’s (Central Counter Parties), LCH (London Clearing House) and EUREX have been converted in 2020 and for the respective collaterals ESTER is used as interest rate. Furthermore, the conversion for a significant part of unsecured derivatives was done in November 2020. The fair value of these derivatives is already determined using ESTER as discount rate. Further-more, the conversion for the most part of unsecured derivatives was done in November 2020. The valuation difference resulting from the conversion has been offset by a compensation payment. The change for all bilateral contracts and CSA’s (Credit Support Annex) is in process and will take place the same way as for CCP’s contracts. Erste Group values derivatives at mid-market levels. To reflect the potential bid-ask-spread of the relevant positions an adjustment based on market liquidity is performed. The adjustment parameters depend on product type, currency, maturity and notional size. Parameters are reviewed on a regular basis or in case of significant market moves. Netting is not applied when determining the bid-ask-spread adjustments. Credit value adjustments (CVA) for counterparty risk and debit value adjustments (DVA) for own default credit risk are applied to OTC derivatives. For the CVA the adjustment is driven by the expected positive exposure of all derivatives and the credit quality of the counter-party. DVA is driven by the expected negative exposure and Erste Group’s credit quality. Erste Group has implemented an approach, where the modeling of the expected exposure is based on option replication strategies. For products where an option replication is not feasible the exposure is computed with Monte-Carlo simulation techniques. One of the two modeling approaches is considered for the most relevant portfolios and products. The methodology for the remaining entities and products is determined by market value plus add-on considerations. The probability of default by counterparties that are not traded in an active market is determined from internal PDs mapped to a basket of liquid titles present in the central European market. Market based valuation concepts are incorporated for this. Counterparties with liquid bond or CDS markets are valued by the respective single-name market based PD derived from the prices. Erste Group’s probability of default has been derived from the buy-back levels of Erste Group’s issuances. Netting has only been considered for a few counterparties where the impact was material. In these cases, netting has been applied for both CVA and DVA. For counterparties with CSA-agreements in place no CVA was taken into account for all cases with immaterial threshold amounts. According to the described methodology the accumulated CVA-adjustments amounted to EUR 17.5 million (2020: EUR 17.6 million) and the total DVA-adjustment amounted to EUR 4.8 million (2020: EUR 3.1 million). Validation and control The responsibility for valuation of financial instruments measured at fair value is independent of the trading units. In addition, Erste Group has implemented an independent validation function in order to ensure separation between units responsible for model development, fair value measurement and validation. The aim of independent model validation is to evaluate model risks arising from the models’ theoretical foundation, the appropriateness of input data (market data) and model calibration. Fair value hierarchy Financial assets and financial liabilities measured at fair value are categorized under the three levels of the IFRS fair value hierarchy. Level 1 of the fair value hierarchy The fair value of financial instruments assigned to Level 1 of the fair value hierarchy is determined based on quoted prices in active markets for identical financial assets and liabilities. More particular, the evaluated fair value can qualify as Level 1 if transactions occur with suffi-cient frequency, volume and pricing consistency on an ongoing basis.

75
These include exchange traded derivatives (futures, options), shares, government bonds as well as other bonds and funds, which are traded in highly liquid and active markets. Leve 2 of the fair value hierarchy In case a market quote is used for valuation but due to restricted liquidity the market does not qualify as active (derived from available market liquidity indicators) the instrument is classified as Level 2. If no market prices are available the fair value is measured by using valuation models which are based on observable market data. If all the significant inputs in the valuation model are observable the instrument is classified as Level 2 of the fair value hierarchy. For Level 2 valuations typically yield curves, credit spreads and implied volatilities are used as observable market parameters. These include OTC derivatives, less liquid shares, bonds and funds as well as asset backed securities (ABS), collateralized debt obligations (CDO), own issues and deposits. Level 3 of the fair value hierarchy In some cases, the fair value can be determined neither on the basis of sufficiently frequent quoted market prices nor on the basis of valuation models that rely entirely on observable market data. In these cases individual valuation parameters which are not observable in the market are estimated on the basis of reasonable assumptions. If any unobservable input in the valuation model is significant or the price quote used is updated infrequently the instrument is classified as Level 3 of the fair value hierarchy. For Level 3 valuations besides observable param-eters typically credit spreads derived from internally calculated historical probability of default (PD) and loss given default (LGD) measures are used as unobservable parameters. Furthermore, internally calculated cost of equity and adjustments made on the equity (in the adjusted net asset value method) are unobservable parameters for the valuation of non-trading equity instruments. These include shares, participations and funds not quoted, illiquid bonds as well as collateralized mortgage obligations (CMO) as well as loans. In addition, fund units issued by investment funds fully consolidated by Erste Group as well as own issues are reported in this category. A reclassification from Level 1 into Level 2 or Level 3 as well as vice versa will be done if the financial instrument does no longer meet the criteria described above for the respective level. Classification of financial instruments carried at fair value by levels of the fair value hierarchy
Dec 20 Mar 21
in EUR million Level 1 Level 2 Level 3 Total Level 1 Level 2 Level 3 Total
Assets
Financial assets HfT 2,390 3,881 85 6,356 3,058 3,330 76 6,464
Derivatives 4 2,875 75 2,954 7 2,501 44 2,551
Other financial assets held for trading 2,385 1,007 10 3,402 3,051 829 32 3,912
Non-trading financial assets - FVPL 1,805 232 1,046 3,083 1,766 239 1,092 3,096
Equity instruments 59 7 282 347 42 6 276 325
Debt securities 1,747 225 77 2,048 1,723 233 80 2,036
Loans and advances 0 0 687 687 0 0 735 735
Financial assets FVOCI 7,347 795 376 8,519 7,341 780 426 8,547
Hedge accounting derivatives 0 205 0 205 0 141 9 149
Total assets 11,542 5,113 1,508 18,163 12,164 4,490 1,602 18,256
Liabilities
Financial liabilities HfT 500 2,123 2 2,625 502 1,687 4 2,192
Derivatives 3 2,032 2 2,037 6 1,621 4 1,631
Other financial liabilities held for trading 496 91 0 588 495 66 0 561
Financial liabilities - FVPL 347 11,408 336 12,091 347 10,794 242 11,383
Deposits from customers 0 254 0 254 0 230 0 230
Debt securities issued 347 11,154 155 11,657 347 10,564 70 10,982
Other financial liabilities 0 0 180 180 0 0 172 172
Hedge accounting derivatives 0 189 0 189 0 191 0 191
Total liabilities 846 13,720 338 14,905 849 12,672 246 13,766
Derivatives transacted via clearing houses are presented after netting in compliance with their balance sheet treatment. The netted derivatives are allocated to Level 2. The allocation of the appropriate level of positions is determined at the end of the reporting period.

76
Valuation process for financial instruments categorised as Level 3 The valuation of financial instruments categorized as Level 3 involves one or more significant inputs that are not directly observable on the market. Additional price verification steps need to be done. These may include reviewing relevant historical data and benchmarking for similar transactions, among others. This involves estimation and expert judgment. Further details regarding input parameters used and the results of the sensitivity analysis are disclosed in the sub-chapter Unobservable inputs and sensitivity analysis for Level 3 measurements below. Changes in volumes of Level 1 and Level 2 Changes in Level 1 and Level 2 volumes of financial instruments carried at fair value in the balance sheet
Dec 20 Mar 21
in EUR million Level 1 Level 2 Level 1 Level 2
Securities
Net transfer from Level 1 -5 113
Net transfer from Level 2 5 -113
Net transfer from Level 3 0 -7 0 3
Purchases/sales/expiries -400 163 733 -301
Changes in derivatives -2 230 2 -439
Total year-to-date change -397 381 622 -624
Level 1-Movements. The total amount of Level 1 financial assets increased by EUR 622 million compared to last year. The volume of Level 1 securities increased by EUR 620 million. The main changes are caused by matured or sold assets in the amount of EUR 1,710 million and by new investments in the amount of EUR 722 million. Furthermore, the increase in volume for securities that were allocated to Level 1 at both reporting dates (2021 and 2020) amounted to EUR 1,580 million (due to partial purchases and sales and fair value changes caused by market movements). Due to improved market liquidity, assets in the amount of EUR 137 million have been reclassified from Level 2 to Level 1. This applied mainly to securities issued by governments (EUR 129 million), but also to securities issued by other corporates (EUR 5 million) and financial institutions (EUR 3 million). Due to lower market activity and changes to modelled fair value, securities in total of EUR 250 million have been moved from Level 1 to Level 2. This applies mainly to securities issued by governments (EUR 232 mil-lion), as well as securities issued by financial institutions (EUR 18 million). The remaining positive change in the amount of EUR 91 million was due to partial sales and fair value changes of reclassified instruments. The volume of derivatives increased by EUR 2 million. Level 2-Movements: Financial Assets. The total value of Level 2 financial assets decreased between 2021 and 2020 by EUR 623 million. The Level 2 fair value change of securities and other receivables (in total down by EUR 185 million) can be explained for the most part by matured or sold positions in the amount of EUR 594 million and new investments in the amount of EUR 264 million. The increase in volume for securities that have been allocated to Level 2 at both reporting dates 2021 and 2020 amounted to EUR 17 million due to pur-chases or sales in volumes and changes in market values. Due to reduced market depth a total volume of EUR 250 million was reclassified from Level 1 to Level 2 in 2020. This applies mainly to securities issued by governments (EUR 232 million) and securities issued by financial institutions (EUR 18 million). Securities in the amount of EUR 137 million were reclassified from Level 2 to Level 1 for the reporting date. Due to the use of significant non-observable valuation parameters a total volume of EUR 7 million was reclassified from Level 2 to Level 3. Due to a change to valuation models with significant observable parameters a total volume of EUR 10 million was reclassified from Level 3 to Level 2. The remaining positive change in the amount of EUR 12 million was due to partial sales and fair value changes of reclassified instruments. The decrease on the asset side derivatives in Level 2 by EUR 439 million are caused by changes in market values and by netting effects. Level 2-Movements: Financial Liabilities. The total Level 2 financial liabilities decreased by EUR 1,048 million. Whereas the fair value of derivatives decreased by EUR 409 million, the portfolio of securities decreased by EUR 615 million. The fair value of client deposits decreased by EUR 24 million.

77
Movements in Level 3 of financial instruments carried at fair value Development of fair value of financial instruments in Level 3
in EUR million
Gain/loss in profit or loss
Gain/loss in OC
Purch-ases Sales
Settle-ments
Additions to Group
Disposal out of Group
Transfer into
Level 3
Transfer out of
Level 3 Currency
translation
Jan 21 Mar 21
Assets
Financial assets HfT 85 -9 0 22 -1 0 0 0 1 -23 0 76
Derivatives 75 -9 0 0 0 0 0 0 1 -23 0 44
Other financial assets held for trading 10 0 0 22 -1 0 0 0 1 0 0 32
Non-trading financial assets at FVPL 1,046 -6 0 60 -3 -7 0 0 1 -1 1 1,092
Equity instruments 282 -4 0 1 -3 0 0 0 0 0 0 276
Debt securities 77 1 0 1 0 0 0 0 1 0 0 80
Loans and advances 687 -3 0 58 0 -7 0 0 0 -1 1 735
Financial assets FVOCI 376 0 -3 8 -6 -10 0 0 69 -9 0 426
Hedge accounting derivatives 0 0 0 0 0 0 0 0 9 0 0 9
Total assets 1,508 -15 -3 91 -10 -17 0 0 80 -33 1 1,602
Liabilities
Financial liabilities HfT 2 2 0 0 0 0 0 0 1 -2 0 4
Derivatives 2 2 0 0 0 0 0 0 1 -2 0 4
Other financial liabilities held for trading 0 0 0 0 0 0 0 0 0 0 0 0
Financial liabilities at FVPL 336 0 0 5 -13 0 0 0 11 -96 0 242
Deposits from customers 0 0 0 0 0 0 0 0 0 0 0 0
Debt securities issued 155 0 0 0 0 0 0 0 11 -96 0 70
Other financial liabilities 180 0 0 5 -13 0 0 0 0 0 0 172
Total liabilities 338 2 0 5 -13 0 0 0 12 -98 0 246
Jan 20 Mar 20
Assets
Financial assets HfT 93 16 0 5 0 -1 0 0 75 -1 -3 185
Derivatives 79 17 0 2 0 -1 0 0 72 -1 -2 165
Other financial assets held for trading 14 -1 0 3 0 0 0 0 3 0 0 20
Non-trading financial assets at FVPL 922 -9 0 82 -4 -6 0 0 1 -6 -38 942
Financial assets at FVOCI 457 1 -4 13 -76 -3 0 0 9 -7 -4 385
Total assets 1,473 7 -4 100 -80 -10 0 0 85 -13 -44 1,512
Liabilities
Financial liabilities HfT 5 3 0 0 0 0 0 0 4 0 0 11
Derivatives 5 3 0 0 0 0 0 0 4 0 0 11
Other financial liabilities held for trading 0 0 0 0 0 0 0 0 0 0 0 0
Financial liabilities at FVPL 308 -10 -2 48 -45 -1 0 0 0 0 0 297
Deposits from customers 0 0 0 0 0 0 0 0 0 0 0 0
Debt securities issued 89 0 -2 0 0 -1 0 0 0 0 0 86
Other financial liabilities 219 -10 0 48 -45 0 0 0 0 0 0 211
Total liabilities 313 -8 -2 48 -45 -1 0 0 4 0 0 309
Level 3-Movements. The reclassification of securities to Level 3 was caused by a decrease in market liquidity and was based on an in-depth analysis of broker quotes. Based on the described analysis securities in the amount of EUR 7 million were reclassified from Level 2 to Level 3. The change is coming from securities issued by other corporates (EUR 7 million). On the other hand, securities that were on the balance at both reporting dates (2021 and 2020) were reclassified from Level 3 to Level 2 in the amount of EUR 10 million. Thereof, EUR 10 million are securities issued by other corporates. Loans and advances which are measured at fair value under IFRS 9 increased by EUR 48 million, mainly by purchases. The additional change in Level 3 positions was on the one hand caused by a decrease in derivative exposure of EUR 22 million and on the other hand by an increase caused by the purchase, sale and market value change of securities in the amount of EUR 72 million.

78
Gains/losses in profit or loss on Level 3 instruments held at the end of the reporting period in EUR million 1-3 20 1-3 21
Assets
Financial assets HfT 16.6 -8.4
Derivatives 17.2 -8.1
Other financial assets held for trading -0.6 -0.2
Non-trading financial assets at FVPL -9.7 -5.9
Equity instruments -7.7 -3.5
Debt securities -1.8 0.7
Loans and advances -0.2 -3.1
Financial assets at FVOCI 1.0 -0.9
Hedge accounting derivatives -0.2 0.0
Total 7.7 -15.1
For financial liabilities designated at FVPL in Level 3 a valuation of EUR -3.0 million was posted via income statement for the end of the reporting period (2020: EUR -5.6 million). The volume of Level 3 financial assets can be allocated to the following categories:
_ Market values of derivatives where the credit value adjustment (CVA) has a material impact and is calculated based on unobservable parameters (i.e. internal estimates of PDs and LGDs).
_ Illiquid bonds, shares and funds not quoted in an active market where either valuation models with non-observable parameters have been used (e.g. credit spreads) or broker quotes have been used that cannot be allocated to Level 1 or Level 2.
_ Loans which do not comply with the contractual cash flow criteria.
Unobservable inputs and sensitivity analysis for Level 3 measurements In case the fair value measurement of a financial asset is retrieved from input parameters which are not observable in the market, those parameters can be retrieved from a range of alternative parameters. For the preparation of the balance sheet the parameters where chosen to reflect the market situation at the reporting date.

79
Range of unobservable valuation parameters used in Level 3 measurements
Financial assets Type of instrument Fair value
in EUR million Valuation technique
Significant unobservable inputs
Range of unobservable inputs (weighted average)
Mar 21
Positive fair value of derivatives Forwards, swaps, options 86.9 Discounted cash flow and option models with CVA adjustment based on potential future exposure
PD 0.48%-100% (5.95%)
LGD 60%
Financial assets at FVPL
Fixed and variable coupon bonds
6.1 Discounted cash flow Credit Spread 0.81%-4.55% (2.60%)
Loans 734.9 Discounted cash flow PD 1.16%-6.10% (2.21%)
LGD 0%-68.22% (27.75%)
Financial assets at FVOCI Fixed and variable coupon bonds
83.1 Discounted cash flow Credit Spread 0.59%-5.31% (1.19%)
Financial assets at FVOCI / at FVPL
Non-trading equity instruments (participations)
234,4 Dividend Discount Model; Simplified Income Approach
Beta relevered
Industries: Insurance (General) 0.90-0.95 Recreation 0.96 Real Estate (General/Diversified) 0.78 ; Real Estate (Operations, Services) 0.49 Financial Svcs. (Non-bank & Insurance) 0.91-1.10 Banks (Regional) 0.51 Health Resort & Gesundheitszentrum GmbH 0.74
Country risk premium
Croatia 4.45%, Austria 0.35%-0.50%Czech Republic 0.90% Romania 3.26%, Russia 2.58%, Slovakia 1.26%, Hungary 3.26% Resulting cost of equity based on above inputs: 4.19%-12.83%
178.0 Adjusted Net Asset Value Adjusted Equity Depending on accounting equity of investment.
32.0 Market comparable companies
EV / SALES EV / EBITDA EV / EBIT P/E P/E (implicit) P/B
Depending on industry classification according to Damodaran.
Dez 20
Positive fair value of derivatives Forwards, swaps, options 75.5 Discounted cash flow and option models with CVA adjustment based on potential future exposure
PD 0.60%-100% (4.12%)
LGD 60%
Financial assets at FVPL
Fixed and variable coupon bonds
6.1 Discounted cash flow Credit Spread 0.81%-6.10% (4.51%)
Loans 687.0 Discounted cash flow PD 1,16%-6,10% (2,38%)
LGD 0%-68,22% (27,94%)
Financial assets at FVOCI Fixed and variable coupon bonds
132.3 Discounted cash flow Credit Spread 0.86%-6.52% (2.18%)
Financial assets at FVOCI / at FVPL
Non-trading equity instruments (participations)
236.0 Dividend Discount Model; Simplified Income Approach
Beta relevered
Industries: Insurance (General) 0.90-0.95; Recreation 0.96 Real Estate (General/Diversified) 0.78; Real Estate (Operations & Services) 0.49; Financial Svcs. (Non-bank & Insurance) 0.91-1.10 Banks (Regional) 0.51; Health Resort & Gesundheitszentrum GmbH 0.74
Country risk premium
Croatia 4.45%, Austria 0.35%-0.5% Czech Republic 0.90% Romania 3.26%, Russia 2.58%, Slovakia 1.26%, Hungary 3.26% Resulting cost of equity based on above inputs: 4.19%-12.83%
183.6 Adjusted Net Asset Value Adjusted Equity Depending on accounting equity of investment.
33.0 Market comparable companies
EV / SALES EV / EBITDA EV / EBIT P/E P/E (implicit) P/B
Depending on industry classification according to Damodaran.

80
In addition to the information above, equity instruments with a fair value in amount of EUR 21.9 million (2020: EUR 21.6 million) are assessed on the basis of expert opinions. Furthermore, for equity instruments other than participations classified as Level 3, the amount of EUR 50.1 million (2020: EUR 49.9 mil-lion) is presented in the statement of financial position using the criteria of availability and quality of broker quotes. Fair value changes per product type using reasonably possible alternatives
Dec 20 Mar 21
in EUR million Positive Negative Positive Negative
Derivatives 2.4 -2.3 3.4 -4.4
Income statement 2.4 -2.3 3.4 -4.4
Debt securities 11.7 -15.6 17.2 -22.9
Income statement 2.1 -2.8 4.1 -5.4
Other comprehensive income 9.6 -12.8 13.1 -17.5
Equity instruments 113.0 -73.4 109.9 -69.8
Income statement 73.1 -49.9 73.7 -47.8
Other comprehensive income 39.9 -23.5 36.2 -22.0
Loans 16.7 -35.4 11.8 -28.0
Income statement 16.7 -35.4 11.8 -28.0
Total 143.8 -126.7 142.3 -125.1
Income statement 94.3 -90.4 93.0 -85.6
Other comprehensive income 49.5 -36.3 49.3 -39.5
In estimating these impacts, mainly changes in credit spreads (for bonds), PDs, LGDs (for CVA of derivatives) and market values of com-parable equities were considered. An increase (decrease) of spreads, PDs and LGDs result in a decrease (increase) of the corresponding fair values. Positive correlation effects between PDs and LGDs were not taken into account in the sensitivity analysis. For non-trading equity instruments increases (decreases) in any of the inputs used for the cost of equity calculation in isolation would result in a lower (higher) fair value. The following ranges of reasonably possible alternatives of the unobservable inputs were considered in the sensitivity analysis table:
_ for debt securities range of credit spreads between +100 basis points and -75 basis points _ for equity related instruments the price range between -10% and +5% _ for unquoted equity instruments measured by the adjusted net asset value the price range between -10% and +10% _ for unquoted equity instruments measured by dividend discount model/simplified income approach the cost of equity range beween
-2% and +2% _ for CVA on derivatives PDs rating upgrade/downgrade by one notch, as well as the change of LGD by -5% and +10%. _ for loans, the PDs rating upgrade/downgrade by 1%, the change of LGD by -5% and +10% and a range of credit spreads between +100
basis points and -75 basis points.

81
Fair values of financial instruments for which fair value is disclosed in the notes
Dec 20 Mar 21
in EUR million Carrying amount
(balance sheet) Fair value Carrying amount
(balance sheet) Fair value
Assets
Cash and cash balances 35,839 35,839 53,954 53,954
Financial assets at AC 210,940 218,023 219,901 226,184
Loans and advances to banks 21,466 21,502 27,477 27,507
Loans and advances to customers 159,895 165,257 161,414 166,613
Debt securities 29,579 31,264 31,009 32,064
Finance lease receivables 4,127 4,124 4,094 4,099
Assets held for sale 4 4 4 4
Trade and other receivables 1,341 1,338 1,596 1,599
Liabilities
Financial liabilities at AC 235,125 235,688 262,669 262,672
Deposits from banks 24,771 24,763 35,288 35,133
Deposits from customers 190,816 191,098 205,144 205,070
Debt securities issued 19,020 19,309 21,535 21,768
Other financial liabilities 518 518 702 702
Financial guarantees and commitments
Financial guarantees n/a 5 n/a -19
Irrevocable commitments n/a 895 n/a 539
In the table above, positive fair values of financial guarantees and commitments are shown with a positive sign whereas negative fair values are shown with a negative sign. The fair value of loans and advances to customers and credit institutions has been calculated by discounting future cash flows while taking into consideration interest and credit spread effects. The interest rate impact is based on the movements of market rates, while credit spread changes are derived from PDs and LGDs used for internal risk calculations. For the calculation of fair value loans and advances were grouped into homogeneous portfolios based on rating method, rating grade, maturity and the country where they were granted. The fair values of debt securities at amortised cost are either taken directly from the market or they are determined by directly observable input parameters (i.e. yield curves). The fair value of deposits and other liabilities, measured at amortised cost, is estimated by taking into account the current interest rate environment, as well as the own credit spreads. These positions are assigned to the Level 3 category. For liabilities without contractual maturities (e.g. demand deposits), the carrying amount represents the minimum of their fair value. The fair value of issued securities and subordinated liabilities measured at amortized cost is determined based on quoted prices in active markets, if available. For issued securities where the fair value cannot be retrieved from quoted market prices, the fair value is calculated by discounting the future cash flows. Significant input factors for the spread adjustment of Erste Group’s own credit risk for the respective seniority class are credit spreads derived from liquid benchmark bonds and additional indications from external investments banks, which are provided on a regular basis. The applied spreads are validated on a regular basis from an independent Risk Management unit. Moreover optionality is taken into account when calculating the fair value. For off-balance sheet liabilities (i.e. financial guarantees and unused loan commitments) the following fair value approaches are applied: the fair value of unused loan commitments is estimated using regulatory credit conversion factors. The resulting loan equivalents are treated like other on-balance sheet assets. The difference between the calculated total fair value and the notional amount of the hypothetical loan equivalents represents the fair value of the unused loan commitments. In case of the total fair value being higher than the notional amount of the hypothetical loan equivalents the unused loan commitments have a positive fair value. The fair value of financial guarantees is estimated in analogy to credit default swaps. The fair value of the guarantee is the sum of the present value of the protection leg and the present value of the premium leg. The value of the protection leg is estimated using the PDs and LGDs of the respective customers, whereas the value of the premium leg is estimated by the present value of the future fee payments to be received. If the protection leg is higher than the premium leg, financial guarantees have a negative fair value.

82
33. Average number of employees during the financial period (weighted according to the level of employment)
1-3 20 1-3 21
Austria 16,334 15,939
Erste Group, EB Oesterreich and subsidiaries 9,198 8,895
Haftungsverbund savings banks 7,136 7,044
Outside Austria 31,141 29,687
Česká spořitelna Group 9,842 9,908
Banca Comercială Română Group 6,775 5,597
Slovenská sporiteľňa Group 4,067 3,755
Erste Bank Hungary Group 3,198 3,222
Erste Bank Croatia Group 3,306 3,285
Erste Bank Serbia Group 1,150 1,205
Savings banks subsidiaries 1,618 1,499
Other subsidiaries and foreign branch offices 1,185 1,216
Total 47,475 45,626
34. Own funds and capital requirements Regulatory Requirements Since 1 January 2014, Erste Group has been calculating the regulatory capital and the regulatory capital requirements according to the Capital Requirements Regulation (CRR) and the Capital Requirement Directive (CRD IV). The CRD IV was enacted in national law in the Austrian Banking Act (ABA). Regulatory scope of consolidation and institutional protection scheme The consolidated regulatory own funds and the consolidated regulatory capital requirements are calculated based on the scope of consoli-dation stipulated in the CRR. Based on Art. 4 para 1 (3), (16) to (27) CRR in line with Art. 18 and 19 CRR and para 30 ABA, the scope consists of credit institutions, investment firms, financial institutions and ancillary service undertakings. The definition pursuant to CRR differs from the scope of consolidation according to IFRS, which also includes insurance companies and other entities, that are subject to full consolidation. The Austrian savings banks are included as subsidiaries in Erste Group’s regulatory scope of consolidation based on the cross-guarantee contract of the Haftungsverbund. Furthermore, Erste Group Bank AG together with the savings banks forms an institutional protection scheme (IPS) according to Art. 113 para 7 CRR. Disclosure requirements for the institutional protection scheme according to Art. 113 para 7 e CRR are met by the publication of the consolidated financial statements, which cover all entities included in the institutional protection scheme. Accounting Principles The financial and regulatory figures published by Erste Group are based on IFRS. Consolidated own funds Own funds according to CRR consist of common equity tier 1 (CET1), additional tier 1 (AT1) and tier 2 (T2). In order to determine the capital ratios, each respective capital component – after application of all regulatory deductions and filters – is considered in relation to the total risk amount. The regulatory minimum capital ratios including the capital buffers as of 31 March 2021 amount to
_ 9.18% for CET1(4.5% CET1, +2.5% capital conservation buffer, +2.0% buffer for systemic vulnerability and for systemic concentration risk and +0.18% countercyclical capital buffer),
_ 10.68% for tier 1 capital (sum of CET1 and AT1) and _ 12.68% for total own funds.
Capital buffer requirements are set out in sections 23 (capital conservation buffer), 23a (countercyclical buffer), 23b (Global Systemic Important Institution (G-SII) buffer), 23c (Other Systemic Important Institution (O-SII) buffer) and 23d (systemic risk buffer) of the ABA and further specified in the regulation of the Financial Market Authority (FMA) on the establishment and recognition of the countercyclical buffer rate in accordance with section 23a para 3 ABA, on the establishment of the systemic risk buffer in accordance with section 23d para 3 ABA as well as on the detailed definition of the bases of calculation in accordance with section 23a para 3 clause 1 ABA and section 24 para 2 ABA (capital buffers regulation). All capital buffers have to be met entirely with CET1 capital and relate, except the countercyclical buffer, to total risk.

83
In addition to minimum capital ratios and capital buffer requirements, institutions also have to fulfil capital requirements determined in the Supervisory Review and Evaluation Process (SREP). The ECB Banking Supervision adjusted the SREP approach for 2020 in light of the Covid-19 crisis. Therefore the ECB has not issued a SREP decision 2020, but rather chose a pragmatic SREP 2020 approach keeping the SREP 2019 decision in place and confirming a Pillar 2 requirement (P2R) of 1.75%. The adjustments made to the regulatory framework on 12 March 2020 to stabilize the financial markets remain in place. The originally envisaged relief for 2021 regarding the composition of capital for the Pillar 2 requirement under article 104a (4) CRD V can be applied directly by credit institutions under the supervision of the ECB. Therefore, the minimum CET1 ratio of 5.48% encompasses the Pillar 1 minimum requirement of 4.5% and the Pillar 2 requirement of 0.98% (56.25% of 1.75%) as of 31 March 2021. The regulatory minimum capital ratios including the capital buffers and SREP requirements as of 31 March 2021 amount to
_ a CET1 requirement of 10.16%, (Pillar 1 requirement of 4.5%, combined capital buffers of 4.68% and 56.25% of 1.75% Pillar 2 requirement)
_ a T1 requirement of 11.99% (CET1 requirement plus Pillar 1 AT1 requirement of 1.5% and 18.75% of 1.75% Pillar 2 requirement) and
_ a total own funds requirement of 14.43% (Tier 1 requirement plus Pillar 1 T2 requirement of 2.0% and 25% of 1.75% Pillar 2 requirement).
Following the SREP 2019, Erste Group is expected to meet a Pillar 2 Guidance (P2G) of 1.0% valid as of 1 January 2020 onwards. The ECB press release of 12 March 2020 also indicated that the Pillar 2 Guidance need not be fully complied with temporarily by credit insti-tutions during the current Covid-19 crisis. The Pillar 2 Guidance is not MDA (maximum distributable amount) relevant. Overview of capital requirements and capital buffers (not taking into account temporary adjustments) Dec 20 Mar 21
Pillar 1
Minimum CET1 requirement 4.50% 4.50%
Minimum Tier 1 requirement 6.00% 6.00%
Minimum Own Funds requirements 8.00% 8.00%
Combined buffer requirement (CBR) 4.68% 4.68%
Capital conservation buffer 2.50% 2.50%
Institution-specific countercyclical capital buffer 0.18% 0.18%
Systemic risk buffer (SRB) 2.00% 2.00%
O-SII capital buffer 2.00% 2.00%
Minimum CET 1 requirement (incl. CBR) 9.18% 9.18%
Minimum Tier 1 requirement (incl. CBR) 10.68% 10.68%
Minimum Own Funds requirement (incl. CBR) 12.68% 12.68%
Pillar2
Minimum CET1 requirement 0.98% 0.98%
Minimum T1 requirement 1.31% 1.31%
Minimum Own Funds requirement 1.75% 1.75%
Pillar 2 requirement (P2R) 1.75% 1.75%
Total CET1 requirement for Pillar 1 and Pillar 2 10.16% 10.16%
Total Tier 1 requirement for Pillar 1 and Pillar 2 11.99% 11.99%
Total Own Funds requirement for Pillar 1 and Pillar 2 14.43% 14.43%
The combined buffer requirement is the sum of the capital conservation buffer, the countercyclical capital buffer and the maximum of the O-SII capital buffer or the systemic risk buffer. As announced by the European Central Bank (ECB) in its press release on 12 March 20201, Erste Group is not obliged to fully comply with the capital conservation buffer of 2.5% during the current Covid-19 crisis. In the "Frequently Asked Questions - FAQs"2 published on 20 March 2020, however, the ECB states that the incomplete fulfillment of the combined buffer requirement leads to restrictions on distribu-tions and banks are only allowed to make distributions within the limits of the maximum distributable amount (MDA). Taking into account ECB’s communication on the temporary capital relief measures with regard to the Pillar 2 requirement, the full usage of the capital conservation buffer as well as the Pillar 2 guidance (P2G), Erste Group’s CET1 requirement amounts to 7.66%, its T1 require-ment amounts to 9.49% and its total own funds requirement amounts to 11.93%.
1 https://www.bankingsupervision.europa.eu/press/pr/date/2020/html/ssm.pr200312~43351ac3ac.en.html 2 https://www.bankingsupervision.europa.eu/press/pr/date/2020/html/ssm.pr200320_FAQs~a4ac38e3ef.en.html

84
Capital structure
Dec 20 Mar 21
in EUR million Phased-in Final Phased-in Final
Common equity tier 1 capital (CET1)
Capital instruments eligible as CET1 2,337 2,337 2,337 2,337
Retained earnings 13,002 13,002 12,987 12,987
Accumulated other comprehensive income -1,690 -1,690 -1,796 -1,796
Minority interest recognised in CET1 4,891 4,891 4,884 4,884
Common equity tier 1 capital (CET1) before regulatory adjustments 18,540 18,540 18,411 18,411
Own CET1 instruments -63 -63 -54 -54
Prudential filter: cash flow hedge reserve -36 -36 18 18
Prudential filter: cumulative gains and losses due to changes in own credit risk on fair valued liabilities 289 289 289 289
Prudential filter: fair value gains and losses arising from the institution's own credit risk related to derivative liabilities -3 -3 -5 -5
Value adjustments due to the requirements for prudent valuation -58 -58 -65 -65
Securitisations with a risk weight of 1,250% -29 -29 -10 -10
Goodwill -544 -544 -544 -544
Other intangible assets -720 -720 -693 -693
Deferred tax assets dependent upon future profitability and not temporary differences net of associated tax liabilities -48 -48 -48 -48
IRB shortfall of credit risk adjustments to expected losses 0 0 0 0
CET1 capital elements or deductions – other -270 -270 -300 -300
Common equity tier 1 capital (CET1) 17,057 17,057 16,997 16,997
Additional tier 1 capital (AT1)
Capital instruments eligible as AT1 2,733 2,733 2,733 2,733
Instruments issued by subsidiaries that are given recognition in AT1 7 7 6 6
Additional tier 1 capital (AT1) before regulatory adjustments 2,740 2,740 2,739 2,739
Own AT1 instruments -2 -2 -2 -2
Additional tier 1 capital (AT1) 2,738 2,738 2,738 2,738
Tier 1 capital - total of common equity tier 1 (CET1) and additional tier 1 (AT1) 19,795 19,795 19,735 19,735
Tier 2 capital (T2)
Capital instruments and subordinated loans eligible as T2 3,222 3,222 3,069 3,069
Instruments issued by subsidiaries recognised in T2 209 209 209 209
IRB excess of provisions over expected losses eligible 467 467 478 478
Tier 2 capital (T2) before regulatory adjustments 3,899 3,899 3,756 3,756
Own T2 instruments -50 -50 -51 -51
Tier 2 capital (T2) 3,848 3,848 3,704 3,704
Total own funds 23,643 23,643 23,439 23,439
Capital requirement 9,440 9,612 9,523 9,680
CET1 capital ratio 14.5% 14.2% 14.3% 14.0%
Tier 1 capital ratio 16.8% 16.5% 16.6% 16.3%
Total capital ratio 20.0% 19.7% 19.7% 19.4%
The position CET1 elements or deduction – Others include development of unaudited risk provisions during the year (EU No 183/2014) and starting with year end 2020 also insufficient coverage for non-performing exposures (NPE Backstop) covering the requirements from both Art. 36 para 1 (m) CRR in connection with Art. 47(c) CRR and the Addendum to the ECB Guidance to banks on non-performing loans: supervisory expectations for prudential provisioning of non-performing exposures. The capital structure table above is based on the Commission Implementing Regulation (EU) 1423/2013 with regard to disclosure of own funds requirements, enlarged by the EBA GL 2014/14. Positions, which are not relevant for Erste Group are not disclosed. Figures shown under full implementation of Basel 3 considered the current CRR. On 15 March 2021, the ECB granted permission to revert to the use of the Standardised Approach for the exposures of Erste Group Bank AG classified as Specialised Lending Object Finance. The implementation of this change is planned for the second quarter of 2021 and will lead to an insignificant increase in the RWA. Following the application from February 2019, Erste Group Bank AG received on 3 March 2021, the ECB’s draft decision on the material model change related to the LGD model. The draft decision foresees the implementation of specific RWA add-ons with the go-live of the new model. The final impact on the credit risk related RWAs will be defined, once the ECB decision has been finalized (expected in the second quarter of 2021).

85
Following the finalization of the horizontal analysis of ECB, a new decision complementing the initial TRIM (Targeted Review of Internal Models) Market risk decision from October 2018 has been issued in February 2021. This new, follow-up decision requires the implemen-tation of multiplicator factors, which led to an immaterial increase of the RWAs for market risk as of 31 March 2021. The AMA-model related add-on, which was implemented in the fourth quarter of 2018, has been removed after the respective confirmation from the regulator. This led to a reduction of approximately EUR 700 million RWA on Erste Group’s consolidated level as of 31 March 2021. Risk structure
Dec 20 Mar 21
in EUR million Total risk
(phased-in)
Capital requirement (phased-in)
Total risk (phased-in)
Capital requirement (phased-in)
Total risk exposure amount 118,005 9,440 119,038 9,523
Risk-weighted assets (credit risk) 95,923 7,674 97,317 7,785
Standardised approach 18,056 1,444 17,694 1,416
IRB approach 77,852 6,228 79,622 6,370
Contribution to the default fund of a CCP 15 0 1 0
Settlement risk 1 0 0 0
Trading book, foreign FX risk and commodity risk 3,630 290 3,759 301
Operational risk 14,813 1,185 14,240 1,139
Exposure for CVA 397 32 473 38
Other exposure amounts (including Basel 1 floor) 3,241 259 3,249 260
Dec 20 Mar 21
in EUR million Total risk (final)
Capital requirement
(final) Total risk
(final)
Capital requirement
(final)
Total risk exposure amount 120,151 9,612 121,003 9,680
Risk-weighted assets (credit risk) 98,069 7,846 99,282 7,943
Standardised approach 18,065 1,445 17,703 1,416
IRB approach 79,988 6,399 81,578 6,526
Contribution to the default fund of a CCP 15 0 1 0
Settlement risk 1 0 0 0
Trading book, foreign FX risk and commodity risk 3,630 290 3,759 301
Operational risk 14,813 1,185 14,240 1,139
Exposure for CVA 397 32 473 38
Other exposure amounts (including Basel 1 floor) 3,241 259 3,249 260
35. Events after the reporting date There are no significant events after the balance sheet date.

86
Abbreviations ABA Austrian Banking Act
AC Amortized cost
AFS Available for sale
ALM Asset Liability Management
AT1 Additional Tier 1
BCR Banca Comercialǎ Romȃnlǎ S.A.
ALM & LCC Asset/LiabiltyManagement & Local Corporate Center
CEE Central and Eastern Europe
CIS Commonwealth of Independent States
CRD Capital Requirements Directive
CRR Capital Requirements Regulation
CSAS Česká spořitelna, a.s.
CVA Credit Value Adjustments
EBA European Banking Authority
EBC Erste Bank Croatia
EBH Erste Bank Hungary Zrt.
EBOe Erste Bank Oesterreich
EBOe & Subs Erste Bank Oesterreich and Subsidiaries
ECL Expected Credit Loss
EIR Effective interest rate
EU European Union
FVO Fair value option-designated at fair value
FVOCI Fair value through other comprehensive income
FVPL Fair value through profit or loss
FX Foreign exchange
G-SII Global Systemic Important Institution
HFT Held for trading
HTM Held to maturity
IAS International Accounting Standards
IFRS International Financial Reporting Standards
LGD Loss Given Default
L&R Loans and receivables
MDA Maximum distributable amount
NPL Non-performing loans
OCI Other comprehensive income
O-SII Other Systemic Important Institution
P2G Pillar 2 Guidance
P2R Pillar 2 Requirement
P&L Profit or loss
PD Probability of Default
POCI Purchased or originated credit impaired
RTS Regulatory Technical Standards
RW Risk weight
RWA Risk Weighted Assets
SICR Significant increase in credit risk
SLSP Slovenská sporiteľňa
SPPI Solely payments of principal and interest
SREP Supervisory Review and Evaluation Process
T1 Tier 1
T2 Tier 2
VAR Value at Risk

Your Notes

Your Notes

We have prepared this report with the greatest possible care and have thoroughly checked the data presented in it. However, we cannot rule out errors associated with rounding, transmission, typesetting or printing. The English version of the report is a translation. Note regarding forward-looking statements This report contains forward-looking statements. These statements are based on current estimates, assumptions and projections of Erste Group Bank AG and currently available public information. They are not guarantees of future performance and involve certain known and yet unknown risks and uncertainties and are based upon assumptions as to future events that may not prove to be accurate. Many factors could cause the actual results or performance to be materially different from those that may be expressed or implied by such statements. Erste Group Bank AG does not assume any obligation to update the forward-looking statements contained in this report.

Shareholder Events
19 May 2021 Annual General Meeting30 July 2021 Half-year financial report 20212 November 2021 Results for the first three quarters of 2021
The financial calendar is subject to change. The latest updated version is available on Erste Group’s website:
www.erstegroup.com/investorrelations
Group Investor Relations
Erste Group Bank AG Am Belvedere 11100 ViennaAustria
Phone: +43 (0) 5 0100 - 17731Email: [email protected]: www.erstegroup.com/investorrelations
Thomas SommerauerPhone: +43 (0) 5 0100 - 17326Email: [email protected]
Peter MakrayPhone: +43 (0) 5 0100 - 16878Email: [email protected]
Simone PilzPhone: +43 (0) 5 0100 - 13036Email: [email protected]
Gerald KramesPhone: +43 (0) 5 0100 - 12751Email: [email protected]
Ticker Symbols
Reuters: ERST.VIBloomberg: EBS AVDatastream: 0:ERSISIN: AT0000652011
www.erstegroup.com