interim report january–march 2021 - securitas.com
TRANSCRIPT

Interim ReportJanuary–March 2021
1

25 814Total sales, MSEK
4.9%Operating margin
1.86Earnings per share, SEK
January–March 2021
• Total sales MSEK 25 814 (28 420)
• Organic sales growth 0 percent (2)
• Operating income before amortization MSEK 1 256 (1 086)
• Operating margin 4.9 percent (3.8)
• Items affecting comparability (IAC) MSEK –136 (–45), relating to transformation programs and the cost-savings program in the Group
• Earnings per share SEK 1.86 (1.61)
• Earnings per share, before IAC, SEK 2.11 (1.70)
• Net debt/EBITDA 2.1 (2.4)
• Cash flow from operating activities 102 percent (34)
CONTENTS
Comments from the President and CEO 3January–March summary 4Group development 5Development in the Group’s business segments 6Cash flow 9Capital employed and financing 10Acquisitions and divestitures 11
Other significant events 12Risks and uncertainties 12Parent Company operations 13Consolidated financial statements 14Segment overview 18Notes 19Parent Company 25Financial information 26
2Securitas AB Interim Report January–March 2021

“A good start to the year while continuing the transformation journey”
Comments from the President and CEO
A RESILIENT BUSINESSThe Group’s organic sales growth in the first quarter was 0 percent (2), with all business segments showing positive organic sales growth in the month of March. Although we are seeing signs of commercial activity picking up through out the Group, the corona pandemic continues to hamper organic sales growth. The airport security business remains significantly negatively impacted, primarily in Security Services Europe, but we continue to improve profitability through contract reviews.
Sales reductions in the contract port-folio, primarily related to the corona pandemic, were partly offset by the increased level of corona-related extra sales, which continued from 2020 into the first quarter.
The installation business within electronic security continued to be burdened by the corona pandemic, while the strategic acquisitions of STANLEY Security in five countries and FE Moran Security Solutions in the US contributed positively to both sales and profitability in the quarter with the integration work progressing according to plan. Security solutions and electronic security sales was 22 percent (22) of total Group sales in the first quarter.
The operating result for the Group, adjusted for changes in exchange rates, increased by 30 percent and the oper-ating margin was 4.9 percent (3.8) with improvements in all business segments and also supported by the cost-savings program initiated during 2020.
Support from government grants relating mostly to employees on temporary unemployment continued, and total price adjustments in the Group were on par with wage cost increases in the first quarter.
Profitability improvement is a key focus area and we are thus working actively with contract portfolio management across the Group.
The Group delivered a strong cash flow, albeit at lower organic sales growth, supported by a strong focus on accounts receivable. CORONA PANDEMICThe corona pandemic continues to be a substantial challenge in our day-to-day operations as we close the first quarter of 2021. Our priorities remain the same since January 2020 and are to protect our people, to handle our clients’ changing needs in the most professional way possible, to control our costs and to carefully manage cash.
While there is still significant un-certainty regarding the long-term consequences of the pandemic, we are coming out stronger thanks to having taken action early. Together with a clear focus and solid finances we have strength and leverage to tackle further challenges.
COMMITTED TO TRANSFORMATION TARGETSThe business transformation program in Europe and Ibero-America that was announced in the beginning of the year is progressing according to plan, as do our other transformation programs. During the first quarter we also announced an update to our brand to reflect our transformation journey, and to support our position as the leading Intelligent Protective Services Partner.
We are confident that these programs will change the business mix and we are fully committed to achieve the related margin targets.
Securitas entered 2021 stronger and more focused, with a clear commitment to continue the transformation journey despite continued global uncertainty. The performance in the first quarter of 2021 confirms the direction and ambition for the years ahead.
Magnus AhlqvistPresident and CEO
3Securitas AB Interim Report January–March 2021

January–March summary
FINANCIAL SUMMARY
MSEK
Q1 Change, % Full year Change, %
2021 2020 Total Real 2020 Total
Sales 25 814 28 420 –9 1 107 954 –3
Organic sales growth, % 0 2 0
Operating income before amortization 1 256 1 086 16 30 4 892 –15
Operating margin, % 4.9 3.8 4.5
Amortization of acquisition-related intangible assets –65 –72 –286
Acquisition-related costs –29 –17 –137
Items affecting comparability * –136 –45 –640
Operating income after amortization 1 026 952 8 19 3 829 –26
Financial income and expenses –94 –144 –500
Income before taxes 932 808 15 27 3 329 –28
Net income for the period 680 588 16 28 2 416 –28
Earnings per share, SEK 1.86 1.61 16 27 6.63 –28
EPS before items affecting comparability, SEK 2.11 1.70 24 36 8.02 –17
Cash flow from operating activities, % 102 34 147
Free cash flow 796 –324 5 944
Net debt to EBITDA ratio 2.1 2.4 2.1
* Refer to note 7 on page 22 for further information.
ORGANIC SALES GROWTH AND OPERATING MARGIN DEVELOPMENT PER BUSINESS SEGMENT
%
Organic sales growth Operating margin
Q1 Q1
2021 2020 2021 2020
Security Services North America 3 2 5.9 5.2
Security Services Europe –1 0 5.1 3.6
Security Services Ibero-America –2 9 5.2 4.4
Group 0 2 4.9 3.8
4Securitas AB Interim Report January–March 2021
Organic sales growth, %
QUARTERLY SALES DEVELOPMENT
19000
21000
23000
25000
27000
29000
Q12021
Q42020
Q32020
Q22020
Q12020
MSEK
–5
–3
–1
1
3
5
%
28420
26556 26501 2647725814
Operating margin, %
QUARTERLY OPERATING INCOME DEVELOPMENT
500
700
900
1 100
1300
1500
Q12021
Q42020
Q3 2020
Q22020
Q12020
MSEK
3.5
4.0
4.5
5.0
5.5
6.0
%
1 086 1 075
1 327
1 404
1 256
Group development
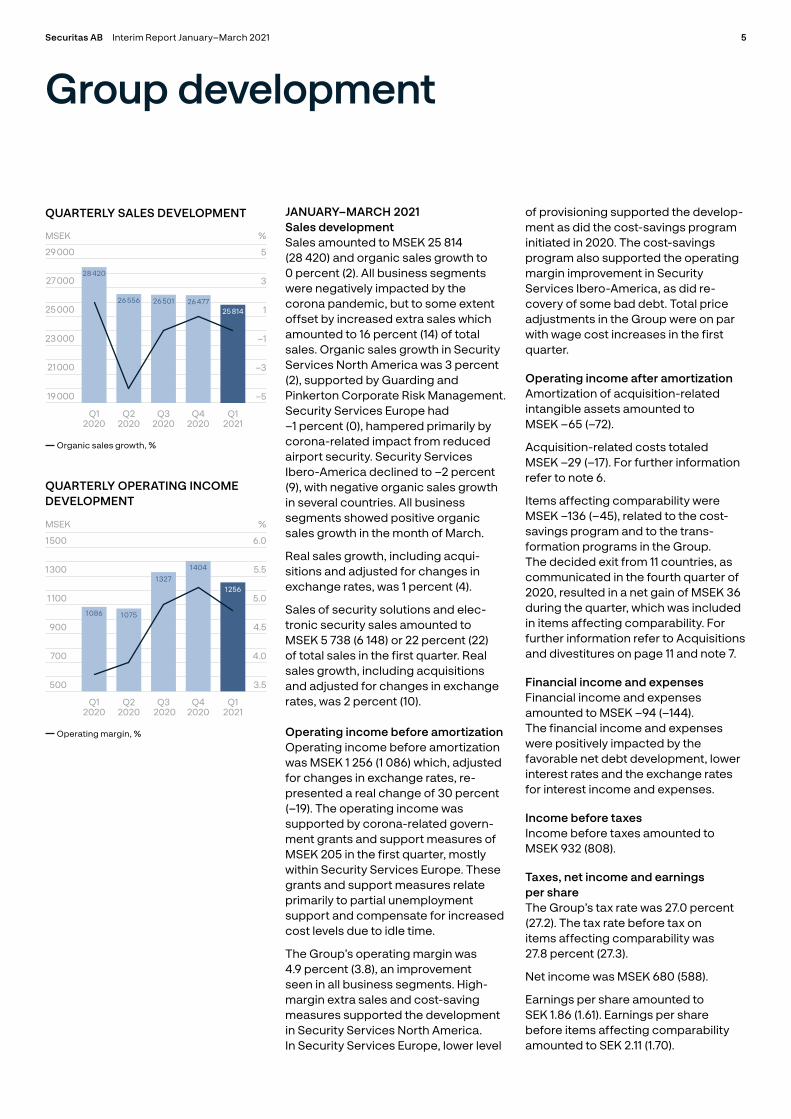
JANUARY–MARCH 2021Sales developmentSales amounted to MSEK 25 814 (28 420) and organic sales growth to 0 percent (2). All business segments were negatively impacted by the corona pandemic, but to some extent offset by increased extra sales which amounted to 16 percent (14) of total sales. Organic sales growth in Security Services North America was 3 percent (2), supported by Guarding and Pinkerton Corporate Risk Management. Security Services Europe had –1 percent (0), hampered primarily by corona-related impact from reduced airport security. Security Services Ibero-America declined to –2 percent (9), with negative organic sales growth in several countries. All business segments showed positive organic sales growth in the month of March.
Real sales growth, including acqui-sitions and adjusted for changes in exchange rates, was 1 percent (4).
Sales of security solutions and elec-tronic security sales amounted to MSEK 5 738 (6 148) or 22 percent (22) of total sales in the first quarter. Real sales growth, including acquisitions and adjusted for changes in exchange rates, was 2 percent (10).
Operating income before amortizationOperating income before amortization was MSEK 1 256 (1 086) which, adjusted for changes in exchange rates, re-presented a real change of 30 percent (–19). The operating income was supported by corona-related govern-ment grants and support measures of MSEK 205 in the first quarter, mostly within Security Services Europe. These grants and support measures relate primarily to partial unemployment support and compensate for increased cost levels due to idle time.
The Group’s operating margin was 4.9 percent (3.8), an improvement seen in all business segments. High-margin extra sales and cost-saving measures supported the development in Security Services North America. In Security Services Europe, lower level
of provisioning supported the develop-ment as did the cost- savings program initiated in 2020. The cost-savings program also supported the operating margin improvement in Security Services Ibero-America, as did re-covery of some bad debt. Total price adjustments in the Group were on par with wage cost increases in the first quarter.
Operating income after amortizationAmortization of acquisition- related in tangible assets amounted to MSEK –65 (–72).
Acquisition-related costs totaled MSEK –29 (–17). For further information refer to note 6.
Items affecting comparability were MSEK –136 (–45), related to the cost- savings program and to the trans-formation programs in the Group. The decided exit from 11 countries, as communi cated in the fourth quarter of 2020, resulted in a net gain of MSEK 36 during the quarter, which was included in items affecting comparability. For further information refer to Acquisitions and divestitures on page 11 and note 7.
Financial income and expensesFinancial income and expenses amounted to MSEK –94 (–144). The financial income and expenses were positively impacted by the favorable net debt development, lower interest rates and the exchange rates for interest income and expenses.
Income before taxes Income before taxes amounted to MSEK 932 (808).
Taxes, net income and earnings per shareThe Group’s tax rate was 27.0 percent (27.2). The tax rate before tax on items affecting comparability was 27.8 percent (27.3).
Net income was MSEK 680 (588).
Earnings per share amounted to SEK 1.86 (1.61). Earnings per share before items affecting comparability amounted to SEK 2.11 (1.70).
5Securitas AB Interim Report January–March 2021

Organic sales growth, %
QUARTERLY SALES DEVELOPMENT
8000
9000
10000
11000
12000
13000
Q12021
Q42020
Q32020
Q22020
Q12020
MSEK
–4
–2
0
2
4
6
%
12647
11 98011 606 11 568
11 374
Operating margin, %
QUARTERLY OPERATING INCOME DEVELOPMENT
100
250
400
550
700
850
Q12021
Q42020
Q32020
Q22020
Q12020
MSEK
3.0
4.0
5.0
6.0
7.0
8.0
%
652 666
742 740
675
Development in the Group’s business segments
Security Services North AmericaSecurity Services North America provides protective services in the US, Canada and Mexico. The operations in the US are organized in four specialized units – Guarding, Electronic Security, Pinkerton Corporate Risk Management and Critical Infrastructure Services. There is a unit for global and national clients and specialized client segment units, such as aviation, healthcare, manufacturing and oil and gas.
MSEK
Q1 Change, % Full year
2021 2020 Total Real 2020
Total sales 11 374 12 647 –10 3 47 801
Organic sales growth, % 3 2 2
Share of Group sales, % 44 45 44
Operating income before amortization 675 652 4 18 2 800
Operating margin, % 5.9 5.2 5.9
Share of Group operating income, % 54 60 57
JANUARY–MARCH 2021Organic sales growth was 3 percent (2), supported by the business units Guarding and Pinkerton Corporate Risk Management. The level of corona- related extra sales within Guarding remained high in the quarter. Critical Infrastructure Services and Electronic Security hampered organic sales growth due to impacts from the corona pandemic, although Electronic Security showed positive organic sales growth in the month of March. The client retention rate was 90 percent (92), excluding the effect of corona-related temporary reductions.
Security solutions and electronic security sales represented MSEK 2 039 (2 304) or 18 percent (18) of total sales in the business segment in the first quarter.
The operating margin was 5.9 percent (5.2), an improvement supported by all business units. Guarding improved as a result of the corona-related change in the business mix with an increased share of extra sales. Critical Infrastructure Services improved compared to the first quarter last year primarily due to cost-saving measures.
Cost-saving measures also supported Electronic Security, as did the acqui-sition of FE Moran Security Solutions. The improvement in Pinkerton was primarily driven from leverage from the sales growth.
The Swedish krona exchange rate strengthened against the US dollar, which had a negative effect on operating income in Swedish kronor. The real change was 18 percent (–6) in the first quarter.
6Securitas AB Interim Report January–March 2021

Organic sales growth, %
QUARTERLY SALES DEVELOPMENT
7000
8000
9000
10000
11000
12000
Q12021
Q42020
Q32020
Q22020
Q12020
MSEK
–8
–6
–4
–2
0
2
%
11 659
1092411 284 11 321
10873
Operating margin, %
QUARTERLY OPERATING INCOME DEVELOPMENT
200
300
400
500
600
700
Q12021
Q42020
Q32020
Q22020
Q12020
MSEK
2.0
3.0
4.0
5.0
6.0
7.0
%
418
395
574
682
556
Security Services EuropeSecurity Services Europe provides protective services with operations in 22 countries. The full range of protective services includes on-site, mobile and remote guarding, electronic security, fire and safety services and corporate risk management. In addition there is a specialized unit for global clients and one for security solutions.
MSEK
Q1 Change, % Full year
2021 2020 Total Real 2020
Total sales 10 873 11 659 –7 0 45 188
Organic sales growth, % –1 0 –2
Share of Group sales, % 42 41 42
Operating income before amortization 556 418 33 41 2 069
Operating margin, % 5.1 3.6 4.6
Share of Group operating income, % 44 38 42
JANUARY–MARCH 2021Organic sales growth was –1 percent (0). The decline was mainly explained by the significant negative impact on airport security due to the corona pandemic that started in March 2020. Organic sales growth in the business segment was positive in the month of March, while airport security remained negative. A few countries had positive organic sales growth, including Sweden, Denmark and the guarding business in Turkey. The client retention rate was 92 percent (89), excluding the effect of corona-related temporary reductions.
Security solutions and electronic security sales represented MSEK 2 640 (2 679) or 24 percent (23) of total sales in the business segment.
The operating margin was 5.1 percent (3.6), where the comparative was significantly impacted by the corona pandemic that started in March 2020. Corona-related government grants in several countries have reduced the negative impact from the corona pandemic. The improvement was supported by the cost-savings program that was initiated in the Group in 2020
and by returning to lower cost levels of provisioning for any bad debt. Change in the business mix, including lower airport security sales, also supported the operating margin. Most countries in the business segment contributed to the operating margin development.
The Swedish krona exchange rate strengthened against foreign currencies, primarily the euro, which had a negative effect on operating income in Swedish kronor. The real change was 41 percent (–27) in the first quarter.
7Securitas AB Interim Report January–March 2021 Development in the Group’s business segments
Organic sales growth, %
QUARTERLY SALES DEVELOPMENT
0
800
1600
2400
3200
4000
Q12021
Q42020
Q32020
Q22020
Q12020
MSEK
–10
–5
0
5
10
15
%
3460
3044 3045 3003 2957
Operating margin, %
QUARTERLY OPERATING INCOME DEVELOPMENT
100
115
130
145
160
175
Q12021
Q42020
Q32020
Q22020
Q12020
MSEK
2.0
3.0
4.0
5.0
6.0
7.0
%
152
120
138
160
153
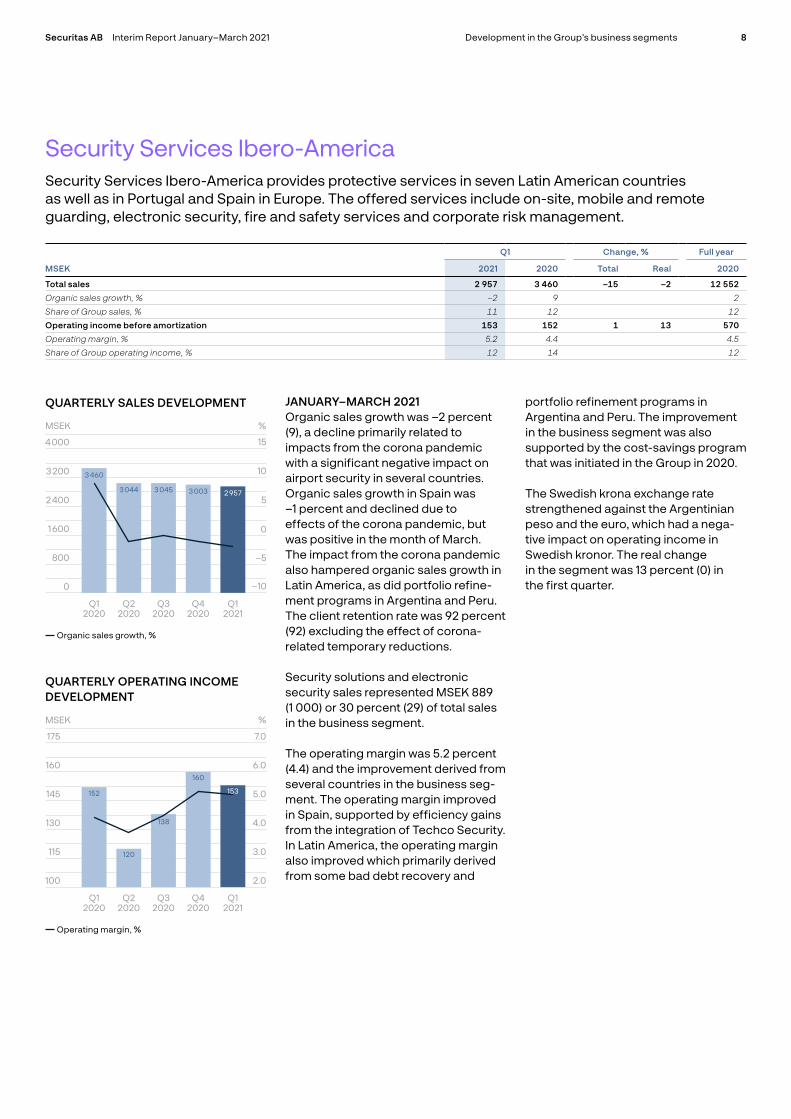
Security Services Ibero-AmericaSecurity Services Ibero-America provides protective services in seven Latin American countries as well as in Portugal and Spain in Europe. The offered services include on-site, mobile and remote guarding, electronic security, fire and safety services and corporate risk management.
MSEK
Q1 Change, % Full year
2021 2020 Total Real 2020
Total sales 2 957 3 460 –15 –2 12 552
Organic sales growth, % –2 9 2
Share of Group sales, % 11 12 12
Operating income before amortization 153 152 1 13 570
Operating margin, % 5.2 4.4 4.5
Share of Group operating income, % 12 14 12
JANUARY–MARCH 2021Organic sales growth was –2 percent (9), a decline primarily related to impacts from the corona pandemic with a significant negative impact on airport security in several countries. Organic sales growth in Spain was –1 percent and declined due to effects of the corona pandemic, but was positive in the month of March. The impact from the corona pandemic also hampered organic sales growth in Latin America, as did portfolio refine-ment programs in Argentina and Peru. The client retention rate was 92 percent (92) excluding the effect of corona- related temporary reductions.
Security solutions and electronic security sales represented MSEK 889 (1 000) or 30 percent (29) of total sales in the business segment.
The operating margin was 5.2 percent (4.4) and the improvement derived from several countries in the business seg-ment. The operating margin improved in Spain, supported by efficiency gains from the integration of Techco Security. In Latin America, the operating margin also improved which primarily derived from some bad debt recovery and
portfolio refinement programs in Argentina and Peru. The improvement in the business segment was also supported by the cost-savings program that was initiated in the Group in 2020.
The Swedish krona exchange rate strengthened against the Argentinian peso and the euro, which had a nega-tive impact on operating income in Swedish kronor. The real change in the segment was 13 percent (0) in the first quarter.
8Securitas AB Interim Report January–March 2021 Development in the Group’s business segments

QUARTERLY FREE CASH FLOW
–500
0
500
1000
1500
2000
2500
3000
Q12021
Q42020
Q32020
Q22020
Q12020
–324
2439 2409
1420
796
MSEK
Cash flow
JANUARY–MARCH 2021Cash flow from operating activities amounted to MSEK 1 283 (372), equiva-lent to 102 percent (34) of operating income before amortization. This is a strong cash flow, especially for a first quarter in the year, resulting from a strong focus on accounts receivable and also due to lower organic sales growth.
The impact from changes in accounts receivable was MSEK 140 (–654). Changes in other operating capital employed were MSEK –118 (–3). While some of the previously postponed payments under various government support schemes have been made, the large amount in the North American operations of approximately MSEK 1 300 is only due to be paid later in the year and in 2022.
Financial income and expenses paid was MSEK –242 (–290) and current taxes paid was MSEK –245 (–406).
Cash flow from operating activities in-cludes net investments in non- current tangible and intangible assets, amount-ing to MSEK 5 (–57), also including capital expenditures in equipment
for solutions contracts. The net in-vestments result from invest ments of MSEK –638 (–753) and re versal of depreciation of MSEK 643 (696).
Free cash flow was MSEK 796 (–324), equivalent to 92 percent (–47) of adjusted income.
Cash flow from investing activities, acquisitions and divestitures, was MSEK –179 (–354). Refer to note 6 for further information.
Cash flow from items affecting compar ability amounted to MSEK –170 (–60). Refer to note 7 for further infor-mation.
Cash flow from financing activities was MSEK 225 (1 646) due to a net increase in borrowings.
Cash flow for the period was MSEK 672 (908). The closing balance for liquid funds after translation differences of MSEK 49 was MSEK 5 441 (4 720 as of December 31, 2020).
FREE CASH FLOWMSEK Jan–Mar 2021
Operating income before amortization 1 256
Net investments 5
Change in accounts receivable 140
Change in other operating capital employed –118
Cash flow from operating activities 1 283
Financial income and expenses paid –242
Current taxes paid –245
Free cash flow 796
9Securitas AB Interim Report January–March 2021

NET DEBT TO EBITDA RATIO
Q12021
Q42020
Q32020
Q22020
Q12020
1.3
1.6
1.9
2.2
2.5
2.8
Capital employed and financing
CAPITAL EMPLOYED AS OF MARCH 31, 2021The Group’s operating capital employed was MSEK 9 408 (8 893 as of December 31, 2020), corresponding to 9 percent of sales (8 as of December 31, 2020), adjusted for the full-year sales figures of acquired units. The trans-lation of foreign operating capital employed to Swedish kronor increased the Group’s operating capital employed by MSEK 432.
The Group’s total capital employed was MSEK 33 761 (32 042 as of December 31, 2020). The translation of foreign capital employed to Swedish kronor increased the Group’s capital employed by MSEK 1 462. The return on capital employed was 13 percent (13 as of December 31, 2020).
FINANCING AS OF MARCH 31, 2021The Group’s net debt amounted to MSEK 14 502 (14 335 as of December 31, 2020). The net debt was positively impacted mainly by the free cash flow of MSEK 796, while it was negatively impacted mainly by translation differ-ences of MSEK –545, net payments for acquisitions and divestitures of MSEK –179 and payments for items affecting comparability of MSEK –170.
The net debt to EBITDA ratio was 2.1 (2.4). The free cash flow to net debt ratio amounted to 0.49 (0.18). The interest coverage ratio amounted to 10.2 (9.0).
Securitas has a Revolving Credit Facility with its ten key relationship banks. The credit facility comprises one tranche of MEUR 938 originally matur-ing in 2025. In April 2021, the maturity was extended to 2026 and there is a possibility to extend for another year in 2022. It was undrawn on March 31, 2021.
In February 2021, Securitas issued a MEUR 350 Eurobond in a 7-year deal under its existing MEUR 4 000 EMTN (Euro Medium Term Note) program. The coupon rate was set at 0.250 percent and the maturity date is February 22, 2028. The proceeds will be used to refinance existing credit facilities and for general corporate purposes. The joint lead managers were BBVA, Citi, ING, KBC and SEB.
Standard and Poor’s rating for Securitas is BBB/A-2 with a stable outlook.
Further information regarding financial instruments and credit facilities is provided in note 9.
Shareholders’ equity amounted to MSEK 19 259 (17 707 as of December 31, 2020). The translation of foreign assets and liabilities into Swedish kronor increased shareholders’ equity by MSEK 917. Refer to the statement of comprehensive income on page 14 for further information.
The total number of shares amounted to 365 058 897 (365 058 897) as of March 31, 2021. Refer to page 17 for further information.
CAPITAL EMPLOYED AND FINANCINGMSEK Mar 31, 2021
Operating capital employed 9 408
Goodwill 22 378
Acquisition-related intangible assets 1 646
Shares in associated companies 329
Capital employed 33 761
Net debt 14 502
Shareholders' equity 19 259
Financing 33 761
NET DEBT DEVELOPMENTMSEK Jan–Mar 2021
Opening balance –14 335
Free cash flow 796
Acquisitions/divestitures –179
Items affecting comparability –170
Lease liabilities –5
Change in net debt 442
Revaluation –64
Translation –545
Closing balance –14 502
10Securitas AB Interim Report January–March 2021

Acquisitions and divestitures
ACQUISITIONS AND DIVESTITURES JANUARY–MARCH 2021 (MSEK)
Company Business segment 1)Included
fromAcquired
share 2)Annual
sales 3)Enterprise
value 4) Goodwill
Acq. related intangible
assets
Opening balance 21 414 1 424
Dansk Brandteknik, Denmark Security Services Europe Feb 22 100 81 148 80 75
Other acquisitions and divestitures 5, 6) – – –92 –5 –98 152
Total acquisitions and divestitures January – March 2021 –11 1437) –18 227
Amortization of acquisition-related intangible assets – –65
Translation differences and remeasurement for hyperinflation 982 60
Closing balance 22 378 1 646
1) Refers to business segment with main responsibility for the acquisition. 2) Refers to voting rights for acquisitions in the form of share purchase agreements. For asset deals no voting rights are stated.3) Estimated annual sales. 4) Purchase price paid/received plus acquired/divested net debt but excluding any deferred considerations.5) Related to other acquisitions for the period and updated previous year acquisition calculations for the following entities: FE Moran Security Solutions, the US, Protector i Sundsvall and Polar Park
(contract portfolio), Sweden, SAMCA Vagt, Denmark, KONTROLL DATA-SERVICE Gesellschaft für Sicherheit und Kontrollwesen, Austria, STANLEY Security, Singapore and Fredon Security, Australia. Related also to divestitures of Securitas Estonia, Securitas Slovenia, Securitas Panama (asset deal), Securitas Sri Lanka and Securitas Egypt as well as to deferred considerations paid in the US, Germany, Austria and Australia.
6) Deferred considerations have been recognized mainly based on an assessment of the future profitability development in the acquired entities for an agreed period. The net of new deferred considerations, payments made from previously recognized deferred considerations and revaluation of deferred considerations in the Group was MSEK –25. Total deferred considerations, short - term and long-term, in the Group’s balance sheet amount to MSEK 277.
7) Cash flow from acquisitions and divestitures amounts to MSEK –179, which is the sum of enterprise value MSEK –143 and acquisition-related costs paid MSEK –36.
All acquisition calculations are final-ized no later than one year after the acquisition is made. Transactions with non-controlling interests are specified in the statement of changes in share-holders’ equity on page 17. Transaction costs and revaluation of deferred considerations can be found in note 6 on page 21.
DANSK BRANDTEKNIK, DENMARKSecuritas has acquired Dansk Brandteknik A/S, a leading Danish fire and safety company that specializes
in fire and safety services and equip-ment, including related consulting and training services. The acquisition will significantly enhance Securitas’ protect ive services capabilities in Denmark and is in line with the Group’s strategy of doubling its security solu-tions and electronic security sales by 2023.
In 2020, Dansk Brandteknik’s annual sales were more than MDKK 60 (MSEK 81), of which 70 percent were on a recurring monthly revenue basis.
The company has a nationwide pres-ence in Denmark with 40 employees and approximately 7 500 business clients, mainly in the small- and medium-sized enterprise (SME) seg-ment, with high client retention rates.
The acquisition-related costs are expected to be MSEK 6, to be recog-nized in 2021 and 2022, respectively. The acquisition is expected to be accretive to EPS as of 2021 and was consolidated in Securitas as of February 22, 2021.
11Securitas AB Interim Report January–March 2021

Other significant events
For critical estimates and judgments, provisions and contingent liabilities refer to the 2020 Annual Report and to note 12 on page 24. If no significant events have occurred relating to the information in the Annual Report, no further comments are made in the Interim Report for the respective case.
SECURITAS’ NOMINATION COMMITTEE PROPOSES NEW CHAIR AND MEMBERS OF THE BOARD OF DIRECTORSThe Nomination Committee of Securitas proposes the election of Jan Svensson as the new Chair of the Board of Direct ors at the Annual General Meeting on May 5, 2021.
The Committee also proposes the election of Gunilla Fransson, Harry Klagsbrun and Johan Menckel as new members of the Board. Carl Douglas, currently Vice-Chair of the Board, and Anders Böös and Dick Seger, currently members of the Board, have informed the Committee that they will not be avail-able for re-election. In November 2020, Marie Ehrling, currently Chair of the Board, informed the Committee that she will not be available for re- election. In addition, the Committee proposes the re- election of Sofia Schörling Högberg, Ingrid Bonde, John Brandon and Fredrik Cappelen as members of the Board.
CHANGES IN GROUP MANAGEMENTAs previously announced, Andreas Lindback, Divisional President for AMEA since 2017 and with Securitas since 2011, will take over the role of CFO on August 16, 2021, as Bart Adam steps down. Brett Pickens, COO AMEA and with Securitas since 2018, took over the role of Divisional President AMEA and became a member of Group Management on April 1, 2021. All other Group Management members continue in their present roles.
Risks and uncertainties
Risk management is necessary for Securitas to be able to fulfill its strategies and achieve its corporate objectives. Securitas’ risks fall into three main categories; contract and acquisition risks, operational assign-ment risks and financial risks. Securitas’ approach to enterprise risk manage-ment is described in more detail in the Annual Report for 2020.
In the preparation of financial reports, the Board of Directors and Group Management make estimates and judgments. These impact the state-ment of income and balance sheet as well as disclosures such as contingent liabilities. The actual outcome may differ from these estimates and judg-ments under different circumstances and conditions.
Securitas as well as other companies continue to face the challenge of the corona pandemic. As disclosed in earlier reports and further in this interim report, the corona pandemic has in different ways impacted the Group’s result, and poses an additional chal-lenge when making estimates and judgments. It is currently unclear when certain service levels will return to normal levels and to what extent any costs will be further supported by government grants. Government grants and other relief measures include requirements that need to be fulfilled in order to be eligible for the grants. Together with the valuation of accounts receivable and certain employee benefits, these are key elements in relation to estimates and judgments in preparing the statement of income and balance sheet as well as disclosures.
Further, increased risks are noticed related to the general macro economic environ ment, and it is unclear what type of impact the corona pandemic will have on the mid- and longer term eco-nomical development of the different markets and geographies in which we operate.
For the forthcoming nine-month period, the financial impact of the corona pandemic as well as certain items affecting comparability, provisions and contingent liabilities, as described in the Annual Report for 2020 and, where applicable, under the heading Other significant events above, may vary from the current financial estimates and provisions made by management. This could affect the Group’s profit-ability and financial position.
12Securitas AB Interim Report January–March 2021

Parent Company operations
JANUARY–MARCH 2021The Parent Company’s income amounted to MSEK 326 (271) and mainly relates to license fees and other income from subsidiaries.
Financial income and expenses amounted to MSEK 1 391 (-194). The increase compared with last year is mainly explained by higher dividends received from subsidiaries. Income before taxes amounted to MSEK 1 532 (-82).
AS OF MARCH 31, 2021The Parent Company’s non-current assets amounted to MSEK 45 735 (45 822 as of December 31, 2020) and mainly comprise shares in subsidiaries of MSEK 44 201 (44 233 as of December 31, 2020). Current assets amounted to MSEK 7 318 (4 052 as of December 31, 2020) of which liquid funds accounted for MSEK 1 594 (151 as of December 31, 2020).
Shareholders’ equity amounted to MSEK 30 428 (28 999 as of December 31, 2020). The Parent Company’s liabilities and untaxed reserves amounted to MSEK 22 625 (20 875 as of December 31, 2020) and mainly consist of interest-bearing debt.
For further information, refer to the Parent Company’s condensed financial statements on page 25.
Stockholm, May 5, 2021
Magnus AhlqvistPresident and Chief Executive Officer
This report has not been reviewed by the company’s auditors.
The Group’s Parent Company, Securitas AB, is not involved in any operating activities. Securitas AB consists of Group Management and support functions for the Group.
13Securitas AB Interim Report January–March 2021

Consolidated financial statements
STATEMENT OF INCOMEMSEK Note Jan–Mar 2021 Jan–Mar 2020 Jan–Dec 2020
Sales 25 533 28 016 106 642
Sales, acquired business 281 404 1 312
Total sales 3 25 814 28 420 107 954
Organic sales growth, % 4 0 2 0
Production expenses –21 192 –23 693 –89 046
Gross income 4 622 4 727 18 908
Selling and administrative expenses –3 384 –3 662 –14 100
Other operating income 3 10 9 39
Share in income of associated companies 8 12 45
Operating income before amortization 1 256 1 086 4 892
Operating margin, % 4.9 3.8 4.5
Amortization of acquisition-related intangible assets –65 –72 –286
Acquisition-related costs 6 –29 –17 –137
Items affecting comparability 7 –136 –45 –640
Operating income after amortization 1 026 952 3 829
Financial income and expenses 8, 9 –94 –144 –500
Income before taxes 932 808 3 329
Net margin, % 3.6 2.8 3.1
Current taxes –295 –251 –1 048
Deferred taxes 43 31 135
Net income for the period 680 588 2 416
Whereof attributable to:
Equity holders of the Parent Company 679 588 2 419
Non-controlling interests 1 0 –3
Earnings per share before and after dilution (SEK) 1.86 1.61 6.63
Earnings per share before and after dilution and before items affecting comparability (SEK) 2.11 1.70 8.02
STATEMENT OF COMPREHENSIVE INCOMEMSEK Note Jan–Mar 2021 Jan–Mar 2020 Jan–Dec 2020
Net income for the period 680 588 2 416
Other comprehensive income for the period
Items that will not be reclassified to the statement of income
Remeasurements of defined benefit pension plans net of tax 141 –62 –78
Total items that will not be reclassified to the statement of income 10 141 –62 –78
Items that subsequently may be reclassified to the statement of income
Remeasurement for hyperinflation net of tax 8 23 16 62
Cash flow hedges net of tax –48 –64 –22
Cost of hedging net of tax –2 10 34
Net investment hedges net of tax –264 –621 528
Other comprehensive income from associated companies, translation differences 15 7 –40
Translation differences 1 166 1 642 –3 087
Total items that subsequently may be reclassified to the statement of income 10 890 990 –2 525
Other comprehensive income for the period 10 1 031 928 –2 603
Total comprehensive income for the period 1 711 1 516 –187
Whereof attributable to:
Equity holders of the Parent Company 1 710 1 518 –180
Non-controlling interests 1 –2 –7
14Securitas AB Interim Report January–March 2021

STATEMENT OF CASH FLOWOperating cash flow MSEK Note Jan–Mar 2021 Jan–Mar 2020 Jan–Dec 2020
Operating income before amortization 1 256 1 086 4 892
Investments in non-current tangible and intangible assets –638 –753 –2 787
Reversal of depreciation 643 696 2 690
Change in accounts receivable 140 –654 123
Change in other operating capital employed –118 –3 2 289
Cash flow from operating activities 1 283 372 7 207
Cash flow from operating activities, % 102 34 147
Financial income and expenses paid –242 –290 –401
Current taxes paid –245 –406 –862
Free cash flow 796 –324 5 944
Free cash flow, % 92 –47 178
Cash flow from investing activities, acquisitions and divestitures 6 –179 –354 –1 801
Cash flow from items affecting comparability 7 –170 –60 –405
Cash flow from financing activities 225 1 646 –2 762
Cash flow for the period 672 908 976
Change in net debt MSEK Note Jan–Mar 2021 Jan–Mar 2020 Jan–Dec 2020
Opening balance –14 335 –17 541 –17 541
Cash flow for the period 672 908 976
Change in lease liabilities –5 –94 –139
Change in loans –225 –1 646 1 010
Change in net debt before revaluation and translation differences 442 –832 1 847
Revaluation of financial instruments 9 –64 –70 17
Translation differences –545 –851 1 342
Change in net debt –167 –1 753 3 206
Closing balance –14 502 –19 294 –14 335
Cash flow MSEK Note Jan–Mar 2021 Jan–Mar 2020 Jan–Dec 2020
Cash flow from operations 1 197 313 8 072
Cash flow from investing activities –523 –812 –3 438
Cash flow from financing activities –2 1 407 –3 658
Cash flow for the period 672 908 976
Change in liquid funds MSEK Note Jan–Mar 2021 Jan–Mar 2020 Jan–Dec 2020
Opening balance 4 720 3 948 3 948
Cash flow for the period 672 908 976
Translation differences 49 39 –204
Closing balance 5 441 4 895 4 720
15Securitas AB Interim Report January–March 2021 Consolidated financial statements

CAPITAL EMPLOYED AND FINANCINGMSEK Note Mar 31, 2021 Mar 31, 2020 Dec 31, 2020
Operating capital employed 9 408 14 612 8 893
Operating capital employed as % of sales 9 13 8
Return on operating capital employed, % 47 38 39
Goodwill 22 378 23 673 21 414
Acquisition-related intangible assets 1 646 1 673 1 424
Shares in associated companies 329 328 311
Capital employed 33 761 40 286 32 042
Return on capital employed, % 13 13 13
Net debt –14 502 –19 294 –14 335
Shareholders’ equity 19 259 20 992 17 707
Net debt equity ratio, multiple 0.75 0.92 0.81
BALANCE SHEETMSEK Note Mar 31, 2021 Mar 31, 2020 Dec 31, 2020
ASSETS
Non-current assets
Goodwill 22 378 23 673 21 414
Acquisition-related intangible assets 1 646 1 673 1 424
Other intangible assets 1 851 1 938 1 788
Right-of-use assets 3 440 3 568 3 334
Other tangible non-current assets 3 280 3 639 3 262
Shares in associated companies 329 328 311
Non-interest-bearing financial non-current assets 1 836 1 898 1 835
Interest-bearing financial non-current assets 421 503 686
Total non-current assets 35 181 37 220 34 054
Current assets
Non-interest-bearing current assets 21 801 25 491 20 209
Other interest-bearing current assets 248 202 144
Liquid funds 5 441 4 895 4 720
Total current assets 27 490 30 588 25 073
TOTAL ASSETS 62 671 67 808 59 127
MSEK Note Mar 31, 2021 Mar 31, 2020 Dec 31, 2020
SHAREHOLDERS’ EQUITY AND LIABILITIES
Shareholders’ equity
Attributable to equity holders of the Parent Company 19 248 20 977 17 697
Non-controlling interests 11 15 10
Total shareholders’ equity 19 259 20 992 17 707
Equity ratio, % 31 31 30
Long-term liabilities
Non-interest-bearing long-term liabilities 287 426 265
Long-term lease liabilities 2 642 2 668 2 554
Other interest-bearing long-term liabilities 11 945 14 460 11 694
Non-interest-bearing provisions 2 350 2 600 2 477
Total long-term liabilities 17 224 20 154 16 990
Current liabilities
Non-interest-bearing current liabilities and provisions 20 163 18 896 18 793
Current lease liabilities 906 980 876
Other interest-bearing current liabilities 5 119 6 786 4 761
Total current liabilities 26 188 26 662 24 430
TOTAL SHAREHOLDERS’ EQUITY AND LIABILITIES 62 671 67 808 59 127
16Securitas AB Interim Report January–March 2021 Consolidated financial statements
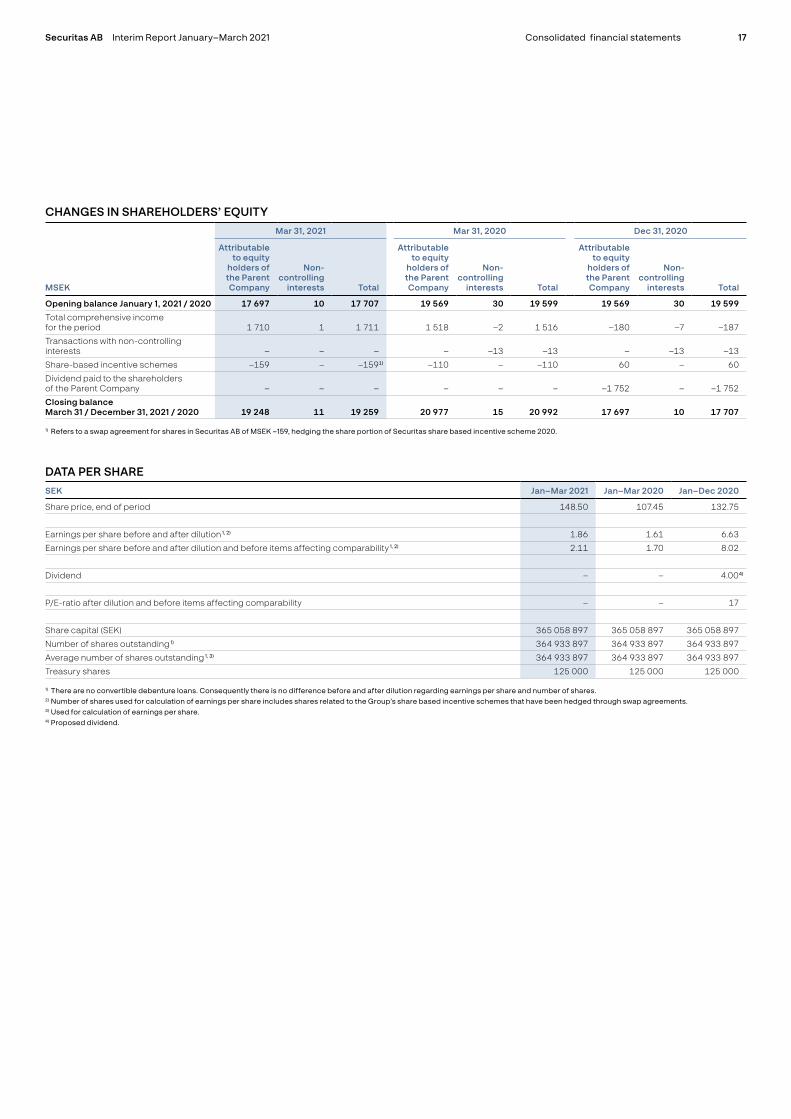
CHANGES IN SHAREHOLDERS’ EQUITY
MSEK
Mar 31, 2021 Mar 31, 2020 Dec 31, 2020
Attributable to equity
holders of the Parent Company
Non- controlling
interests Total
Attributable to equity
holders of the Parent Company
Non- controlling
interests Total
Attributable to equity
holders of the Parent Company
Non- controlling
interests Total
Opening balance January 1, 2021 / 2020 17 697 10 17 707 19 569 30 19 599 19 569 30 19 599
Total comprehensive income for the period 1 710 1 1 711 1 518 –2 1 516 –180 –7 –187
Transactions with non-controlling interests – – – – –13 –13 – –13 –13
Share-based incentive schemes –159 – –1591) –110 – –110 60 – 60
Dividend paid to the shareholders of the Parent Company – – – – – – –1 752 – –1 752
Closing balance March 31 / December 31, 2021 / 2020 19 248 11 19 259 20 977 15 20 992 17 697 10 17 707
1) Refers to a swap agreement for shares in Securitas AB of MSEK –159, hedging the share portion of Securitas share based incentive scheme 2020.
DATA PER SHARESEK Jan–Mar 2021 Jan–Mar 2020 Jan–Dec 2020
Share price, end of period 148.50 107.45 132.75
Earnings per share before and after dilution 1, 2) 1.86 1.61 6.63
Earnings per share before and after dilution and before items affecting comparability 1, 2) 2.11 1.70 8.02
Dividend – – 4.004)
P/E-ratio after dilution and before items affecting comparability – – 17
Share capital (SEK) 365 058 897 365 058 897 365 058 897
Number of shares outstanding 1) 364 933 897 364 933 897 364 933 897
Average number of shares outstanding 1, 3) 364 933 897 364 933 897 364 933 897
Treasury shares 125 000 125 000 125 000
1) There are no convertible debenture loans. Consequently there is no difference before and after dilution regarding earnings per share and number of shares.2) Number of shares used for calculation of earnings per share includes shares related to the Group’s share based incentive schemes that have been hedged through swap agreements.3) Used for calculation of earnings per share.4) Proposed dividend.
17Securitas AB Interim Report January–March 2021 Consolidated financial statements
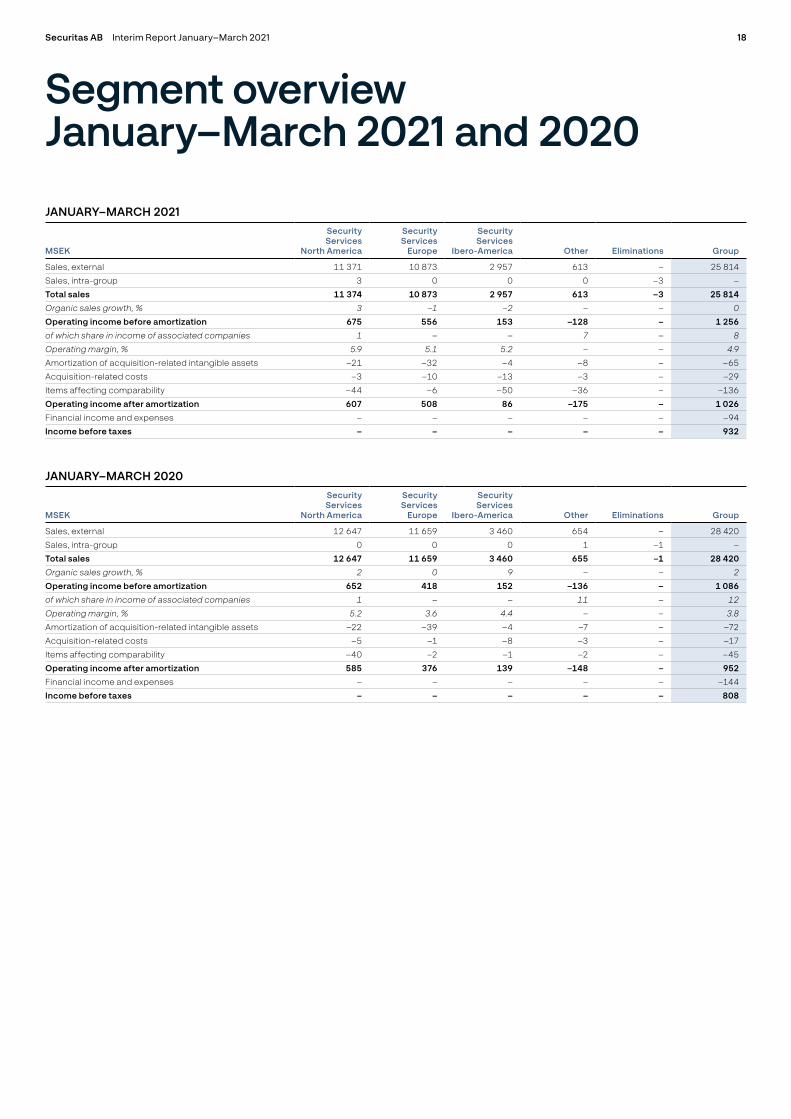
JANUARY–MARCH 2021
MSEK
Security Services
North America
Security Services
Europe
Security Services
Ibero-America Other Eliminations Group
Sales, external 11 371 10 873 2 957 613 – 25 814
Sales, intra-group 3 0 0 0 –3 –
Total sales 11 374 10 873 2 957 613 –3 25 814
Organic sales growth, % 3 –1 –2 – – 0
Operating income before amortization 675 556 153 –128 – 1 256
of which share in income of associated companies 1 – – 7 – 8
Operating margin, % 5.9 5.1 5.2 – – 4.9
Amortization of acquisition-related intangible assets –21 –32 –4 –8 – –65
Acquisition-related costs –3 –10 –13 –3 – –29
Items affecting comparability –44 –6 –50 –36 – –136
Operating income after amortization 607 508 86 –175 – 1 026
Financial income and expenses – – – – – –94
Income before taxes – – – – – 932
JANUARY–MARCH 2020
MSEK
Security Services
North America
Security Services
Europe
Security Services
Ibero-America Other Eliminations Group
Sales, external 12 647 11 659 3 460 654 – 28 420
Sales, intra-group 0 0 0 1 –1 –
Total sales 12 647 11 659 3 460 655 –1 28 420
Organic sales growth, % 2 0 9 – – 2
Operating income before amortization 652 418 152 –136 – 1 086
of which share in income of associated companies 1 – – 11 – 12
Operating margin, % 5.2 3.6 4.4 – – 3.8
Amortization of acquisition-related intangible assets –22 –39 –4 –7 – –72
Acquisition-related costs –5 –1 –8 –3 – –17
Items affecting comparability –40 –2 –1 –2 – –45
Operating income after amortization 585 376 139 –148 – 952
Financial income and expenses – – – – – –144
Income before taxes – – – – – 808
Segment overview January–March 2021 and 2020
18Securitas AB Interim Report January–March 2021

NOTE 1Accounting principlesThis interim report has been prepared in accordance with IAS 34 Interim Financial Reporting and the Swedish Annual Accounts Act. The interim report comprises pages 1–26 and pages 1–13 are thus an integrated part of this financial report.
Securitas’ consolidated financial statements are prepared in accordance with International Financial Reporting Standards (IFRS) as endorsed by the European Union, the Swedish Annual Accounts Act and the Swedish Financial Reporting Board’s standard RFR 1 Supplementary Accounting Rules for Groups. The most important accounting principles under IFRS, which is the basis for the preparation of this interim report, can be found in note 2 on pages 87 to 93 in the Annual Report for 2020. The accounting principles are also available on the Group’s website www.securitas.com under the section Investors – Financial data – Accounting Principles.
The Parent Company’s financial statements are prepared in accordance with the Swedish Annual Accounts Act and the Swedish Financial Reporting Board’s standard RFR 2 Accounting for Legal Entities. The most important accounting principles used by the Parent Company can be found in note 41 on page 142 in the Annual Report for 2020.
Introduction and effect of new and revised IFRS 2021
Securitas has adopted phase 2 of the amendments to IFRS 9 Financial instruments related to the IBOR reform that came into effect on January 1, 2021. Phase 2 addresses the accounting for effects on the financial statements due to the IBOR reform, including the effects of changes to contractual cash flows or hedging relationships that may arise as a consequence of the interest rate benchmark reform. The amendments ensure that there is no impact on the Group’s financial statements due to the IBOR reform.
None of the other published standards and interpretations that are mandatory for the Group’s financial year 2021 are assessed to have any impact on the Group’s financial statements.
Introduction and effect of new and revised IFRS 2022 and onwards
The effect on the Group’s financial statements from standards and interpretations that are mandatory for the Group’s financial year 2022 or later remain to be assessed.
Usage of key ratios not defined in IFRS
For definitions and calculations of key ratios not defined in IFRS, refer to notes 4 and 5 in this interim report as well as to note 3 in the Annual Report 2020.
Notes
NOTE 2Events after the balance sheet date There have been no significant events with effect on the financial reporting after balance sheet date.
NOTE 3Revenue
MSEK Jan–Mar 2021 % Jan–Mar 2020 % Jan–Dec 2020 %
Guarding services 19 387 75 21 579 76 81 838 76
Security solutions and electronic security 5 738 22 6 148 22 23 478 22
Other 689 3 693 2 2 638 2
Total sales 25 814 100 28 420 100 107 954 100
Other operating income 10 0 9 0 39 0
Total revenue 25 824 100 28 429 100 107 993 100
Guarding services
This comprises on-site and mobile guarding, which is services with the same revenue recognition pattern. Revenue is recognized over time, as the services are rendered by Securitas and simultaneously consumed by the customers. Such services cannot be reperformed.
Security solutions and electronic security
This comprises two broad categories regarding security solutions and electronic security.
Security solutions are a combination of services such as on-site and / or mobile guarding and/or remote guarding. These services are combined with a technology component in terms of equipment owned and managed by Securitas and used in the provision of services. The equipment is installed at the customer site. The revenue recognition pattern is over time, as the services are rendered by Securitas and simultaneously consumed by the customers. A security solution normally constitutes one performance obligation.
Electronic security consists of the sale of alarm installations comprising design and installation (time, material and related expenses). Revenue is recognized as per the contract, either upon completion of the conditions
in the contract, or over time based on the percentage of completion. Remote guarding (in the form of alarm monitoring services), that is sold separately and not as part of a security solution, is also included in this category. Revenue recognition is over time as this is also a service that is rendered by Securitas and simultaneously consumed by the customers. The category further includes maintenance services, that are either performed upon request (time and material) with revenue recognition at a point in time (when the work has been performed), or over time if part of a service level contract with a subscription fee. Finally, there is also a to a limited extent product sales (alarms and components) without any design or installation. The revenue recognition is at a point in time (upon delivery).
Other
Other comprises mainly corporate risk management services that are either recognized over time or at a point in time as well as other ancillary business.
Other operating income
Other operating income consists in its entirety of trade mark fees for the use of the Securitas brand name.
19Securitas AB Interim Report January–March 2021
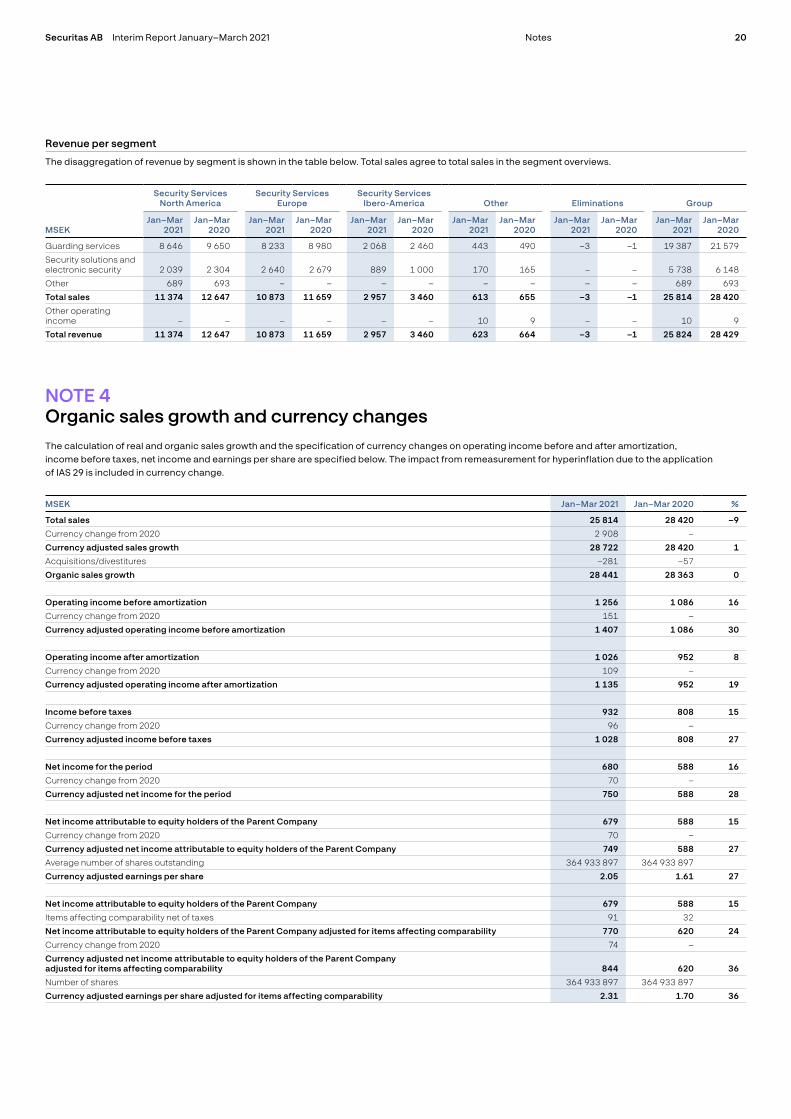
Revenue per segment
The disaggregation of revenue by segment is shown in the table below. Total sales agree to total sales in the segment overviews.
MSEK
Security Services North America
Security Services Europe
Security Services Ibero-America Other Eliminations Group
Jan–Mar 2021
Jan–Mar 2020
Jan–Mar 2021
Jan–Mar 2020
Jan–Mar 2021
Jan–Mar 2020
Jan–Mar 2021
Jan–Mar 2020
Jan–Mar 2021
Jan–Mar 2020
Jan–Mar 2021
Jan–Mar 2020
Guarding services 8 646 9 650 8 233 8 980 2 068 2 460 443 490 –3 –1 19 387 21 579
Security solutions and electronic security 2 039 2 304 2 640 2 679 889 1 000 170 165 – – 5 738 6 148
Other 689 693 – – – – – – – – 689 693
Total sales 11 374 12 647 10 873 11 659 2 957 3 460 613 655 –3 –1 25 814 28 420
Other operating income – – – – – – 10 9 – – 10 9
Total revenue 11 374 12 647 10 873 11 659 2 957 3 460 623 664 –3 –1 25 824 28 429
NOTE 4Organic sales growth and currency changesThe calculation of real and organic sales growth and the specification of currency changes on operating income before and after amortization, income before taxes, net income and earnings per share are specified below. The impact from remeasurement for hyperinflation due to the application of IAS 29 is included in currency change.
MSEK Jan–Mar 2021 Jan–Mar 2020 %
Total sales 25 814 28 420 –9
Currency change from 2020 2 908 –
Currency adjusted sales growth 28 722 28 420 1
Acquisitions/divestitures –281 –57
Organic sales growth 28 441 28 363 0
Operating income before amortization 1 256 1 086 16
Currency change from 2020 151 –
Currency adjusted operating income before amortization 1 407 1 086 30
Operating income after amortization 1 026 952 8
Currency change from 2020 109 –
Currency adjusted operating income after amortization 1 135 952 19
Income before taxes 932 808 15
Currency change from 2020 96 –
Currency adjusted income before taxes 1 028 808 27
Net income for the period 680 588 16
Currency change from 2020 70 –
Currency adjusted net income for the period 750 588 28
Net income attributable to equity holders of the Parent Company 679 588 15
Currency change from 2020 70 –
Currency adjusted net income attributable to equity holders of the Parent Company 749 588 27
Average number of shares outstanding 364 933 897 364 933 897
Currency adjusted earnings per share 2.05 1.61 27
Net income attributable to equity holders of the Parent Company 679 588 15
Items affecting comparability net of taxes 91 32
Net income attributable to equity holders of the Parent Company adjusted for items affecting comparability 770 620 24
Currency change from 2020 74 –
Currency adjusted net income attributable to equity holders of the Parent Company adjusted for items affecting comparability 844 620 36
Number of shares 364 933 897 364 933 897
Currency adjusted earnings per share adjusted for items affecting comparability 2.31 1.70 36
20Securitas AB Interim Report January–March 2021 Notes

NOTE 5Definitions and calculation of key ratiosThe calculations below relate to the period January–March 2021.
Interest coverage ratio
Operating income before amortization (rolling 12 months) plus interest income (rolling 12 months) in relation to interest expenses (rolling 12 months).
Calculation: (5 062 + 34) / 502 = 10.2
Cash flow from operating activities, %
Cash flow from operating activities as a percentage of operating income before amortization.
Calculation: 1 283 / 1 256 = 102 %
Free cash flow as % of adjusted income
Free cash flow as a percentage of adjusted income (operating income before amortization adjusted for financial income and expenses, excluding revaluation of financial instruments, and current taxes).
Calculation: 796 / (1 256 – 94 – 0 – 295) = 92 %
Free cash flow in relation to net debt
Free cash flow (rolling 12 months) in relation to closing balance net debt.Calculation: 7 064 / 14 502 = 0.49
Net debt to EBITDA ratio
Net debt in relation to operating income after amortization (rolling 12 months) plus amortization of acquisition-related intangible assets (rolling 12 months) and depreciation (rolling 12 months).
Calculation: 14 502 / (3 903 + 279 + 2 637) = 2.1
Operating capital employed as % of total sales
Operating capital employed as a percentage of total sales adjusted for the full-year sales of acquired and divested entities.
Calculation: 9 408 / 107 560 = 9 %
Return on operating capital employed
Operating income before amortization (rolling 12 months) plus items affecting comparability (rolling 12 months) as a percentage of the average balance of operating capital employed.
Calculation: (5 062 - 731) / ((9 408 + 8 893) / 2) = 47 %
Return on capital employed
Operating income before amortization (rolling 12 months) plus items affecting comparability (rolling 12 months) as a percentage of closing balance of capital employed.
Calculation: (5 062 – 731) / 33 761 = 13 %
Net debt equity ratio
Net debt in relation to shareholders’ equity.Calculation: 14 502 / 19 259 = 0.75
NOTE 6Acquisition-related costs and cash flow from acquisitions and divestitures
MSEK Jan–Mar 2021 Jan–Mar 2020 Jan–Dec 2020
Restructuring and integration costs –23 –11 –92
Transaction costs –5 –5 –40
Revaluation of deferred considerations –1 –1 –5
Total acquisition-related costs –29 –17 –137
Cash flow impact from acquisitions and divestitures
Purchase price payments –120 –387 –1 780
Assumed net debt –23 52 98
Acquisition-related costs paid –36 –19 –119
Total cash flow impact from acquisitions and divestitures –179 –354 –1 801
For further information regarding the Group’s acquisitions, refer to the section Acquisitions and divestitures.
21Securitas AB Interim Report January–March 2021 Notes

NOTE 7Items affecting comparability
MSEK Jan–Mar 2021 Jan–Mar 2020 Jan–Dec 2020
Recognized in the statement of income
Transformation programs, Group1) –104 –45 –351
Cost-savings program, Group2) –32 – –289
Total recognized in the statement of income before tax –136 –45 –640
Taxes 45 13 133
Total recognized in the statement of income after tax –91 –32 –507
Cash flow impact
Transformation programs, Group1) –72 –48 –251
Cost-savings program, Group2) –84 – –111
Cost-savings program, Security Services Europe –14 –12 –43
Total cash flow impact –170 –60 –405
1) Related to the business transformation program in Security Services North America, Security Services Europe and Security Services Ibero-America, as well as the global IS/IT transformation program.2) Includes costs related to exit of business operations. Cash flow related to exit of business operations is accounted for as cash flow from investing activities.
NOTE 8Remeasurement for hyperinflationThe Group’s subsidiaries in countries that according to IAS 29 Financial reporting in Hyperinflationary economies are classified as hyperinflationary economies are accounted for in the Group’s financial statements after remeasurement for hyperinflation. Currently, Securitas’ operations in Argentina are accounted for according to IAS 29.
The impact on the consolidated statement of income from the remeasurement according to IAS 29 is illustrated below. The index used by Securitas for the remeasurement of the financial statements is the consumer price index with base period January 2003.
EXCHANGE RATES AND INDEXMar 31, 2021 Mar 31, 2020 Dec 31, 2020
Exchange rate SEK/ARS 0.10 0.16 0.10
Index 26.17 18.34 23.35
NET MONETARY GAIN RECOGNIZED IN THE CONSOLIDATED STATEMENT OF INCOMEMSEK Jan–Mar 2021 Jan–Mar 2020 Jan–Dec 2020
Net monetary gain 8 3 14
Total financial income and expenses 8 3 14
22Securitas AB Interim Report January–March 2021 Notes

NOTE 9Financial instruments and credit facilitiesRevaluation of financial instruments
Revaluation of financial instruments is recognized in the statement of income on the line financial income and expenses. Revaluation of cash flow hedges (and the subsequent recycling into the statement of income) is recognized in other comprehensive income on the line cash flow hedges. Cost of hedging (and the subsequent recycling into the state ment of income) is recognized on the corresponding line in other comprehensive income.
The amount disclosed in the specification of change in net debt is the total revaluation before tax in the table below.
MSEK Jan–Mar 2021 Jan–Mar 2020 Jan–Dec 2020
Recognized in the statement of income
Revaluation of financial instruments 0 –1 1
Deferred tax – – –
Impact on net income 0 –1 1
Recognized in the statement of comprehensive income
Cash flow hedges –61 –82 –28
Cost of hedging –3 13 44
Deferred tax 14 15 –4
Total recognized in the statement of comprehensive income –50 –54 12
Total revaluation before tax –64 –70 17
Total deferred tax 14 15 –4
Total revaluation after tax –50 –55 13
Fair value hierarchy
The methods and assumptions used by the Group in estimating the fair value of the financial instruments are disclosed in note 7 in the Annual Report 2020. Further information regarding the accounting principles for financial instruments is disclosed in note 2 in the Annual Report 2020.
There have been no transfers between any of the the valuation levels during the period.
MSEKQuoted
market pricesValuation techniques using
observable market dataValuation techniques using
non-observable market data Total
March 31, 2021
Financial assets at fair value through profit or loss – 5 – 5
Financial liabilities at fair value through profit or loss – –9 –277 –286
Derivatives designated for hedging with positive fair value – 247 – 247
Derivatives designated for hedging with negative fair value – –174 – –174
December 31, 2020
Financial assets at fair value through profit or loss – 20 – 20
Financial liabilities at fair value through profit or loss – –11 –295 –306
Derivatives designated for hedging with positive fair value – 362 – 362
Derivatives designated for hedging with negative fair value – –159 – –159
Financial instruments by category – carrying and fair values
For financial assets and liabilities other than those disclosed in the table below, fair value is deemed to approximate the carrying value. A full comparison of fair value and carrying value for all financial assets and liabilities is disclosed in note 7 in the Annual Report 2020.
MSEK
Mar 31, 2021 Dec 31, 2020
Carrying value Fair value Carrying value Fair value
Long-term loan liabilities 10 262 10 424 10 118 10 336
Short-term loan liabilities 3 586 3 635 3 528 3 531
Total financial instruments by category 13 848 14 059 13 646 13 867
23Securitas AB Interim Report January–March 2021 Notes

SUMMARY OF CREDIT FACILITIES AS OF MARCH 31, 2021
Type Currency Facility amount
(million)Available amount
(million) Maturity
EMTN FRN private placement USD 40 0 2021
EMTN FRN private placement USD 60 0 2021
EMTN FRN private placement USD 40 0 2021
EMTN Eurobond, 1.25 % fixed EUR 350 0 2022
EMTN Eurobond, 1.125 % fixed EUR 350 0 2024
EMTN FRN private placement USD 50 0 2024
EMTN FRN private placement USD 105 0 2024
EMTN Eurobond, 1.25 % fixed EUR 300 0 2025
Multi Currency Revolving Credit Facility EUR (or equivalent) 938 938 2025
EMTN Eurobond, 0.25 % fixed EUR 350 0 2028
Commercial Paper (uncommitted) SEK 5 000 4 700 n/a
NOTE 10Deferred tax on other comprehensive income
MSEK Jan–Mar 2021 Jan–Mar 2020 Jan–Dec 2020
Deferred tax on remeasurements of defined benefit pension plans –28 17 19
Deferred tax on cash flow hedges 13 18 6
Deferred tax on cost of hedging 1 –3 –10
Deferred tax on net investment hedges 69 169 –144
Total deferred tax on other comprehensive income 55 201 –129
NOTE 11Pledged assets
MSEK Mar 31, 2021 Mar 31, 2020 Dec 31, 2020
Pension balances, defined contribution plans 160 134 144
Total pledged assets 160 134 144
NOTE 12Contingent liabilities
MSEK Mar 31, 2021 Mar 31, 2020 Dec 31, 2020
Guarantees – – –
Guarantees related to discontinued operations 16 16 15
Total contingent liabilities 16 16 15
For critical estimates and judgments, provisions and contingent liabilities, refer to note 4 and note 39 in the Annual Report 2020 as well as to the section Other significant events in this report.
24Securitas AB Interim Report January–March 2021 Notes

STATEMENT OF INCOMEMSEK Jan–Mar 2021 Jan–Mar 2020 Jan–Dec 2020
License fees and other income 326 271 1 233
Gross income 326 271 1 233
Administrative expenses –161 –155 –949
Operating income 165 116 284
Financial income and expenses 1 391 –194 1 067
Income after financial items 1 556 –78 1 351
Appropriations –24 –4 –71
Income before taxes 1 532 –82 1 280
Taxes –3 10 150
Net income for the period 1 529 –72 1 430
BALANCE SHEETMSEK Mar 31, 2021 Mar 31, 2020 Dec 31, 2020
ASSETS
Non-current assets
Shares in subsidiaries 44 201 43 943 44 233
Shares in associated companies 112 112 112
Other non-interest-bearing non-current assets 565 1 264 344
Interest-bearing financial non-current assets 857 1 673 1 133
Total non-current assets 45 735 46 992 45 822
Current assets
Non-interest-bearing current assets 1 765 1 368 571
Other interest-bearing current assets 3 959 4 627 3 330
Liquid funds 1 594 2 337 151
Total current assets 7 318 8 332 4 052
TOTAL ASSETS 53 053 55 324 49 874
SHAREHOLDERS’ EQUITY AND LIABILITIES
Shareholders’ equity
Restricted equity 7 730 7 737 7 730
Non-restricted equity 22 698 21 445 21 269
Total shareholders’ equity 30 428 29 182 28 999
Untaxed reserves 725 687 723
Long-term liabilities
Non-interest-bearing long-term liabilities/provisions 187 308 169
Interest-bearing long-term liabilities 11 939 14 442 11 679
Total long-term liabilities 12 126 14 750 11 848
Current liabilities
Non-interest-bearing current liabilities 1 730 1 525 960
Interest-bearing current liabilities 8 044 9 180 7 344
Total current liabilities 9 774 10 705 8 304
TOTAL SHAREHOLDERS’ EQUITY AND LIABILITIES 53 053 55 324 49 874
Parent Company25Securitas AB Interim Report January–March 2021

Securitas AB (publ.)P. O. Box 12307, SE-102 28 Stockholm, Sweden
Visiting address:Lindhagensplan 70
Telephone: + 46 10 470 30 00
Corporate registration number: 556302–7241
www.securitas.com
Financial information
FINANCIAL INFORMATION CALENDAR
May 5, 2021Annual General Meeting 2021
July 29, 2021, app. 1.00 p.m. (CET)Interim Report January–June 2021
October 29, 2021, app. 1.00 p.m. (CET)Interim Report January–September 2021
For further information regarding Securitas IR activities, refer to www.securitas.com/investors/ financial-calendar
PRESENTATION OF THE INTERIM REPORT
Analysts and media are invited to participate in a telephone conference on May 5, 2021, at 3:00 p.m. (CET) where President and CEO Magnus Ahlqvist and CFO Bart Adam will present the report and answer questions. The telephone conference will also be audio cast live via Securitas’ website. To participate in the telephone conference, please dial in five minutes prior to the start of the conference call:US: + 1 631 913 1422Sweden: + 46 8 566 426 51UK: + 44 333 3000 804Please use the following pin code for the telephone conference: 621 490 78#
To follow the audio cast of the telephone conference via the web, please follow the link www.securitas.com/investors/webcasts.
A recorded version of the audio cast will be available at www.securitas.com/investors/webcasts after the telephone conference.
For further information, please contact:Micaela Sjökvist, Head of Investor Relations + 46 76 116 7443
ABOUT SECURITAS
Securitas has a leading global and local market presence with operations in 47 countries. Our operations are organized in three business segments: Security Services North America, Security Services Europe and Security Services Ibero-America. We also have operations in Africa, the Middle East, Asia and Australia, which form the AMEA division. Securitas serves a wide range of clients of all sizes in a variety of industries and segments. Security solutions based on client- specific needs are built through different combinations of on-site, mobile and remote guarding, electronic security, fire and safety, and corporate risk management. We adapt our security solutions based on the risks and needs of each client through increased client engagement and continuously enhanced knowledge. Securitas is listed in the Large Cap segment at Nasdaq Stockholm.
Group strategyAt Securitas, we are leading the transformation of the security industry by putting our clients at the heart of our business. We solve our clients’ security needs by offering qualified and engaged people, in-depth expertise and innovation within each of our protective services, the ability to combine services into solutions and by using data to add further intelligence. To execute on our strategy to become the intelligent protective services partner, we are focusing on four areas: empowering our people, client engagement, protective services leadership and innovation, and efficiency.
Group financial targetsSecuritas has three financial targets:
• An annual average increase in earnings per share of 10 percent• Net debt to EBITDA ratio of on average 2.5• An operating cash flow of 70 to 80 percent of operating income before amortization
Securitas has also set a strategic transformation ambition – to double our security solutions and electronic security sales by 2023, compared with 2018.
This is information that Securitas AB is obliged to make public pursuant to the EU Market Abuse Regulation. The information was submitted for publication, through the agency of the contact person set out above, at 1:00 p.m. (CET) on Wednesday, May 5, 2021.
26Securitas AB Interim Report January–March 2021