interim report january – june 2015 - capio group - … report january – june 2015 telephone...
TRANSCRIPT

Interim report January – June 2015
Telephone conference July 21, 2015 Thomas Berglund, CEO Olof Bengtsson, CFO

2015-07-21 Capio AB (publ)
2
Stable improvements in sales growth and operating results in all segments
Highlights - January-June 2015
• Stable development in H1 2015 with 3.2% organic sales growth, 6.7% EBITDA growth1
and 15.1% EBITA growth1
• Modern Medicine driving Rapid Recovery with shorter AVLOS in continental Europe
• Modern Management increases patient time for medical staff driving higher productivity in the Nordics
• Capio listed on Nasdaq Stockholm June 30, 2015 – long term ownership – increased transparency – access to capital
1 For reported numbers for 2014 refer to page 4 in the published Interim report and refer to page 27 for definitions of EBITDA and EBITA.
Set to speed up change in European healthcare
2015-07-21 Capio AB (publ) 3
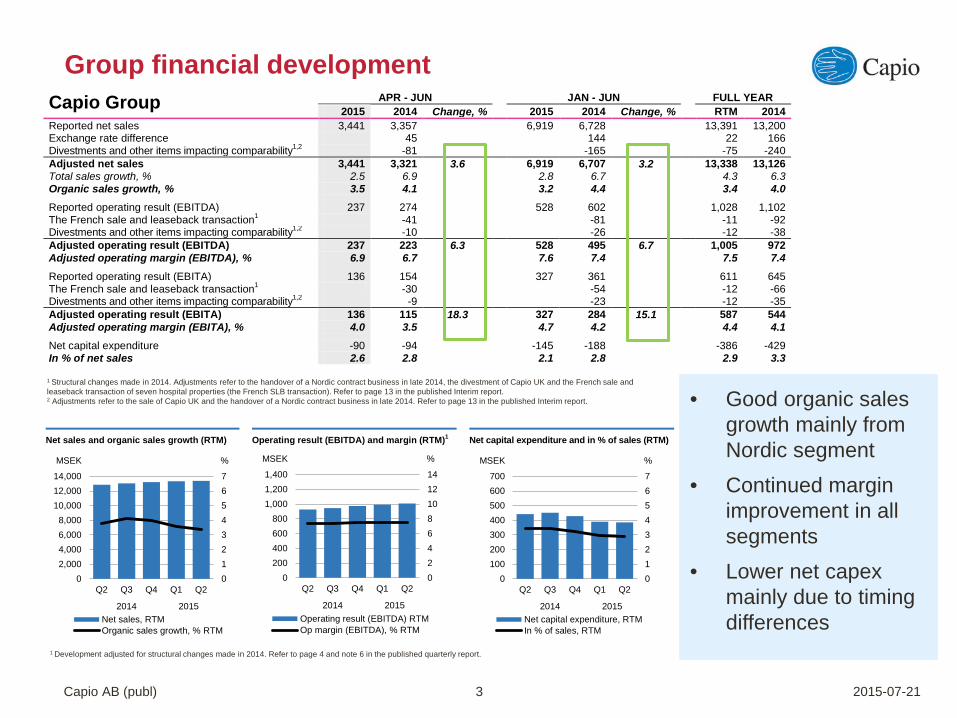
Group financial development
1 Structural changes made in 2014. Adjustments refer to the handover of a Nordic contract business in late 2014, the divestment of Capio UK and the French sale and leaseback transaction of seven hospital properties (the French SLB transaction). Refer to page 13 in the published Interim report. 2 Adjustments refer to the sale of Capio UK and the handover of a Nordic contract business in late 2014. Refer to page 13 in the published Interim report.
• Good organic sales growth mainly from Nordic segment
• Continued margin improvement in all segments
• Lower net capex mainly due to timing differences
Net sales and organic sales growth (RTM) Operating result (EBITDA) and margin (RTM)1 Net capital expenditure and in % of sales (RTM)
01234567
02,0004,0006,0008,000
10,00012,00014,000
Q2 Q3 Q4 Q1 Q2
2014 2015Net sales, RTMOrganic sales growth, % RTM
MSEK %
02468101214
0200400600800
1,0001,2001,400
Q2 Q3 Q4 Q1 Q2
2014 2015Operating result (EBITDA) RTMOp margin (EBITDA), % RTM
MSEK %
01234567
0100200300400500600700
Q2 Q3 Q4 Q1 Q2
2014 2015Net capital expenditure, RTMIn % of sales, RTM
MSEK %
1 Development adjusted for structural changes made in 2014. Refer to page 4 and note 6 in the published quarterly report.
Capio Group APR - JUN
JAN - JUN
FULL YEAR 2015 2014 Change, % 2015 2014 Change, % RTM 2014
Reported net sales 3,441 3,357
6,919 6,728
13,391 13,200 Exchange rate difference 45
144
22 166
Divestments and other items impacting comparability1,2 -81
-165
-75 -240 Adjusted net sales 3,441 3,321 3.6
6,919 6,707 3.2
13,338 13,126
Total sales growth, % 2.5 6.9
2.8 6.7
4.3 6.3 Organic sales growth, % 3.5 4.1
3.2 4.4
3.4 4.0
Reported operating result (EBITDA) 237 274
528 602
1,028 1,102 The French sale and leaseback transaction1 -41
-81
-11 -92
Divestments and other items impacting comparability1,2 -10
-26
-12 -38 Adjusted operating result (EBITDA) 237 223 6.3
528 495 6.7
1,005 972
Adjusted operating margin (EBITDA), % 6.9 6.7
7.6 7.4
7.5 7.4 Reported operating result (EBITA) 136 154
327 361
611 645
The French sale and leaseback transaction1 -30
-54
-12 -66 Divestments and other items impacting comparability1,2 -9
-23
-12 -35
Adjusted operating result (EBITA) 136 115 18.3
327 284 15.1
587 544 Adjusted operating margin (EBITA), % 4.0 3.5
4.7 4.2
4.4 4.1
Net capital expenditure -90 -94
-145 -188
-386 -429 In % of net sales 2.6 2.8
2.1 2.8
2.9 3.3

• Sales growth driven by free healthcare choice and contracts
• Positive development in St Göran’s Hospital, Specialist Clinics and Norway
• Strong focus on improving performance in Proximity Care
• Increased focus on Modern Management to drive productivity
2015-07-21 Capio AB (publ) 4
Segment - Capio Nordic
Capio Nordic APR – JUN
JAN - JUN
FULL YEAR 2015 2014 Change, % 2015 2014 Change, % RTM 2014
Reported net sales 1,856 1,827
3,697 3,626
7,199 7,128 Exchange rate difference -3
-1
-4 -5
Divestments and other items impacting comparability1,3 -43
-87
-73 -160 Adjusted net sales 1,856 1,781 4.2
3,697 3,538 4.5
7,122 6,963
Total sales growth, % 1.6 6.5
2.0 6.7
3.7 6.1 Organic sales growth, % 4.8 5.6
5.1 5.9
4.7 5.1
Reported operating result (EBITDA) 103 100
207 199
444 436 Divestments and other items impacting comparability1,3 -6
-13
-12 -25
Adjusted operating result (EBITDA) 103 94 9.6
207 186 11.3
432 411 Adjusted operating margin (EBITDA), % 5.5 5.3
5.6 5.3
6.1 5.9
Reported operating result (EBITA) 68 64
138 127
297 286 Divestments and other items impacting comparability1,3 -6
-13
-11 -24
Adjusted operating result (EBITA) 68 58 17.2
138 114 21.1
286 262 Adjusted operating margin (EBITA), % 3.7 3.3
3.7 3.2
4.0 3.8
1 Structural changes made in 2014. Adjustments refer to the handover of a Nordic contract business in late 2014, the divestment of Capio UK and the French sale and leaseback transaction of seven hospital properties (the French SLB transaction). Refer to page 13 in the published Interim report. 3 Adjustments refer to the handover of a Nordic contract business in late 2014. Refer to page 13 in the published Interim report.
Stable growth and result development

• Modern Medicine speeds up Rapid Recovery and lower AVLOS
• In- to outpatient shift continues: 6.6% outpatient growth • Share of outpatients operated on increased to 67%
• Program to mitigate neg. price effects in Q1 start to deliver
• New modern hospital in Bayonne to open in August 2015
2015-07-21 Capio AB (publ) 5
Segment - Capio France
Capio France APR – JUN
JAN - JUN
FULL YEAR 2015 2014 Change, % 2015 2014 Change, % RTM 2014
Reported net sales 1,304 1,226
2,617 2,451
5,035 4,869 Exchange rate difference 34
107
23 130
Adjusted net sales 1,304 1,260 3.5
2,617 2,558 2.3
5,058 4,999 Total sales growth, % 6.4 6.7
6.8 5.5
7.6 7.0
Organic sales growth, % 1.8 1.8
1.2 1.8
2.0 2.4 Reported operating result (EBITDA) 143 184
313 388
583 658
The French sale and leaseback transaction1 -41
-81
-11 -92 Adjusted operating result (EBITDA) 143 143 0.0
313 307 2.0
572 566
Adjusted operating margin (EBITDA), % 11.0 11.3
12.0 12.0
11.3 11.3 Reported operating result (EBITA) 85 109
195 236
339 380
The French sale and leaseback transaction1 -30
-54
-12 -66 Adjusted operating result (EBITA) 85 79 7.6
195 182 7.1
327 314
Adjusted operating margin (EBITA), % 6.5 6.3
7.5 7.1
6.5 6.3
1 Structural changes made in 2014. Adjustments refer to the handover of a Nordic contract business in late 2014, the divestment of Capio UK and the French sale and leaseback transaction of seven hospital properties (the French SLB transaction). Refer to page 13 in the published Interim report.
Rapid Recovery strategy continues to deliver

2015-07-21 Capio AB (publ) 6
France - Modern Medicine in focus with new facilities
• Modern Medicine and streamlined facilities drive Rapid Recovery and increased productivity
• Three hospitals in Bayonne merged into a new modern hospital designed for Modern Medicine to open in August 2015
• New pure outpatient hospital in Domont near Paris to open in autumn 2016
• Strengthening Modern Medicine strategy in Toulouse through the merger of two hospitals in 2018
• Projects facilitated by operational leases
Capio Clinique Croix du Sud - Toulouse
Capio Clinique Belharra - Bayonne
Capio Clinique de Domont

• Patient case mix and pricing support organic sales growth
• General hospitals show positive result development (mainly the Dannenberg hospital)
• Bad Kötzting hospital divested
2015-07-21 Capio AB (publ) 7
Segment - Capio Germany
Capio Germany APR - JUN
JAN - JUN
FULL YEAR 2015 2014 Change, % 2015 2014 Change, % RTM 2014
Reported net sales 281 267
605 573
1,155 1,123 Exchange rate difference 7
25
5 30
Adjusted net sales 281 274 2.6
605 598 1.1
1,160 1,153 Total sales growth, % 5.2 9.0
5.6 9.1
7.0 8.9
Organic sales growth, % 2.6 3.1
1.1 4.0
2.0 3.5 Operating result (EBITDA) 12 8 50.0
52 48 8.3
82 78
Operating margin (EBITDA), % 4.2 3.1
8.6 8.4
7.1 6.9 Operating result (EBITA) 5 2 150.0
40 36 11.1
59 55
Operating margin (EBITA), % 1.8 0.8
6.7 6.4
5.1 4.9
A platform for increased focus on Modern Medicine

2015-07-21 Capio AB (publ) 8
APR - JUN
JAN - JUN
FULL YEAR
Capio Group, MSEK 2015 2014 2015 2014 RTM 2014 Net debt opening -3,426 -5,591
-3,440 -5,402
-3,359 -5,402
Operating result (EBITA) 136 154
327 361
611 645 Capital expenditure -94 -96
-174 -190
-417 -433
Divestments of fixed assets 4 2 29 2 31 4 Net capital expenditure -90 -94
-145 -188
-386 -429
In % of net sales 2.6 2.8
2.1 2.8
2.9 3.3 Add-back depreciation 101 119 201 240 418 457 Net investments 11 25
56 52
32 28
Change in net customer receivables 40 4
-117 -170
-23 -76 Other changes in operating capital employed 56 96 77 41 -10 -46 Operating cash flow 243 279
343 284
610 551
Cash conversion, % 178.7 181.2
104.9 78.7
99.8 85.4 Income taxes paid 6 -55 -10 -66 -70 -126 Free cash flow before financial items 249 224
333 218
540 425
Cash conversion, % 183.1 145.5
101.8 60.4
88.4 65.9 Net financial items paid -51 -82 -100 -144 -214 -258 Free cash flow after financial items 198 142
233 74
326 167
Cash conversion, % 145.6 92.2
71.3 20.5
53.4 25.9 Acquisitions/divestments of companies 29 -23
-18 -58
87 47
Divestment of French properties 0 2,231
0 2,231
-16 2,215 Received/paid restructuring and other non-recurring items -419 -38
-457 -75
-568 -186
Shareholder transactions 667 -3 667 -3 675 5 Net cash flow 475 2,309
425 2,169
504 2,248
Cash conversion, % 349.3 1,499.4
130.0 600.8
82.5 348.5 Other items affecting net debt -80 -77 -16 -126 -176 -286 Net debt closing -3,031 -3,359
-3,031 -3,359
-3,031 -3,440
Cash flow
• Net capex at 2.1% YTD and at 2.9% RTM
• Restructuring items include French SLB tax payment MSEK -374 in Q2 2015
• New share issue of net MSEK 669 on June 30
• Other items include write-off of capitalized borrowing costs for the previous Group financing facility

2015-07-21 Capio AB (publ) 9
Capital employed & financing
2015
2014
Capio Group, MSEK 30 Jun 30 Jun 31 Dec Operating capital employed 1,371
1,595 1,403
In % of net sales 10.2
12.4 10.6 Other capital employed 6,492
6,081 6,217
Capital employed 7,863 7,676 7,620 Return on capital employed, % 7.8
8.3 8.5
Net debt 3,031
3,359 3,440 Financial leverage 2.9
3.0 3.1
Equity 4,832
4,317 4,180 Financing 7,863 7,676 7,620
• Operating capital employed lower due to working capital improvements and lower capex
• Net debt lower due to good cash flow and new share issue – adjusted financial leverage at 3x end June 2015
• New 5 year MEUR 500 Group financing at IPO

2015-07-21 Capio AB (publ) 10
Financial calendar
• Q3 Interim report due November 4, 2015
• Full year report due February 12, 2016
• Capital market day planned to be held in mid March 2016 – focus on the Capio model and strategy

2015-07-21 Capio AB (publ) 11
Questions and Answers

www.capio.com