interim report and unaudited condensed … · interim report and unaudited condensed interim...
TRANSCRIPT

INTERIM REPORT AND UNAUDITED CONDENSED INTERIM FINANCIAL STATEMENTSFOR THE PERIOD FROM 1 APRIL 2017 TO 30 SEPTEMBER 2017

ContentsHighlights 1
Company Summary 2
Chairman’s Statement 3-5
Investment Adviser’s Report 6-11
Board of Directors 12
Statement of Directors’ Responsibilities 13
Principal Risks & Uncertainties 14
Independent Auditor’s Review Report 15
Unaudited Condensed Interim Statement of Comprehensive Income 16
Unaudited Condensed Interim Statement of Changes in Shareholders’ Equity 17
Unaudited Condensed Interim Statement of Financial Position 18
Unaudited Condensed Interim Statement of Cash Flows 19
Notes to the Unaudited Condensed Interim Financial Statements 20-33
Officers and Advisers 34

Sequoia Economic Infrastructure Income Fund Limited Unaudited Condensed Interim Financial Statements
Page 1
HighlightsFor the period from 1 April 2017 to 30 September 2017
• The Company raised net proceeds of £157.4 million through an Open Offer, Placing and Offer for Subscription
• Annualised portfolio yield-to-maturity of 8.1% as at 30 September 2017
• Annualised dividend yield of 6.0% of original issue price for the period
• Diversified portfolio of 53 investments made across 8 sectors, 25 sub-sectors and 8 jurisdictions
– 73% of investments in private debt– 57% floating rate investments, capturing short-term rate rises– Attractive weighted average maturity
• A number of loan investments expected to prepay in the third quarter of this financial year, with the proceeds rapidly deployed
• Multi-currency Revolving Credit Facility of £100 million from The Royal Bank of Scotland International Limited and ING Bank and Investec
Financial Highlights at 30 September 2017
Total net assets £757,048,635
Net Asset Value (‘NAV’) per Ordinary Share * 101.24p
Ordinary Share price * 112.80p
Ordinary Share premium to NAV 11.4%
* Cum dividend
Robert Jennings, Chairman of the Company, said:
“The Board is pleased with the progress of the Company in the first half. We are close to being fully invested, having deployed most of the funds from our successful £160 million capital raise in May and we have a strong pipeline of further opportunities.
“The balance of floating rate and shorter term fixed investments means that the portfolio is well positioned to benefit from a rising interest rate environment. We remain confident in the Investment Adviser’s ability to grow the portfolio and source high quality, cash generative economic infrastructure debt investment opportunities that will enable us to maintain portfolio yield at 8% or higher and an annual dividend of 6p per share.”

Sequoia Economic Infrastructure Income Fund Limited Unaudited Condensed Interim Financial Statements
Page 2
Company Summary
Principal ActivitySequoia Economic Infrastructure Income Fund Limited (the “Company”) invests in a diversified portfolio of senior and subordinated economic infrastructure debt investments through its subsidiary Sequoia IDF Asset Holdings S.A. (the “Subsidiary”, together the “Group” or the “Fund”). The Company controls the Subsidiary through a holding of 100% of its shares.
Investment Objective The Company’s investment objective is to provide investors with regular, sustained, long term distributions and capital appreciation from a diversified portfolio of senior and subordinated economic infrastructure debt investments. This objective is subject to the Fund having a sufficient level of investment capital from time to time and the ability of the Fund to invest its cash in suitable investments.
Investment PolicyThe Company’s principal investment policy is to invest in a portfolio of loans, notes and bonds where all or substantially all of the associated underlying revenues are from business activities in the following market sectors: transport, transportation equipment, utilities, power, renewable energy, accommodation and telecommunications infrastructure. The revenues should derive from certain eligible jurisdictions, as defined in the Company’s Prospectus. In addition, once fully invested, in excess of 50% of the portfolio should be floating rate or inflation-linked debt, and not more than 10% by value of the Fund’s investments (at the time of investment) should relate to any one individual infrastructure asset.
Dividend PolicyIn the absence of any significant restricting factors, the Board expects to pay dividends totalling 6p per Ordinary Share per annum for the foreseeable future. The Company pays dividends on a quarterly basis.

Sequoia Economic Infrastructure Income Fund Limited Unaudited Condensed Interim Financial Statements
Page 3
Dear Shareholder,
It is my pleasure to present to you the Interim Report of Sequoia Economic Infrastructure Income Fund Limited (the “Company”) for the six month period of operations ended 30 September 2017.
Positive momentum since IPOApproximately two and a half years ago, on 3 March 2015, the Company was admitted to the premium segment of the Official List on the London Stock Exchange with a market capitalisation of approximately £150 million, following an over-subscribed initial public offering (“IPO”). The Company invests in debt backed by economic infrastructure projects, and is advised by Sequoia Investment Management Company (the “Investment Adviser”), who have substantial experience in the sector.
Since the IPO, the Company has had four further successful capital raises, two through placing programmes in December 2016 and May 2017, and two through C Share issues in November 2015 and June 2016 (both of which subsequently converted to Ordinary Shares). In aggregate the Company has raised gross proceeds through the issue of shares of approximately £759 million and its market capitalisation was approximately £843 million on 30 September 2017. As a result of this growth in its market capitalisation, the Company entered the FTSE 250 on 18 September 2017.
The Company’s shares have generally traded at a premium to its NAV, which averaged 11.1% over the past six months.
Investors in the IPO have received (up to 30 September 2017) dividends of 12.5p per share and saw the share price increase from 100p to 112.8p, representing a total gain of 25.3p per share and an annualised return (“IRR”) of 9.6%.
Net Asset Value performance and future resilienceOver the first half of this financial year, and after the payment of dividends of 3p per share, the Company’s NAV per share has declined modestly from 102.72p to 101.24p. The NAV performance is substantially explained by the strength of Sterling which resulted in FX losses of 1.1p per share, and adverse asset valuation movements of 0.7p per share.
From the end of September through to the end of November, the portfolio has performed well, with NAV total return in line with the company’s target of 7-8% per annum. In general the portfolio is currently close to fully invested, diversified, devoid of “problem assets” and generating an attractive yield.
For these reasons, in the absence of any material adverse change in market conditions, the Investment Adviser continues to believe that NAV accretion of 1p to 2p per annum after servicing the dividend is a realistic target.
Moreover, while we anticipate that mildly rising long term interest rates would result in a small decline in NAV per share in the short term, this risk is mitigated by two significant considerations.
Firstly, approximately half of the portfolio consists of floating rate investments, which do not generally decline in value in a rising interest rate environment, and will generate a higher yield as short-term rates increase.
Secondly, the portfolio is very cash generative, the benefits of which are perhaps under-appreciated. The cash arises from not just the investments’ regular, contractual and therefore predictable interest payments, but in many cases from either periodic amortisation payments (i.e. the borrower repaying the loan or bond over its life in instalments) or short investment maturities.
The Investment Adviser estimates that the portfolio will, over the next twelve months, generate over £175 million of free cash (23% of NAV), after payment of its operating expenses and a dividend of 6p per share. The practical benefit of this cash generation is that, in a rising interest rate environment, the Company will be able to redeploy this cash at new, higher, interest rates.
This re-investment opportunity should enhance cash flows accruing to the company, thus allowing NAV per share to recover and/or our dividend payout to be increased over time. As such, mildly-rising interest rates should benefit shareholders in the long term, a point that may differentiate us from infrastructure equity funds whose capital tends to be locked up in long term investments, where returns may not benefit from higher rates.
An alternative investment portfolio has been assembledSince the Company’s IPO, the Board of Directors of the Company (the “Board”) has been pleased with the progress made by the Investment Adviser in building a portfolio of attractive infrastructure debt investments. As at 30 September 2017, the portfolio comprised 53 investments, diversified by borrower, jurisdiction, sector and sub-sector, and generating an average yield-to-maturity of 8.1%. The yield on the portfolio has the potential to increase if LIBOR increases, since half of the assets have floating-rate interest income.
Chairman’s Statement
Sequoia Economic Infrastructure Income Fund Limited Unaudited Condensed Interim Financial Statements
Page 4
An alternative investment portfolio has been assembled (continued)In constructing the portfolio, the Investment Adviser was mindful of a number of factors. Paramount is credit quality, with each investment subject to rigorous and regular scrutiny and due diligence. In addition, the yield on investments needs to be attractive both in relative terms (when compared to assets of a similar quality) and in absolute terms (to ensure the Company can meet its target of paying a dividend of 6p per share). Finally, a range of other criteria must also be met, including compliance with concentration limits to ensure a well-diversified portfolio, and targeting floating rate investments for at least half of the portfolio.
Pleasingly, approximately 73% of the portfolio now consists of private debt investments, almost at the three-year target of 75%. This is important as private debt typically enjoys a higher yield (an “illiquidity premium”) compared to rated, listed bonds. Since the Company’s fundamental strategy is buy-and-hold, as opposed to a debt trading strategy, it makes sense to capture this illiquidity premium. At the same time, the infrastructure bond part of the portfolio provides the Company with considerable liquidity, and the Directors believe there is value in having that ability to raise liquid funds at short notice, should the need arise.
The Investment Adviser will continue to update you on the Company’s progress by way of the monthly Investor Reports.
Growth prospects and the state of the infrastructure debt marketWhen our investment pipeline exceeds funds available for investment, the Board will look to raise further capital if it believes that to do so would be in the interest of our shareholders, having regard to such matters as the impact on secondary market liquidity in our shares, portfolio diversification and net asset value per share. However, growth cannot come at the expense of the credit quality or the performance of the investment portfolio, and therefore the Board is pleased to see that the Investment Adviser has developed a strong pipeline of potential investments for the Company which will maintain the portfolio’s yield at 8% or higher, without taking an undue level of credit risk.
Much of the market turbulence present in the early stages of the Company’s life has abated, and the credit markets in general are currently characterised by low volatility and historically tight lending margins and bond spreads. To a certain extent the infrastructure debt markets have been
included in this trend, with some sectors such as social infrastructure, core renewables (e.g. onshore wind and ground-mounted solar) and European toll roads now being funded at very low interest rates. This is primarily the result of institutional investors such as insurance companies becoming more active in infrastructure debt, as they look to improve upon the yields that are available in the corporate bond market. However, this is far from uniformly the story across the infrastructure debt market with, in particular, the US markets, the mezzanine lending market, and some industry sectors continuing to offer excellent risk-adjusted returns. It is an important part of the Investment Adviser’s job to avoid the expensive, “over-banked” sectors and jurisdictions, and instead to focus on the best lending opportunities.
Over the course of 2017, infrastructure finance in the UK through the PFI or PPP model has become increasingly politicised, with the Labour Party threatening nationalisation. Whilst this may or may not come to pass, I am pleased to reassure investors that, as at 30 September 2017, only 1.7% of the Company’s NAV consisted of loans or bonds to UK PFI/PPP projects. These investments contain clear and comprehensive contractual provisions for their repayment in the event that the underlying project is terminated, either at par value or in some cases a premium to par. The Investment Adviser is accordingly of the view that the potential effect on the Company of nationalisation in the PFI/PPP sector is very limited.
Outlook for the rest of the financial yearThe Company is close to being fully invested, having successfully deployed the bulk of the proceeds from the capital raise in May 2017. There are a number of loan investments that are expected to prepay in the third quarter of this financial year, but the expectation is that the proceeds from these will be redeployed rapidly through transactions in the Company’s investment pipeline.
The Company also refinanced its loan with JP Morgan in the third quarter of this financial year, replacing it with a flexible, multi-currency revolving credit facility. This will help the Company to reduce the cash drag associated with raising equity, by buying assets through leverage prior to a capital raise, with the intention of then repaying the debt with the capital raised.
More generally, the Board believes that the Company’s portfolio and investment pipeline will continue to deliver an attractive risk-adjusted return with a relatively low correlation to the broader financial markets.
Chairman’s Statement (continued)
Sequoia Economic Infrastructure Income Fund Limited Unaudited Condensed Interim Financial Statements
Page 5
Chairman’s Statement (continued)
Governance and complianceThe Board recognises the importance of a strong corporate governance culture and continues to maintain principles of good corporate governance as set out in the UK Code which was updated in April 2016, and the Association of Investment Companies Code of Corporate Governance, which was updated in July 2016, and accompanying guide. A copy of the UK Code is available at www.frc.org; a copy of the AIC Code and Guide can be found at www.theaic.co.uk.
Your Board has now been working together for over three years, which includes the period prior to formal appointment. During that time, we have conducted ourselves in a manner which we believe is both required for and consistent with delivering satisfactory returns to our Shareholders. Specifically, we routinely and actively challenge our advisers on all key issues that affect our NAV per share performance including the selection and retention of investments in our portfolio, our potential use of leverage, our policies towards capital raising and share redemption, our approach to risk and risk allocation and the terms of engagement of all our advisers. We also maintain a focus on costs and expenses in the fund: the Ongoing Charges figure has been consistently around 1% since the IPO but we expect this to decline over time as the Company benefits from economies of scale, and in particular most of its costs are designed to decrease in percentage terms as the Company’s NAV increases.
I have been very pleased with the way in which the Board and our advisers have pulled together as a well-balanced team and how our approach has evolved over the first two and a half years in our Company’s life. This has helped the Company to achieve its target dividend yield while also protecting the NAV per share. We see our duty going forward as being to remain as actively focused as we have been to date so that we can sustain the target yield while also advancing NAV per share. In turn this should help to support the premium at which our shares have traded over the period since our admission to listing on 3 March 2015.
I would like to close by thanking you for your commitment and support.
Robert JenningsChairman7 December 2017

Sequoia Economic Infrastructure Income Fund Limited Unaudited Condensed Interim Financial Statements
Page 6
The Investment Adviser’s Objectives for the YearOver the course of the first half of 2017, Sequoia Investment Management (“Sequoia”) has had a number of objectives for the Company:
Goal Commentary
Gross portfolio return of 8-9% The Company is practically fully invested with a portfolio that yields in excess of 8%
Capital growth to deliver economies of scale and broader benefits
Gross proceeds of £160 million raised in May’s over-subscribed capital raise
Timely and transparent investor reporting
Factsheet, commentary, and the full portfolio are provided monthly for full transparency
Dividends of 6p per share The Company paid 3p of dividends in the first half of 2017 and is on track to pay 6p
Capital Raised and Share PerformanceThe Company completed one capital raise during the half-year ending 30 September 2017: an Ordinary Share issue in May 2017 which raised gross proceeds of £160 million and was oversubscribed.
Capital Raising and Deployment since IPO
Mar
-15
Jun-
15
Sep-
15
Dec
-15
Mar
-16
Jun-
16
Sep-
16
Dec
-16
Mar
-17
Jun-
1 7
Sep-
17
800
700
600
500
400
300
200
100
0
SEQ
I NA
V (£
mm
)
Private
Dec-16£610m
Nov-15£288m
Jun-16£478m
Mar-15£147m
Public Net Cash
Sept-17£757m
As at 30 September 2017, the Company had 747,754,796 Ordinary Shares in issue. The closing share price on that day was 112.8p per share, implying a market capitalisation for the Company of approximately £843.5 million, compared to £531.5 million a year previously.
Investment Adviser’s Report

Sequoia Economic Infrastructure Income Fund Limited Unaudited Condensed Interim Financial Statements
Page 7
Investment Adviser’s Report (continued)
NAV PerformanceOver the last six months, the Company’s NAV decreased from 102.72p per share to 101.24p per share, driven by the following effects:
Factor NAVeffectInterest income on the Company’s investments 3.36pLosses on foreign exchange movements, net of the effect of hedging (1.11)pNegative market movements (0.70)pOne-off cost of writing down acquired assets to their bid price (0.22)pOperating costs (0.51)pGains from issuing shares at a premium to NAV 0.70p
Gross increase in NAV 1.52pLess: Dividends paid (3.00)p
Net decrease in NAV after payments of dividends (1.48)p
Notably, the Company made a loss of 1.11p from foreign exchange movements, which is a direct result of the gradual strengthening of Sterling over the last six months. On 30 September 2017, approximately 90% of the Company’s NAV consisted of either Sterling assets or was hedged into Sterling through foreign exchange forward contracts. The value of these contracts are marked-to-market along with the investments on a monthly basis in order to reduce the potential for foreign exchange rate volatility in the Company’s NAV over the longer term.
Including the loss arising from foreign exchange movements and the 3p per share of dividends, the net gain over the last six months was approximately 1.52p per share. In addition, some of the costs incurred over the year are of a one-off or non-recurring nature which implies the run-rate return from the Company’s assets may have been slightly in excess of the target return.
The Market Environment during the YearThe Fund has operated in a relatively calm environment over the last six months, with the credit markets especially experiencing historically tight lending margins and bond spreads. The infrastructure debt markets are not entirely insulated from this trend, with sectors such as social infrastructure, core wind and solar projects, and European toll roads being funded at very low interest rates.
This is primarily a result of institutional investors expanding beyond the corporate bond market in the search for yield, however there is still significant value in other areas of the infrastructure debt market. The US markets, the mezzanine lending market, and certain industry sectors in particular continue to offer excellent risk-adjusted returns, relatively stable cash flows, and are often backed by real assets.
1000
800
600
400
200
02007 2008 2009 2010 2011 2012 2013 2014 2015 2016 2017
Q1 Q1 Q1 Q1 Q1 Q1 Q1 Q1 Q1 Q1 Q1
Mezzanine rangeEuropean BBB bondsEMEA project finance loansUS BB bonds

Sequoia Economic Infrastructure Income Fund Limited Unaudited Condensed Interim Financial Statements
Page 8
Investment Adviser’s Report (continued)
The Market Environment during the Year (continued)Primary market issuance in the infrastructure loan markets has been strong, with deal volumes of $118 billion over the last six months, split approximately 46% in the Americas, 35% in EMEA and 19% in Asia1. In addition, there were significant amounts of infrastructure debt issued in the bond markets, and through bilateral loans and private placements that are not always captured in the market data. The opportunity for the Fund to deploy capital, therefore, is exceedingly large.
The PortfolioThe Company has taken advantage of these favourable market conditions to assemble a diversified portfolio of infrastructure loans and bonds over its two-and-a-half years of operations. These investments are capable of providing the regular, sustained, and long-term distributions of income which is the primary stated investment objective of the Company. In addition, the Company has acquired in the secondary loan markets a number of assets at a material discount to their par value which offer the potential for appreciation over time.
The Company’s focus is in economic infrastructure, which includes transportation, utility, power, telecommunication, renewable and other related sectors that exhibit infrastructure characteristics and typically have demand exposure. Sequoia believes that lending into these sectors is more attractive than lending into availability-based PFI/PPP projects, which are often hotly contested among lenders and therefore offer lower yields. Moreover, economic infrastructure projects usually have much more conservative capital structures than availability-based PFI/PPP projects, with equity cushions of typically 20-30% rather than 10%, and in Sequoia’s opinion this compensates for the potentially higher revenue risk. Lending into the economic infrastructure sector has delivered an investment portfolio with equity-like returns but with the protections of debt, including lower volatility and less downside risk than equity. None of the loans or bonds acquired has defaulted and were selected, in part, based on their prospects for high recovery in the event of a default. Each loan and bond in the portfolio is to a borrower with an adequate equity cushion which helps to protect the Company from credit losses. Sequoia believes that diversification is an important risk management tool for an infrastructure debt portfolio, since a large component of credit risk in infrastructure is idiosyncratic or project-specific risk, and is typically not highly correlated to exogenous factors such as the broader economy. As such, a properly diversified portfolio ought to have a more stable performance than one which is concentrated in one jurisdiction or sector. (For example, a debt portfolio that was largely focused on financing UK renewable projects might be highly exposed to specific risks such as regulatory changes.)
The Company’s investment portfolio is therefore diversified by borrower, jurisdiction, sector and sub-sector, with strict investment limits in place to ensure that this remains the case. The chart below shows portfolio sectors and sub-sectors on 30 September 2017:
Due to roundings, the sum of sub-sector percentages may not equal the sector totals
Geographically, the Company invests in stable low-risk jurisdictions. Under the terms of its investment criteria, the Company is limited to investment-grade countries, but Sequoia has chosen not to pursue any opportunities in Spain or Italy, where in addition to the obvious economic challenges, infrastructure projects have also been exposed to regulatory and legal risks. The Company has been focused on the United States, Canada, Australia, the UK, and Northern and Western Europe.
11%
3% 3%1%
6%4%
2% 2%5%
3%1%
7%
3%5%
9%6% 6%
4% 3%5%
3% 2% 2% 2%
Road
Airp
ort
Mot
orw
ay S
ervi
ces
Rail
Airc
raft
Rolli
ng S
tock
Ship
ping
Spec
ialis
t Shi
ppin
g
Was
te-to
-ene
rgy
Elec
tric
ity d
istr
ibut
ion
Wat
er
Elec
tric
ity G
ener
atio
n
PPA
Sola
r and
Win
d
Dat
a ce
ntre
s
Tow
ers
Und
erse
a ca
ble
Hea
lth c
are
Stud
ent h
ousi
ng
Priv
ate
hosp
itals
Indu
stria
l inf
ra
Resi
dent
ial i
nfra
Alte
rnat
ive
fuel PF
I
18%Transport
14%Transport assets
9%Utility
10%Power
21%TMT
15%Other
8%Accomm.
1%
Airc
raft
par
ts
5%Renew
1 IJ Global: Transaction Data 01/04/17-30/09/17.

Sequoia Economic Infrastructure Income Fund Limited Unaudited Condensed Interim Financial Statements
Page 9
The Portfolio (continued)The Company focuses predominantly on private debt, which on 30 September 2017 represented approximately 73% of its portfolio (compared to 67% a year previously). This is because, typically, private debt enjoys an illiquidity premium: i.e. a higher yield than a liquid bond with otherwise similar characteristics. Since the Fund’s main investment strategy is “buy and hold”, it makes sense to capture this illiquidity premium. Sequoia’s research indicates that infrastructure private debt instruments yield approximately 1% more than public, rated bonds. However, in some cases, bonds can also be an attractive investment for three reasons. Firstly, some bonds are “private placements” which, whilst in bond format, have an attractive yield that is comparable to loans. Secondly, some sectors, such as US utility companies, predominantly borrow through the bond markets, and therefore having an allocation to bonds can improve the diversification of the portfolio. And, thirdly, having some liquid assets in the portfolio can position the Company to take advantage of future opportunities and also can be used to satisfy the Company’s potential obligations under its tender obligations.
The Company remains committed to limiting exposure to greenfield construction risk in the portfolio. Whilst up to 20% of the NAV can consist of lending to such projects, the actual exposure to assets in construction on 30 September 2017 was only 16% of the portfolio. Sequoia is careful to select projects where it believes the Company is well compensated for taking a moderate level of construction risk, and where the underlying strength of the borrower’s business or project mitigates the risk.
Origination ActivitiesThe Company’s strategy is to invest in both the primary and secondary debt markets. Sequoia believes that this combination delivers a number of benefits: participating in the primary markets allows the Company to generate upfront lending fees and to structure investments to meet its own requirements; buying investments in the secondary markets can permit the rapid deployment of capital into seasoned assets with a proven track record. As the Company grows in size, Sequoia expects to source an increasing number of opportunities from the primary market.
Case Study – Hawaiki Submarine Cable Partnership
Hawaiki Submarine Cable Partnership is building a submarine fibre-optic cable to transmit bandwidth across the Pacific from Oceania to Oregon. The cable will be 14,000km long and will link Australia, New Zealand, and some Pacific Islands to Hawaii and the mainland United States.
This Pacific cable route benefits from the fact that there are only two other cables in operation, one of which is owned by a telecom company and the other is nearing the end of its design life. The Hawaiki cable is scheduled to be ready for service in mid-2018.
The Company has invested £37.7 million in the junior debt facility, with an overall yield at acquisition in excess of 10%. The junior facility security package comprises second ranking security over the same assets as the senior security package.
Primary market originationThe primary loan markets are an increasingly important opportunity for the Company. The Investment Adviser has sourced bilateral loans and participated in “club” deals, where a small number of lenders join together, and the Company has also participated in more widely-syndicated infrastructure loans. Primary market loans often have favourable economics because the Company, as lender, benefits from upfront lending fees.
Secondary market originationSome of the Company’s investments were acquired from banks or other lenders in the secondary markets. This enabled a relatively rapid deployment of capital, since primary market transactions in infrastructure debt can often take a considerable time to execute. In addition, secondary market loans have performance history that permits credit analysis on actual results rather than financial forecasts. Finally, research2 shows that infrastructure loans improve in credit quality over time so secondary loans in many cases have improved in credit quality from the time of their initial origination.
Investment Adviser’s Report (continued)
2 Average annual European broad infrastructure and global project finance default rates. Moody’s, “Default and Recovery Rates for Project Finance Bank Loans 1983-2015,” Mar 2017 and 1983-2015 Addendum, Sept 2017.

Sequoia Economic Infrastructure Income Fund Limited Unaudited Condensed Interim Financial Statements
Page 10
Investment Adviser’s Report (continued)
OutlookSequoia has developed a very strong pipeline of mostly private debt infrastructure lending opportunities, which are expected to become executable mostly over the next three to nine months. Pricing on these opportunities is consistent with the Company generating a gross return in excess of 8%. The potential investments are widely spread across a range of sectors and jurisdictions. Sequoia is especially excited about potential investments in the transport, accommodation and TMT (Telecommunications, Media and Technology) sectors where the current portfolio is arguably underweight, lending opportunities are often attractive and additional investments would be desirable.
Fund performance30
September 2017
31 March
2017
30 September
2016
Net asset value per Ordinary Share£ million
101.24p£757.0
102.72p£611.8
101.29p£480.5
Invested portfolio percentage of net asset valueincluding investments in settlement
88.5%95.4%
97.0%98.5%
89.3%96.7%
Portfolio characteristics30
September 2017
31 March
2017
30 September
2016
Number of investments 53 45 36
Single largest investment
Average investment size
£ millionpercentage of NAV
£ million
£38.25.0%£12.6
£37.16.1%£13.2
£32.66.8%3
£11.6
SectorsSub-sectorsJurisdictions
by number of assets8258
8257
8207
Private debtSenior debtFloating rateConstruction risk
percentage of invested assets
73.0%57.0%57.0%16%
73.0%68.4%50.2%
12%
67.4%72.4%52.2%12%
Weighted-average maturityWeighted average lifeYield-to-maturityModified duration
yearsyears
6.74.58.1%1.9
5.84.6
8.3%2.3
6.64.6
8.6%2.8
Sequoia expects project finance senior lending margins, especially in the UK and Europe and for “core” infrastructure projects and availability-based PFI/PPP projects to remain tight, driven by sustained commercial bank appetite for these types of assets and by increasing demand from institutional investors such as continental European insurance companies. However spreads in the mezzanine market, and for senior debt in the US and some asset classes in the UK and Europe, are expected to remain more attractive.
3 Percentage of combined SEQI Ordinary Share and C Share net asset values.

Sequoia Economic Infrastructure Income Fund Limited Unaudited Condensed Interim Financial Statements
Page 11
Outlook (continued)US Dollar Libor is continuing to increase and Sequoia expects this trend to continue over time, increasing the average cash-on-cash yield of the portfolio. Note that this potential growth is not being relied upon to pay dividends, and Sequoia’s estimations of investment yields are based on constant Libor.
Overall, the opportunity for the Company in economic infrastructure debt is strong and the asset class remains under-invested and attractive. Sequoia is optimistic about the prospects for growing the Company without jeopardising its track record of sourcing suitable investments and delivering to shareholders a total return of 7-8%.
Sequoia Investment Management Company Limited7 December 2017
Investment Adviser’s Report (continued)

Sequoia Economic Infrastructure Income Fund Limited Unaudited Condensed Interim Financial Statements
Page 12
The Directors of the Company, all of whom are non-executive and independent, are as follows:
Robert Jennings, CBE (Chairman)Robert Jennings is a resident of the United Kingdom and qualified as a Chartered Accountant in 1979. He has over 30 years experience in the infrastructure sector. Mr Jennings was a managing director of UBS Investment Bank and was joint head of the Bank’s Infrastructure Group until 2007. He has twice acted as a special senior adviser to HM Treasury; in 2001/02 during Railtrack’s administration and again in 2007/08 in relation to Crossrail. Mr Jennings is also a non executive director of Crossrail, and was until February 2017 Chairman of Southern Water. Mr Jennings has been appointed to the Board of 3i Infrastructure in a non-executive role with effect from 1 February 2018.
Jan PethickJan Pethick is a resident of the United Kingdom and has over 35 years experience in the debt sector. Mr Pethick was chairman of Merrill Lynch International Debt Capital Markets for 10 years, from 2000 to 2010. He had previously been Head of Global Debt Origination at Dresdner Kleinwort Benson which had acquired the credit research boutique, Luthy Baillie which he had co founded in 1990. Prior to that, he worked for 12 years at Lehman Brothers where he was a member of the Executive Management Committee in Europe. Mr Pethick is currently also Chairman of Troy Asset Management and an independent member of the Supervisory Board of Moody’s Investor Services Europe.
Jonathan (Jon) BridelJon Bridel is a resident of Guernsey. Mr Bridel is currently a non executive director of a number of investment funds and managers including Alcentra European Floating Rate Income Fund Limited, The Renewables Infrastructure Group Limited (FTSE 250), Funding Circle SME Income Fund Limited, Starwood European Real Estate Finance Limited and Phaunos Timber Fund Limited (currently being wound up), all of which are listed on the Main Market of the London Stock Exchange, and of DP Aircraft I Limited and Fair Oaks Income Limited. Mr Bridel was previously Managing Director of Royal Bank of Canada’s investment businesses in the Channel Islands.
After qualifying as a Chartered Accountant in 1987, Mr Bridel worked with Price Waterhouse Corporate Finance in London. He subsequently held senior positions in banking, credit and corporate finance, investment management and private international businesses where he was Chief Financial Officer.
Mr Bridel holds a Master of Business Administration and also holds qualifications from the Institute of Chartered Accountants in England and Wales, where he is a Fellow, the Chartered Institute of Marketing, where he is a Chartered Marketer, and the Australian Institute of Company Directors. He is also a member of the Institute of Directors and is a Chartered Fellow of the Chartered Institute for Securities and Investment.
Sandra PlattsSandra Platts is a resident of Guernsey and holds a Masters in Business Administration. Mrs Platts joined Kleinwort Benson (CI) Ltd in 1986 and was appointed to the board in 1992. She undertook the role of Chief Operating Officer for the Channel Islands business and in 2000 for the Kleinwort Benson Private Bank Group – UK and Channel Islands. In January 2007, she was appointed to the position of Managing Director of the Guernsey Branch of Kleinwort Benson and led strategic change programmes as part of her role as Group Chief Operating Officer. Mrs Platts also held directorships on the strategic holding board of the KB Group, as well as sitting on the Bank, Trust Company and Operational Boards. She resigned from these boards in 2010. Mrs Platts is a non executive director of NB Global Floating Rate Income Fund Limited and UK Commercial Property Trust Limited (both listed on the Main Market of the London Stock Exchange) and Investec Bank (Channel Islands) Limited, plus a number of other investment companies. She is a member of the Institute of Directors.
Board of Directors

Sequoia Economic Infrastructure Income Fund Limited Unaudited Condensed Interim Financial Statements
Page 13
Statement of Directors’ Responsibilities
We confirm that to the best of our knowledge:
• The Unaudited Condensed Interim Financial Statements (the “Financial Statements”) have been prepared in accordance with IAS 34 ‘Interim Financial Reporting’; and
• The Interim Report, together with the Financial Statements, meet the requirements of an interim management report, and include a fair review of the information required by:
• DTR 4.2.7R of the DTR of the UK’s FCA, being an indication of important events that have occurred during the period ended 30 September 2017 and their impact on the Financial Statements; and a description of the principal risks and uncertainties for the remaining six months of the year; and
• DTR 4.2.8R of the DTR of the UK’s FCA, being related party transactions that have taken place during the period ended 30 September 2017 and have materially affected the financial position or performance of the Company during that period.
The Directors are responsible for the maintenance and integrity of the corporate and financial information included on the Company’s website, and for the preparation and dissemination of financial statements. Legislation in Guernsey governing the preparation and dissemination of financial statements may differ from legislation in other jurisdictions.
Signed on behalf of the Board by:
Sandra PlattsDirector
7 December 2017
Sequoia Economic Infrastructure Income Fund Limited Unaudited Condensed Interim Financial Statements
Page 14
The Board has established a Risk Committee, which is responsible for reviewing the Company’s overall risks and monitoring the risk control activity designed to mitigate these risks. The Risk Committee has carried out a robust assessment of the principal risks facing the Company, including those that would threaten the Company’s business model, future performance, solvency or liquidity. The Board has appointed International Fund Management Limited (“IFML” or the “Investment Manager”) as the Alternative Investment Fund Manager (“AIFM”) to the Company. IFML is also responsible for providing risk management services compliant with that defined in the Alternative Investment Fund Managers Directive (“AIFMD”) and as deemed appropriate by the Board.
Under the instruction of the Risk Committee, IFML is responsible for the implementation of a risk management policy and ensuring that appropriate risk mitigation processes are in place; for monitoring risk exposure; preparing quarterly risk reports to the Risk Committee; and otherwise reporting on an ad hoc basis to the Board as necessary.
The principal risks associated with the Company are as follows:
Market riskThe value of the investments made and intended to be made by the Company will change from time to time according to a variety of factors, including the performance of the underlying borrowers, expected and unexpected movements in interest rates, exchange rates, inflation and bond ratings and general market pricing of similar investments will all impact the Company and its Net Asset Value.
Credit riskBorrowers in respect of loans or bonds in which the Group has invested may default on their obligations. Such default may adversely affect the income received by the Company and the value of the Company’s assets.
Liquidity riskInfrastructure debt investments in loan form are not likely to be publicly-traded or freely marketable, and debt investments in bond form may have limited or no secondary market liquidity. Such investments may therefore be difficult to value or sell and therefore the price that is achievable for the investments might be lower than the valuation of these assets.
Counterparty riskCounterparty risk can arise through the Company’s exposure to particular counterparties for executing transactions and the risk that the counterparties will not meet their contractual obligations.
Leverage riskLeverage risk arises where the Company takes on additional exposure to other risks because of the leverage of exposures, along with the specific potential for loss arising from a leverage counterparty being granted a charge over assets. The Board monitors the level of leverage on an ongoing basis as well as the credit ratings of any leverage counterparties.
Compliance & regulatory riskCompliance and regulatory risk can arise where processes and procedures are not followed correctly or where incorrect judgement causes the Company to be unable to fulfil its objectives or obligation, exposing the Company to the risk of loss, sanction or action by Shareholders, counterparties or regulators. The Investment Adviser and the Administrator monitor compliance with regulatory requirements and the Administrator presents a report at quarterly Board meetings.
Operational riskThis is the risk of loss resulting from inadequate or failed internal processes, people and systems or from external events. This can include, but is not limited to, internal/external fraud, business disruption and system failures, data entry errors and damage to physical assets.
These risks, and the way in which they are managed, are described in more detail in note 5 to the Company’s Annual Financial Statements for the year ended 31 March 2017. The Company’s principal risks and uncertainties have not changed materially since the date of that Report and are not expected to change materially for the remainder of the Company’s financial year.
Principal Risks and Uncertainties

Sequoia Economic Infrastructure Income Fund Limited Unaudited Condensed Interim Financial Statements
Page 15
Independent Review Report to the Members of Sequoia Economic Infrastructure Income Fund Limited
ConclusionWe have been engaged by Sequoia Economic Infrastructure Income Fund Limited (the “Company”) to review the condensed interim financial statements (the “financial statements”) in the half-yearly financial report for the six months ended 30 September 2017 of the Company which comprises the unaudited condensed interim statement of comprehensive income, the unaudited condensed interim statement of changes in equity, the unaudited condensed interim statement of financial position, the unaudited condensed interim statement of cash flows and the related explanatory notes.
Based on our review, nothing has come to our attention that causes us to believe that the condensed set of financial statements in the half-yearly financial report for the six months ended 30 September 2017 is not prepared, in all material respects, in accordance with IAS 34 Interim Financial Reporting and the Disclosure Guidance and Transparency Rules (“the DTR”) of the UK’s Financial Conduct Authority (“the UK FCA”).
Scope of reviewWe conducted our review in accordance with International Standard on Review Engagements (UK and Ireland) 2410 Review of Interim Financial Information Performed by the Independent Auditor of the Entity issued by the Auditing Practices Board for use in the UK. A review of interim financial information consists of making enquiries, primarily of persons responsible for financial and accounting matters, and applying analytical and other review procedures. We read the other information contained in the half-yearly financial report and consider whether it contains any apparent misstatements or material inconsistencies with the information in the condensed set of financial statements.
A review is substantially less in scope than an audit conducted in accordance with International Standards on Auditing (UK) and consequently does not enable us to obtain assurance that we would become aware of all significant matters that might be identified in an audit. Accordingly, we do not express an audit opinion.
Directors’ responsibilitiesThe half-yearly financial report is the responsibility of, and has been approved by, the Directors. The Directors are responsible for preparing the half-yearly financial report in accordance with the DTR of the UK FCA.
As disclosed in note 2, the annual financial statements of the Company are prepared in accordance with International Financial Reporting Standards. The Directors are responsible for preparing the condensed set of financial statements included in this half-yearly financial report in accordance with IAS 34.
Our responsibilityOur responsibility is to express to the Company a conclusion on the condensed set of financial statements in the half-yearly financial report based on our review.
The purpose of our review work and to whom we owe our responsibilitiesThis report is made solely to the Company in accordance with the terms of our engagement letter to assist the Company in meeting the requirements of the DTR of the UK FCA. Our review has been undertaken so that we might state to the Company those matters we are required to state to it in this report and for no other purpose. To the fullest extent permitted by law, we do not accept or assume responsibility to anyone other than the Company for our review work, for this report, or for the conclusions we have reached.
Dermot A. DempseyFor and on behalf of
KPMG Channel Islands Limited Chartered AccountantsGuernsey
7 December 2017

Sequoia Economic Infrastructure Income Fund Limited Unaudited Condensed Interim Financial Statements
Page 16
Unaudited Condensed Interim Statement of Comprehensive IncomeFor the period from 1 April 2017 to 30 September 2017
For the period from 1 April 2017 to
30 September 2017 (unaudited)
For the period from 1 April 2016 to
30 September 2016 (unaudited)
Note £ £
Revenue
Net (losses)/gains on non-derivative financial assets at fair value through profit or loss 6 (9,342,998) 25,326,134
Net gains/(losses) on derivative financial assets at fair value through profit or loss 7 11,179,627 (19,247,542)
Investment income 8 10,203,743 15,710,697
Net foreign exchange (losses)/gains (703,502) 425,502
Total revenue 11,336,870 22,214,791
Expenses
Investment Adviser’s fees 9 2,264,973 1,479,336
Investment Manager’s fees 9 159,119 122,341
Directors’ fees and expenses 9 93,250 86,750
Administration fees 9 179,733 163,888
Custodian fees 83,523 55,514
Audit and related non-audit fees 41,287 40,730
Legal and professional fees 41,467 45,824
Valuation fees 270,200 95,130
Listing and regulatory fees 31,754 33,465
Loan interest 12 596,204 –
Other expenses 101,825 98,101
Total operating expenses 3,863,335 2,221,079
Profit and total comprehensive income for the period 7,473,535 19,993,712
Basic and diluted earnings per Ordinary Share 11 1.07p 6.09p
Basic and diluted earnings per C Share 11 – 1.46p
All items in the above statement derive from continuing operations.
The accompanying notes on pages 20 to 33 form an integral part of the Financial Statements.

Sequoia Economic Infrastructure Income Fund Limited Unaudited Condensed Interim Financial Statements
Page 17
Unaudited Condensed Interim Statement of Changes in Shareholders’ EquityFor the period from 1 April 2017 to 30 September 2017
Share capital
Retained earnings
Total
Note £ £ £
At 1 April 2017 588,354,362 23,472,915 611,827,277
Issue of Ordinary Shares during the period, net of issue costs 10 157,895,248 – 157,895,248
Total comprehensive income for the period – 7,473,535 7,473,535
Dividend paid during the period 5 – (20,147,425) (20,147,425)
At 30 September 2017 746,249,610 10,799,025 757,048,635
For the period from 1 April 2016 to 30 September 2016 (unaudited)
Share capital
Retained earnings
Total
Note £ £ £
At 1 April 2016 291,136,398 5,969,282 297,105,680
Issue of Ordinary Shares during the period, net of issue costs 274,662 – 274,662
Issue of C Shares during the period, net of issue costs 172,212,492 – 172,212,492
Total comprehensive income for the period – 19,993,712 19,993,712
Dividend paid during the period 5 – (9,078,344) (9,078,344)
At 30 September 2016 463,623,552 16,884,650 480,508,202
The accompanying notes on pages 20 to 33 form an integral part of the Financial Statements.

Sequoia Economic Infrastructure Income Fund Limited Unaudited Condensed Interim Financial Statements
Page 18
Unaudited Condensed Interim Statement of Financial PositionAt 30 September 2017
30 September 2017(unaudited)
31 March 2017(audited)
Note £ £
Non-current assets
Non-derivative financial assets at fair value through profit or loss 6 725,074,656 604,801,618
Current assets
Cash and cash equivalents 60,780,793 46,734,809
Trade and other receivables 3,637,400 8,584,225
Derivative financial assets at fair value through profit or loss 7 11,019,133 2,886,733
Total current assets 75,437,326 58,205,767
Total assets 800,511,982 663,007,385
Current liabilities
Loan payable 12 40,512,273 40,527,090
Trade and other payables 1,418,469 1,287,213
Derivatives financial liabilities at fair value through profit or loss 7 1,532,605 9,365,805
Total liabilities 43,463,347 51,180,108
Net assets 757,048,635 611,827,277
Equity
Share capital 10 746,249,610 588,354,362
Retained earnings 10,799,025 23,472,915
Total equity 757,048,635 611,827,277
Number of Ordinary Shares 10 747,754,796 595,642,196
Net Asset Value per Ordinary Share 101.24p 102.72p
The Unaudited Condensed Interim Financial Statements on pages 16 to 33 were approved and authorised for issue by the Board of Directors on 7 December 2017 and signed on its behalf by:
Sandra PlattsDirector
The accompanying notes on pages 20 to 33 form an integral part of the Financial Statements.

Sequoia Economic Infrastructure Income Fund Limited Unaudited Condensed Interim Financial Statements
Page 19
Unaudited Condensed Interim Statement of Cash FlowsFor the period from 1 April 2017 to 30 September 2017
For the period from 1 April 2017
to 30 September 2017
For the period from 1 April 2016
to 30 September 2016
Note £ £
Cash flows from operating activities
Profit for the period 7,473,535 19,993,712
Adjustments for:
Net unrealised losses/(gains) on non-derivative financial assets at fair value through profit or loss
6 9,342,998 (25,246,882)
Net (gains)/losses on derivative financial assets at fair value through profit or loss 7 (11,179,627) 19,247,542
Net foreign exchange losses/(gains) 703,502 (425,502)
Decrease/(increase) in trade and other receivables 4,946,824 (7,174,567)
Increase in trade and other receivables 131,256 426,786
Decrease in loan payable (14,817) –
11,403,671 6,821,089
Net cash paid on settled forward contracts 7 (4,785,972) (11,204,285)
Purchases of investments 6 (130,381,381) (207,908,878)
Proceeds from sales of investments 6 765,345 86,741,299
Net cash outflow from operating activities (122,998,337) (125,550,775)
Cash flows from financing activities
Proceeds from issue of C Shares, net of issue costs 10 – 172,212,492
Proceeds from issue of Ordinary Shares, net of issue costs 10 157,895,248 274,662
Dividends paid 5 (20,147,425) (9,078,344)
Net cash inflow from financing activities 137,747,823 163,408,810
Net increase in cash and cash equivalents 14,749,486 37,858,035
Cash and cash equivalents at beginning of period 46,734,809 7,382,306
Effect of foreign exchange rate changes on cash and cash equivalents during the period
(703,502) 425,502
Cash and cash equivalents at end of period 60,780,793 45,665,843
The accompanying notes on pages 20 to 33 form an integral part of the Financial Statements.

Sequoia Economic Infrastructure Income Fund Limited Unaudited Condensed Interim Financial Statements
Page 20
Notes to the Unaudited Condensed Interim Financial StatementsFor the period from 1 April 2017 to 30 September 2017
1. General Information Sequoia Economic Infrastructure Income Fund Limited (the “Company”) was incorporated and registered in Guernsey under the Companies
(Guernsey) Law, 2008 on 30 December 2014. The Company’s registration number is 59596 and it is regulated by the Guernsey Financial Services Commission as a registered closed ended collective investment scheme under The Registered Collective Investment Scheme Rules 2015. The Company is listed and began trading on the Main Market of the London Stock Exchange and was admitted to the premium segment of the Official List of the UK Listing Authority on 3 March 2015.
The Company makes its investments through Sequoia IDF Asset Holdings S.A. (the “Subsidiary”). The Company controls the Subsidiary through a holding of 100% of its shares. The Company further invests in the Subsidiary through the acquisition of Variable Funding Notes (“VFNs”) issued by the Subsidiary. The Subsidiary is domiciled in Luxembourg and has no underlying subsidiaries.
Through its Subsidiary, the Company invests in a diversified portfolio of senior and subordinated economic infrastructure debt investments.
With effect from 28 January 2015, Sequoia Investment Management Company Limited (the “Investment Adviser”) was appointed as the Investment Adviser and International Fund Management Limited (the “Investment Manager”) was appointed as the Investment Manager.
2. Significant Accounting Policies Basis of preparation and statement of compliance These Unaudited Condensed Financial Statements (“Financial Statements”) have been prepared in accordance with International
Accounting Standard (IAS) 34 ‘Interim Financial Reporting’, the Listing Rules of the London Stock Exchange (“LSE”) and applicable legal and regulatory requirements. They do not include all the information and disclosures required in Annual Financial Statements and should be read in conjunction with the Company’s last Annual Audited Financial Statements for the year ended 31 March 2017.
The accounting policies applied in these Financial Statements are consistent with those applied in the last Annual Audited Financial Statements for the year ended 31 March 2017, which were prepared in accordance with International Financial Reporting Standards (“IFRS”), as issued by the IASB. Having reassessed the principal risks, the Company’s financial position as at 30 September 2017 and the factors that may impact its performance in the forthcoming year, the Directors considered it appropriate to adopt the going concern basis of accounting in preparing these Financial Statements.
These Financial Statements were authorised for issue by the Company’s Board of Directors on 29 November 2017.
Significant judgements and estimates There have been no changes to the significant accounting judgements, estimates and assumptions from those applied in the Company’s
Audited Annual Financial Statements for the year ended 31 March 2017.
New Accounting Standards effective and adopted• IAS 7 (amended) “Statement of Cash Flows” (amendments arising as a result of the disclosure initiative, effective for periods
commencing on or after 1 January 2017).
In addition, the IASB completed its Annual Improvements 2014-2016 Cycle project in December 2016. This project has amended a number of existing standards and interpretations effective for accounting periods commencing on or after 1 January 2017 or 1 January 2018.
The adoption of these amended standards has had no material impact on the Financial Statements of the Company.
Sequoia Economic Infrastructure Income Fund Limited Unaudited Condensed Interim Financial Statements
Page 20
Sequoia Economic Infrastructure Income Fund Limited Unaudited Condensed Interim Financial Statements
Page 21Page 21
Sequoia Economic Infrastructure Income Fund Limited Unaudited Condensed Interim Financial Statements
Notes to the Unaudited Condensed Interim Financial Statements (continued)For the period from 1 April 2017 to 30 September 2017
3. Segmental Reporting In the Board’s opinion, the Company is engaged in a single segment of business, through its investment in the Subsidiary, being investment
in senior and subordinated infrastructure debt instruments and related and/or similar assets.
The Company receives no revenues from external customers, nor holds any non-current assets, in any geographical area other than Guernsey.
4. Financial Risk Management The Company’s financial risk management objectives and policies are consistent with those disclosed in the Company’s Audited Annual
Financial Statements for the year ended 31 March 2017.
5. Dividends The Company’s dividend policy, subject to sufficient profits being available and taking into account working capital and liquidity requirements,
is to pay dividends totalling 6% per annum of the Company’s original issue price per Ordinary Share. The Company pays dividends on a quarterly basis.
The Company paid the following dividends during the period ended 30 September 2017:
Dividend rate per Ordinary Net dividend Period to Payment date Share (pence) payable (£) Record date Ex-dividend date 31 March 2017 24 May 2017 1.5 8,934,633 28 April 2017 27 April 2017 30 June 2017 25 August 2017 1.5 11,212,792 28 July 2017 27 July 2017
The Company paid the following dividends during the period ended 30 September 2016:
Dividend rate per Ordinary Net dividend Period to Payment date Share (pence) payable (£) Record date Ex-dividend date 31 March 2016 25 May 2016 1.5 4,538,231 29 April 2016 28 April 2016 30 June 2016 26 August 2016 1.5 4,540,113 29 July 2016 28 July 2016
Under Guernsey law, the Company can pay dividends in excess of its accounting profit provided it satisfies the solvency test prescribed by the Companies (Guernsey) Law, 2008. The solvency test considers whether the Company is able to pay its debts when they fall due, and whether the value of the Company’s assets is greater than its liabilities. The Company satisfied the solvency test in respect of the dividend declared in the period.
6. Financial Assets at fair value through Profit or Loss 30 September 2017 31 March 2017 (unaudited) (audited) £ £Cost at the start of the period/year 548,018,390 279,073,491VFNs purchased during the period/year 130,381,381 412,036,161VFNs redeemed during the period/year (765,345) (143,170,514)Realised gains on redemptions of VFNs – 79,252
Cost at the end of the period/year 677,634,426 548,018,390Net gains on non-derivative financial assets at the end of the period/year 47,440,230 56,783,228
Non-derivative financial assets at fair value through profit or loss at the end of the period/year 725,074,656 604,801,618

Sequoia Economic Infrastructure Income Fund Limited Unaudited Condensed Interim Financial Statements
Page 22
6. Financial Assets at fair value through Profit or Loss (continued) The following table provides a reconciliation of the financial assets at fair value through profit or loss of the Subsidiary to the Company’s
financial assets at fair value through profit or loss:
30 September 2017 31 March 2017 (unaudited) (audited) £ £Subsidiary’s non-derivative financial assets at fair value through profit or loss 670,032,652 593,188,992Subsidiary’s net current assets 55,042,004 11,612,626
Company’s non-derivative financial assets at fair value through profit or loss 725,074,656 604,801,618
None of the Subsidiary’s non-derivative financial assets at fair value through profit or loss are subject to any special arrangements arising from their illiquid nature.
The Company’s net gains on non-derivative financial assets at fair value through profit or loss in the period comprises the following:
30 September 2017 30 September 2016 (unaudited) (unaudited) £ £Unrealised foreign exchange (losses)/gains on VFNs during the period (17,657,198) 26,943,393Realised gains on VFNs redeemed during the period – 79,252Unrealised gains/(losses) on revaluation of the Subsidiary in the period 8,314,200 (1,696,511)
Net (losses)/gains on non-derivative financial assets at fair value through profit or loss in the period (9,342,998) 25,326,134
On a look-through basis, the Fund’s cumulative net gains on non-derivative financial assets at fair value through profit or loss as at 30 September 2017 comprises the following:
30 September 2017 31 March 2017 (unaudited) (audited) £ £SubsidiaryInvestment income during the period/year 20,815,341 28,242,532Realised gains on non-derivative financial assets at fair value through profit or loss during the period/year 877,557 12,824,516Unrealised (losses)/gains on non-derivative financial assets at fair value through profit or loss during the period/year (19,286,467) 30,014,630Foreign exchange gains/(losses) during the period/year 13,858,285 (32,419,787)Interest on VFNs during the period/year (10,115,676) (28,007,811)Net income/(expenses) during the period/year 2,165,160 (40,130)
8,314,200 10,613,950Subsidiary gains/(losses) brought forward 9,007,273 (1,606,677)
17,321,473 9,007,273CompanyUnrealised foreign exchange gains on VFNs brought forward 47,775,955 14,732,542Unrealised foreign exchange (losses)/gains on VFNs in the period/year (17,657,198) 33,043,413
Net gains on non-derivative financial assets at fair value through profit or loss at the end of the period/year 47,440,230 56,783,228
Notes to the Unaudited Condensed Interim Financial Statements (continued)For the period from 1 April 2017 to 30 September 2017
Sequoia Economic Infrastructure Income Fund Limited Unaudited Condensed Interim Financial Statements
Page 23Page 23
Sequoia Economic Infrastructure Income Fund Limited Unaudited Condensed Interim Financial Statements
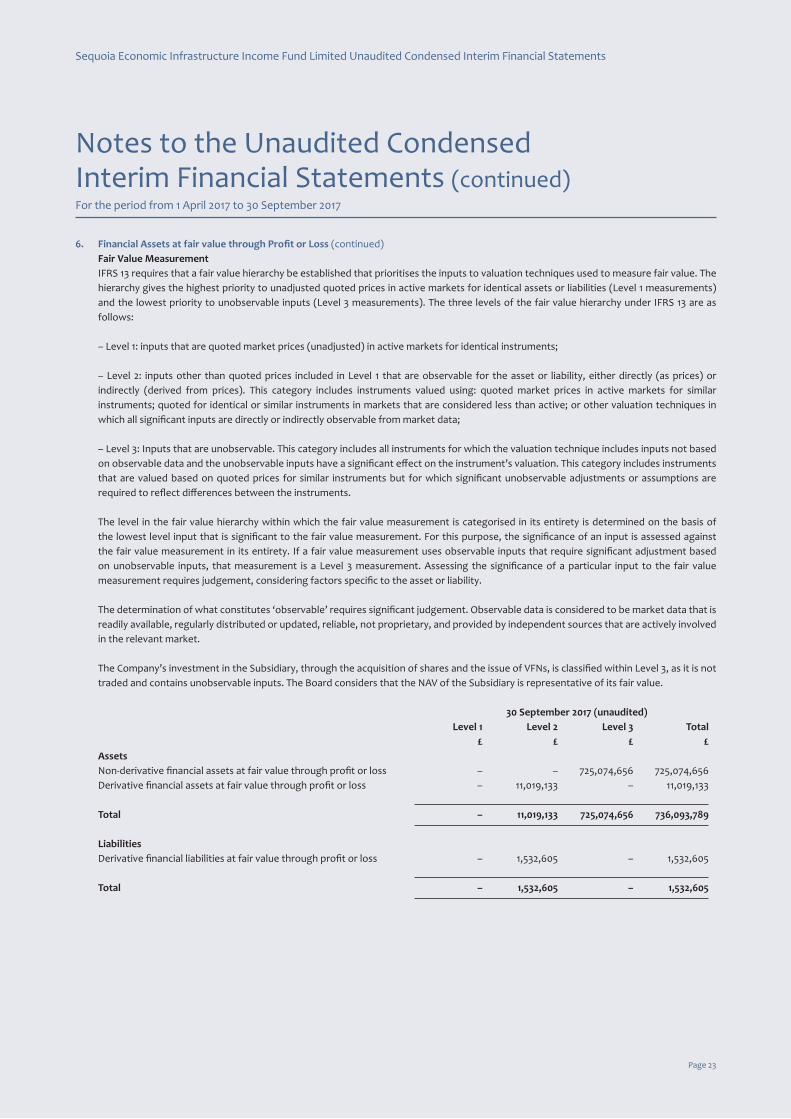
6. Financial Assets at fair value through Profit or Loss (continued) Fair Value Measurement IFRS 13 requires that a fair value hierarchy be established that prioritises the inputs to valuation techniques used to measure fair value. The
hierarchy gives the highest priority to unadjusted quoted prices in active markets for identical assets or liabilities (Level 1 measurements) and the lowest priority to unobservable inputs (Level 3 measurements). The three levels of the fair value hierarchy under IFRS 13 are as follows:
– Level 1: inputs that are quoted market prices (unadjusted) in active markets for identical instruments;
– Level 2: inputs other than quoted prices included in Level 1 that are observable for the asset or liability, either directly (as prices) or indirectly (derived from prices). This category includes instruments valued using: quoted market prices in active markets for similar instruments; quoted for identical or similar instruments in markets that are considered less than active; or other valuation techniques in which all significant inputs are directly or indirectly observable from market data;
– Level 3: Inputs that are unobservable. This category includes all instruments for which the valuation technique includes inputs not based on observable data and the unobservable inputs have a significant effect on the instrument’s valuation. This category includes instruments that are valued based on quoted prices for similar instruments but for which significant unobservable adjustments or assumptions are required to reflect differences between the instruments.
The level in the fair value hierarchy within which the fair value measurement is categorised in its entirety is determined on the basis of the lowest level input that is significant to the fair value measurement. For this purpose, the significance of an input is assessed against the fair value measurement in its entirety. If a fair value measurement uses observable inputs that require significant adjustment based on unobservable inputs, that measurement is a Level 3 measurement. Assessing the significance of a particular input to the fair value measurement requires judgement, considering factors specific to the asset or liability.
The determination of what constitutes ‘observable’ requires significant judgement. Observable data is considered to be market data that is readily available, regularly distributed or updated, reliable, not proprietary, and provided by independent sources that are actively involved in the relevant market.
The Company’s investment in the Subsidiary, through the acquisition of shares and the issue of VFNs, is classified within Level 3, as it is not traded and contains unobservable inputs. The Board considers that the NAV of the Subsidiary is representative of its fair value.
30 September 2017 (unaudited) Level 1 Level 2 Level 3 Total £ £ £ £AssetsNon-derivative financial assets at fair value through profit or loss – – 725,074,656 725,074,656Derivative financial assets at fair value through profit or loss – 11,019,133 – 11,019,133
Total – 11,019,133 725,074,656 736,093,789
LiabilitiesDerivative financial liabilities at fair value through profit or loss – 1,532,605 – 1,532,605
Total – 1,532,605 – 1,532,605
Notes to the Unaudited Condensed Interim Financial Statements (continued)For the period from 1 April 2017 to 30 September 2017

Sequoia Economic Infrastructure Income Fund Limited Unaudited Condensed Interim Financial Statements
Page 24
6. Financial Assets at fair value through Profit or Loss (continued) Fair Value Measurement (continued)
31 March 2017 (audited) Level 1 Level 2 Level 3 Total £ £ £ £AssetsNon-derivative financial assets at fair value through profit or loss – – 604,801,618 604,801,618Derivative financial assets at fair value through profit or loss – 2,886,733 – 2,886,733
Total – 2,886,733 604,801,618 607,688,351
LiabilitiesDerivative financial liabilities at fair value through profit or loss – 9,365,805 – 9,365,805
Total – 9,365,805 – 9,365,805
There have been no transfers between levels of the fair value hierarchy during the period. Transfers between levels of the fair value hierarchy are recognised at the end of the reporting period during which the change has occurred.
Movements in the Company’s Level 3 financial instruments during the period/year were as follows:
30 September 2017 31 March 2017 (unaudited) (audited) £ £Opening balance 604,801,618 292,199,356Purchases 130,381,381 412,036,161Sales (765,345) (143,170,514)Net (losses)/gains on non-derivative financial assets at the end of the period/year (9,342,998) 43,736,615
Closing balance 725,074,656 604,801,618
The investments held by the Subsidiary in the underlying portfolio are classified within the fair value hierarchy as follows:
30 September 2017 (unaudited) Level 1 Level 2 Level 3 Total £ £ £ £AssetsNon-derivative financial assets at fair value through profit or loss 19,126,540 252,067,864 398,838,248 670,032,652
31 March 2017 (audited) Level 1 Level 2 Level 3 Total £ £ £ £AssetsNon-derivative financial assets at fair value through profit or loss 60,738,269 225,880,018 306,570,705 593,188,992
Notes to the Unaudited Condensed Interim Financial Statements (continued)For the period from 1 April 2017 to 30 September 2017

Sequoia Economic Infrastructure Income Fund Limited Unaudited Condensed Interim Financial Statements
Page 25Page 25
Sequoia Economic Infrastructure Income Fund Limited Unaudited Condensed Interim Financial Statements
6. Financial Assets at fair value through Profit or Loss (continued) Fair Value Measurement (continued) The Subsidiary’s Level 3 investment valuations are calculated by discounting future cashflows at a yield appropriate to comparable
infrastructure loans or bonds (with such yield assessed primarily from publicly available sources and secondarily in consultation with brokers and syndicate desks). Spread data will also be cross-referenced to recently priced primary market transactions if possible. When identifying comparable loans or bonds, for the purpose of assessing market yields, structural and credit characteristics and project type are also considered.
The following table shows the Directors’ best estimate of the sensitivity of the Subsidiary’s Level 3 investments to changes in the principal unobservable input, with all other variables held constant.
30 September 2017 31 March 2017 (unaudited) (unaudited) Possible reasonable effect on net assets effect on net assets change in input and profit or loss and profit or loss* Unobservable input £ £
Yield +1% (3,098,237) (3,376,740) -1% 3,453,866 3,755,287
* The basis for the calculation of the sensitivity of the fair value of the Level 3 investments at 30 September 2017 has been updated to further improve its relevance. The comparative amounts as at 31 March 2017 have been reclassified to amend the previously reported amounts to the new basis of calculation and disclosure.
The possible changes in the yield of 1% are regarded as reasonable in view of the current low level of global interest rates.
The cash and cash equivalents, trade and other receivables and trade and other payables are carried at amortised cost; their carrying values are a reasonable approximation of fair value.
Valuation techniques for the investment portfolio of the Subsidiary The principles and techniques utilised during the period in determining the valuations are described below.
Performing Portfolio Loans and Bonds Valuations of performing portfolio loans and bonds are based on actual market prices (bid-side prices) obtained from third-party brokers
and syndicate desks if available (such brokers to be agreed with the Investment Adviser); if such prices are not available, then valuations are calculated by discounting future cashflows at a yield appropriate to comparable infrastructure loans or bonds (with such yield assessed primarily from publically available sources and secondarily in consultation with brokers and syndicate desks). Spread data will also be cross-referenced to recently-priced primary market transactions if possible.
When identifying comparable loans or bonds, for the purpose of assessing market yields, the following will be taken into account:
• Project type: jurisdiction, sector, project status, transaction counterparties such as construction companies, facility management providers;
• Structural characteristics: maturity and average life, seniority, secured/unsecured, amortisation profile, cash sweeps, par versus discount; and
• Credit characteristics: credit ratios (e.g. equity cushion, asset cover/LTV, debt service coverage ratios or equivalent, debt/EBITDA), ratings and ratings trajectory.
Notes to the Unaudited Condensed Interim Financial Statements (continued)For the period from 1 April 2017 to 30 September 2017

Sequoia Economic Infrastructure Income Fund Limited Unaudited Condensed Interim Financial Statements
Page 26
6. Financial Assets at fair value through Profit or Loss (continued) Valuation techniques for the investment portfolio of the Subsidiary (continued)
Performing Portfolio Loans and Bonds (continued) In calculating the net present value of future cashflows on loans with uncertain cashflows (such as cash-sweep mechanisms), “banking base
case” cashflows are used unless there is clear evidence that the market is using a valuation based upon another set of cashflows.
In the case of discount loans with step-up margins, the assumption will be that market discounts are calculated on a yield-to-worst basis, unless there is clear evidence that the market convention for that loan is different.
For variable rate loans and bonds, for the purposes of projecting cashflows, the market convention of simple compounding to the next interest payment date is used and swap rates for subsequent interest payments, unless there is clear evidence that the market convention for that loan or bond is different.
Non-performing Portfolio Loans and Bonds Valuations of non-performing portfolio loans and bonds are based on actual market prices obtained from third-party brokers if available,
otherwise the net present value of future expected loan cashflows will be calculated, estimated on the basis of the median outcome and discount rate that reflects the market yield of distressed/defaulted loans or bonds.
In assessing the median outcome cashflows, a project/corporate model that reflects the distressed state of the project will be used in order to assess a range of potential outcomes for expected future cashflows with regards to, for example, interest or principal recoveries and timing. The Investment Adviser will work closely with the independent third party valuer and they will have access to the Investment Adviser’s own model, analysis and internal valuations. These valuations will be subject to a high degree of management oversight by the Investment Manager and will be reviewed with high frequency.
Valuation Agent With effect from 28 January 2015, the Company engaged Mazars LLP (“Mazars”) as Valuation Agent. During the period, the Company
terminated Mazars’ engagement and engaged PricewaterhouseCoopers LLP as Valuation Agent with effect from 18 April 2017.
The Valuation Agent is responsible for reviewing the valuations applied by the Investment Adviser in relation to the acquisition of illiquid loans and, on a monthly basis, for performing an independent fair valuation review of the draft pricing of the portfolio loans and bonds provided by the Investment Adviser. The Valuation Agent’s reports are in turn reviewed and checked by the Investment Adviser and, finally, by the Investment Manager, who holds ultimate responsibility under the Alternative Investment Fund Managers Directive (“AIFMD”) for the final valuation of the Fund’s investments.
Finalising the Net Asset Value Once the appropriate position price has been determined to be applied to each investment, the calculation of the Subsidiary’s net asset
value is finalised through the following steps:
• Conversion of each investment into GBP based on month end FX exchange rates;• Reconciliation of any interest accrued since issue of the most recent coupon; and• Aggregation of the investments into a single Fund NAV position statement (clean and dirty price).
Notes to the Unaudited Condensed Interim Financial Statements (continued)For the period from 1 April 2017 to 30 September 2017

Sequoia Economic Infrastructure Income Fund Limited Unaudited Condensed Interim Financial Statements
Page 27Page 27
Sequoia Economic Infrastructure Income Fund Limited Unaudited Condensed Interim Financial Statements
7. Derivative Financial Assets at fair value through Profit or Loss As at 30 September 2017, the Company had the following outstanding commitments in respect of open forward foreign exchange contracts.
Unrealised Unrealised Net unrealised30 September 2017 (unaudited) gains losses gainsCounterparty £ £ £Global Reach 2,677,854 – 2,677,854Investec Bank 1,821,834 (731,392) 1,090,442Monex 990,587 (169,055) 821,532Moneycorp 503,853 – 503,853RBSI 5,025,005 (632,158) 4,392,847
11,019,133 (1,532,605) 9,486,528
Unrealised Unrealised Net unrealised31 March 2017 (audited) gains losses gains/(losses)Counterparty £ £ £Global Reach 244,624 (53,026) 191,598Investec Bank 1,196,382 (258,548) 937,834Monex 138,243 (8,924,702) (8,786,459)RBSI 1,307,484 (129,529) 1,177,955
2,886,733 (9,365,805) (6,479,072)
All forward foreign exchange positions at the period end were held with Investec Bank plc, Monex Europe Limited, TTT Moneycorp Limited, the Royal Bank of Scotland International or Global Reach Partners, as noted above. There are no master netting arrangements in place.
The net gain/(loss) on forward foreign exchange contracts in the period comprises both realised and unrealised losses as follows:
30 September 2017 30 September 2016 (unaudited) (unaudited) £ £Realised losses on forward foreign exchange contracts during the period (4,785,972) (11,204,285)Unrealised gains/(losses) on forward foreign exchange contracts during the period 15,965,599 (8,043,257)
Net gains/(losses) on forward foreign exchange contracts during the period 11,179,627 (19,247,542)
8. Investment Income 30 September 2017 30 September 2016 (unaudited) (unaudited) £ £Interest income on financial assets carried at amortised cost:Cash and cash equivalents 88,067 102,475
Interest income on the Company’s non-derivative financial assets at fair value through profit and loss 10,115,676 15,608,222
10,203,743 15,710,697
Notes to the Unaudited Condensed Interim Financial Statements (continued)For the period from 1 April 2017 to 30 September 2017

Sequoia Economic Infrastructure Income Fund Limited Unaudited Condensed Interim Financial Statements
Page 28
9. Related Parties and Other Material Contracts Directors’ Fees Robert Jennings is entitled to a fee in remuneration for his services as Chairman of the Board of Directors at a rate payable of £56,000 per
annum (increased from £52,000 per annum with effect from 1 April 2017). The remaining Directors are entitled to a fee in remuneration for their services as Directors at a rate of £36,500 each per annum (increased from £35,000 per annum with effect from 1 April 2017).
Jan Pethick, Jon Bridel and Sandra Platts are also each entitled to a fee of £7,000 per annum (increased from £5,500 per annum with effect from 1 April 2017) in respect of their roles as Chairman of the Management Engagement Committee, Chairman of the Risk Committee and Chairman of the Audit and Remuneration Committees respectively.
During the period, Robert Jennings, Jan Pethick, Jon Bridel and Sandra Platts each received a listing fee of £6,000 in relation to the Company’s Open Offer, Placing and Offer for Subscription on 31 May 2017, subject to admission. During the prior period, Robert Jennings, Jan Pethick, Jon Bridel and Sandra Platts each received a listing fee of £5,000, which was subject to issue of the Prospectus, in relation to the listing of C shares on 10 June 2016.
Ordinary Shares held by related parties The Shareholdings of the Directors’ in the Company at 30 September 2017 were as follows:
30 September 2017 31 March 2017 (unaudited) (audited) Percentage of Percentage ofName Number of Ordinary Shares Number of Ordinary Shares Ordinary Shares in Issue Ordinary Shares in IssueRobert Jennings (Chairman)(with other members of his family) 217,200 0.03% 181,000 0.03%Jan Pethick (with his spouse) 219,504 0.03% 219,504 0.04%Jon Bridel (with his spouse) 10,452 0.00% 10,452 0.00%Sandra Platts (in a family RATS) 16,139 0.00% 10,452 0.00%
As at 30 September 2017, the Investment Adviser held an aggregate of 1,331,271 Ordinary Shares (31 March 2017: 877,439 Ordinary Shares), which is 0.18% (31 March 2017: 0.15%) of the issued share capital.
As at 30 September 2017, the members of the Investment Adviser’s founding team held an aggregate of 681,643 Ordinary Shares (31 March 2017: 670,215 Ordinary Shares), which is 0.09% (31 March 2017: 0.11%) of the issued share capital. During the period, a member of the Investment Adviser’s founding team acquired a further holding of 11,428 Ordinary Shares in the Open Offer, Placing and Offer for Subscription of Ordinary Shares on 31 May 2017.
As at 30 September 2017, the Investment Manager held an aggregate of 50,000 Ordinary Shares (31 March 2017: 50,000 Ordinary Shares), which is 0.01% (31 March 2017: 0.01%) of the issued share capital.
Transactions with Investment Manager and Investment Adviser
Investment Manager With effect from 28 January 2015, International Fund Management Limited (the “Investment Manager”) was appointed as the Investment
Manager. With effect from 1 December 2016, the Investment Manager was entitled to receive a management fee for AIFM services calculated as follows:
• if the Company’s NAV is less than £200 million, 0.075% per annum of the value of the Company’s NAV; plus• if the Company’s NAV is more than £200 million and less than £400 million, 0.05% per annum of the Company’s NAV not included above;
plus • if the Company’s NAV is more than £400 million and less than £500 million, 0.04% per annum of the Company’s NAV not included above;
plus• if the Company’s NAV is more than £500 million, 0.015% per annum of the Company’s NAV not included above.
Notes to the Unaudited Condensed Interim Financial Statements (continued)For the period from 1 April 2017 to 30 September 2017

Sequoia Economic Infrastructure Income Fund Limited Unaudited Condensed Interim Financial Statements
Page 29Page 29
Sequoia Economic Infrastructure Income Fund Limited Unaudited Condensed Interim Financial Statements
9. Related Parties and Other Material Contracts (continued) Transactions with Investment Manager and Investment Adviser (continued)
Investment Manager (continued) Prior to 1 May 2016, the rate applied to the first £200 million of the NAV was 0.064%. Prior to 1 December 2016, the rate applied to NAV
balances over £500 million was 0.04%.
The fee is subject to an annualised minimum of £80,000 applied on a monthly basis and is payable monthly in arrears. With effect from 2 May 2017, the management fee was capped at £320,000 per annum.
In addition, the Investment Manager received a fee during the period of £7,500 for services rendered in connection with the Open Offer, Placing and Offer for Subscription of Ordinary Shares on 31 May 2017.
The Investment Management agreement can be terminated by either party giving not less than 6 months written notice.
Investment Adviser With effect from 28 January 2015, Sequoia Investment Management Company Limited (the “Investment Adviser”) was appointed as the
Investment Adviser. The Investment Adviser is entitled to receive from the Company a base fee calculated as follows and payable quarterly:
• 0.5% per annum of the value of the listed debt securities owned by the Subsidiary; plus • if the Company’s NAV is less than £250 million, 0.9% per annum of the value of the Company’s other investments (excluding listed debt
securities and cash); plus• if the Company’s NAV is more than £250 million and less than £500 million, 0.8% per annum of the value of the Company’s other
investments (excluding listed debt securities and cash) not included above; plus • if the Company’s NAV is more than £500 million, 0.7% per annum of the value of the Company’s other investments (excluding listed
debt securities and cash) not included above; plus• if the Company’s NAV is more than £750 million, 0.6% per annum of the value of the Company’s other investments (excluding listed
debt securities and cash) not included above.
One quarter of the Investment Adviser’s fee will be applied in subscribing for Ordinary Shares in the Company, which the Investment Adviser shall retain with a three-year rolling lock-up (such that those Ordinary Shares may not be sold or otherwise disposed of by the Investment Adviser without the prior consent of the Company before the third anniversary of the date of issue of the relevant Ordinary Shares). If the Company raises further capital or otherwise increases its Net Asset Value, the Investment Adviser will receive a reduced percentage fee.
On 20 April 2017, the Company issued 218,497 Ordinary Shares to the Investment Adviser in relation to fees payable for the quarter ended 31 March 2017.
On 20 July 2017, the Company issued 235,335 Ordinary Shares of no par value to the Investment Adviser, in relation to fees payable for the period ended 30 June 2017.
On 18 October 2017, the Company issued 275,886 Ordinary Shares of no par value to the Investment Adviser, in relation to fees payable for the period ended 30 September 2017.
The Investment Advisory agreement can be terminated by either party giving not less than 6 months written notice. The Investment Adviser’s appointment will be automatically terminated upon termination of the Investment Manager’s appointment under the Investment Management Agreement.
Notes to the Unaudited Condensed Interim Financial Statements (continued)For the period from 1 April 2017 to 30 September 2017

Sequoia Economic Infrastructure Income Fund Limited Unaudited Condensed Interim Financial Statements
Page 30
9. Related Parties and Other Material Contracts (continued) Other Material Contracts Administrator With effect from 28 January 2015, Praxis Fund Services Limited (the “Administrator”) was appointed as the Administrator. With effect from
1 June 2016, the Administrator is entitled to receive from the Company a base fee for its services based on the following sliding scale:
• if the Company’s NAV is less than £300 million, 0.07% per annum of the value of the Company’s NAV; plus• if the Company’s NAV is more than £300 million and less than £400 million, 0.05% per annum of the Company’s NAV not included above;
plus • if the Company’s NAV is more than £400 million, 0.04% per annum of the Company’s NAV not included above.
Prior to 1 June 2016, the base fee was calculated at a single rate of 0.07% of the Company’s NAV. The base fee is subject to a minimum of £65,000 applied on a monthly basis and is capped at £300,000 per annum. The Administrator is also entitled to a fee for company secretarial services based on time costs.
In addition, the Administrator received a fee during the period of £18,000 for services rendered in connection with the Open Offer, Placing and Offer for Subscription of Ordinary Shares on 31 May 2017.
Subsidiary Administrator With effect from 28 January 2015, TMF Luxembourg S.A. (the “Subsidiary Administrator”) was appointed as the administrator of the
Subsidiary. With effect from 1 January 2017, the Subsidiary Administrator is entitled to receive an annual fee of €24,600 (prior to 1 January 2017: €24,000 per annum) and, in addition, a fee for NAV reconciliation and reporting services based on time costs but capped at €6,150 per annum (prior to 1 January 2017: €6,000 per annum).
Custodian With effect from 27 February 2015, The Bank of New York Mellon (the “Custodian”) was appointed as the Custodian. The Custodian is
entitled to receive fees, as agreed from time to time, for services provided as portfolio administrator, calculating agent, account bank and custodian.
The amounts charged for the above-mentioned fees during the period ended 30 September 2017 and outstanding at 30 September 2017 are as follows:
Charge for the Charge for the period from Amounts period from Amounts 1 April 2017 outstanding at 1 April 2016 outstanding at to 30 September 2017 30 September 2017 to 30 September 2016 31 March 2017 (unaudited) (unaudited) (unaudited) (audited) £ £ £ £Investment advisory fee 2,264,973 1,227,141 1,479,336 1,060,127Investment management fee 159,119 – 122,341 26,056Administration fee 179,733 6,238 163,888 35,628Directors’ fees and expenses 93,250 – 86,750 –Sub-administration fee* 10,511 3,965 19,915 2,950Fees payable to the Custodian* 181,919 75,312 113,175 96,632
2,889,505 1,312,656 1,985,405 1,221,393
* Includes expenses of the Subsidiary
Notes to the Unaudited Condensed Interim Financial Statements (continued)For the period from 1 April 2017 to 30 September 2017

Sequoia Economic Infrastructure Income Fund Limited Unaudited Condensed Interim Financial Statements
Page 31Page 31
Sequoia Economic Infrastructure Income Fund Limited Unaudited Condensed Interim Financial Statements
9. Related Parties and Other Material Contracts (continued) Overdraft facility On 15 February 2016, the Company entered into an overdraft facility with the Royal Bank of Scotland International Limited with a limit of
£1,500,000. As at 30 September 2017, this facility had not been utilised.
Loan collateral The Company is the guarantor of a Senior VFN in the sum of £40 million, which serves as collateral for a loan of £40 million payable to JP
Morgan Chase Bank, London Branch (see note 12).
10. Share Capital The Company’s Ordinary Shares and C Shares are classified as equity. Incremental costs directly attributable to the issue of Ordinary Shares
and C Shares are recognised as a deduction in equity and are charged to the relevant share capital account, including the initial set up costs.
The Company undertakes that it shall ensure that its records and bank accounts are operated in such a way that the assets attributable to the Ordinary Shares and the C Shares can be separately identified. On the conversion of C Shares to Ordinary Shares, C Shareholders shall be allocated an appropriate number of Ordinary Shares, calculated by reference to the conversion ratio.
The authorised share capital of the Company is represented by an unlimited number of Shares of nil par value, to which are attached the following rights:
(a) Dividends: Ordinary Shareholders and C Shareholders are entitled to receive, and participate in, any dividends or other distributions resolved to be distributed from their respective pools of assets in respect of any accounting period or other period, provided that no calls or other sums due by them to the Company are outstanding.
(b) Winding Up: On a winding up, the Ordinary Shareholders and C Shareholders shall be entitled to the surplus assets remaining in their respective pools of assets after payment of creditors.
(c) Voting: Ordinary Shareholders have the right to receive notice of and to attend, speak and vote at general meetings of the Company and each holder being present in person or by proxy shall upon a show of hands have one vote and upon a poll one vote in respect of every Ordinary Share held. C Shareholders have no right to attend or vote at any meeting of the Company, except that the consent of C Shareholders is required for any alteration to the Memorandum or Articles of the Company; for the passing of any resolution to wind up the Company; and for the variation or abrogation of the rights attached to the C Shares.
Issued Share Capital Ordinary and C Shares
30 September 2017 31 March 2017 (unaudited) (audited) Ordinary Ordinary C shares shares C shares shares Number Number Number NumberShare Capital at the beginning of the period/year – 595,642,196 – 302,548,728Share Capital issued and fully paid – 152,112,600 175,171,834 120,689,349Converted from C to Ordinary Shares – – (175,171,834) 172,404,119
Total Share Capital at the end of the period/year – 747,754,796 – 595,642,196
Notes to the Unaudited Condensed Interim Financial Statements (continued)For the period from 1 April 2017 to 30 September 2017

Sequoia Economic Infrastructure Income Fund Limited Unaudited Condensed Interim Financial Statements
Page 32
Sequoia Economic Infrastructure Income Fund Limited Unaudited Condensed Interim Financial Statements
Page 32
Notes to the Unaudited Condensed Interim Financial Statements (continued)For the period from 1 April 2017 to 30 September 2017
10. Share Capital (continued) Issued Share Capital (continued)
Ordinary and C Shares (continued) 30 September 2017 31 March 2017 (unaudited) (audited) Ordinary Ordinary C shares shares C shares shares £ £ £ £Share Capital at the beginning of the period/year – 588,354,362 – 291,136,398Share Capital issued and fully paid – 160,501,989 175,171,834 126,755,714Share issue costs – (2,606,741) (2,962,136) (1,737,448)Converted to Ordinary Shares – – (172,209,698) 172,199,698
Total Share Capital at the end of the period/year – 746,249,610 – 588,354,362
On 31 May 2017, the Company issued 151,658,768 new Ordinary Shares at an issue price of £1.055 in respect of the Company’s Open Offer, Placing and Offer for Subscription.
During the period, 453,832 Ordinary Shares (31 March 2017: 689,349 Ordinary Shares) have been issued to the Investment Adviser in relation to fees payable for the period from 1 January 2017 to 30 June 2017, at an average issue price of £1.11 per Ordinary Share (see note 9).
During the prior period, 175,171,834 C Shares were issued at an issue price of £1.00 per Share. On 1 November 2016, each C Share was converted to Ordinary Shares at a rate of 0.9842 Ordinary Shares per C Share, on the basis of the NAVs of the respective share classes. Costs of £10,000 were incurred in relation to the conversion.
11. Basic and Diluted Earnings Per Share For the period For the period from 1 April 2017 from 1 April 2016 to 30 September 2017 to 30 September 2016 (unaudited) (unaudited)Ordinary SharesProfit for the financial period £7,473,535 £19,993,712Weighted average number of Shares 697,019,818 302,715,299Basic and diluted earnings per Share 1.07p 6.09p
For the period For the period from 1 April 2017 from 1 April 2016 to 30 September 2017 to 30 September 2016 (unaudited) (unaudited)C SharesProfit for the financial period – £1,569,421Weighted average number of Shares – 107,208,991Basic and diluted earnings per Share – 1.46p
The weighted average numbers of Ordinary and C Shares are based on the number of Ordinary and C Shares in issue during the period under review, as detailed in note 10.
There was no dilutive effect for potential Ordinary Shares or C Shares during the current period.

Sequoia Economic Infrastructure Income Fund Limited Unaudited Condensed Interim Financial Statements
Page 33
12. Loan Payable On 17 October 2016, the Company executed an 18 month £40 million loan with JP Morgan Chase Bank, London Branch (“JP Morgan Chase”).
The proceeds of the loan have been used in or towards the making of investments in accordance with the Company’s investment policy. Collateral for the loan is provided by a Senior VFN in the sum of £40 million issued by the Subsidiary to the Company. Should the value of the underlying assets held in the Subsidiary fall below a certain level, further margin calls may be made by JP Morgan Chase, however no margin calls have been made during the period. Interest on the loan is charged at a rate of LIBOR plus 2.5% per annum. Loan interest of £596,204 (30 September 2016: £nil) has been incurred on the loan during the period. No upfront fees or commitment fees were payable on the loan, however a fee is payable upon early prepayment. On 6 December 2017, the Company refinanced this loan, replacing it with a flexible, multi-currency revolving credit facility in the sum of £100 million with a consortium of three banks led by Royal Bank of Scotland International Limited.
13. Subsequent Events On 18 October 2017, the Company issued 275,886 Ordinary Shares of no par value to the Investment Adviser, in relation to fees payable for
the period ended 30 September 2017.
On 18 October 2017, the Company declared a dividend of 1.5p per Ordinary Share. The dividend was paid on 24 November 2017.
On 6 December 2017, the Company refinanced its loan with JP Morgan Chase Bank, replacing it with a flexible, multi-currency revolving credit facility in the sum of £100 million with a consortium of three banks led by Royal Bank of Scotland International Limited.
There have been no other significant events since the period end which would require revision of the figures or disclosures in these Financial Statements.
Page 33
Sequoia Economic Infrastructure Income Fund Limited Unaudited Condensed Interim Financial Statements
Notes to the Unaudited Condensed Interim Financial Statements (continued)For the period from 1 April 2017 to 30 September 2017

Sequoia Economic Infrastructure Income Fund Limited Unaudited Condensed Interim Financial Statements
Page 34
Officers and Advisers
Directors Robert Jennings, CBE (Independent Non-executive Chairman)Jan Pethick (Independent Non-executive Director)Jon Bridel (Independent Non-executive Director)Sandra Platts (Independent Non-executive Director)
Investment AdviserSequoia Investment Management Company Limited11-13 Market PlaceLondon W1W 8AH
Investment ManagerInternational Fund Management LimitedSarnia HouseLe TruchotSt Peter PortGuernsey GY1 1GR
Administrator and SecretaryPraxis Fund Services LimitedSarnia HouseLe TruchotSt Peter PortGuernsey GY1 1GR
Subsidiary AdministratorTMF Luxembourg S.A.46A, Avenue JF KennedyL-1855 Luxembourg
Valuation AgentPricewaterhouseCoopers LLP (appointed 18 April 2017)7 More London RiversideLondon SE1 2RT
Mazars LLP (resigned 18 April 2017)Tower Bridge HouseSt Katharine’s WayLondon E1W 1DD
Cash Portfolio ManagerPraxisIFM Treasury Services LimitedSarnia HouseLe TruchotSt Peter PortGuernsey GY1 1GR
Registered OfficeSarnia HouseLe TruchotSt Peter PortGuernsey GY1 1GR
Independent AuditorKPMG Channel Islands LimitedGlategny CourtGlategny EsplanadeSt Peter PortGuernsey GY1 1WR
BrokerStifel Nicolaus Europe Limited150 CheapsideLondon EC2V 6ET
DepositaryBank of New York Mellon SA/NVNiederlassung Frankfurt am MainFriedrich-Ebert-Anlage 4960327 Frankfurt am MainGermany
CustodianBank of New York Mellon1 Canada SquareLondon E14 5AL
RegistrarComputershare Investor Services (Guernsey) Limited1st Floor Tudor HouseLe BordageSt Peter PortGuernsey GY1 1DB
Legal Adviser (as to Guernsey Law)Mourant Ozannes1 Le Marchant StreetSt Peter PortGuernsey GY1 4HP
Legal Adviser (as to UK Law) Jones Day21 Tudor StreetLondon EC4Y 0DJ