unaudited interim condensed consolidated financial ... · unaudited interim condensed consolidated...
TRANSCRIPT
UNAUDITED INTERIM CONDENSED CONSOLIDATED FINANCIAL STATEMENTS
FOR THE THREE AND NINE MONTHS ENDED SEPTEMBER 30, 2017
November 9, 2017

TABLE OF CONTENTS
CONSOLIDATED FINANCIAL STATEMENTS 2
Unaudited Interim Condensed Consolidated Statements of Earnings 2
Unaudited Interim Condensed Consolidated Statements of Comprehensive Income 3
Unaudited Interim Condensed Consolidated Statements of Financial Position 4
Unaudited Interim Condensed Consolidated Statements of Changes in Equity 5
Unaudited Interim Condensed Consolidated Statements of Cash Flows 6
NOTES TO THE UNAUDITED INTERIM CONDENSED CONSOLIDATED FINANCIAL STATEMENTS 7
1. Nature of business 7
2. Summary of significant accounting policies 7
3. Recent accounting pronouncements 8
4. Segmented information 9
5. Expenses classified by nature 13
6. Earnings per share 14
7. Current investments 14
8. Assets held for sale 14
9. Long-term debt 15
10. Derivatives 17
11. Provisions 19
12. Share capital 20
13. Reserves 21
14. Fair value 21
15. Contingent liabilities 24
UNAUDITED INTERIM CONDENSED CONSOLIDATED FINANCIAL STATEMENTS
UNAUDITED INTERIM CONDENSED CONSOLIDATED STATEMENTS OF EARNINGS
Three Months EndedSeptember 30,
Nine Months Ended September 30,
U.S. dollars Note
2017$000’s
(except per shareamounts)
2016$000’s
(except pershare
amounts)(As reclassified
*)
2017$000’s
(except per shareamounts)
2016$000’s
(except pershare
amounts)(As reclassified
*)
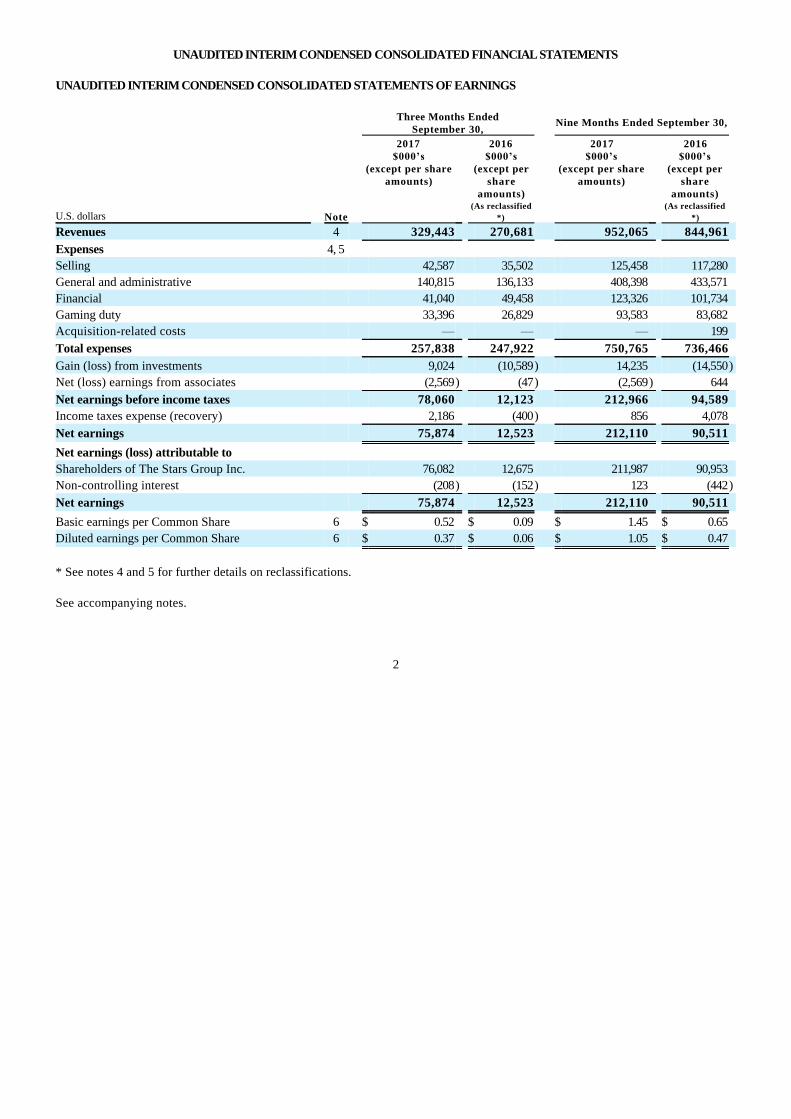
Revenues 4 329,443 270,681 952,065 844,961
Expenses 4, 5
Selling 42,587 35,502 125,458 117,280
General and administrative 140,815 136,133 408,398 433,571
Financial 41,040 49,458 123,326 101,734
Gaming duty 33,396 26,829 93,583 83,682
Acquisition-related costs — — — 199
Total expenses 257,838 247,922 750,765 736,466
Gain (loss) from investments 9,024 (10,589) 14,235 (14,550)
Net (loss) earnings from associates (2,569) (47) (2,569) 644
Net earnings before income taxes 78,060 12,123 212,966 94,589
Income taxes expense (recovery) 2,186 (400) 856 4,078
Net earnings 75,874 12,523 212,110 90,511
Net earnings (loss) attributable to
Shareholders of The Stars Group Inc. 76,082 12,675 211,987 90,953
Non-controlling interest (208) (152) 123 (442)
Net earnings 75,874 12,523 212,110 90,511
Basic earnings per Common Share 6 $ 0.52 $ 0.09 $ 1.45 $ 0.65
Diluted earnings per Common Share 6 $ 0.37 $ 0.06 $ 1.05 $ 0.47
* See notes 4 and 5 for further details on reclassifications.
See accompanying notes.
2
UNAUDITED INTERIM CONDENSED CONSOLIDATED STATEMENTS OF COMPREHENSIVE INCOME (LOSS)
Three Months EndedSeptember 30,
Nine Months EndedSeptember 30,
2017 2016 2017 2016
U.S. dollars $000’s $000’s $000’s $000’s
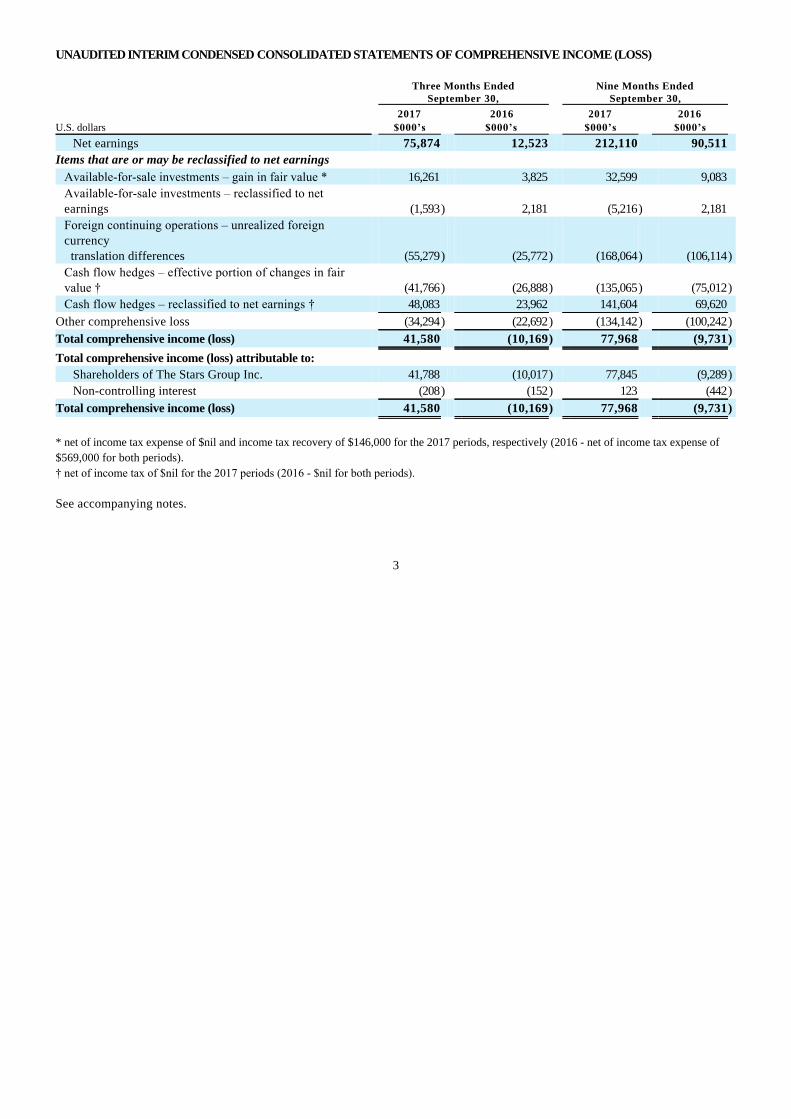
Net earnings 75,874 12,523 212,110 90,511
Items that are or may be reclassified to net earnings
Available-for-sale investments – gain in fair value * 16,261 3,825 32,599 9,083
Available-for-sale investments – reclassified to netearnings (1,593) 2,181 (5,216) 2,181
Foreign continuing operations – unrealized foreigncurrency translation differences (55,279) (25,772) (168,064) (106,114)
Cash flow hedges – effective portion of changes in fairvalue † (41,766) (26,888) (135,065) (75,012)
Cash flow hedges – reclassified to net earnings † 48,083 23,962 141,604 69,620
Other comprehensive loss (34,294) (22,692) (134,142) (100,242)
Total comprehensive income (loss) 41,580 (10,169) 77,968 (9,731)
Total comprehensive income (loss) attributable to:
Shareholders of The Stars Group Inc. 41,788 (10,017) 77,845 (9,289)
Non-controlling interest (208) (152) 123 (442)
Total comprehensive income (loss) 41,580 (10,169) 77,968 (9,731)
* net of income tax expense of $nil and income tax recovery of $146,000 for the 2017 periods, respectively (2016 - net of income tax expense of
$569,000 for both periods).
† net of income tax of $nil for the 2017 periods (2016 - $nil for both periods).
See accompanying notes.
3

UNAUDITED INTERIM CONDENSED CONSOLIDATED STATEMENTS OF FINANCIAL POSITION
As at September 30, As at December 31,
2017 2016
U.S. dollars Note $000’s $000’s
ASSETS
Current assets
Cash and cash equivalents - operational 109,578 129,459
Cash and cash equivalents - customer deposits 117,612 138,225
Total cash and cash equivalents 227,190 267,684
Restricted cash advances and collateral 7,067 5,767
Current investments 7 88,641 59,977
Current investments - customer deposits 234,900 228,510
Total current investments 323,541 288,487
Accounts receivable 79,403 81,557
Inventories 447 515
Prepaid expenses and deposits 36,552 22,567
Assets held for sale 8 — 6,972
Income tax receivable 19,001 16,838
Derivatives 10 961 —
Total current assets 694,162 690,387
Non-current assets
Restricted cash advances and collateral 45,742 45,728
Prepaid expenses and deposits 20,183 20,798
Long-term accounts receivable 11,581 9,458
Long-term investments 6,973 6,921
Promissory note — 4,827
Property and equipment 41,383 40,800
Investment tax credits receivable 2,897 1,892
Income tax receivable 20,890 —
Deferred income taxes 3,418 1,054
Derivatives 10 — 52,038
Goodwill and intangible assets 4,506,156 4,588,572
Total non-current assets 4,659,223 4,772,088
Total assets 5,353,385 5,462,475
LIABILITIES
Current liabilities
Accounts payable and accrued liabilities 127,337 135,777
Other payables 45,067 56,588
Provisions 11 21,512 212,780
Customer deposits 352,512 366,735
Income tax payable 15,966 23,616
Current maturity of long-term debt 9 5,420 47,750
Derivatives 10 — 4,922
Total current liabilities 567,814 848,168
Non-current liabilities
Long-term debt 9 2,347,564 2,380,829
Provisions 11 3,091 8,942
Derivatives 10 95,630 5,594
Income taxes payable 25,232 —
Deferred income taxes 16,882 17,214
Total non-current liabilities 2,488,399 2,412,579
Total liabilities 3,056,213 3,260,747
EQUITY
Share capital 12 1,875,428 1,862,789
Reserves 13 (92,632) 35,847
Retained earnings 514,275 302,288
Equity attributable to the owners of The Stars Group Inc. 2,297,071 2,200,924
Non-controlling interest 101 804
Total equity 2,297,172 2,201,728
Total liabilities and equity 5,353,385 5,462,475
See accompanying notes.

Approved and authorized for issue on behalf of the Board on November 9, 2017.(Signed) “Divyesh (Dave) Gadhia”, DirectorDivyesh (Dave) Gadhia, Chairman of the Board
(Signed) “David Lazzarato”, DirectorDavid Lazzarato, Chairman of the Audit Committee
4

UNAUDITED INTERIM CONDENSED CONSOLIDATED STATEMENTS OF CHANGES IN EQUITY
For the nine months ended September 30, 2017 and 2016:
Share Capital
U.S. dollars
CommonShares
Number
ConvertiblePreferred
SharesNumber
CommonSharesamount$000’s
ConvertiblePreferredSharesamount$000’s
Reserves(note 13)$000’s
RetainedEarnings$000’s
Equityattributable
to theowners ofThe Stars
Group Inc.$000's
Non-controlling
interest$000’s
Total equity$000’s
Balance – January 1,2016 133,426,193 1,139,249 887,014 684,386 280,964 166,144 2,018,508 1,398 2,019,906
Net earnings (loss) — — — — — 90,953 90,953 (442) 90,511
Other comprehensive loss — — — — (100,242) — (100,242) — (100,242)
Total comprehensive
(loss) income — — — — (100,242) 90,953 (9,289) (442) (9,731)
Issue of Common Shares
in
relation to exercised
warrants 11,266,575 — 290,175 — (288,981) — 1,194 — 1,194
Issue of Common Shares
in relation
to exercised employee
stock options 267,909 — 854 — (209) — 645 — 645
Stock-based compensation — — — — 8,396 — 8,396 — 8,396
Balance – September30, 2016 144,960,677 1,139,249 1,178,043 684,386 (100,072) 257,097 2,019,454 956 2,020,410
Balance – January 1,2017 145,101,127 1,139,249 1,178,404 684,385 35,847 302,288 2,200,924 804 2,201,728
Net earnings — — — — — 211,987 211,987 123 212,110
Other comprehensive loss — — — — (134,142) — (134,142) — (134,142)
Total comprehensive
(loss) income — — — — (134,142) 211,987 77,845 123 77,968
Issue of Common Shares
in relation
to Equity awards 2,426,150 — 13,132 — (3,211) — 9,921 — 9,921
Share cancellation (76,437) — (493) — 493 — — — —
Stock-based compensation — — — — 7,914 — 7,914 — 7,914
Acquisition of non-
controlling interest
(Note 10) — — — — 467 — 467 (826) (359)
Balance –September 30, 2017 147,450,840 1,139,249 1,191,043 684,385 (92,632) 514,275 2,297,071 101 2,297,172
See accompanying notes.
5

UNAUDITED INTERIM CONDENSED CONSOLIDATED STATEMENTS OF CASH FLOWS
Nine Months Ended September 30,
2017 2016
U.S. dollars $000’s $000’s
Operating activities
Net earnings 212,110 90,511
Dormant accounts recognized as revenue (2,670) (3,160)
Stock-based compensation 7,914 8,396
Interest accretion 28,072 26,574
Interest expense 90,752 99,085
Income tax expense recognized in net earnings 856 4,078
Depreciation of property and equipment 6,555 6,109
Amortization of intangible assets 95,838 93,573
Amortization of deferred development costs 6,573 3,346
Unrealized gain on foreign exchange (9,891) (21,103)
Unrealized (gain) loss on investments (9,332) 7,233
(Reversal of) Impairment of assets held for sale, associates and intangible assets (8,430) 7,285
Net loss (earnings) from associates 2,569 (644)
Gain on settlement of deferred consideration (44) —
Realized gain on investments (9,155) (634)
Income taxes paid (8,941) (9,164)
Changes in non-cash operating elements of working capital (10,284) (33,924)
Customer deposit liability movement (22,398) (76,481)
Other 749 561
Net cash inflows from operating activities 370,843 201,641
Financing activities
Issuance of capital stock in relation with exercised warrants — 1,194
Issuance of capital stock in relation with exercised employee stock options 9,921 645
Interest paid (95,620) (99,938)
Settlement of margin (7,602) —
Gain on settlement of derivative 13,904 —
Transaction costs on repricing of long-term debt (4,719) —
Payment of deferred consideration (197,510) —
Repayment of long-term debt (133,901) (40,455)
Net cash outflows from financing activities (415,527) (138,554)
Investing activities
Additions in deferred development costs (16,701) (14,916)
Purchase of property and equipment (5,507) (5,265)
Acquired intangible assets (1,484) (6,623)
Sale (purchase) of investments 1,236 (6,631)
Cash movement into restricted cash advances and collateral (527) (80,231)
Settlement of minimum revenue guarantee (7,286) (14,230)
Settlement of promissory note 8,084 —
Net sale of investments utilizing customer deposits 4,466 14,623
Acquisition of further interests in subsidiary (6,516) (5,297)
Investment in associate (2,000) —
Proceeds on disposal of interest in associate classified as held for sale 16,127 —
Net cash outflows from investing activities (10,108) (118,570)
Decrease in cash and cash equivalents (54,792) (55,483)
Cash and cash equivalents – beginning of period 267,684 274,359
Unrealized foreign exchange difference on cash and cash equivalents 14,298 4,030
Cash and cash equivalents - end of period 227,190 222,906
See accompanying notes.
6

NOTES TO THE UNAUDITED INTERIM CONDENSED CONSOLIDATED FINANCIAL STATEMENTS
1. NATURE OF BUSINESS
The Stars Group Inc. (“The Stars Group” or the “Corporation”), is a leading provider of technology-based products and services inthe global gaming and interactive entertainment industries. As at September 30, 2017, The Stars Group had two major lines ofoperations within its gaming business, real-money online poker (“Poker”) and real-money online casino and sportsbook (“Casino &Sportsbook”). As it relates to these two business lines, online revenues include revenues generated through the Corporation’s real-money online, mobile and desktop client platforms.
Through Stars Interactive Holdings (IOM) Limited and its subsidiaries and affiliates (collectively, “Stars Interactive Group”), TheStars Group’s gaming business operates globally and conducts its principal activities from its headquarters in the Isle of Man.Through its Stars Interactive division, the Corporation ultimately owns and operates gaming and related interactive entertainmentbusinesses, which it offers under several owned brands including, among others, PokerStars, PokerStars Casino, BetStars, FullTilt, StarsDraft, and the PokerStars Championship, PokerStars Festival and PokerStars Megastack live poker tour brands(incorporating aspects of the European Poker Tour, PokerStars Caribbean Adventure, Latin American Poker Tour and Asia PacificPoker Tour).
The Stars Group’s registered head office is located at 200 Bay Street, South Tower, Suite 3250, Toronto, Ontario, Canada, M5J 2J3 andits common shares (“Common Shares”) are listed on the Toronto Stock Exchange (the “TSX”) under the symbol “TSGI” and theNasdaq Global Select Market under the symbol “TSG”.
2. SUMMARY OF SIGNIFICANT ACCOUNTING POLICIES
Basis of accounting
These unaudited interim condensed consolidated financial statements have been prepared in accordance with InternationalAccounting Standard 34—Interim Financial Reporting as issued by the International Accounting Standards Board, and do notinclude all of the information required for full annual consolidated financial statements. The accounting policies and methods ofcomputation applied in these unaudited interim condensed consolidated financial statements and related notes contained therein areconsistent with those applied by the Corporation in its audited consolidated financial statements as at and for the year endedDecember 31, 2016 (the “2016 Financial Statements”). These unaudited interim condensed consolidated financial statements shouldbe read in conjunction with the 2016 Financial Statements.
For reporting purposes, the Corporation prepares its financial statements in U.S. dollars. Unless otherwise indicated, all dollar (“$”)amounts and references to “USD” or “USD $” in these unaudited interim condensed consolidated financial statements are expressedin U.S. dollars. References to ‘‘EUR’’ or “€” are to European Euros, references to ‘‘CDN’’ or “CDN $” are to Canadian dollars andreferences to “GBP” are to Great British Pounds Sterling. Unless otherwise indicated, all references to a specific “note” refer to thesenotes to the unaudited interim condensed consolidated financial statements of the Corporation for the three and nine months endedSeptember 30, 2017. References to “IFRS” and “IASB” are to International Financial Reporting Standards and the InternationalAccounting Standards Board, respectively.
New significant accounting policies
Debt modification
From time to time, the Corporation pursues amendments to its credit agreements based on prevailing market conditions. Suchamendments, when completed, are considered by the Corporation to be debt modifications. The accounting treatment of a debtmodification depends on whether the modified terms are substantially different than the previous terms. Terms of an amended debtagreement are considered to be substantially different when the discounted present value of the cash flows under the new termsdiscounted using the original effective interest rate, is at least ten percent different from the discounted present value of theremaining cash flows of the original debt. If the modification is not substantially different, it will be considered as a modification withany costs or fees incurred adjusting the carrying amount of the liability and amortized over the remaining term of the liability. If themodification is substantially different then the transaction is accounted for as an extinguishment of the old debt instrument with anadjustment to the carrying amount of the liability being recorded in the unaudited interim condensed statement of earningsimmediately.
Cash flow hedges
Hedge accounting is discontinued on a prospective basis when the hedge no longer meets the hedge accounting criteria (includingwhen it becomes ineffective), when the hedge instrument is sold, terminated or exercised and when, for cash flow hedges, thedesignation is revoked and the forecast transaction is no longer expected to occur. The cumulative gain or loss deferred in theunaudited interim condensed statement of Other comprehensive income should be classified to the unaudited interim condensedstatement of earnings in the same period during which the hedged forecast cash flows affect net earnings. Where the forecast
7
transaction is no longer expected to occur, the cumulative gain or loss deferred in Other comprehensive income is transferredimmediately to net earnings.
3. RECENT ACCOUNTING PRONOUNCEMENTS New Accounting Pronouncements – Not Yet Effective
IFRS 9, Financial Instruments
The IASB issued IFRS 9 relating to the classification and measurement of financial instruments. IFRS 9 uses a single approach todetermine whether a financial asset is measured at amortized cost or fair value, and this approach replaces the previous requirementsof IAS 39. The approach in IFRS 9 is based on how an entity manages its financial assets (i.e., its business model) and thecontractual cash flow characteristics of those financial assets. IFRS 9 also amends the impairment criteria by introducing a newexpected credit losses model for calculating impairment on financial assets and commitments to extend credit. Further, IFRS 9includes new hedge accounting requirements that align hedge accounting more closely with risk management. These newrequirements do not fundamentally change the types of hedging relationships or the requirement to measure and recognizeineffectiveness but do allow more hedging strategies that are used for risk management to qualify for hedge accounting and for morejudgment by management in assessing the effectiveness of those hedging relationships. Extended disclosures in respect of riskmanagement activity for those choosing to apply the new hedge accounting requirements will also be required under the newstandard.
The Corporation intends to adopt IFRS 9 from its effective date of January 1, 2018 but is still finalizing its analysis of the expectedimpact on its consolidated financial statements, disclosures and related controls, specifically as applied to the classification andmeasurement of its currently designated available-for-sale investments, as well as the expected impact of adopting or delaying theadoption to a later date of the new hedge accounting requirements. Notwithstanding, the Corporation does not currently expect anysuch adoption to have a material impact on its future consolidated financial statements.
IFRS 15, Revenues from Contracts with Customers
The Financial Accounting Standards Board and IASB have issued converged standards in respect of revenue recognition. IFRS 15affects any entity entering into contracts with customers, unless those contracts fall within the scope of other standards such asinsurance contracts, financial instruments or lease contracts. IFRS 15 supersedes the revenue recognition requirements in IAS 18,Revenue, IFRIC 13, Customer Loyalty Programmes, and the majority of other industry-specific guidance.
The standard contains a single model that applies to contracts with customers and two approaches to recognizing revenue: at apoint in time or over time. The model features a contract-based five-step analysis of transactions to determine whether, how muchand when revenue is recognized. New estimates and judgmental thresholds have been introduced, which may affect the amount ortiming of revenue recognized.
The Corporation intends to adopt IFRS 15 from its effective date of January 1, 2018 but is still finalizing its analysis of the expectedimpact on its consolidated financial statements, disclosures and related controls. The Corporation does not currently expect suchadoption to have a material impact on its future consolidated financial statements.
IFRS 16, Leases
The IASB recently issued IFRS 16 to replace IAS 17 “Leases”. This standard introduces a single lessee accounting model andrequires a lessee to recognize assets and liabilities for all leases with a term of more than 12 months, unless the underlying asset is oflow value. A lessee is required to recognize a right-of-use asset representing its right to use the underlying asset and a lease liabilityrepresenting its obligation to make lease payments.
This standard substantially carries forward the lessor accounting requirements of IAS 17, while requiring enhanced disclosures to beprovided by lessors.
The Corporation intends to adopt IFRS 16 from its effective date of January 1, 2019. The Corporation is currently evaluating theimpact of this standard, and does not anticipate applying it prior to its effective date.
8
4. SEGMENTED INFORMATION
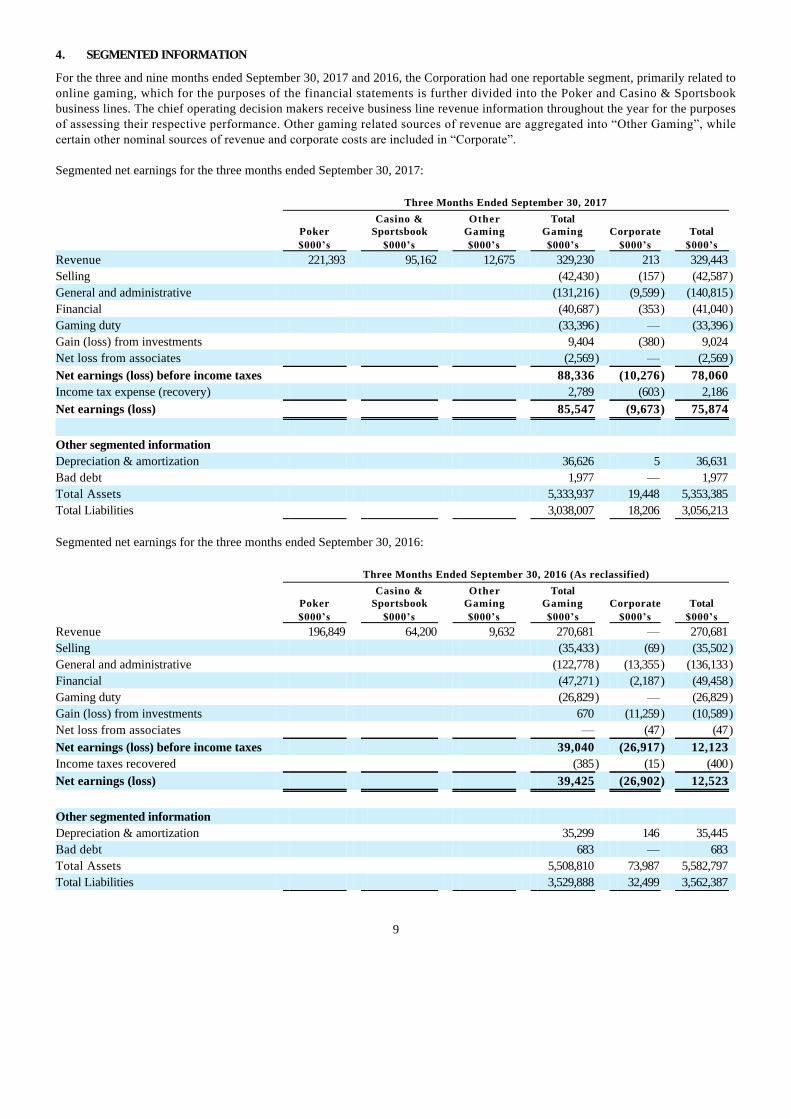
For the three and nine months ended September 30, 2017 and 2016, the Corporation had one reportable segment, primarily related toonline gaming, which for the purposes of the financial statements is further divided into the Poker and Casino & Sportsbookbusiness lines. The chief operating decision makers receive business line revenue information throughout the year for the purposesof assessing their respective performance. Other gaming related sources of revenue are aggregated into “Other Gaming”, whilecertain other nominal sources of revenue and corporate costs are included in “Corporate”.
Segmented net earnings for the three months ended September 30, 2017:
Three Months Ended September 30, 2017
Poker Casino &
Sportsbook Other
Gaming Total
Gaming Corporate Total
$000’s $000’s $000’s $000’s $000’s $000’s
Revenue 221,393 95,162 12,675 329,230 213 329,443
Selling (42,430) (157) (42,587)
General and administrative (131,216) (9,599) (140,815)
Financial (40,687) (353) (41,040)
Gaming duty (33,396) — (33,396)
Gain (loss) from investments 9,404 (380) 9,024
Net loss from associates (2,569) — (2,569)
Net earnings (loss) before income taxes 88,336 (10,276) 78,060
Income tax expense (recovery) 2,789 (603) 2,186
Net earnings (loss) 85,547 (9,673) 75,874
Other segmented information
Depreciation & amortization 36,626 5 36,631
Bad debt 1,977 — 1,977
Total Assets 5,333,937 19,448 5,353,385
Total Liabilities 3,038,007 18,206 3,056,213
Segmented net earnings for the three months ended September 30, 2016:
Three Months Ended September 30, 2016 (As reclassified)
Poker Casino &
Sportsbook Other
Gaming Total
Gaming Corporate Total
$000’s $000’s $000’s $000’s $000’s $000’s
Revenue 196,849 64,200 9,632 270,681 — 270,681
Selling (35,433) (69) (35,502)
General and administrative (122,778) (13,355) (136,133)
Financial (47,271) (2,187) (49,458)
Gaming duty (26,829) — (26,829)
Gain (loss) from investments 670 (11,259) (10,589)
Net loss from associates — (47) (47)
Net earnings (loss) before income taxes 39,040 (26,917) 12,123
Income taxes recovered (385) (15) (400)
Net earnings (loss) 39,425 (26,902) 12,523
Other segmented information
Depreciation & amortization 35,299 146 35,445
Bad debt 683 — 683
Total Assets 5,508,810 73,987 5,582,797
Total Liabilities 3,529,888 32,499 3,562,387
9
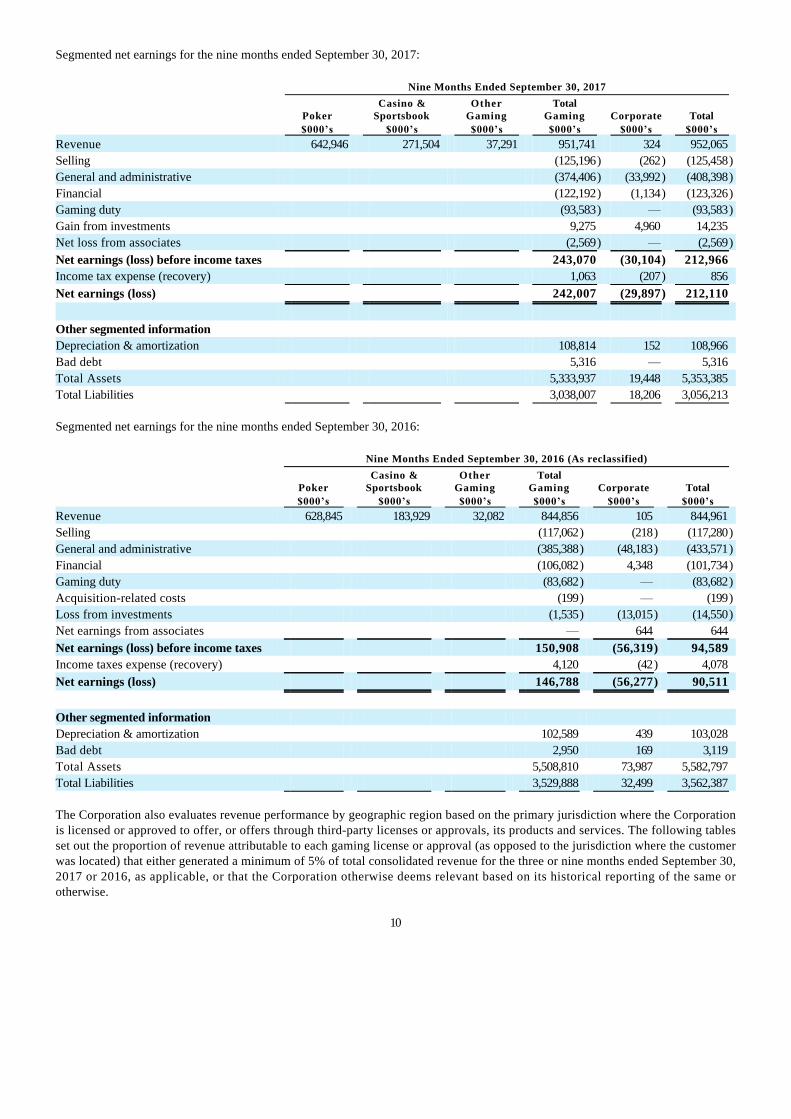
Segmented net earnings for the nine months ended September 30, 2017:
Nine Months Ended September 30, 2017
Poker Casino &
Sportsbook Other
Gaming Total
Gaming Corporate Total
$000’s $000’s $000’s $000’s $000’s $000’s
Revenue 642,946 271,504 37,291 951,741 324 952,065
Selling (125,196) (262) (125,458)
General and administrative (374,406) (33,992) (408,398)
Financial (122,192) (1,134) (123,326)
Gaming duty (93,583) — (93,583)
Gain from investments 9,275 4,960 14,235
Net loss from associates (2,569) — (2,569)
Net earnings (loss) before income taxes 243,070 (30,104) 212,966
Income tax expense (recovery) 1,063 (207) 856
Net earnings (loss) 242,007 (29,897) 212,110
Other segmented information
Depreciation & amortization 108,814 152 108,966
Bad debt 5,316 — 5,316
Total Assets 5,333,937 19,448 5,353,385
Total Liabilities 3,038,007 18,206 3,056,213
Segmented net earnings for the nine months ended September 30, 2016:
Nine Months Ended September 30, 2016 (As reclassified)
Poker Casino &
Sportsbook Other
Gaming Total
Gaming Corporate Total
$000’s $000’s $000’s $000’s $000’s $000’s
Revenue 628,845 183,929 32,082 844,856 105 844,961
Selling (117,062) (218) (117,280)
General and administrative (385,388) (48,183) (433,571)
Financial (106,082) 4,348 (101,734)
Gaming duty (83,682) — (83,682)
Acquisition-related costs (199) — (199)
Loss from investments (1,535) (13,015) (14,550)
Net earnings from associates — 644 644
Net earnings (loss) before income taxes 150,908 (56,319) 94,589
Income taxes expense (recovery) 4,120 (42) 4,078
Net earnings (loss) 146,788 (56,277) 90,511
Other segmented information
Depreciation & amortization 102,589 439 103,028
Bad debt 2,950 169 3,119
Total Assets 5,508,810 73,987 5,582,797
Total Liabilities 3,529,888 32,499 3,562,387
The Corporation also evaluates revenue performance by geographic region based on the primary jurisdiction where the Corporationis licensed or approved to offer, or offers through third-party licenses or approvals, its products and services. The following tablesset out the proportion of revenue attributable to each gaming license or approval (as opposed to the jurisdiction where the customerwas located) that either generated a minimum of 5% of total consolidated revenue for the three or nine months ended September 30,2017 or 2016, as applicable, or that the Corporation otherwise deems relevant based on its historical reporting of the same orotherwise.
10
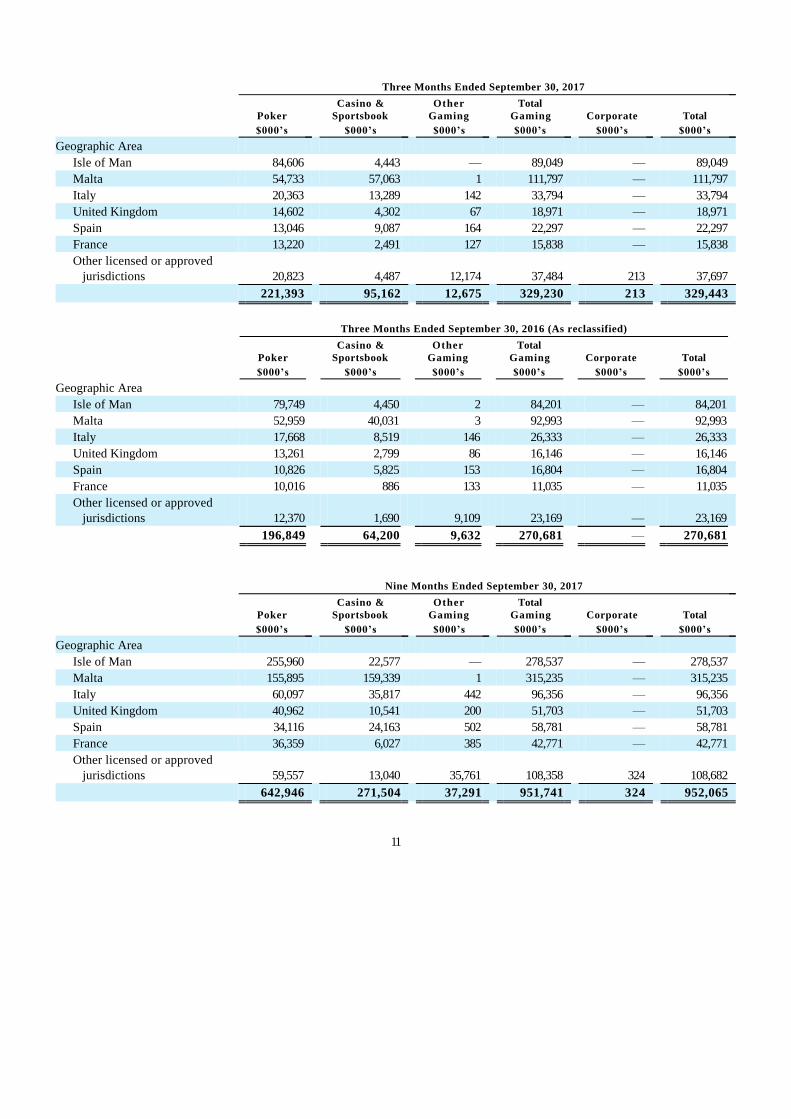
Three Months Ended September 30, 2017
Poker
Casino &Sportsbook
OtherGaming
TotalGaming Corporate Total
$000’s $000’s $000’s $000’s $000’s $000’s
Geographic Area
Isle of Man 84,606 4,443 — 89,049 — 89,049
Malta 54,733 57,063 1 111,797 — 111,797
Italy 20,363 13,289 142 33,794 — 33,794
United Kingdom 14,602 4,302 67 18,971 — 18,971
Spain 13,046 9,087 164 22,297 — 22,297
France 13,220 2,491 127 15,838 — 15,838
Other licensed or approved jurisdictions 20,823 4,487 12,174 37,484 213 37,697
221,393 95,162 12,675 329,230 213 329,443
Three Months Ended September 30, 2016 (As reclassified)
Poker
Casino &Sportsbook
OtherGaming
TotalGaming Corporate Total
$000’s $000’s $000’s $000’s $000’s $000’s
Geographic Area
Isle of Man 79,749 4,450 2 84,201 — 84,201
Malta 52,959 40,031 3 92,993 — 92,993
Italy 17,668 8,519 146 26,333 — 26,333
United Kingdom 13,261 2,799 86 16,146 — 16,146
Spain 10,826 5,825 153 16,804 — 16,804
France 10,016 886 133 11,035 — 11,035
Other licensed or approved jurisdictions 12,370 1,690 9,109 23,169 — 23,169
196,849 64,200 9,632 270,681 — 270,681
Nine Months Ended September 30, 2017
Poker
Casino &Sportsbook
OtherGaming
TotalGaming Corporate Total
$000’s $000’s $000’s $000’s $000’s $000’s
Geographic Area
Isle of Man 255,960 22,577 — 278,537 — 278,537
Malta 155,895 159,339 1 315,235 — 315,235
Italy 60,097 35,817 442 96,356 — 96,356
United Kingdom 40,962 10,541 200 51,703 — 51,703
Spain 34,116 24,163 502 58,781 — 58,781
France 36,359 6,027 385 42,771 — 42,771
Other licensed or approved jurisdictions 59,557 13,040 35,761 108,358 324 108,682
642,946 271,504 37,291 951,741 324 952,065
11

Nine Months Ended September 30, 2016 (As reclassified)
Poker
Casino &Sportsbook
OtherGaming
TotalGaming Corporate Total
$000’s $000’s $000’s $000’s $000’s $000’s
Geographic Area
Isle of Man 251,190 10,666 2 261,858 — 261,858
Malta 173,247 119,931 3 293,181 — 293,181
Italy 57,699 21,346 447 79,492 — 79,492
United Kingdom 43,319 9,932 283 53,534 — 53,534
Spain 30,456 17,453 468 48,377 — 48,377
France 38,182 1,212 413 39,807 — 39,807
Other licensed or approved jurisdictions 34,752 3,389 30,466 68,607 105 68,712
628,845 183,929 32,082 844,856 105 844,961
The Corporation reclassified interest revenue previously included within “Revenue”, to “Gain from investments” totaling $0.16million and $0.49 million for the three months and nine months ended September 30, 2016, respectively. The Corporation hasdetermined that the impact of these corrections is immaterial. The Corporation’s effective corporate income tax rate for the three and nine months ended September 30, 2017, excluding prior yearadjustments, was 2.8% and 2.6%, respectively, as the Corporation primarily operates from the Isle of Man and Malta, which are lowtax jurisdictions. In addition to corporate income tax, the Corporation also pays significant amounts of gaming duty, VAT andemployment taxes. The distribution of some of the Corporation’s non-current assets (goodwill, intangible assets and property and equipment) bygeographic region is as follows:
As at September 30, As at December 31,
2017 2016
$000’s $000’s
Geographic Area
Canada 48,757 39,993
Isle of Man 4,476,806 4,567,314
Malta — —
Italy 37 47
United Kingdom 7,528 6,380
Other licensed or approved jurisdictions 14,411 15,638
4,547,539 4,629,372
12

5. EXPENSES CLASSIFIED BY NATURE
Three Months EndedSeptember 30,
Nine Months Ended September 30,
2017$000’s
2016$000’s
(Asreclassified)
2017$000’s
2016$000’s
(Asreclassified)
Financial
Interest and bank charges 38,432 43,909 120,999 126,288
Foreign exchange loss (gain) 2,608 5,549 2,327 (24,554)
41,040 49,458 123,326 101,734
General and administrative
Processor costs 17,446 13,826 50,784 40,938
Office 20,631 16,885 57,709 54,423
Salaries and fringe benefits 45,101 43,552 122,719 139,842
Research and development salaries 6,030 6,441 18,513 22,160
Stock-based compensation 3,298 1,978 7,914 8,396
Depreciation of property and equipment 2,178 2,119 6,555 6,109
Amortization of deferred development costs 2,397 1,207 6,573 3,346
Amortization of intangible assets 32,056 32,119 95,838 93,573
Professional fees 10,481 16,550 44,308 53,818
(Reversal of) Impairment of assets held for sale, associatesand intangible assets
(1,118)
527
(8,430)
7,285
Bad debt 1,977 683 5,316 3,119
Loss on disposal of assets 338 246 599 562
140,815 136,133 408,398 433,571
Selling
Marketing 34,754 30,845 103,528 103,247
Royalties 7,833 4,657 21,930 14,033
42,587 35,502 125,458 117,280
Gaming duty 33,396 26,829 93,583 83,682
Acquisition-related costs
Professional fees — — — 199
— — — 199
The Corporation changed the presentation of certain items within its unaudited interim condensed consolidated statement ofearnings for the comparative period to conform to the current year’s presentation. The Corporation reclassified travel andentertainment costs previously included within “Selling” expenses to “Office” expenses. The Corporation has determined that theimpact of this correction is immaterial. The Corporation also segregated Selling expenses into “Marketing” and “Royalties” in orderto provide a better understanding to the readers of the distribution of expenses within Selling expenses. None of thesereclassifications had a net earnings impact on the unaudited interim condensed consolidated statement of earnings. During the nine months ended September 30, 2017, the Corporation received $5.77 million in indemnification proceeds from the sellersof Stars Interactive Group for gaming duty, professional fees and taxes owed for periods prior to the Corporation’s acquisition ofStars Interactive Group on August 1, 2014 (the “Stars Interactive Group Acquisition”). The amounts received from the sellers wereclassified as Gaming duty, Professional fees and Income taxes. In addition, the Corporation received a refund of $2.85 million in taxesand penalties from the Belgian tax authorities, and insurance indemnification proceeds of $2.91 million in respect of Autorité desmarchés financiers (AMF) and other investigation professional fees. The amount received from the Belgian tax authorities wasclassified as Income taxes and the insurance indemnification was classified as Professional fees.
13
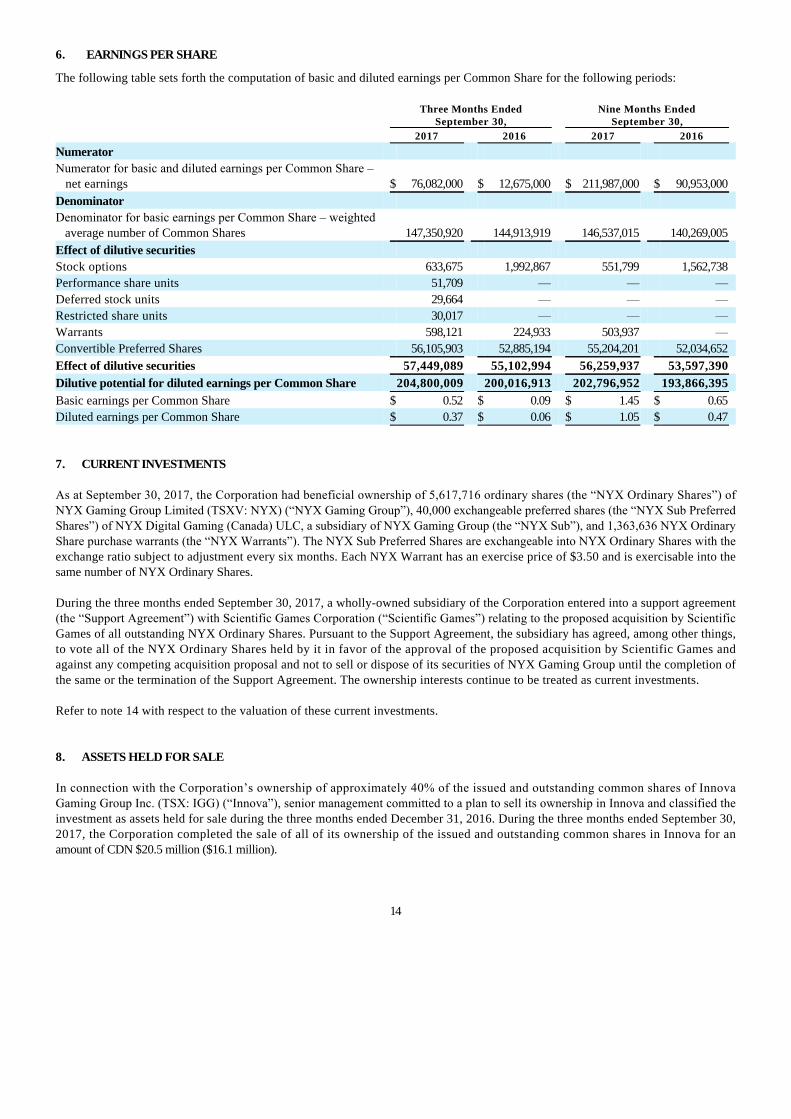
6. EARNINGS PER SHARE
The following table sets forth the computation of basic and diluted earnings per Common Share for the following periods:
Three Months Ended
September 30,
Nine Months Ended
September 30,
2017 2016 2017 2016
Numerator
Numerator for basic and diluted earnings per Common Share – net earnings $ 76,082,000 $ 12,675,000 $ 211,987,000 $ 90,953,000
Denominator
Denominator for basic earnings per Common Share – weighted average number of Common Shares
147,350,920 144,913,919
146,537,015 140,269,005
Effect of dilutive securities
Stock options 633,675 1,992,867 551,799 1,562,738
Performance share units 51,709 — — —
Deferred stock units 29,664 — — —
Restricted share units 30,017 — — —
Warrants 598,121 224,933 503,937 —
Convertible Preferred Shares 56,105,903 52,885,194 55,204,201 52,034,652
Effect of dilutive securities 57,449,089 55,102,994 56,259,937 53,597,390
Dilutive potential for diluted earnings per Common Share 204,800,009 200,016,913 202,796,952 193,866,395
Basic earnings per Common Share $ 0.52 $ 0.09 $ 1.45 $ 0.65
Diluted earnings per Common Share $ 0.37 $ 0.06 $ 1.05 $ 0.47
7. CURRENT INVESTMENTS As at September 30, 2017, the Corporation had beneficial ownership of 5,617,716 ordinary shares (the “NYX Ordinary Shares”) ofNYX Gaming Group Limited (TSXV: NYX) (“NYX Gaming Group”), 40,000 exchangeable preferred shares (the “NYX Sub PreferredShares”) of NYX Digital Gaming (Canada) ULC, a subsidiary of NYX Gaming Group (the “NYX Sub”), and 1,363,636 NYX OrdinaryShare purchase warrants (the “NYX Warrants”). The NYX Sub Preferred Shares are exchangeable into NYX Ordinary Shares with theexchange ratio subject to adjustment every six months. Each NYX Warrant has an exercise price of $3.50 and is exercisable into thesame number of NYX Ordinary Shares. During the three months ended September 30, 2017, a wholly-owned subsidiary of the Corporation entered into a support agreement(the “Support Agreement”) with Scientific Games Corporation (“Scientific Games”) relating to the proposed acquisition by ScientificGames of all outstanding NYX Ordinary Shares. Pursuant to the Support Agreement, the subsidiary has agreed, among other things,to vote all of the NYX Ordinary Shares held by it in favor of the approval of the proposed acquisition by Scientific Games andagainst any competing acquisition proposal and not to sell or dispose of its securities of NYX Gaming Group until the completion ofthe same or the termination of the Support Agreement. The ownership interests continue to be treated as current investments. Refer to note 14 with respect to the valuation of these current investments. 8. ASSETS HELD FOR SALE
In connection with the Corporation’s ownership of approximately 40% of the issued and outstanding common shares of InnovaGaming Group Inc. (TSX: IGG) (“Innova”), senior management committed to a plan to sell its ownership in Innova and classified theinvestment as assets held for sale during the three months ended December 31, 2016. During the three months ended September 30,2017, the Corporation completed the sale of all of its ownership of the issued and outstanding common shares in Innova for anamount of CDN $20.5 million ($16.1 million).
14
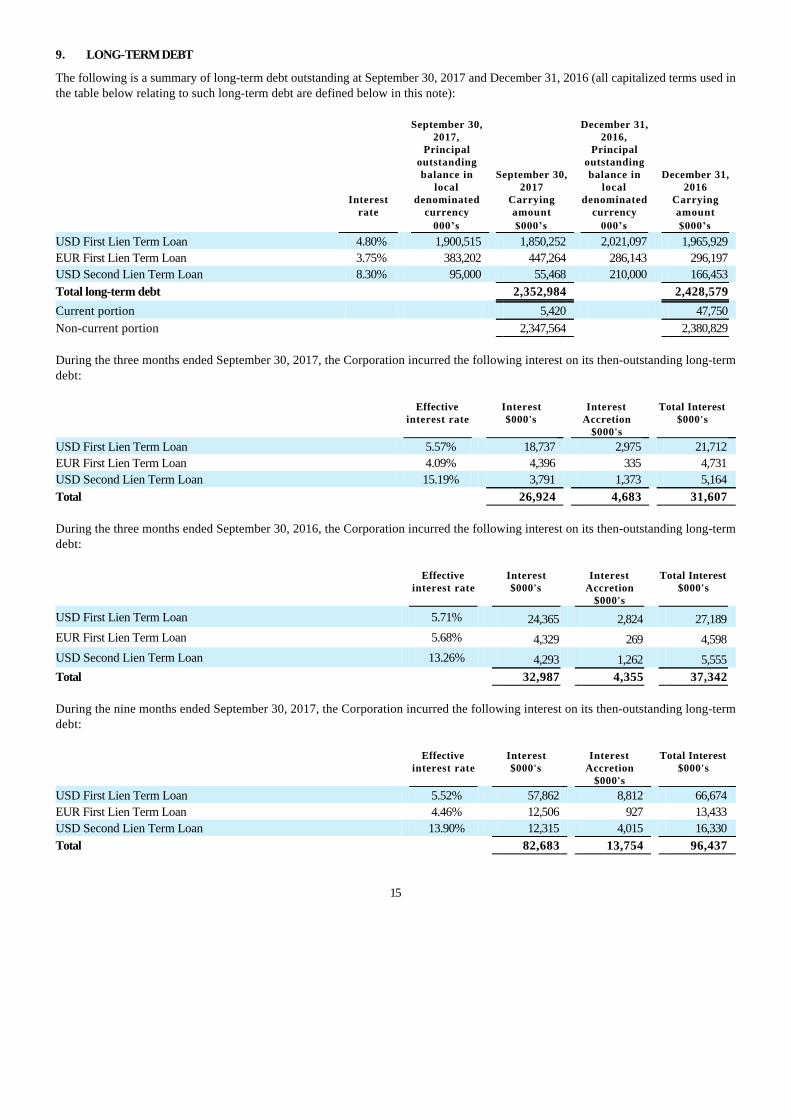
9. LONG-TERM DEBT
The following is a summary of long-term debt outstanding at September 30, 2017 and December 31, 2016 (all capitalized terms used inthe table below relating to such long-term debt are defined below in this note):
Interest
rate
September 30,2017,
Principaloutstandingbalance in
localdenominated
currency
September 30,2017
Carryingamount
December 31,2016,
Principaloutstandingbalance in
localdenominated
currency
December 31,2016
Carryingamount
000’s $000’s 000’s $000’s
USD First Lien Term Loan 4.80% 1,900,515 1,850,252 2,021,097 1,965,929
EUR First Lien Term Loan 3.75% 383,202 447,264 286,143 296,197
USD Second Lien Term Loan 8.30% 95,000 55,468 210,000 166,453
Total long-term debt 2,352,984 2,428,579
Current portion 5,420 47,750
Non-current portion 2,347,564 2,380,829
During the three months ended September 30, 2017, the Corporation incurred the following interest on its then-outstanding long-termdebt:
Effectiveinterest rate
Interest$000's
InterestAccretion
$000's
Total Interest$000's
USD First Lien Term Loan 5.57% 18,737 2,975 21,712
EUR First Lien Term Loan 4.09% 4,396 335 4,731
USD Second Lien Term Loan 15.19% 3,791 1,373 5,164
Total 26,924 4,683 31,607
During the three months ended September 30, 2016, the Corporation incurred the following interest on its then-outstanding long-termdebt:
Effectiveinterest rate
Interest$000's
InterestAccretion
$000's
Total Interest$000's
USD First Lien Term Loan 5.71% 24,365 2,824 27,189
EUR First Lien Term Loan 5.68% 4,329 269 4,598
USD Second Lien Term Loan 13.26% 4,293 1,262 5,555
Total 32,987 4,355 37,342
During the nine months ended September 30, 2017, the Corporation incurred the following interest on its then-outstanding long-termdebt:
Effectiveinterest rate
Interest$000's
InterestAccretion
$000's
Total Interest$000's
USD First Lien Term Loan 5.52% 57,862 8,812 66,674
EUR First Lien Term Loan 4.46% 12,506 927 13,433
USD Second Lien Term Loan 13.90% 12,315 4,015 16,330
Total 82,683 13,754 96,437
15
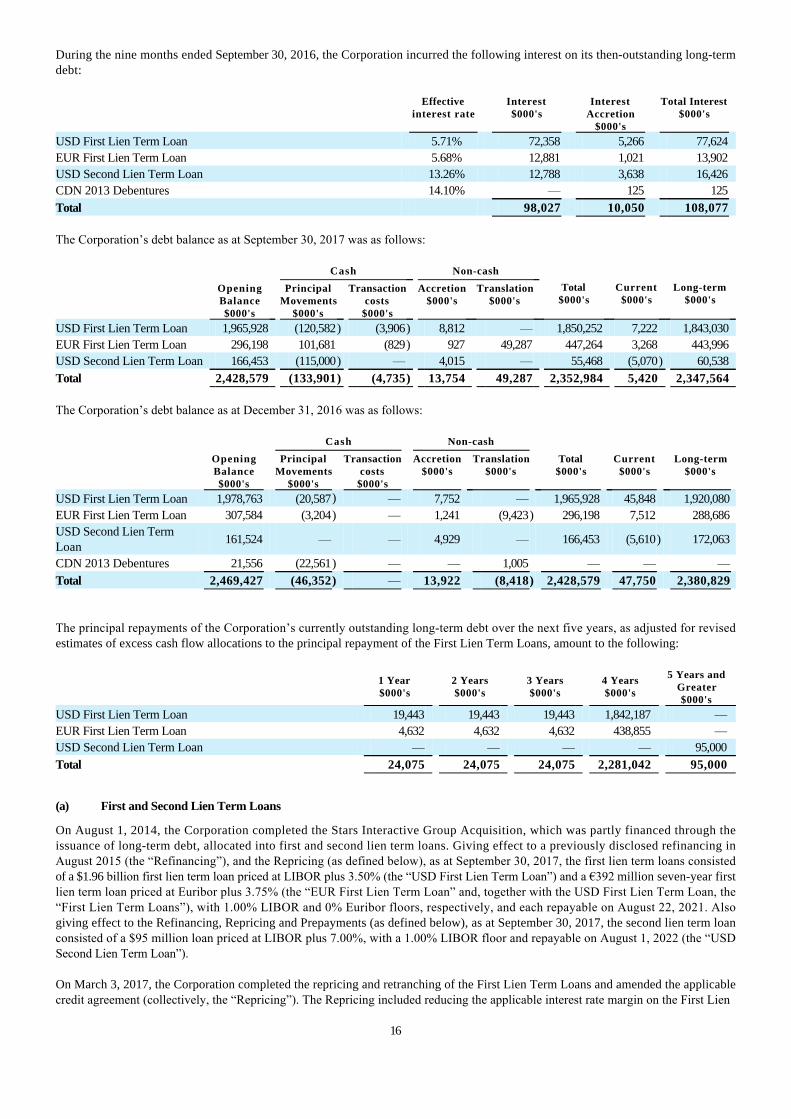
During the nine months ended September 30, 2016, the Corporation incurred the following interest on its then-outstanding long-termdebt:
Effectiveinterest rate
Interest$000's
InterestAccretion
$000's
Total Interest$000's
USD First Lien Term Loan 5.71% 72,358 5,266 77,624
EUR First Lien Term Loan 5.68% 12,881 1,021 13,902
USD Second Lien Term Loan 13.26% 12,788 3,638 16,426
CDN 2013 Debentures 14.10% — 125 125
Total 98,027 10,050 108,077
The Corporation’s debt balance as at September 30, 2017 was as follows:
Cash Non-cash
OpeningBalance$000's
PrincipalMovements
$000's
Transactioncosts
$000's
Accretion$000's
Translation$000's
Total$000's
Current$000's
Long-term$000's
USD First Lien Term Loan 1,965,928 (120,582) (3,906) 8,812 — 1,850,252 7,222 1,843,030
EUR First Lien Term Loan 296,198 101,681 (829) 927 49,287 447,264 3,268 443,996
USD Second Lien Term Loan 166,453 (115,000) — 4,015 — 55,468 (5,070) 60,538
Total 2,428,579 (133,901) (4,735) 13,754 49,287 2,352,984 5,420 2,347,564
The Corporation’s debt balance as at December 31, 2016 was as follows:
Cash Non-cash
OpeningBalance$000's
PrincipalMovements
$000's
Transactioncosts
$000's
Accretion$000's
Translation
$000's
Total
$000's
Current
$000's
Long-term
$000's
USD First Lien Term Loan 1,978,763 (20,587) — 7,752 — 1,965,928 45,848 1,920,080
EUR First Lien Term Loan 307,584 (3,204) — 1,241 (9,423) 296,198 7,512 288,686
USD Second Lien TermLoan
161,524 —
—
4,929 — 166,453 (5,610) 172,063
CDN 2013 Debentures 21,556 (22,561) — — 1,005 — — —
Total 2,469,427 (46,352) — 13,922 (8,418) 2,428,579 47,750 2,380,829
The principal repayments of the Corporation’s currently outstanding long-term debt over the next five years, as adjusted for revisedestimates of excess cash flow allocations to the principal repayment of the First Lien Term Loans, amount to the following:
1 Year$000's
2 Years$000's
3 Years$000's
4 Years$000's
5 Years andGreater$000's
USD First Lien Term Loan 19,443 19,443 19,443 1,842,187 —
EUR First Lien Term Loan 4,632 4,632 4,632 438,855 —
USD Second Lien Term Loan — — — — 95,000
Total 24,075 24,075 24,075 2,281,042 95,000
(a) First and Second Lien Term Loans
On August 1, 2014, the Corporation completed the Stars Interactive Group Acquisition, which was partly financed through theissuance of long-term debt, allocated into first and second lien term loans. Giving effect to a previously disclosed refinancing inAugust 2015 (the “Refinancing”), and the Repricing (as defined below), as at September 30, 2017, the first lien term loans consistedof a $1.96 billion first lien term loan priced at LIBOR plus 3.50% (the “USD First Lien Term Loan”) and a €392 million seven-year firstlien term loan priced at Euribor plus 3.75% (the “EUR First Lien Term Loan” and, together with the USD First Lien Term Loan, the“First Lien Term Loans”), with 1.00% LIBOR and 0% Euribor floors, respectively, and each repayable on August 22, 2021. Alsogiving effect to the Refinancing, Repricing and Prepayments (as defined below), as at September 30, 2017, the second lien term loanconsisted of a $95 million loan priced at LIBOR plus 7.00%, with a 1.00% LIBOR floor and repayable on August 1, 2022 (the “USDSecond Lien Term Loan”).
On March 3, 2017, the Corporation completed the repricing and retranching of the First Lien Term Loans and amended the applicablecredit agreement (collectively, the “Repricing”). The Repricing included reducing the applicable interest rate margin on the First Lien
16
Term Loans by 50 basis points to LIBOR plus 350 basis points with a LIBOR floor of 100 basis points and Euribor plus 375 basispoints with a 0% Euribor floor, respectively, and retranching such loans by raising €100 million of incremental debt on the EUR FirstLien Term Loan and using the proceeds to reduce the USD First Lien Term Loan by $106 million. The Corporation and the lendersalso amended the credit agreement for the First Lien Term Loans to, among other things, reflect the Repricing and waive the required2016 and 2017 excess cash flow repayments (as defined and described in the credit agreement) previously due on March 31, 2017 andMarch 31, 2018, respectively.
The Repricing has been accounted for as a debt modification as the terms of the amended credit agreement were not considered tobe substantially different than the previous terms and as a result there was no significant impact on the carrying amount.
On August 8, 2017, and September 20, 2017, the Corporation made principal prepayments without penalty (the “Prepayments”) of $40million and $75 million, respectively, under the USD Second Lien Term Loan using cash on its balance sheet, cash flow fromoperations, or a combination thereof.
First Lien Term Loans
Except as set forth above, the Corporation is required to allocate up to 50% of the excess cash flow of the Corporation to theprincipal repayment of the First Lien Term Loans. Excess cash flow is referred to as EBITDA of Stars Group Holdings B.V. on aconsolidated basis for such excess cash flow period (i.e., each fiscal year commencing with the fiscal year ending on December 31,2015), minus, without duplication, debt service, capital expenditures, permitted business acquisitions and investments, taxes paid incash, increases in working capital, cash expenditures in respect of swap agreements, any extraordinary, unusual or nonrecurring loss,income or gain on asset dispositions, and plus, without any duplication, decreases in working capital, capital expenditures fundedwith the proceeds of the issuance of debt or the issuance of equity, cash payments received in respect of swap agreements, anyextraordinary, unusual or nonrecurring gain realized in cash and cash interest income to the extent deducted in the computation ofEBITDA.
The percentage allocated to the principal repayment can fluctuate based on the following:
• If the total secured leverage ratio at the end of the applicable excess cash flow period is less than or equal to 4.75 to 1.00but is greater than 4.00 to 1.00, the repayments will be 25% of the excess cash flow.
• If the total secured leverage ratio at the end of the applicable excess cash flow period is less than or equal to 4.00 to 1.00,the repayment will be 0% of the excess cash flow.
The agreement for the First Lien Term Loans restricts Stars Group Holdings B.V. and its subsidiaries from, among other things,incurring additional debt or granting additional liens on its assets and equity, distributing equity interests and distributing anyassets to third parties.
Second Lien Term Loan
Giving effect to the Refinancing and Prepayments, the principal balance of the USD Second Lien Term Loan decreased to $95 million,as at September 30, 2017. The applicable and effective interest rates are noted on the tables above.
(b) 2013 Debentures
On February 7, 2013, the Corporation closed a private placement of units, issuing and selling 30,000 units at a price of CDN $1,000 perunit for aggregate gross proceeds of CDN $30 million. Each unit consisted of certain non-convertible subordinated debentures (the“CDN 2013 Debentures”) and non-transferable Common Share purchase warrants. The CDN 2013 Debentures matured on January 31,2016 and CDN $30 million was repaid on February 1, 2016 and the then-remaining outstanding warrants expired on January 31,2016. As of such date, the Corporation had no further obligations under or with respect to the same.
10. DERIVATIVES
The Corporation is exposed to interest rate and currency risk. The Corporation uses derivative financial instruments for riskmanagement purposes and anticipates that such instruments will mitigate interest rate and currency risk, as applicable. As such, anychange in cash flows associated with derivative instruments is expected to be offset by changes in cash flows related to the hedgedposition.
Cash flow hedge accounting
On March 2, 2015, a subsidiary of the Corporation entered into cross-currency interest rate swap agreements (the “March 2015 SwapAgreements”). A USD notional amount of $1.74 billion was designated in cash flow hedge relationships to hedge the interest rateand foreign exchange of the USD First Lien Term Loan bearing a minimum floating interest rate of 4.5% (USD three-month LIBORplus a
17

3.5% margin, with a LIBOR floor of 1.0%). The March 2015 Swap Agreements, which mature in five years, fix the Euro to USDexchange rate at 1.1102 and fix the Euro interest payments at an average rate of 4.6016%.
In connection with the Refinancing, a subsidiary of the Corporation entered into two additional cross-currency interest rate swapagreements to hedge the interest rate and foreign exchange, effective August 12, 2015, for a USD notional amount of $325 million (the“August 2015 Swap Agreements” and together with the March 2015 Swap Agreements, the “Swap Agreements”). A portion of theAugust 2015 Swap Agreements (USD notional amount of $302 million) was designated in cash flow hedge relationships to hedge theinterest rate and foreign exchange of the USD First Lien Term Loan bearing a minimum floating interest rate of 4.5% (USD three-month LIBOR plus a 3.5% margin, with a LIBOR floor of 1.0%). The August 2015 Swap Agreements, which mature in five years, fixthe Euro to USD exchange rate at 1.094 and fix the Euro interest payments at an average rate of 4.657%. During the nine monthsended September 30, 2017, the Corporation unwound and settled a notional principal amount of $616.54 million of the SwapAgreements for a gain of $13.9 million.
As part of the Repricing, the Corporation reduced the applicable interest rate margin on the First Lien Term Loans by 50 basis pointsto LIBOR plus 350 basis points with a LIBOR floor of 100 basis points. As a result, the Corporation de-designated and re-designatedthe applicable hedging instruments in new hedge accounting relationships. An amount of $12.43 million was recognized as Financialexpenses during the nine months ended September 30, 2017 relating to the amortization of the Other comprehensive income balancebrought forward from the previous hedge accounting relationship.
During the three and nine months ended September 30, 2017 and 2016, there was no ineffectiveness with respect to the cash flowhedge.
During the three and nine months ended September 30, 2017, $4.62 million and $12.06 million, respectively (September 30, 2016 - $1.51million and $4.61 million, respectively) was reclassified from “Reserves” to the unaudited interim condensed consolidated statementof earnings as Financial expenses.
The fair value of the Swap Agreements in hedging relationships included in the derivative liabilities of the Corporation as atSeptember 30, 2017 was $95.63 million (derivative assets at December 31, 2016 – $52.04 million).
Net investment hedge accounting
During the period ended September 30, 2017 and during a portion of the year ended December 31, 2016, the Corporation designated aportion of the USD First Lien Term Loan, its entire principal amount of the USD Second Lien Term Loan and its then-outstandingdeferred consideration (i.e., the deferred purchase price for the Stars Interactive Group Acquisition) as a foreign exchange hedge ofits net investment in its foreign operations. Accordingly, the portion of the gains arising from the translation of the USD-denominated liabilities that was determined to be an effective hedge during the period was recognized in the unaudited interimcondensed consolidated statements of comprehensive income (loss), counterbalancing a portion of the losses arising fromtranslation of the Corporation’s net investment in its foreign operations. During the three and nine months ended September 30,2017, there was no ineffectiveness with respect to the net investment hedge.
For the three and nine months ended September 30, 2017, the Corporation recorded an unrealized exchange loss on translation of$30.56 million and $122.90 million, respectively (for the three and nine months ended September 30, 2016 – a gain of $6.82 million anda loss of $6.29 million, respectively) in the “Cumulative translation adjustment” in reserves related to the translation of a portion ofthe USD First Lien Term Loan, USD Second Lien Term Loan and the deferred consideration.
Put liabilities
In connection with the July 31, 2015 acquisition of Stars Fantasy Sports Subco, LLC (“Stars Fantasy”), the operator of, among otherthings, the Corporation’s StarsDraft brand, the Corporation granted a put option to the sellers whereby such sellers had the right,but not the obligation, to sell to the Corporation all the equity interests then held by such sellers. During the nine months endedSeptember 30, 2017, the Corporation acquired the remaining equity interests from the sellers. The derivative as at September 30, 2017was $nil (December 31, 2016 - $5.59 million).
18
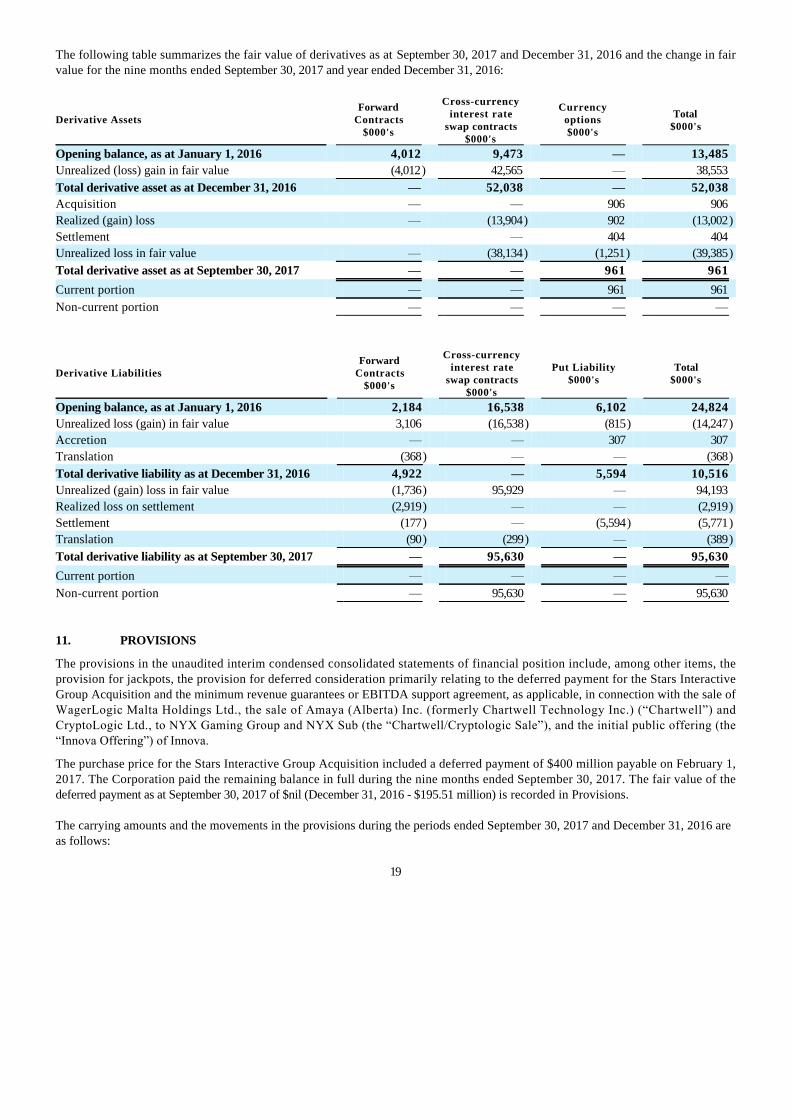
The following table summarizes the fair value of derivatives as at September 30, 2017 and December 31, 2016 and the change in fairvalue for the nine months ended September 30, 2017 and year ended December 31, 2016:
Derivative AssetsForward
Contracts$000's
Cross-currencyinterest rate
swap contracts$000's
Currencyoptions$000's
Total$000's
Opening balance, as at January 1, 2016 4,012 9,473 — 13,485
Unrealized (loss) gain in fair value (4,012) 42,565 — 38,553
Total derivative asset as at December 31, 2016 — 52,038 — 52,038
Acquisition — — 906 906
Realized (gain) loss — (13,904) 902 (13,002)
Settlement — 404 404
Unrealized loss in fair value — (38,134) (1,251) (39,385)
Total derivative asset as at September 30, 2017 — — 961 961
Current portion — — 961 961
Non-current portion — — — —
Derivative LiabilitiesForward
Contracts$000's
Cross-currencyinterest rate
swap contracts$000's
Put Liability$000's
Total$000's
Opening balance, as at January 1, 2016 2,184 16,538 6,102 24,824
Unrealized loss (gain) in fair value 3,106 (16,538) (815) (14,247)
Accretion — — 307 307
Translation (368) — — (368)
Total derivative liability as at December 31, 2016 4,922 — 5,594 10,516
Unrealized (gain) loss in fair value (1,736) 95,929 — 94,193
Realized loss on settlement (2,919) — — (2,919)
Settlement (177) — (5,594) (5,771)
Translation (90) (299) — (389)
Total derivative liability as at September 30, 2017 — 95,630 — 95,630
Current portion — — — —
Non-current portion — 95,630 — 95,630
11. PROVISIONS
The provisions in the unaudited interim condensed consolidated statements of financial position include, among other items, theprovision for jackpots, the provision for deferred consideration primarily relating to the deferred payment for the Stars InteractiveGroup Acquisition and the minimum revenue guarantees or EBITDA support agreement, as applicable, in connection with the sale ofWagerLogic Malta Holdings Ltd., the sale of Amaya (Alberta) Inc. (formerly Chartwell Technology Inc.) (“Chartwell”) andCryptoLogic Ltd., to NYX Gaming Group and NYX Sub (the “Chartwell/Cryptologic Sale”), and the initial public offering (the“Innova Offering”) of Innova.
The purchase price for the Stars Interactive Group Acquisition included a deferred payment of $400 million payable on February 1,2017. The Corporation paid the remaining balance in full during the nine months ended September 30, 2017. The fair value of thedeferred payment as at September 30, 2017 of $nil (December 31, 2016 - $195.51 million) is recorded in Provisions.
The carrying amounts and the movements in the provisions during the periods ended September 30, 2017 and December 31, 2016 areas follows:
19
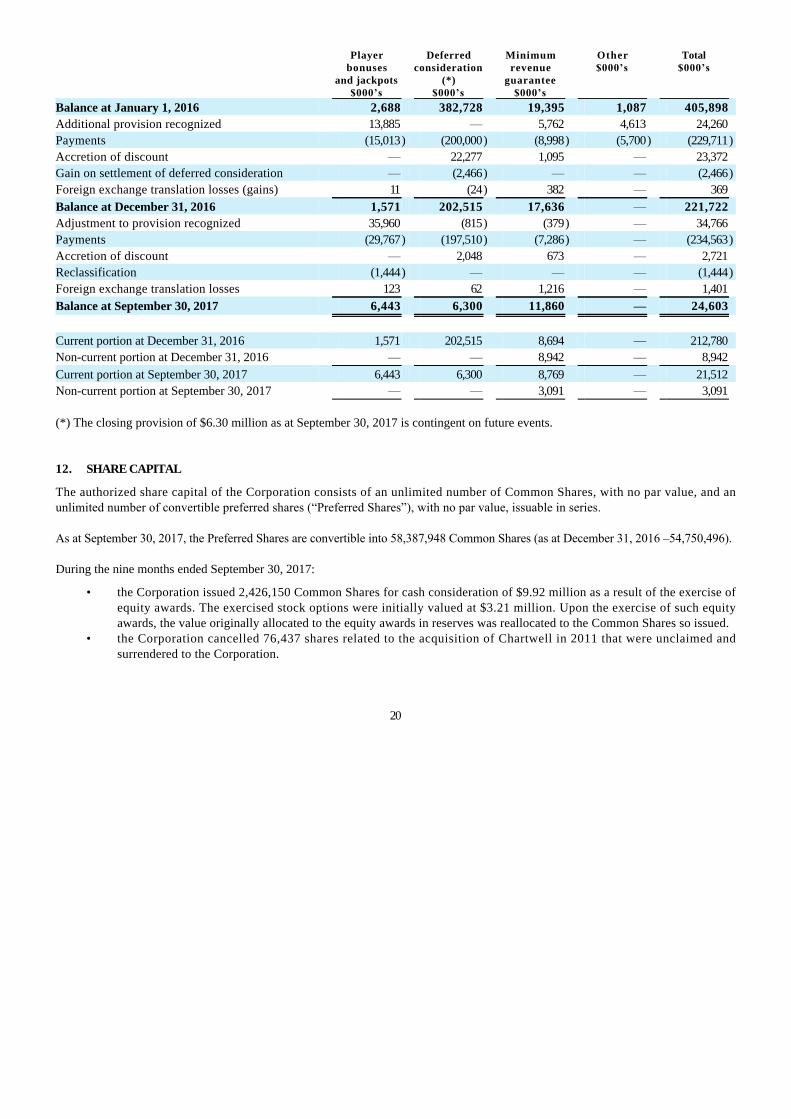
Playerbonuses
and jackpots$000’s
Deferredconsideration
(*)$000’s
Minimumrevenue
guarantee$000’s
Other$000’s
Total$000’s
Balance at January 1, 2016 2,688 382,728 19,395 1,087 405,898
Additional provision recognized 13,885 — 5,762 4,613 24,260
Payments (15,013) (200,000) (8,998) (5,700) (229,711)
Accretion of discount — 22,277 1,095 — 23,372
Gain on settlement of deferred consideration — (2,466) — — (2,466)
Foreign exchange translation losses (gains) 11 (24) 382 — 369
Balance at December 31, 2016 1,571 202,515 17,636 — 221,722
Adjustment to provision recognized 35,960 (815) (379) — 34,766
Payments (29,767) (197,510) (7,286) — (234,563)
Accretion of discount — 2,048 673 — 2,721
Reclassification (1,444) — — — (1,444)
Foreign exchange translation losses 123 62 1,216 — 1,401
Balance at September 30, 2017 6,443 6,300 11,860 — 24,603
Current portion at December 31, 2016 1,571 202,515 8,694 — 212,780
Non-current portion at December 31, 2016 — — 8,942 — 8,942
Current portion at September 30, 2017 6,443 6,300 8,769 — 21,512
Non-current portion at September 30, 2017 — — 3,091 — 3,091
(*) The closing provision of $6.30 million as at September 30, 2017 is contingent on future events. 12. SHARE CAPITAL
The authorized share capital of the Corporation consists of an unlimited number of Common Shares, with no par value, and anunlimited number of convertible preferred shares (“Preferred Shares”), with no par value, issuable in series. As at September 30, 2017, the Preferred Shares are convertible into 58,387,948 Common Shares (as at December 31, 2016 –54,750,496). During the nine months ended September 30, 2017:
• the Corporation issued 2,426,150 Common Shares for cash consideration of $9.92 million as a result of the exercise ofequity awards. The exercised stock options were initially valued at $3.21 million. Upon the exercise of such equityawards, the value originally allocated to the equity awards in reserves was reallocated to the Common Shares so issued.
• the Corporation cancelled 76,437 shares related to the acquisition of Chartwell in 2011 that were unclaimed andsurrendered to the Corporation.
20
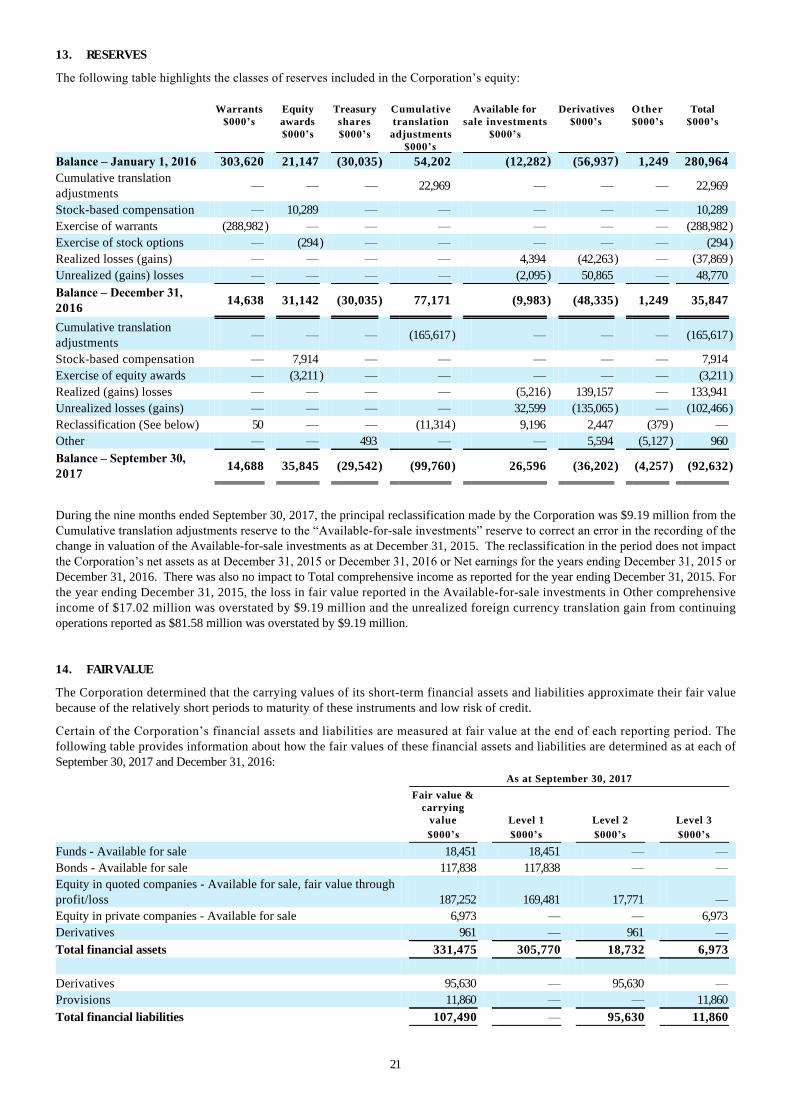
13. RESERVES
The following table highlights the classes of reserves included in the Corporation’s equity:
Warrants$000’s
Equityawards$000’s
Treasuryshares$000’s
Cumulativetranslation
adjustments$000’s
Available forsale investments
$000’s
Derivatives$000’s
Other$000’s
Total$000’s
Balance – January 1, 2016 303,620 21,147 (30,035) 54,202 (12,282) (56,937) 1,249 280,964
Cumulative translationadjustments
— — — 22,969 — — — 22,969
Stock-based compensation — 10,289 — — — — — 10,289
Exercise of warrants (288,982) — — — — — — (288,982)
Exercise of stock options — (294) — — — — — (294)
Realized losses (gains) — — — — 4,394 (42,263) — (37,869)
Unrealized (gains) losses — — — — (2,095) 50,865 — 48,770
Balance – December 31,2016
14,638 31,142 (30,035) 77,171 (9,983) (48,335) 1,249 35,847
Cumulative translationadjustments
— — — (165,617) — — — (165,617)
Stock-based compensation — 7,914 — — — — — 7,914
Exercise of equity awards — (3,211) — — — — — (3,211)
Realized (gains) losses — — — — (5,216) 139,157 — 133,941
Unrealized losses (gains) — — — — 32,599 (135,065) — (102,466)
Reclassification (See below) 50 — — (11,314) 9,196 2,447 (379) —
Other — — 493 — — 5,594 (5,127) 960
Balance – September 30,2017
14,688 35,845 (29,542) (99,760) 26,596 (36,202) (4,257) (92,632)
During the nine months ended September 30, 2017, the principal reclassification made by the Corporation was $9.19 million from theCumulative translation adjustments reserve to the “Available-for-sale investments” reserve to correct an error in the recording of thechange in valuation of the Available-for-sale investments as at December 31, 2015. The reclassification in the period does not impactthe Corporation’s net assets as at December 31, 2015 or December 31, 2016 or Net earnings for the years ending December 31, 2015 orDecember 31, 2016. There was also no impact to Total comprehensive income as reported for the year ending December 31, 2015. Forthe year ending December 31, 2015, the loss in fair value reported in the Available-for-sale investments in Other comprehensiveincome of $17.02 million was overstated by $9.19 million and the unrealized foreign currency translation gain from continuingoperations reported as $81.58 million was overstated by $9.19 million.
14. FAIR VALUE
The Corporation determined that the carrying values of its short-term financial assets and liabilities approximate their fair valuebecause of the relatively short periods to maturity of these instruments and low risk of credit.
Certain of the Corporation’s financial assets and liabilities are measured at fair value at the end of each reporting period. Thefollowing table provides information about how the fair values of these financial assets and liabilities are determined as at each ofSeptember 30, 2017 and December 31, 2016:
As at September 30, 2017
Fair value &carrying
value Level 1 Level 2 Level 3
$000’s $000’s $000’s $000’s
Funds - Available for sale 18,451 18,451 — —
Bonds - Available for sale 117,838 117,838 — —
Equity in quoted companies - Available for sale, fair value throughprofit/loss 187,252 169,481 17,771 —
Equity in private companies - Available for sale 6,973 — — 6,973
Derivatives 961 — 961 —
Total financial assets 331,475 305,770 18,732 6,973
Derivatives 95,630 — 95,630 —
Provisions 11,860 — — 11,860
Total financial liabilities 107,490 — 95,630 11,860
21
As at December 31, 2016
Fair value &carrying
value Level 1 Level 2 Level 3
$000’s $000’s $000’s $000’s
Funds - Available for sale 58,518 58,518 — —
Bonds - Available for sale 98,605 98,605 — —
Debentures- Fair value through profit/loss 7,556 — 7,556 —
Equity in quoted companies - Available for sale 123,808 115,480 — 8,328
Equity in private companies - Available for sale 6,921 — — 6,921
Derivatives 52,038 — 52,038 —
Total financial assets 347,446 272,603 59,594 15,249
Derivatives 10,516 — 4,922 5,594
Provisions 213,141 — — 213,141
Total financial liabilities 223,657 — 4,922 218,735
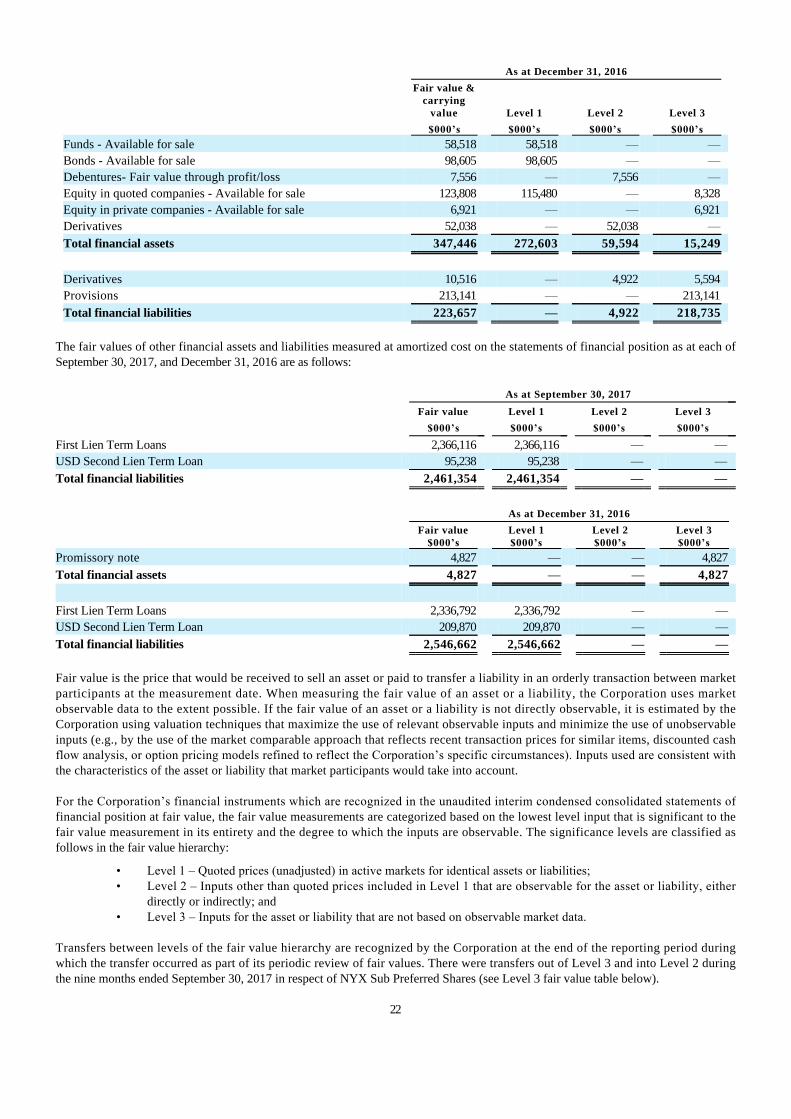
The fair values of other financial assets and liabilities measured at amortized cost on the statements of financial position as at each ofSeptember 30, 2017, and December 31, 2016 are as follows:
As at September 30, 2017
Fair value Level 1 Level 2 Level 3
$000’s $000’s $000’s $000’s
First Lien Term Loans 2,366,116 2,366,116 — —
USD Second Lien Term Loan 95,238 95,238 — —
Total financial liabilities 2,461,354 2,461,354 — —
As at December 31, 2016
Fair value$000’s
Level 1$000’s
Level 2$000’s
Level 3$000’s
Promissory note 4,827 — — 4,827
Total financial assets 4,827 — — 4,827
First Lien Term Loans 2,336,792 2,336,792 — —
USD Second Lien Term Loan 209,870 209,870 — —
Total financial liabilities 2,546,662 2,546,662 — —
Fair value is the price that would be received to sell an asset or paid to transfer a liability in an orderly transaction between marketparticipants at the measurement date. When measuring the fair value of an asset or a liability, the Corporation uses marketobservable data to the extent possible. If the fair value of an asset or a liability is not directly observable, it is estimated by theCorporation using valuation techniques that maximize the use of relevant observable inputs and minimize the use of unobservableinputs (e.g., by the use of the market comparable approach that reflects recent transaction prices for similar items, discounted cashflow analysis, or option pricing models refined to reflect the Corporation’s specific circumstances). Inputs used are consistent withthe characteristics of the asset or liability that market participants would take into account.
For the Corporation’s financial instruments which are recognized in the unaudited interim condensed consolidated statements offinancial position at fair value, the fair value measurements are categorized based on the lowest level input that is significant to thefair value measurement in its entirety and the degree to which the inputs are observable. The significance levels are classified asfollows in the fair value hierarchy:
• Level 1 – Quoted prices (unadjusted) in active markets for identical assets or liabilities;• Level 2 – Inputs other than quoted prices included in Level 1 that are observable for the asset or liability, either
directly or indirectly; and• Level 3 – Inputs for the asset or liability that are not based on observable market data.
Transfers between levels of the fair value hierarchy are recognized by the Corporation at the end of the reporting period duringwhich the transfer occurred as part of its periodic review of fair values. There were transfers out of Level 3 and into Level 2 duringthe nine months ended September 30, 2017 in respect of NYX Sub Preferred Shares (see Level 3 fair value table below).
22
Valuation of Level 2 fair values
Derivative Financial Instruments
Currently, the Corporation uses cross currency swap and interest rate swap agreements to manage its interest rate and foreigncurrency risk and foreign currency forward and option contracts to manage foreign currency risk. The valuation of these instrumentsis determined using widely accepted valuation techniques including discounted cash flow analysis on the expected cash flows ofeach derivative. This analysis reflects the contractual terms of the derivatives, including the period to maturity, and uses observablemarket-based inputs, including interest rate curves, spot and forward rates, as well as option volatility.
To comply with the provisions of IFRS 13, Fair value measurement, the Corporation incorporates credit valuation adjustments toappropriately reflect both its own nonperformance risk and the respective counterparty’s nonperformance risk in the fair valuemeasurements. In adjusting the fair value of its derivative contracts for the effect of nonperformance risk, the Corporation hasconsidered the impact of netting and any applicable credit enhancements, such as collateral postings, thresholds, mutual puts, andguarantees.
Although the Corporation has determined that the majority of the inputs used to value its derivatives fall within Level 2 (excluding,as at December 31, 2016, the put option in relation to Stars Fantasy) of the fair value hierarchy, the credit valuation adjustmentsassociated with its derivatives utilize Level 3 inputs, such as estimates of current credit spreads to evaluate the likelihood of defaultby itself and its counterparties. However, as of September 30, 2017 and December 31, 2016, the Corporation assessed the significanceof the impact of the credit valuation adjustments on the overall valuation of its derivative positions and determined that the creditvaluation adjustments are not significant to the overall valuation of its derivatives. As a result, the Corporation determined that itsderivative valuations in their entirety are classified in Level 2 of the fair value hierarchy. The put option in relation to Stars Fantasy,previously classified as level 3 in the fair value hierarchy, was settled in the nine months ended September 30, 2017.
NYX Sub Preferred Shares
As a result of the proposed acquisition of NYX Gaming Group by Scientific Games described in note 7 above, the Corporationchanged its valuation methodology for NYX Sub Preferred Shares from a binomial valuation approach to a net present valueapproach using a discount rate of 2.3%, based on the offer price from Scientific Games. Prior to transfer during the three monthsended September 30, 2017, this investment was classified as a Level 3 financial asset (2016: Level 3 financial asset).
Reconciliation of Level 3 fair values
Some of the Corporation’s financial assets and liabilities are classified as Level 3 of the fair value hierarchy because the respectivefair value determinations use inputs that are not based on observable market data. As at September 30, 2017, and December 31, 2016for each Level 3 asset or liability the valuation techniques and key inputs used by the Corporation were as follows:
- Equity in private companies (Level 3 Asset): Given the nature of the investee’s business, there is no readily available marketdata to carry an extensive valuation. The Corporation assesses for impairment on an annual basis using latest managementbudgets, long-term revenue growth rates and pre-tax operating margins. The carrying amount approximates the fair value.
- Promissory note (Level 3 Promissory note): The Corporation received the full balance of the Promissory note during the ninemonths ended September 30, 2017 (2016 – 11.3% discount rate).
- Deferred consideration (Level 3 Liability): The Corporation paid the remaining balance of the deferred consideration for theStars Interactive Group Acquisition in full during the nine months ended September 30, 2017 (2016 – 6% discount rate).
- Stars Fantasy put option (Level 3 Liability): See note 10 above for the applicable description. The option was exercisedduring the nine months ended September 30, 2017 (2016 – 5.7% discount rate).
- Innova EBITDA support agreement (Level 3 Liability): As previously disclosed, in connection with the Innova Offering, theCorporation entered into an EBITDA support agreement with Innova. The Corporation uses a net present value approachfor the Innova EBITDA support agreement using a 5.7% discount rate (2016 – 5.7% discount rate).
- Licensing Agreement (Level 3 Liability): As previously disclosed, in connection with the Chartwell/Cryptologic Sale, asubsidiary of the Corporation entered into a supplier licensing agreement with NYX Gaming Group (the “LicensingAgreement”). The Corporation uses a net present value approach for the Licensing Agreement using a 5.7% discount rate,9% revenue share percentage and long-term revenue forecast (2016 – 5.7% and 9%, respectively).
23
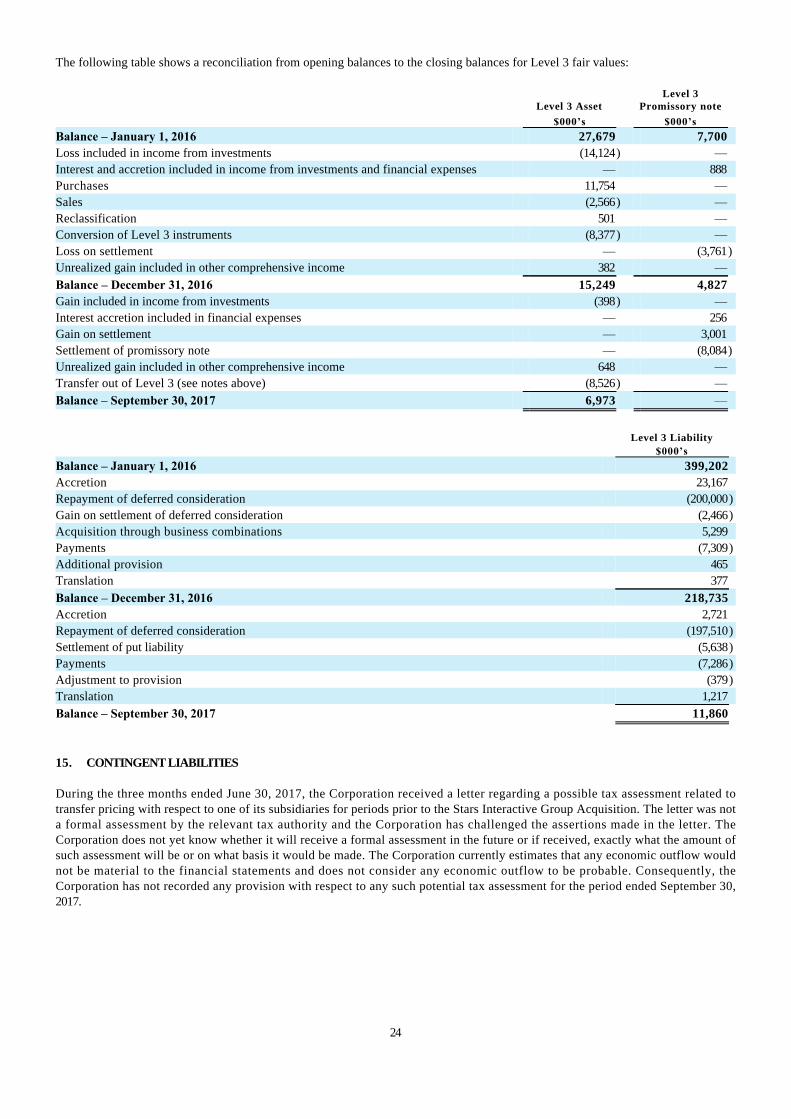
The following table shows a reconciliation from opening balances to the closing balances for Level 3 fair values:
Level 3 Asset Level 3
Promissory note
$000’s $000’s
Balance – January 1, 2016 27,679 7,700
Loss included in income from investments (14,124) —
Interest and accretion included in income from investments and financial expenses — 888
Purchases 11,754 —
Sales (2,566) —
Reclassification 501 —
Conversion of Level 3 instruments (8,377) —
Loss on settlement — (3,761)
Unrealized gain included in other comprehensive income 382 —
Balance – December 31, 2016 15,249 4,827
Gain included in income from investments (398) —
Interest accretion included in financial expenses — 256
Gain on settlement — 3,001
Settlement of promissory note — (8,084)
Unrealized gain included in other comprehensive income 648 —
Transfer out of Level 3 (see notes above) (8,526) —
Balance – September 30, 2017 6,973 —
Level 3 Liability
$000’s
Balance – January 1, 2016 399,202
Accretion 23,167
Repayment of deferred consideration (200,000)
Gain on settlement of deferred consideration (2,466)
Acquisition through business combinations 5,299
Payments (7,309)
Additional provision 465
Translation 377
Balance – December 31, 2016 218,735
Accretion 2,721
Repayment of deferred consideration (197,510)
Settlement of put liability (5,638)
Payments (7,286)
Adjustment to provision (379)
Translation 1,217
Balance – September 30, 2017 11,860
15. CONTINGENT LIABILITIES
During the three months ended June 30, 2017, the Corporation received a letter regarding a possible tax assessment related totransfer pricing with respect to one of its subsidiaries for periods prior to the Stars Interactive Group Acquisition. The letter was nota formal assessment by the relevant tax authority and the Corporation has challenged the assertions made in the letter. TheCorporation does not yet know whether it will receive a formal assessment in the future or if received, exactly what the amount ofsuch assessment will be or on what basis it would be made. The Corporation currently estimates that any economic outflow wouldnot be material to the financial statements and does not consider any economic outflow to be probable. Consequently, theCorporation has not recorded any provision with respect to any such potential tax assessment for the period ended September 30,2017.
24