interim financial statements - vale.com · the accounting pronouncement cpc 21(r1) –...
TRANSCRIPT

Interim Financial Statements March 31, 2016 BRGAAP
Filed with the CVM, SEC and HKEx on April 28, 2016

2
Vale S.A. Interim Financial Statements Contents
Page Independent auditor’s report on the review of the quarterly information - ITR 3 Condensed Consolidated and Parent Company Income Statement 5 Condensed Consolidated and Parent Company Statement of Comprehensive Income 6 Condensed Consolidated and Parent Company Cash Flow Statement 7 Condensed Consolidated and Parent Company Balance Sheet 8 Condensed Statement of Changes in Equity 9 Condensed Consolidated and Parent Company Value Added Statement 10 Selected Notes to the Interim Financial Statements 11
1. Corporate information 2. Basis for preparation of the interim financial statements 3. Information by business segment and by geographic area 4. Relevant event 5. Assets held for sale 6. Acquisitions and divestitures 7. Cash and cash equivalents 8. Accounts receivable 9. Inventories 10. Investments in associates and joint ventures 11. Intangibles 12. Property, plant and equipment 13. Loans and borrowings 14. Litigation 15. Income taxes 16. Employee benefits obligations 17. Financial instruments classification 18. Fair value estimate 19. Derivative financial instruments 20. Stockholders’ equity 21. Costs and expenses by nature 22. Financial results 23. Deferred revenue - Gold stream 24. Commitments 25. Related parties 26. Parent Company information (individual interim information)
Members of the Board of Directors, Fiscal Council, Advisory Committees and Executive Officers 45

3
Independent auditor’s report on the financial statements (A free translation of the original report in Portuguese, as filed with the Brazilian Securities and Exchange
Commission (CVM), prepared in accordance with the accounting practices adopted in Brazil, rules of the CVM
and of the International Financial Reporting Standards - IFRS)
To
The Board of Directors and Stockholders of
Vale S.A.
Rio de Janeiro - RJ
Introduction
1. We have reviewed the interim accounting information of Vale S.A. (“the Company”), individual and consolidated,
included in the quarterly information form - ITR for the quarter ended March 31, 2016, which comprises the balance sheet
as of March 31, 2016 and the respective statements of income and comprehensive income, statements of changes in
stockholders’ equity and statement of cash flows for the three-month period a then ended, including the explanatory notes.
2. The Company`s Management is responsible for the preparation of the interim accounting information in accordance with
the Accounting Pronouncement CPC 21(R1) – “Demonstração Intermediária” and the international accounting rule IAS
34 - Interim Financial Reporting, issued by the IASB, as well as the presentation of these information in accordance with
the standards issued by the Brazilian Securities and Exchange Commission (CVM), applicable to the preparation of
quarterly information - ITR. Our responsibility is to express our conclusion on this interim accounting information based
on our review.
Scope of the review
3. We conducted our review in accordance with Brazilian and International Interim Information Review Standards (NBC TR
2410 - Revisão de Informações Intermediárias Executada pelo Auditor da Entidade and ISRE 2410 - Review of Interim
Financial Information Performed by the Independent Auditor of the Entity), respectively. A review of interim information
consists of making inquiries primarily of the management responsible for financial and accounting matters and applying
analytical procedures and other review procedures. The scope of a review is significantly less than an audit conducted in
accordance with auditing standards and, accordingly, it did not enable us to obtain assurance that we were aware of all the
material matters that would have been identified in an audit. Therefore, we do not express an audit opinion.
KPMG Auditores Independentes
Av. Almirante Barroso, 52 - 4º
20031-000 - Rio de Janeiro, RJ - Brasil
Caixa Postal 2888
20001-970 - Rio de Janeiro, RJ - Brasil
Central Tel 55 (21) 3515-9400
Fax 55 (21) 3515-9000
Internet www.kpmg.com.br

4
Conclusion on the interim accounting information
4. Based on our review, we are not aware of any fact that might lead us to believe that the individual and consolidated
interim accounting information included in the aforementioned quarterly information was not prepared, in all material
respects, in accordance with CPC 21(R1) and IAS 34, applicable to the preparation of the quarterly review - ITR, and
presented in accordance with the standards issued by the Brazilian Securities and Exchange Commission.
Other matters
Statements of added value
5. We have also reviewed the individual and consolidated interim information of added value for the three-month period
ended March 31, 2016, prepared under the responsibility of the Company`s Management, for which presentation is
required in the interim information in accordance with the standards issued by the CVM applicable to the preparation of
quarterly information - ITR, and considered as supplementary information by IFRS, which does not require the
presentation of the statements of added value. These statements were submitted to the same review procedures described
previously and, based on our review, we are not aware of any fact that might lead us to believe that they were not
prepared, in all material respects, in accordance with the individual and consolidated interim accounting information,
taken as a whole.
Rio de Janeiro, April 27, 2016
KPMG Auditores Independentes
CRC SP-014428/O-6 F-RJ
(Original report in Portuguese signed by)
Manuel Fernandes Rodrigues de Sousa
Accountant CRC RJ-052428/O-2
KPMG Auditores Independentes, uma sociedade simples brasileira e firma-membro da rede KPMG de firmas-membro independentes e afiliadas à KPMG International Cooperative (“KPMG International”), uma entidade suíça.
KPMG Auditores Independentes, a Brazilian entity and a member firm of the KPMG network of independent member firms affiliated with KPMG International Cooperative (“KPMG International”), a Swiss entity.

(A free translation of the original in Portuguese)
5
Condensed Income Statement In millions of Brazilian Reais, except as otherwise stated Consolidated Parent Company
Three-month period ended March 31
Notes 2016 2015 2016 2015
Net operating revenue 3(c) 22,067 18,027 8,164 10,237 Cost of goods sold and services rendered 21(a) (16,467) (14,988) (6,962) (6,424)
Gross profit 5,600 3,039 1,202 3,813
Operating (expenses) income Selling and administrative expenses 21(b) (465) (555) (240) (293) Research and evaluation expenses (232) (344) (119) (167) Pre operating and operational stoppage (400) (758) (164) (113) Equity results from subsidiaries - - 2,899 (3,774) Other operating income (expenses), net 21(c) (134) 179 (427) 39
(1,231) (1,478) 1,949 (4,308) Results on measurement or sale of non-current assets 6 - 546 - 546
Operating income 4,369 2,107 3,151 51
Financial income 22 11,753 6,953 11,362 6,923 Financial expenses 22 (6,980) (20,631) (6,720) (19,030) Equity results in associates and joint ventures 10 589 (825) 589 (825) Results on sale or disposal of investments in associates and joint ventures 6 - 55 - 55
Net income (loss) before income taxes 9,731 (12,341) 8,382 (12,826) Income taxes 15 Current tax (1,292) (200) (1,017) - Deferred tax (2,111) 2,850 (1,054) 3,288
(3,403) 2,650 (2,071) 3,288
Net income (loss) 6,328 (9,691) 6,311 (9,538)
Income (loss) attributable to noncontrolling interests 17 (153) Net income (loss) attributable to Vale's stockholders 6,311 (9,538)
Earnings per share attributable to Vale's stockholders: Basic and diluted earnings per share: 20(b) Preferred share (R$) 1.22 (1.85) Common share (R$) 1.22 (1.85) The accompanying notes are an integral part of these interim financial statements.

(A free translation of the original in Portuguese)
6
Condensed Statement of Comprehensive Income In millions of Brazilian Reais Consolidated Parent Company
Three-month period ended March 31
2016 2015 2016 2015
Net income (loss) 6,328 (9,691) 6,311 (9,538)
Other comprehensive income (loss): Items that will not be reclassified subsequently to the income statement Retirement benefit obligations Gross balance for the period (331) (318) (21) (10) Effect of taxes 104 157 7 3 Equity results in associates and joint ventures - - (213) (154)
(227) (161) (227) (161)
Total items that will not be reclassified subsequently to the income statement (227) (161) (227) (161)
Items that may be reclassified subsequently to the income statement Cumulative translation adjustments Gross balance for the period (6,429) 14,938 (6,494) 14,309 Effect of taxes (549) - - -
(6,978) 14,938 (6,494) 14,309 Cash flow hedge Gross balance for the period 21 724 - - Effect of taxes (3) - - - Equity results in associates and joint ventures - (7) 8 300 Transfer of realized results to net income, net of taxes (10) (417) - -
8 300 8 300
Total of items that may be reclassified subsequently to the income statement (6,970) 15,238 (6,486) 14,609
Total comprehensive income (loss) (869) 5,386 (402) 4,910
Comprehensive income (loss) attributable to noncontrolling interests (467) 476 Comprehensive income (loss) attributable to Vale's stockholders (402) 4,910
The accompanying notes are an integral part of these interim financial statements.

(A free translation of the original in Portuguese)
7
Condensed Cash Flow Statement In millions of Brazilian Reais Consolidated Parent Company
Three-month period ended March 31
Cash flow from operating activities: 2016 2015 2016 2015
Net income (loss) before income taxes 9,731 (12,341) 8,382 (12,826) Adjustments for: Equity results from associates and joint ventures (589) 825 (3,488) 4,599 Results on measurement or sale of non-current assets - (546) - (546) Results on sale or disposal of investments in associates and joint ventures - (55) - (55) Results on disposal of property, plant and equipment and intangibles 39 (682) 6 58 Depreciation, amortization and depletion 3,314 3,000 1,164 988 Financial results, net (4,773) 13,678 (4,642) 12,107 Changes in assets and liabilities: Accounts receivable (3,896) 2,221 1,640 1,598 Inventories (400) 753 19 114 Suppliers and contractors (1,430) (1,150) 1 (654) Payroll and related charges (11) (1,581) 96 (1,097) Other taxes assets and liabilities, net (183) 75 22 172 Deferred revenue - Gold stream (note 23) - 1,670 - - Other assets and liabilities, net 939 80 (142) (322)
Cash generated from operations 2,741 5,947 3,058 4,136 Dividends and interest on capital received from subsidiaries - - - 209 Interest on loans with related parties received (paid), net - - (218) (152) Interest on loans and borrowings paid (1,861) (1,321) (960) (769) Derivatives received (paid), net (note 19) (1,976) (1,785) (502) (600) Interest on participative stockholders' debentures paid - (124) - (124) Income taxes (631) (759) (20) - Income taxes - Settlement program (343) (308) (336) (302)
Net cash provided by (used in) operating activities (2,070) 1,650 1,022 2,398
Cash flow from investing activities: Financial investments redeemed (invested) 378 402 (5) 388 Loans and advances received (granted) (13) (6) 62 205 Guarantees and deposits received (granted) (138) (70) (157) (65) Additions to investments (362) (30) (645) (740) Acquisition of subsidiary, net of cash acquired 17 (237) - - Additions to property, plant and equipment and intangible (note 3(b)) (5,354) (6,259) (3,607) (4,167) Dividends and interest on capital received from associates and joint ventures 2 74 4 71 Proceeds from disposal of assets and investments 47 339 - 309 Proceeds from gold stream transaction (note 23) - 1,156 - -
Net cash used in investing activities (5,423) (4,631) (4,348) (3,999)
Cash flow from financing activities: Loans and borrowings (i) Additions 12,950 3,676 5,669 3,686 Repayments (4,735) (819) (640) (578) Transactions with related parties - - (1,478) (1,154) Transactions with stockholders: Dividends and interest on capital paid to noncontrolling interest (17) (7) - - Transactions with noncontrolling stockholders (69) - - -
Net cash provided by financing activities 8,129 2,850 3,551 1,954
Increase (decrease) in cash and cash equivalents 636 (131) 225 353 Cash and cash equivalents in the beginning of the period 14,022 10,555 518 685 Effect of exchange rate changes on cash and cash equivalents (1,197) 1,394 - -
Cash and cash equivalents at end of the period 13,461 11,818 743 1,038
Non-cash transactions: Additions to property, plant and equipment - capitalized loans and borrowing costs 670 556 401 283 (i) Includes transactions with related parties: Banco Bradesco, Banco do Brasil e Banco Nacional do Desenvolvimento economico e Social - BNDES. The accompanying notes are an integral part of these interim financial statements.

(A free translation of the original in Portuguese)
8
Condensed Balance Sheet In millions of Brazilian Reais Consolidated Parent Company
Notes March 31, 2016 December 31, 2015 March 31, 2016 December 31, 2015
Assets Current assets Cash and cash equivalents 7 13,461 14,022 743 518 Financial investments 97 109 24 18 Derivative financial instruments 19 500 474 288 196 Accounts receivable 8 9,088 5,763 31,292 36,026 Inventories 9 13,527 13,775 3,893 3,830 Prepaid income taxes 2,223 3,513 1,960 3,176 Recoverable taxes 5,420 5,482 3,429 3,352 Related parties 25 356 273 1,715 834 Others 2,072 1,215 403 581
46,744 44,626 43,747 48,531 Assets held for sale 5 14,560 15,792 - -
61,304 60,418 43,747 48,531
Non-current assets Derivative financial instruments 19 605 363 525 293 Loans 691 732 109 106 Prepaid income taxes 1,839 1,840 - - Recoverable taxes 1,936 1,956 1,458 1,457 Deferred income taxes 15(a) 27,317 30,867 16,245 17,292 Judicial deposits 14(c) 3,502 3,445 2,788 2,707 Related parties 25 - 5 1,074 1,468 Others 2,213 2,392 592 765
38,103 41,600 22,791 24,088 Investments 10 12,091 11,481 124,032 127,517 Intangibles 11 21,416 20,789 9,727 8,557 Property, plant and equipment 12 206,148 211,259 97,712 96,887
277,758 285,129 254,262 257,049
Total assets 339,062 345,547 298,009 305,580
Liabilities Current liabilities Suppliers and contractors 11,200 13,140 6,420 7,084 Payroll and related charges 1,468 1,464 836 806 Derivative financial instruments 19 5,798 8,107 2,975 3,559 Loans and borrowings 13 11,584 9,788 6,195 4,736 Related parties 25 2,604 1,856 9,354 6,774 Income taxes - Settlement program 15(c) 1,383 1,348 1,355 1,320 Taxes payable 792 977 306 460 Provision for income taxes 596 943 - - Employee postretirement obligations 16 253 266 63 72 Asset retirement obligations 312 346 77 83 Others 4,240 2,531 624 825
40,230 40,766 28,205 25,719 Liabilities associated with assets held for sale 5 336 416 - -
40,566 41,182 28,205 25,719
Non-current liabilities Derivative financial instruments 19 4,359 5,581 3,715 4,745 Loans and borrowings 13 100,413 102,878 55,564 55,986 Related parties 25 438 830 54,954 63,837 Employee postretirement obligations 16 6,963 6,831 494 483 Provisions for litigation 14(a) 3,029 3,210 2,070 2,190 Income taxes - Settlement program 15(c) 16,023 15,953 15,694 15,626 Deferred income taxes 15(a) 6,467 6,520 - - Asset retirement obligations 9,333 9,313 1,466 1,291 Participative stockholders' debentures 24(b) 1,787 1,336 1,787 1,336 Deferred revenue - Gold stream 23 6,102 6,830 - - Others 5,600 5,664 3,302 3,207
160,514 164,946 139,046 148,701
Total liabilities 201,080 206,128 167,251 174,420
Stockholders' equity Equity attributable to Vale's stockholders 20 130,758 131,160 130,758 131,160 Equity attributable to noncontrolling interests 7,224 8,259 - -
Total stockholders' equity 137,982 139,419 130,758 131,160
Total liabilities and stockholders' equity 339,062 345,547 298,009 305,580
The accompanying notes are an integral part of these interim financial statements.

(A free translation of the original in Portuguese)
9
Condensed Statement of Changes in Equity In millions of Brazilian Reais
Share
capital
Results on conversion
of shares
Results from operation with noncontrolling
interest Profit
reserves Treasury
stocks
Unrealized fair value gain
(losses)
Cumulative translation
adjustments Retained earnings
Equity attributable
to Vale's stockholders
Equity attributable to noncontrolling
interests
Total stockholder's
equity
Balance at December 31, 2015 77,300 50 (1,881) 3,846 (2,746) (3,873) 58,464 - 131,160 8,259 139,419
Net income - - - - - - - 6,311 6,311 17 6,328 Other comprehensive income: Retirement benefit obligations - - - - - (227) - - (227) - (227) Cash flow hedge - - - - - 8 - - 8 - 8 Translation adjustments - - - - - 208 (6,702) - (6,494) (484) (6,978) Transactions with stockholders: Dividends of noncontrolling interest - - - - - - - - - (592) (592) Capitalization of noncontrolling interest advances - - - - - - - - - 24 24
Balance at March 31, 2016 77,300 50 (1,881) 3,846 (2,746) (3,884) 51,762 6,311 130,758 7,224 137,982
Share
capital
Results on conversion
of shares
Results from operation with noncontrolling
interest Profit
reserves Treasury
stocks
Unrealized fair value gain
(losses)
Cumulative translation
adjustments Retained earnings
Equity attributable
to Vale's stockholders
Equity attributable to noncontrolling
interests
Total stockholder's
equity
Balance at December 31, 2014 77,300 50 (970) 53,085 (2,746) (4,553) 24,248 - 146,414 3,187 149,601
Loss - - - - - - - (9,538) (9,538) (153) (9,691) Other comprehensive income: Retirement benefit obligations - - - - - (161) - - (161) - (161) Cash flow hedge - - - - - 300 - - 300 - 300 Translation adjustments - - - - - (548) 14,857 - 14,309 629 14,938 Transactions with stockholders: Dividends of noncontrolling interest - - - - - - - - - (5) (5) Acquisitions and disposal of participation of noncontrolling interest - - (5) - - - - - (5) 4 (1) Capitalization of noncontrolling interest advances - - - - - - - - - 20 20
Balance at March 31, 2015 77,300 50 (975) 53,085 (2,746) (4,962) 39,105 (9,538) 151,319 3,682 155,001
The accompanying notes are an integral part of these interim financial statements.

(A free translation of the original in Portuguese)
10
Condensed Value Added Statement In millions of Brazilian Reais Consolidated Parent Company
Three-month period ended March 31
Generation of value added from continuing operations 2016 2015 2016 2015
Gross revenue Revenue from products and services 22,377 18,363 8,333 10,552 Results on measurement or sale of non-current assets - 601 - 601 Revenue from the construction of own assets 3,582 6,845 2,707 4,450 Allowance for doubtful accounts (1) - (2) (2) Other revenues 166 1,636 72 396 Less: Acquisition of products (326) (704) (137) (167) Material, service and maintenance (8,096) (10,288) (4,851) (6,262) Oil and gas (1,200) (902) (666) (574) Energy (638) (421) (241) (209) Freight (1,920) (2,269) (10) - Other costs and expenses (1,650) (3,024) (603) (861)
Gross value added 12,294 9,837 4,602 7,924 Depreciation, amortization and depletion (3,314) (3,000) (1,164) (988)
Net value added 8,980 6,837 3,438 6,936 Received from third parties Equity results from associates and joint ventures 589 (825) 3,488 (4,599) Financial income 234 161 90 92 Monetary and exchange variation of assets (3,700) 6,227 (3,965) 6,583
Total value added to be distributed 6,103 12,400 3,051 9,012
Personnel 1,971 2,074 886 1,033 Taxes and contributions 2,025 2,118 1,641 1,683 Current income tax 1,292 200 1,016 - Deferred income tax 2,111 (2,850) 1,055 (3,288) Financial expense (excludes capitalized interest) 1,272 4,627 1,047 3,487 Monetary and exchange variation of liabilities (9,286) 15,575 (9,650) 15,172 Other remunerations of third party funds 390 347 745 463 Reinvested net income (absorbed loss) 6,311 (9,538) 6,311 (9,538) Net income (loss) attributable to noncontrolling interest 17 (153) - -
Distributed value added 6,103 12,400 3,051 9,012
The accompanying notes are an integral part of these interim financial statements.

(A free translation of the original in Portuguese)
11
Selected Notes to the Interim Financial Statements Expressed in millions of Brazilian Reais, unless otherwise stated
1. Corporate information Vale S.A. (the “Parent Company”) is a public company headquartered at 700, Avenida das Américas, Rio de Janeiro, Brazil with securities traded on the stock exchanges of São Paulo - BM&F BOVESPA (Vale3 and Vale5), New York - NYSE (VALE and VALE.P), Paris - NYSE Euronext (Vale3 and Vale5) and Hong Kong - HKEx (codes 6210 and 6230). Vale and its direct and indirect subsidiaries (“Vale”, “Group” or “Company”) are producers of iron ore and iron ore pellets, key raw materials for steelmaking, and producers of nickel, which is used to produce stainless steel and metal alloys employed in the production of several products. The Group also produces copper, metallurgical and thermal coal, potash, phosphates and other fertilizer nutrients, manganese ore, ferroalloys, platinum group metals, gold, silver and cobalt. The information by segment is presented in note 3.
2. Basis for preparation of the interim financial statements a) Statement of compliance The condensed consolidated and individual interim financial statements of the Company (“interim financial statements”) have been prepared in accordance with the International Financial Reporting Standards (“IFRS”) as implemented in Brazil by the Brazilian Accountant Pronouncements Committee ("CPC"), approved by the Brazilian Securities Exchange Commission ("CVM") and by the Brazilian Federal Accounting Council (“CFC”). All relevant information from its own financial statements, and only this information, are being presented and correspond to those used by the Company's Management. The consolidated financial statements present the accounts of the Group. The individual financial statements present the accounts of the Parent Company and are presented in a summarized form in note 26. b) Basis of presentation The interim financial statements have been prepared under the historical cost convention as adjusted to reflect: (i) the fair value of financial instruments measured at fair value through income statement or available-for-sale financial instruments measured at fair value through the statement of comprehensive income; and (ii) impairment of assets. The accounting practices, accounting estimates and judgments, risk management and measurement methods are the same as those adopted when preparing the financial statements for the year ended December 31, 2015. These interim financial statements were prepared to update users about relevant information presented in the period and should be read in conjunction with the financial statements for the year ended December 31, 2015. The interim financial statements of the Group and its associates and joint ventures are measured using the currency of the primary economic environment in which each entity operates (“functional currency”). In the case of the Parent Company the functional currency is the Brazilian real (“BRL” or “R$”). For presentation purposes, these interim financial statements are presented in R$. The exchange rates used by the Group for major currencies to translate its operations into R$ are as follows: Closing rate Average rate for the three-month period ended
March 31, 2016 December 31, 2015 March 31, 2016 March 31, 2015
US dollar ("US$") 3.5589 3.9048 3.9022 2.8702 Canadian dollar ("CAD") 2.7446 2.8171 2.8421 2.3120 Australian dollar ("AUD") 2.7322 2.8532 2.8165 2.2543 Euro ("EUR" or "€") 4.0539 4.2504 4.3008 3.2212
Subsequent events were evaluated through April 27, 2016, which is the date the interim financial statements were approved by the Board of Directors. c) Accounting standards issued but not yet effective The standards and interpretations issued by IASB relevant to the Company but not yet effective are the same as those adopted when preparing the financial statements for the year ended December 31, 2015.

(A free translation of the original in Portuguese)
12
3. Information by business segment and by geographic area The information presented to the Executive Board on the performance of each segment is derived from the accounting records, adjusted for reallocations between segments. a) Operating income and adjusted EBITDA Adjusted EBITDA is used by management to support the decision making process for segments. The definition of adjusted EBITDA for the Company is the operating income or loss adding dividends received from associates and joint ventures, and excluding the depreciation, depletion and amortization, impairment, onerous contracts and results on measurement or sales of non-current assets. Consolidated
Three-month period ended March 31, 2016
Income statement Adjusted by
Net operating
revenue Costs Expenses, net
Research and evaluation
expenses
Pre operating and operational
stoppage Depreciation and
other results Operating
income (loss)
Dividends received from
associates and joint ventures
Depreciation, depletion and amortization
Adjusted EBITDA
Ferrous minerals Iron ore 11,188 (5,038) (599) (41) (126) (933) 4,451 - 933 5,384 Pellets 2,918 (1,695) (59) (2) (15) (310) 837 - 310 1,147 Ferroalloys and manganese 182 (175) 6 - (10) (29) (26) - 29 3 Other ferrous products and services 339 (230) 18 (1) (3) (69) 54 - 69 123
14,627 (7,138) (634) (44) (154) (1,341) 5,316 - 1,341 6,657 Coal 599 (1,133) 187 (7) (4) (96) (454) - 96 (358) Base metals Nickel and other products 3,883 (2,973) (89) (56) (124) (1,425) (784) 1 1,425 642 Copper 1,371 (747) 6 (3) - (169) 458 - 169 627
5,254 (3,720) (83) (59) (124) (1,594) (326) 1 1,594 1,269 Fertilizers Potash 91 (69) 17 (7) (14) (22) (4) - 22 18 Phosphates 1,125 (910) (50) (12) (1) (220) (68) - 220 152 Nitrogen 228 (163) (7) (2) - (19) 37 - 19 56 Other fertilizers products 49 - - - - - 49 - - 49
1,493 (1,142) (40) (21) (15) (261) 14 - 261 275 Others 94 (175) 22 (100) - (22) (181) 1 22 (158)
Total 22,067 (13,308) (548) (231) (297) (3,314) 4,369 2 3,314 7,685

(A free translation of the original in Portuguese)
13
Consolidated
Three-month period ended March 31, 2015
Statement of income Adjusted by
Net operating
revenue Costs Expenses, net
Research and evaluation
expenses
Pre operating and operational
stoppage Depreciation and
other results Operating
income (loss)
Results on measurement or sale of non-current assets
Dividends received from
associates and joint ventures
Depreciation, depletion and amortization
Adjusted EBITDA
Ferrous minerals Iron ore 7,859 (5,548) (488) (94) (75) (1,058) 596 - - 1,058 1,654 Pellets 2,778 (1,703) 10 (4) (16) (246) 819 - 72 246 1,137 Ferroalloys and manganese 206 (138) - - (16) (17) 35 - - 17 52 Other ferrous products and services 335 (284) 30 (3) (1) (58) 19 - - 58 77
11,178 (7,673) (448) (101) (108) (1,379) 1,469 - 72 1,379 2,920 Coal 419 (544) (195) (14) (36) (67) (437) - - 67 (370) Base metals Nickel and other products 3,855 (2,434) (187) (80) (306) (1,214) (366) - - 1,214 848 Copper 1,102 (647) 13 (4) (2) (137) 325 - - 137 462 Other base metals products - - 722 - - - 722 - - - 722
4,957 (3,081) 548 (84) (308) (1,351) 681 - - 1,351 2,032 Fertilizers Potash 85 (59) (2) (29) (13) (17) (35) - - 17 (18) Phosphates 1,020 (742) (47) (18) (25) (157) 31 - - 157 188 Nitrogen 223 (158) (8) (2) (2) (17) 36 - - 17 53 Other fertilizers products 34 - - - - - 34 - - - 34
1,362 (959) (57) (49) (40) (191) 66 - - 191 257 Others 111 (79) (141) (96) (1) 534 328 (546) 2 12 (204) Total 18,027 (12,336) (293) (344) (493) (2,454) 2,107 (546) 74 3,000 4,635

(A free translation of the original in Portuguese)
14
b) Assets by segment Consolidated
As at March 31, 2016
Three-month period
ended March 31, 2016
Trade receivables Product inventory
Investments in associates and joint ventures
Property, plant and equipment and
intangible assets
Additions to property, plant and equipment and
intangible (i)
Ferrous minerals Iron ore 2,653 3,404 1,575 105,635 3,542 Pellets 3,292 641 1,253 4,335 27 Ferroalloys and manganese 182 231 - 616 24 Other ferrous products and services 386 5 3,023 822 -
6,513 4,281 5,851 111,408 3,593 Coal 95 155 1,062 6,694 521 Base metals Nickel and other products 1,392 3,992 55 78,641 690 Copper 709 112 - 8,862 365
2,101 4,104 55 87,503 1,055 Fertilizers Potash 22 75 - 541 - Phosphates 381 1,194 295 14,289 153 Nitrogen 57 47 - - -
460 1,316 295 14,830 153 Others 133 15 4,828 7,129 32
Total 9,302 9,871 12,091 227,564 5,354
(i) Include only cash effect .
Consolidated
December 31, 2015
Three-month period ended March 31, 2015
Trade receivables Product inventory
Investments in associates and joint ventures
Property, plant and equipment and
intangible assets
Additions to property, plant and equipment
and intangible (i)
Ferrous minerals Iron ore 289 3,168 1,581 104,539 4,154 Pellets 2,792 620 1,156 4,213 31 Ferroalloys and manganese 203 249 - 547 6 Other ferrous products and services 303 7 3,038 824 9
3,587 4,044 5,775 110,123 4,200 Coal 176 206 1,195 7,075 1,007 Base metals Nickel and other products 1,606 4,460 66 83,118 617 Copper 67 92 - 8,731 202
1,673 4,552 66 91,849 819 Fertilizers Potash 12 52 - 570 - Phosphates 326 1,063 292 14,526 159 Nitrogen 55 41 - - -
393 1,156 292 15,096 159 Others 159 10 4,153 7,905 74
Total 5,988 9,968 11,481 232,048 6,259
(i) Include only cash effect.

(A free translation of the original in Portuguese)
15
c) Results by segment and revenues by geographic area Consolidated
Three-month period ended March 31, 2016
Ferrous
minerals Coal Base metals Fertilizers Others Total
Results Net operating revenue 14,627 599 5,254 1,493 94 22,067 Cost and expenses (7,970) (957) (3,986) (1,218) (253) (14,384) Depreciation, depletion and amortization (1,341) (96) (1,594) (261) (22) (3,314)
Operating income (loss) 5,316 (454) (326) 14 (181) 4,369 Financial result 5,104 165 (531) 52 (17) 4,773 Equity results in associates and joint ventures 154 (35) (6) - 476 589 Income taxes (3,558) - 179 (24) - (3,403)
Net income (loss) 7,016 (324) (684) 42 278 6,328
Income (loss) attributable to noncontrolling interests 158 (95) (68) 20 2 17 Income (loss) attributable to Vale's stockholders 6,858 (229) (616) 22 276 6,311
Sales classified by geographic area: America, except United States and Brazil 355 15 1,080 38 - 1,488 United States of America 131 - 671 - 14 816 Europe 1,882 26 1,637 83 - 3,628 Middle East/Africa/Oceania 634 71 35 - - 740 Japan 994 137 202 - - 1,333 China 8,678 95 613 - - 9,386 Asia, except Japan and China 606 255 947 78 - 1,886 Brazil 1,347 - 69 1,294 80 2,790
Net operating revenue 14,627 599 5,254 1,493 94 22,067
Consolidated
Three-month period ended March 31, 2015
Ferrous
minerals Coal Base metals Fertilizers Others Total
Results Net operating revenue 11,178 419 4,957 1,362 111 18,027 Cost and expenses (8,330) (789) (2,925) (1,105) (317) (13,466) Results on measurement or sales of non-current assets - - - - 546 546 Depreciation, depletion and amortization (1,379) (67) (1,351) (191) (12) (3,000)
Operating income (loss) 1,469 (437) 681 66 328 2,107 Financial result (13,458) 240 (272) (204) 16 (13,678) Results on sale or disposal of investments in associates and joint ventures - - - - 55 55 Equity results in associates and joint ventures (455) (1) (17) - (352) (825) Income taxes 3,242 (73) (109) (398) (12) 2,650
Net income (loss) (9,202) (271) 283 (536) 35 (9,691)
Income (loss) attributable to noncontrolling interests (15) (33) (95) 18 (28) (153) Income (loss) attributable to Vale's stockholders (9,187) (238) 378 (554) 63 (9,538)
Sales classified by geographic area: America, except United States and Brazil 269 - 867 41 - 1,177 United States of America 28 - 684 - 22 734 Europe 1,856 35 1,254 82 - 3,227 Middle East/Africa/Oceania 859 99 115 9 - 1,082 Japan 1,171 83 417 - - 1,671 China 4,792 - 419 - - 5,211 Asia, except Japan and China 877 172 816 29 - 1,894 Brazil 1,326 30 385 1,201 89 3,031
Net operating revenue 11,178 419 4,957 1,362 111 18,027
(A free translation of the original in Portuguese)
16
4. Relevant event – Dam failure at Samarco Mineração S.A. (“Samarco”) On November 5, 2015, Samarco experienced the failure of an iron ore tailings dam (Fundão) in the state of Minas Gerais - Brazil, which affected communities and ecosystems, including the Rio Doce river. Following the dam failure, the state government of Minas Gerais ordered the suspension of Samarco’s operations. Samarco and its shareholders, Vale and BHP Billiton Brasil Ltda. (“BHPB”), entered into a settlement agreement on March 2, 2016 with the federal Attorney General of Brazil, the two Brazilian states affected by the failure (Espírito Santo and Minas Gerais) and certain other parties. The settlement agreement, which includes no admission of civil, criminal or administrative liability for the Fundão dam failure, is expected to resolve the lawsuit brought in Brazilian courts by several Brazilian governmental authorities. The settlement agreement is already effective, though the resolution of claims pursuant to the agreement remains subject to judicial approval. There is no assurance as to whether and when the court will approve the resolution of claims. The term of the agreement is 15 years, renewable for successive one-year periods until all obligations under the agreement have been performed. Under the settlement agreement, Samarco, Vale and BHPB will establish a foundation to develop and implement remediation programs to restore the environment, local communities and the social condition of the affected areas, as well as compensation programs. Samarco has agreed to provide funding to the foundation in the amount of R$2.0 billion in 2016, R$1.2 billion in 2017 and R$1.2 billion in 2018. Amounts that Samarco has already spent on remediation and compensation will be applied towards its funding obligations. From 2019 to 2021, Samarco has agreed to provide funding based on the amounts needed to complete remaining remediation and compensation projects, subject to an annual minimum of R$800 and an annual maximum of R$1.6 billion. The foundation will allocate an annual amount of R$240 over 15 years to the implementation of compensation programs, and these annual amounts are included in the annual contributions described above for the first six years. Through the end of 2018, the foundation will also set aside R$500 for basic sanitation in the affected areas. To comply with the settlement agreement, Samarco will continue to conduct and fund the humanitarian and environmental recovery and compensation works until the foundation is operational, which is likely to occur before the end of 2016. Samarco is currently unable to conduct ordinary mining and processing. Samarco’s management is working on a plan that would permit it to resume operations, but the feasibility, timing and scope of restarting remain uncertain. To the extent of Samarco does not meet its funding obligations in the foundation, each of Vale and BHPB is liable, under the terms of the agreement, to provide funds to the foundation in proportion to its 50% interest in Samarco. Samarco and its shareholders expect that Samarco will be able to generate all or a substantial part of the funding required under the arrangement. Therefore Samarco´s future cash flow projections require the use of critical estimates and assumptions in their preparation including but not limited to: (i) Judicial approval of the agreement; (ii) the release of certain escrow accounts in connection with judicial proceedings in progress; (iii) the resumption of operations within a reasonable period of time (iv) and the management of debt held by Samarco with financial institutions and bond holders. Until new facts and circumstances are available and the referred uncertainties are reduced, it is not possible to estimate or reliably measure whether Vale will be required to provide the contributions to Samarco to comply with the agreement or to provide guarantees of its other obligations. Therefore, no provision was recognized in the Company´s interim financial statements as of March 31, 2016. In addition, Samarco and its shareholders are named as a defendant in several other lawsuits brought by individuals, corporations and governmental entities seeking damages for personal injury, wrongful death, commercial or economic injury, breach of contract and violations of statutes. Because these pending lawsuits are at the very early stages, it is not possible to determine a range of outcomes or reliable estimates of the potential exposure at this time. Therefore, no provision has been recognized and no contingent liability has been quantified. The Company will reassess each reporting period the key assumptions used in Samarco´s cash flow and any impact identified and related to this matter will be reflect in its financial statements.

(A free translation of the original in Portuguese)
17
5. Assets held for sale a) Coal - Nacala logistic corridor (“Nacala”)
As at March 31, 2016 and December 31, 2015, assets held for sale refers to Nacala logistic corridor (“Nacala”). In December 2014, the Company signed an agreement with Mitsui & Co., Ltd. (“Mitsui”) to sell 50% of its stake of 70% in the Nacala corridor. Nacala is a combination of railroad and port concessions under construction located in Mozambique and Malawi. After completion of the transaction, Vale will share control of Nacala with Mitsui and therefore will not consolidate the assets, liabilities and results of those entities. The assets and liabilities were classified as assets held for sale with no impact in the income statement. As at March 2016, completion of the transaction remains dependent upon certain conditions. The Company remains committed to its plan to sell its 50% interest. March 31, 2016 December 31, 2015
Assets held for sale Accounts receivable 30 13 Other current assets 431 522 Property, plant and equipment and Intangible, net 14,099 15,257
Total assets 14,560 15,792
Liabilities associated with assets held for sale Suppliers and contractors 295 365 Other current liabilities 41 51
Total liabilities 336 416
Net assets held for sale 14,224 15,376
6. Acquisitions and divestitures 2016
Minas da Serra Geral S.A. ("MSG") – In March 2016, the Company completed the purchase option on additional 50% participation
at MSG which was owned by JFE Steel Corporation ("JFE") in the amount of R$65. Vale now holds 100% of MSG’s total stockholder’s equity.
2015
Energy generation assets - In December 2013, the Company signed agreements with CEMIG Geração e Transmissão S.A. (“CEMIG GT”) to incorporate two joint ventures, Aliança Norte Participações S.A. and Aliança Geração de Energia S.A and exchange of assets and shares. The transaction was completed in the first quarter of 2015, in which Vale received cash proceeds of R$306 and recognized a gain of R$55 as result on sale or disposal of investments in associates and joint ventures and a gain of R$546 as results on measurement or sales of non-current assets.
7. Cash and cash equivalents Consolidated
March 31, 2016 December 31, 2015
Cash and bank deposits 9,332 7,881 Short-term investments 4,129 6,141
13,461 14,022
Cash and cash equivalents includes cash, immediately redeemable deposits and short-term investments with an insignificant risk of change in value. They are readily convertible to cash, part in R$, indexed to the Brazilian Interbank Interest rate (“DI Rate”or”CDI”) and part denominated in US$, mainly time deposits.

(A free translation of the original in Portuguese)
18
8. Accounts receivable Consolidated
March 31, 2016 December 31, 2015
Trade receivables 9,302 5,988 Provision for doubtful debts (214) (225)
9,088 5,763
Trade receivables related to the steel sector - % 76.25% 75.32% Consolidated
Three-month period ended March 31
2016 2015
Provision for doubtful debts recorded in the income statement - - Trade receivables write-offs recorded in the income statement (1) -
Trade receivables by segments are presented in note 3(b). No individual customer represents over 10% of receivables or revenues.
9. Inventories Consolidated
March 31, 2016 December 31, 2015
Product inventory 9,871 9,968 Consumable inventory 3,656 3,807
Total 13,527 13,775
Product inventory is stated net of provisions, as follows:
Consolidated
March 31, 2016 December 31, 2015
Product inventory, gross amount 11,445 11,991 Iron ore (72) (72) Coal (1,262) (1,652) Manganese (17) (16) Nickel (193) (275) Phosphate (30) (8)
Total 9,871 9,968
Product inventories by segments are presented in note 3(b).

(A free translation of the original in Portuguese)
19
10. Investments in associates and joint ventures Changes in investments in associates and joint ventures are as follows: Consolidated
Three-month period ended March 31
2016 2015
Balance at beginning of the period 11,481 10,978
Acquisitions (i) - 1,819 Additions 334 30 Translation adjustment (159) 326 Equity results on income statement 589 (825) Equity results on statement of comprehensive income - (7) Dividends declared (108) (76) Transfer to held for sale (15) Others (46) -
Balance at end of the period 12,091 12,230
(i) Refers to Aliança Geração transaction, see note 6.
In April 2016 (subsequent events), the Company announced the sale of its 26.87% interest at Thyssenkrupp Companhia Siderúrgica do Atlântico Ltd for a symbolic amount. The transaction will result in R$339 loss on recycling the “Cumulative translation adjustments”. The Company indirectly holds a 4.6 % interest in Norte Energia S.A. (through Aliança Norte Energia Participações S.A.), and the Company’s investment and equity results as of March 31, 2016, are respectively R$390 and R$(6). The independent auditor's opinion on the Norte Energia financial statements for the year ended December 31, 2015, was qualified due to an investigation related to possible breaches of law and regulation that had not been completed when the mentioned the opinion was issued. Vale believes that the auditor’s qualification has no quantitative or qualitative impact on its interim financial information as of March 31, 2016.
11. Intangibles Changes in intangibles are as follows: Consolidated
Goodwill (i) Concessions (ii) Right of use (ii) Software (ii) Total
Balance at December 31, 2015 11,544 7,084 811 1,350 20,789
Additions - 1,421 3 6 1,430 Disposals - (2) - (1) (3) Amortization - (125) (4) (145) (274) Translation adjustment (530) - (15) (6) (551) Transfers - - (263) 288 25
Balance at March 31, 2016 11,014 8,378 532 1,492 21,416
Cost 11,014 11,526 910 4,948 28,398 Accumulated amortization - (3,148) (378) (3,456) (6,982)
11,014 8,378 532 1,492 21,416
Consolidated
Goodwill (i) Concessions (ii) Right of use (ii) Software (ii) Total
Balance at December 31, 2014 9,987 5,876 789 1,462 18,114
Additions - 349 - 213 562 Disposals - (37) - - (37) Amortization - (119) (30) (125) (274) Translation adjustment 801 - 65 - 866 Acquisition of subsidiary 101 - - - 101
Balance at March 31, 2015 10,889 6,069 824 1,550 19,332
Cost 10,889 9,382 1,494 3,815 25,580 Accumulated amortization - (3,313) (670) (2,265) (6,248)
10,889 6,069 824 1,550 19,332
(i) Indefinite useful life. (ii) Finite useful life.

(A free translation of the original in Portuguese)
20
12. Property, plant and equipment Changes in property, plant and equipment are as follows: Consolidated
Land Building Facilities Equipment Mineral
properties Others Constructions
in progress Total
Balance at December 31, 2015 2,989 35,538 32,378 28,532 40,234 28,135 43,453 211,259
Additions (i) - - - - - - 3,406 3,406 Disposals - (2) (1) (40) (11) (33) (5) (92) Depreciation and amortization - (443) (547) (834) (690) (548) - (3,062) Translation adjustment (53) (955) (1,009) (1,205) (1,121) (474) (669) (5,486) Assets retirement obligations - - - - 147 - - 147 Transfers (14) 887 186 895 367 126 (2,472) (25) Acquisition of subsidiary - 1 - - - - - 1
Balance at March 31, 2016 2,922 35,026 31,007 27,348 38,926 27,206 43,713 206,148
Cost 2,922 52,510 50,074 46,722 65,023 40,179 43,713 301,143 Accumulated depreciation - (17,484) (19,067) (19,374) (26,097) (12,973) - (94,995)
2,922 35,026 31,007 27,348 38,926 27,206 43,713 206,148
Consolidated
Land Building Facilities Equipment Mineral
properties Others Constructions
in progress Total
Balance at December 31, 2014 2,839 30,955 28,721 24,669 39,654 29,095 51,574 207,507
Additions (i) - - - - - - 6,019 6,019 Disposals - (14) (3) (14) (434) (18) (5) (488) Depreciation and amortization - (387) (596) (883) (624) (568) - (3,058) Translation adjustment 93 1,667 1,162 2,331 3,378 2,028 2,667 13,326 Transfers 28 4,166 2,221 2,658 (1,312) 1,166 (8,927) - Acquisition of subsidiary - - - 1 - 316 - 317
Balance at March 31, 2015 2,960 36,387 31,505 28,762 40,662 32,019 51,328 223,623
Cost 2,960 44,164 46,956 43,983 58,668 44,433 51,328 292,492 Accumulated depreciation - (7,777) (15,451) (15,221) (18,006) (12,414) - (68,869)
2,960 36,387 31,505 28,762 40,662 32,019 51,328 223,623
(i) Includes capitalized borrowing costs, see cash flow.
There are no material changes to the net book value of consolidated property, plant and equipment pledged to secure judicial claims and loans and borrowings (note 13(d)) compared to those disclosed in the financial statements as at December 31, 2015.
13. Loans and borrowings a) Total debt Consolidated
Current liabilities Non-current liabilities
March 31, 2016 December 31, 2015 March 31, 2016 December 31, 2015
Debt contracts in the international markets Floating rates in: US$ 859 943 28,795 20,203 Fixed rates in: US$ 6,858 4,651 40,628 50,463 EUR - - 6,081 6,376 Other currencies 59 56 638 659 Accrued charges 775 1,274 - -
8,551 6,924 76,142 77,701
Debt contracts in Brazil Floating rates in: R$, indexed to TJLP, TR, IPCA, IGP-M and CDI 830 827 18,274 18,388 Basket of currencies and US$ indexed to LIBOR 1,114 1,133 4,497 5,239 Fixed rates in: R$ 248 246 985 1,047 Accrued charges 841 658 515 503
3,033 2,864 24,271 25,177
11,584 9,788 100,413 102,878

(A free translation of the original in Portuguese)
21
The future flows of debt payments (principal and interest) per nature of funding are as follows: Consolidated
Bank loans (i)
Capital markets (i)
Development agencies (i)
Debt principal (i)
Estimated future
payments of interest(ii)
2016 2,214 - 1,274 3,488 5,538 2017 3,395 4,313 3,861 11,569 5,627 2018 3,566 3,039 10,890 17,495 5,089 2019 4,196 3,559 2,484 10,239 4,377 2020 2,794 4,659 12,221 19,674 3,861 2021 2,701 299 1,413 4,413 3,274 Between 2022 and 2025 3,370 11,865 3,879 19,114 8,499 2026 onwards 488 23,083 303 23,874 20,667
22,724 50,817 36,325 109,866 56,932
(i) Does not include accrued charges. (ii) Consists of estimated future payments of interest, calculated based on interest rate curves and foreign exchange rates applicable as at March 31, 2016 and considering that all amortization payments and payments at maturity on loans and borrowings will be made on their contracted payments dates. The amount includes the estimated values of future interest payments (not yet accrued), in addition to interest already recognized in the financial statements.
At March 31, 2016, the average annual interest rates by currency are as follows: Consolidated
Loans and borrowings in Average interest rate (i) Total debt
US$ 4.20% 83,523 R$ (ii) 9.96% 21,662 EUR (iii) 4.06% 6,114 Other currencies 6.14% 698
111,997
(i) In order to determine the average interest rate for debt contracts with floating rates, the Company used the last renegotiated rate at March 31, 2016. (ii) R$ denominated debt that bears interest at IPCA, CDI, TR or TJLP, plus spread. For a total of R$15,036, the Company entered into derivative transactions to mitigate the exposure to the cash flow variations of the floating rate debt denominated in R$, resulting in an average cost of 2.21% per year in US$. (iii) Eurobonds, for which the Company entered into derivatives to mitigate the exposure to the cash flow variations of the debt denominated in EUR, resulting in an average cost of 4.29% per year in US$.
b) Credit and financing lines Available amount
Type
Contractual currency Date of agreement
Period of the agreement Total amount March 31, 2016
Credit lines Revolving credit facilities US$ May 2015 5 years 10,677 4,271 Revolving credit facilities US$ July 2013 5 years 7,118 2,847 Financing lines BNDES (i) R$ April 2008 10 years 7,300 1,751 BNDES - CLN 150 R$ September 2012 10 years 3,883 21 BNDES - S11D e S11D Logística R$ May 2014 10 years 6,163 2,847
(i) Memorandum of understanding signature date, however term is considered from the signature date of each contract amendment. This credit line supported or supports the Usina VIII, Onça Puma, Salobo I and II and capital expenditure of Itabira projects.
c) Funding In January 2016, the Company drew down on R$12,065 (US$3,000) of its revolving credit facilities. The amount of R$7,239 (US$1,800) was drew down on by Vale International S.A. and R$4,826 (US$1,200) by the Parent Company.
d) Guarantees
As at March 31, 2016 and December 31, 2015, loans and borrowings are secured by property, plant and equipment and receivables in the amount of R$1,804 and R$1,937, respectively. The securities issued through Vale’s 100%-owned finance subsidiary Vale Overseas Limited are fully and unconditionally guaranteed by Vale.

(A free translation of the original in Portuguese)
22
e) Covenants Some of the Company’s debt agreements with lenders contain financial covenants. The main covenants in those agreements require maintaining certain ratios, such as debt to EBITDA (Earnings before Interest Taxes, Depreciation and Amortization) and interest coverage. The Company has not identified any instances of noncompliance as at March 31, 2016 and December 31, 2015.
14. Litigation a) Provision for litigation Vale is party to labor, civil, tax and other ongoing lawsuits, at administrative and court levels. Provisions for losses resulting from lawsuits are estimated and updated by the Company, based on analysis from the Company’s legal consultants. Changes in provision for litigation are as follows: Consolidated
Tax litigation Civil litigation Labor litigation
Environmental litigation
Total of litigation provision
Balance at December 31, 2015 1,052 309 1,771 78 3,210
Additions 12 47 175 7 241 Reversals (30) (15) (66) (8) (119) Payments (268) (70) (89) - (427) Indexation and interest 23 94 13 4 134 Translation adjustment (13) - 2 1 (10)
Balance at March 31, 2016 776 365 1,806 82 3,029
Consolidated
Tax litigation Civil litigation Labor litigation
Environmental litigation
Total of litigation provision
Balance at December 31, 2014 1,088 311 1,876 130 3,405
Additions 402 47 101 - 550 Reversals (496) (33) (74) - (603) Payments (9) 7 (13) (35) (50) Indexation and interest (56) 34 20 (7) (9) Translation adjustment 51 1 - 141 193
Balance at March 31, 2015 980 367 1,910 229 3,486
b) Contingent liabilities Contingent liabilities consist of administrative and judicial claims, which expectation of loss is classified as possible, and for which the recognition of a provision is not considered necessary by the Company, based on legal support. Consolidated
March 31, 2016 December 31, 2015
Tax litigation 22,768 20,796 Civil litigation 5,689 5,214 Labor litigation 6,434 7,288 Environmental litigation 5,682 5,393
Total 40,573 38,691
i - Tax litigation - The most significant claims relate to pending challenges by the Brazilian federal tax authority concerning the deductibility of Brazilian social contribution payments for income tax purposes and demands by Brazilian state tax authorities for additional payments of the value-added tax on services and circulation of goods (“ICMS”) in relation to the use of ICMS credits from sales and energy transmission. The change in the period is basically a new tax enforcement on services and circulation of goods (“ICMS”) and Tax on services of any nature ("ISS). ii - Civil litigation - Most of these claim have been filed by suppliers for indemnification under construction contracts, primarily relating to certain alleged damages, payments and contractual penalties. A number of other claims involve disputed contractual terms for inflation indexation. iii - Labor litigation - These line represent a very large number of individual claims by (i) employees and service providers, primarily involving demands for additional compensation for overtime work, time spent commuting or health and safety conditions; and (ii) the Brazilian federal social security administration (“INSS”) regarding contributions on compensation programs based on profits.

(A free translation of the original in Portuguese)
23
iv - Environmental litigation - The most significant claims concern alleged procedural deficiencies in licensing processes, non-compliance with existing environmental licenses or damage to the environment. c) Judicial deposits In addition to the provisions and contingent liabilities, the Company is required by law to make judicial deposits to secure a potential adverse outcome of certain lawsuits. These court-ordered deposits are monetarily adjusted and reported as non-current assets until a judicial decision to draw the deposit occurs. Consolidated
March 31, 2016 December 31, 2015
Tax litigation 854 822 Civil litigation 354 399 Labor litigation 2,230 2,163 Environmental litigation 64 61
Total 3,502 3,445
d) Others i - Samarco - Vale S.A. and certain of its officers have been named as defendants in putative securities class action suits in federal court in New York brought by holders of Vale’s securities under U.S. federal securities laws. The lawsuits allege that Vale made false and misleading statements or omitted to make disclosures concerning the risks and dangers of the operations of Samarco's Fundão dam and the adequacy of related programs and security procedures. The plaintiffs have not specified an amount of alleged damages in these actions. Vale intends to vigorously defend these actions and mount a full defense against the allegations, considering they do not represent true facts and therefore lack legal foundation. The litigation is at a very early stage. On March 7, 2016, the judge overseeing the putative securities class actions issued an order consolidating these actions and designating lead plaintiffs and counsel. The judge has given lead plaintiffs until April 29, 2016 to file a consolidated amended complaint that will serve as the operative complaint in the litigation. As a consequence of the preliminary nature of these suits, it is not possible to determine a range of outcomes or reliable estimates of the potential exposure at this time, and no provision has been recognized. ii - Compulsory Deposits - In the third quarter of 2015, the Company filed an enforceable action in the amount of R$524 referring to the final court decision in favor of the Company of the accrued interest of compulsory deposits from 1987 to 1993. Currently it is not possible to estimate the economic benefit inflow as the counterparty can appeal on the calculation. Consequently, the asset was not recognized in the financial statements.
15. Income taxes a) Deferred income tax
Changes in deferred tax are as follows: Consolidated
Assets Liabilities Total
Balance at December 31, 2015 30,867 6,520 24,347
Effect in income statement (2,288) (177) (2,111) Translation adjustment (1,092) (154) (938) Transfers between asset and liabilities 350 350 - Other comprehensive income (520) (72) (448)
Balance at March 31, 2016 27,317 6,467 20,850
Consolidated
Assets Liabilities Total
Balance at December 31, 2014 10,560 8,874 1,686
Effect in income statement 2,828 (22) 2,850 Translation adjustment 676 1,244 (568) Acquisition of subsidiary (31) - (31) Other comprehensive income 3 (154) 157
Balance at March 31, 2015 14,036 9,942 4,094

(A free translation of the original in Portuguese)
24
b) Income tax reconciliation The total amount presented as income taxes in the income statement is reconciled to the rate established by law, as follows: Consolidated
Three-month period ended March 31
2016 2015
Net income (loss) before income taxes 9,731 (12,341) Income taxes at statutory rates ‐ 34% (3,309) 4,196 Adjustments that affect the basis of taxes: Income tax benefit from interest on stockholders' equity - 545 Equity results 214 (281) Additions of tax loss carry forward 209 - Unrecognized tax losses of the period (723) (1,191) Others 206 (619)
Income taxes (3,403) 2,650
c) Income taxes - Settlement program (“REFIS”) In 2013, the Company elected to participate in the REFIS, a federal tax settlement program, to settle most of the claims related to the collection of income tax and social contribution on equity gains of foreign subsidiaries and affiliates from 2003 to 2012. At March 31, 2016, the balance of R$17,406 (R$1,383 as current and R$16,023 as non-current) is due in 151 remaining monthly installments, bearing interest at the SELIC rate.
16. Employee benefits obligations Reconciliation of assets and liabilities recognized in the balance sheet Total
Consolidated
March 31, 2016 December 31, 2015
Overfunded
pension plans Underfunded pension plans
Others benefits
Overfunded pension plans
Underfunded pension plans
Others benefits
Balance at beginning of the period 3,754 - - 3,455 - -
Interest income 128 - - 427 - - Changes in asset ceiling and onerous liability 882 - - (128) - -
Balance at end of the period 4,764 - - 3,754 - -
Amount recognized in the balance sheet Present value of actuarial liabilities (9,758) (13,987) (4,676) (9,659) (14,407) (4,773) Fair value of assets 14,522 11,447 - 13,413 12,083 - Effect of the asset ceiling (4,764) - - (3,754) - -
Liabilities - (2,540) (4,676) - (2,324) (4,773)
Current liabilities - (70) (183) - (67) (199) Non-current liabilities - (2,470) (4,493) - (2,257) (4,574)
Liabilities - (2,540) (4,676) - (2,324) (4,773)

(A free translation of the original in Portuguese)
25
17. Financial instruments classification Consolidated
March 31, 2016 December 31, 2015
Financial assets Loans and
receivables or amortized cost
At fair value through net
income Total
Loans and receivables or
amortized cost
At fair value through net
income
Derivatives designated as
hedge accounting Total
Current Cash and cash equivalents 13,461 - 13,461 14,022 - - 14,022 Financial investments 97 - 97 109 - - 109 Derivative financial instruments - 500 500 - 474 - 474 Accounts receivable 9,088 - 9,088 5,763 - - 5,763 Related parties 356 - 356 273 - - 273
23,002 500 23,502 20,167 474 - 20,641
Non-current Derivative financial instruments - 605 605 - 363 - 363 Loans 691 - 691 732 - - 732 Related parties - - - 5 - - 5
691 605 1,296 737 363 - 1,100
Total of financial assets 23,693 1,105 24,798 20,904 837 - 21,741
Financial liabilities Current Suppliers and contractors 11,200 - 11,200 13,140 - - 13,140 Derivative financial instruments - 5,798 5,798 - 7,909 198 8,107 Loans and borrowings 11,584 - 11,584 9,788 - - 9,788 Related parties 2,604 - 2,604 1,856 - - 1,856
25,388 5,798 31,186 24,784 7,909 198 32,891
Non-current Derivative financial instruments - 4,359 4,359 - 5,581 - 5,581 Loans and borrowings 100,413 - 100,413 102,878 - - 102,878 Related parties 438 - 438 830 - - 830 Participative stockholders' debentures - 1,787 1,787 - 1,336 - 1,336 Others (i) - 599 599 - 551 - 551
100,851 6,745 107,596 103,708 7,468 - 111,176
Total of financial liabilities 126,239 12,543 138,782 128,492 15,377 198 144,067
(i) See note 18(a).
18. Fair value estimate a) Assets and liabilities measured and recognized at fair value: Consolidated
March 31, 2016 December 31, 2015
Level 2 Level 3 Total Level 2 Level 3 Total
Financial assets Derivative financial instruments 1,105 - 1,105 837 - 837
Total 1,105 - 1,105 837 - 837
Financial liabilities Derivative financial instruments 10,157 - 10,157 13,688 - 13,688 Participative stockholders' debentures 1,787 - 1,787 1,336 - 1,336 Others (minimum return instrument) - 599 599 - 551 551
Total 11,944 599 12,543 15,024 551 15,575
There are no changes in the methods and techniques of evaluation of instruments disclosed above in the financial statements as at December 31, 2015. b) Fair value of financial instruments not measured at fair value The fair values and carrying amounts of loans (net of interest) are as follows: Consolidated
Financial liabilities Balance Fair value Level 1 Level 2
March 31, 2016 Debt principal 109,866 101,444 43,831 57,613 December 31, 2015 Debt principal 110,231 102,434 48,017 54,417
(A free translation of the original in Portuguese)
26
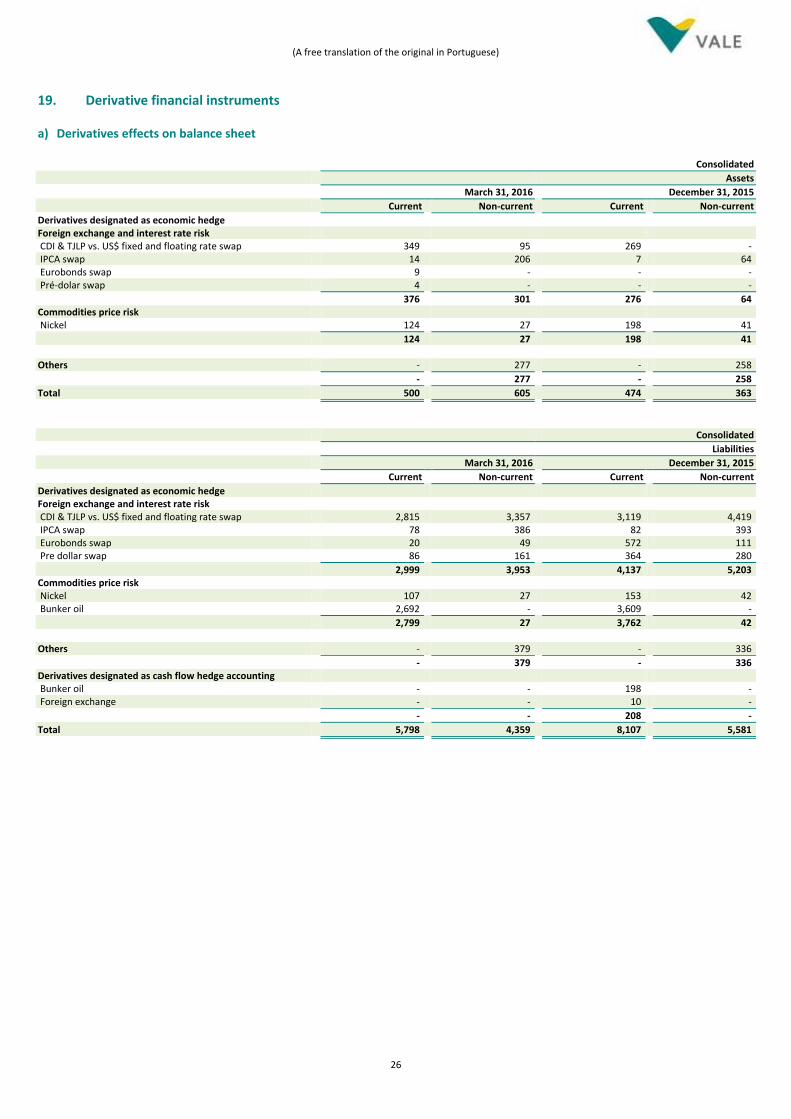
19. Derivative financial instruments a) Derivatives effects on balance sheet Consolidated
Assets
March 31, 2016 December 31, 2015
Current Non-current Current Non-current
Derivatives designated as economic hedge Foreign exchange and interest rate risk CDI & TJLP vs. US$ fixed and floating rate swap 349 95 269 - IPCA swap 14 206 7 64 Eurobonds swap 9 - - - Pré-dolar swap 4 - - -
376 301 276 64 Commodities price risk Nickel 124 27 198 41
124 27 198 41 Others - 277 - 258
- 277 - 258
Total 500 605 474 363
Consolidated
Liabilities
March 31, 2016 December 31, 2015
Current Non-current Current Non-current
Derivatives designated as economic hedge Foreign exchange and interest rate risk CDI & TJLP vs. US$ fixed and floating rate swap 2,815 3,357 3,119 4,419 IPCA swap 78 386 82 393 Eurobonds swap 20 49 572 111 Pre dollar swap 86 161 364 280
2,999 3,953 4,137 5,203 Commodities price risk Nickel 107 27 153 42 Bunker oil 2,692 - 3,609 -
2,799 27 3,762 42 Others - 379 - 336
- 379 - 336 Derivatives designated as cash flow hedge accounting Bunker oil - - 198 - Foreign exchange - - 10 -
- - 208 -
Total 5,798 4,359 8,107 5,581

(A free translation of the original in Portuguese)
27
b) Effects of derivatives on the income statement, cash flow and other comprehensive income Consolidated
Three-month period ended March 31
Gain (loss) recognized in the
income statement Financial settlement
inflows (outflows) Gain (loss) recognized in other
comprehensive income
2016 2015 2016 2015 2016 2015
Derivatives designated as economic hedge Foreign exchange and interest rate risk CDI & TJLP vs. US$ fixed and floating rate swap 1,312 (2,893) (175) (915) - - IPCA swap 140 (224) 5 11 - - Eurobonds swap 49 (426) (524) - - Pre dollar swap 107 (272) (295) (6) - -
1,608 (3,815) (989) (910) - - Commodities price risk Nickel (94) (23) (69) (46) - - Bunker oil (60) (151) (705) (412) - -
(154) (174) (774) (458) - - Others (18) (18) - - - -
(18) (18) - - - - Derivatives designated as cash flow hedge accounting Bunker oil - (343) (203) (376) - 308 Foreign exchange (10) (41) (10) (41) 8 (1)
(10) (384) (213) (417) 8 307
Total 1,426 (4,391) (1,976) (1,785) 8 307
Related to the effects of derivatives in the Income statements, the Company recognized as costs of goods sold and financial results the amounts of R$343 and R$4,048, respectively, for the 1st quarter of 2015. In 2016, all derivatives impacts were charged to financial results. The maturities dates of the derivative financial instruments are as follows: Maturity dates
Currencies and interest rates July 2023 Bunker oil December 2016 Nickel June 2018 Others December 2027
Additional information about derivatives financial instruments The risk of the derivatives portfolio is measured using the delta-Normal parametric approach, and considers that the future distribution of the risk factors and its correlations tends to present the same statistic properties verified in the historical data. The value at risk estimate considers a 95% confidence level for a one-business day time horizon. There was no cash amount deposited as margin call regarding derivative positions on March 31, 2016. The derivative positions described in this document did not have initial costs associated. The following tables detail the derivatives positions for Vale and its controlled companies as of March 31, 2016, with the following information: notional amount, fair value including credit risk, gains or losses in the period, value at risk and the fair value breakdown by year of maturity. a) Foreign exchange and interest rates derivative positions (i) Protection programs for the R$ denominated debt instruments In order to reduce cash flow volatility, swap transactions were implemented to convert into US$ the cash flows from certain debt instruments denominated in R$ with interest rates linked mainly to CDI, TJLP and IPCA. In those swaps, Vale pays fixed or floating rates in US$ and receives payments in R$ linked to the interest rates of the protected debt instruments.

(A free translation of the original in Portuguese)
28
The swap transactions were negotiated over-the-counter and the protected items are the cash flows from debt instruments linked to R$. These programs transform into US$ the obligations linked to R$ to achieve a currency offset in the Company’s cash flows, by matching its receivables - mainly linked to US$ - with its payables.
(ii) Protection program for EUR denominated debt instruments In order to reduce the cash flow volatility, swap and forward transactions were implemented to convert into US$ the cash flows from certain debt instruments issued in Euros by Vale. In those swaps, Vale receives fixed rates in EUR and pays fixed rates in US$. And in those forwards only the principal amount of the debt is converted from EUR to US$. The swap and forward transactions were negotiated over-the-counter and the protected items are the cash flows from debt instruments linked to EUR. The financial settlement inflows/outflows are offset by the protected items’ losses/gains due to EUR/US$ exchange rate.
(iii) Foreign exchange hedging program for disbursements in CAD In order to reduce the cash flow volatility, forward transactions were implemented to mitigate the foreign exchange exposure that arises from the currency mismatch between revenues denominated in US$ and disbursements denominated in CAD. The forward transactions were negotiated over-the-counter and the protected item is part of the CAD denominated disbursements. The financial settlement inflows/outflows are offset by the protected items’ losses/gains due to CAD/US$ exchange rate. This program is classified under the hedge accounting requirements, and it was settled in this quarter.
Financial settlement
Inflows (Outflows) Value at Risk
Flow March 31, 2016 December 31, 2015 Index Average rate March 31, 2016 December 31, 2015 March 31, 2016 March 31, 2016 2016 2017 2018 2019+
CDI vs. US$ fixed rate swap (2,423) (3,059) (295) 154 (1,566) (111) (746) -
Receivable R$ 5,739 R$ 5,239 CDI 107.57%
Payable US$ 2,399 US$ 2,288 Fix 3.46%
TJLP vs. US$ fixed rate swap (3,101) (3,965) (253) 253 (572) (899) (444) (1,187)
Receivable R$ 5,180 R$ 5,484 TJLP + 1.31%
Payable US$ 2,486 US$ 2,611 Fix 1.69%
TJLP vs. US$ floating rate swap (204) (245) (2) 16 (9) (15) (18) (161)
Receivable R$ 32 R$ 267 TJLP + 0.92%
Payable US$ 155 US$ 156 Libor + -1.21%
R$ fixed rate vs. US$ fixed rate swap (243) (644) 81 75 (76) (25) 23 (164)
Receivable R$ 1,139 R$ 1,356 Fix 7.32%
Payable US$ 398 US$ 528 Fix -0.83%
IPCA vs. US$ fixed rate swap (299) (411) 5 39 - 12 8 (319)
Receivable R$ 1,000 R$ 1,000 IPCA + 6.55%
Payable US$ 434 US$ 434 Fix 3.98%
IPCA vs. CDI swap 55 6 - 1 (76) (58) (45) 235
Receivable R$ 1,350 R$ 1,350 IPCA + 6.62%
Payable US$ 1,350 US$ 1,350 CDI 98.58%
Fair value by yearNotional Fair value
Financial settlement
Inflows (Outflows) Value at Risk
Flow March 31, 2016 December 31, 2015 Index Average rate March 31, 2016 December 31, 2015 March 31, 2016 March 31, 2016 2016 2017 2018 2019+
EUR fixed rate vs. US$ fixed rate swap (69) (683) (524) 64 - (17) (15) (37)
Receivable € 500 € 1,000 Fix 3.75%
Payable US$ 613 US$ 1,302 Fix 4.29%
Financial settlement
Inflows (Outflows) Value at Risk
Flow March 31, 2016 December 31, 2015
Bought /
Sold
Average rate
(USD/EUR) March 31, 2016 December 31, 2015 March 31, 2016 March 31, 2016 2016 2017
Forward € 500 - B 1.143 9 - - 22.9 - 9
Fair value by year
Notional Fair value Fair value by year
Notional Fair value
Financial settlement
Inflows (Outflows) Value at Risk
Fair value
by year
Flow March 31, 2016 December 31, 2015
Bought /
Sold
Average rate
(CAD / USD) March 31, 2016 December 31, 2015 March 31, 2016 March 31, 2016 2016
Forward - CAD 10 B 1.028 - (10) - - -
Notional Fair value

(A free translation of the original in Portuguese)
29
b) Commodities derivative positions (i) Bunker Oil purchase cash flows protection program In order to reduce the impact of bunker oil price fluctuation on maritime freight hiring/supply and, consequently, reducing the company’s cash flow volatility, bunker oil derivatives were implemented. These transactions are usually executed through forward purchases and zero cost-collars. The derivative transactions were negotiated over-the-counter and the protected item is part of the Vale’s costs linked to bunker oil prices. The financial settlement inflows/outflows are offset by the protected items’ losses/gains due to bunker oil prices changes.
As at March 31, 2016 and December 31, 2015, excludes R$400 and R$397, respectively, of transactions in which the financial settlement occurs subsequently of the closing month. (ii) Protection programs for base metals raw materials and products
In the operational protection program for nickel sales at fixed prices, derivatives transactions were implemented to convert into floating prices the contracts with clients that required a fixed price, in order to keep nickel revenues exposed to nickel price fluctuations. Those operations are usually implemented through the purchase of nickel forwards, which are unwound before the original maturity in order to match the settlement dates of the commercial contracts in which the prices were fixed. In the operational protection program for the purchase of raw materials and products, derivatives transactions were implemented, usually through the sale of nickel and copper forward or futures, in order to reduce the mismatch between the pricing period of purchases (concentrate, cathode, sinter, scrap and others) and the pricing period of the final product sales to the clients. The derivative transactions are negotiated at London Metal Exchange or over-the-counter and the protected item is part of Vale’s revenues and costs linked to nickel and copper prices. The financial settlement inflows/outflows are offset by the protected items’ losses/gains due to nickel and copper prices changes.
Financial Settlement
Inflows (Outflows) Value at Risk
Fair value
by year
Flow March 31, 2016 December 31, 2015
Bought /
Sold
Average strike
(US$/ton) March 31, 2016 December 31, 2015 March 31, 2016 March 31, 2016 2016
Bunker Oil protection
Forwards 1,410,000 1,867,500 B 513 (1,586) (2,252) (577) 40 (1,586)
Call options 1,507,500 2,041,500 B 383 0.6 0.1 - 0.2 0.6
Put options 1,507,500 2,041,500 S 308 (707) (1,158) (363) 39 (707)
Total (2,292) (3,410) (2,292)
Fair valueNotional (ton)
Financial Settlement
Inflows (Outflows) Value at Risk
Flow March 31, 2016 December 31, 2015
Bought /
Sold
Average strike
(US$/ton) March 31, 2016 December 31, 2015 March 31, 2016 March 31, 2016 2016 2017 2018
Fixed prices sales protection
Nickel forwards 16,102 16,917 B 10,892 (126) (180) (70) 17 (87) (39) 0
Raw materials purchase protection
Nickel forwards 90 118 S 8,486 0.0 0.4 0.5 0.1 0.0 - -
Copper forwards 398 385 S 4,598 (0.3) 0.4 0.5 0.1 (0.3) - -
Total (0.3) 0.7 (0.3) - -
Fair value by yearNotional (ton) Fair value

(A free translation of the original in Portuguese)
30
c) Silver Wheaton Corp. warrants The company owns warrants of Silver Wheaton Corp. (SLW), a Canadian company with stocks negotiated in Toronto Stock Exchange and New York Stock Exchange. Such warrants configure American call options and were received as part of the payment regarding the sale of part of gold payable flows produced as a sub product from Salobo copper mine and some nickel mines in Sudbury.
d) Call options from debentures The company has debentures in which lenders have call options of a specified quantity of Ferrovia Norte Sul ordinary shares, later changed to VLI SA shares. The call option’s strike price is given by the debentures’ remaining notional in each exercise date.
e) Options related to Minerações Brasileiras Reunidas S.A. (“MBR”) shares The Company entered into a contract that has options related to MBR shares. Under certain restrict and contingent conditions, which are beyond the buyer’s control, the contract has a clause that gives the buyer the right to sell back its stake to the Company. It this case, the Company could settle through cash or shares. On the other hand, the Company has the right to buy back this non-controlling interest in the subsidiary.
f) Embedded derivatives in commercial contracts The Company has some nickel concentrate and raw materials purchase agreements in which there are provisions based on nickel and copper future prices behavior. These provisions are considered as embedded derivatives.
The Company has also a natural gas purchase agreement in which there´s a clause that defines that a premium can be charged if the Company’s pellet sales prices trade above a pre-defined level. This clause is considered an embedded derivative.
Financial settlement
Inflows (Outflows) Value at Risk
Fair value
by year
Flow March 31, 2016 December 31, 2015
Bought /
Sold
Average strike
(US$/share) March 31, 2016 December 31, 2015 March 31, 2016 March 31, 2016 2023
Call Options 10,000,000 10,000,000 B 65 54 28 - 6 54
Notional (quantity) Fair Value
Financial settlement
Inflows (Outflows) Value at Risk
Fair value
by year
Flow March 31, 2016 December 31, 2015
Bought /
Sold
Average strike
(US$/share) March 31, 2016 December 31, 2015 March 31, 2016 March 31, 2016 2027
Call options 140,239 140,239 S 8,570 (137) (152) - 8 (137)
Notional (quantity) Fair Value
Financial settlement
Inflows (Outflows) Value at Risk
Fair value
by year
Flow March 31, 2016 December 31, 2015
Bought /
Sold
Average strike
(US$/share) March 31, 2016 December 31, 2015 March 31, 2016 March 31, 2016 2016+
Options 2,139 2,139 B/S 1.8 (14) 57 - 25 (14)
Notional (quantity, in millions) Fair Value
Financial Settlement
Inflows (Outflows) Value at Risk
Fair value
by year
Flow March 31, 2016 December 31, 2015
Bought /
Sold
Average strike
(US$/ton) March 31, 2016 December 31, 2015 March 31, 2016 March 31, 2016 2016
Nickel Forward 5,799 3,877 S 8,543 (0.9) 11.7 (0.9)
Copper Forward 4,325 5,939 S 4,653 (1.3) 7.7 (1.3)
Total (2.2) 19.4 - 7.6 (2.2)
Notional (ton) Fair value
Financial Settlement
Inflows (Outflows) Value at Risk
Flow March 31, 2016 December 31, 2015
Bought /
Sold
Average strike
(US$/ton) March 31, 2016 December 31, 2015 March 31, 2016 March 31, 2016 2016 2017 2018+
Call options 746,667 746,667 S 179 (4.8) - - 3.1 (0.0) (0.0) (4.8)
Fair value by yearNotional (volume/month) Fair value

(A free translation of the original in Portuguese)
31
g) Sensitivity analysis of derivative financial instruments The following tables present the potential value of the instruments given hypothetical stress scenarios for the main market risk factors that impact the derivatives positions. The scenarios were defined as follows: - Scenario I: fair value calculation considering market prices as of March 31, 2016 - Scenario II: fair value estimated considering a 25% deterioration in the associated risk variables - Scenario III: fair value estimated considering a 50% deterioration in the associated risk variables
Instrument Instrument's main risk events Scenario I Scenario II Scenario III
CDI vs. US$ fixed rate swap R$ depreciation (2,424) (4,603) (6,781)
US$ interest rate inside Brazil decrease (2,424) (2,481) (2,538)
Brazilian interest rate increase (2,424) (2,435) (2,446)
Protected item: R$ denominated debt R$ depreciation n.a. - -
TJLP vs. US$ fixed rate swap R$ depreciation (3,102) (5,243) (7,384)
US$ interest rate inside Brazil decrease (3,102) (3,238) (3,382)
Brazilian interest rate increase (3,102) (3,368) (3,606)
TJLP interest rate decrease (3,102) (3,266) (3,439)
Protected item: R$ denominated debt R$ depreciation n.a. - -
TJLP vs. US$ floating rate swap R$ depreciation (204) (328) (453)
US$ interest rate inside Brazil decrease (204) (215) (228)
Brazilian interest rate increase (204) (221) (237)
TJLP interest rate decrease (204) (215) (226)
Protected item: R$ denominated debt R$ depreciation n.a. - -
R$ fixed rate vs. US$ fixed rate swap R$ depreciation (242) (603) (963)
US$ interest rate inside Brazil decrease (242) (294) (350)
Brazilian interest rate increase (242) (352) (444)
Protected item: R$ denominated debt R$ depreciation n.a. - -
IPCA vs. US$ fixed rate swap R$ depreciation (300) (710) (1,119)
US$ interest rate inside Brazil decrease (300) (332) (366)
Brazilian interest rate increase (300) (419) (522)
IPCA index decrease (300) (366) (429)
Protected item: R$ denominated debt R$ depreciation n.a. - -
IPCA vs. CDI swap Brazilian interest rate increase 55 (126) (277)
IPCA index decrease 55 (46) (141)
Protected item: R$ denominated debt linked to IPCA IPCA index decrease n.a. 46 141
EUR fixed rate vs. US$ fixed rate swap EUR depreciation (68) (699) (1,331)
Euribor increase (68) (90) (112)
US$ Libor decrease (68) (121) (177)
Protected item: EUR denominated debt EUR depreciation n.a. 699 1,331
EUR Forward EUR depreciation 9 (498) (1,005)
Euribor increase 9 6 3
US$ Libor decrease 9 5 1
Protected item: EUR denominated debt EUR depreciation n.a. 498 1,005

(A free translation of the original in Portuguese)
32
h) Financial counterparties’ ratings The transactions of derivative instruments, cash and cash equivalents as well as investments are held with financial institutions whose exposure limits are periodically reviewed and approved by the delegated authority. The financial institutions credit risk is performed through a methodology that considers, among other information, ratings provided by international rating agencies. The table below presents the ratings in foreign currency published by agencies Moody’s and S&P regarding the main financial institutions that we had outstanding positions as of March 31, 2016.
i) Market curves The curves used on the pricing of derivatives instruments were developed based on data from BM&F, Central Bank of Brazil, London Metals Exchange and Bloomberg.
Instrument Instrument's main risk events Scenario I Scenario II Scenario III
Bunker Oil protection
Forwards and options Bunker Oil price decrease (2,292) (2,748) (3,207)
Protected item: Part of costs linked to bunker oil prices Bunker Oil price decrease n.a. 2,748 3,207
Nickel sales fixed price protection
Forwards Nickel price decrease (126) (247) (369)
Protected item: Part of nickel revenues with fixed prices Nickel price fluctuation n.a. 247 369
Purchase protection program
Nickel forwards Nickel price increase 0.0 (0.7) (1.4)
Protected item: Part of costs linked to nickel prices Nickel price increase n.a. 0.7 1.4
Copper forwards Copper price increase (0.3) (2.0) (3.7)
Protected item: Part of costs linked to copper prices Copper price increase n.a. 2.0 3.7
SLW warrants SLW stock price decrease 53 23 3
VLI call options VLI stock value increase (136) (221) (306)
Options regarding non-controlling interest in subsidiary Subsidiary stock value increase 19 (169) (266)
Instrument Main risks Scenario I Scenario II Scenario III
Embedded derivatives - Raw material purchase (nickel) Nickel price increase (1) (46) (91)
Embedded derivatives - Raw material purchase (copper) Copper price increase (1) (20) (39)
Embedded derivatives - Gas purchase Pellet price increase (5) (10) (17)
Long term ratings by counterparty Moody’s S&P Long term ratings by counterparty Moody’s S&P
ANZ Australia and New Zealand Banking Aa2 AA- Caixa Economica Federal Ba3 BB
Banco Bradesco Ba3 BB Citigroup Baa1 BBB+
Banco de Credito del Peru Baa1 BBB Credit Agricole A2 A
Banco do Brasil Ba3 BB Deutsche Bank A2 BBB+
Banco do Nordeste Ba3 BB Goldman Sachs A3 BBB+
Banco Safra Ba3 BB HSBC A1 A
Banco Santander Ba3 BB Intesa Sanpaolo Spa A3 BBB-
Banco Votorantim Ba3 BB Itau Unibanco Ba3 BB
Bank of America Baa1 BBB+ JP Morgan Chase & Co A3 A-
Bank of Nova Scotia Aa3 A+ Macquarie Group Ltd A3 BBB
Bank of Tokyo Mitsubishi UFJ A1 A Morgan Stanley A3 BBB+
Banpara Ba3 BB- National Australia Bank NAB Aa2 AA-
Barclays Baa3 BBB Royal Bank of Canada Aa3 AA-
BBVA A3 BBB+ Societe Generale A2 A
BNP Paribas A1 A Standard Bank Group Baa3 -
BTG Pactual Ba3 B+ Standard Chartered A1 BBB+

(A free translation of the original in Portuguese)
33
(i) Products
(ii) Foreign exchange and interest rates
Maturity Price (US$/ton) Maturity Price (US$/ton) Maturity Price (US$/ton)SPOT 8,280 SEP16 8,531 MAR17 8,595
APR16 8,462 OCT16 8,543 MAR18 8,711
MAY16 8,476 NOV16 8,556 MAR19 8,813
JUN16 8,490 DEC16 8,567 MAR20 8,899
JUL16 8,503 JAN17 8,577
AUG16 8,519 FEB17 8,586
Maturity Price (US$/lb) Maturity Price (US$/lb) Maturity Price (US$/lb)SPOT 2.19 SEP16 2.19 MAR17 2.19
APR16 2.21 OCT16 2.19 MAR18 2.19
MAY16 2.20 NOV16 2.19 MAR19 2.19
JUN16 2.20 DEC16 2.19 MAR20 2.19
JUL16 2.20 JAN17 2.19
AUG16 2.20 FEB17 2.19
Maturity Price (US$/ton) Maturity Price (US$/ton) Maturity Price (US$/ton)SPOT 172 SEP16 192 MAR17 210
APR16 175 OCT16 195 MAR18 236
MAY16 178 NOV16 198 MAR19 274
JUN16 180 DEC16 201 MAR20 322
JUL16 184 JAN17 205
AUG16 188 FEB17 208
Bunker Oil
Nickel
Copper
Maturity Rate (% p.a.) Maturity Rate (% p.a.) Maturity Rate (% p.a.)05/02/16 3.73 03/01/17 3.25 07/01/19 3.34
06/01/16 3.65 04/03/17 3.23 10/01/19 3.37
07/01/16 3.41 07/03/17 3.26 01/02/20 3.45
08/01/16 3.35 10/02/17 3.22 04/01/20 3.52
09/01/16 3.20 01/02/18 3.20 07/01/20 3.65
10/03/16 3.12 04/02/18 3.17 10/01/20 3.86
11/01/16 3.11 07/02/18 3.19 01/04/21 4.01
12/01/16 3.11 10/01/18 3.21 07/01/21 4.09
01/02/17 3.20 01/02/19 3.23 01/03/22 4.36
02/01/17 3.24 04/01/19 3.29 01/02/23 4.81
Maturity Rate (% p.a.) Maturity Rate (% p.a.) Maturity Rate (% p.a.)1M 0.44 6M 0.71 11M 0.75
2M 0.52 7M 0.72 12M 0.75
3M 0.63 8M 0.73 2Y 0.86
4M 0.67 9M 0.74 3Y 0.98
5M 0.69 10M 0.74 4Y 1.11
Maturity Rate (% p.a.) Maturity Rate (% p.a.) Maturity Rate (% p.a.)05/02/16 7.50 03/01/17 7.50 07/01/19 7.50
06/01/16 7.50 04/03/17 7.50 10/01/19 7.50
07/01/16 7.50 07/03/17 7.50 01/02/20 7.50
08/01/16 7.50 10/02/17 7.50 04/01/20 7.50
09/01/16 7.50 01/02/18 7.50 07/01/20 7.50
10/03/16 7.50 04/02/18 7.50 10/01/20 7.50
11/01/16 7.50 07/02/18 7.50 01/04/21 7.50
12/01/16 7.50 10/01/18 7.50 07/01/21 7.50
01/02/17 7.50 01/02/19 7.50 01/03/22 7.50
02/01/17 7.50 04/01/19 7.50 01/02/23 7.50
US$ Interest Rate
TJLP
US$-Brazil Interest Rate

(A free translation of the original in Portuguese)
34
Maturity Rate (% p.a.) Maturity Rate (% p.a.) Maturity Rate (% p.a.)05/02/16 14.14 03/01/17 13.83 07/01/19 13.92
06/01/16 14.12 04/03/17 13.80 10/01/19 13.93
07/01/16 14.10 07/03/17 13.77 01/02/20 13.93
08/01/16 14.06 10/02/17 13.73 04/01/20 13.92
09/01/16 14.06 01/02/18 13.72 07/01/20 13.91
10/03/16 14.03 04/02/18 13.78 10/01/20 13.90
11/01/16 13.97 07/02/18 13.80 01/04/21 13.91
12/01/16 13.92 10/01/18 13.83 07/01/21 13.93
01/02/17 13.88 01/02/19 13.86 01/03/22 13.94
02/01/17 13.85 04/01/19 13.89 01/02/23 14.05
Maturity Rate (% p.a.) Maturity Rate (% p.a.) Maturity Rate (% p.a.)05/02/16 7.43 03/01/17 7.13 07/01/19 6.92
06/01/16 7.41 04/03/17 7.11 10/01/19 6.92
07/01/16 7.39 07/03/17 7.02 01/02/20 6.92
08/01/16 7.36 10/02/17 6.93 04/01/20 6.90
09/01/16 7.36 01/02/18 6.87 07/01/20 6.89
10/03/16 7.32 04/02/18 6.89 10/01/20 6.88
11/01/16 7.27 07/02/18 6.88 01/04/21 6.89
12/01/16 7.23 10/01/18 6.89 07/01/21 6.90
01/02/17 7.19 01/02/19 6.89 01/03/22 6.92
02/01/17 7.16 04/01/19 6.91 01/02/23 7.03
Maturity Rate (% p.a.) Maturity Rate (% p.a.) Maturity Rate (% p.a.)1M -0.33 6M -0.18 11M -0.15
2M -0.28 7M -0.17 12M -0.15
3M -0.25 8M -0.16 2Y -0.04
4M -0.22 9M -0.16 3Y 0.00
5M -0.19 10M -0.15 4Y 0.02
Maturity Rate (% p.a.) Maturity Rate (% p.a.) Maturity Rate (% p.a.)1M 0.90 6M 1.01 11M 0.89
2M 0.90 7M 0.97 12M 0.88
3M 0.90 8M 0.95 2Y 0.89
4M 0.95 9M 0.92 3Y 0.91
5M 0.99 10M 0.91 4Y 0.95
CAD/US$ 0.7709 US$/BRL 3.5589 EUR/US$ 1.1380
Currencies - Ending rates
Implicit Inflation (IPCA)
EUR Interest Rate
CAD Interest Rate
BRL Interest Rate

(A free translation of the original in Portuguese)
35
20. Stockholders’ equity a) Share capital At March 31, 2016 and December 31, 2015, the share capital was R$77,300 corresponding to 5,244,316,120 shares issued and fully paid without par value. March 31, 2016
Stockholders ON PNA Total
Valepar S.A. 1,716,435,045 20,340,000 1,736,775,045 Brazilian Government (Golden Share) - 12 12 Foreign investors - ADRs 794,340,784 664,290,644 1,458,631,428 FMP - FGTS 78,297,758 - 78,297,758 PIBB - BNDES 1,186,115 1,098,260 2,284,375 BNDESPar 206,378,882 66,185,272 272,564,154 Foreign institutional investors in local market 277,441,505 710,319,270 987,760,775 Institutional investors 75,906,803 121,112,309 197,019,112 Retail investors in Brazil 35,666,108 384,376,159 420,042,267
Shares outstanding 3,185,653,000 1,967,721,926 5,153,374,926 Shares in treasury 31,535,402 59,405,792 90,941,194
Total issued shares 3,217,188,402 2,027,127,718 5,244,316,120
Amounts per class of shares (in millions) 47,421 29,879 77,300
Total authorized shares 7,200,000,000 3,600,000,000 10,800,000,000
b) Basic and diluted earnings per share Basic and diluted earnings per share are as follows: Three-month period ended March 31
2016 2015
Net income (loss) attributable to Vale's stockholders 6,311 (9,538) Basic and diluted earnings per share: Income (loss) available to preferred stockholders 2,410 (3,642) Income (loss) available to common stockholders 3,901 (5,896)
Total 6,311 (9,538)
Weighted average number of shares outstanding (thousands of shares) - preferred shares 1,967,722 1,967,722 Weighted average number of shares outstanding (thousands of shares) - common shares 3,185,653 3,185,653
Total 5,153,375 5,153,375
Basic and diluted earnings per share Preferred share 1.22 (1.85) Common share 1.22 (1.85)

(A free translation of the original in Portuguese)
36
21. Costs and expenses by nature a) Cost of goods sold and services rendered Consolidated
Three-month period ended March 31
2016 2015
Personnel 1,945 1,521 Materials and services 3,074 2,776 Fuel oil and gas 1,193 886 Maintenance 2,420 1,909 Energy 635 414 Acquisition of products 326 704 Depreciation and depletion 3,159 2,654 Freight 1,920 2,269 Others 1,795 1,855
Total 16,467 14,988
Cost of goods sold 16,051 14,568 Cost of services rendered 416 420
Total 16,467 14,988
b) Selling and administrative expenses Consolidated
Three-month period ended March 31
2016 2015
Personnel 199 239 Services (consulting, infrastructure and others) 61 81 Advertising and publicity 3 8 Depreciation and amortization 89 82 Travel expenses 6 8 Taxes and rents 15 17 Others 92 120
Total 465 555
c) Others operational expenses (incomes), net Consolidated
Three-month period ended March 31
2016 2015
Provision for litigation 122 (53) Provision for loss with VAT credits (ICMS) 117 119 Provision for profit sharing program - 61 Provision (reversals) for disposal of materials and inventories (330) 185 Gold stream transaction - (722) Result on sale or disposal of property, plant and equipment and intangible 39 40 Others 186 191
Total 134 (179)

(A free translation of the original in Portuguese)
37
22. Financial result Consolidated
Three-month period ended March 31
Financial expenses 2016 2015
Loans and borrowings gross interest (1,611) (1,118) Capitalized loans and borrowing costs 690 556 Labor, tax and civil lawsuits (81) (95) Derivative financial instruments (228) (4,049) Indexation and exchange rate variation (a) (4,279) (15,913) Participative stockholders' debentures (451) 722 Expenses of REFIS (448) (408) Others (572) (326)
(6,980) (20,631)
Financial income Short‐term investments 164 73 Derivative financial instruments 1,654 1 Indexation and exchange rate variation (b) 9,865 6,779 Others 70 100
11,753 6,953
Financial results, net 4,773 (13,678)
Summary of indexation and exchange rate variation Loans and borrowings 9,592 (15,081) Others (4,006) 5,947
Net (a) + (b) 5,586 (9,134)
23. Deferred revenue - Gold stream In 2013 and 2015, the Company entered into gold stream transactions with Silver Wheaton Corp. ("SLW") to sell part of the gold extracted during the life of the mine as a by-product of Salobo copper mine and Sudbury nickel mines. The Company received up-front cash proceeds, which were initially recognized as deferred revenue. This transaction was bifurcated into two identifiable components: (i) the sale of the mineral rights and, (ii) the services for gold extraction on the portion in which Vale operates as an agent for SLW gold extraction. In 2015, the result of the sale of the mineral rights of R$722 was recognized in the income statement of 2015 as other operating expenses, net and the portion related to the provision of future services for gold extraction was recorded as deferred revenue (liability) in the amount of R$1,670. During the three-month period ended March 31, 2016 and 2015, the Company recognized in income statement R$135 and R$44, respectively, related to rendered services of the gold extraction.
24. Commitments a) Base metals operations In March 2016, Vale Canada Limited purchased the equity interest held by Sumic Nickel Netherland B.V. in Vale Nouvelle-Calédonie S.A.S. for R$ 480 (US$135). There have been no other material changes to the commitments of the base metals operations disclosed in the financial statements as at December 31, 2015, except for letters of credit and guarantees in the amount of R$ 3,666 (US$1,030) (R$ 3,870 (US$991) at December 31, 2015) associated with items such as environment reclamation, asset retirement obligation commitments, insurance, electricity commitments, post-retirement benefits, community service commitments and import and export duties. b) Participative stockholders’ debentures The Company paid as semiannual remuneration the amount of R$124 for the three-month period ended March 31, 2015. At April 1st, 2016 (subsequently event), the company has paid the semiannual remuneration to stockholders debentures the amount of US$128.

(A free translation of the original in Portuguese)
38
c) Operating lease and purchase obligations The future payment commitments for operating lease and purchase obligations are as follows: 2016 179 2017 196 2018 206 2019 177 2020 and thereafter 186
Total minimum payments required 944
d) Guarantees provided At March 31, 2016, corporate guarantees provided by Vale (within the limit of its direct or indirect interest) for the companies Norte Energia S.A. and Companhia Siderúrgica do Pecém S.A. totaled R$1.100 and R$4.445, respectively. Due to the conclusion of the energy generation assets transaction (note 6), the guarantee of Norte Energia S.A. is shared with Cemig GT.
25. Related parties
Transactions with related parties are made by the Company at arm´s-length, observing the price and usual market conditions and therefore do not generate any undue benefit to their counterparties or loss to the Company. In the normal course of operations, Vale enters into contracts with related parties (subsidiaries, associates, joint ventures and stockholders), related to the sale and purchase of products and services, loans, leasing of assets, sale of raw material and railway transportation services. The balances of these related party transactions and their effects on the financial statements are as follows:
Assets
Consolidated
March 31, 2016 December 31, 2015
Cash and
cash equivalents
Derivative financial
instruments Accounts
receivable Related parties
Cash and cash
equivalents
Derivative financial
instruments Accounts
receivable Related parties
Banco Bradesco S.A. 153 25 - - 144 258 - - Banco do Brasil S.A. 904 78 - - 1,544 62 - - Baovale Mineração S.A. - - - 4 - - - 4 Companhia Coreano-Brasileira de Pelotização - - - 22 - - - 22 Companhia Hispano-Brasileira de Pelotização - - 7 14 - - 3 14 Companhia Ítalo-Brasileira de Pelotização - - - 33 - - - 33 Companhia Nipo-Brasileira de Pelotização - - - 35 - - - 35 Consórcio de Rebocadores da Baia de São Marcos - - 74 - - - 60 - Ferrovia Norte Sul S.A. - - 22 - - - 12 - Mitsui & Co., Ltd. - - 3 - - - 5 - MRS Logística S.A. - - - 66 - - - 65 VLI Multimodal S.A. - - 17 - - - 36 - VLI Operações Portuárias S.A. - - 43 - - - 99 - VLI S.A. - - 422 37 - - - 39 Others - - 150 145 - - 91 66
Total 1,057 103 738 356 1,688 320 306 278

(A free translation of the original in Portuguese)
39
Liabilities
Consolidated
March 31, 2016 December 31, 2015
Suppliers
and contractors
Derivative financial
instruments Related parties
Loans and borrowings
Suppliers and
contractors
Derivative financial
instruments Related parties
Loans and borrowings
Aliança Geração de Energia S.A. 47 - 125 - 43 - - - Banco Bradesco S.A. - 598 - 1,662 - 800 - 1,445 Banco do Brasil S.A. - 879 - 10,225 - 976 - 10,250 Baovale Mineração S.A. 42 - - - 29 - - - BNDES - 139 - 14,955 - 152 - 15,877 BNDES Participações S.A. - - - 1,481 - - - 1,449 Companhia Coreano-Brasileira de Pelotização 74 - 222 - 15 - 273 - Companhia Hispano-Brasileira de Pelotização 50 - 178 - 143 - 26 - Companhia Ítalo-Brasileira de Pelotização 40 - 223 - 12 - 252 - Companhia Nipo-Brasileira de Pelotização 138 - 367 - 34 - 436 - Consórcio de Rebocadores Baia da São Marcos 40 - - 30 - - - Ferrovia Centro Atlântica S.A. - - 268 - - - 266 - Mitsui & Co., Ltd. 38 - - 41 - - MRS Logística S.A. 84 - - - 91 - - - Sumic Nickel Netherland B.V. - - 1,255 - - - 1,374 - VLI S.A. 2 - 321 - - - - - Others 95 - 83 - 93 - 59 -
Total 650 1,616 3,042 28,323 531 1,928 2,686 29,021
Consolidated
Three-month period ended March 31
2016 2015
Net operating
revenue Costs and expenses Financial result
Net operating revenue
Costs and expenses Financial result
Banco Bradesco S.A. (i) - - (58) - - (199) Banco do Brasil S.A. (i) - - (131) - - (406) Baovale Mineração S.A. - (13) - - (13) - BNDES (i) - - (170) - - (50) BNDES Participações S.A. (i) - - (24) - - (28) Companhia Coreano-Brasileira de Pelotização - (69) - - (45) - Companhia Hispano-Brasileira de Pelotização - (41) - - (36) - Companhia Ítalo-Brasileira de Pelotização - (38) - - (40) - Companhia Nipo-Brasileira de Pelotização - (127) - - (72) - Companhia Siderúrgica do Pecem 64 - - - - - Ferrovia Centro Atlântica S.A. 29 (19) (2) 35 (33) - Ferrovia Norte Sul S.A. 17 - - 11 - - Mitsui & Co., Ltd. 79 - - 171 - - MRS Logística S.A. - (240) - - (342) - Samarco Mineração S.A. - - - 90 - - VLI Operações Portuárias S.A. 114 - - - - - VLI S.A. 107 - - 178 - 5 Others 36 (33) 4 52 (34) 5
Total 446 (580) (381) 537 (615) (673)
(i) Not include exchange rate variation

(A free translation of the original in Portuguese)
40
26. Select notes to Parent Company information (individual interim information) (a) Investments Parent Company
Three-month period ended March 31
2016 2015
Balance at beginning of the period 127,517 118,628
Acquisitions (i) - 1,819 Additions 643 750 Capitalizations 5 - Translation adjustment (6,502) 13,506 Equity results on income statement 3,488 (4,599) Equity results on statement of comprehensive income (196) 142 Dividends declared (893) 11 Transfer to held for sale - (131) Others (30) -
Balance at end of the period 124,032 130,126
(i) Refers Aliança Geração transaction, see note 6.
(b) Intangible Parent Company
Concessions (i) Right of use (i) Software (i) Total
Balance at December 31, 2015 7,084 123 1,350 8,557
Additions (ii) 1,421 - 5 1,426 Disposals (2) - - (2) Amortization (125) (2) (127) (254)
Balance at March 31, 2016 8,378 121 1,228 9,727
Cost 11,526 223 4,002 15,751 Accumulated amortization (3,148) (102) (2,774) (6,024)
8,378 121 1,228 9,727
Parent Company
Concessions (i) Right of use (i) Software (i) Total
Balance at December 31, 2014 5,876 129 1,462 7,467
Additions 349 - 213 562 Disposals (37) - - (37) Amortization (119) (2) (125) (246)
Balance at March 31, 2015 6,069 127 1,550 7,746
Cost 9,382 223 3,815 13,420 Accumulated amortization (3,313) (96) (2,265) (5,674)
6,069 127 1,550 7,746
(i) Finite useful life. (ii) Refers mainly duplication the Carajás Railroad.

(A free translation of the original in Portuguese)
41
(c) Property, plant and equipment Parent Company
Land Building Facilities Equipment Mineral
properties Others Constructions
in progress Total
Balance at December 31, 2015 1,672 19,546 19,379 8,371 4,215 14,203 29,501 96,887
Additions (i) - - - - - - 1,722 1,722 Disposals - - - (4) - - (4) (8) Depreciation and amortization - (152) (233) (250) (44) (314) - (993) Assets retirement obligations - - - - 104 - - 104 Transfers (13) 280 (215) 306 (86) 263 (535) -
Balance at March 31, 2016 1,659 19,674 18,931 8,423 4,189 14,152 30,684 97,712
Cost 1,659 22,709 24,962 13,692 5,480 21,465 30,684 120,651 Accumulated depreciation - (3,035) (6,031) (5,269) (1,291) (7,313) - (22,939)
1,659 19,674 18,931 8,423 4,189 14,152 30,684 97,712
Parent Company
Land Building Facilities Equipment Mineral
properties Others Constructions
in progress Total
Balance at December 31, 2014 1,452 13,364 17,337 7,097 4,396 9,820 33,855 87,321
Additions (i) - - - - - - 2,780 2,780 Disposals - (14) (1) (10) - - - (25) Depreciation and amortization - (111) (213) (228) (44) (281) - (877) Transfers 27 2,167 736 544 (1,265) 538 (2,747) -
Balance at March 31, 2015 1,479 15,406 17,859 7,403 3,087 10,077 33,888 89,199
Cost 1,479 17,709 23,094 11,782 3,987 16,448 33,888 108,387 Accumulated depreciation - (2,303) (5,235) (4,379) (900) (6,371) - (19,188)
1,479 15,406 17,859 7,403 3,087 10,077 33,888 89,199
(i) Includes capitalized borrowing costs, see cash flow.
(d) Loans and borrowings Parent Company
Current liabilities Non-current liabilities
March 31, 2016 December 31, 2015 March 31, 2016 December 31, 2015
Debt contracts in the international markets Floating rates in: US$ 517 567 19,422 16,829 Fixed rates in: US$ 2,544 937 7,225 9,020 EUR - - 6,081 6,376 Accrued charges 212 479 - -
3,273 1,983 32,728 32,225
Debt contracts in Brazil Floating rates in: R$, indexed to TJLP, TR, IPCA, IGP-M and CDI 785 780 17,520 17,658 Basket of currencies and US$ indexed to LIBOR 1,107 1,125 4,488 5,227 Fixed rates in: R$ 190 190 828 876 Accrued charges 840 658 - -
2,922 2,753 22,836 23,761
6,195 4,736 55,564 55,986

(A free translation of the original in Portuguese)
42
The future flows of debt payments (principal) are as follows: Parent Company
Debt principal
2016 3,113 2017 6,077 2018 16,881 2019 6,019 2020 8,155 2021 3,670 Between 2022 and 2025 10,832 2026 onwards 5,960
60,707
In January 2016, the Parent Company drew down on R$4,826 (US$1,200) of its revolving credit facilities.
(e) Provisions for litigation Parent Company
Tax litigation Civil litigation Labor litigation
Environmental litigation
Total of litigation
provision
Balance at December 31, 2015 332 241 1,562 55 2,190
Additions 12 45 160 7 224 Reversals (29) (1) (62) (6) (98) Payments (195) (70) (84) - (349) Indexation and interest - 95 5 3 103
Balance at March 31, 2016 120 310 1,581 59 2,070
Parent Company
Tax litigation Civil litigation Labor litigation
Environmental litigation
Total of litigation provision
Balance at December 31, 2014 436 186 1,732 94 2,448
Additions 289 46 92 - 427 Reversals (494) (30) (51) - (575) Payments (9) (7) (12) (35) (63) Indexation and interest 129 45 (31) 3 146
Balance at March 31, 2015 351 240 1,730 62 2,383
(f) Income taxes The total amount presented as income taxes in the income statement is reconciled to the rate established by law, as follows: Parent Company
Three-month period ended March 31
2016 2015
Net income (loss) before income taxes 8,382 (12,826) Income taxes at statutory rates ‐ 34% (2,850) 4,361 Adjustments that affect the basis of taxes: Income tax benefit from interest on stockholders' equity - 545 Equity results in income statement 1,186 (1,564) Reversals of tax loss carry forward (271) - Others (136) (54)
Income taxes (2,071) 3,288

(A free translation of the original in Portuguese)
43
(g) Related parties Parent Company
Assets
March 31, 2016 December 31, 2015
Cash and
cash equivalents
Accounts receivable
Derivative financial
instruments Related parties
Cash and cash
equivalents Accounts
receivable
Derivative financial
instruments Related parties
Banco Bradesco S.A. 41 - 25 - 44 - 258 - Banco do Brasil S.A. 290 - 78 - 217 - 62 - Biopalma da Amazônia S.A. - - - 1,170 - - - 1,360 Companhia Coreano-Brasileira de Pelotização - - - 22 - - - 22 Companhia Hispano-Brasileira de Pelotização - 7 - 14 - - - 14 Companhia Ítalo-Brasileira de Pelotização - - - 33 - - - 33 Companhia Nipo-Brasileira de Pelotização - - - 35 - - - 35 Companhia Portuária Baía de Sepetiba - - - 121 - - - 119 Mineração Brasileiras Reunidas S.A. - - - 924 - - - 161 Mineração Corumbaense Reunidas S.A. - - - 45 - 51 - - MRS Logística S.A. - - - 26 - - - 27 Salobo Metais S.A. - 9 - 183 - 22 - 155 Vale International S.A. - 33,329 - 2 - 36,518 - 331 VLI Multimodal S.A. - 17 - - - 36 - - VLI Operações Portuárias S.A. - 42 - - - 99 - - VLI S.A. - 422 - 37 - - - 39 Others - 236 - 177 - 230 - 6
Total 331 34,062 103 2,789 261 36,956 320 2,302
Parent Company
Liabilities
March 31, 2016 December 31, 2015
Suppliers
and contractors
Derivative
financial instruments
Related parties
Loans and
borrowings
Suppliers and
contractors
Derivative financial
instruments
Related parties
Loans and
borrowings
Aliança Geração de Energia S.A. 47 - 125 - 43 - - - Baovale Mineração S.A. 42 - - - 29 - - - Banco Bradesco S.A. - 598 - 1,663 - 800 - 1,445 Banco do Brasil S.A. - 879 - 10,224 - 976 - 10,250 BNDES - 139 - 13,477 - 152 - 14,405 BNDES Participações S.A. - - - 1,479 - - - 1,449 Companhia Coreano-Brasileira de Pelotização 74 - - - 15 - - - Companhia Hispano-Brasileira de Pelotização 50 - - - 143 - - - Companhia Ítalo-Brasileira de Pelotização 40 - - - 12 - - - Companhia Nipo-Brasileira de Pelotização 138 - - - 34 - - - Companhia Portuária Baía de Sepetiba 540 - - - 484 - - - Ferrovia Centro Atlântica S.A. - - 268 - - - 266 - Mineração Brasileiras Reunidas S.A. 452 - 3,291 - 510 - 3,172 - MRS Logística S.A. 84 - - - 91 - - - Vale International S.A. 4 - 59,945 - 5 - 66,814 - Others 231 - 679 - 257 - 359 -
Total 1,702 1,616 64,308 26,843 1,623 1,928 70,611 27,549

(A free translation of the original in Portuguese)
44
Parent Company
Three-month period ended March 31
Net operating revenue Costs and expenses Financial result
2016 2015 2016 2015 2016 2015
Banco Bradesco S.A. (i) - - - - (59) (198) Banco do Brasil S.A. (i) - - - - (131) (406) BNDES (i) - - - - (166) (50) BNDES Participações S.A. (i) - - - - (24) (28) Baovale Mineração S.A. - - (13) (13) - - Biopalma da Amazônia S.A. - - - - (104) - Companhia Coreano-Brasileira de Pelotização - - (69) (45) - - Companhia Hispano-Brasileira de Pelotização - - (41) (36) - - Companhia Ítalo-Brasileira de Pelotização - - (38) (40) - - Companhia Nipo-Brasileira de Pelotização - - (127) (72) - - Companhia Portuária Baía de Sepetiba - - (266) (172) - - Ferrovia Centro Atlântica S.A. 29 35 (19) (33) - - Mineração Brasileiras Reunidas S.A. - - (374) (180) (119) - MRS Logística S.A. - - (240) (342) - - Samarco Mineração S.A. - 90 - - - - Vale Energia S.A. - - (5) - - - Vale International S.A. 6,831 8,972 - - 1,858 (485) VLI Operações Portuárias S.A. 114 - - - - - VLI S.A. 107 177 - - - 5 Others 102 65 1 (88) (38) 225
Total 7,183 9,339 (1,191) (1,021) 1,217 (937)
(i) Not include exchange rate variation

(A free translation of the original in Portuguese)
45
Members of the Board of Directors, Fiscal Council, Advisory Committees and Executive Officers Board of Directors Governance and Sustainability Committee Gueitiro Matsuo Genso Fernando Jorge Buso Gomes Chairman Arthur Prado Silva Eduardo de Oliveira Rodrigues Filho Sérgio Alexandre Figueiredo Clemente Ricardo Rodrigues Morgado Vice-President Ricardo Simonsen Dan Antonio Marinho Conrado Fiscal Council Marcel Juviniano Barros Tarcísio José Massote de Godoy Marcelo Amaral Moraes Fernando Jorge Buso Gomes Chairman Motomu Takahashi Oscar Augusto de Camargo Filho Paulo José dos Reis Souza Luciano Galvão Coutinho Sandro Kohler Marcondes Lucio Azevedo Aníbal Moreira dos Santos Alberto Guth Raphael Manhães Martins Alternate Alternate Gilberto Antonio Vieira Paula Bicudo de Castro Magalhães Moacir Nachbar Junior Sergio Mamede Rosa do Nascimento Arthur Prado Silva Oswaldo Mário Pego de Amorim Azevedo Francisco Ferreira Alexandre Julio Sergio de Souza Cardozo Robson Rocha Luiz Mauricio Leuzinger Yoshitomo Nishimitsu Executive Officers Eduardo de Oliveira Rodrigues Filho Victor Guilherme Tito Murilo Pinto de Oliveira Ferreira Carlos Roberto de Assis Ferreira Chief Executive Officer Advisory Committees of the Board of Directors Vânia Lucia Chaves Somavilla Executive Officer (Human Resources, Health & Safety, Sustainability and Energy) Controlling Committee Eduardo Cesar Pasa Luciano Siani Pires Moacir Nachbar Junior Executive Officer (Finance and Investors Relations) Oswaldo Mário Pego de Amorim Azevedo Marcos Paulo Pereira da Silva Roger Allan Downey Executive Officer (Fertilizers, Coal and Strategy) Executive Development Committee Oscar Augusto de Camargo Filho Gerd Peter Poppinga Marcel Juviniano Barros Executive Officer (Ferrous) Fernando Jorge Buso Gomes Tatiana Boavista Barros Heil Galib Abrahão Chaim Executive Officer (Capital Projects Implementation) Strategic Committee Murilo Pinto de Oliveira Ferreira Humberto Ramos de Freitas Gueitiro Matsuo Genso Executive Officer (Logistics and Mineral Research) Luiz Carlos Trabuco Cappi Oscar Augusto de Camargo Filho Jennifer Anne Maki Luciano Galvão Coutinho Executive Officer (Base Metals) Finance Committee
Gilmar Dalilo Cezar Wanderley Fernando Jorge Buso Gomes Eduardo de Oliveira Rodrigues Filho Marcelo Botelho Rodrigues Tatiana Boavista Barros Heil Global Controller Director Murilo Muller Controllership Director Dioni Brasil Accounting Manager TC-CRC-RJ 083305/O-8