interim financial report january 1 june 30, 2009 - durr€¦ · interim financial report january 1...
TRANSCRIPT
Interim Financial Report January 1 – June 30, 2009

2
Interim Financial Report January 1 – June 30, 2009
Contents
3 Key figures
4 Highlights
5 Management report
24 Consolidated income statement
25 Statement of total comprehensive income
26 Consolidated balance sheet
27 Consolidated statement of changes in shareholders´ equity
28 Consolidated cash flow statement
29 Notes to the consolidated financial statement
40 Responsibility statement by management
41 Financial calendar
41 Contact
Cover photo:
Fully automated top coat paint-ing line for the VW Golf at the Zwickau plant

3
Interim Financial Report January 1 – June 30, 2009
Key figures for the Dürr Group (IFRS)(Continuing operations)
H1 2009
H1 2008
Incoming orders in € m 506.8 876.1
Orders on hand (June 30) in € m 844.5 1,172.7
Sales revenues in € m 571.5 752.7
EBITDA in € m 16.4 33.5
EBIT in € m 6.1 24.6
Earnings after tax in € m -6.6 10.8
Cash flow from operating activities in € m -37.8 -7.5
Cash flow from investing activities in € m -13.3 4.3
Cash flow from financing activities in € m 30.3 -22.5
Free cash flow in € m -51.9 -24.7
Balance sheet total (June 30) in € m 989.3 1,141.5
Equity (with minority interests) (June 30) in € m 325.9 294.5
Net financial debt (June 30) in € m 104.5 89.0
Net working capital (June 30) in € m 168.8 127.2
Employees (June 30) 5,906 6,044
Dürr stockISIN: DE0005565204
High1) € 14.85 33.89
Low1) € 7.14 17.51
Close1) € 11.45 25.99
Number of shares (weighted average) k 17,301 15,763
Earnings per share (diluted / undiluted) € -0.42 0.63
1) XETRA
Immaterial variances may occur in this report in the computation of sums and percentages due to rounding.

4
Interim Financial Report January 1 – June 30, 2009
Highlights
Stabilization: demand picks up in Q2 �
Q2 new orders well up on Q1 �
Stronger than expected fall in sales revenues �
EBIT also positive in Q2 �
Capacity and cost reduction measures take effect �
Cash flow in Q2 much improved versus Q1 �

5
Interim Financial Report January 1 – June 30, 2009
Management report
Market stabilization in the second quarter
We saw signs of stabilization in the market in the course of the second quarter. Our customers are resuming projects they had shelved and are starting new pro-jects. The new projects are focused even more strongly on the emerging markets than previously, while requests for quotations in the established market regions such as the USA and France remain at a very low level.
All in all, we expect average investment activity in the automobile industry in the next year to be lower than in 2007 and 2008, too. We are therefore continuing the package of capacity and cost reduction measures that we initiated in 2008.
The 270 job cuts in France and the USA that were announced have been com-pleted. Since the fourth quarter of 2008 the number of employees in the Group has been reduced by 300 in gross terms. First-time consolidations added 99 new employees. A further 350 job cuts Group-wide are planned in the second half of 2009.
We aim to start 2010 with about 1,100 fewer employees (including leased labor) than in 2009. That is a reduction of nearly 20% versus September 30, 2008. In addition, we have introduced temporary measures such as the rundown of over-time accounts and short-time working. 8.5% of the workforce in Germany was working short-time at the end of March and 10.2% at the end of July. The figure is expected to rise to up to 15% in the third quarter.
Besides these adjustments, the optimization measures already initiated are also being rigorously continued. This includes in-sourcing work that was previously out-sourced, coordinating capacity utilization between locations worldwide and optimi-zing working capital.
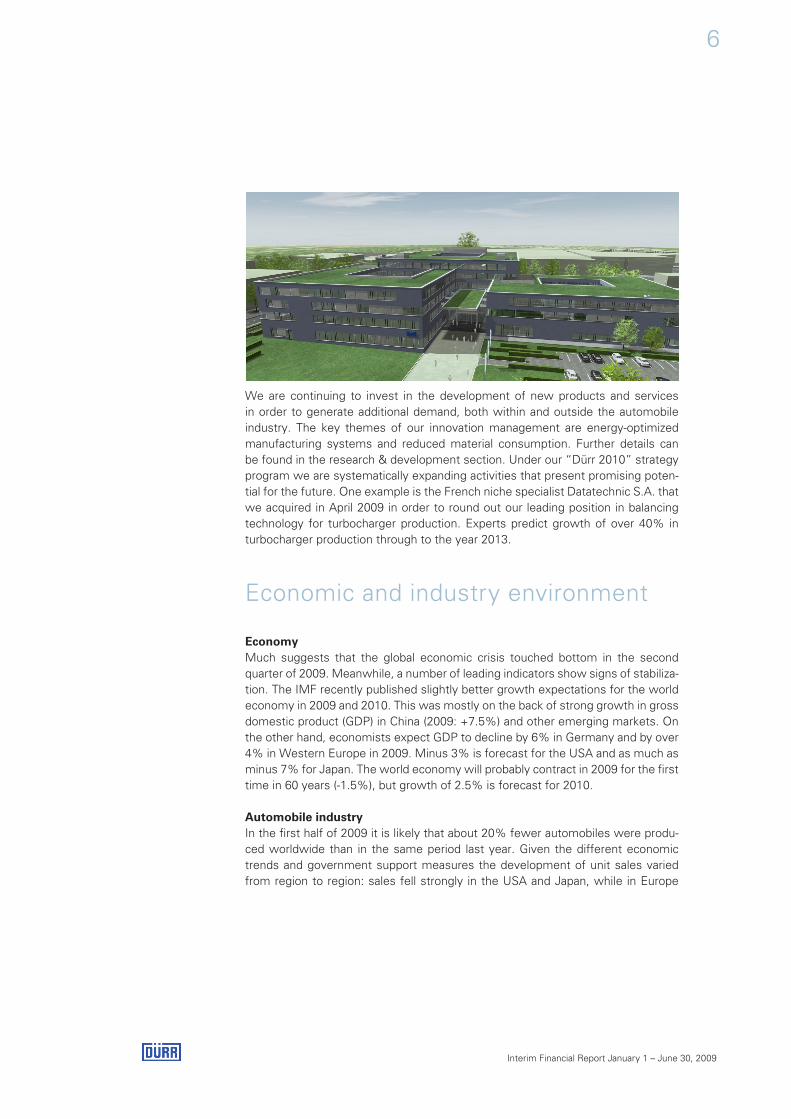
We are also pressing ahead with our efforts to improve our business processes. An important role is played here by our new Group headquarters, the “Dürr Cam-pus”, in Bietigheim-Bissingen (picture on page 6) which we occupied in July. At the Campus we are concentrating our German painting, assembly and environ-mental systems activities into an integrated center of competence for technology, project execution and services. There are approximately 1,500 employees working for Dürr there, including 900 from the Stuttgart site that has been closed. This concentration will lead to synergies and increased productivity especially in the painting activities. Dürr’s legal domicile will continue to be situated in Stuttgart.
6
Interim Financial Report January 1 – June 30, 2009
We are continuing to invest in the development of new products and services in order to generate additional demand, both within and outside the automobile industry. The key themes of our innovation management are energy-optimized manufacturing systems and reduced material consumption. Further details can be found in the research & development section. Under our “Dürr 2010” strategy program we are systematically expanding activities that present promising poten-tial for the future. One example is the French niche specialist Datatechnic S.A. that we acquired in April 2009 in order to round out our leading position in balancing technology for turbocharger production. Experts predict growth of over 40% in turbocharger production through to the year 2013.
Economic and industry environment
Economy Much suggests that the global economic crisis touched bottom in the second quarter of 2009. Meanwhile, a number of leading indicators show signs of stabiliza-tion. The IMF recently published slightly better growth expectations for the world economy in 2009 and 2010. This was mostly on the back of strong growth in gross domestic product (GDP) in China (2009: +7.5%) and other emerging markets. On the other hand, economists expect GDP to decline by 6% in Germany and by over 4% in Western Europe in 2009. Minus 3% is forecast for the USA and as much as minus 7% for Japan. The world economy will probably contract in 2009 for the first time in 60 years (-1.5%), but growth of 2.5% is forecast for 2010.
Automobile industryIn the first half of 2009 it is likely that about 20% fewer automobiles were produ-ced worldwide than in the same period last year. Given the different economic trends and government support measures the development of unit sales varied from region to region: sales fell strongly in the USA and Japan, while in Europe

7
Interim Financial Report January 1 – June 30, 2009
the drop was slightly more moderate mostly due to the wrecking premiums intro-duced in various countries; in Germany, unit sales were even up 26%. China wit-nessed double-digit growth also. The trend towards smaller, cheaper, economical automobiles has gathered pace worldwide, supported by deliberate government incentives and the growing environmental and cost consciousness of many con-sumers. Against this backdrop the automobile industry is pushing the develop-ment of low-consumption vehicles and alternative drive technologies.
New car registrations in important regions
Source: VDA; Tachometer 2/2009
Automobile industry investment cycle at the turning pointAfter the automobile industry had put many investments on hold at the end of 2008 and in the first months of 2009, there were first signs of investment activity stabilizing at a low level in the second quarter of 2009. In the USA, Germany and Eastern Europe some projects that had been shelved were resumed and awarded. There are new investment projects in the pipeline in Mexico, China and Eastern Europe. Nonetheless, we are preparing for investment in the automobile industry to be about 20 to 25% below the 2007 and 2008 level in the next year, also.
Aircraft industry continues investmentsThe aviation industry is also affected by the global economic crisis but aircraft manufacturers such as Boeing, Airbus, Bombardier and Lockheed need to imple-ment their investment programs in order to be able to deliver announced aircraft on time.
Development of unit sales January – June 2009
-60 -40 -20 0 20 40
Germany
China
India
Mercosur
Western Europe
Japan
New EU countries
USA
Russia
Change in %
18.7
2.6
-2.3
-9.8
-20.8
-26.1
-35.1
-48.6
26.0

8
Interim Financial Report January 1 – June 30, 2009
Business developments*
Growth in orders on hand in the second quarter The Group booked incoming orders worth € 506.8 million in the first half of 2009, which was 42% below the figure for the first six months last year (€ 876.1 mil-lion). In the second quarter we received orders worth € 298.4 million, a decrease of 17% versus the same quarter last year. That was a marked improvement on the weak first quarter when new orders were still down 60% year over year. Business activity stabilized noticeably in June.
In the Paint and Assembly Systems division incoming orders were down 41% in the first half of 2009. After the pronounced restraint in investment activity in the automobile industry from the fourth quarter of 2008 onwards we received seve-ral large paint systems orders at the end of the second quarter. For example, we are supplying parts of the paint shop for VW’s new US plant in Chattanooga. This order is a milestone as VW is the world’s first automobile manufacturer to opt for our new energy-saving EcoDryScrubber spray booth system. The decline in orders in Application Technology was less pronounced than in the paint systems business. The Aircraft and Technology Systems business unit saw growth in or-ders in business with the aircraft industry, to which a large order from Airbus for the supply of 57 painting booths contributed. The greater part of this order was booked in the first quarter. In the strategically important US market we received a technologically demanding reference order from Lockheed.
Incoming orders in the Measuring and Process Systems division, where the focus is on mechanical engineering, were down 44% in the first six months of 2009. At € 66.3 million, order intake in the second quarter was up 3% on the first quarter. The Cleaning and Filtration Systems business unit was hit particularly hard by the investment restraint in the automobile industry. On the other hand, business at Balancing and Assembly Products (balancing, testing and filling technology) picked up in the second quarter. There was a temporary shift in the distribution of incoming orders by region in the first half of 2009. The share of the emerging markets sank from nearly 50% to around 30%. This was mainly due to the fact that all the four large orders we booked in the first six months came from established markets such as Germany and the USA. Germany accounted for 34% of incoming orders, the rest of Europe for 29%, America for 23%, and Asia for 14%.
*Unless stated otherwise, all figures and statements in this interim report refer to the continuing operations of the Dürr Group. These interim financial statements have been prepared in accordance with the International Financial Reporting Standards (IFRS).
9
Interim Financial Report January 1 – June 30, 2009
Sales revenues below expectationsSales revenues were down 24% in the first half of 2009 at € 571.5 million. In the second quarter they came to € 262.0 million, which was below the € 309.5 million posted in the first quarter. In addition to the deferred realization of sales revenues as a result of customer-induced project delays this was also due to the weak development of the services business. The sharp cutbacks in production in the automobile industry led to considerable shortfalls in the spare parts business that is dependent on production levels. Planned plant revamps, conversions and other service projects were also postponed or considerably scaled back in order to save liquidity. In our mechanical engineering business, where throughput times are short, the drop in new orders quickly fed through in lower sales revenues.
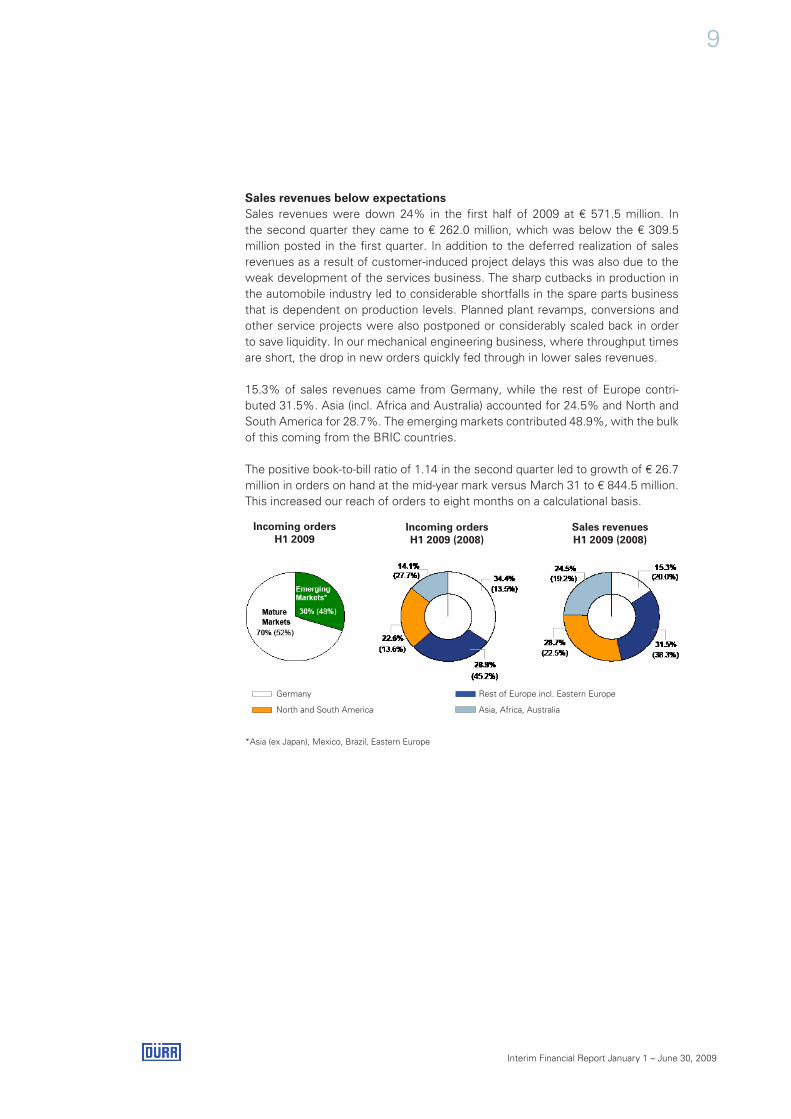
15.3% of sales revenues came from Germany, while the rest of Europe contri-buted 31.5%. Asia (incl. Africa and Australia) accounted for 24.5% and North and South America for 28.7%. The emerging markets contributed 48.9%, with the bulk of this coming from the BRIC countries.
The positive book-to-bill ratio of 1.14 in the second quarter led to growth of € 26.7 million in orders on hand at the mid-year mark versus March 31 to € 844.5 million. This increased our reach of orders to eight months on a calculational basis.
Germany Rest of Europe incl. Eastern Europe
North and South America Asia, Africa, Australia
*Asia (ex Japan), Mexico, Brazil, Eastern Europe
Incoming ordersH1 2009
Incoming ordersH1 2009 (2008)
Sales revenuesH1 2009 (2008)

10
Interim Financial Report January 1 – June 30, 2009
Gross margin rises to 20.1%The cost of sales fell by 27% in the first half of the year and thus more strongly than sales revenues, which raised the gross margin to 20.1% (H1 2008: 17.0%). Factors helping to lower the cost of sales were process improvements as well as sourcing benefits and the capacity reductions. A negative factor, on the other hand, was the double-digit fall in revenues and earnings in the high-margin services busi-ness. In addition, reduced levels of capacity utilization resulted in losses in France and the USA. Gross profit was down € 12.9 million in the reporting period.
Overhead costs reducedThe cost reduction measures initiated at the end of 2008 took effect increasingly in the second quarter. Selling and general administrative expenses, for instance, were down 7% both versus the first quarter and versus the same quarter last year.
Selling expenses included one-off expenses of € 0.7 million from the Chrysler insolvency. Research and development expenses in the first six months were up 5% to € 12.7 million (H1 2008: € 12.1 million) as we are sustaining our high pace of innovation despite the weak market environment.
Other operating income and expenses showed a net balance of € -1.2 million (H1 2008: € +2.4 million) which was mainly due to currency translation effects. Re-structuring costs for capacity adjustments (see page 5) amounted to € 2.8 million; there had been no comparable expense in the same period last year. EBIT also positive in the second quarterEBITDA was down € 17.1 million to € 16.4 million in the first half of 2009. EBIT came to € 6.1 million, a drop of € 18.5 million versus the same period last year. € 7.1 million of the decline was due to non-operating factors, namely the non-recurrence of the book gains posted the year before, the one-time expenses in connection with the Chrysler insolvency, and the restructuring costs.
The financial result improved significantly by € 1.4 million to € -7.8 million. This is mostly due to the partial redemption of our corporate bond in the second half of 2008. The effective tax rate will probably rise more strongly in 2009 than previously ex-pected. The main reasons are the earnings shortfalls in the USA and France where no deferred tax assets can be created due to losses. Tax expense in the first six months was € 4.9 million (H1 2008: € 4.6 million). This led to earnings after tax of € -6.6 million (H1 2008: € 10.7 million) although earnings before tax were only slightly negative at € -1.7 million (H1 2008: € 15.4 million).

11
Interim Financial Report January 1 – June 30, 2009
Financial position
Cash flow from operating activities steadies in the second quarterIn the second quarter of 2009 cash flow from operating activities improved by € 26.8 million versus the first quarter. This was mainly because we were able to reduce net working capital (NWC) appreciably: from € 187.5 million in the first quarter to € 168.8 million as of June 30, 2009.
The reason for the growth in NWC in the first quarter was the decline in trade pay-ables and in prepayments received. Customer-induced delays in project execution also tied up additional capital. Overall, operating cash flow in the first half of 2009 was negative to the tune of € -37.8 million. This was also because of higher tax payments owing to back payments for 2008 that were due abroad. In addition, there were taxes on intercompany earnings distributions. However, these will mostly be refunded later in the year. The cash-out in the item “Other“ is largely due to payments to employees under the profit-sharing scheme for the very suc-cessful 2008 fiscal year; these payments were already expensed in 2008. Interest payments were reduced by about 30% as a result of the refinancing.
Cash flow statement*
H1 2009
H1 2008
in € million
Earnings before income taxes -1.7 15.4
Depreciation and amortization 10.3 9.0
Interest result 8.6 10.4
Income taxes -11.4 -6.7
Change in provisions -5.8 5.3
Change in net working capital -16.6 -9.2
Other -21.2 -31.7
Cash flow from operating activities -37.8 -7.5
Interest payments (net) -6.5 -9.1
Capital expenditure -7.6 -8.1
Free cash flow -51.9 -24.7
Other cash flows (incl. dividend) -18.2 -2.5
Decrease (+), increase (-) in net financial debt -70.1 -27.2
*Exchange rate effects have been eliminated in the cash flow statement. For this reason, the changes shown here are not fully reflected in the balance sheet.
12
Interim Financial Report January 1 – June 30, 2009
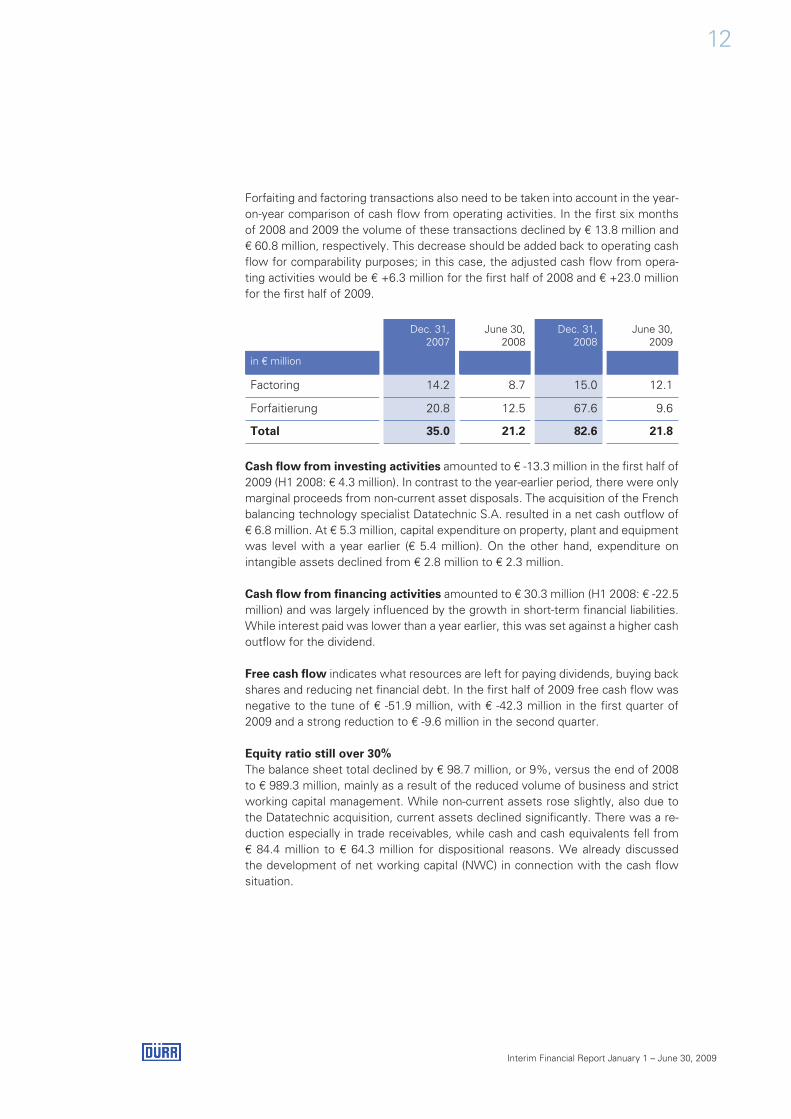
Forfaiting and factoring transactions also need to be taken into account in the year-on-year comparison of cash flow from operating activities. In the first six months of 2008 and 2009 the volume of these transactions declined by € 13.8 million and € 60.8 million, respectively. This decrease should be added back to operating cash flow for comparability purposes; in this case, the adjusted cash flow from opera-ting activities would be € +6.3 million for the first half of 2008 and € +23.0 million for the first half of 2009.
Dec. 31,2007
June 30,2008
Dec. 31, 2008
June 30,2009
in € million
Factoring 14.2 8.7 15.0 12.1
Forfaitierung 20.8 12.5 67.6 9.6
Total 35.0 21.2 82.6 21.8
Cash flow from investing activities amounted to € -13.3 million in the first half of 2009 (H1 2008: € 4.3 million). In contrast to the year-earlier period, there were only marginal proceeds from non-current asset disposals. The acquisition of the French balancing technology specialist Datatechnic S.A. resulted in a net cash outflow of € 6.8 million. At € 5.3 million, capital expenditure on property, plant and equipment was level with a year earlier (€ 5.4 million). On the other hand, expenditure on intangible assets declined from € 2.8 million to € 2.3 million.
Cash flow from financing activities amounted to € 30.3 million (H1 2008: € -22.5 million) and was largely influenced by the growth in short-term financial liabilities. While interest paid was lower than a year earlier, this was set against a higher cash outflow for the dividend. Free cash flow indicates what resources are left for paying dividends, buying back shares and reducing net financial debt. In the first half of 2009 free cash flow was negative to the tune of € -51.9 million, with € -42.3 million in the first quarter of 2009 and a strong reduction to € -9.6 million in the second quarter. Equity ratio still over 30%The balance sheet total declined by € 98.7 million, or 9%, versus the end of 2008 to € 989.3 million, mainly as a result of the reduced volume of business and strict working capital management. While non-current assets rose slightly, also due to the Datatechnic acquisition, current assets declined significantly. There was a re-duction especially in trade receivables, while cash and cash equivalents fell from € 84.4 million to € 64.3 million for dispositional reasons. We already discussed the development of net working capital (NWC) in connection with the cash flow situation.

13
Interim Financial Report January 1 – June 30, 2009
On the equity and liabilities side, there were only marginal changes in equity and non-current liabilities versus year-end 2008. The dividend payment and the loss led to a moderate reduction in equity to € 325.9 million at the mid-year mark (Decem-ber 31, 2008: € 341.4 million). Owing to the smaller balance sheet total the equity ratio rose from 31.4% (December 31, 2008) to 32.9%.
Net financial debt amounted to € 104.5 million as of June 30 as compared to € 89.0 million a year earlier and € 34.4 million at the end of 2008. We met our financing requirements from cash and cash equivalents and through an increase in bank liabilities. Dürr’s financing requirements are usually higher during the year than at the end of the year.
While short-term financial liabilities rose, there was a marked reduction in trade payables. This was due not least to the fact that, owing to the restraint in placing new orders, prepayments received from customers declined by € 24.8 million ver-sus the end of 2008 to € 132.5 million. The ratio of prepayments received to orders on hand remained stable at just over 15%. This indicates that the payment morale of our customers has not deteriorated. Current and non-current liabilities
June 30,2009
June 30,2008
Dec. 31, 2008
in € million
Financial liabilities (incl. bond) 172.5 209.8 122.6
Provisions (incl. pensions) 111.7 119.9 117.5
Trade payables 266.8 381.2 372.2
of which: prepayments received 132.4 178.9 157.3
Income tax liabilities 6.5 27.7 15.7
Other liabilities (incl. deferred taxes, deferred income) 105.9 108.5 118.6
Total 663.4 847.1 746.6

14
Interim Financial Report January 1 – June 30, 2009
R&D and capital expenditures
Direct expenses for research and development (R&D) recognized in the income statement increased to € 12.7 million in the first half of 2009 (H1 2008: € 12.1 million). As a result, the R&D ratio, that is the ratio of these R&D expenses to sales revenues, rose to 2.2% (H1 2008: 1.6%). If additional project-related development expenses which arise in connection with customer orders are included, both R&D spending and the ratio were much higher and above the year-earlier level. Another € 0.9 million of expenditure for research and development was capitalized (H1 2008: € 1.1 million).
A focus of our R&D activities is the development of modular and scalable manufacturing systems. With such FlexLine concepts customers can start production with low volumes and then expand the line for higher capacities according to market developments.
In application technology we introduced the new EcoBell2 HX universal atomizer. In automobile and truck production it is particularly well suited for customers with complex painting applications such as interior and exterior painting in one zone. The atomizer is also ideal for the production of plastic fittings such as bumpers and for repair zones.
As an engineering group we provide our customers with support already at the early stage of process and plant planning. We have developed a new software tool for these consulting activities: the Dürr Snap-Planner enables different layout and process versions for future production lines to be modeled efficiently on the computer. Features such as unit costs and CO2 emissions can also be calculated. Originally developed by the Cleaning and Filtration Systems business unit, the Dürr Snap-Planner has meanwhile also been used by Dürr Consulting and in the planning of FAStplant assembly lines.
In balancing technology we are bringing a new static balancer to the market. This enables imbalances to be determined without rotating the workpiece. Instead, the high-precision balancing machine diagnoses imbalances by measuring the weight distribution of the workpiece at three weighing points. “Non-rotating balancing” is ideal for instance for sensitive rotors such as unfired grinding disks, propellers and rolling stock wheels. The system is very energy efficient as no drive is required because the workpieces are not rotated.
15
Interim Financial Report January 1 – June 30, 2009
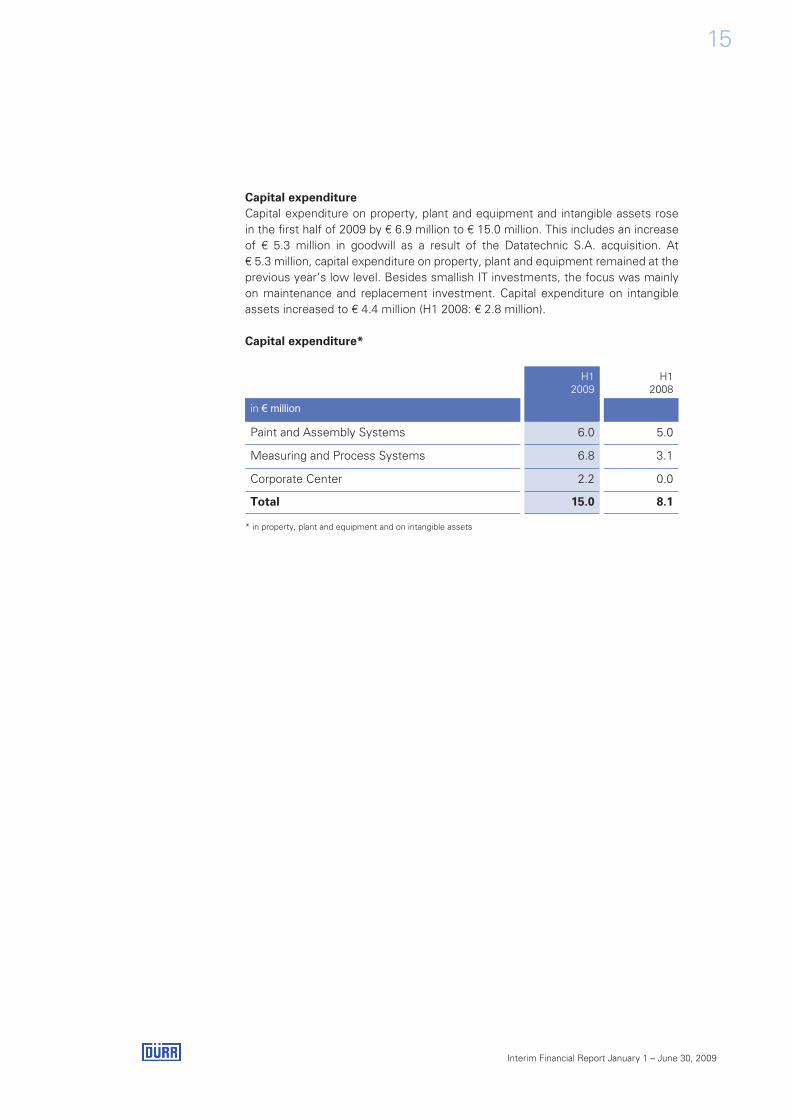
Capital expenditureCapital expenditure on property, plant and equipment and intangible assets rose in the first half of 2009 by € 6.9 million to € 15.0 million. This includes an increase of € 5.3 million in goodwill as a result of the Datatechnic S.A. acquisition. At € 5.3 million, capital expenditure on property, plant and equipment remained at the previous year’s low level. Besides smallish IT investments, the focus was mainly on maintenance and replacement investment. Capital expenditure on intangible assets increased to € 4.4 million (H1 2008: € 2.8 million).
Capital expenditure*
H1 2009
H1 2008
in € million
Paint and Assembly Systems 6.0 5.0
Measuring and Process Systems 6.8 3.1
Corporate Center 2.2 0.0
Total 15.0 8.1
* in property, plant and equipment and on intangible assets

16
Interim Financial Report January 1 – June 30, 2009
Employees
Planned capacity adjustments implementedThe Dürr Group had 5,906 employees as of June 30, 2009. That was 3.9% fewer than at year-end 2008 and 2.3% less than on June 30, 2008. 68 employees were added in the second half of 2008 by the full consolidation of Verind S.p.A. of Italy for the first time; another 34 employees were added in April 2009 with the first- time consolidation of Datatechnic S.A. We have cut about 300 jobs since the fourth quarter of 2008 in response to the weak demand. The cuts were mainly in France and the USA. The number of employees in the emerging markets was slightly lower than at year-end 2008 at 1,397 (December 31, 2008: 1,416). They mean-while account for 23.7% of the Group’s total workforce.
Employees
June 30, 2009
June 30,2008
Dec. 31,2008
Paint and Assembly Systems 3,433 3,560 3,595
Measuring and Process Systems 2,427 2,437 2,499
Corporate Center 46 47 49
Total 5,906 6,044 6,143
Company officers
There were no changes in the Board of Management or Supervisory Board in the reporting period.
17
Interim Financial Report January 1 – June 30, 2009
Overview of the divisions
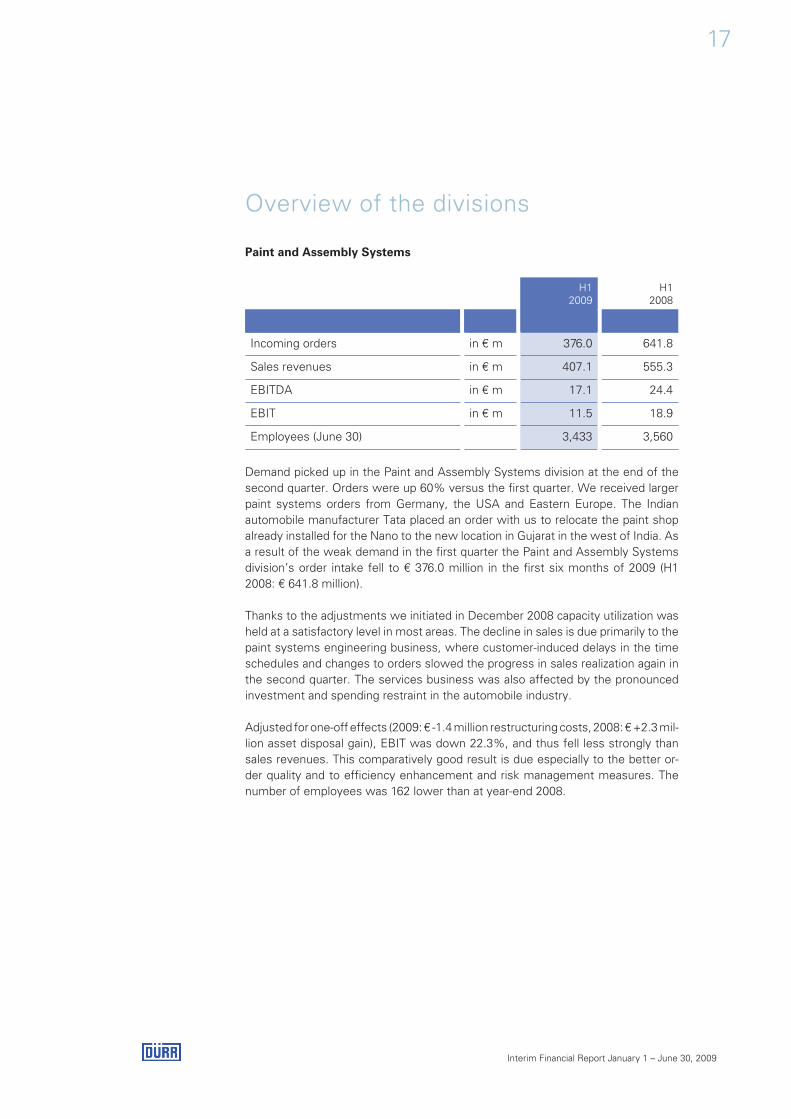
Paint and Assembly Systems
H1 2009
H1 2008
Incoming orders in € m 376.0 641.8
Sales revenues in € m 407.1 555.3
EBITDA in € m 17.1 24.4
EBIT in € m 11.5 18.9
Employees (June 30) 3,433 3,560
Demand picked up in the Paint and Assembly Systems division at the end of the second quarter. Orders were up 60% versus the first quarter. We received larger paint systems orders from Germany, the USA and Eastern Europe. The Indian automobile manufacturer Tata placed an order with us to relocate the paint shop already installed for the Nano to the new location in Gujarat in the west of India. As a result of the weak demand in the first quarter the Paint and Assembly Systems division’s order intake fell to € 376.0 million in the first six months of 2009 (H1 2008: € 641.8 million).
Thanks to the adjustments we initiated in December 2008 capacity utilization was held at a satisfactory level in most areas. The decline in sales is due primarily to the paint systems engineering business, where customer-induced delays in the time schedules and changes to orders slowed the progress in sales realization again in the second quarter. The services business was also affected by the pronounced investment and spending restraint in the automobile industry.
Adjusted for one-off effects (2009: € -1.4 million restructuring costs, 2008: € +2.3 mil- lion asset disposal gain), EBIT was down 22.3%, and thus fell less strongly than sales revenues. This comparatively good result is due especially to the better or-der quality and to efficiency enhancement and risk management measures. The number of employees was 162 lower than at year-end 2008.

18
Interim Financial Report January 1 – June 30, 2009
Measuring and Process Systems
H12009
H1 2008
Incoming orders in € m 130.7 234.3
Sales revenues in € m 164.4 197.3
EBITDA in € m 0.4 10.9
EBIT in € m -3.1 8.0
Employees (June 30) 2,427 2,437
The Measuring and Process Systems division also suffered substantial declines in new orders in the first six months. However, the development of its two business units differed in the second quarter: while Cleaning and Filtration Systems only saw an improvement in new orders in June, business at Balancing and Assembly Products was better than in the first quarter throughout the second quarter.
Earnings performance also differed. Balancing and Assembly Products achieved a reduced but still positive result in the first half of 2009. Earnings at Cleaning and Filtration Systems, on the other hand, were still burdened by capacity utilization problems especially in France and the USA. The business unit reacted with further structural adjustments: 80 jobs were cut in the first six months and a further re-duction of a similar magnitude is planned in the second half of the year.
The number of employees in the Measuring and Process Systems division, inclu-ding Datatechnic S.A., declined by a net 72 versus year-end 2008. The real estate and services subsidiary Schenck Technologie- und Industriepark GmbH, which is part of the Measuring and Process Systems division, continued its positive perfor-mance and achieved a good result on the back of a high occupancy level.
Corporate Center Corporate Center (Dürr AG) EBIT in the first half of 2009 came to € -1.5 million, after € -2.3 million in the same period last year. The slight improvement is due mainly to lower expenses of € 0.9 million for the Campus project (H1 2008: € 1.7 million).
In addition to the earnings contributions from the two divisions (€ 8.5 million) and from the Corporate Center (€ -1.5 million), consolidated Group EBIT includes ear-nings effects from the application of new IFRS rules (IAS 23 / € -0.5 million) and the elimination of consolidation effects (€ -0.3 million). In this connection we would draw your attention to the reconciliation statement on page 37.
19
Interim Financial Report January 1 – June 30, 2009
Opportunities and risks
RisksThe usual risks in our business and the instruments, processes and structures we use to counter them are discussed in detail in our Annual Report for 2008.
The Group’s current risk profile continues to be shaped by the effects of the glo-bal economic weakness. Compared with the first quarter of 2009 some positive tendencies have been discernible of late in this respect:
• The economic stimulus programs launched in many countries have helped to stabilize economic output over the past weeks. Against this backdrop the con- cerns over an even steeper fall of the world economy have given way to guarded optimism.
• Unit sales in the automobile industry showed signs of bottoming out in the second quarter. Sales did not fall further in the established markets and wit- nessed in part strong upturns in the first six months in the growth markets.
• The automobile industry placed a number of strategically important large orders again in the second quarter after virtually no major investment decisions were taken in the first quarter.
• In addition, more new investment projects are planned again in the emerging markets. From today’s vantage point it appears likely that there will be a number of larger orders in the pipeline due to be awarded from the fourth quarter of 2009 onwards.
• Several automobile manufacturers have increased production recently. Parallel with this, demand for spare parts picked up again towards the middle of the year.
• Apart from Chrysler and GM, no other insolvencies or defaults among important customers are foreseeable at present.
Despite the slightly improved market outlook we are continuing to monitor pay-ment receipts from customers that do not have investment grade ratings very closely. We are also constantly analyzing the supplier side for potential risks of fai-lure on the basis of an early warning signal system. The risks of capacity underuti-lization and a deterioration of order quality still persist, especially if the stabilization of new orders currently discernible does not continue.
We see no financing risks for the Group as we completed a comprehensive refi-nancing in September 2008. Our € 440 million syndicated loan (€ 200 million credit line, € 240 million guarantee facility) and the remaining half (€ 100 million) of our corporate bond do not mature until the second half of 2011.

20
Interim Financial Report January 1 – June 30, 2009
OpportunitiesThe opportunities for our business are also discussed in detail in our Annual Re-port for 2008. We see potential for a more pronounced revival in our core busi-ness especially on the services side and in the emerging markets of Asia, Eastern Europe and Latin America. Experts, including more recently Booz & Company, predict strong growth in vehicle numbers in these regions in the coming decade. The process of building up the additional local production capacities needed to meet this demand will continue; we have registered growing project activity again in these countries of late. In addition to the regional shifts, the market shares of the individual automobile manufacturers are also seen to be changing significantly; moreover, demand is shifting more and more towards smaller, economical auto-mobiles.
We expect demand in the currently very weak North American automobile mar-ket to recover appreciably in two to three years’ time. There are several factors that support this view: growing replacement demand among consumers after the current spending restraint, mid to long-term population growth, and the structural shift towards more economical, environment-friendly drive technologies. On top of that, there are shifts on the supply side: in the course of the Chrysler and GM insolvency proceedings numerous plants have been closed; these capacities will be lacking and will need to be replaced in an upswing. Moreover, new plants are likely to be built by Asian and European manufacturers that want to increase their market shares in North America. Finally, existing plants will be re-equipped and modernized in the future.
In view of the rising energy prices expected in the mid term and for ecological reasons our customers are investing increasingly in sustainable, energy-efficient manufacturing systems. We stand to benefit from this trend as we already fo-cused on developing environmentally compatible, resource-saving manufacturing technologies early on.
We are aiming to increase our sales revenues from business with the Japanese automobile industry to over € 100 million in the mid term. The conditions for this are good as we entered into a cooperation agreement with the Japanese company Parker Engineering at the beginning of 2009. Parker Engineering is Japan’s third largest supplier of paint systems and has close relations with the Japanese auto-mobile industry.
With the acquisition of Datatechnic S.A. we have positioned ourselves for further growth in business with balancing technology for the turbocharger industry. Further details can be found on page 6 of this report.
Good opportunities for profitable growth are also presented by our business in paint and assembly systems for the aircraft industry. We recently received a tech-nologically demanding order from Lockheed that has further improved our starting position for building up our activities in the lucrative US market.

21
Interim Financial Report January 1 – June 30, 2009
Related-party disclosures
These disclosures can be found in the notes to the consolidated financial state-ments on page 38.
Outlook
Customer-induced delays in the execution of orders in the plant engineering busi-ness, the weak services business and declining new orders, especially in mecha-nical engineering products for general industry, will also have a negative impact on sales realization in the further course of the year. We therefore expect a decline of up to one-fourth in sales revenues for the full year 2009.
Demand in our sales markets improved in the second quarter of 2009 compared with the two preceding quarters. We expect this trend to continue through to the end of the year. There are a number of plant engineering projects in the pipeline that should be awarded in the fourth quarter. The upturn seen in the mechanical engineering business since June should also continue. In the services business there are first signs that the investment freeze is slowly thawing. Against this backdrop we assume that incoming orders will exceed sales revenues in 2009. From today´s vantage point, at the end of the year orders on hand should therefore be slightly above the level at the beginning of 2009 (€ 925 million).
As a result of the reduction in sales revenues gross profit will be down in abso-lute terms. Overhead costs will continue to fall but this will only partly offset the decline in gross profit. We expect EBIT of between € 20 and 30 million before restructuring costs (up to € 9 million).
The interest result will improve as a result of the refinancing in 2008. Owing to the project postponements in the automobile industry we expect to draw more strongly on the syndicated loan on average this year. On the other hand, the partial redemption of our high-yield bond in October 2008 will reduce interest expense. In addition, the one-off refinancing costs of € 9.4 million included in the interest result in 2008 will fall away this year. However, we assume more unfavorable interest rate terms in the second half of the year.
We see the positive cash flow trend in the second quarter continuing and expect a positive operating cash flow in the second half of the year, to which an upturn in prepayments received and our strict cash and net working capital management should contribute. However, for 2009 as a whole cash flow from operating activi-ties will probably still be negative.
We will be confining capital expenditure to the essential, with the focus on re-placement investment. Net financial debt will probably be above the year-end 2008 level in 2009. We assume that the equity ratio will also reach a level above 30% at the end of the year.

22
Interim Financial Report January 1 – June 30, 2009
Treasury stock and capital changes
Dürr AG owns no treasury stock. In the reporting period there were no changes in the company’s subscribed capital of € 44.3 million, which is divided into 17.3 million shares.
Development of Dürr stock
While concerns over the financial and economic crisis had still predominated at the beginning of the year, sentiment on the equity markets brightened in the second quarter. Several banks posted respectable profits again in the first half year; there was a veritable boom in issuance on the market for corporate bonds.
The Dürr stock lost 10% in price in the first six months, which was much less than most other stocks in the engineering sector. The DAX lost 4%, while the SDAX managed to recoup almost all of its losses from the beginning of the year.
Dürr indexed DAX indexed MDAX indexed SDAX indexed
50
60
70
80
90
100
110
120
January 09 February 09 May 09 July 09March 09 April 09 June 09
in %

23
Interim Financial Report January 1 – June 30, 2009
Shareholder structureThere were no changes in the shareholder structure in the second quarter. The Dürr family added slightly to its holdings through Heinz Dürr GmbH in July 2009. The present shareholder structure is as follows:
The free float as calculated by Deutsche Börse is 35.7%.
Events subsequent to the reporting date
No exceptional or reportable events took place between the end of the reporting period and the time this interim report was published.
Stuttgart, August 6, 2009
Dürr Aktiengesellschaft
The Board of Management
38.6%
3.5%
27.7%
17.2%
5.0%
8.0%Heinz Dürr GmbH, Berlin
Heinz und Heide Dürr Stiftung GmbH, Berlin
Institutional and private investors (including approx. 1.3% held by Dürr AG´s Board of Management)
ATON GmbH, Fulda
Süd-Kapitalbeteiligungs-Gesellschaft mbH, Stuttgart
Harris Associates L. P., Chicago

24
Interim Financial Report January 1 – June 30, 2009
Consolidated income statementof Dürr Aktiengesellschaft, Stuttgart, for the period January 1 to June 30, 2009
H1 2009 H1 2008 Q22009
Q22008
Amounts in € k
Sales revenues 571,508 752,668 261,971 396,509
Cost of sales -456,780 -625,056 -208,175 -329,482
Gross profit on sales 114,728 127,612 53,796 67,027
Selling expenses -50,094 -48,947 -24,575 -25,293
General and administrative expenses -41,786 -44,464 -19,769 -22,311
Research and development costs -12,709 -12,071 -6,584 -6,340
Other operating income and expenses -1,239 2,435 -20 1,130
8,900 24,565 2,848 14,213
Restructuring expenses/onerous contracts -2,765 - -1,471 -
Earnings before investment income, interest and similar income, interest and similar expenses, and income taxes 6,135 24,565 1,377 14,213
Profit/loss from entities accounted for using the equity method 801 1,250 470 874
Interest and similar income 928 2,381 610 443
Interest and similar expenses -9,574 -12,786 -4,934 -6,410
Earnings before income taxes -1,710 15,410 -2,477 9,120
Income taxes -4,934 -4,595 -4,643 -2,771
Profit/loss from continuing operations -6,644 10,815 -7,120 6,349
Profit/loss from discontinued operations - -93 - -93
Net profit/loss for the period of the Dürr Group -6,644 10,722 -7,120 6,256
Profit/loss share of minority interests
Continuing operations 581 830 232 534
Discontinued operations - - - -
Dürr Group 581 830 232 534
Profit/loss share of shareholders of Dürr Aktiengesellschaft
Continuing operations -7,225 9,985 -7,352 5,815
Discontinued operations - -93 - -93
Dürr Group -7,225 9,892 -7,352 5,722
Earnings per share in € (basic and diluted)
Continuing operations -0.42 0.63 -0.43 0.36
Discontinued operations 0.00 0.00 0.00 0.00
Dürr Group -0.42 0.63 -0.43 0.36

25
Interim Financial Report January 1 – June 30, 2009
Statement of total comprehensive income of Dürr Aktiengesellschaft, Stuttgart, for the period January 1 to June 30, 2009
H1 2009
H1 2008
Amounts in € k
Net profit/loss of the Dürr Group -6,644 10,722
Other comprehensive income
Gains/losses resulting from changes in the fair value of financial instruments used for hedging purposes
Changes of unrealized gains/lossesReclassification adjustments for gains/losses recognized innet income in the current period
2,304
-1,169
2,089
-2,200
Total unrealized gains/losses 1,135 -111
Changes in the fair value of a put option recognized in equity - -1,945
Currency translation reserve resulting from the consolidation of foreign subsidiaries 3,001 -11,380
Currency translation reserve resulting from entities accounted for using the equity method -841 -66
Gains/losses from non-current assets classified as held for sale - 2,800
Actuarial gains/losses from defined benefit obligations and similar obligations 980 -
Deferred taxes on other comprehensive income -619 -5
Other comprehensive income after tax 3,656 -10,707
Total comprehensive income after tax -2,988 15
of which attributable to minority interestsof which attributable to shareholders of Dürr Aktiengesellschaft
581
-3,569
356
-341

26
Interim Financial Report January 1 – June 30, 2009
Consolidated balance sheetof Dürr Aktiengesellschaft, Stuttgart, as of June 30, 2009
June 30, 2009
June 30,2008
Dec. 31, 2008
Amounts in € k
Assets
Goodwill 271,283 260,155 265,974
Other intangible assets 37,227 30,161 36,131
Property, plant and equipment 89,911 88,606 89,005
Investment property 20,744 13,436 21,019
Investments in entities accounted for using the equity method 12,997 12,478 13,040
Other financial assets 344 348 342
Trade receivables 1,588 2,499 2,803
Income tax receivables 116 156 116
Other receivables and other assets 5,967 8,453 5,950
Deferred taxes 5,863 4,600 4,716
Prepaid expenses 6,809 313 4,383
Non-current assets 452,849 421,205 443,479
Inventories and prepayments 71,429 73,311 77,923
Trade receivables 362,917 442,463 443,810
Income tax receivables 6,355 8,051 6,377
Other receivables and other assets 25,858 73,157 29,294
Cash and cash equivalents 64,338 116,111 84,385
Prepaid expenses 5,529 7,235 2,745
Current assets 536,426 720,328 644,534
Total assets Dürr Group 989,275 1,141,533 1,088,013
Equity and liabilities
Subscribed capital 44,289 44,289 44,289
Capital reserve 200,186 200,113 200,186
Revenue reserves 112,496 98,512 131,814
Accumulated other comprehensive income -38,400 -50,327 -42,039
Equity without minority interests 318,571 292,587 334,250
Minority interests 7,312 1,889 7,119
Equity with minority interests 325,883 294,476 341,369
Provisions for post-employment benefit obligations 51,257 50,459 52,222
Other provisions 6,513 7,741 8,575
Bond 97,529 192,704 96,917
Other financial liabilities 6,554 7,756 6,854
Income tax liabilities - 15,397 123
Other liabilities 15,053 16,960 16,189
Deferred taxes 23,868 18,300 19,513
Deferred income 852 1,067 895
Non-current liabilities 201,626 310,384 201,288
Other provisions 53,910 61,662 56,663
Trade payables 1) 266,825 381,186 372,179
Financial liabilities 68,410 9,317 18,834
Income tax liabilities 6,484 12,273 15,601
Other liabilities 1) 65,547 71,638 81,666
Deferred income 590 597 413
Current liabilities 461,766 536,673 545,356
Total equity and liabilities Dürr Group 989,275 1,141,533 1,088,013
1Adjusted previous year figures as of June 30, 2008, compare page 138 Annual Report 2008

27
Interim Financial Report January 1 – June 30, 2009
Consolidated statement of changes in shareholders´ equityof Dürr Aktiengesellschaft, Stuttgart, for the period January 1 to June 30, 2009
Subscribed capital
Capital reserve
Revenue reserves
Accumula-ted other compre-hensive income
Amounts resulting
from assets
held for sale
Equity without minority
interestsMinority interests
Equity with
minority interests
Amounts in € k
January 1, 2008 40,264 160,459 94,911 -37,294 -2,800 255,540 1,569 257,109
Total comprehensive income after tax - - 9,892 -13,033 2,800 -341 356 15
Capital increase Dürr Aktiengesellschaft 4,025 39,654 - - - 43,679 - 43,679
Dividends - - -6,291 - - -6,291 -36 -6,327
June 30, 2008 44,289 200,113 98,512 -50,327 - 292,587 1,889 294,476
January 1, 2009 44,289 200,186 131,814 -42,039 - 334,250 7,119 341,369
Total comprehensive income after tax - - -7,225 3,656 - -3,569 581 -2,988
Dividends - - -12,110 - - -12,110 -388 -12,498
Other changes - - 17 -17 - - - -
June 30, 2009 44,289 200,186 112,496 -38,400 - 318,571 7,312 325,883

28
Interim Financial Report January 1 – June 30, 2009
Consolidated cash flow statementof Dürr Aktiengesellschaft, Stuttgart, for the period January 1 to June 30, 2009
H1 2009
H1 2008
Amounts in € k
Earnings before income taxes -1,710 15,410
Income taxes paid -11,359 -6,736
Net interest 8,646 10,405
Profit/loss from entities accounted for using the equity method -801 -1,250
Dividends from entities accounted for using the equity method - 504
Amortization and depreciation of non-current assets 10,344 8,957
Net gain/loss on the disposal of non-current assets -270 -3,640
Other non-cash income and expenses -11 23
Changes in operating assets and liabilities
Inventories 6,793 -16,591
Trade receivables 86,954 -47,470
Other receivables and assets 5,683 -11,184
Provisions -5,764 5,280
Trade payables -110,313 54,818
Other liabilities (other than bank) -20,832 -11,945
Other assets and liabilities -5,110 -4,069
Cash flow from operating activities -37,750 -7,488
Purchase of intangible assets -2,259 -2,751
Purchase of property, plant and equipment -5,289 -5,376
Purchase of entities accounted for using the equity method -13 -
Proceeds from the sale of non-current assets 246 10,768
Acquisitions, net of cash acquired -6,832 -
Interest received 886 1,628
Cash flow from investing activities -13,261 4,269
Change in current bank liabilities 50,974 -4,552
Repayment of non-current financial liabilities -275 -499
Payment of finance lease liabilities -437 -417
Repayment (borrowing) of financial liabilities due to entities accounted for using the equity method -2 19
Dividends paid to shareholders of Dürr Aktiengesellschaft -12,110 -6,291
Dividends paid to minority interests -388 -36
Interest paid -7,470 -10,707
Cash flow from financing activities 30,292 -22,483
Effects of exchange rate changes 672 -5,676
Changes in cash and cash equivalents -20,047 -31,378
Cash and cash equivalents
At the beginning of the period 84,385 147,489
At the end of the period 64,338 116,111
29
Interim Financial Report January 1 – June 30, 2009
Notes to the consolidated financial statements January 1 to June 30, 2009
1. Summary of significant accounting policies
The Company
Dürr Aktiengesellschaft (“Dürr AG” or the “Company”) is headquartered in Stutt-gart, Germany. The Dürr Group (“Dürr” or the “Group”) consists of Dürr AG and its subsidiaries. The Dürr Group specializes in mechanical and plant engineering and is one of the global market leaders in almost all of its fields of business. It generates some 85% of sales revenues with the automotive industry, but also acts as supplier of production technology for other industries including the aviation, mechanical engineering, and energy industry as well as the chemical and phar-maceutical industries. Dürr serves the market with two divisions: the Paint and Assembly Systems division offers production and painting technologies, mainly for automotive bodyshells. The machines and systems produced by the Measuring and Process Systems division are mainly used in engine and transmission produc-tion as well as final assembly.
Accounting policies
The consolidated financial statements are prepared in accordance with Interna-tional Financial Reporting Standards (IFRS) as adopted by the European Union as of the balance sheet date, and the additional requirements of German commercial law pursuant to Sec. 315a (1) HGB („Handelsgesetzbuch“: German Commercial Code). The consolidated financial statements are in line with all IFRSs that have to be adopted by the balance sheet date. Due to the application of IAS 34 „Interim Financial Reporting“, these financial statements do not include all of the informa-tion and footnotes required by IFRS for complete financial statements for year-end reporting.
The consolidated financial statements as of June 30, 2009 are not subject to any review or audit in accordance with Sec. 317 HGB.
With regard to the preparation of consolidated financial statements for interim re-porting in accordance with IAS 34 the Management Board has to make estimates and judgements, which influence the application of accounting policies within the Company and the reporting of assets and liabilities as well as income and ex-penses. The actual amounts can differ from these estimates.

30
Interim Financial Report January 1 – June 30, 2009
The accounting policies used generally correspond to the methods applied in the consolidated financial statements as of December 31, 2008; we refer to our 2008 annual report. Changes in the accounting policies during the first six months of fiscal year 2009 mainly arose from the following new or amended standards, for which an application is mandatory since January 1, 2009.
IAS 1 “Presentation of Financial Statements”: One significant change compared to the previous version is the presentation of changes in equity. IAS 1 now prescribes that all changes other than those arising from transactions with owners have to be presented either in a statement of comprehensive income or in two separate statements. Dürr decided to present these changes in two schedules. Compo-nents of comprehensive income are no longer permitted to be presented in the statement of changes in equity. In addition, IAS 1 requires income tax relating to each component of other comprehensive income and reclassification adjustments to be disclosed separately. Furthermore, IAS 1 introduces new titles for the indi-vidual financial statement elements; entities may use titles other than those set forth in the standard, however.
IAS 23 “Borrowing Costs”: The IASB issued an amended version of IAS 23 in March 2007. It requires borrowing costs that are directly attributable to the acqui- sition, construction or production of a qualifying asset to be capitalized. The pre-vious option of immediately recognizing borrowing costs as an expense was elimi-nated. For further information see note 8.
IFRS 8 “Operating Segments”: IFRS 8 replaces IAS 14 “Segment Reporting”. IFRS 8 requires the disclosure of financial and narrative information on the repor-table segments. Reportable segments are either operating segments or aggrega-tions of operating segments that meet specified criteria. Operating segments are components of an entity on which separate financial information is available that is evaluated regularly by the chief operating decision maker in deciding how to allocate resources and in assessing performance. Generally, financial information is required to be reported on the basis used internally for evaluating operating seg-ment performance (management approach).
Income that is recorded during the reporting period for seasonal reasons, due to cyclical developments, or only occasionally is not cut off in the consolidated inte-rim financial statements. Expenses that are incurred irregularly during the repor-ting period have been cut off in those cases where they would also be cut off at year-end.
The income taxes were determined on the basis of an estimated average annual effective income tax rate.
The consolidated financial statements are prepared in euros; all amounts are re-ported in thousands of euros (€ k), unless stated otherwise.

31
Interim Financial Report January 1 – June 30, 2009
2. Consolidated group
Besides Dürr AG, the consolidated financial statements as of June 30, 2009, con-tain all domestic and foreign companies which Dürr AG can control directly or indirectly (control concept). The entities are included in the consolidated finan-cial statements from the date on which the possibility of control was obtained. Joint ventures and associates are included in the consolidated financial statements using the equity method from the date on which joint control or the possibility of significant influence, respectively, has started to exist.
The table below shows the number of entities included in the consolidated group besides Dürr AG.
June 30, 2009
Dec. 31, 2008
Number of fully consolidated entitiesGermany
9 10
Other countries 40 39
49 49
June 30, 2009
Dec. 31, 2008
Number of entities accounted for using the equity methodGermany 3 2
Other countries 1 1
4 3
The consolidated financial statements contain four entities (December 31, 2008: four) in which minority shareholders hold interests.
Effective as of April 2, 2009, Dürr acquired Datatechnic S.A., Uxegney, France. This rounds out Dürr´s product range for balancing turbochargers.
As of April 29, Dürr-Grundstücks-GmbH, Stuttgart, was merged into Dürr Systems GmbH, Stuttgart, with economic effect as of January 1, 2009.

32
Interim Financial Report January 1 – June 30, 2009
Dürr Systems GmbH and EDAG SIGMA Concurrent Engineering GmbH signed the articles of incorporation and bylaws for the joint venture Dürr EDAG Aircraft Systems GmbH on September 23, 2008. Dürr and EDAG each hold an interest of 50% in the joint venture, which is designed to accelerate marketing of their joint product and service range for the aviation industry. The company was registered in the commercial register on May 25, 2009. Dürr EDAG Aircraft Systems GmbH has been accounted for using the equity method as a joint venture in the consolidated financial statements.
3. Company acquisitions
As of April 2, 2009, 100% of the shares of Datatechnic S.A., Uxegney, France, were acquired. Datatechnic S.A. is a leading producer of balancing machines for turbochargers.
Datatechnic S.A. was first consolidated pursuant to IFRS 3 „Business Combina-tions“ under application of the acquisition method. The results of the acquired company were included in the consolidated financial statements starting as of the acquisition date. The contribution of Datatechnic S.A. to the net income of the pe-riod from the date of acquisition to June 30, 2009, amounted to € 57 thousand, the consolidated sales revenues included in this period amounted to € 453 thousand. If the acquisition had taken place as of January 1, 2009, the Group’s sales revenues for the first-half of 2009 would have amounted to € 573,456 thousand and the net loss of the period to € 6,999 thousand.
Aquired net assets and goodwill from the acquisition of Datatechnic S.A. are de-termined as follows:
April 2, 2009
Amounts in € k
Acquisition price 7,000
Costs directly attributable to the acquisition 142
Total purchase price 7,142
Current market value of the acquired net assets 1,826
Goodwill 5,316

33
Interim Financial Report January 1 – June 30, 2009
The total purchase price was allocated to the acquired assets and liabilities as follows:
Carrying amount before
acquisition Adjustment
Carrying amount
after acquisition
Amounts in € k
Intangible assets 7 1,364 1,371
Property, plant, and equipment
270 -11 259
Deferred tax assets - 157 157
Inventories 2,240 -1,946 294
Receivables and other assets 1,951 1,305 3,256
Cash and cash equivalents 310 - 310
Non-current liabilities -10 - -10
Deferred tax liabilities - -598 -598
Current liabilities -4,485 1,272 -3,213
Net assets 283 1,543 1,826
The carrying amounts after the acquisition correspond to the fair values at the time of the acquisition. The most essential adjustments were made for intangible assets. For those a non-competition clause and a customer relationship were capitalized in the course of the purchase price allocation. Additionally, adjustments were made to inventories, trade receivables and trade liabilities to the amounts determined applying IAS 11 “Construction Contracts” according to the percentage-of-comple-tion-method.
The acquisition costs of the company shares amounted to € 7,142 thousand. The goodwill of € 5,316 thousand reflects technology and cost synergy effects between balancing and correction technology as well as the positive earnings prospects of Datatechnic S.A. The goodwill was allocated to the Balancing and Assembly Pro-ducts business unit. The anticipated useful lives of the acquired intangible assets are as follows:
Fair value (in € k)
Useful life (in years)
Non-competition clause 249 5
Customer relationship 1,115 10
1,364

34
Interim Financial Report January 1 – June 30, 2009
4. Discontinued operations
The consolidated financial statements for the first six months of fiscal year 2009 include no subsequent effects from discontinued operations, whereas in the same period of 2008 € -93 thousand from the sale of the Services, Development Test Systems (DTS) and Measuring and Process Technologies (MPT) business units in fiscal year 2005 were included.
5. Earnings per share
Earnings per share are determined pursuant to IAS 33 „Earnings per Share“.
They are determined by dividing the earnings share of the shareholders of Dürr AG by the weighted average number of shares outstanding. The calculation is pre-sented below. In the reporting periods from January 1 to June 30, 2009 and 2008 there were no dilutive effects.
H12009
H12008
Profit/loss attributable to shareholders of Dürr AG in € k -7,225
9,892
of which continuing operations in € k -7,225 9,985
of which discontinued operations in € k - -93
Number of shares outstanding (weighted average) in k 17,300.5 15,762.6
Earnings per share (basic and diluted) € -0.42 0.63
of which continuing operations € -0.42 0.63
of which discontinued operations € 0.00 0.00

35
Interim Financial Report January 1 – June 30, 2009
6. Income tax effects relating to other comprehensive income
The following table shows the components of other comprehensive income and the associated tax effects, taking into account the changes of the items “Amounts resulting from assets held for sale” and “Minority interests”.
H1 2009 H1 2008
Amounts in € k Before taxTax
effect Net Before taxTax
effect Net
Net gains/losses (-) from derivatives used to hedge cash flows 1,057 -333 724 -111 -5 -116
Change in unrealized gains/losses (-) from a put option - - - -1,945 - -1,945
Exchange differences 2,995 - 2,995 -11,380 - -11,380
Exchange differences from entities accoun-ted for using the equity method -841 - -841 -66 - -66
Amounts recorded directly in equity from non-current assets classified as held for sale - - - 2,800 - 2,800
Change in net actuarial gains and losses from benefit obligations 980 -292 688 - - -
Other comprehensive income 4,191 -625 3,566 -10,702 -5 -10,707
7. Liabilities from restructuring measures
Liabilities from restructuring measures decreased by € 2,814 thousand to € 6,960 thousand compared to December 31, 2008. This was mainly due to the uti-lization of liabilities formed in prior periods, whereas an addition of € 171 thousand was recorded in the first six months of fiscal year 2009 with opposite effect.

36
Interim Financial Report January 1 – June 30, 2009
8. Segment reporting
The segment reporting was prepared according to IFRS 8 „Operating Segments“. Based on the internal reporting and organizational structure of the Group, the con-solidated financial statement data is presented by divisions. The segmentation aims to make the earnings power and the net assets and financial situation of the respective activities transparent.
The reporting is based on the divisions of the Group. The Dürr Group comprises a management holding and two divisions differentiated by product and service spectrum that each have global responsibility for their products and results. The Corporate Center mainly consists of Dürr AG.
Management monitors the EBIT (earnings before investment income, interest and similar income and similar expenses, and income taxes) of its divisions separately for the purpose of making decisions about resource allocation, determination of profitability and performance assessment. As the segment reporting in accordance with IFRS 8 is based on the internal reporting (management approach), EBIT can be measured differently from EBIT in the consolidated financial statements. Group financing (including interest income and interest expenses) and income taxes are managed on a group basis and are not allocated to the operating segments.
H1 2009
Paint and Assembly Systems
Measur-ing and Process
SystemsTotal
segmentsRecon-
ciliation
Total Dürr
Group
External sales revenues € k407,132 164,376 571,508 - 571,508
Sales revenues with other divisions € k 318 7,550 7,868 -7,868 -
Total sales revenues € k 407,450 171,926 579,376 -7,868 571,508
EBIT € k 11,550 -3,084 8,466 -2,331 6,135
Assets (as of June 30) € k 543,298 396,107 939,405 49,869 989,274
Employees (as of June 30) 3,433 2,427 5,860 46 5,906
H1 2008
Paint and Assembly Systems
Measur-ing and Process
SystemsTotal
segmentsRecon-
ciliation
Total Dürr
Group
External sales revenues € k555,335 197,333 752,668 - 752,668
Sales revenues with other divisions € k 269 13,848 14,117 -14,117 -
Total sales revenues € k 555,604 211,181 766,785 -14,117 752,668
EBIT € k 18,882 8,047 26,929 -2,457 24,472
Assets (as of June 30) € k 572,459 429,981 1,002,440 139,093 1,141,533
Assets (as of December 31) € k 609,657 407,088 1,016,745 71,268 1,088,013
Employees (as of June 30) 3,560 2,437 5,997 47 6,044

37
Interim Financial Report January 1 – June 30, 2009
Group figures are derived as follows from the segment figures:
H12009
H12008
Amounts in € k
EBIT of segments 8,466 26,929
EBIT of Corporate Center -1,506 -2,284
Reclassification borrowing costs in accordance with IAS 23
-543 -
Eliminations -282 -80
EBIT from continuing operations 6,135 24,565
EBIT from discontinued operations - -93
EBIT of Dürr Group 6,135 24,472
June 30, 2009
June 30,2008
Dec. 31,2008
Amounts in € k
Segment assets 939,405 1,002,440 1,016,745
Assets of Corporate Center 498,934 542,649 496,536
Eliminations -538,695 -544,952 -533,902
Cash and cash equivalents 64,338 116,111 84,385
Tax receivables 6,471 8,207 6,493
Investments in entities accounted for using the equity method
12,997 12,478 13,040
Deferred tax assets 5,824 4,600 4,716
Gross assets Dürr Group 989,274 1,141,533 1,088,013
The employees of the Corporate Center are reported in the reconciliation column.
The amended IAS 23 “Borrowing Costs” requires borrowing costs that are directly attributable to the acquisition, construction or production of a qualifying asset to be capitalized. The previous option of immediately recognizing borrowing costs as an expense was eliminated. In Dürr’s financial statements this leads to a reclas-sification of finance expenses, which are attributable to long-term construction contracts according to IAS 11 “Construction Contracts”, from interest expenses to cost of sales. As the internal monitoring is based on EBIT without financing costs, borrowing costs are not included in the segment results.

38
Interim Financial Report January 1 – June 30, 2009
9. Related-party transactions
Dr.-Ing. E. h. Heinz Dürr is the chairman of the Supervisory Board of Dürr AG and Dürr Systems GmbH. In the reporting period he received remuneration of € 69 thousand (prior period: € 53 thousand) for these duties. Dr.-Ing. E. h. Heinz Dürr is also a member of the supervisory board of Landesbank Baden-Württemberg. In the reporting period expenses of € 100 thousand (prior period: € 136 thousand) were payable to Heinz Dürr GmbH, Berlin, of which Dr.-Ing. E. h. Heinz Dürr is general manager, for reimbursement of office and travel expenses relating to supervisory board activities and for cost reimbursements for the Dürr office in the German capital, Berlin. For his former activity as general manager, Dr.-Ing. E. h. Heinz Dürr also received benefits from the pension commitment (of April 2, 1978, supplemented December 21, 1988) of € 189 thousand (prior period: € 186 thou-sand) in the reporting period.
Mr. Joachim Schielke is a Supervisory Board member of Dürr AG, member of the board of management of Landesbank Baden-Württemberg and chairman of the board of management of Baden-Württembergische Bank. From the current business relationship, a balance of € 1,681 thousand (prior period: € 40,183 thou-sand) was held at and liabilities from utilization of the cash line of the syndicated loan of € 15,000 thousand (prior period: € 0 thousand) were entered with Baden- Württembergische Bank as of the balance sheet date. Transactions with Baden-Württembergische Bank resulted in interest expenses of € 732 thousand (prior period: € 91 thousand) in the reporting period. The warranties and guarantees issued by Baden-Württembergische Bank on behalf of Dürr amounted to € 14,932 thousand as of the balance sheet date (prior period: € 23,551 thousand).
The Board of Management confirms that all the related-party transactions des-cribed above were carried out at arm’s length conditions.
39
Interim Financial Report January 1 – June 30, 2009
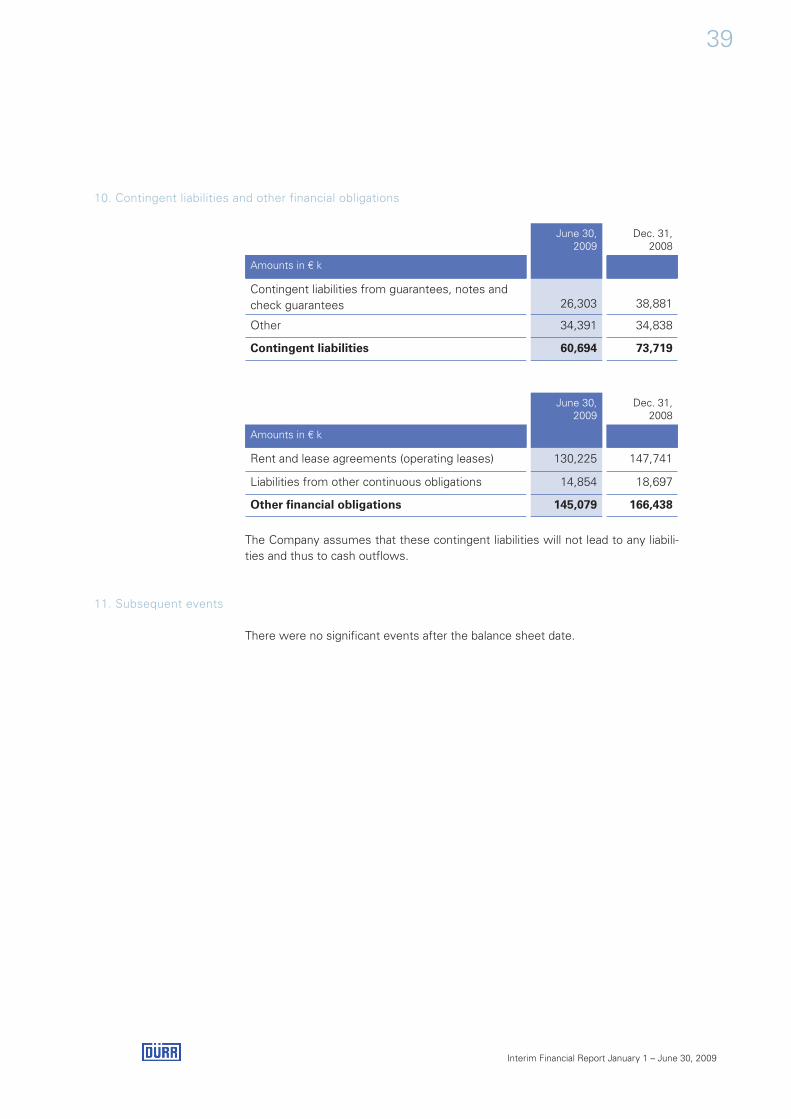
10. Contingent liabilities and other financial obligations
June 30, 2009
Dec. 31, 2008
Amounts in € k
Contingent liabilities from guarantees, notes and check guarantees 26,303 38,881
Other 34,391 34,838
Contingent liabilities 60,694 73,719
June 30, 2009
Dec. 31, 2008
Amounts in € k
Rent and lease agreements (operating leases) 130,225 147,741
Liabilities from other continuous obligations 14,854 18,697
Other financial obligations 145,079 166,438
The Company assumes that these contingent liabilities will not lead to any liabili-ties and thus to cash outflows.
11. Subsequent events
There were no significant events after the balance sheet date.
40
Interim Financial Report January 1 – June 30, 2009
Responsibility statement by management
To the best of our knowledge, and in accordance with the applicable reporting principles for interim financial reporting, the interim consolidated financial state-ments give a true and fair view of the assets, liabilities, financial position and profit or loss of the group, and the interim management report of the group includes a fair review of the development and performance of the business and the position of the group, together with a description of the principal opportunities and risks associated with the expected development of the group for the remaining months of the financial year.
Stuttgart, August 6, 2009
Dürr Aktiengesellschaft
The Board of Management
Ralf Dieter Ralph HeuwingChairman of the Board Chief Financial Officerof Management

41
Interim Financial Report January 1 – June 30, 2009
Financial calendar
August 26, 2009 Mechanical engineering conference of Commerzbank, Frankfurt/Main
November 05, 2009 Interim report for the first nine months of 2009
November 09 - 11, 2009 German Equity Forum, Frankfurt/Main
December 01 - 02, 2009 Mechanical engineering conference of BHF-Bank, Frankfurt/Main
Contact
Please contact us for Dürr AGfurther information: Günter Dielmann Corporate Communications & Investor Relations Carl-Benz-Strasse 34 74321 Bietigheim-Bissingen Germany Phone +49 7142 78-1785 Fax +49 7142 78-1716 [email protected] [email protected]
www.durr.com
This interim report is the English translation of the German original. The German version shall prevail.
This interim report includes forward-looking statements about future developments. As is the case for any business activity conducted in a global environment, such forward-looking statements are always subject to uncertainty. Our information is based on the conviction and assumptions of the Board of Management of Dürr AG, as developed from the information currently available. However, the following factors may affect the success of our strategic and operating measures: geopolitical risks, changes in general economic conditions (especially a prolonged recession in Europe or North America), exchange rate fluctuations and changes in interest rates, new products launched by competitors, and a lack of customer acceptance for new Dürr products or services, including growing competitive pressure. Should any of these factors or other imponderable circumstances arise, or should the assumptions underlying the forward-looking statements prove incorrect, actual results may differ from those projected. Dürr AG undertakes no obligation to provide continuous updates of forward-looking statements and information. Such statements and information are based upon the circumstances as of the date of their publication.