interim financial report at september 30, 2017 - amazon s3 · (antonella carù appointed by the...
TRANSCRIPT

Interim Financial Report
at September 30, 2017

1
PIRELLI & C. Società per Azioni (Joint Stock Company)
Milan Office
Viale Piero e Alberto Pirelli n. 25
Share Capital euro 1,904,374,935.66
Register of Companies of Milan No. 00860340157
REA (Economic Administrative Index) No. 1055

2
PIRELLI & C. S.p.A. - MILAN
SUMMARY
Macroeconomic and market scenario pg. 5
Significant events of the first nine months of 2017 pg. 8
Group performance and results pg. 15
Business Outlook for 2017 pg. 31
Significant events subsequent to the end of the quarter pg. 32
Alternative performance indicators pg. 33
Other information pg. 35
Financial Statements pg. 39
Declaration pursuant to the provisions of the Article 154-bis,
paragraph 2 of the Legislative Decree 58/1998 pg. 48
3
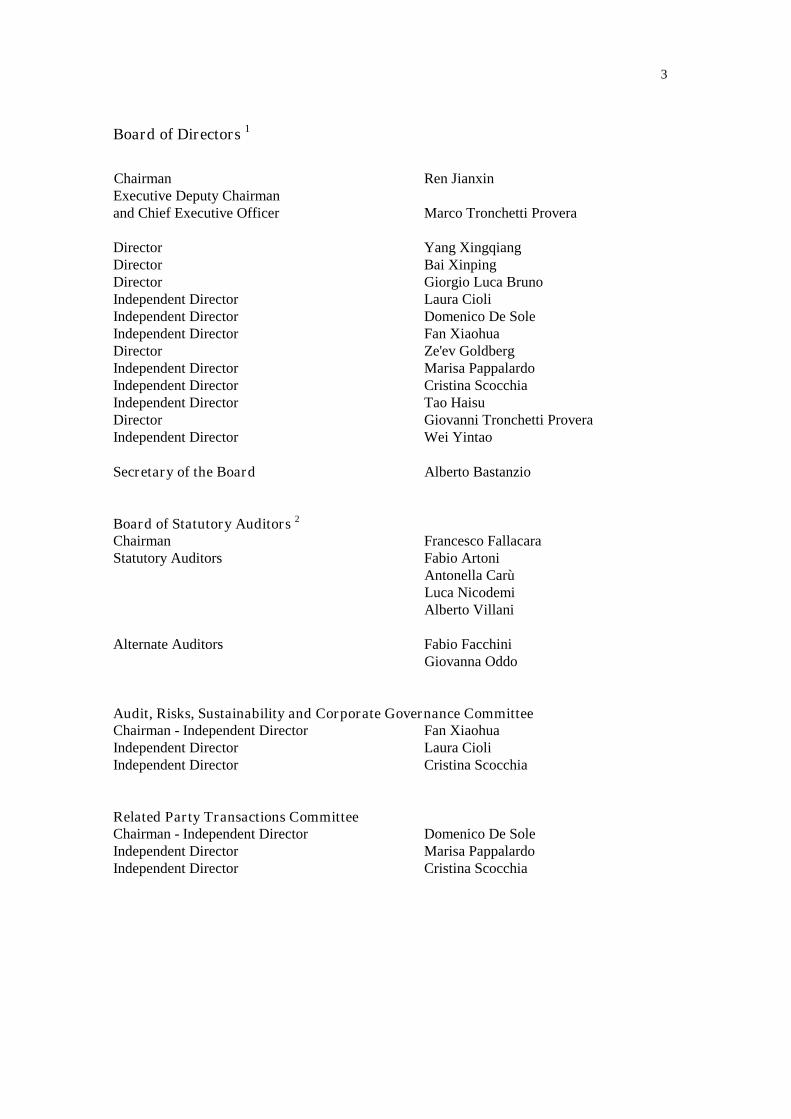
Board of Directors 1
Chairman Ren JianxinExecutive Deputy Chairmanand Chief Executive Officer Marco Tronchetti Provera
Director Yang XingqiangDirector Bai XinpingDirector Giorgio Luca BrunoIndependent Director Laura CioliIndependent Director Domenico De SoleIndependent Director Fan XiaohuaDirector Ze'ev GoldbergIndependent Director Marisa PappalardoIndependent Director Cristina ScocchiaIndependent Director Tao HaisuDirector Giovanni Tronchetti ProveraIndependent Director Wei Yintao
Secretary of the Board Alberto Bastanzio
Board of Statutory Auditors 2
Chairman Francesco FallacaraStatutory Auditors Fabio Artoni
Antonella CarùLuca NicodemiAlberto Villani
Alternate Auditors Fabio FacchiniGiovanna Oddo
Audit, Risks, Sustainability and Corporate Governance CommitteeChairman - Independent Director Fan XiaohuaIndependent Director Laura CioliIndependent Director Cristina Scocchia
Related Party Transactions CommitteeChairman - Independent Director Domenico De SoleIndependent Director Marisa PappalardoIndependent Director Cristina Scocchia
4
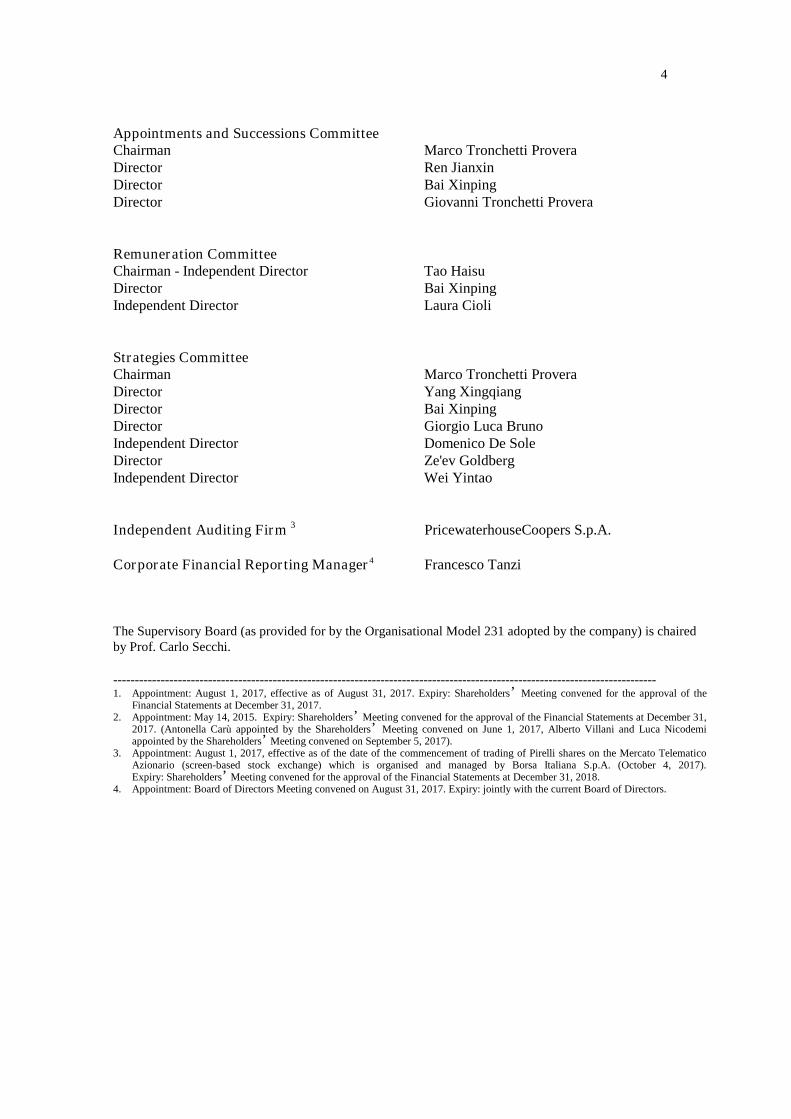
Appointments and Successions CommitteeChairman Marco Tronchetti ProveraDirector Ren JianxinDirector Bai XinpingDirector Giovanni Tronchetti Provera
Remuneration CommitteeChairman - Independent Director Tao HaisuDirector Bai XinpingIndependent Director Laura Cioli
Strategies CommitteeChairman Marco Tronchetti ProveraDirector Yang XingqiangDirector Bai XinpingDirector Giorgio Luca BrunoIndependent Director Domenico De SoleDirector Ze'ev GoldbergIndependent Director Wei Yintao
Independent Auditing Firm 3 PricewaterhouseCoopers S.p.A.
Corporate Financial Reporting Manager4 Francesco Tanzi
The Supervisory Board (as provided for by the Organisational Model 231 adopted by the company) is chairedby Prof. Carlo Secchi.
------------------------------------------------------------------------------------------------------------------------------1. Appointment: August 1, 2017, effective as of August 31, 2017. Expiry: Shareholders’ Meeting convened for the approval of the
Financial Statements at December 31, 2017.2. Appointment: May 14, 2015. Expiry: Shareholders’ Meeting convened for the approval of the Financial Statements at December 31,
2017. (Antonella Carù appointed by the Shareholders’ Meeting convened on June 1, 2017, Alberto Villani and Luca Nicodemiappointed by the Shareholders’ Meeting convened on September 5, 2017).
3. Appointment: August 1, 2017, effective as of the date of the commencement of trading of Pirelli shares on the Mercato TelematicoAzionario (screen-based stock exchange) which is organised and managed by Borsa Italiana S.p.A. (October 4, 2017).Expiry: Shareholders’ Meeting convened for the approval of the Financial Statements at December 31, 2018.
4. Appointment: Board of Directors Meeting convened on August 31, 2017. Expiry: jointly with the current Board of Directors.
5
MACROECONOMIC AND MARKET SCENARIO
Global economic recovery continued in the third quarter of 2017 at a sustained pace thanks
to the contribution of both advanced and emerging countries.
After a disappointing first quarter, the US economy recorded a growth in GDP of +3.1% for
the second quarter, thanks to the contribution of private consumption, investments and a
good export performance also. In Europe, economic indicators and the first surveys on the
manufacturing sector confirmed an expansive scenario also for the third quarter. Growth for
the second quarter had been +0.7%. In China, the government was successfully steering the
rebalancing of the economy which recorded a GDP growth rate of +6.9% for the first nine
months of 2017 compared to the corresponding period of the previous year. Brazil emerged
from the recession after recording two growth quarters during the first half of 2017 (+1.0%
for the first quarter, +0.2% for the second). In Russia, economic expansion strengthened,
signalling a growth of +2.5% for the second quarter compared to the corresponding period of
the previous financial year (+0.5% for the first quarter).
On the foreign exchange front, the Euro continued to appreciate against the US Dollar during
the third quarter thanks also to a more favourable macroeconomic scenario than expected.
The average price of the Euro against the US Dollar stood at $1.17 for the third quarter, a
growth of +7% compared to the average of USD 1.10 recorded for the second quarter. The
Pound Sterling dropped to euro 0.90 (the average for the third quarter), affected by the
uncertainty of national policy and negotiations for defining the terms of the UK exit from the
European Union. The Chinese Renminbi appreciated during the third quarter recording an
average price of Yuan 6.67 per US Dollar, (+3% compared to the second quarter but
unchanged compared to the corresponding quarter of 2016). Even the Brazilian Real
appreciated during the third quarter by +2% against the US Dollar, recording an average
price of 3.16.

6
The Rouble decreased slightly against the US Dollar during the third quarter (-3% compared
to the second quarter with an average price of 59.0). Despite this, the currency of the Russian
Federation recorded a strengthening for the first nine months of 2017 of approximately
+17% against the US Dollar compared to the corresponding period of the previous financial
year.
High volatility in raw materials:
the average price of oil (Brent) stood at USD 52 per barrel in the third quarter (+11%
compared to the third quarter of 2016), recovering from the minimum values touched
during the second quarter of the financial year, but even so remained below the
average recorded in the first quarter of the financial year (USD 55 per barrel).
Butadiene prices, which were sustained during the first half-year by the increase in
demand in Asia, collapsed during the third quarter due to the stabilising of demand
and recorded an average price of euro 783 per ton, compared with euro 1,500 per ton
in the second quarter, even so resulting in a growth of +17% compared to the third
quarter of 2016 (euro 670 per ton);
following strong growth in first quarter which peaked at USD 2,095 per ton, the price
of natural rubber declined during the second quarter to USD 1,533 per ton before
stabilising during the third quarter (an average price of USD 1,538) but which
resulted in a growth of +16% compared to the third quarter of the preceding financial
year (USD 1,318 per ton).
As for the development of demand in the tyre market, in the New Premium Car segment, i.e.
rim size equal or greater than 18", a very positive trend is confirmed.
In the first nine months of 2017, this segment, where Pirelli is focused with a leading
position, posted a +10.7% increase, equal to over five times the non New Premium segment
growth rate (rim size equal or lower than 17").

7
A geographic analysis of this trend reveals that 94% of New Premium double-digit growth
is concentrated in Europe, Nafta and Apac.
In the first nine months of 2017:
Europe: in the Replacement segment, sales of New Premium Car tyres grew by
approximately 11% vs. a flat trend in the non New Premium segment. In Original
Equipment, sales of New Premium grew by approximately 8% vs. a 3% drop in the
non New Premium.
Nafta: similar dynamics. In the Replacement channel, New Premium Car tyre sales
grew by approximately +10% vs. -3% in the non New Premium. In Original
Equipment, the New Premium shows a steady trend vs. a 6% drop in the non New
Premium.
Apac: here, China is definitely the engine for development. In the Replacement
channel, New Premium Car tyre sales were up +14% vs. an approximately +6% in
the non New Premium. In Original Equipment, the trend is even more dynamic: New
Premium grew by approximately +23% vs. a flat non New Premium.
Finally, recovery was seen for markets both in Latin America, with double-digit growth both
for the Replacement channel (+12%) and the Original Equipment channel (+22%), as well as
in Russia where the Replacement and Original Equipment channels both experienced growth
of approximately +19% and +25% for the first nine months of the financial year.
8
SIGNIFICANT EVENTS OF THE FIRST NINE MONTHS OF 2017
On January 13, 2017, the agreement signed on December 28, 2016 between Pirelli and
Cinda for the sale to the latter of 38% of Pirelli Industrial’s capital was finalised, as part of
the broader reorganisation and integration project for the Industrial business. The sale took
place at a price of approximately euro 266 million.
On February 9, 2017 Pirelli announced a price increase of up to 9% for all European and
North American markets for car, light truck and motorcycle tyres of all product ranges
(summer, all-season and winter) and brands. The increase which became effective as of
April 1, 2017 was due to the rising price of the main raw materials and the increasing
investment in the development of highly technological products.
On February 14, 2017 Pirelli presented its new Motorsport season which saw the company
committed - in addition to the Formula One World Championship - to over 460
championships for cars and motorcycles. The presentation which coincided with the 110th
Year Anniversary in Motorsports for Pirelli was held at the Turin Automobile Museum.
On March 7, 2017 Pirelli presented two new products at the Geneva Motor Show, which
was consistent with its strategy of focusing on High Value products and of expanding its
range of services for the consumer:
- the coloured editions of the P Zero and the Winter Sottozero tyres, for which Pirelli
engineers had developed, thanks to Pirelli’s experience with F1, innovative materials
and protective finishes capable of ensuring bright and long lasting colours;
9
- Pirelli Connesso, a digital platform which is integrated into the P Zero and Winter
Sottozero tyres, and which is available in the replacement market in black or
coloured, and which thanks to the sensor fixed to the hollow recess of the tyre (i.e.,
on the inner wall of the tyre itself) is connected to an app, and is able to communicate
with the motorist and provide information on certain basic parameters concerning the
functioning of the tyre and safety, in addition to a range of other personalised
services.
During the month of March 2017, for the purpose of ensuring autonomous growth paths and
independent development strategies, the two business areas - Consumer and Industrial - were
definitively separated as a result of the assignment to sole shareholder Marco Polo
International Holding Italy S.p.A., of all TP Industrial Holding S.p.A. shares previously held
by Pirelli & C. S.p.A. TP Industrial Holding S.p.A. is the company into which Pirelli's
Industrial assets were merged. As a result of the assignment, TP Industrial Holding S.p.A.
and Pirelli & C. S.p.A. were therefore controlled either directly or indirectly by Marco Polo
International Italy S.p.A., the vehicle through which the partnership between CNRC (at
65%), Camfin (at 22.4%) and Long-Term Investments Luxembourg (at 12.6%) was realised.
On April 27, 2017 the Board of Directors of the Company decided to accelerate the listing
process in order to take advantage of the market opportunities of the fourth quarter of 2017.
The decision was made in the light of the positive results achieved by the Company, the
implemented focus on the Consumer business which led Pirelli to becoming the sole "pure
consumer tyre player" for the sector, and the current favourable dynamics of the markets. In
context of the listing, the CNRC confirmed its willingness to lower its share in Pirelli to
below 50%, but without prejudicing the requisite conditions for the continued consolidation
of Pirelli.
On May 11, 2017 Pirelli announced its return to the world of cycling with a range of high
performance tyres, dedicated to racing bikes.
10
At the end of June, Marco Polo International Italy S.p.A. - a direct shareholder of Pirelli
following the merger with Marco Polo International Holding Italy S.p.A. – subscribed to a
capital increase, which including the premium amounted to approximately euro 1.2 billion.
The proceeds of the capital increase were used to reimburse a part of Pirelli’s debt, by the
same amount. Also to be noted is that on June 27, 2017 (with a closing date of June 29),
Pirelli & C. S.p.A. and Pirelli International Plc subscribed to the refinancing of bank credit
facilities for a total amount of euro 4.2 billion with a pool of leading international banks.
The refinancing operation was completed with improved conditions compared to a previous
financing completed in 2016, particularly through the reduction of the all-in cost but also
thanks to the lengthening of its average life, thus contributing to the improvement of Pirelli’s
financial profile.
At the end of July 2017, Burlington Loan Management DAC, the Irish investment vehicle
managed by Davidson Kempner Capital Management LP, signed a contract with Pirelli,
Intesa Sanpaolo S.p.A., UniCredit S.p.A. and Fenice S.r.l. for the acquisition of 44.86% of
the capital of Prelios S.p.A. amounting to 611,910,548 shares in total. The trade was set at
euro 0.116 per share, therefore equal to a total of euro 70.9 million, of which euro 17.2
million will be paid to Pirelli, euro 24.5 million euro to Fenice S.r.l, the vehicle invested in
by Pirelli, and the remainder - in proportion to the investment held - to Intesa Sanpaolo and
Unicredit.
On August 1, 2017 the Shareholders’ Meeting of Pirelli approved a number of resolutions
aimed at implementing the previously announced process of listing the Company shares on
the stock exchange. Amongst other things, the adoption of a new text for the Articles of
Association was approved (effective as of the listing date) which expressly provides for,
amongst other things, a "corporate governance based on best international practices".

11
In order to protect shareholders, specific provisions of the Articles of Association address
the issue of the long term preservation of Pirelli’s constitutive and intrinsic elements such
the localisation in Italy of its registered headquarters and the Group's management center, as
well as the control of its technological know-how (including for Pirelli brands). For such
elements in particular, the Articles of Association provide (i) that Pirelli’s technological
know-how shall remain under Pirelli ownership and shall not be transferred to third parties,
except where provided for in the same Articles of Association, and (ii) that the operating and
administrative headquarters of Pirelli shall remain in Milan. Such provisions may be
derogated only through a prior resolution adopted by a Pirelli Shareholders' Meeting where
at least 90% of the share capital is represented as being in favour.
Also on August 1, 2017 (effective as of August 31, 2017), the Shareholders Meeting
renewed the Board of Directors, pursuant to the new Shareholders' Agreement signed on July
28, 2017 by China National Chemical Corporation, China National Tyre & Rubber
Corporation, Ltd., Silk Road Fund Co., Ltd., CNRC International Limited (HK), CNRC
International Holding (HK) Limited, Fourteen Sundew S.à r.l., Camfin S.p.A., Long-Term
Investments Luxembourg S.A. and Marco Tronchetti Provera & C. S.p.A.
The Board of Directors is currently composed of: Ren Jianxin (Chairman), Marco Tronchetti
Provera (Executive Deputy Chairman and Chief Executive Officer), Yang Xingqiang, Bai
Xinping, Giorgio Luca Bruno, Ze’ev Goldberg and Giovanni Tronchetti Provera, as well as
Independent Directors, Laura Cioli, Domenico De Sole, Fan Xiaohua, Marisa Pappalardo,
Cristina Scocchia, Tao Haisu and Wei Yintao.
The Shareholders' Meeting also:
- appointed Antonella Carù as the new Statutory Auditor of the Company, replacing
Fabrizio Acerbis;
- conferred the role for the statutory audit of accounts for the nine-year period from
2017 to 2025 to the independent auditing firm PricewaterhouseCoopers S.p.A.
12
On August 31, 2017 Pirelli's Board of Directors deliberated on the governance structure of
the Company, and approved, in particular, the constitution of the Board Committees and the
establishment of procedures in view of the announced listing process of the Company on the
stock exchange.
In addition, the Board of Directors appointed Marco Tronchetti Provera as Executive Deputy
Chairman and Chief Executive Officer, conferring to him the same powers of management
of the Company consistent with those of the previous mandate and with the Shareholders'
Agreements signed on 28 July 2017.
On September 1, 2017, as part of the preparatory process for re-listing the Company, Pirelli
released its new focus strategy on the High Value Segment, the forecast data for the new
Industrial Plan 2017-2020, as well as carve-out consolidated Interim Financial Statements at
June 30, 2017, and carve-out consolidated Financial Statements for 2016, 2015 and 2014.
The High Value segment is identified by the following categories:
Prestige: tyres designed and developed in partnership with car-makers in the Prestige
Car segment, which traditionally includes companies such as Ferrari, Lamborghini,
Maserati, Bentley, Bugatti, Rolls Royce, Porche, Aston Martin, McLaren and Pagani,
and subject to specific homologations;
New Premium: tyres with a rim size equal or greater than 18 inches, mainly but not
limited to fitting Prestige and Premium cars, which traditionally includes car makers,
such as BMW, Mercedes, Audi, Alfa Romeo, Jaguar, Land Rover, Infiniti, Lexus,
Lincoln, Acura, Cadillac, Tesla and Volvo. Up to the end of 2016, Pirelli identified
tyres with a rim size equal or greater than 17 inches as Premium tyres. Starting from
the first quarter of 2017, Pirelli redefined the scope of Premium tyres as tyres with a
rim size equal or greater than 18 inches, thereby changing the definition into New
Premium;
Specialties and Superspecialties: tyres with a high technological content for cars of
any class, meeting the needs of specific applications, such as for example run flat, or
customisation, as it happened, for instance, with the “color edition” tyres, as
required by the end consumers, irrespective of rim sizes;
Premium Moto: tyres for high-performance top-of-the- range motorbikes.
13
The main actions that Pirelli took and is taking for the future on the basis of its new Business
Plan include:
Maintaining its strategic focus on the High Value segment, by accelerating the
pathway successfully started a few years ago, through increasing homologations,
launching new products, expanding its production capacity in the High Value
segment, intensifying its focus on the consumer with the introduction of new tools
and processes, increasing its control over distribution and the number of retail POSs,
and implementing high-value levers in Europe, APAC and NAFTA, strengthening
the Moto business, launch of two new businesses, Velo and Cyber;
Implementing a new efficiency plan amounting to 1% of its revenues, linked to
its industrial and product operations, such as raw materials cost optimisation, product
streamlining and tyre weight reduction, growth of production in low-cost countries,
productivity improvement and process streamlining, energy and other cost
optimisation;
Implementation of a digital transformation, of both internal (e.g. forecasting,
production, distribution, sales) and offering processes (e.g, new services linked to
Connesso);
Strategic conversion of standard tyre production capacity, by reducing exposure
to less profitable market segments and maintaining footprint in those standard
markets deemed as strategic, implementing standard capacity reduction initiatives
and partial conversion into high value capacity.
On September 5, 2017, Pirelli announced that the Shareholders' Meeting had appointed
Luca Nicodemi and Alberto Villani as Statutory Auditors for the Company, replacing
Giovanni Bandera and David Reali, who had resigned from the role for professional reasons.
14
On September 12, 2017, Pirelli, consistent with focusing its activities on its core business,
notified the Chairman of the Agreement to invest in the capital of Mediobanca S.p.A., the
decision to exercise the right of cancellation from the agreement for all shares held and
conferred to the Agreement itself, approximately 1.79% of Mediobanca's share capital.
On September 15, 2017, in context of the listing process, Consob approved the registration
document, the disclosure notes for the financial instruments and the related summary note
for the offer of sale and admission to listing on the Mercato Telematico Azionario (screen-
based stock exchange) organised and managed by Borsa Italiana S.p.A., of the Pirelli shares,
offered by Marco Polo International Italy S.p.A.. The offer of sale was held from September
18, 2017 to September 28, 2017.

15
GROUP PERFORMANCE AND RESULTS
In this document, in addition to the financial performance measures as provided for by the
International Financial Reporting Standards (IFRS), alternative performance indicators
derived from the IFRS were used in order to allow for a better assessment of the Group's
operating and financial performance. These indicators were:
- Gross Operating Margin adjusted (EBITDA adjusted);
- Gross Operating Margin adjusted without start-up costs (EBITDA adjusted without
start-up costs);
- Operating Income (loss) (EBIT);
- Operating Income (loss) adjusted (EBIT adjusted);
- Operating Income (loss) adjusted without start-up costs (EBIT adjusted without start-
up costs);
- Net Income (loss) related to continuing operations (Consumer) adjusted;
- Fixed Assets related to continuing operations;
- Provisions;
- Operating Working Capital related to continuing operations;
- Net Working Capital related to continuing operations;
- Net Financial (liquidity)/debt Position.
Reference should be made to the paragraph “Alternative Performance Indicators” for a more
detailed description of these indicators.
16
Also as a result of the assignment by Pirelli & C. S.p.A. of TP Industrial Holding S.p.A.
shares, the company into which almost all of Pirelli's Industrial assets were merged, to
Marco Polo International Holding Italy S.p.A., the Industrial business qualified as a
“discontinued operation”. The results for the period for the “discontinued operation” were
reclassified to the Income Statement as a single item, "net income (loss) from discontinued
operations", and includes the financial data for the first quarter of 2017 for the Industrial
Business, which no longer comes under the scope of the Group as a result of the assignment,
as well as the nine month results for some of the residual Industrial activities currently in the
process of being separated. The comparable financial data for 2016 was subjected to
restatement.
* * *
The results for the first nine months of 2017 reflect the beginning of the implementation
of the High Value strategy, as summarised on page 12, and the development of new
activities aimed at capturing emerging new trends in mobility.
The results are characterised by:
revenues which grew by 9.0% to euro 4,038.5 million (+13% for the High Value
segment);
an EBIT adjusted without start-up costs equal to euro 681.2 million, with a margin of
16.9% (16.7% for the first nine months of 2016), 17.6% for the third quarter (16.2%
for the corresponding period of 2016);
net income related to continuing operations (Consumer) which grew to euro 198.9
million (euro 35.8 million at September 30, 2016);

17
a net financial (liquidity)/debt position of euro 4,287.7 million, (euro 4,912.8 million
at December 31, 2016 including the Industrial business) and an NFP / EBITDA
adjusted without start-up costs ratio equal to 3.7x for 20171 (4.6x at December 31,
2016 which was calculated using the NFP relative to the sole Consumer business
equal to euro 4,960.7 million).
The main actions underlying these results and, more generally, actions relating to the
implementation of the Industrial Plan 2017-2020, can be summarised as follows:
strengthening of High Value, which, as of September 30, 2017, accounts for 58%
of revenues (56% in the same period of 2016). High Value volumes posted a 13%
growth in the first nine months of 2016, with an improvement of market shares in
the Prestige segment and in the New Premium Car segment (+15% vs. +11% of the
market);
progressive reduction of exposure on the standard segment with a 5.1% decrease
in volumes mainly in Russia, South America, MEAI and in Europe with the
reduction in sales of the less profitable products. As a result of this impact, the total
growth in volumes (cars and motorbikes) stood at +1.2%;
resulting improvement in the price/mix component, which once again reached the
highest level amongst peers: +6.5% for the first nine months of the financial year,
+7.4% for the third quarter, due to the progressive improvement of the mix and to the
price increases put in place as of April 1, 2017;
1 Indicator calculated based on the ratio between the Net Financial (liquidity)/debt Position as of September 30,2017 and the EBITDA adjusted without start up costs of the last twelve months (fourth quarter of 2016 plusfirst nine months of 2017).
18
In more detail, in the more specific programs, it should be noticed:
the strengthening of the partnership with Prestige and Premium car
manufacturers: approximately 150 High Value homologations just for the third
quarter of the financial year, 230 in the first nine months of 2017, 20% of which
Prestige, with a portfolio of approximately 2,050 homologations capable of providing
insight into future demand;
the expansion of High Value production capacity mainly in Europe, NAFTA
and APAC, converting part of the standard capacity, preparing processes and
organising the factory to handle the growing complexity and ever-increasing rim
diameters. The total Car capacity is expected to be approximately 76 million tyres at
the end of 2017 (71 million in 2016), of which 55% High Value (54% in 2016);
the increased distribution coverage in Europe, NAFTA, APAC and LatAm, with
a wider footprint in Car Dealers, retail customers and Pirelli Tier 1 channels, where
Pirelli exercises greater control and records higher sales;
the continuous development of business programs that intercept new end-
customer needs (such as Cyber and Velo), projects for the digital transformation
of the Company, and the conversion of Aeolus into Pirelli brand production in
the manufacturing plant in Jiaozuo for the Car sector acquired from Aeolus. These
activities were reflected in the sustainment of start-up costs of approximately euro 39
million for the first nine months of the financial year;
efficiencies equal to approximately 1% of revenues for the first nine months of
the financial year, linked to industrial and product activities such as the
optimisation of raw material costs, the streamlining of products and the reduction of
tyre weights, the growth of production in countries with low industrial costs,
improved productivity with the streamlining of processes, plus the optimisation of
energy and other costs.

19
The Group’s Consolidated Financial Statements are summarised as follows:
(in millions of euro)
09/30/2017 09/30/2016
Restated *
12/31/2016
Restated *
12/31/2016
Carve out (**)Net sales 4,038.5 3,706.5 4,976.4 4,976.4
EBITDA adjusted without start-up costs 865.7 801.4 1,082.3 1,082.3
% of net sales 21.4% 21.6% 21.7% 21.7%
EBITDA adjusted 836.3 801.4 1,082.3 1,082.3% of net sales 20.7% 21.6% 21.7% 21.7%
EBIT adjusted without start-up costs 681.2 620.7 844.3 844.3% of net sales 16.9% 16.7% 17.0% 17.0%
EBIT adjusted 642.2 620.7 844.3 844.3% of net sales 15.9% 16.7% 17.0% 17.0%
Adjustment: - amortisation of intangible assets included in PPA (80.9) (78.4) (104.6) (104.6)
- non-recurring and restructuring expenses (20.2) (28.6) (53.2) (53.2)
EBIT 541.1 513.7 686.5 686.5% of net sales 13.4% 13.9% 13.8% 13.8%
Net income (loss) from equity investments (18.6) (52.7) (20.0) (20.0)
Financial income/(expenses) (289.9) (351.6) (427.3) (427.3)
Net income (loss) before tax 232.6 109.4 239.2 239.2
Tax expenses (33.7) (73.6) (75.2) (75.2)Tax rate % on net income (loss) before tax (14.5%) (67.3%) (31.4%) (31.4%)
Net income (loss) related continuing operations (Consumer) 198.9 35.8 164.0 164.0
Net income (loss) related to continuing operations (Consumer) adjusted 257.5 132.6 296.6 296.6
Net income (loss) related to discontinued operations (Industrial) (75.0) (13.1) (16.4)
Total net income (loss) 123.9 22.7 147.6
Net income attributable to the Parent Company 123.6 16.7 135.1
Fixed assets related to continuing operations 9,147.4 10,299.2 9,167.6
Inventories 969.3 1,055.6 874.0
Trade receivables 1,037.4 679.3 680.1
Trade payables (1,066.9) (1,498.5) (1,280.5)
Operating working capital related to continuing operations 939.8 236.4 273.6% of net sales (°) 17.5% 5.5%
Other receivables/other payables 147.0 (310.7) 19.0
Net working capital related to continuing operations 1,086.8 (74.3) 292.6% of net sales (°) 20.2% 5.9%
Net invested capital held for sale (1.4) -
Net invested capital 10,232.8 10,224.9 9,460.2
Equity 4,159.6 3,274.9 2,633.4
Provisions 1,785.5 2,037.2 1,866.1
Net financial (liquidity)/debt position 4,287.7 4,912.8 4,960.7
Equity attributable to the Parent Company 4,104.0 3,134.1
Investments in property, plant and equipment and intangible assets 327.6
Research and development expenses 164.7% of net sales 4.1%
Research and development expenses - High Value 147.0% on sales Premium 6.3%
Employees (headcount at end of period) 31,106
Industrial sites (number) 17
(°) in interim periods net sales are calculated on the annual basis
(*) on the basis of IFRS 5 accounting principle: a) the economic comparative figures at 09/30/2016 related to the Industrial business have been reclassified in the item "Net income
(loss) from discontinued operations";b) balance sheet comparative figures at 12/31/2016 have not been restated and consequently include the figures related to the Industrial
business
(**)the figures refer to the "Carve out" Consolidated Financial Statements at 12.31.2016 of the Consumer Business included in the Registration Document, prepared for the listing
of Pirelli Group and released on 09.15.2017.

20
For a better understanding of the Group's performance, the following quarterly performance
information is provided.(in millions of euro)
2017 2016 2017 2016 2017 2016 2017 2016
Net sales 1,339.3 1,180.9 1,346.0 1,246.0 1,353.2 1,279.6 4,038.5 3,706.5yoy 13.4% 8.0% 8.0% 9.0%
EBITDA adjusted without start-up costs 281.7 261.5 285.1 268.4 298.9 271.5 865.7 801.4% of net sales 21.0% 22.1% 21.2% 21.5% 22.1% 21.2% 21.4% 21.6%
EBITDA adjusted 270.4 261.5 276.0 268.4 289.9 271.5 836.3 801.4% of net sales 20.2% 22.1% 20.5% 21.5% 21.4% 21.2% 20.7% 21.6%
EBIT adjusted without start-up costs 219.5 203.6 223.5 209.6 238.2 207.5 681.2 620.7% of net sales 16.4% 17.2% 16.6% 16.8% 17.6% 16.2% 16.9% 16.7%
EBIT adjusted 205.0 203.6 211.2 209.6 226.0 207.5 642.2 620.7% of net sales 15.3% 17.2% 15.7% 16.8% 16.7% 16.2% 15.9% 16.7%
Adjustment: - amortisation of intangible assets included in PPA (26.2) (26.2) (26.1) (26.1) (28.6) (26.1) (80.9) (78.4)
- non-recurring and restructuring expenses (10.1) (11.3) (35.6) (8.1) 25.5 (9.2) (20.2) (28.6)
EBIT - Operating income (loss) 168.7 166.1 149.5 175.4 222.9 172.2 541.1 513.7% of net sales 12.6% 14.1% 11.1% 14.1% 16.5% 13.5% 13.4% 13.9%
1 Q 2 Q 3 Q TOTAL at 09/30
Group net sales amounted to euro 4,038.5 million, which represented a growth of +9%,
+7.7 in organic terms, or rather net of the exchange rate effect (+0.6%), and for the
consolidation of the Aeolus Car business (+0.7%). Organic growth for the third quarter was
equal to +8.3%.
High Value revenues amounted to euro 2,344.0 million for the first nine months of 2017,
with an organic growth of +12.9%, (+13.6% net of the exchange rate effect) and contribute
to 58% of sales (plus 2 percentage points compared with the same period of 2016).
The following table shows the market drivers for the net sales performance:
2017 2017 2017 2017
Volume 2.9% -0.3% 1.0% 1.2%
Price/mix 5.5% 6.5% 7.3% 6.5%
Change on a like-for-like basis 8.4% 6.2% 8.3% 7.7%
Translation effect 4.0% 1.2% -3.1% 0.6%
Change in scope of consolidation - Aeolus car 1.0% 0.6% 0.6% 0.7%
Total change 13.4% 8.0% 5.8% 9.0%
Cumulative at 09/301 Q 2 Q 3 Q
21
Sales volumes in 2017 resulted in a total growth of +1.2% and reflected the diverse
dynamics within the different segments and markets. The growth in volumes was supported
by the strengthening in the High Value segment (+12.9%, +15.3%, for Car tyres with a rim
diameter ≥18 inches) while Standard Car (-5,3%) was impacted by the reduction in lower
profitability volumes, particularly in Russia (with a sharp contraction in local sales for the
Amtel brand), and in LatAm.
The strong price/mix improvement (+6.5%) reflects the continuation of Pirelli value strategy
and was supported by the success of high-end products, and from the progressive increase in
prices implemented as of April 1, 2017 to counter the increase in raw material costs
(price/mix for the first quarter +5.5%, for the second quarter +6.5%, and for the third
quarter +7.3%).
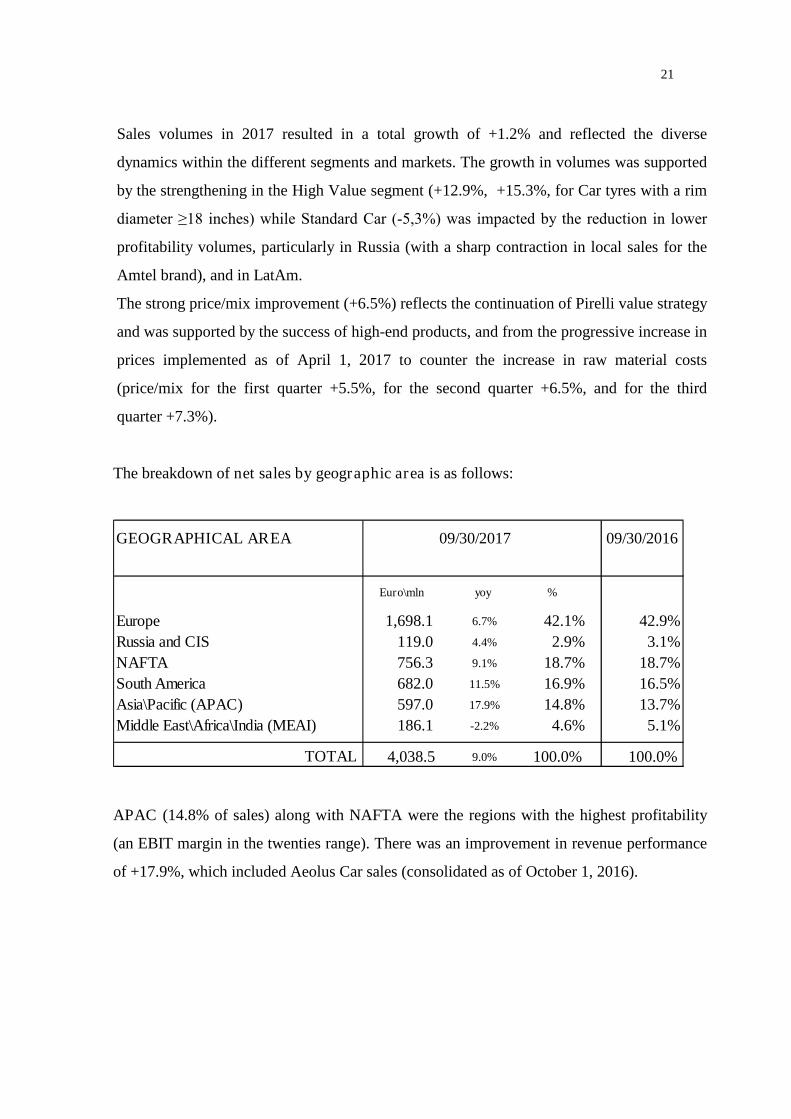
The breakdown of net sales by geographic area is as follows:
GEOGRAPHICAL AREA
Euro\mln yoy %
Europe 1,698.1 6.7% 42.1% 42.9%
Russia and CIS 119.0 4.4% 2.9% 3.1%
NAFTA 756.3 9.1% 18.7% 18.7%
South America 682.0 11.5% 16.9% 16.5%
Asia\Pacific (APAC) 597.0 17.9% 14.8% 13.7%
Middle East\Africa\India (MEAI) 186.1 -2.2% 4.6% 5.1%
TOTAL 4,038.5 9.0% 100.0% 100.0%
09/30/2017 09/30/2016
APAC (14.8% of sales) along with NAFTA were the regions with the highest profitability
(an EBIT margin in the twenties range). There was an improvement in revenue performance
of +17.9%, which included Aeolus Car sales (consolidated as of October 1, 2016).
22
Net of the exchange rate effect (-2.1%) on a like-for-like-basis (+2.1% due to Aeolus Car)
organic growth nevertheless equalled +17.9%, supported by the High Value segment (an
organic growth of +22.2%, +20.2% net of the exchange rate effect) due to the increased
market exposure on the Original Equipment channel (which counted new homologations
with European and local car brands) and to the expansion of the commercial presence which
now counts approximately 4,000 points of sale. The activities for the conversion of Aeolus
brand production into Pirelli brand production in the Aeolus Car tyre manufacturing plant
acquired on October 1, 2016, were also continued in support of future growth in the area.
NAFTA (18.7% of sales) recorded an organic growth in revenues of 9.1% (+9.1% including
the exchange rate effect). Revenue performance reflected the positive trend in volumes, in
particular that of the High Value segment thanks to the introduction of all-season products,
and the greater penetration of the retail channel. Profitability (EBIT margin) was in the
twenties range.
Europe (42.1% of sales) closed the first nine months with a growth in revenues of +6.7%
(+7.5% for organic growth) sustained by the strengthening in the High Value segment
(growth in revenues of +11% for the first nine months of 2017, +16% for just the third
quarter), while for Standard there was the continued reduction of exposure to less profitable
products. Profitability was in the mid-teens range, impacted by start-up costs, but which
steadily improved during the third quarter (high teens) as a result of the improved mix and
the implementation of price increases.
MEAI (4.6% of sales) recorded a growth in revenues of +2.0% (-3.2% net of the exchange
rate effect on a like-for-like basis) with profitability in the mid-teens range, with a slight
increase compared to the corresponding period of 2016, albeit impacted by the devaluation
of currencies particularly in Turkey.
23
In Russia (2.9% of sales) the strategy of focusing on the more profitable segments - with the
progressive reduction in the production and sales of non-Pirelli brand products - impacted
positively on the results for the first nine months of 2017, with a strong improvement in
profitability (an EBIT margin in the low teens, but which had been negative for the
corresponding period of 2016). In organic terms - revenues recorded a decrease of 12.8%
(+4.4% including the exchange rate effect) due to the aforesaid decrease in volumes.
South America (16.9% of sales) recorded a revenue growth of +11.5%, and +3.6% in
organic terms (excluding the exchange rate effect on a like-for-like basis). This performance
reflected the:
continuing focus on the mix, with the progressive reduction in sales of the less
profitable products within the Standard segment;
allocation of a portion of production to export in North America in view of the
growing demand for Pirelli Premium products;
contraction of the car market in Argentina.
Profitability, in the mid single-digits range, was stable compared to the corresponding period
of 2016, also due to continued activities aimed at the improvement and conversion of the
mix.
The EBIT adjusted for the Group - before non-recurring and restructuring expenses and
the amortisation of the intangible assets included in the PPA (Purchase Price Allocation) and
without start-up costs - amounted to euro 681.2 million representing a growth of +9.7%
and of euro 60.5 million in absolute value, compared to the corresponding period of the
previous financial year (euro 620.7 million for the first nine months of 2016).
The EBIT margin adjusted without start-up costs was 16.9%, which represented a growth of
+0.2 percentage points compared to the previous financial year.
The EBIT adjusted for the Group - before non-recurring and restructuring expenses and
the amortisation of the intangible assets included in the PPA - amounted to euro 642.2
million, with a growth of euro 21.5 million compared to the previous financial year.

24
Specifically, the operating income (loss) adjusted for the Group was as follows:
(in millions of euro)
1 Q 2 Q 3 Q
Cumulative at
09/30
2016 EBIT Adjusted 203.6 209.6 207.5 620.7
Differences from foreign currency translation from consolidation 3.7 (1.9) 0.3 2.1
Price/mix 39.6 71.0 90.8 201.4
Volumes 16.4 (1.9) 5.2 19.7
Cost of prodution factors: (commodities) (17.5) (63.1) (51.0) (131.6)
Cost of prodution factors (labour/energy/others) (10.1) (12.9) (11.4) (34.4)
Efficiencies 7.4 17.4 9.2 34.0
Amortisation, depreciation and other costs related to the development of
High Value (23.6) 5.3 (12.4) (30.7)
Change without start-up costs 15.9 13.9 30.7 60.5
2017 EBIT adjusted without start-up costs 219.5 223.5 238.2 681.2
Start-up costs (14.5) (12.3) (12.2) (39.0)
2017 EBIT adjusted 205.0 211.2 226.0 642.2
The improvement in the results is linked to the effect of internal levers such as price/mix,
volumes and efficiencies, which more than offset the rise in the cost of raw materials, costs
inflation (particularly in emerging markets), higher amortisation and depreciation and other
costs related to business development.
In particular:
growth in volumes (euro +19.7 million);
improvement of the price/mix component (euro +201.4 million);
efficiencies (euro +34 million) together with the translation effect (euro +2.1
million);
which more than offset:
the increase in the cost of raw materials (euro -131.6 million) and costs inflation
particularly in the emerging markets (euro -34.4 million);
higher amortisation, depreciation and other costs related to the development of the
High Value segment and the expansion of territorial coverage to the amount of euro
-30.7 million;
start-up costs amounting to euro 39.0 million and attributable to new businesses
(Velo and Connesso), to the conversion of Aeolus brand production into Pirelli
brand production in the manufacturing plant in Jiaozuo for the Car sector acquired
from Aeolus, and to activities for the digital transformation of the Company.

25
The EBIT which amounted to euro 541.1 million (compared to euro 513.7 million for the
corresponding period of the previous financial year) was impacted by:
- non-recurring and restructuring expenses amounting to euro 20.2 million (euro 28.6
million for the first nine months of 2016) due to structural rationalisation activities
and activities under way for the integration of Pirelli’s Industrial segment with the
Industrial assets of the China National Tyre & Rubber Co., Ltd. and for advisory
costs related to the IPO process. It is to be noted that during the first half of the year
euro 37.4 million had been earmarked for the extraordinary incentive plan named
"Special Award" in favour of a selected panel of high level executives and senior
managers. This provision was released with a positive impact on the Income
Statement during the course of the third quarter of 2017, in that the target Equity
Value which the payment of the respective incentive was subject to, had not been
reached;
- euro 80.9 million relating to the amortisation of the intangible assets identified
during the Purchase Price Allocation (euro 78.4 million for the first nine months of
2016).
The net income (loss) from equity investments was negative for euro 18.6 million (euro
52.7 million at September 30, 2016) and mainly relates to the:
pro-rata share of the results for the Indonesian Joint Venture PT Evoluzione Tyres
(negative for euro 7.3 million);
impairment of the investment in the company Pirelli de Venezuela C.A. (negative for
euro 7.6 million euro), whose residual value at September 30, 2017 amounted to euro
2.6 million;
impairment of the investment in Fenice S.r.l. (negative for euro 1.3 million, negative
to the amount of euro 20.7 million for the first nine months of 2016);
pro-rata negative result for Prelios S.p.A. for the fourth quarter of 2016 and the first
half of 2017 (negative for euro 1.6 million, negative for euro 18.2 million for the
corresponding period of 2016). As reported in the section regarding the significant
events of the period, a contract for the disposal of the total investment in Prelios
S.p.A. was signed in July.
26
The net income (loss) related to continuing operations (Consumer) at September 30,
2017 amounted to euro 198.9 million, compared to earnings of euro 35.8 million for the first
nine months of 2016. This result also reflected, in addition to the improvement in the
operating income and the results from investments, the lower net financial expenses of euro
61.7 million (euro 289.9 million for the first nine months of 2017 compared to euro 351.6
million for the first nine months of 2016, which had been impacted by euro 25.4 million
relating to the extinction of the US Private Placement bond loan).
The reduction in financial expenses was mainly attributable to the decrease in the cost of
debt (5.52% at September 30, 2017 compared with 6.16% for the same period the previous
financial year).
Tax expenses for the first nine months of 2017 amounted to euro 33.7 million against pre-
tax earnings of euro 232.6 million with a tax rate which stood at 14.5%. The tax rate for the
first nine months of 2017 was positively impacted by the booking of deferred tax assets on
tax losses and other temporary differences pertinent to the Italian companies.
The net income (loss) related to continuing operations (Consumer) adjusted amounted
to euro 257.5 million compared with euro 132.6 million for the corresponding period of the
previous financial year. Specifically, this item is determined by rectifying the net income
related to continuing operations (Consumer) of the adjustments considered for the purpose of
determining the EBIT adjusted, inclusive of the relative tax impacts, as well as one-off and
non-recurring items recognised within financial and tax expenses.
27
The net income (loss) related to discontinued operations includes the financial data for
the first quarter of 2017 for the Industrial business, which no longer comes under the scope
of the Group due to the assignment, as well as the results for the nine months of some
residual Industrial activities currently undergoing separation, and was negative for the total
amount of euro 75.0 million. This result which was attributable to the net income from
discontinued operations, was positive for euro 5.2 million, and to the reversal to the Income
Statement of negative translation differences which matured at the date of the assignment
and which were negative for euro 80.2 million, which were mainly attributable to the
Egyptian company.
The net income attributable to Pirelli & C. S.p.A. was positive for euro 123.6 million
compared to the positive amount of euro 16.7 million for the corresponding period of the
previous financial year.
28
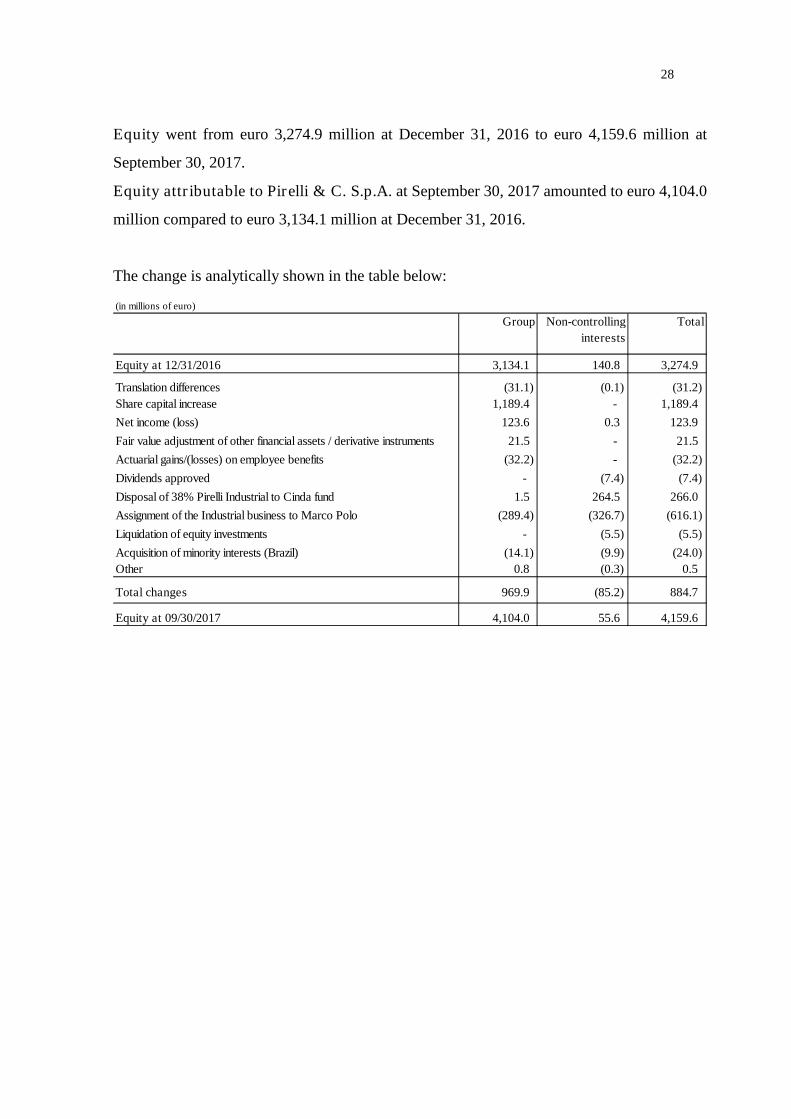
Equity went from euro 3,274.9 million at December 31, 2016 to euro 4,159.6 million at
September 30, 2017.
Equity attributable to Pirelli & C. S.p.A. at September 30, 2017 amounted to euro 4,104.0
million compared to euro 3,134.1 million at December 31, 2016.
The change is analytically shown in the table below:
(in millions of euro)
Group Non-controlling
interests
Total
Equity at 12/31/2016 3,134.1 140.8 3,274.9
Translation differences (31.1) (0.1) (31.2)
Share capital increase 1,189.4 - 1,189.4
Net income (loss) 123.6 0.3 123.9
Fair value adjustment of other financial assets / derivative instruments 21.5 - 21.5
Actuarial gains/(losses) on employee benefits (32.2) - (32.2)
Dividends approved - (7.4) (7.4)
Disposal of 38% Pirelli Industrial to Cinda fund 1.5 264.5 266.0
Assignment of the Industrial business to Marco Polo (289.4) (326.7) (616.1)
Liquidation of equity investments - (5.5) (5.5)
Acquisition of minority interests (Brazil) (14.1) (9.9) (24.0)
Other 0.8 (0.3) 0.5
Total changes 969.9 (85.2) 884.7
Equity at 09/30/2017 4,104.0 55.6 4,159.6
29
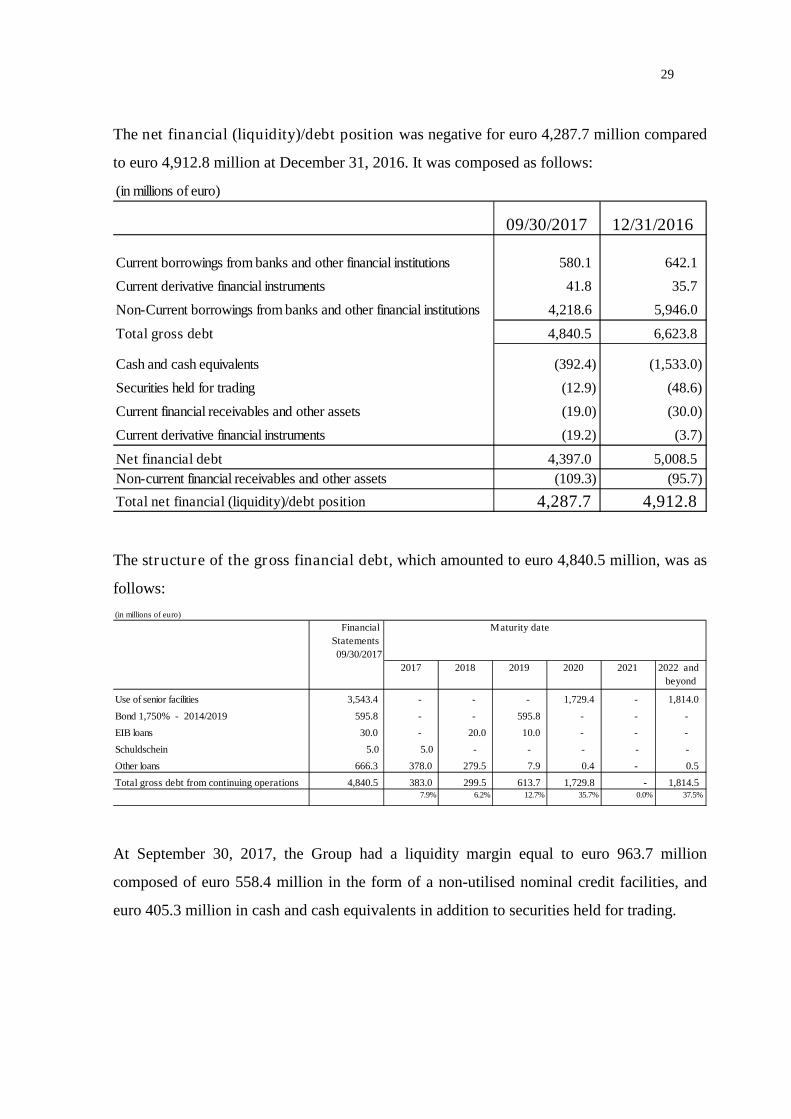
The net financial (liquidity)/debt position was negative for euro 4,287.7 million compared
to euro 4,912.8 million at December 31, 2016. It was composed as follows:
(in millions of euro)
09/30/2017 12/31/2016
Current borrowings from banks and other financial institutions 580.1 642.1
Current derivative financial instruments 41.8 35.7
Non-Current borrowings from banks and other financial institutions 4,218.6 5,946.0
Total gross debt 4,840.5 6,623.8
Cash and cash equivalents (392.4) (1,533.0)
Securities held for trading (12.9) (48.6)
Current financial receivables and other assets (19.0) (30.0)
Current derivative financial instruments (19.2) (3.7)
Net financial debt 4,397.0 5,008.5
Non-current financial receivables and other assets (109.3) (95.7)
Total net financial (liquidity)/debt position 4,287.7 4,912.8
The structure of the gross financial debt, which amounted to euro 4,840.5 million, was as
follows:
(in millions of euro)
Financial
Statements
09/30/2017
Maturity date
2017 2018 2019 2020 2021 2022 and
beyond
Use of senior facilities 3,543.4 - - - 1,729.4 - 1,814.0
Bond 1,750% - 2014/2019 595.8 - - 595.8 - - -
EIB loans 30.0 - 20.0 10.0 - - -
Schuldschein 5.0 5.0 - - - - -
Other loans 666.3 378.0 279.5 7.9 0.4 - 0.5
Total gross debt from continuing operations 4,840.5 383.0 299.5 613.7 1,729.8 - 1,814.57.9% 6.2% 12.7% 35.7% 0.0% 37.5%
At September 30, 2017, the Group had a liquidity margin equal to euro 963.7 million
composed of euro 558.4 million in the form of a non-utilised nominal credit facilities, and
euro 405.3 million in cash and cash equivalents in addition to securities held for trading.

30
Cash flow performance in the period was as follows:
(in millions of euro)
2017 2016
Restated
2017 2016
Restated
2017 2016
Restated
2017 2016
Restated
Adjusted operating income (loss) 205.0 203.6 211.2 209.6 226.0 207.5 642.2 620.7
Amortisation and depreciation 65.4 57.9 64.8 58.8 63.9 64.0 194.1 180.7
Investments in property, plant and equipment and intangible assets (98.3) (70.0) (117.4) (77.8) (111.9) (74.1) (327.6) (221.9)
Change in working capital/other (892.2) (783.8) 123.9 70.1 (131.8) (63.8) (900.1) (777.5)
Operating net cash flow (720.1) (592.3) 282.5 260.7 46.2 133.6 (391.4) (198.0)
Financial income/(expenses) (77.0) (133.7) (149.4) (118.7) (63.5) (99.2) (289.9) (351.6)
Tax expenses (39.1) (20.3) 27.8 (26.4) (22.4) (26.9) (33.7) (73.6)
Ordinary net cash flow (836.2) (746.3) 160.9 115.6 (39.7) 7.5 (715.0) (623.2)
Financial (investments) / disinvestments (1.7) (5.2) (0.8) 11.1 - - (2.5) 5.9
Disposal of real estate - - - - - 16.1 - 16.1
Partial acquisition of minotiry interest Pneuac - Brazil - - - - (15.4) - (15.4) -
Dividends approved to non-controlling interests - - - - (12.9) - (12.9) -
Cash Out for non-recurring and restructuring expenses (11.9) (17.7) (4.6) (9.4) (6.8) (8.3) (23.3) (35.4)
Disposal of minority equity investments (5.5) - - - - - (5.5) -
Reversal of release of the provision for deferred tax liabilities included
in tax expenses (6.6) (6.4) (33.9) (6.8) (42.7) (8.7) (83.2) (21.9)
Financial expenses included in the acquisition debt - - - 122.2 - - - 122.2
Differences from foreign currency translation/other (19.8) (62.7) 2.4 (25.7) 6.3 (1.1) (11.1) (89.5)
Net cash flow before extraordinary transactions (881.7) (838.3) 124.0 207.0 (111.2) 5.5 (868.9) (625.8)
Industrial reorganization 269.3 59.3 35.3 37.9 - 21.5 304.6 118.7
Change NFP Bidco from 01/01 to 05/31 - - - (134.3) - - - (134.3)
Share capital increase subscribed by Marco Polo - - 1,189.4 - - - 1,189.4 -
Net cash flow (612.4) (779.0) 1,348.7 110.6 (111.2) 27.0 625.1 (641.4)
Cumulative at 09/301 Q 2 Q 3 Q
More specifically, the operating net cash flow for the first nine months of 2017 was
negative to the amount of euro 391.4 million (a seasonal negativity of euro 198.0 million for
2016), after having sustained investments of euro 327.6 million (euro 221.9 million for
2016) primarily aimed at increasing the capacity of the High Value segment in Europe and
NAFTA, at strategic reconversion of standard production capacity into High Value in Brazil
(Bahia and Campinas), at transformation of production from Aeolus brand products to Pirelli
brand products in the Car plant in Jiaozuo and at the continuous improvement of the mix and
quality in all manufacturing plants. The performance of the operating net cash flow
compared to the first nine months of 2016, was mainly due to changes in the working capital
(euro 900.1 million in cash absorption for 2017 compared to euro 777.5 million for 2016),
mainly due to the effect of higher sales.
Net cash flow before extraordinary transactions was negative to the amount of euro 868.9
million compared to the negative result of euro 625.8 million recorded for 2016.
Total net cash flow was positive for euro 625.1 million (negative for euro 641.4 million in
the corresponding period of 2016), and for 2017 included the positive effect (euro 304.6
million) resulting from the continued reorganisation of the Industrial business and the capital
increase of euro 1,189.4 million subscribed by Marco Polo International Italy S.p.A. in June.
31
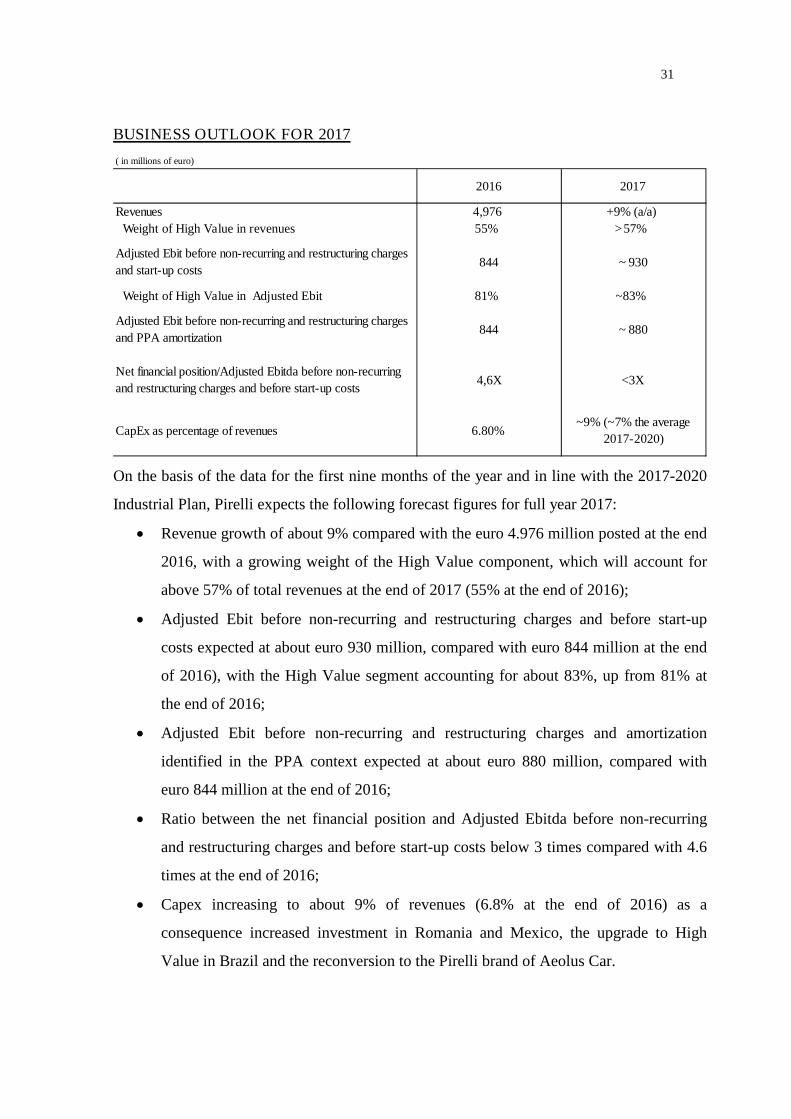
BUSINESS OUTLOOK FOR 2017
( in millions of euro)
2016 2017
Revenues 4,976 +9% (a/a)
Weight of High Value in revenues 55% >57%
Adjusted Ebit before non-recurring and restructuring charges
and start-up costs844 ~ 930
Weight of High Value in Adjusted Ebit 81% ~83%
Adjusted Ebit before non-recurring and restructuring charges
and PPA amortization844 ~ 880
Net financial position/Adjusted Ebitda before non-recurring
and restructuring charges and before start-up costs4,6X <3X
CapEx as percentage of revenues 6.80%~9% (~7% the average
2017-2020)
On the basis of the data for the first nine months of the year and in line with the 2017-2020
Industrial Plan, Pirelli expects the following forecast figures for full year 2017:
Revenue growth of about 9% compared with the euro 4.976 million posted at the end
2016, with a growing weight of the High Value component, which will account for
above 57% of total revenues at the end of 2017 (55% at the end of 2016);
Adjusted Ebit before non-recurring and restructuring charges and before start-up
costs expected at about euro 930 million, compared with euro 844 million at the end
of 2016), with the High Value segment accounting for about 83%, up from 81% at
the end of 2016;
Adjusted Ebit before non-recurring and restructuring charges and amortization
identified in the PPA context expected at about euro 880 million, compared with
euro 844 million at the end of 2016;
Ratio between the net financial position and Adjusted Ebitda before non-recurring
and restructuring charges and before start-up costs below 3 times compared with 4.6
times at the end of 2016;
Capex increasing to about 9% of revenues (6.8% at the end of 2016) as a
consequence increased investment in Romania and Mexico, the upgrade to High
Value in Brazil and the reconversion to the Pirelli brand of Aeolus Car.

32
SIGNIFICANT EVENTS SUBSEQUENT TO THE END OF THE QUARTER
On October 4 2017 Pirelli debuted on the Milan Stock Exchange on the MTA, Mercato
Telematico Azionario, organized and managed by Borsa Italiana S.p.A.. With the beginning
of trading the activities of direction and coordination by Marco Polo International Italy
S.p.A. ceased. The object of the Global Offering was 350 million ordinary shares, at a price
of 6.5 euro per share for a capitalization of 6.5 billion euro. The Greenshoe option, of 50
million shares conceded in the context of the operation by Marco Polo International Italy
S.p.A. to the placement consortium, was partially exercised on November 2, 2017 for a total
of 18,904,836 million shares. Including the Greenshoe option, the Public Offering concerned
therefore 368,904,836 Pirelli ordinary shares and, as a consequence, the total proceeds from
the Public Offering, attributable solely to the Selling Shareholder, amounted to about 2.4
billion Euro.
The outcome of the partial exercise of the Greenshoe Option is that Marco Polo International
Italy S.p.A. will hold 631,095,164 Pirelli ordinary shares, corresponding to about 63% of
share capital.
33
ALTERNATIVE PERFORMANCE INDICATORS
This document, in addition to the financial measures as provided for by the International
Financial Reporting Standards (IFRS), also includes measures derived from the latter even
though they are not provided for by the IFRS (Non-GAAP Measures). These measures are
presented in order to allow for a better assessment of the results of Group operations and
must not be considered as alternatives to those required by IFRS.
In particular, the Non-GAAP Measures used were as follows:
- Gross operating margin adjusted (EBITDA adjusted): is equal to the operating
income (loss) and excludes the amortisation of intangible and depreciation of tangible
assets as well as non-recurring and restructuring expenses;
- Gross operating margin adjusted without start-up costs (EBITDA adjusted
without start-up costs): the EBITDA adjusted without start-up costs is equal to the
EBITDA adjusted but excludes the contribution to the Gross Operating Margin (start-up
costs) of the Cyber and Velo Business Unit, the costs for the conversion of Aeolus brand
Car products, and costs sustained for the digital transformation of the Company;
- Operating income (loss) (EBIT): EBIT is an intermediate measure, which is derived
from the net income but which excludes taxes, financial income, financial expenses and
the results from investments;
- Operating income (loss) adjusted (EBIT adjusted): the operating income (loss)
adjusted is an intermediate measure, which is derived from the operating income (loss)
and which excludes, the amortisation of intangible assets relative to assets recognised as
a consequence of Business Combinations, as well as operational costs attributable to
non-recurring and restructuring expenses. Of particular note are the amortisable
intangible assets detected during the PPA. It is to be noted that these assets are related to
activities which are continuously regenerated internally within the company and which
incur costs that are not capitalised, and which end up duplicating the amortisations
created by way of the effect of the PPA;
34
- Operating income (loss) adjusted without start-up costs (EBIT adjusted without
start-up costs): the EBIT adjusted without start-up costs is equal to the EBIT adjusted
but excludes the contribution to the Operating Income (start-up costs) of the Cyber and
Velo Business Unit, the costs for the conversion of Aeolus brand Car products, and the
costs sustained for the digital transformation of the Company;
- Net income (loss) related to continuing operations (Consumer) adjusted: the
adjusted net income related to continuing operations is calculated by adjusting the net
income related to assets related to continuing operations for the following items:
o the amortisation of intangible assets related to assets detected as a consequence
of Business Combinations, and operational costs due to non-recurring and
restructuring expenses;
o non-recurring costs/income recognised under financial income and expenses;
o non-recurring costs/income recognised under taxes;
- Fixed assets related to continuing operations: this measure is constituted by the sum
of the items "Property, plant and equipment", "Intangible assets", "Investments in
associates and joint ventures" and "Other financial assets";
- Provisions: this measure is constituted by the sum of "Provisions for liabilities and
charges (current and non-current)", "Employee benefit obligations" and "Provisions for
deferred tax liabilities";
- Operating working capital related to continuing operations: this measure is
constituted by the sum of "Inventories", "Trade receivables" and "Trade payables";
- Net working capital related to continuing operations: this measure consists of the
operating working capital and other receivables and payables not included in the “Net
financial liquidity/(debt) position";
- Net financial (liquidity)/debt position: this measure is represented by the gross
financial debt less cash and cash equivalents as well as financial receivables.
35
OTHER INFORMATION
The Board of Directors, taking into account the simplification of regulatory requirements
introduced by Consob in the Issuer's Regulation No: 11971/99, resolved to exercise the
power to derogate, pursuant to the provisions of Article 70, paragraph 8, and Article 71,
paragraph 1-bis of the aforesaid Regulation, the obligations to publish the disclosure
documents required at the time of significant mergers, de-mergers, capital increase by
contributions in kind, acquisitions and disposals.
Role of the Board of Directors
The Board of Directors is responsible for the strategic guidance and supervision of the
overall business activities, with the power to address the Company’s administration as a
whole, and is empowered in the undertaking of the most important financial/strategic
decisions, or decisions which have a structural impact on operations or are functional
decisions, or activities which exercise the control and direction of Pirelli.
The Chairman is endowed with the legal representation of the Company including in the
legal proceedings of the Company, as well as all other powers attributable to the Chairman
in accordance with the Articles of Association.
The Executive Deputy Chairman and Chief Executive Officer are delegated exclusive
powers for the ordinary management of the Company and the Group, as well as the power to
propose Industrial Plans and Budgets to the Board of Directors, as well as any resolutions
concerning any strategic industrial partnerships or joint ventures of which Pirelli is a part.
The Board has internally instituted the following Committees with advisory and
propositional tasks:
- Audit, Risks, Sustainability and Corporate Governance Committee
- Remuneration Committee
- Related Party Transactions Committee;
- Appointments and Successions Committee
- Strategies Committee
36
Infomation on the share capital and ownership structure
The subscribed and paid up share capital at the date of approval of this Financial Report
amounted to euro 1,904,347,935.66, and was represented by 1,000,000,000 registered shares
without indication of their nominal value.
Marco Polo International Italy S.p.A. is the entitled controlling shareholder of the Company
but does not exercise management and coordination.
Extracts are available on the Company’s website of the agreements dated July 2017 between
the shareholders, including the indirect shareholders, of Marco Polo International Italy
S.p.A. which contain the provisions of the Shareholders' Agreements relative to, amongst
other things, the governance of Pirelli.
Related party transactions
The Board of Directors has approved the Transactions with Related Parties Procedure,
following the unanimous favorable opinion by the Related Party Transactions Committee, as
indicated in the “Documento di Registrazione” published for the Public Offering. The
procedure is available in the page “governance” on the website of the Company
www.pirelli.com, together with the other policies related to the governance structure of the
Company.
Related party transactions, including intra-group transactions, do not qualify as either
unusual or exceptional, but are part of the ordinary course of business for the companies of
the Group. Such transactions, when not settled under standard conditions, or are dictated by
specific regulatory conditions, are in any case regulated by conditions consistent with those
of the market.
37
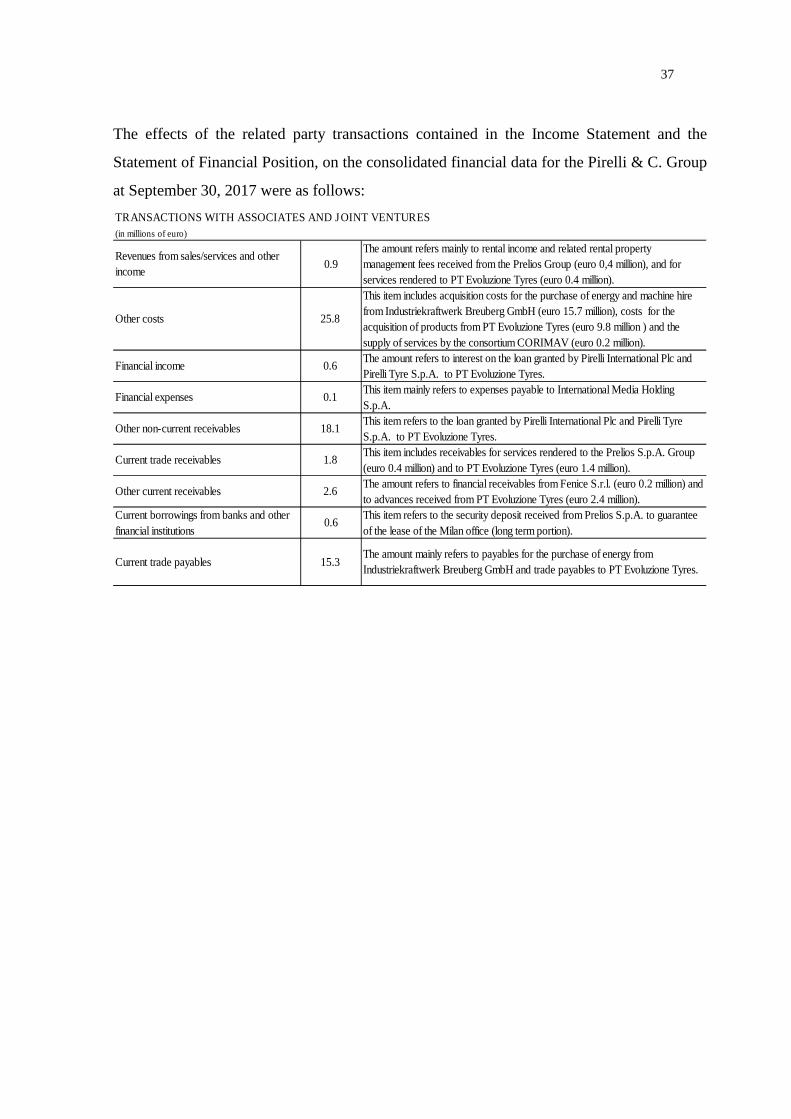
The effects of the related party transactions contained in the Income Statement and the
Statement of Financial Position, on the consolidated financial data for the Pirelli & C. Group
at September 30, 2017 were as follows:
TRANSACTIONS WITH ASSOCIATES AND JOINT VENTURES
(in millions of euro)
Revenues from sales/services and other
income0.9
The amount refers mainly to rental income and related rental property
management fees received from the Prelios Group (euro 0,4 million), and for
services rendered to PT Evoluzione Tyres (euro 0.4 million).
Other costs 25.8
This item includes acquisition costs for the purchase of energy and machine hire
from Industriekraftwerk Breuberg GmbH (euro 15.7 million), costs for the
acquisition of products from PT Evoluzione Tyres (euro 9.8 million ) and the
supply of services by the consortium CORIMAV (euro 0.2 million).
Financial income 0.6The amount refers to interest on the loan granted by Pirelli International Plc and
Pirelli Tyre S.p.A. to PT Evoluzione Tyres.
Financial expenses 0.1This item mainly refers to expenses payable to International Media Holding
S.p.A.
Other non-current receivables 18.1This item refers to the loan granted by Pirelli International Plc and Pirelli Tyre
S.p.A. to PT Evoluzione Tyres.
Current trade receivables 1.8This item includes receivables for services rendered to the Prelios S.p.A. Group
(euro 0.4 million) and to PT Evoluzione Tyres (euro 1.4 million).
Other current receivables 2.6The amount refers to financial receivables from Fenice S.r.l. (euro 0.2 million) and
to advances received from PT Evoluzione Tyres (euro 2.4 million).
Current borrowings from banks and other
financial institutions0.6
This item refers to the security deposit received from Prelios S.p.A. to guarantee
of the lease of the Milan office (long term portion).
Current trade payables 15.3The amount mainly refers to payables for the purchase of energy from
Industriekraftwerk Breuberg GmbH and trade payables to PT Evoluzione Tyres.
38
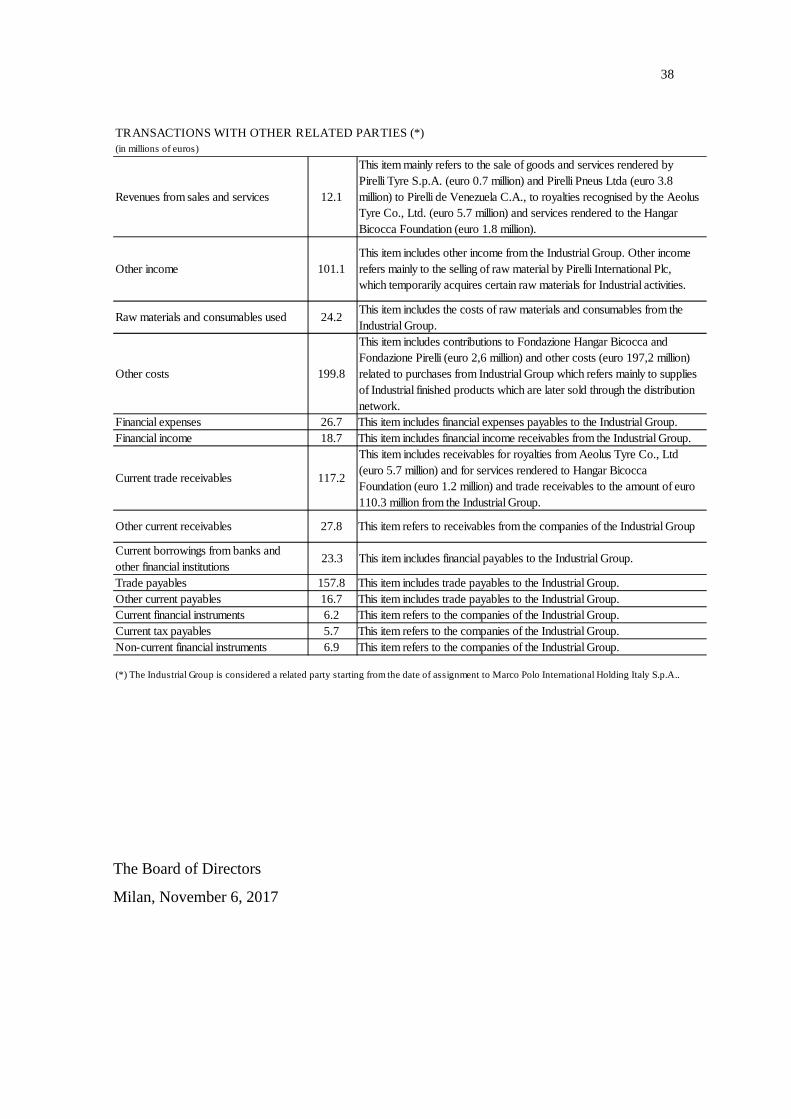
TRANSACTIONS WITH OTHER RELATED PARTIES (*)(in millions of euros)
Revenues from sales and services 12.1
This item mainly refers to the sale of goods and services rendered by
Pirelli Tyre S.p.A. (euro 0.7 million) and Pirelli Pneus Ltda (euro 3.8
million) to Pirelli de Venezuela C.A., to royalties recognised by the Aeolus
Tyre Co., Ltd. (euro 5.7 million) and services rendered to the Hangar
Bicocca Foundation (euro 1.8 million).
Other income 101.1
This item includes other income from the Industrial Group. Other income
refers mainly to the selling of raw material by Pirelli International Plc,
which temporarily acquires certain raw materials for Industrial activities.
Raw materials and consumables used 24.2This item includes the costs of raw materials and consumables from the
Industrial Group.
Other costs 199.8
This item includes contributions to Fondazione Hangar Bicocca and
Fondazione Pirelli (euro 2,6 million) and other costs (euro 197,2 million)
related to purchases from Industrial Group which refers mainly to supplies
of Industrial finished products which are later sold through the distribution
network.
Financial expenses 26.7 This item includes financial expenses payables to the Industrial Group.
Financial income 18.7 This item includes financial income receivables from the Industrial Group.
Current trade receivables 117.2
This item includes receivables for royalties from Aeolus Tyre Co., Ltd
(euro 5.7 million) and for services rendered to Hangar Bicocca
Foundation (euro 1.2 million) and trade receivables to the amount of euro
110.3 million from the Industrial Group.
Other current receivables 27.8 This item refers to receivables from the companies of the Industrial Group
Current borrowings from banks and
other financial institutions23.3 This item includes financial payables to the Industrial Group.
Trade payables 157.8 This item includes trade payables to the Industrial Group.
Other current payables 16.7 This item includes trade payables to the Industrial Group.
Current financial instruments 6.2 This item refers to the companies of the Industrial Group.
Current tax payables 5.7 This item refers to the companies of the Industrial Group.
Non-current financial instruments 6.9 This item refers to the companies of the Industrial Group.
(*) The Industrial Group is considered a related party starting from the date of assignment to Marco Polo International Holding Italy S.p.A..
The Board of Directors
Milan, November 6, 2017

39
FINANCIAL STATEMENTS
40
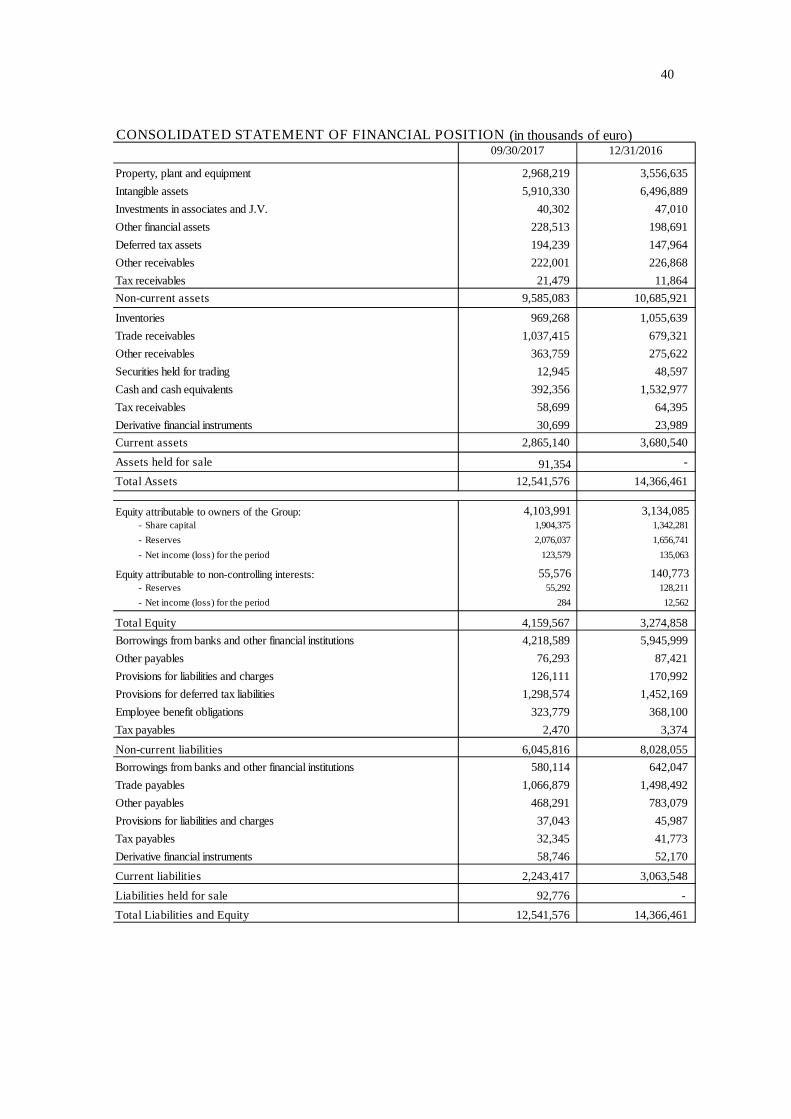
CONSOLIDATED STATEMENT OF FINANCIAL POSITION (in thousands of euro)
Property, plant and equipment 2,968,219 3,556,635
Intangible assets 5,910,330 6,496,889
Investments in associates and J.V. 40,302 47,010
Other financial assets 228,513 198,691
Deferred tax assets 194,239 147,964
Other receivables 222,001 226,868
Tax receivables 21,479 11,864
Non-current assets 9,585,083 10,685,921
Inventories 969,268 1,055,639
Trade receivables 1,037,415 679,321
Other receivables 363,759 275,622
Securities held for trading 12,945 48,597
Cash and cash equivalents 392,356 1,532,977
Tax receivables 58,699 64,395
Derivative financial instruments 30,699 23,989
Current assets 2,865,140 3,680,540
Assets held for sale 91,354 -
Total Assets 12,541,576 14,366,461
Equity attributable to owners of the Group: 4,103,991 3,134,085- Share capital 1,904,375 1,342,281
- Reserves 2,076,037 1,656,741
- Net income (loss) for the period 123,579 135,063
Equity attributable to non-controlling interests: 55,576 140,773- Reserves 55,292 128,211
- Net income (loss) for the period 284 12,562
Total Equity 4,159,567 3,274,858
Borrowings from banks and other financial institutions 4,218,589 5,945,999
Other payables 76,293 87,421
Provisions for liabilities and charges 126,111 170,992
Provisions for deferred tax liabilities 1,298,574 1,452,169
Employee benefit obligations 323,779 368,100
Tax payables 2,470 3,374
Non-current liabilities 6,045,816 8,028,055
Borrowings from banks and other financial institutions 580,114 642,047
Trade payables 1,066,879 1,498,492
Other payables 468,291 783,079
Provisions for liabilities and charges 37,043 45,987
Tax payables 32,345 41,773
Derivative financial instruments 58,746 52,170
Current liabilities 2,243,417 3,063,548
Liabilities held for sale 92,776 -
Total Liabilities and Equity 12,541,576 14,366,461
09/30/2017 12/31/2016

41
Revenues from sales and services 4,038,531 3,706,530
Other income 473,753 511,988
Changes in inventories of unfinished, semi-finished and finished products 98,164 (39,653)
Raw materials and consumables used (net of change in inventories) (1,395,014) (1,127,513)
Personnel expenses (767,495) (734,973)
Amortisation, depreciation and impairment (275,226) (259,441)
Other costs (1,633,782) (1,544,914)
Increase in fixed assets for internal work 2,202 1,682
Operating income (loss) 541,133 513,706
Net income (loss) from equity investments (18,591) (52,729)
- share of net income (loss) of associates and j.v. (8,656) (42,765)
- gains on equity investments 188 8,973
- losses on equity investments (10,260) (20,733)
- dividends 137 1,796
Financial income 153,718 61,447
Financial expenses (443,666) (413,013)
Net income (loss) before tax 232,594 109,411
Tax (33,701) (73,593)
Net income (loss) from continuing operations 198,893 35,818
Net income (loss) from discontinued operations (75,030) (13,076)
Total net income (loss) for the period 123,863 22,742
Attributable to:
Owners of the parent company 123,579 16,665
Non-controlling interests 284 6,077
1/1 - 09/30/2017 1/1 - 09/30/2016 (*)
CONSOLIDATED INCOME STATEMENT (in thousands of euro)
(*) the figures refer the classification of the income statement data of the Industrial business in the item "Net income (loss) from discontinued operations"
42
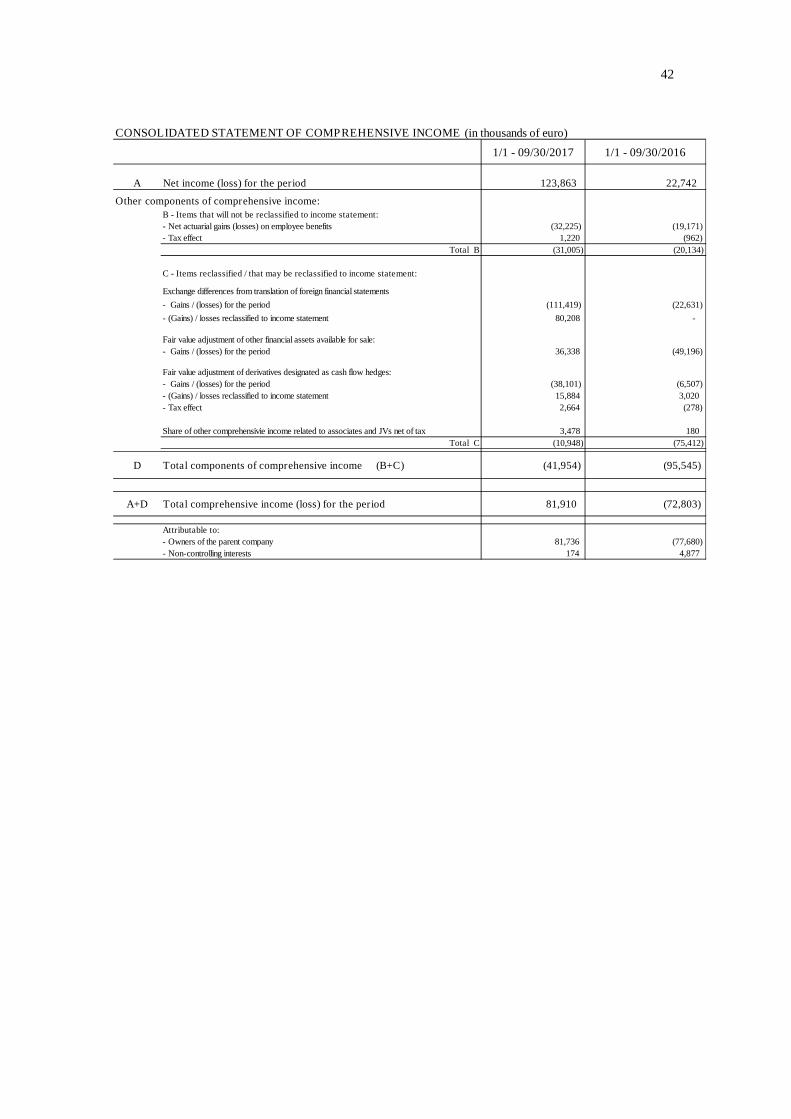
CONSOLIDATED STATEMENT OF COMPREHENSIVE INCOME (in thousands of euro)
1/1 - 09/30/2017 1/1 - 09/30/2016
A Net income (loss) for the period 123,863 22,742
B - Items that will not be reclassified to income statement:
- Net actuarial gains (losses) on employee benefits (32,225) (19,171)
- Tax effect 1,220 (962)
Total B (31,005) (20,134)
C - Items reclassified / that may be reclassified to income statement:
Exchange differences from translation of foreign financial statements
- Gains / (losses) for the period (111,419) (22,631)
- (Gains) / losses reclassified to income statement 80,208 -
Fair value adjustment of other financial assets available for sale:
- Gains / (losses) for the period 36,338 (49,196)
Fair value adjustment of derivatives designated as cash flow hedges:
- Gains / (losses) for the period (38,101) (6,507)
- (Gains) / losses reclassified to income statement 15,884 3,020
- Tax effect 2,664 (278)
Share of other comprehensivie income related to associates and JVs net of tax 3,478 180
Total C (10,948) (75,412)
D Total components of comprehensive income (B+C) (41,954) (95,545)
A+D Total comprehensive income (loss) for the period 81,910 (72,803)
Attributable to:
- Owners of the parent company 81,736 (77,680)
- Non-controlling interests 174 4,877
Other components of comprehensive income:
43
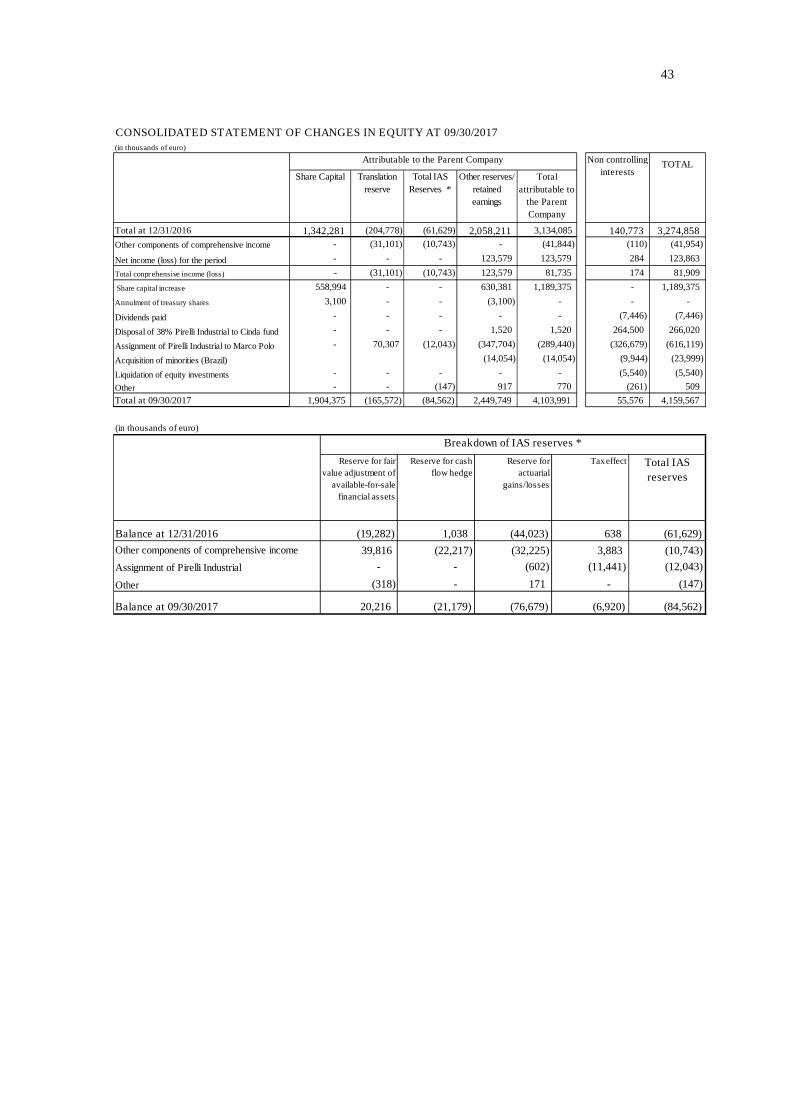
CONSOLIDATED STATEMENT OF CHANGES IN EQUITY AT 09/30/2017(in thousands of euro)
TOTAL
Share Capital Translation
reserve
Total IAS
Reserves *
Other reserves/
retained
earnings
Total
attributable to
the Parent
Company
Total at 12/31/2016 1,342,281 (204,778) (61,629) 2,058,211 3,134,085 140,773 3,274,858
Other components of comprehensive income - (31,101) (10,743) - (41,844) (110) (41,954)
Net income (loss) for the period - - - 123,579 123,579 284 123,863
Total conprehensive income (loss) - (31,101) (10,743) 123,579 81,735 174 81,909
Share capital increase 558,994 - - 630,381 1,189,375 - 1,189,375
Annulment of treasury shares 3,100 - - (3,100) - - -
Dividends paid - - - - - (7,446) (7,446)
Disposal of 38% Pirelli Industrial to Cinda fund - - - 1,520 1,520 264,500 266,020
Assignment of Pirelli Industrial to Marco Polo - 70,307 (12,043) (347,704) (289,440) (326,679) (616,119)
Acquisition of minorities (Brazil) (14,054) (14,054) (9,944) (23,999)
Liquidation of equity investments - - - - - (5,540) (5,540)
Other - - (147) 917 770 (261) 509
Total at 09/30/2017 1,904,375 (165,572) (84,562) 2,449,749 4,103,991 55,576 4,159,567
Attributable to the Parent Company Non controlling
interests
(in thousands of euro)
Reserve for fair
value adjustment of
available-for-sale
financial assets
Reserve for cash
flow hedge
Reserve for
actuarial
gains/losses
Taxeffect Total IAS
reserves
Balance at 12/31/2016 (19,282) 1,038 (44,023) 638 (61,629)
Other components of comprehensive income 39,816 (22,217) (32,225) 3,883 (10,743)
Assignment of Pirelli Industrial - - (602) (11,441) (12,043)
Other (318) - 171 - (147)
Balance at 09/30/2017 20,216 (21,179) (76,679) (6,920) (84,562)
Breakdown of IAS reserves *
44
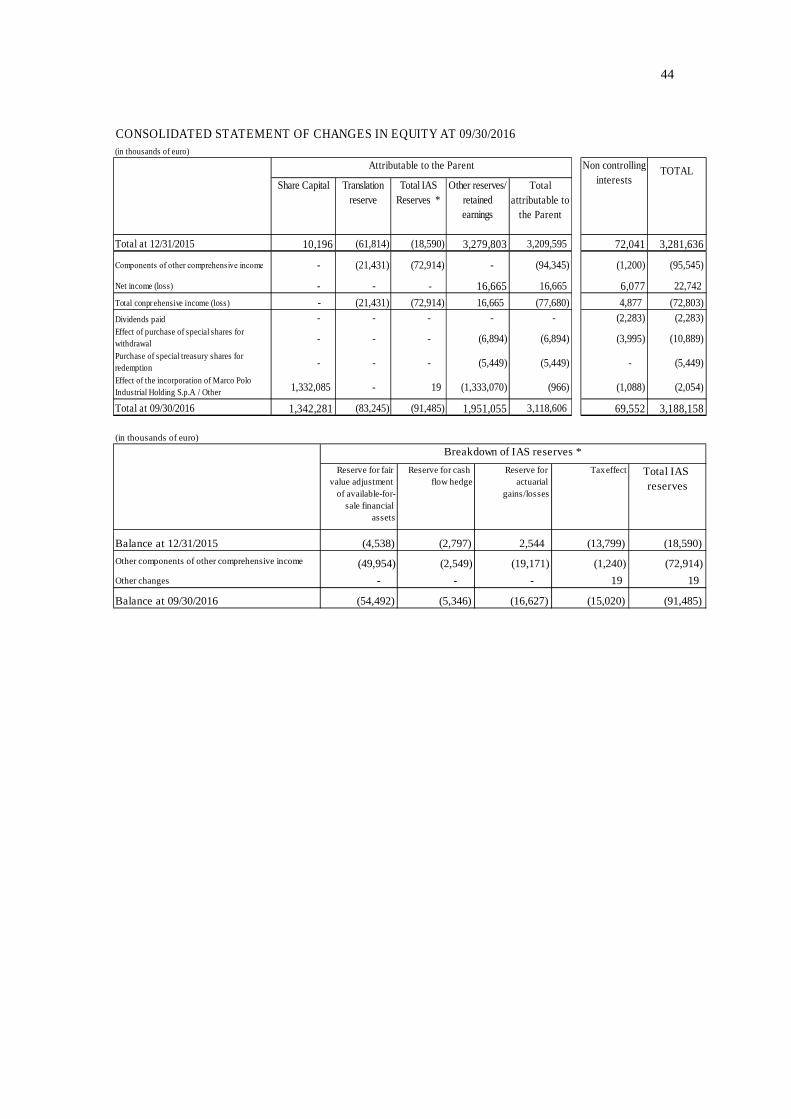
CONSOLIDATED STATEMENT OF CHANGES IN EQUITY AT 09/30/2016(in thousands of euro)
TOTAL
Share Capital Translation
reserve
Total IAS
Reserves *
Other reserves/
retained
earnings
Total
attributable to
the Parent
Total at 12/31/2015 10,196 (61,814) (18,590) 3,279,803 3,209,595 72,041 3,281,636
Сomponents of other comprehensive income - (21,431) (72,914) - (94,345) (1,200) (95,545)
Net income (loss) - - - 16,665 16,665 6,077 22,742
Total conprehensive income (loss) - (21,431) (72,914) 16,665 (77,680) 4,877 (72,803)
Dividends paid - - - - - (2,283) (2,283)Effect of purchase of special shares for
withdrawal - - - (6,894) (6,894) (3,995) (10,889)
Purchase of special treasury shares for
redemption - - - (5,449) (5,449) - (5,449)
Effect of the incorporation of Marco Polo
Industrial Holding S.p.A / Other 1,332,085 - 19 (1,333,070) (966) (1,088) (2,054)
Total at 09/30/2016 1,342,281 (83,245) (91,485) 1,951,055 3,118,606 69,552 3,188,158
Attributable to the Parent Non controlling
interests
(in thousands of euro)
Reserve for fair
value adjustment
of available-for-
sale financial
assets
Reserve for cash
flow hedge
Reserve for
actuarial
gains/losses
Taxeffect Total IAS
reserves
Balance at 12/31/2015 (4,538) (2,797) 2,544 (13,799) (18,590)
Other components of other comprehensive income (49,954) (2,549) (19,171) (1,240) (72,914)
Other changes - - - 19 19
Balance at 09/30/2016 (54,492) (5,346) (16,627) (15,020) (91,485)
Breakdown of IAS reserves *
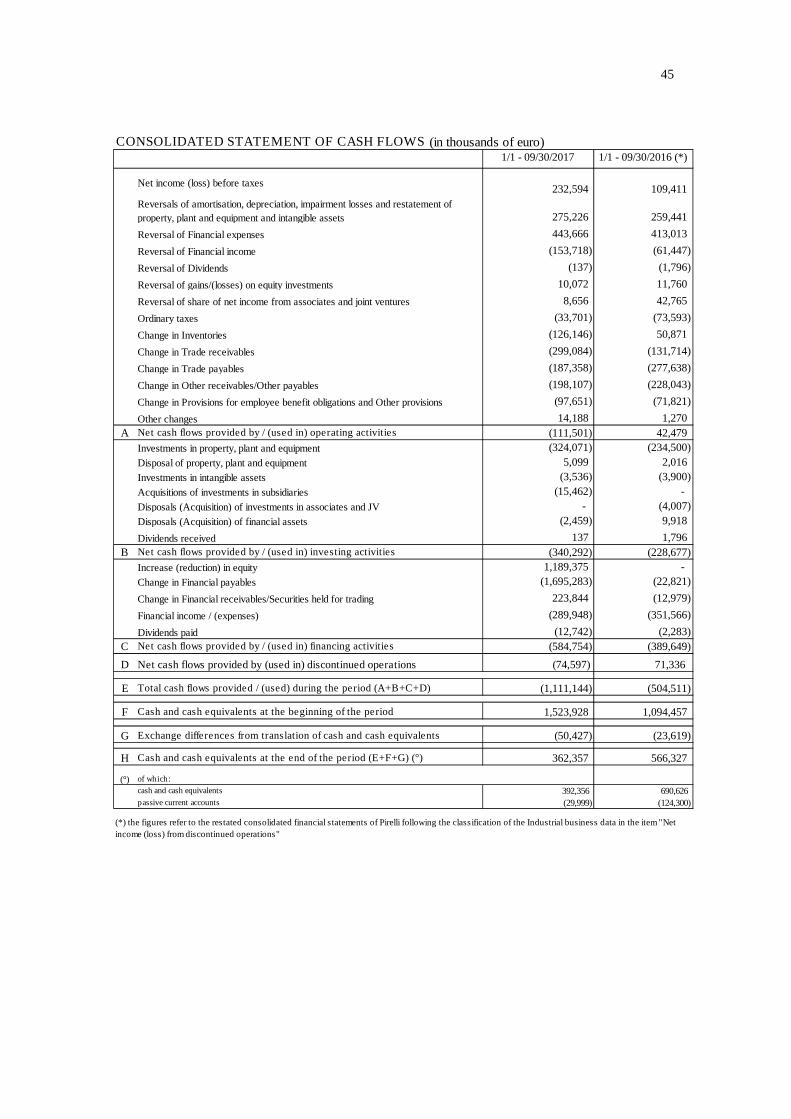
45
CONSOLIDATED STATEMENT OF CASH FLOWS (in thousands of euro)
Net income (loss) before taxes232,594 109,411
Reversals of amortisation, depreciation, impairment losses and restatement of
property, plant and equipment and intangible assets 275,226 259,441
Reversal of Financial expenses 443,666 413,013
Reversal of Financial income (153,718) (61,447)
Reversal of Dividends (137) (1,796)
Reversal of gains/(losses) on equity investments 10,072 11,760
Reversal of share of net income from associates and joint ventures 8,656 42,765
Ordinary taxes (33,701) (73,593)
Change in Inventories (126,146) 50,871
Change in Trade receivables (299,084) (131,714)
Change in Trade payables (187,358) (277,638)
Change in Other receivables/Other payables (198,107) (228,043)
Change in Provisions for employee benefit obligations and Other provisions (97,651) (71,821)
Other changes 14,188 1,270
A Net cash flows provided by / (used in) operating activities (111,501) 42,479
Investments in property, plant and equipment (324,071) (234,500)
Disposal of property, plant and equipment 5,099 2,016
Investments in intangible assets (3,536) (3,900)
Acquisitions of investments in subsidiaries (15,462) -
Disposals (Acquisition) of investments in associates and JV - (4,007)
Disposals (Acquisition) of financial assets (2,459) 9,918
Dividends received 137 1,796
B Net cash flows provided by / (used in) investing activities (340,292) (228,677)
Increase (reduction) in equity 1,189,375 -
Change in Financial payables (1,695,283) (22,821)
Change in Financial receivables/Securities held for trading 223,844 (12,979)
Financial income / (expenses) (289,948) (351,566)
Dividends paid (12,742) (2,283)
C Net cash flows provided by / (used in) financing activities (584,754) (389,649)
D Net cash flows provided by (used in) discontinued operations (74,597) 71,336
E Total cash flows provided / (used) during the period (A+B+C+D) (1,111,144) (504,511)
F Cash and cash equivalents at the beginning of the period 1,523,928 1,094,457
G Exchange differences from translation of cash and cash equivalents (50,427) (23,619)
H Cash and cash equivalents at the end of the period (E+F+G) (°) 362,357 566,327
(°) of which:
cash and cash equivalents 392,356 690,626passive current accounts (29,999) (124,300)
1/1 - 09/30/2017 1/1 - 09/30/2016 (*)
(*) the figures refer to the restated consolidated financial statements of Pirelli following the classification of the Industrial business data in the item "Net
income (loss) from discontinued operations"
46
FORM AND CONTENT
The publication of the Interim Financial Reports - as announced by the Company during the
course of October 2017 at the commencement of the stock market listing - is carried out on a
voluntary basis (starting as of this Interim Financial Report and up until a different
resolution is approved by the Board of Directors) and contains a continuity of informative
content with respect to similar publications previously issued by the Company. The
publication of the Interim Financial Reports will cover the quarters which close at March 31
and September 30 of each financial year.
The accounting standards applied for the valuation of the accounting measures were the
International Accounting Standards (IAS) and the International Financial Reporting
Standards (IFRS) issued by the International Accounting Standards Board (IASB) and the
relative interpretations issued by the International Financial Reporting Interpretations
Committee (IFRIC), as approved by the European Commission and were in force at the time
of approval of these Financial Statements.
The accounting standards used are the same as those used for the preparation of the
consolidated Financial Statements at December 31, 2016, to which reference should be made
for further details, with the exception of income taxes, which were recognised on the basis of
the best estimate of the weighted average rate expected for the entire financial year.
The following standards listed below came into force as of January 1, 2017 but have not yet
been approved by the European Union and are therefore not applicable:
Amendments to IAS 12 - Recognition of Deferred Tax Assets for Unrealised Losses: no
impacts were forseen on the Group's Financial Statements arising from the application of
these amendments.
Amendments to IAS 7 – Disclosure Initiative: these amendments did have a limited
impact on the disclosure of the Financial Statements of the Group.
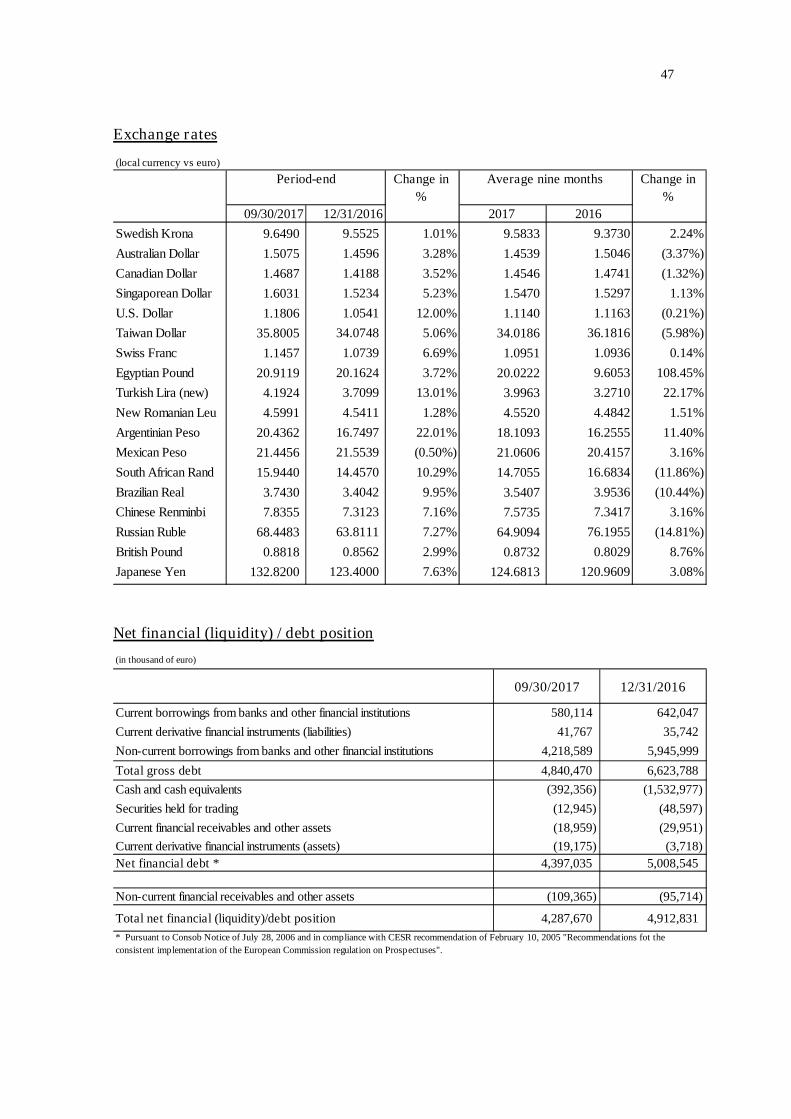
47
Exchange rates
(local currency vs euro)
Period-end Change in
%
Average nine months Change in
%
09/30/2017 12/31/2016 2017 2016
Swedish Krona 9.6490 9.5525 1.01% 9.5833 9.3730 2.24%
Australian Dollar 1.5075 1.4596 3.28% 1.4539 1.5046 (3.37%)
Canadian Dollar 1.4687 1.4188 3.52% 1.4546 1.4741 (1.32%)
Singaporean Dollar 1.6031 1.5234 5.23% 1.5470 1.5297 1.13%
U.S. Dollar 1.1806 1.0541 12.00% 1.1140 1.1163 (0.21%)
Taiwan Dollar 35.8005 34.0748 5.06% 34.0186 36.1816 (5.98%)
Swiss Franc 1.1457 1.0739 6.69% 1.0951 1.0936 0.14%
Egyptian Pound 20.9119 20.1624 3.72% 20.0222 9.6053 108.45%
Turkish Lira (new) 4.1924 3.7099 13.01% 3.9963 3.2710 22.17%
New Romanian Leu 4.5991 4.5411 1.28% 4.5520 4.4842 1.51%
Argentinian Peso 20.4362 16.7497 22.01% 18.1093 16.2555 11.40%
Mexican Peso 21.4456 21.5539 (0.50%) 21.0606 20.4157 3.16%
South African Rand 15.9440 14.4570 10.29% 14.7055 16.6834 (11.86%)
Brazilian Real 3.7430 3.4042 9.95% 3.5407 3.9536 (10.44%)
Chinese Renminbi 7.8355 7.3123 7.16% 7.5735 7.3417 3.16%
Russian Ruble 68.4483 63.8111 7.27% 64.9094 76.1955 (14.81%)
British Pound 0.8818 0.8562 2.99% 0.8732 0.8029 8.76%
Japanese Yen 132.8200 123.4000 7.63% 124.6813 120.9609 3.08%
Net financial (liquidity) / debt position
(in thousand of euro)
Current borrowings from banks and other financial institutions 580,114 642,047
Current derivative financial instruments (liabilities) 41,767 35,742
Non-current borrowings from banks and other financial institutions 4,218,589 5,945,999
Total gross debt 4,840,470 6,623,788
Cash and cash equivalents (392,356) (1,532,977)
Securities held for trading (12,945) (48,597)
Current financial receivables and other assets (18,959) (29,951)
Current derivative financial instruments (assets) (19,175) (3,718)
Net financial debt * 4,397,035 5,008,545
Non-current financial receivables and other assets (109,365) (95,714)
Total net financial (liquidity)/debt position 4,287,670 4,912,831
12/31/201609/30/2017
* Pursuant to Consob Notice of July 28, 2006 and in compliance with CESR recommendation of February 10, 2005 "Recommendations fot the
consistent implementation of the European Commission regulation on Prospectuses".
48
Declaration of the Manager responsible for the preparation of the
corporate financial documents pursuant to the provisions of the Article
154-bis, paragraph 2 of the Legislative Decree 58/1998
Francesco Tanzi, as Manager responsible for the preparation of the corporate financial
documents, pursuant to the provisions of the Article 154-bis, paragraph 2 of the Legislative
Decree 58/1998, hereby certifies that the accounting information contained in the Interim
Financial Report as at September 30, 2017 corresponds to what contained in the accounting
documentation, books and records.
Milan, November 6, 2017
__________________
Francesco Tanzi