intergovernmental group on tea twentieth ......intergovernmental group on tea twentieth session...
TRANSCRIPT

CCP:TE 12/CRS 7
January 2012
E
COMMITTEE ON COMMODITY
PROBLEMS
INTERGOVERNMENTAL GROUP ON TEA
Twentieth Session
Colombo, Sri Lanka, 30 January - 1 February 2012
CURRENT SITUATION AND MEDIUM TERM OUTLOOK FOR TEA
I. INTRODUCTION
1. This document constitutes an overview of the current market situation and medium term
outlook to 2021 for tea. The analysis is based on data received by the Secretariat from member
countries, supplemented by data from other sources including the International Tea Committee.
Macro-economic data were sourced from the IMF, World Bank and OECD, particularly for those used
in the medium term projections.
2. A deviation from past practices, is the inclusion of market commentaries from IGG member
countries that had provided theirs. The Secretariat is extremely grateful to contributions from
Argentina, India, Indonesia, Kenya, Mauritius, Sri Lanka, Tanzania and Vietnam. If delegates find this
useful, they may wish to adopt it as a standard practice for the Group in its evaluation of the world tea
market, and include contributions from importing countries as well. This would go a long way in
improving the spirit of cooperation among members and promote marketing priorities of the Group in
the areas of:
Improving market transparency;
Fostering market expansion; and
Value chain enhancement.
3. Finally, delegates are requested to review the information presented, and amend and
supplement these where necessary, pertaining to their countries.
II. HIGHLIGHTS
4. World black tea prices remained firm in 2010 and 2011 as market fundamentals were strong.
After long periods of sustained growth, black tea production actually declined in 2009, and although
consumption also declined marginally, demand for black tea exceeded supply. This trend continued in
2010 and 2011 as consumption continued to exceed production.
5. Therefore, as the FAO Tea Composite Price is an indicator price for black tea, it followed that
prices would remain firm throughout 2009 to 2011. Early forecast for 2012 indicates a continuation of

2 CCP:TE 12/CRS 7
this trend as adverse weather has been experienced by some major producers. However, this trend
could change quickly if supply flows are unchecked.
III. PRODUCTION
6. World tea production (Black, Green and Instant) increased significantly by 4.2 percent to 4.1
million tonnes in 2010. Black tea output increased by 5.5 percent in response to record prices while
green tea output increased by 1.9 percent (Table 1). Growth in world output was due to major
recoveries in the two largest black tea exporting countries: Kenya by 18 percent and Sri Lanka by 13
percent. Other notable increases occurred in Argentina (23.5 percent) and Uganda (16.6 percent).
7. China remained the largest tea producing country with an output of 1.4 million tonnes,
accounting for 33 percent of the world total, while production in India, the 2nd largest producer,
continued to decline and reached 0.97 million tonnes in 2010.
8. Preliminary returns for 2011 indicate an estimated increase in total tea production of 1.8
percent to reach 4.2 million tonnes.
IV. EXPORTS
9. World tea exports recovered by 8.4 percent in 2010 after a 4.2 percent decline in 2009 when
volumes reached 1.68 million tonnes in 2009.
10. Although export volumes of black tea were down, earnings actually increased by 7 percent to
USD 4.13 billion because of higher prices (Table 2).
V. CONSUMPTION
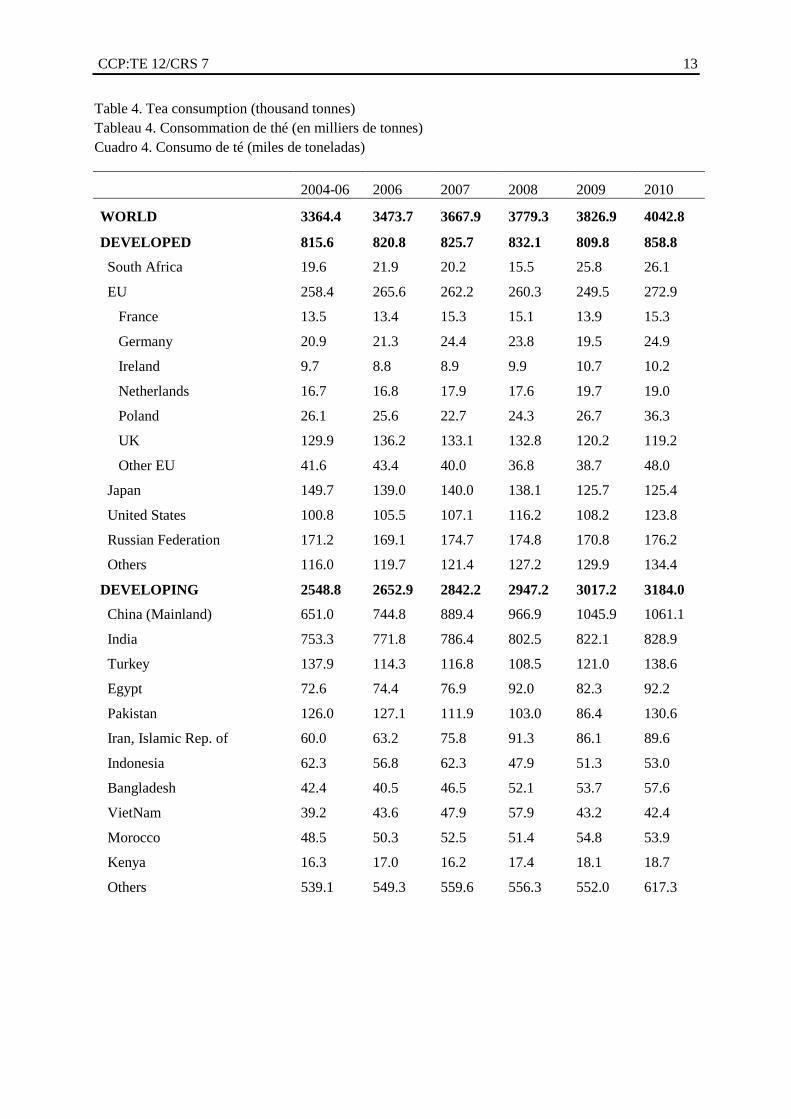
11. The surge in world tea consumption in 2008 continued in 2010 after a brief correction in 2009.
Total tea consumption increased by 5.6 percent in 2010 to 4 million tonnes, which was underpinned by
the rapid growth in per capita income levels, particularly in China, India and other emerging
economies. Growth in demand was particularly marked in China. After a spectacular annual increase
of 8.7 percent in 2008, total consumption in China increased by a further 8.2 percent in 2009, and 1.4
percent in 2010 to reach 1.06 million tonnes, the largest in the world. In India, consumption expanded
by 2.4 percent in 2009 and 1 percent in 2010 to reach 828 890 tonnes (Table 3).
VI. PRICES
12. The FAO Tea Composite Price increased significantly from 2006 to 2009 and reached a
record USD 3.18 per kg in September 2009. Growth continued in 2010 averaging USD 2.81 per kg.
for the year and in 2011 when the price was USD 2.85 per Kg (Fig 1).

CCP:TE 12/CRS 7 3
Figure 1 - FAO Tea Composite Price
13. There are several reasons for the strong growth. Firstly improved supply and demand balance
of black tea, and therefore market fundamentals – for the first time black tea consumption exceeded
production in 2009 and this continued through 2010 and 2011; the weak USD; and high transportation
cost due to high oil prices.
VII. MARKET INFORMATION PROVIDED BY MEMBER COUNTRIES
TO THE SECRETARIAT
A. ARGENTINA
14. Tea in Argentina is harvested from October to late April or early May. Production in 2010/11
increased by 23.5 percent to reach 90 705 tonnes, but 2011/12 began with some difficulty due to “tea
red mite” (Olygonychus yoothersi) infestation, poor rainfall due to the climatic phenomenon known as
“La Niña” and reduced input application due to increased costs.
15. Argentina exports tea to more than 40 countries, but the United States remain the largest,
accounting for 57.2 percent of exports in 2010, when the total exports of tea from Argentina reached
85 571 tonnes. However, demand from Europe was down, possibly due to the negative impact of the
economic crisis.
16. Domestic consumption remains low at 5 428 tonnes, because yerba mate and coffee are the
preferred infusions. However, there are some groups that promote consumption, culture and tea
ceremonies, which are likely to influence consumption.
B. INDIA
17. The estimated area under tea in India in 2010 was 579 353 ha, of which 28 percent was owned
by 161 238 small growers who were responsible for producing 26 percent of the total output of the
country. The remaining 72 percent of the tea area was under the organised sector with 1 686 gardens.
18. Tea production (black and green tea) in 2010 declined by 12 600 tonnes to 966 400 tonnes
due to adverse weather in Assam. While there was a big drop in CTC production, output of other types
of teas showed an increase. From January to October 2011, production was up by 33 000 tonnes,
mainly due to good weather conditions in tea growing regions of North India. Forecast for the full year
FAO Tea Composite Price
1.00
1.50
2.00
2.50
3.00
3.50
Jan-
06
Apr-
06
Jul-0
6
Oct
-06
Jan-
07
Apr-
07
Jul-0
7
Oct
-07
Jan-
08
Apr-
08
Jul-0
8
Oct
-08
Jan-
09
Apr-
09
Jul-0
9
Oct
-09
Jan-
10
Apr-
10
Jul-1
0
Oct
-10
Jan-
11
Apr-
11
Jul-1
1
Oct
-11
US
D/
kg

4 CCP:TE 12/CRS 7
indicates production to exceed 1 million tonnes. Of the tea produced, 55 percent was sold in domestic
public auctions where prices remained stable and almost at par with prices fetched in 2009.
19. Export volumes and value in 2010 were down, mainly due to smaller shipments to the
Russian Federation, Iraq, Afghanistan, United Kingdom and Egypt, and although exports in the first
ten months of 2011 to October, were also down , the value and unit prices were well above that of the
previous year.
20. In the longer term, according to the XIIth five year plan period for the tea industry (2012-17),
the focus of the tea sub-sector would be on meeting domestic demand in full and maintain a
reasonable share of the global market. The estimated production target for the terminal year of the plan
period is 1.2 million tonnes and emphasis will be placed on realising higher value rather than chasing
volume of exports. In addition, the plan aims to improve collectivisation of small growers and help
them move up the value chain. Field assets will also be renovated by large scale uprooting and
replanting of senile plantations, as well as improving the living conditions of plantation workers.
C. INDONESIA
21. Indonesia produces orthodox and CTC black tea; panning and steaming green tea; jasmine tea;
white tea; oolong tea; instant tea; tea bags and ready to drink (RTD) which are traded in more 40
brand names, as well as teas produced for the pharmaceutical industry. Tea production has steadily
declined from 169 000 tonnes in 2003 to 129 200 tonnes in 2010. Preliminary estimates for 2011
places production at 125 000 tonnes and forecast for 2012 estimates a slight increase to 130 000
tonnes. The decrease in production over the last decade was mainly due to the contraction in area
under tea, from 157 000 ha in 1998 to an estimated 120 000 ha in 2011 as low productivity and returns
caused growers to diversify to other crops. No further decline in area is envisaged for 2012.
22. Bulk black and green tea have successfully been exported to more than 40 countries in
Europe, America, Asia, Africa and Australia. In 2010 export earnings reached USD 178 million.
Meanwhile, tea imports have increased from 50 tonnes in 1996 to 7 200 tonnes in 2009, valued at
USD 12.5 million.
23. Black tea price has also been increasing, from US cents 95.46 per kg 2003 to US cents 198.11
per kg in 2011 (January-September).
D. KENYA
24. Tea production in Kenya reached an all time high of 399 000 tonnes in 2010, surpassing the
record of 369 000 tonnes established in 2007, mainly due to conducive weather conditions. Auction
prices held firm during the year, despite increased supplies, with the price for Kenyan tea at the
Mombasa Tea Auction averaging USD 2.75 per Kg of made tea for 2010. This reflected a gradual
increase from USD 2.72 per Kg realized in 2009 and USD 2.33 per Kg in 2008.
25. Tea exports increased by nearly 30 percent in 2010 reaching 441 tonnes valued at USD 1.3
billion compared to tea export earnings amounting to USD 899 million in 2009.
26. Tea production declined by 5 percent in 2011 to 377 900 tonnes as most tea growing regions
experienced depressed and poorly distributed rainfall during the second quarter as well as relatively
hot and dry weather conditions in the first quarter of the year. The average Auction price for Kenyan
tea continued to hold firm at USD 2.99 per Kg, but export volumes declined slightly to 421 000 tonnes
earning USD 1.23 Billion, which was higher in Kenya Shillings due to the depreciation of the currency
against the USD. The Kenya Shilling exchanged at an average rate of 88.86 to the USD compared to
79.23 in 2010.
27. Production in the first quarter of 2012 is expected to be lower than that of 2011, because of
dry weather at the end of December 2011 combined with incidences of frost that affected the tea
growing areas at the beginning of 2012. As the hot and dry weather conditions continued in January,
production for the first quarter of the year is likely to drop by 17 percent to 70 000 tonnes, compared
to the first quarter of 2011, which is likely to affect production marginally by an estimated 2 percent

CCP:TE 12/CRS 7 5
for the year. However, due to expected firm prices, export earnings for 2012 are projected to reach
K.sh 115 Billion thereby surpassing earnings in 2011.
E. MAURITIUS
28. Mauritius, green leaf output amounted to 7 370 tonnes in 2010 and is estimated at 9 285
tonnes in 2011, producing 1 494 tonnes and 1 868 tonnes of black tea, respectively. Prospects for 2012
appear to be good if the present climatic conditions prevail, namely high temperature, and adequate
sunshine and rainfall.
F. SRI LANKA
29. Conducive weather throughout 2010, combined with no work stoppages in the plantation
sector yielded a historical production record for Sri Lanka. The total crop output was recorded at 331
400 tonnes. Strong demand at the Colombo Tea Auctions helped to maintain buoyant Ceylon tea
prices and the national average reached Rs. 371/- per kg (USD 3.28 per kg). The exports of pure
Ceylon Tea was computed at 298 600 tonnes in 2010.
30. Erratic weather conditions impacted tea production in 2011 which is estimated to exceed
325 000 tonnes, but not likely to reach the 2010 output level. The final production figure is expected to
be around 1 to 1.5 percent less. The national auction average took a marginal dip to Rs. 350/kg
(USD 3.10 per kg) due to instability in Sri Lanka’s markets in the Near East, sanctions on Iran, turmoil
in North Africa, global economic recession, the depreciation of currencies in tea importing countries
against the dollar and the Sri Lankan rupee remaining strong viz. a viz. the currencies of other
producing countries. Exports for 2011 is expected to reach 300 000 tonnes.
31. Weather permitting, output in 2012 is expected to increase by 2 percent to 335 000 tonnes,
due to a greater rate of re-planting, exports are expected to reach 310 000 tonnes, and prices would
surpass Rs. 400/kg (USD 3.51 per kg) underpinned by stronger demand for Ceylon tea.
G. UNITED REPUBLIC OF TANZANIA
32. Black tea production in Tanzania for the year 2010 stood at 31 646 tonnes representing a
3.6 percent drop compared to 2009, mainly due to the drought which affected most of the tea growing
regions. Output from estates fell by 6.4 percent to 21 697 tonnes, while production from smallholders
actually increase by 2.3 percent to 9 949 tonnes. Exports for the year increased by 7 percent to reach
26 000 tonnes, valued at USD 48 million, an increase of USD 4 million over the earnings registered in
the previous year, as export prices per kg averaged USD 1.84 in 2010 against USD 1.79 in 2009. Local
tea consumption increased by 26.2 percent in 2010 to reach 5 810 tonnes, mostly attributed to
increased tea drinking campaigns conducted by Tea Board of Tanzania in collaboration with Tea
Stakeholders geared towards enhancing local tea consumption in Tanzania.
33. Preliminary estimates for 2011 indicate a 10.6 percent increase in production to 35 000 tonnes,
as a result of increased tea productivity from rehabilitated tea farms and improving management
practices of tea farms of both estates and smallholders, and in 2012 production is expected to increase
by 2.9 percent to 36 000 tonnes.
H. VIETNAM
34. A summary of the situation in Vietnam was provided by the Vietnam Tea Association as
follows: tea production in 2011 was approximately 178 000 tonnes, of which 53 percent was black tea,
45 percent green tea (including oolong and scented teas) and 2 percent others. As for exports, 123 000
tonnes valued at USD 188 million were exported through official channels in 2011 and 20 000 tonnes
valued at an additional USD 20 million, through unofficial channels. Exports fetched an average price
of USD 1 340 per tonnes for black tea, and USD 1700 per tonne for green tea. Domestic consumption
reached 20 000 tonnes, and closing stocks amounted to 15 000 tonnes.
35. A summary of the situation in Vietnam was provided by the Vietnam Tea Association as
follows: tea production in 2011 was approximately 178 000 tonnes, of which 53 percent was black tea,

6 CCP:TE 12/CRS 7
45 percent green tea (including oolong and scented teas) and 2 percent others. As for exports, 123 000
tonnes valued at USD 188 million were exported through official channels in 2011 and 20 000 tonnes
valued at an additional USD 20 million, through unofficial channels. Exports fetched an average price
of USD 1 340 per tonnes for black tea, and USD 1700 per tonne for green tea. Domestic consumption
reached 20 000 tonnes, and closing stocks amounted to 15 000 tonnes.
VIII. PROJECTIONS
A. PRODUCTION
36. The 10 years projections to 2021 indicate that world black tea production will grow at a
slightly lower rate compared to the previous decade.
37. Black tea production is projected to grow at 1.9 percent annually to reach 3.28 million tonnes
by 2021 (Table 6).
38. World green tea production is expected to grow at a faster rate than black tea, 7.2 percent,
reflecting the growth in China where production of green tea is expected to reach. 2.3 million tonnes
(Table 7).
B. BLACK TEA CONSUMPTION
39. For non-tea producing countries: net imports were used as a proxy for consumption; and for
producing countries: actual domestic consumption.
40. Data on green tea consumption are not complete and therefore difficult to make a meaningful
projection.
41. Black tea consumption will grow at 1.8 percent p.a. to reach 3.36 million tonnes in 2021
(Table 9).
42. Stronger growth in consumption in producing countries is unlikely to offset declines in
traditional import markets in the next 10 years.
C. BLACK TEA EXPORTS
43. Black tea exports are projected to reach 1.52 million tonnes in 2021 (Table 8), with similar
growth rates projected for both Africa and Asia. However, by 2021, export volumes for Asia are
projected to reach 745 145 tonnes compared to 637 040 tonnes for Africa. Major exporting countries
are expected to remain the same with Kenya being the largest exporter followed by Sri Lanka, India,
Vietam, Indonesia, Malawi, Uganda and Tanzania.
D. GREEN TEA EXPORTS
44. World green tea exports are projected to grow at 5.8 percent annually to reach 515 972.tonnes
by 2021 (Table 7). China is expected to continue to dominate with an export volume of 435 813
tonnes, followed by Vietnam at a distant second with 53 757 tonnes, Indonesia with 12 596 tonnes,
and Japan at 2 721 tonnes.
IX. CONCLUDING REMARKS
45. The review of the world tea market indicates an improvement in the fundamental oversupply
situation which has persisted in recent years underpinning current firm prices.
46. The increase in tea prices resulted in an estimated 2.2 percent increase in export earnings in
2011 at the global level, significantly affecting rural incomes and household food security in tea
producing countries.

CCP:TE 12/CRS 7 7
47. The ratio was relatively small for other producing countries, but remained significant. For
example, even though domestic consumption accounted for a larger share of total production in
Indonesia, export value in 2010 was USD 178 million and in Tanzania tea exports earned the country
USD 48 million.
48. In the medium term, the projections suggest that supply and demand of black tea will be in
equilibrium in 2021 at a price of USD 2.75 per Kg, if there is no supply over-reaction to the current
firm prices (Fig 2).
Fig 2 - Baseline projections to 2021 USD per Kg.
49. However, if there is an over-reaction to recent high prices which, for example would result in
a 5 percent increase in production, the results can be quite different (Fig. 3). Here the clearing price
would be 17 percent less than the baseline price at USD 2.54 per Kg.
Fig 3 – Production increases 5 percent over the baseline.
0.00
0.50
1.00
1.50
2.00
2.50
3.00
1989 1991 1993 1995 1997 1999 2001 2003 2005 2007 2009 2011 2013 2015 2017 2019 2021
0.00
0.50
1.00
1.50
2.00
2.50
3.00
19
89
19
90
19
91
19
92
19
93
19
94
19
95
19
96
19
97
19
98
19
99
20
00
20
01
20
02
20
03
20
04
20
05
20
06
20
07
20
08
20
09
20
10
20
11
20
12
20
13
20
14
20
15
20
16
20
17
20
18
20
19
20
20
20
21
Tea prices USD per Kg

8 CCP:TE 12/CRS 7
50. If the reaction to the current high prices is even stronger, resulting in a say 10 percent increase
in production over the baseline increase, then prices could be 38 percent lower (Fig. 4)
Fig 4 – Production increases 10 percent over the baseline.
51. Therefore, caution needs to be exercised. Greater efforts should be directed at expanding
demand. For example, there is scope for increasing per capita consumption in producing countries as
they are low compared to traditional import markets. The IGG on Tea has also encouraged
diversification into other segments of the market, such as organic tea, and the health benefits of tea
consumption should be used more extensively in promoting consumption in both producing and
importing countries. However, in targeting potential growth markets, recognition of and compliance
with food safety and quality standards is essential.
0.00
0.50
1.00
1.50
2.00
2.50
3.00
19
89
19
90
19
91
19
92
19
93
19
94
19
95
19
96
19
97
19
98
19
99
20
00
20
01
20
02
20
03
20
04
20
05
20
06
20
07
20
08
20
09
20
10
20
11
20
12
20
13
20
14
20
15
20
16
20
17
20
18
20
19
20
20
20
21
Tea prices USD per Kg

CCP:TE 12/CRS 7 9
Table 1. World tea production (thousand tonnes)
Tableau 1. Production mondiale de thé (en milliers de tonnes)
Cuadro 1. Producción mundial de té (miles de toneladas)
2004-06 2006 2007 2008 2009 2010
WORLD 3499.4 3599.9 3844.3 3914.8 3953.1 4120.3
Far East 2609.0 2748.2 2893.3 2996.4 3067.7 3120.3
Bangladesh 56.6 53.4 58.4 58.7 60.0 60.0
China (Mainland) 932.7 1028.1 1165.5 1257.9 1344.4 1355.6
India 944.0 985.2 989.7 984.3 982.1 970.3
Indonesia 156.0 146.8 137.2 137.5 136.5 129.2
Sri Lanka 312.4 310.8 304.6 318.6 291.2 331.4
VietNam 133.1 149.2 162.4 162.4 177.3 180.8
Others 74.2 74.5 75.5 77.1 76.2 92.9
Africa 507.1 496.1 576.0 536.8 522.3 617.4
Burundi 7.3 6.3 7.0 6.7 6.9 7.1
Kenya 324.4 313.0 373.2 349.5 318.3 403.3
Malawi 46.7 45.0 48.1 41.6 52.6 51.6
Rwanda 15.9 17.0 20.5 20.0 20.5 22.2
South Africa 3.7 3.4 4.9 3.7 4.0 3.7
Tanzania United Rep 30.8 31.3 34.8 31.6 32.1 31.7
Uganda 37.2 36.7 44.9 45.7 51.0 59.4
Zimbabwe 16.4 15.7 13.0 8.3 7.3 8.6
Others 24.7 27.5 29.7 29.7 29.6 29.8
Latin America and Caribbean 90.5 96.3 99.1 101.1 90.8 108.4
Argentina 73.1 76.2 80.5 82.1 73.4 90.7
Brazil 8.3 8.4 8.5 8.5 7.6 7.7
Others 9.1 11.6 10.1 10.5 9.8 9.9
Near East 179.4 151.4 165.5 168.1 169.4 172.0
Iran, Islamic Rep. of 36.0 36.2 43.8 44.3 39.6 27.0
Turkey 143.4 115.2 121.7 123.8 129.8 145.0
Oceania 7.1 7.1 7.1 7.2 7.2 7.2
Japan 97.5 91.8 94.1 95.5 86.0 85.0
CIS 8.8 9.1 9.2 9.7 9.7 10.0
Developed 117.1 111.4 115.3 116.0 106.9 105.8
Developing 3382.3 3488.5 3729.0 3798.8 3846.2 4014.5

10 CCP:TE 12/CRS 7
Table 2. World tea exports (thousand tonnes)
Tableau 2. Exportations mondiales de thé (en milliers de tonnes)
Cuadro 2. Exportaciones mundiales de té (miles de toneladas)
2004-06 2006 2007 2008 2009 2010
WORLD 1547.7 1555.1 1558.6 1615.2 1547.0 1676.9
Far East 1010.4 1038.0 981.2 1021.2 1008.1 1028.5
Bangladesh 9.1 4.8 10.6 8.4 2.1 0.9
Sri Lanka 301.3 314.9 294.2 301.3 279.9 298.6
China (Mainland) 284.5 286.6 289.4 296.9 303.0 302.4
India 207.1 218.7 178.8 203.1 180.5 182.7
Indonesia 98.7 95.3 83.7 96.2 92.3 87.1
VietNam 98.9 105.6 114.5 104.5 134.1 138.4
Others 11.0 12.0 10.2 10.7 16.3 18.5
Africa 440.6 419.1 476.8 492.1 448.9 541.4
Kenya 292.3 272.0 301.8 329.2 281.1 361.1
Malawi 43.8 42.0 46.6 40.1 46.8 48.9
Zimbabwe 11.6 11.4 10.2 5.7 4.5 5.1
Rwanda 12.0 12.7 19.7 19.8 18.8 21.5
South Africa 3.7 3.2 5.0 8.7 5.2 4.9
Tanzania United Rep 23.6 24.1 29.1 25.5 24.4 26.1
Uganda 33.6 32.7 43.6 42.4 47.9 53.7
Others 20.0 21.0 20.6 20.8 20.2 20.2
Latin America and Caribbean 75.0 78.3 81.9 83.1 73.7 90.4
Oceania 6.5 6.5 6.8 7.7 7.8 7.4
Developed 16.0 17.1 20.5 24.3 19.7 19.2
Developing 1531.8 1538.1 1538.1 1590.8 1527.3 1657.7

CCP:TE 12/CRS 7 11
Table 3. World tea imports (thousand tonnes)
Tableau 3. Importations mondiales de thé (en milliers de tonnes)
Cuadro 3. Importaciones mundiales de té (miles de toneladas)
2004-06 2006 2007 2008 2009 2010
WORLD 1647.3 1676.3 1675.8 1717.9 1645.0 1802.0
Europe 400.5 396.5 382.5 391.4 365.0 381.2
EU 394.0 390.7 377.8 385.4 359.8 376.3
France 16.4 16.3 18.0 18.7 17.7 19.3
Germany 43.9 46.7 48.4 50.8 44.8 50.8
Ireland 10.1 9.1 9.3 10.4 11.0 10.9
Netherlands 32.3 34.2 35.9 36.4 38.6 37.2
Poland 32.4 34.1 28.5 31.7 39.4 47.5
UK 160.1 164.7 159.8 161.0 150.7 152.4
Other EU 98.7 85.8 78.0 76.4 57.4 58.1
Other Europe 6.6 5.8 4.7 6.0 5.3 4.9
CIS 250.8 254.0 264.6 272.1 275.8 277.7
Russian Federation 174.8 172.9 181.3 181.9 183.9 181.6
Canada 17.9 17.7 19.3 17.0 17.3 18.0
Japan 53.4 48.8 47.7 44.5 41.7 42.7
United States 102.4 107.6 109.4 118.8 110.9 126.8
Oceania 16.3 15.5 17.2 17.4 15.9 16.7
Far East 227.3 236.7 231.4 221.4 200.6 251.2
Sri Lanka 9.2 12.5 15.6 18.6 10.0 12.2
China (Mainland) 2.8 3.2 13.4 9.0 4.7 4.6
India 23.7 24.0 16.0 20.3 25.5 20.0
Indonesia 5.0 5.3 8.7 6.6 7.2 10.9
Malaysia 14.6 14.8 15.7 13.5 16.4 17.9
Pakistan 126.2 127.3 112.1 103.0 86.4 130.6
Others 45.8 49.6 49.9 50.4 50.6 55.0
Africa 155.1 162.1 161.3 155.1 162.5 172.6
Kenya 10.9 12.1 8.7 4.9 4.9 13.7
Morocco 48.8 50.6 52.5 51.9 55.3 54.5
South Africa 19.6 21.8 20.4 20.5 27.0 27.3
Others 75.8 77.6 79.7 77.7 75.2 77.1
Latin America and
Caribbean 24.2 24.0 25.4 30.1 25.5 29.3

12 CCP:TE 12/CRS 7
Table 3. World tea imports (thousand tonnes)
Tableau 3. Importations mondiales de thé (en milliers de tonnes)
Cuadro 3. Importaciones mundiales de té (miles de toneladas)
2004-06 2006 2007 2008 2009 2010
Near East 399.5 413.5 416.8 450.1 429.8 485.9
Afghanistan 36.3 34.0 44.0 40.3 46.9 57.6
Egypt 74.8 78.3 79.0 94.0 86.2 95.5
Iran Islamic Rep. of 27.3 27.0 32.0 47.0 46.5 62.6
Iraq 55.3 57.0 35.0 37.0 37.0 40.0
Saudi Arabia 25.6 24.9 29.2 25.6 22.2 23.9
Sudan 18.2 17.5 23.0 21.4 21.8 27.3
Syrian Arab Republic 30.0 30.3 27.5 27.5 32.2 30.3
United Arab Emirates 77.8 85.6 94.0 101.3 79.9 79.9
Libyan Arab Jamahiriya 13.1 14.5 9.5 9.0 9.0 11.7
Others 41.0 44.3 43.7 47.1 48.0 57.0
Developed 862.6 863.7 862.9 883.5 855.4 892.1
Developing 784.8 812.6 812.8 834.4 789.5 909.9
CCP:TE 12/CRS 7 13
Table 4. Tea consumption (thousand tonnes)
Tableau 4. Consommation de thé (en milliers de tonnes)
Cuadro 4. Consumo de té (miles de toneladas)
2004-06 2006 2007 2008 2009 2010
WORLD 3364.4 3473.7 3667.9 3779.3 3826.9 4042.8
DEVELOPED 815.6 820.8 825.7 832.1 809.8 858.8
South Africa 19.6 21.9 20.2 15.5 25.8 26.1
EU 258.4 265.6 262.2 260.3 249.5 272.9
France 13.5 13.4 15.3 15.1 13.9 15.3
Germany 20.9 21.3 24.4 23.8 19.5 24.9
Ireland 9.7 8.8 8.9 9.9 10.7 10.2
Netherlands 16.7 16.8 17.9 17.6 19.7 19.0
Poland 26.1 25.6 22.7 24.3 26.7 36.3
UK 129.9 136.2 133.1 132.8 120.2 119.2
Other EU 41.6 43.4 40.0 36.8 38.7 48.0
Japan 149.7 139.0 140.0 138.1 125.7 125.4
United States 100.8 105.5 107.1 116.2 108.2 123.8
Russian Federation 171.2 169.1 174.7 174.8 170.8 176.2
Others 116.0 119.7 121.4 127.2 129.9 134.4
DEVELOPING 2548.8 2652.9 2842.2 2947.2 3017.2 3184.0
China (Mainland) 651.0 744.8 889.4 966.9 1045.9 1061.1
India 753.3 771.8 786.4 802.5 822.1 828.9
Turkey 137.9 114.3 116.8 108.5 121.0 138.6
Egypt 72.6 74.4 76.9 92.0 82.3 92.2
Pakistan 126.0 127.1 111.9 103.0 86.4 130.6
Iran, Islamic Rep. of 60.0 63.2 75.8 91.3 86.1 89.6
Indonesia 62.3 56.8 62.3 47.9 51.3 53.0
Bangladesh 42.4 40.5 46.5 52.1 53.7 57.6
VietNam 39.2 43.6 47.9 57.9 43.2 42.4
Morocco 48.5 50.3 52.5 51.4 54.8 53.9
Kenya 16.3 17.0 16.2 17.4 18.1 18.7
Others 539.1 549.3 559.6 556.3 552.0 617.3

14 CCP:TE 12/CRS 7
Table 5. FAO composite price (USD per Kg)
Tableau 5. Prix composite de la FAO (dollars EU par kilo)
Cuadro 5. Precio compuesto de la FAO (USD por kg)
Year Jan Feb Mar Apr May June July Aug Sept Oct Nov Dec Average
2000 1.84 1.85 1.79 1.79 1.76 1.71 1.88 1.78 1.88 1.81 1.76 1.71 1.80
2001 1.82 1.72 1.64 1.55 1.49 1.46 1.55 1.54 1.51 1.45 1.50 1.48 1.56
2002 1.48 1.49 1.52 1.46 1.43 1.44 1.44 1.48 1.53 1.54 1.50 1.46 1.48
2003 1.59 1.48 1.47 1.45 1.44 1.45 1.58 1.49 1.51 1.57 1.52 1.53 1.51
2004 1.56 1.61 1.64 1.65 1.61 1.56 1.64 1.64 1.77 1.76 1.74 1.73 1.66
2005 1.63 1.59 1.72 1.64 1.58 1.57 1.62 1.65 1.67 1.67 1.64 1.66 1.64
2006 1.68 1.89 1.84 1.85 1.85 1.90 1.92 1.88 1.87 1.80 1.74 1.77 1.83
2007 1.78 1.78 1.85 1.84 1.81 1.88 1.91 2.01 2.11 2.15 2.10 2.17 1.95
2008 2.44 2.46 2.41 2.46 2.41 2.58 2.64 2.65 2.65 2.25 1.91 1.85 2.39
2009 2.19 2.15 2.29 2.42 2.60 2.71 2.92 2.97 3.18 2.96 3.00 2.89 2.69
2010 2.93 2.87 2.83 2.73 2.62 2.57 2.61 2.89 2.92 2.94 2.90 2.95 2.81
2011 2.98 2.89 2.96 2.94 2.79 2.85 2.95 2.89 2.82 2.80 2.72 2.63 2.85

CCP:TE 12/CRS 7 15
Table 6. Black Tea: Actual and Projected Production - Tableau 6. Thé noir: Production effective
et projetée - Cuadro 6. Té negro: Producción efectiva y prevista
P R O D U C T I O N
Countries / Regions Estimated Projected Growth Rates
2011 2021 2002/2011 2012/2021
Tonnes Percent per year
WORLD 2726780 3286393 1.98 1.87
Africa 572905 733380
Kenya 370000 487678 2.8 2.8
Malawi 45070 49430 1.7 0.8
Zimbabwe 8408 7604 -13.4 -1.0
Rwanda 22249 29356 5.3 2.7
South Africa 3500 3790 -10.2 0.8
Uganda 50678 61128 5.7 1.8
Tanzania United Rep 35000 52000 1.9 4.1
Other 38000 42393 1.1 1.1
Latin America and Caribbean 109150 147998
Argentina 91750 129923 2.9 3.5
Brazil 7900 7641 -0.3 -0.4
Other 9500 10434 -0.3 0.8
Near East 182000 216757
Iran 29000 35664 -6.4 2.1
Turkey 153000 181093 -0.9 1.7
Far East 1846607 2160233
India 990337 1149214 1.7 1.5
Sri Lanka 325543 358418 0.4 1.0
China 185000 259700 16.1 3.4
Viet Nam 115696 148101 7.3 2.5
Bangladesh 62086 72053 1.1 1.5
Malaysia 19939 26796 20.1 3.0
Nepal 17023 19367 9.0 1.2
Indonesia 92000 83536 -3.6 -1.1
Other 38983 43049 0.9 0.8
CIS 8900 20646
Russian Federation 3200 3901 2.9 2.0
Other Former USSR 5700 16746 -1.6 11.1
Oceania 7182 7343 0.4 0.0

16 CCP:TE 12/CRS 7
Table 7. Green Tea : Actual and Projected Production and Exports
Tableau 7. Thé vert: Production et exportations effectives et projetées
Cuadro 7. Té verde: Producción y exportaciones, efectivas y previstas
PRODUCTION
Countries / Regions Estimated Projected Growth Rates
2011 2021 2002/2011 2011/2021
Tonnes Percent per year
World 1299492 2604483 6.9 7.2
China 1076347 2323752 8.3 8.0
Japan 85000 89347 -0.6 0.5
VietNam 65080 122164 8.7 6.5
Indonesia 33000 25619 -3.0 -2.5
EXPORTS
Countries / Regions Estimated Projected Growth Rates
2011 2021 2002/2011 2011/2021
Tonnes Percent per year
World 295000 515972 4.6 5.8
China 230000 435813 3.3 6.6
Japan 2232 2721 13.0 2.0
VietNam 40000 53757 11.5 3.0
Indonesia 11403 12596 12.8 1.0

CCP:TE 12/CRS 7 17
Table 8. Black Tea : Exports, Actual and Projected
Tableau 8. Thé noir: Exportations effectives et projetées
Cuadro 8. Té negro: Exportaciones efectivas y previstas
E X P O R T S
Countries / Regions Estimated Projected Growth Rates
2011 2021 2002/2011 2012/2021
Tonnes Percent per year
WORLD 1295427 1520555 0.9 1.5
Africa 499359 637040
Kenya 326000 432671 2.2 2.9
Malawi 42300 46227 1.0 0.7
Zimbabwe 5000 3082 -16.4 -5.5
Rwanda 21528 27416 8.4 2.5
South Africa 4781 4781 -3.3 0.0
Uganda 50000 59058 6.1 1.8
Tanzania United Rep 29750 43622 2.7 4.3
Other 20000 20183 -0.8 0.0
Far East 691307 745145
India 168000 137034 -1.1 -2.7
Sri Lanka 294185 318844 0.0 1.0
China 40000 80638 0.3 7.0
VietNam 98782 127280 8.3 2.5
Bangladesh 2000 910 -26.8 0.5
Malaysia 2199 2199 5.6 0.0
Nepal 8498 9925 47.6 1.4
Indonesia 71000 61673 -2.8 -1.6
Other 6643 6643 -4.0 0.0
Near East 2500 2164
Turkey 2500 2164 -18.9 -24.8
Other 0 0
Latin America and Caribbean 90692 124638
Argentina 86420 121789 3.8 3.5
Brazil 2119 696 -7.8 -12.5
Other 2153 2153 1.7 0.0

18 CCP:TE 12/CRS 7
Table 8. Black Tea : Exports, Actual and Projected (cont'd)
Tableau 8. Thé noir: Exportations effectives et projetées (suite)
Cuadro 8. Té negro: Exportaciones efectivas y previstas (cont.)
E X P O R T S
Countries / Regions Estimated Projected Growth Rates
2011 2021 2002/2011 2012/2021
Tonnes Percent per year
CIS 4722 4722
Russian Federation 0 0
Other Former USSR 4722 4722 8.6 0.0
Oceania 6847 6847 0.4 0.0

CCP:TE 12/CRS 7 19
Table 9. Black Tea: Consumption
Tableau 9. Thé noir: Consommation
Cuadro 9. Té negro: Consumo
C O N S U M P T I O N
Countries / Regions Estimated Projected Growth Rates
2011 2021 2002/2011 2012/2021
Tonnes Percent per year
WORLD 2792473 3365174 2.3 1.8
Far East 1352518 1654346
Pakistan 127316 139517 0.8 0.8
India 830337 1032199 2.1 2.2
Sri Lanka 29518 33987 2.3 1.8
China 149200 183665 35.8 2.1
VietNam 16914 20821 4.8 2.1
Bangladesh 58986 76596 4.8 2.4
Malaysia 34640 51276 10.8 3.9
Nepal 8767 9684 0.8 1.0
Indonesia 27500 28336 -3.8 0.3
Other 69340 78265 2.8 1.0
Africa 139302 181672
Kenya 19000 28125 5.1 3.9
Malawi 2770 3203 27.9 2.3
Morocco 311 393 7.2 2.3
Zimbabwe 3408 4522 -6.0 3.7
Rwanda 868 1196 -19.2 4.1
South Africa 26049 31136 4.5 1.8
Uganda 1378 1680 -3.4 2.0
Tanzania United Rep 5260 7800 -2.2 4.1
Other 80258 103616 2.5 2.2
Near East 610135 763835
Iran Islamic Rep. of 91492 111528 3.4 2.0
Turkey 143717 182183 -2.4 2.4
Iraq 40041 49194 -4.0 2.1
Saudi Arabia 21597 22701 0.3 0.5
Syria 29999 30300 0.0 0.1
United Arab Emirates 47900 57930 3.4 1.8

20 CCP:TE 12/CRS 7
Table 9. Black Tea: Consumption (cont'd)
Tableau 9. Thé noir: Consommation (suite)
Cuadro 9. Té negro: Consumo (cont.)
C O N S U M P T I O N
Countries / Regions Estimated Projected Growth Rates
2011 2021 2002/2011 2012/2021
Tonnes Percent per year
Egypt 91200 114584 3.4 2.1
Libyan Arab Jam. 11653 12083 -0.7 1.3
Sudan 27344 37462 7.9 3.0
Jordan 9392 12607 7.6 3.7
Israel 1800 2028 3.8 1.2
Other 94000 131234 6.0 3.0
Latin America and
Caribbean 45241 54934
Argentina 5530 8299 -5.7 3.2
Brazil 5781 7047 3.6 2.0
Other 33930 39589 2.7 1.4
North America 115155 139123
United States 102668 126384 2.7 2.1
Canada 12487 12739 -2.6 0.2
Europe 244918 251338 0.2 0.3
EU (27) 240586 248345 0.3 0.3
UK 116931 115304 -1.3 -0.1
Germany 17931 20203 -1.2 1.2
Poland 35985 42175 1.8 1.6
Netherlands 17124 18180 2.4 0.6
France 7199 7952 -1.6 1.0
Other EU 35178 35178 6.9 0.0
Other Europe 3023 2993 -4.3 -0.1
CIS 253578 284209
Russian Federation 158200 161393 0.2 0.2
Other Former USSR 95378 122816 4.7 2.3
Japan 17620 20248 1.8 1.4
Oceania 15315 15469 -0.7 0.1