interest rates - university of california,...
TRANSCRIPT

Interest Rates
Understanding the roles of: Inflation (expected) Risk Liquidity Taxes Maturity
The Fisher Relationship
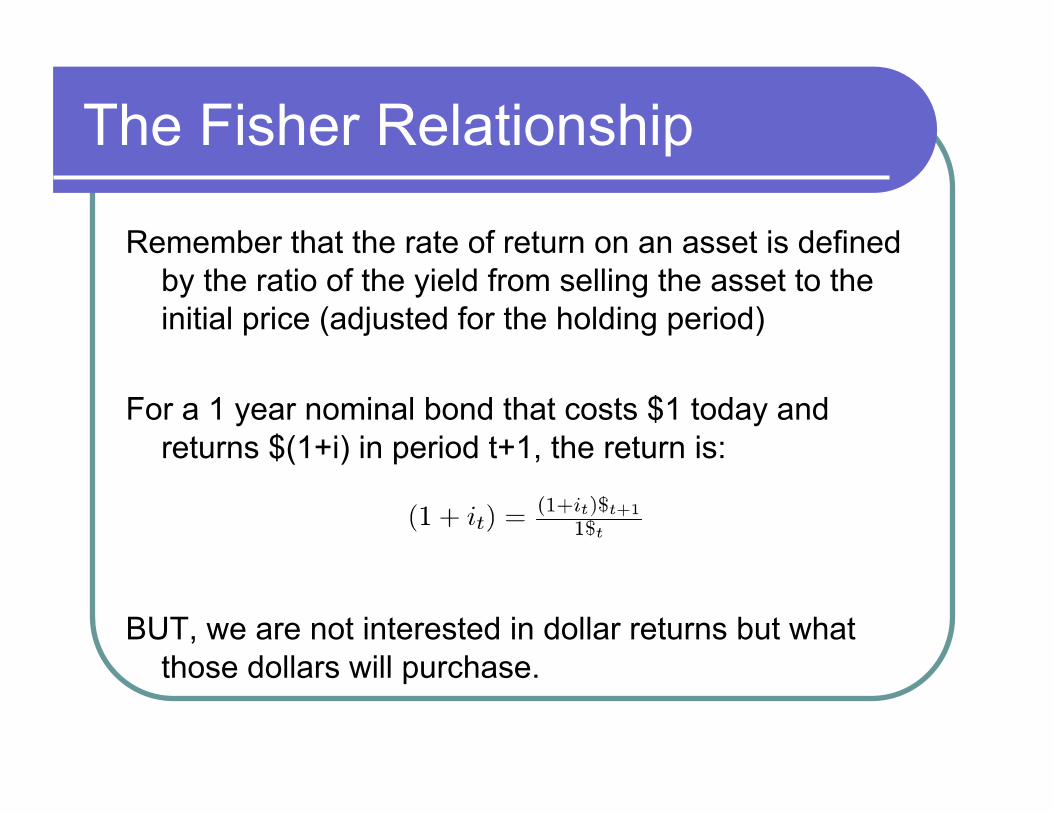
Remember that the rate of return on an asset is defined by the ratio of the yield from selling the asset to the initial price (adjusted for the holding period)
For a 1 year nominal bond that costs $1 today and returns $(1+i) in period t+1, the return is:
BUT, we are not interested in dollar returns but what those dollars will purchase.

The Fisher Relationship
The purchasing power return is the real return: calculated in terms of output.
So: what is the real return from purchasing our nominal bond? Suppose only one good in the world, apples
First, we need to determine the real price of the nominal bond? How? Divide by the price level =

The Fisher Relationship
Or, defining the inflation rate by the ratio of price levels:
Taking logs and using expected inflation rather than actual we have the Fisher relationship:

The Fisher Relationship
Note that what matters for lending and borrowing is the expected real return..measured by the real interest rate.
This is often referred to as the ex-ante real interest rate.
When actual or realized inflation is used, this is called the ex-post real interest rate:

4-6
Evidence on the Fisher Effect in the United States

5-7
Factors Affecting Risk Structure of Interest Rates
To further examine these features, we will look at three specific risk factors.
Default Risk
Liquidity
Income Tax Considerations
5-8
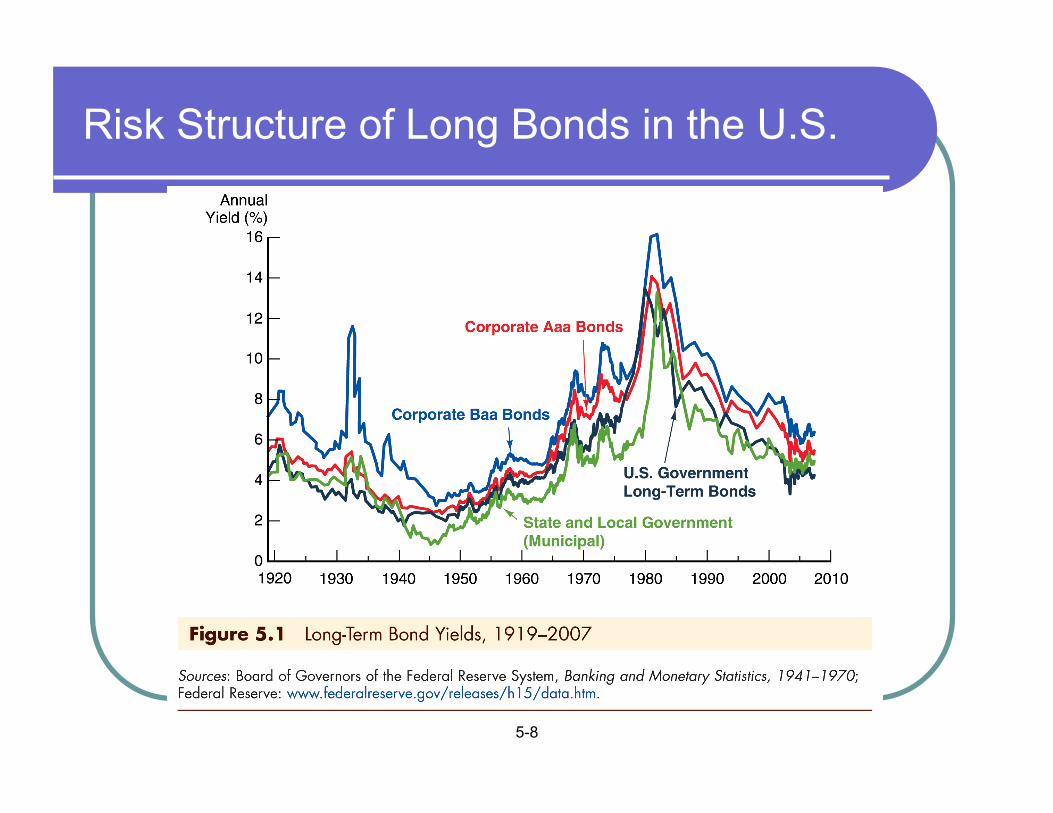
Risk Structure of Long Bonds in the U.S.

5-9
Default Risk Factor One attribute of a bond that influences its
interest rate is its risk of default, which occurs when the issuer of the bond is unable or unwilling to make interest payments when promised.
U.S. Treasury bonds have usually been considered to have no default risk because the federal government can always increase taxes to pay off its obligations (or just print money). Bonds like these with no default risk are called default-free bonds.
5-10
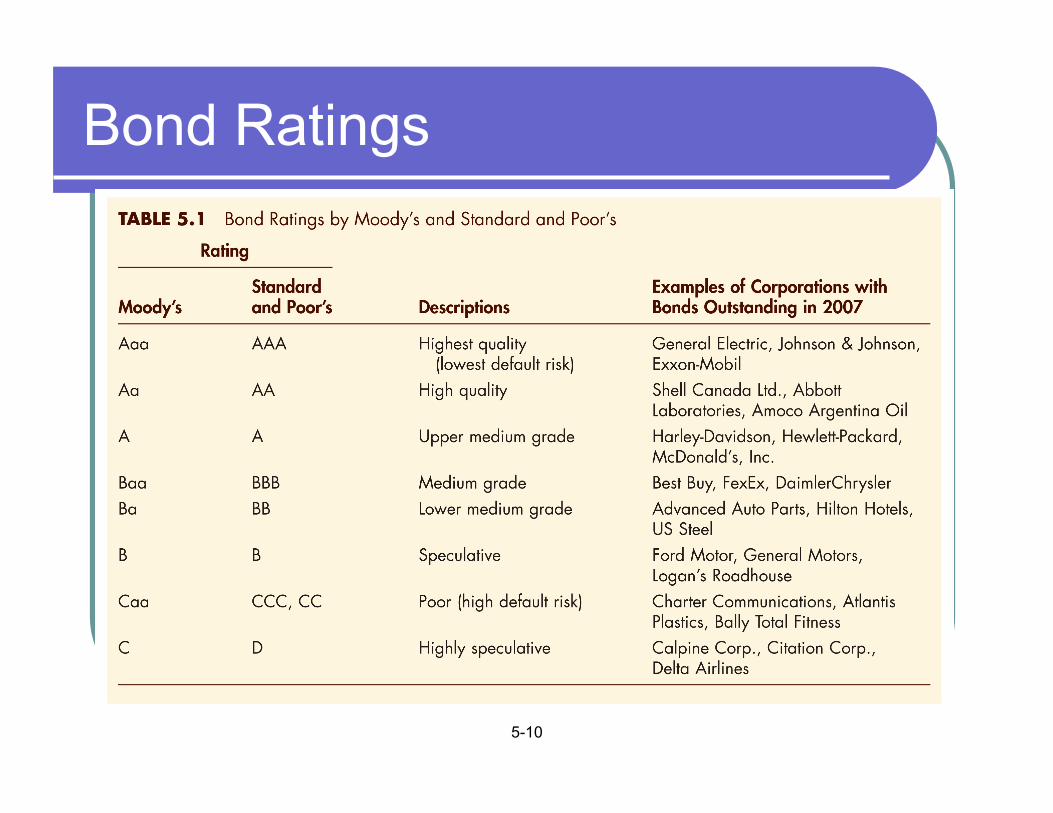
Bond Ratings

5-11
Liquidity Factor
Another attribute of a bond that influences its interest rate is its liquidity; a liquid asset is one that can be quickly and cheaply converted into cash if the need arises. The more liquid an asset is, the more desirable it is (higher demand), holding everything else constant.

5-12
Income Taxes Factor
An odd feature of Figure 1 is that municipal bonds tend to have a lower rate the Treasuries. Why?
Munis certainly can default. Orange County (California) is a recent example from the early 1990s.
Munis are not as liquid a Treasuries.

5-13
Income Taxes Factor
However, interest payments on municipal bonds are exempt from federal income taxes, a factor that has the same effect on the demand for municipal bonds as an increase in their expected return.
Treasury bonds are exempt from state and local income taxes, while interest payments from corporate bonds are fully taxable.
5-14
Income Taxes Factor
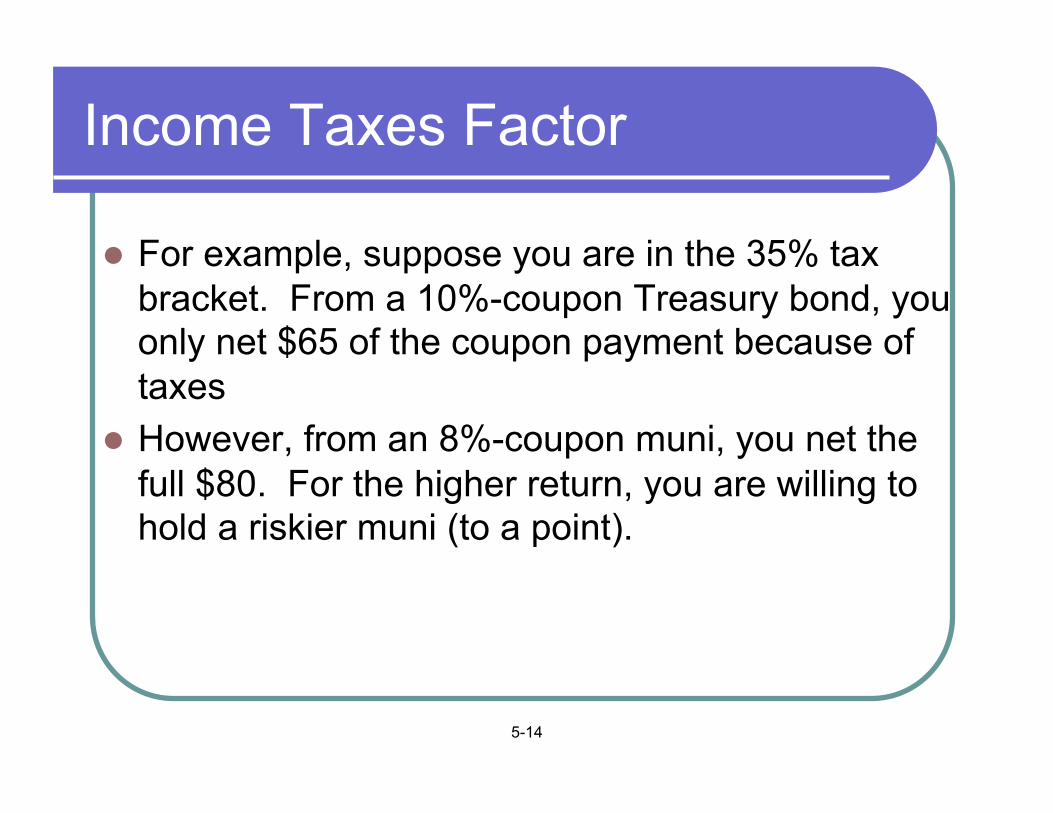
For example, suppose you are in the 35% tax bracket. From a 10%-coupon Treasury bond, you only net $65 of the coupon payment because of taxes
However, from an 8%-coupon muni, you net the full $80. For the higher return, you are willing to hold a riskier muni (to a point).

5-15
Term Structure of Interest Rates
Now that we understand risk, liquidity, and taxes, we turn to another important influence on interest rates – maturity.
Bonds with different maturities tend to have different required rates, all else equal.

The Yield Curve
The Term Structure of interest rates refers to the yield differences that are entirely due to maturity.
A plot of yields versus maturity is referred to as the Yield Curve.
So: Yield Curve and Term Structure are two ways of saying the same thing.

A plot of yields (from Friday, Oct. 2) on Government Securities

Historical plot of Long-Term and Short-Term Rates
Note: Long rates are typically greater than short rates: Yield curve is typically upward sloping.

The critical question: why do bonds with different maturities have different yields?
The most common answer: The Expectations Hypothesis of the Term Structure.
The current yields on bonds with different maturities reflects investors expectations of future interest rates.
Basic intuition: the yields on holding a long term bond until maturity is equal to the expected yield from purchasing a sequence of short bonds.
Consider a simple setting: just one- and two-year bonds. And suppose there is no uncertainty. Then arbitrage requires

Expectations hypothesis, continued
The expectations hypothesis replaces the future rate with its expected value
Take logs and use the approximation
Or
The current long rate is the average of the current and expected short rates!

Expectations hypothesis, continued
This generalizes to an N-period bond:
So the current long rate is influenced by the expected path of short rates.
AND: the current slope of the yield curve forecasts the movements in the short rate.
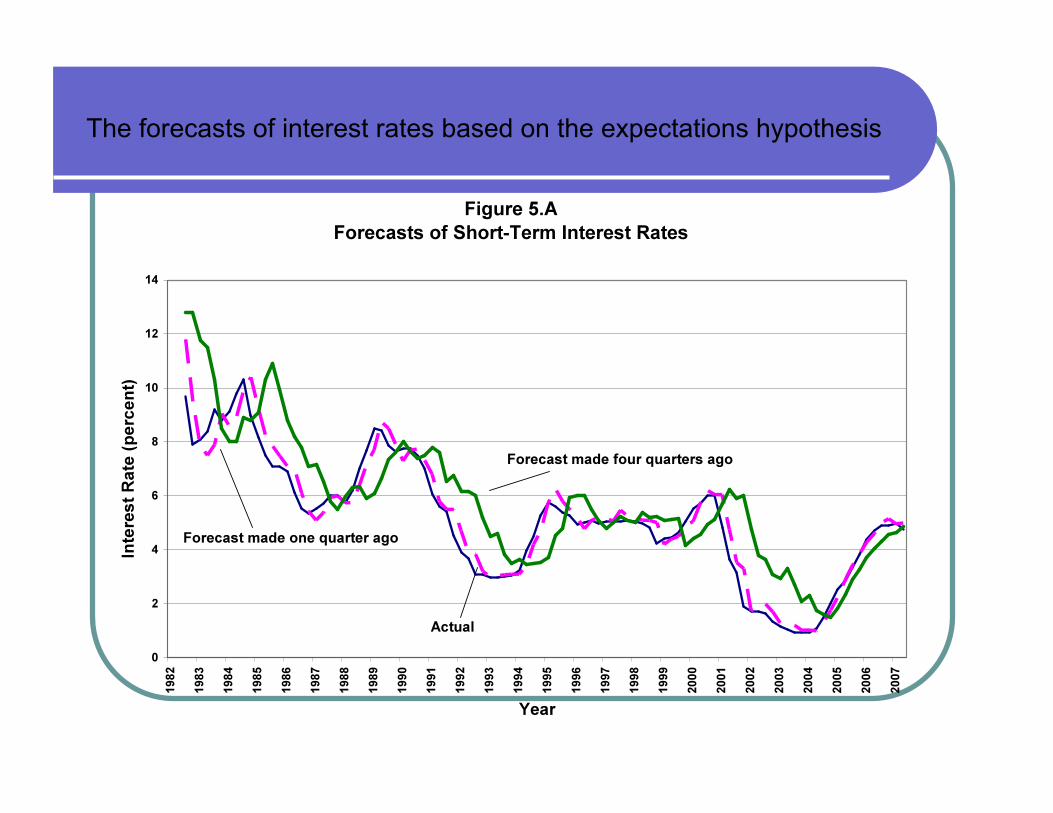
The forecasts of interest rates based on the expectations hypothesis

Comparing the accuracy of the forecasts – short and long term

A brief aside: Expectations Hypothesis belongs to a large class of models. Expectations Based theories of asset pricing
What determines the price of stock (i.e. equity)? In a world of certainty, it would be the present discounted value of dividends:
With uncertainty in dividends, replace with expected value:

A brief aside: Expectations Hypothesis belongs to a large class of models. Expectations Based theories of asset pricing
What explains the difference in interest rates between two countries? The expected change in the exchange rate:
Let denote the price of foreign currency in term of domestic currency. Example Euros – then the exchange rate is:
Note: an increase in the exchange rate is a devaluation in the home currency

A brief aside: Expectations Hypothesis belongs to a large class of models. Expectations Based theories of asset pricing
Consider two strategies: buy a dollar denominated bond or use the dollar to buy euros, then buy a euro denominated bond, then use the proceeds to buy dollars at time t+1. If no uncertainty, then we must have:
Or:

A brief aside: Expectations Hypothesis belongs to a large class of models. Expectations Based theories of asset pricing
With uncertainty, replace future exchange rate with its expected value (this is uncovered interest rate parity):
If the one-year interest rate in the US is 10% greater than in Euroland, then this implies that the dollar is expected to devalue by 10% over the next year.
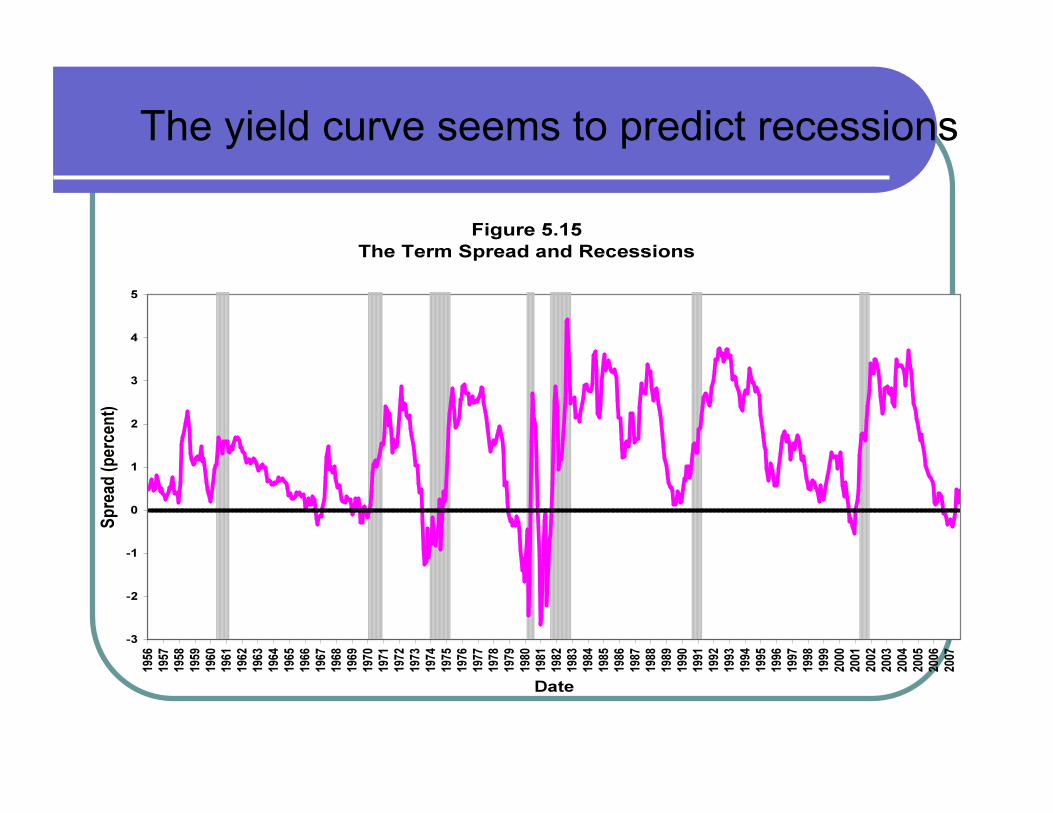
The yield curve seems to predict recessions