pablo a. peña october 2013 - university of california,...
TRANSCRIPT

1
SURNAME FREQUENCY AND LIFESPAN
Pablo A. Peña
October 2013
Abstract
Using administrative records from the Social Security Administration
this article explores the relationship between surname frequency and
lifespan for over 19 million people born in 1910-19 and deceased by
2011—which represent over 80% of the total population born in 1910-
19. People with more frequent surnames had shorter average and me-
dian lifespans. Differences in average lifespan between the top and
bottom 5% of the distribution of people according to surname frequen-
cy amount to 484 days (1.33 years). Differences in median lifespan
amount to 611 days (1.67 years). This empirical finding can be ex-
plained by human capital theory, connecting well-known stylized facts
on fertility, human capital and intergenerational transmission.
JEL codes: I14, I31, J1, N3, O1.
Keywords: surname, last name, human capital, fertility, lifespan, lon-
gevity, Zip’s Law.
2
I. Introduction
The comedy film “Idiocracy” (2006) depicts a cartoonish version of the future in which
the world is populated entirely by people with low IQ. The premise of the plot is that
smart couples in the present do not reproduce as much as not-so-smart couples, eventual-
ly causing the extinction of smart people. In a more serious tone, evolutionary psycholo-
gist Satoshi Kanazawa makes a similar point in the book The Intelligence Paradox, stat-
ing that when it comes to reproductive success “intelligent people are the ultimate losers
in life.” Though disputable, the argument raises questions about the role of fertility dif-
ferentials across human capital levels in the long run.
Income inequality is a public-policy concern, and is at least partially due to human
capital disparities (see Heckman and Krueger 2003). Effective public policies targeting
income inequality require an understanding of the determinants of the distribution of hu-
man capital in a society, and fertility differentials are one of them. If human capital is
transmitted from parents to children, and people with lower human capital reproduce
faster, then societies could have a tendency to become more unequal.
There is evidence of a negative relationship between fertility and some proxies for
human capital. On average, people with more years of schooling or higher IQ have fewer
children (Castro Martin 1995, Vining 1982 and 1995). At the same time, there is evi-
dence of intergenerational transmission of a number of traits and behaviors. Many studies
have documented a positive parent-children correlation for variables ranging from years
of schooling and health status to risk aversion and marital instability (Solon 1999, Black
and Deveraux 2012). Finally, surnames—typically passed from parents to children—
provide an indicator of a person’s ancestry (Lasker 1985, King and Jobling 2009). Data
for different countries show that surnames have skewed distributions. Surnames approx-
imately follow Zipf’s law, i.e. the number of people sharing a surname is inversely pro-
portional to the surname’s frequency rank (Mizayima et al. 2000 present data for Japan,
Kim and Park 2005 for Korea, and Zanette and Manrubia 2001 for the US and Germany).
Brought together, the stylized facts above provide a hypothesis on how fertility differen-
tials could affect the distribution of human capital. Moreover, the hypothesis can be test-
ed using cross-sectional data on surname frequency and a measure of human capital such
as lifespan.
In a society where (i) surnames are passed from parents to children, (ii) there is some
degree of intergenerational transmission of traits and behaviors, including those that de-
termine human capital and fertility, and (iii) human capital and fertility are negatively
related, the surnames borne by those with lower human capital become relatively more
frequent. An expected consequence, which is the hypothesis tested here, is that human
capital eventually would not be independent of surname frequency: greater frequency
would be associated with lower average human capital.
This article uses administrative records from the Social Security Administration for
over 19 million people born in 1910-19 and deceased by 2011, and tests whether there is
any relationship between surname frequency and lifespan—a measure of human capital.
Although it is not the first study relating names and economic outcomes, it does contrib-
ute previously unknown results.

3
II. The study of names
Names constitute a fascinating tool to study behavior. They have been used in different
disciplines and in a variety of ways. Studies on names can be divided into five broad
groups. In the first group, names are indicators of genetic or socioeconomic background.
For instance, Garza, Rojas, and Cerda (2000) study the prevalence of diabetes by sur-
name origin (paraphyletic versus polyphyletic) as a proxy of ethnic origin in Mexico. In
economics, given names and surnames have been used as signals of ethnic background in
field experiments to measure discrimination. In those experiments fake résumés with
identical descriptions except for the name are submitted to real job openings, and then
response rates are compared. Perhaps the best known study is Bertrand and Mullainathan
(2004), who use African-American-sounding names (e.g. Lakisha and Jamal) versus
white-sounding names (e.g. Emily and Gregg) in the US. Similar experiments have been
carried out in other countries.1
The second group of studies focuses on the effect of names on behavior by shaping
the bearer’s preferences. Several articles in the psychological and marketing literatures
study the affinity of people for things whose names resemble theirs. Nuttin (1985) shows
in an experimental setting that letters belonging to one’s own first or last name are pre-
ferred to others. Brendl, Chattopadhyay, Pelham and Carvallo (2004) show experimental
evidence on how people are more likely to choose a brand when the brand name starts
with letters from their names. Jones, Pelham, Carvallo and Mirenberg (2004) show evi-
dence of people disproportionately marrying others whose first or last name resembles
their own. Nelson and Simmons (2007) find that baseball players whose names begin
with K (the symbol for strikeout) strike out more, students whose names begin with C or
D achieve lower GPAs and attend lower-ranked law schools than do students whose
names begin with A or B.
The third group of studies focuses on how names affect behavior by creating differ-
ent experiences for the bearer. Different names result in different initials, and those ini-
tials could result in different social interactions. People with initials that spell something
positive like A.C.E. or V.I.P. might have better experiences than people with initials
spelling something negative, like P.I.G. or D.I.E. Christenlfeld, Phillips and Glynn (1999)
present evidence of males with “positive” initials living longer than males with “nega-
tive” initials.2 Ordering according to surnames is another way in which names affect what
people experience. Classroom rosters are ordered alphabetically by surname. Students
with surnames close to the end of the alphabet might have a different experience than
those with surnames at the beginning. Weston (1965) studied the relationship between
alphabetical order of the last name and longevity for the UK and found that those with
names starting with A-R live longer than those with names starting with S-Z, and he theo-
1 Carlsson and Rooth (2007) and Rooth (2010) use Middle-Eastern/Arab-Muslim and Swedish names
in Sweden. Booth, Leigh and Varganova (2012) use Anglo-saxon, Indigenous, Italian, Chinese and Middle-
Eastern names in Australia. In a similar fashion, Ahmed and Hammarstedt (2008) use Internet applications
for apartments for rent and Arabic/Muslim versus Swedish names in Sweden. 2 Abel and Kruger (2007) did a similar analysis of “positive” versus “negative” initials baseball play-
ers that was later discredited by Smith (2011).
4
rized about an “alphabetical neurosis.” Shupe (1968) did a similar study for the US and
found no significant differences, although with a small sample size. Carlson and Conard
(2011) find that the later in the alphabet the first letter of one’s childhood surname is, the
faster the person acquires items as an adult. Alphabetical ordering also takes place among
coauthors of academic articles in economics. Einav and Yariv (2006) argue that perhaps
such ordering favors individuals with some surnames, and find evidence on economists in
academia being more successful the closer their surname initial is to the beginning of the
alphabet.
In the fourth group are studies that use uncommon surnames as identifiers of popula-
tion subgroups in order to measure intergenerational mobility. In those studies the socio-
economic status of people with uncommon names is tracked across long periods to de-
termine if they have moved and at what rate. Among the countries studied this way are:
England (Clark and Cummins 2012), Sweden, the US (Clark et al. 2012), India (Clark
and Landes 2012), China (Hao and Clark 2012) and Japan (Clark and Ishii 2012).
The fifth group of studies focuses on the cross-sectional relationship between how
common a surname is and the bearers’ attributes. Collado, Ortuño-Ortín, and Romeu
(2008) study data from the Yellow Pages in Spain and find that people bearing uncom-
mon surnames tend to have a higher socioeconomic status, measured by the fraction that
have certain occupations (doctors, lawyers, pharmacists, and university professors). They
also study historical evidence from the 1890 census of Spain and find that surname fre-
quency is negatively related to literacy. Peña (2013) presents evidence for Mexico of a
negative relationship between surname frequency and different measures of human capi-
tal: individuals with more frequent surnames do worse in standardized tests in elementary
school, have lower high school GPA, attain less postsecondary education, and self-report
a worse general-health status.
The present study belongs to the last group. It analyzes the relationship between sur-
name frequency and lifespan in the US. To the best of my knowledge, it is the first study
that analyzes surname frequency and any measure of human capital for the US. At the
same time, it is the first study in the world of the relationship between surname frequency
and lifespan.
III. Social Security Data
With the purpose of preventing fraud, the Social Security Administration publishes the
Social Security Numbers (SSN) belonging to deceased individuals in what is called the
Death Master File (DMF). Besides the SSN, the file only includes last name, given name,
date of birth, and date of death of the person. The file is updated periodically, and by No-
vember 2011, which is the version used here, it contained over 86 million records.3
SSN were issued the first time in November 1936, and by the following year over 37
million SSN were issued. Originally, only employees were issued SSN but several groups
were excluded: agricultural workers, domestic servants, casual labor, maritime workers,
3 The Death Master File is distributed by the Social Security Administration at a charge, but was made
available to the author by courtesy of SSDMF.INFO.

5
government employees, the employees of philanthropic, educational, and similar institu-
tions, and the self-employed. It is estimated that at the time the excluded groups com-
prised about 40 percent of the working population (Puckett 2009).
Coverage was later expanded and the use of SSN grew. In 1957 military personnel
were covered under Social Security and were enumerated in mass. In 1962 the Internal
Revenue Service began using the SSN for federal tax reporting. In 1965 Medicare en-
rollment required enumerating those aged 65 or older. In 1970 legislation required finan-
cial intermediaries to obtain the SSNs of all their customers. In the late 1980s people
started to be enumerated at birth, in part because the SSN became a requirement to be
claimed as dependent for tax purposes.
In sum, not everyone had a SSN when they were first issued, and as time went by the
coverage of SSN became almost universal. In other words, most people in cohorts born
recently have an SSN, but that is not the case among older cohorts. Thus, there is a trade-
off in using SSN: in order to have a more representative analysis we would like to focus
in more recent cohorts (because a larger fraction is likely to have SSN), but among more
recent cohorts the fraction still alive by 2011 (and therefore not in the Death Master File)
is larger.
Figure 1 shows an estimate of the fraction of each decade-of-birth cohort covered by
the Death Master File. The size of the cohort was estimated using the US Censuses 1920-
2010 and computing the maximum population on record. There are different population
totals for each cohort depending on the Census year used. The maximum was taken as the
size. To estimate the fraction covered by the Death Master File, the number of SSN of
individuals was divided by the total size of the cohort according to Census data. The bell
shape illustrates the trade-off between using older and younger cohorts. A larger fraction
of the older cohorts is likely to be dead by 2011 but a smaller fraction is likely to have
had a SSN. In the case of younger cohorts, a larger fraction is likely to have a SSN but a
smaller fraction is likely to be dead. The largest estimated coverage is 82% for the 1910-
19 cohort. That cohort is also the most numerous in the Death Master File, with over 19
million people. For the purpose of my analysis I focus on that cohort.
Considering the 1910-19 cohort alone, the Death Master File contains 19,228,801
records and 849,524 unique surnames. Some surnames are invalid because they include
digits or invalid signs such as asterisks or commas. After the elimination of those invalid
names we are left with 19,228,641 records with 849,366 unique surnames.
Some surnames include suffixes (JR, SR, II, III or IV) and others have slightly differ-
ent yet equivalent spellings (e.g. ONEILL, O NEILL and O-NEILL). When suffixes and spac-
es or hyphens are eliminated without affecting the surname, we are left with 837,782
unique surnames.4
In the resulting data set, 47,563 records and 21,540 unique surnames contain spaces.
Some of those spaces indicate that surnames include prepositions such as DE, DELLA or
VAN. Some others seem to be compositions of two surnames, which in principle could
create artificially uncommon surnames. Surnames with spaces that start with common
4 Spaces and hyphens were eliminated from surnames starting with “MC ”, “MC-”, “MAC ”, “MAC-
”, “O ” or “O-”.

6
prepositions or prefixes and therefore do not seem problematic account for 28,229 rec-
ords and 6,853 unique surnames.5 Thus 19,334 records and 14,687 unique surnames are
potentially problematic. However, they represent a small fraction of the records (0.1%)
and surnames (1.8%) in the sample of analysis.
Once invalid surnames have been eliminated and some other surnames have been
uniformed, we can compute surnames frequencies. Figure 2 shows the frequency of every
surname in the cohort born in 1910-19. The vertical axis shows the number of people that
share the surname and the horizontal axis shows the ranking of the surname according to
frequency, both in logarithmic scale. The location of a few surnames is indicated in the
graph: the top ten most frequent and those that rank 100th
, 1,000th
, 10,000th
and 100,000th
in frequency. The close-to-linear pattern is the so-called Zipf’s Law: the number of peo-
ple sharing a surname is inversely proportional to the surname’s frequency rank.
In order to compute lifespan the exact birth and death dates are necessary. Out of the
records with valid names, 269 had invalid dates of death (they predated the issuance of
the SSN) and were eliminated. A large fraction of the remaining records did not report
the dates with precision. In 8,249 records the day in the birth date was omitted, in
7,292,116 records the day in the death date was omitted, and 7,295,459 records had one
omission or the other.6 Thus, 38% of the records do not specify the day of birth or death,
although the month and year are specified.
The omission of specific days in the date of death displays a clear pattern. For the
6,156,545 deaths that occurred before 1987, 98% do not specify the day. For the
6,018,804 deaths occurring between 1998 and 2011, virtually all specify the date (only
250 deaths do not). In the period 1987-1998, when 7,053,011 deaths occurred, the frac-
tion not specifying the day was 18%. Figure 3 shows the fraction of deaths that occurred
by year without specifying the day of the month. The sudden change in the pattern seems
associated with an exogenous policy change and is probably unrelated to the people dy-
ing every year.
In order to compute the lifespan in days for the sample, the median day of the month
was imputed to the dates that lacked the day. If the month of the date without a day was
February, the day imputed was 14. For any other month the day imputed was 15. Figure 4
shows the distribution of the lifespan in days for the entire sample. The average lifespan
is 28,096 days, which is equivalent to 76.9 years. The median is 28,638 days, or 78.4
years. The standard deviation is 4,085 days, or 11.2 years. Figure 4 also shows the distri-
butions for the records with and without days specified. As expected, given the pattern in
Figure 3, those that died earlier are more likely to not have the day specified.
IV. Hypothesis and Empirical Strategy
In its simplest form, the hypothesis to test is that surname frequency and lifespan are not
independent but negatively related. First, the hypothesis relies on a negative correlation
between fertility and human capital. However, it does not make a difference if there is
5 The prepositions and prefixes considered are ST, VAN, DE, LA, DI, DU, DEL, DELLA, and VON.
6 Days appear as 00.

7
causality in one direction, the other, or in both directions, or if the correlation results from
a third variable causing both and human capital—e.g. ability or schooling opportunities.
Second, the hypothesis also requires that parents “pass” to their children—at least to
some degree—whatever determines their human capital and fertility, so that the differ-
ences in human capital and fertility observed across families within one generation do not
disappear in the next. However, it does not rely on any specific intergenerational trans-
mission mechanism. It is inconsequential if the observed positive parent-children correla-
tions are the result of genetics, parental investments, institutional arrangements, or other
factors.7
If people with greater human capital on average have fewer children, and their chil-
dren resemble them—to some extent—in terms of their human capital and fertility, then
families with lower human capital grow faster. The descendants of those families would
eventually become more numerous than the descendants of high human capital, low fer-
tility families. Their surnames would become more popular too. As a consequence, ceter-
is paribus surname popularity would be negatively related to average human capital.
The empirical strategy to test the hypothesis consists of computing the frequency of
every surname and calculating the lifespan in days for every person in the sample (sub-
tracting birth and death dates), and then comparing the lifespans for different levels of
surname frequency. In order to make comparisons whose results are not driven by the
choice of the functional form (e.g. linear, exponential, logarithmic, or polynomial) or by
observations at the tails, I use quantiles of observations according to frequency and com-
pare mean and median lifespan across quantiles. For simplicity I computed 20 quantiles,
which leave close to one million observations in each quantile.
The hypothesis to be tested is not conditional on any attributes of the person. Thus,
there is no need for “controls.” It should be clear that controls could attenuate the rela-
tionship between surname frequency and lifespan if such controls are proxies or are cor-
related with proxies for human capital. That should not be seen as a caveat. It would im-
ply that surname frequency is also correlated to those proxies.8
There are several reasons why we anticipate an attenuation bias caused by measure-
ment error. First, for many women we see their married surname and not their maiden
surname—and gender is not reported. If sorting in terms of surname frequency is imper-
fect in the marriage market (which is most likely the case), surname frequency for those
women would be measured with error. Second, misspelling causes frequency to be meas-
ured with error. What originally was the same surname derives into several surnames,
making artificially uncommon some variations of the same surname. Third, it is unclear
whether frequency should be measured in subsets of the country rather than nationally. It
is possible that the ranking of surnames differs across states or regions (e.g. the most
popular names in Alaska, Hawaii or California do not coincide with the most popular
surnames in Massachusetts). Clear patterns between surname frequency and lifespan
within each region could be attenuated when considering national comparisons. The
7 See Becker and Tomes (1986) for a model that incorporates several of those elements.
8 If the data contained information on earnings, instead of using them as a control, I would use them
as another variable of analysis, comparing earnings across levels of surname frequency.
8
reader should bear in mind that the measured relationship between lifespan and surname
frequency is most likely downward bias.
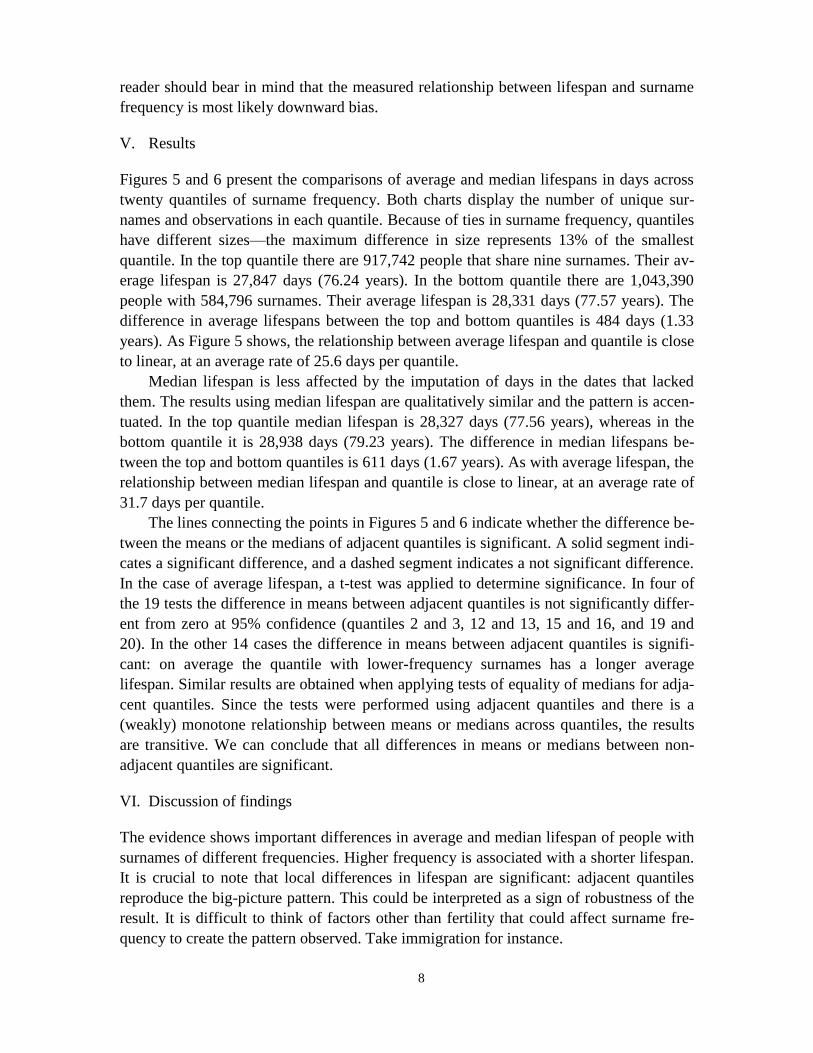
V. Results
Figures 5 and 6 present the comparisons of average and median lifespans in days across
twenty quantiles of surname frequency. Both charts display the number of unique sur-
names and observations in each quantile. Because of ties in surname frequency, quantiles
have different sizes—the maximum difference in size represents 13% of the smallest
quantile. In the top quantile there are 917,742 people that share nine surnames. Their av-
erage lifespan is 27,847 days (76.24 years). In the bottom quantile there are 1,043,390
people with 584,796 surnames. Their average lifespan is 28,331 days (77.57 years). The
difference in average lifespans between the top and bottom quantiles is 484 days (1.33
years). As Figure 5 shows, the relationship between average lifespan and quantile is close
to linear, at an average rate of 25.6 days per quantile.
Median lifespan is less affected by the imputation of days in the dates that lacked
them. The results using median lifespan are qualitatively similar and the pattern is accen-
tuated. In the top quantile median lifespan is 28,327 days (77.56 years), whereas in the
bottom quantile it is 28,938 days (79.23 years). The difference in median lifespans be-
tween the top and bottom quantiles is 611 days (1.67 years). As with average lifespan, the
relationship between median lifespan and quantile is close to linear, at an average rate of
31.7 days per quantile.
The lines connecting the points in Figures 5 and 6 indicate whether the difference be-
tween the means or the medians of adjacent quantiles is significant. A solid segment indi-
cates a significant difference, and a dashed segment indicates a not significant difference.
In the case of average lifespan, a t-test was applied to determine significance. In four of
the 19 tests the difference in means between adjacent quantiles is not significantly differ-
ent from zero at 95% confidence (quantiles 2 and 3, 12 and 13, 15 and 16, and 19 and
20). In the other 14 cases the difference in means between adjacent quantiles is signifi-
cant: on average the quantile with lower-frequency surnames has a longer average
lifespan. Similar results are obtained when applying tests of equality of medians for adja-
cent quantiles. Since the tests were performed using adjacent quantiles and there is a
(weakly) monotone relationship between means or medians across quantiles, the results
are transitive. We can conclude that all differences in means or medians between non-
adjacent quantiles are significant.
VI. Discussion of findings
The evidence shows important differences in average and median lifespan of people with
surnames of different frequencies. Higher frequency is associated with a shorter lifespan.
It is crucial to note that local differences in lifespan are significant: adjacent quantiles
reproduce the big-picture pattern. This could be interpreted as a sign of robustness of the
result. It is difficult to think of factors other than fertility that could affect surname fre-
quency to create the pattern observed. Take immigration for instance.

9
In order to create a story of immigration that fits the pattern, one needs an ad hoc
combination of human capital and surname frequency among immigrants. Highly educat-
ed immigrants with uncommon surnames alone are not enough. They could explain the
pattern at the lower tail but not what happens across all levels of frequency. A mass of
unskilled immigrants sharing a handful of surnames could explain the upper tail. To ex-
plain the whole picture the surnames and the human capital of immigrants would have to
exhibit the same pattern we are starting with—which becomes a circular argument.
The degree to which the connection between surname frequency and lifespan is
causal remains an open question. It is possible that families with greater human capital
and lower fertility make greater investments in the schooling of their offspring, causing
them to live longer (see Lleras-Muney 2005). Given that surnames are genetic markers
(see King and Jobling 2009), it is also entirely possible that the pattern is mostly due to
differences in genes.
The findings for lifespan and surname frequency in the US are consistent with previ-
ous findings for Spain and Mexico using other proxies for human capital. Although hu-
man capital theory offers an explanation, the exact mechanism through which such pat-
terns arise is an open question. The analysis presented here and those for Spain and Mex-
ico are cross-sectional. Although illuminating in some ways, they do not paint a dynamic
picture. In order to make more robust inferences on the underlying relationship between
fertility and the distribution of human capital the next step should be to analyze how sur-
name frequency evolves.
References
Abel, Ernest L., and Michael L. Kruger, 2007, “Symbolic significance of initials on lon-
gevity,” Perceptual and Motor Skills, vol. 104, no. 1, pp. 179-182.
Ahmed, Ali M. and Mats Hammarstedt, 2008, “Discrimination in the rental housing mar-
ket: A field experiment on the Internet,” Journal of Urban Economics, vol. 64, pp.
362-372.
Baek, Seung Ki, Sebastian Bernhardsson, and Petter Minnhagen, 2011, “Zipf's law un-
zipped”, New Journal of Physics, Volume 13, Issue 4, id. 043004.
Becker, Gary S., Kevin M. Murphy, and Robert Tamura, 1990, “Human Capital, Fertility,
and Economic Growth”, Journal of Political Economy, vol. 98, no. 3, pp. S12-S37.
Becker, Gary S. and Nigel Tomes, 1986, “Human Capital and the Rise and Fall of Fami-
lies,” Journal of Labor Economics 4, S1–S39.
Bertrand, Marianne, and Sendhil Mullainathan, 2004, “Are Emily and Greg More Em-
ployable Than Lakisha and Jamal? A Field Experiment on Labor Market Discrimi-
nation,” American Economic Review, vol. 94, no. 4, pp. 991-1013.
Black, Sandra E. and Paul J. Devereux, 2011, “Recent Developments in Intergenerational
Mobility”, in Orley C. Ashenfelter and David Card (Eds.), Handbook of Labor Eco-
nomics, Vol. 4B, (Amsterdam: Elsevier North Holland).
Booth, Alison, Andrew Leigh, and Eelena Varganova, 2011, “Does Ethnic Discrimina-
tion Vary Across Minority Groups? Evidence from a Field Experiment,” Oxford Bul-
letin of Economics and Statistics, vol. 74, no. 4, pp. 547-573.

10
Brendl, C. Miguel, Amitava Chattopadhyay, Brett W. Pelham, and Mauricio Carvallo,
2005, “Name Letter Branding: Valence Transfers When Product-Specific Needs Are
Active,” Journal of Consumer Research, vol. 32, pp. 405–15.
Carlsson, Magnus, and Dan-Olof Rooth, 2007, “Evidence of ethnic discrimination in the
Swedish labor market using experimental data,” Labour Economics, vol. 14, no. 4,
pp. 716-729.
Carson, Kurt A., and Jacqueline M. Conard, 2011, “The Last Name Effect: How Last
name Influences Acquisition Timing,” Journal of Consumer Research, vol. 38, no. 2,
pp. 300-307.
Castro Martin, Teresa, 1995, “Women's Education and Fertility: Results from 26 Demo-
graphic and Health Surveys”, Studies in Family Planning, Vol. 26, No. 4, pp. 187-
202.
Chang, Virginia W., and Diane S. Lauderdale, 2005, “Income Disparities in Body Mass
Index and Obesity in the United States, 1971-2002”, Archives of Internal Medicine,
vol. 165, no. 18, pp. 2122-2128.
Christenfeld, Nicholas, David P. Phillips, and Laura M. Glynn, 1999, “What’s in a name:
mortality and the power of symbols,” Journal of Psychosomatic Research, vol. 47
no. 3, pp. 241-254.
Clark, Gregory, 2012, “What is the True Rate of Social Mobility in Sweden? A Surname
Analysis, 1700-2012,” manuscript.
Clark, Gregory, and Neil Cummins, 2012, “What is the True Rate of Social Mobility?
Surname and Social Mobility in England, 1800-2012,” manuscript.
Clark, Gregory, and Tatsuya Ishii, 2012, “Social Mobility in Japan, 1868-2012: The Sur-
prising Persistence of the Samurai,” manuscript.
Clark, Gregory, and Zach Landes, 2012, “Caste versus Class: Social Mobility in India,
1860-2012,” manuscript.
Clark, Gregory, Daniel Marcin, Firas Abu-Sneneh, Wilfred M. Chow, Kuk Mo Jung,
Ariel M. Marek, and Kevin M. Williams, 2012, “Social Mobility Rates in the USA,
1920-2010: A Surname Analysis,” manuscript.
Collado, M. Dolores, Ignacio Ortuño Ortín, and Anrés Romeu, 2008, “Surnames and so-
cial status in Spain,” Investigaciones Económicas, vol. 32, no. 3, pp. 259-287.
Einav, Liran, and Leeat Yariv, 2006, “What’s in a Surname? The Effects of Surname
Initials on Academic Success,” Journal of Economic Perspectives, vol. 20, no. 1,
pp. 175-188.
Garza-Chapa, Raúl, María de los Angeles Rojas-Alvarado, and Ricardo M. Cerda-Flores,
2000, “Prevalence of NIDDM in Mexicans with paraphyletic and polyphyletic sur-
names”, American Journal of Human Biology, vol. 12, no. 6, pp. 721-728.
Hao, Yu, and Gregory Clark, 2012, “Social Mobility in China, 1645-2012: A Surname
Study,” manuscript.
Heckman, James J., and Alan B. Krueger, 2003, Inequality in America. What Role for
Human Capital Policies?, MIT Press.
Jones, John T., Brett W. Pelham, Maricio Carvallo, and Mathew C. Mirenberg, 2004,
“How Do I Love Thee? Let Me Count the Js: Implicit Egotism and Interpersonal

11
Attraction,” Journal of Personality and Social Psychology, vol. 87, no. 5, pp. 665–
83.
Kim, Beom Jun and Sung Min Park, 2005, “Distribution of Korean family names”, Phys-
ica A: Statistical Mechanics and its Applications, Volume 347, p. 683-694.
King, Turi E. and Mark A. Jobling, 2009, “ What's in a name? Y chromosomes, surnames
and the genetic genealogy revolution,” Trends in Genetics, vol. 25, no. 8, pp. 351-
360.
Lasker, Gabriel W., 1985, Surnames and genetic structure, Cambridge University Press.
Lleras-Muney, Adriana, 2005, “The Relationship between Education and Adult Mortality
in the United States,” Review of Economic Studies, vol. 72, no. 1, pp. 189-221.
Miyazima, Sasuke , Youngki Lee, Tomomasa Nagamine, and Hiroaki Miyajima, 2000,
“Power-law Distribution of Family Names in Japanese Societies”, Physica A: Sta-
tistical Mechanics and its Applications, vol. 278, iss. 1-2, pp. 282-288.
Nelson, Leif D. and Joseph P. Simmons, 2007, “Moniker Maladies: When Names Sabo-
tage Success,” Psychological Science, vol. 18 no. 12, pp. 1106–12.
Nuttin, Jozef M., Jr.,1985, “Narcissism beyond Gestalt and Awareness: The Name Letter
Effect,” European Journal of Social Psychology, vol. 15, no. 3, pp. 353–61.
Peña, Pablo A., 2013, “Surname Frequency and Human Capital,” manuscript.
Reed, William J., and Barry D. Hughes, 2003, “On the Distribution of Family Names”,
Physica A: Statistical Mechanics and its Applications, vol. 319, iss. 1, pp. 579–590.
Rooth, Dan-Olof, 2010, “Automatic associations and discrimination in hiring: real world
evidence,” Labour Economics, vol. 17, pp. 523-534.
Smith, Gary, 2011, “Another look at baseball player initials and longevity,” Perceptual
and Motor Skills, vol. 112, no. 1, pp. 211-216.
Solon, Gary, 1999, “Intergenerational Mobility in the Labor Market,” in Orley C. Ash-
enfelter and David Card (Eds.), Handbook of Labor Economics, Vol. 3A, (Amster-
dam: Elsevier North Holland).
Vining, Daniel R., Jr., 1982, “On the possibility of the reemergence of a dysgenic trend
with respect to intelligence in American fertility differentials”, Intelligence, Volume
6, Issue 3, pp. 241–264.
____, 1995, “On the possibility of the reemergence of a dysgenic trend with respect to
intelligence in American fertility differentials: an update”, Personality and Individ-
ual Differences, Volume 19, Issue 2, pp. 259–263.
Zanette, Damian H., and Susanna C. Manrubia, 2001, “Vertical transmission of culture
and the distribution of family names”, Physica A: Statistical Mechanics and its Ap-
plications, vol. 295, iss. 1-2, pp. 1-8.

12
Figure 1. SSN records: total and as percentage of the population in each cohort
Figure 2. Frequency of surnames

13
Figure 3. Percentage of deaths without a specified day, by year of occurrence
Figure 4. Distribution of lifespan

14
Figure 5. Average lifespan and surname frequency
Figure 6. Median lifespan and surname frequency