intelligent instrumentation - semantic scholar€¦ · intelligent instrumentation alice m. harper...
TRANSCRIPT
Journal of Research of the National Bureau of Standards Volume 90, Number 6, November-December 1985
Intelligent Instrumentation
Alice M. Harper University of Texas at El Paso, El Paso, TX 79968
and Shirley A. Liebman
Aberdeen Proving Grounds, MD 21105,50666
Accepted: July 1, 1985
Feasibility studies on the application of multivariate statistical and mathematical algorithms to chemical problems have proliferated over the past 15 years. In contrast to this. most conunercia11y available computerized analytical instruments have used in the data systems only those algorithms which acquire, display, or massage raw data. These techniques would fall into the "preprocessing stage" of sophisticated data analysis studies. An exception to this is, of course, are the efforts of instrumental manufacturers in the area of spectral library search. Recent firsthand experiences with several groups designing instruments and analytical procedures for which rudimentary statistical techniques were inadequate have focused efforts on the question of multivariate data systems for instrumentation. That a sophisticated and versatile mathematical data system must also be intelligent (not just a number cruncher) is an overriding consideration in our current development. For example, consider a system set up to perform pattern recognition. Either all users need to understand the interaction of data structures with algorithm type and assumptions or the data system must possess such an understanding. It would seem, in such cases, that the algorithm driver should include an expert systems specifically geared to mimic a chemometrician as well as one to aid interpretation in terms of the chemistry of a result. Three areas of modem analysis will be discussed: 1) developments in the area of preprocessing and pattern recognition systems for pyrolysis gas chromatography and pyrolysis mass spectrometry; 2) methods projected for the cross interpretation of several analysis techniques such as several spectroscopies on single samples; and 3) the advantages of having weIl defined chemical problems for expert systems/pattern recognition automation.
Key words: data systems, intelligent; instrumentation; multivariate algorithms, statistical and mathematical; pattern recognition; preprocessing; pyrolysis gas chromatography; pyrolysis mass spectrometry.
Modern computer hardware and ~oftware technologie~ have revolutionized the direction of analytical chemi~try over the past 15 year~. Standard multivariate ~tati~tical tech, nique~ applied to optimization and control of in~trumenta, tion a~ well a~ routine decision making are at the forefront of new instrumental methods such as biomedical 3, dimen~ional ~canner~ and pyrolysi~ MS and GC/MS a~ well a~ more e~tabli~hed mea~urement techniques. De~pite the~e advance~, little attention has been paid to the exploitation of intelligent computerized instrumentation in the de~ign pha~e of chemical research.
Instrumental intelligence i~ the ability of a ~cientific in, strument to perform a ~ingle or ~everal intelligence func,
About the Authors: Alice M. Harper is with the Chern, istry Department at the Univer~ity of Texa~ at El Pa~o. Shirley A .. Liebman i~ with the Ballistics Re~earch Labora, tories at Aberdeen Proving Grounds.
4S3
tion~ in such a way that operation~ normally performed by the ~cienti~t are completely under automated computer con, trol and deci~ion making. Under this definition, intelligent in~truments are quite common. Indeed in recent year~, man, ufacturer~ of ~mall scientific equipment have used the term "intelligent" in conjunction with single purpose items such as recorders to describe the addition of software andlor programmability to the device. Concurrent with this, larger scientific instruments have been marketed with data systems hosting a wide variety of intelligence functions including control and optimization of instrumental variables, optional modes of experimental design, signal averaging, fIltering and integration as well as post analysis data massaging and library search interpretation. Although instruments with the software to perform sophisticated intelligence operations exist, they are not so readily marketed as intelligent instru, ments. For example, modern pulsed Fourier transforms nu, clear magnetic resonance spectrometers (NMR) have micro' computers built into the system, operate over a wide range
of NMR experimental designs, and control instrumental parameters; however, decision making is, for the most part, an operator based function. For this reason, such instruments have limited "intelligence" in comparison to the level of intelligence required to carry an experiment to completion without extensive interaction with the operator. In fact, it could be that more intelligent research instruments might also be less versatile. The limitation is the current state of technology of intelligence programming. The instrument, if used for routine analysis where problem statements can be well defined, could operate with no loss of utility as a totally automated and intelligent instrument.
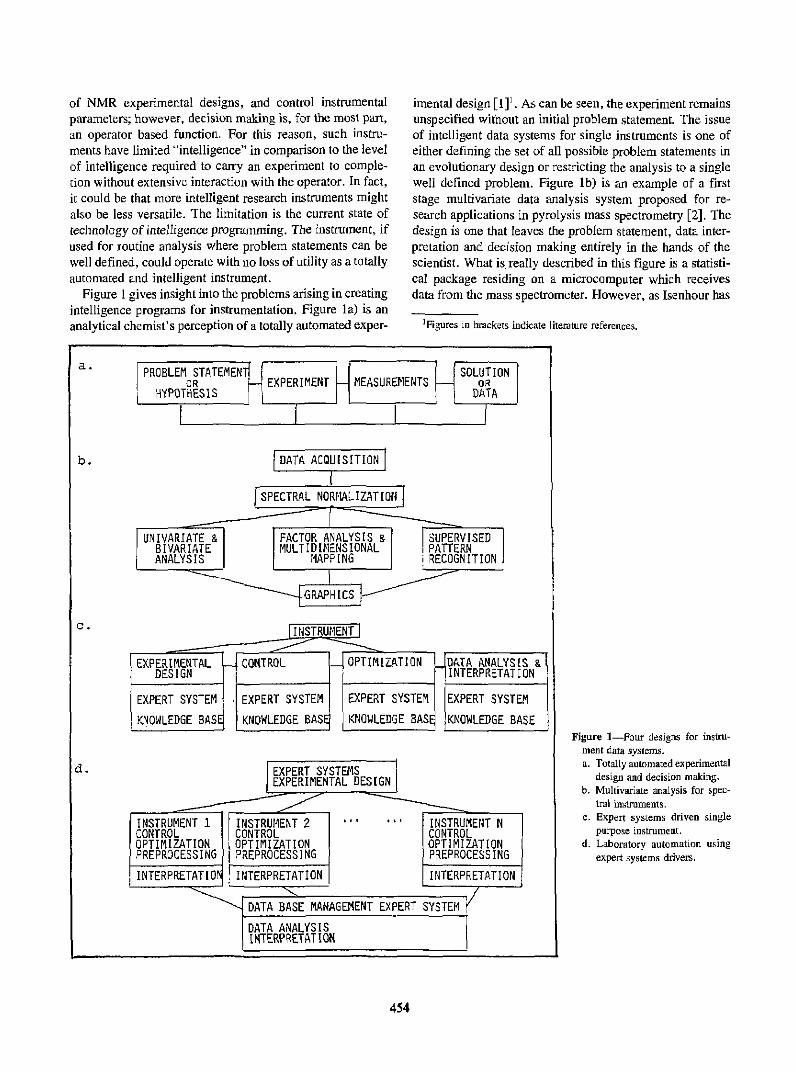
Figure I gives insight into the problems arising in creating intelligence programs for instrumentation. Figure la) is an analytical chemist's perception of a totally automated exper-
a.
imental design [1]1. Af, can be seen, the experiment remains unspecified without an initial problem statement. The issue of intelligent data systems for single instruments is one of either defining the set of all possible problem statements in an evolutionary design or restricting the analysis to a single well defined problem. Figure Ib) is an example of a first stage multivariate data analysis system proposed for research applications in pyrolysis mass spectrometry [2]. The design is one that leaves the problem statement, data interpretation and decision making entirely in the hands of the scientist. What is. really described in this figure is a statistical package residing on a microcomputer which receives data from the mass spectrometer. However, as Isenhour has
I Figures io brackets indkate literature references.
I PROBLEMo~TATEMENl_ EXPERIMENT MEASURE~IENTS SOLUTION
'"'- OR i HYPOTHES I S DATA
I I I
b. DATA ACQUISlTlON I
r SPECTRAL NORl-IALlZATI01i I
UNIVARIATE & FACTOR ANALYSIS & I SUPERVISED I BIVARIATE r1UL TID [lIENS IONAL I PATTERN ANALYSIS MAPPING ; RECOGNlTlON , -. GRAPHICSI~
c. IltiSTRUr'IENT 1
---- ---.... EXPERIMENTAl ~ CONTROL 1- OPWUZATION f- DIlIA ANALYS IS &
DESIGN INTERPRETATION
EXPERT SYSTEM EXPERT SYSTEr1 EXPERT SYSTEM EXPERT SYSTEM
KNOWLEDGE BASE KNOWLEDGE BAS KNOWLEDGE BAS KNOWLEDGE BASE
d. I EXPERT SYSTEMS ~ EXPERIMENTAL DESIGN
/ ---INSTRUMENT 1 1 r INSTRUr-iENT 2 ' " . " II~STRUMErlT N CONTROL CONTROL CONTROL OPTIMIZATION i OPTIMIZATION OPTIMIZATION PREPROCESS I NG I PREPROCESSING PREPROCESSING
I INTERPRETATIO~ 1 : INTERPRETATION INTERPRETATION
~ DATA BASE MANAGEMENT EXPERT SYSTEM~ DATA ANALYSIS -I INTERPRETmON
454
Figure l-fouf designs for instrument data systems. a. Totally automated experimental
design and decisfon making. b. Multivariate analysis for ~pec
tral instruments. c. Expert systems driven single
purpose instrument. d. Laboratory automahon using
expert systems drivers.
demonstrated, multivariate factoring of spectral libraries offers advantages in the interpretation of complex single spectra [3]. It would seem that the incorporation of a multivariate statistics package in the data system is a key element in intelligence programming for many instruments. Figure Ic) incorporates the expert system approach to intelligence for instrumental systems. Under this design, the instrument can accommodate a series of problem statements and decision networks at various analysis stages and uses an intelligent driver for the multivariate analysis and interpretive stages of the analysis. Figure ld) places such a system into the research laboratory controlling a variety of instruments and interpreting results based on one or more analyses.
Although the diagrams of figures lb-ld are not comprehensive designs for total automation, they do provide a hierarchy for linking problem statements and decision making into multivariate research problems. After a brief discussion of components of intelligence designs, an example will be presented of the feasibility of developing expert system data reduction for pyrolysis analysis problems. Problem Statements: Ideally a problem statement is analogous to the standard hypothesis in statistical analysis. Under the hypothesis a knowledge base can be collected and the hypothesis tested. For example, a patient does or does not carry a genetic trait [4]. U nfortunatel y, chemical research problems are often ill-specified and the problem statement may become a hierarchy of data investigations leading to one or more problem statements. For example, I) are there differences in the chemical composition of a series of samples? if differences do occur; 2) what are the nature of the differences?; 3) do the chemical differences correlate with observed changes in physical properties?; and 4) can physical properties be predicted from the chemical differences? [5,6]. Knowledge Base: In order for a instrument to operate as an intelligent system, it must have the knowledge base necessary to arrive at a solution for each of its problem statements. This knowledge base may contain data, rules ("Mass peak 94 is phenol"), programs, and heuristic knowledge.
Consider the knowledge base required for setting up and operating routine analyses of polymer composition by pyrolysis gas chromatography. Possible problem statement areas include optimization of pyrolysis parameters, chromatographic conditions and interface characteristics, control of instrument and data acquisition parameters, data reduction, and data interpretation. The knowledge base must include all information necessary to each of the proposed problem statements. For optimization of parameters, rules governing the detection of an optimum, algorithms (e.g., "simplex" [7]) for efficiently moving toward an optimum, rules for hierachical movements within the algorithm, rules for the detection of poor optimization surface structure, and representative previous optima data might be employed in the decision making. Such optima
455
will be determined, in part, by the polymer degradation characteristics and therefore will not, in this case, be independent of the samples used in the analysis. Instrumental control might employ a knowledge base of rules for the automation of events such as the initiation of sample pyrolysis and data collection. Data reduction for this method will require the rules and data necessary for baseline correction, chromatographic normalization, and peak matching. The knowledge base requires a "memory" of previously collected data to aid peak matching protocols, rules for baseline determinations, transformations for baseline correction, normalization rules and algorithms, and rules for acceptance or rejection of the chromatogram under consideration. Data interpretation on the other hand might require a library of previous chromatograms as well as rules andlor algorithms for interpretation of the current event based on a knowledge of past data with verified interpretations.
Development of the knowledge base is the expensive and time consuming operation in the development instrumental intelligence even when the application is highly specific. It must be remembered that each operation that a human might perform automatically from experience must be programmed into the data system. For this reason, among the attributes of the system, there needs to be evolutionary operation. In other words, in addition to long term knowledge, facts about the current data and new conjectures under consideration must also be easily accommodated.
Expert Systems Driven Multivariate Data Systems: The response of many modern chemical instruments (e.g., spectrometers and chromatographs) is inherently multivariate. For such instruments, data reduction and interpretation often consume a greater portion of analysis time than data collection, and requires scientific expertise. The time delay between data collection and decision making has become an acute problem for newer hyphenated techniques, such as gas chromatography-mass spectrometry and mass spectrometrymass spectrometry, which are capable of collecting thousands of mass spectral peaks in a short period of time.
One possible solution to the problems imposed by large bodies of data is to incorporate into the instrument a data reduction system consisting of multivariate analysis methods. The problem encountered in the actual implementation of such a system is that few experts in instrumental analysis have the expertise for carrying multivariate statistical analyses. It has become increasing apparent that instruments employing versatile multivariate based data systems should be capable of operating in a transparent data analysis mode. In order to accomplish this, the expertise of a chemometrician will need to be programmed into an expert systems driver for the instrument data system. Given a problem statement, and a knowledge base of rules from previous experience, the computer could decide from a variety of possibilities how to reduce the data and represent the results in a meaningful form. A relatively simplistic example of this is the problem
statement "Is there a correlation between two independent variables?" Invisible to the user would be the operations for determining the integrity of the variable distributions. a computation of the correlation and a determination of the significance of the correlation coefficient of the relationship. The result might take a simple form such as "there appears to be a significant correlation between the first variable and the logarithm of the second variable. Would you like to see the computed values?"
Demonstration of Expert System for Data Analysis in Curie-point Pyrolysis
Mass Spectrometry
Pyrolysis mass spectrometry has come to the attention of both mass spectrometrists and chemometricians because of its utility in the analysis of polymeric materials and the complexity of the mass spectra produced by natural polymers and biopolymers. The technique involves degradation of the solid material by pyrolysis followed by mass spectrometry of the pyrolysis fragments. It has been demonstrated by the pioneering work of Meuzelaar (for example see [8J) that Curie-point pyrolyses of samples of biomaterials can produce profiles which, when properly normalized [2J, are reproducible and diagnostic of the chemical similarities and dissimilarities among groups of samples and are quantitative under appropriate experimental designs [9]. Because the process of pyrolysis followed by mass spectrometry of the network polymer of natural heterogeneous biopolymers produces mass spectra with peaks which tend to be highly correlated, tne interpretation problems created by the vast number of, and the overlap of, the masses are solved through multivariate analysis of the mass spectral profiles. A data system for a pyrolysis mass spectrometer would be of limited utility without multivariate statistical methods [2].
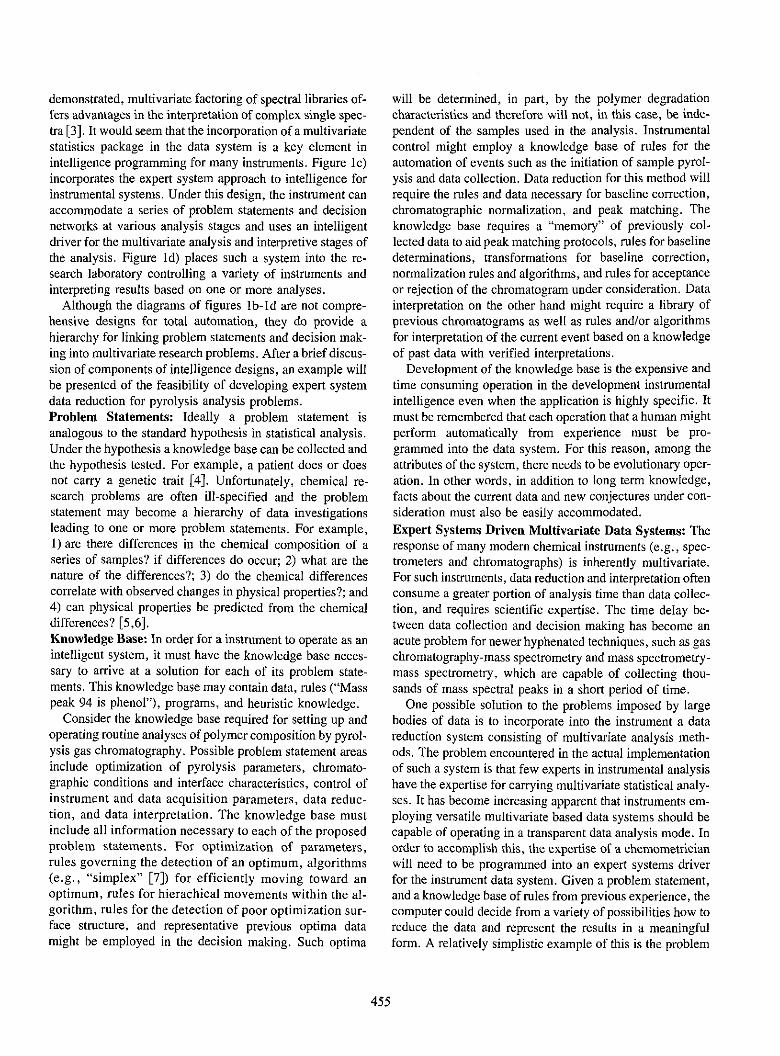
To test the hypothesis that an expert systems approach to data reduction is potentially helpful and feasible, an expert systems driver was implemented to mimic the data analysis portion of a Rocky Mountain Coal study done at Biomaterials Profiling Center in Utah. Detailed results of the original study can be found in [5.6] and of the numerical methods used in [2]. Briefly, 102 Rocky Mountain Coals were analyzed in quadruplicate by pyrolysis mass spectrometry. The pyrolysis profiles were added to a preexisting data set containing conventional measurements on the same coal samples (see table 1). After normalization of the profiles by the method of Eshwis et at. [IOJ, average mass specta were analyzed using multivariate analysis techniques.
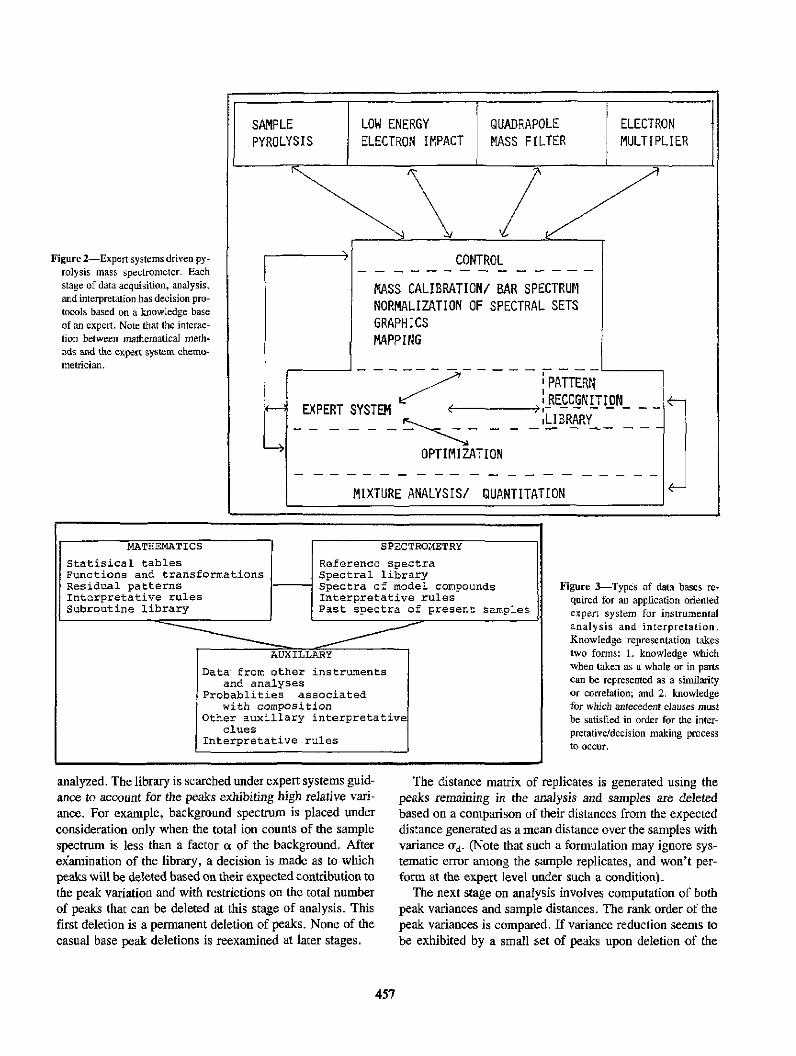
Figure 2 is a minimal design for an expert systems driven data acquisition and analysis system for pyrolysis mass spectrometry. Figure 3 shows the design of the data bases for the present appliC<ltion. As diagrammed in figure 2, each
Table 1. Conventional measurement contained in the "old data" data base for the Rocky ~ountain coals,
COnl'entional Measurement.<i
Vitrinite Fusinite Semifusinitc Macrinile Liplinite Vitrinite Reflectance % Silicon % Aluminum % Titanium % Magnesium % Calcium % Sodium
% Potassium % PhQSptlOrus % Moisture % Pyritic sulfur % Mineral matter % Volatiles % Organic sulfur Calorific value % Organic carbon % Organic hydrogen % Organic sulfur % Organic nitrogen % Organic oxygen
operation of the instrument requires an expert systems driver and decision module for its automation. A [lid~mentary expert systems was built to mimic the decision making used for statistical analysis of coal pyrolysis patterns. This system demonstrates the problems and pitfalls associated with intelligent instrumental development.
Normalization is rarely an option in pyrolysis techniques since the size of the sample undergoing electron impact is determined by the quantity of pyrolsates actually making their way to the ion source of the mass spectrometer. For this reason, spectra are normalized to place each sample on a relative quantitative basis. Furthermore, when replicates of a single sample are analyzed in detail, it is found that some peaks replicate better than others. For example, if an organic solvent is used during the sample preparation, the mass peaks due to this solvent replicate poorly. The same is true of contaminants absorbed to the sample matrix. On the other hand, because the sample size in terms of total ion counts is a variable in these experiments, often one or more replicate spectra will exhibit outlying tendencies when compared to other replicates of the same sample.
NORMA [2J, developed by Meuzelaar's group at Utah, is designed to select peaks with stable variance characteristics for inclusion in the normalization process. With this routine an expert interacts with the computer in a loop of peak deletions and replicate spectra deletions until a set of peaks is defmed which stabilizes the normalization process.
An expert systems approach to the software interaction represents peaks by their variances over the samples and sample replicates and spectra by Euclidean distances between replicates over the mass units. A library data base for normalization is established which contains spectra patterns for commonly used solvents and commonly encountered contaminates as well as the background spectrum from the mass spectrometer. The expert sysems are initialized by computation of peak variances. The variances are ordered high to low and' the shape of the plot of ordered variances is
456
SAMPLE LOW ENERGY QUADRAPOLE ELECTRON PYROLYSIS ELECTRON IMPACT MASS FILTER MULTIPLIER
~\ // Figure 2-Expert systems dri\'en P)'- CONTROL
rolysis- mass. spectrometer. Each - - - -- - - - - - - - --stage of data acquisition. analysis, MASS CALIBRATIONI BAR SPECTRUM and interpretati.on has decision pro- NORMALIZATION OF SPECTRAL SETS tocol!; based on a knowledge base of an expert. Note that the interac- GRAPHICS tion between matbematical meth· MAPPING ods and the e:x.pert system chemo-metrician. - ---~7----
1"---
1
' PATTERtl
<-- EXPERT SYSTEM ( ) !J!E~C.§r.1!JIj)rc --i~ -~-
,LIBRARY - - - - - - - -- - .......... - - --
----} OPTIMIZATION - - - - - - - - - - - - - - - - - -- - -
MIXTURE ANALYSIS; QUANTITATION I~
MATHEMATICS SPECTRO:.lETRY
Statisical tables Reference spectra Functions and transformations Spectral library Residual patterns Spectra of model compounds Figure 3-Types of data bases re-Interpretative rules Interpretative rules quired for an application oriented Subroutine library Past spectra of present sarr.ples expert system for instrumental ---- ------ analysis and interpretation.
Knowledge representation takes AUXILLARY two fonns: I. knowledge which
Data' from other instruments when taken as a whole Of in parts
and analyses can be represented as a similarity
Probablities associated or correlation; and 2. knowledge with composition for which antecedent clauses must
Other auxiliary interpretative be satisfied in order f(lr the inter-clues
Interpretative rules
analyzed. The library is searched under expert systems guidance to account for the peaks exhibiting high relative vari· ance. For example, background spectrum is placed under consideration only when the total ion counts of the sample spectrum is less than a factor ct of the background. After examination of the library, a decision is made as to which peaks will be deleted based on their expected contribution to the peak variation and with restrictions on the total number of peaks that can be deleted at this stage of analysis. This first deletion is a permanent deletion of peaks. None of the casual base peak deletions is reexamined at later stages.
457
pretativeldecision making process to occur.
The distance matrix of replicates is generated using the peaks remaining in the analysis and samples are deleted based on a comparison of their distances from the expected distance generated as a mean distance over the samples with variance ()" d' (Note that such a formulation may ignore systematic error among the samp]e replicates, and won't perform at the expert level under such a condition).
The next stage on analysis involves computation of both peak variances and sample distances. The rank order of the peak variances is compared. If variance reduction seems to be exhibited by a small set of peaks upon deletion {)f the
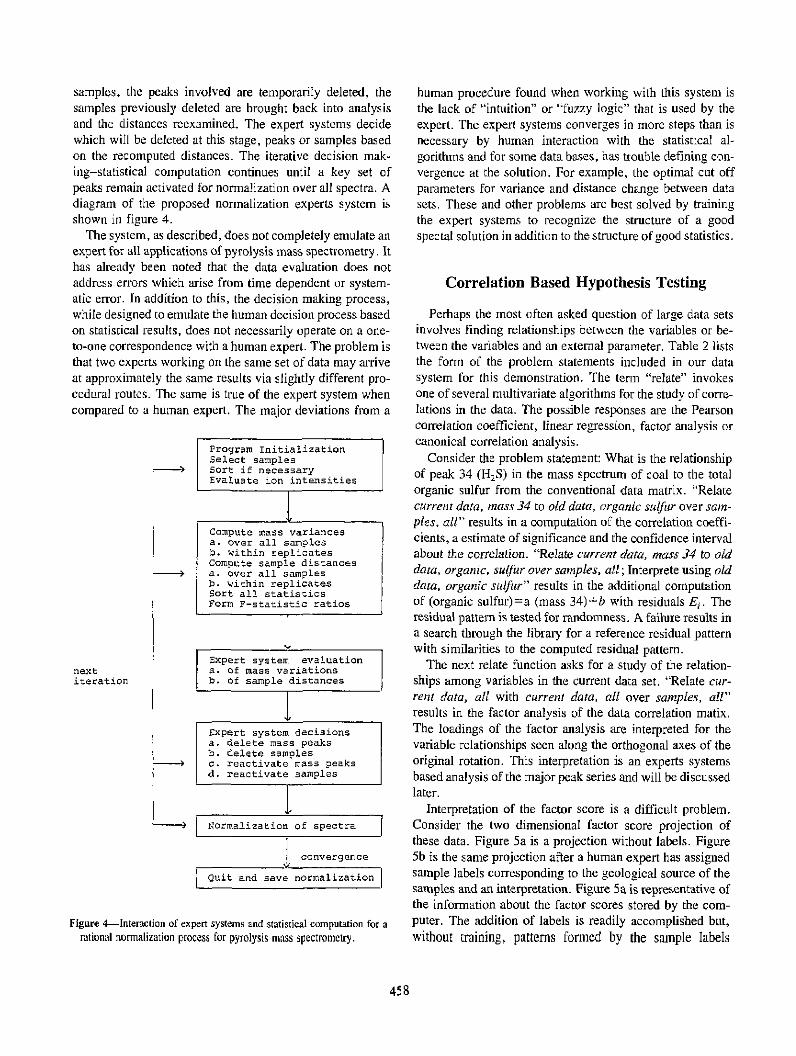
samples. the peaks involved are temporarily deleted. the samples previously deleted are brought back into analysis and the distances reexamined. The expert systems decide which will be deleted at this stage. peaks or samples based on the recomputed distances. The iterative decision making-statistical computation continues until a key set of peaks remain activated for normalization over all spectra. A diagram of the proposed normalization experts system is shown in figure 4.
The system. as described. does not completely emulate an expert for all applications of pyrolysis mass spectrometry. It has already been noted that the data evaluation does not address errors \vhich arise from time dependent or systematic error. In addition to this, the decision making process, while designed to emulate the human decision process based on statistical results, does not necessarily operate on a oneto-one correspondence with a human expert. The problem is that two experts working on the same set of data may arrive at approximately the same results via slightly different procedural routes. The same is true of the expert system when compared to a human expert. The major deviations from a
next iteration
r I
I
Program Initialization Select samples Sort if necessary Evaluate ion intensities
1 Co:npute :rtass variances a. over all sam?les b. within replicates Compl;-=e sample distances a. Over all samples b. wicl1in replicates Sort all statis-:.ics Form F-statistic ratios
1 Expert system evall!ation a. of mass variations b. of sample distances
1 Expert system decisions a. delete mass peaks b. C:elete samples c. reactivate mass peaks d. reactivate samples
1 Norl1'.alization of spectra
convergence
Quit and save normalization
Figure 4-Interaction of e;l[pert systems and statistical computation for a ratiomtl nonnalization process for pyrolysis mass spectrometry.
458
human procedure found when working with this system is the lack of "intuition" or "fuzzy logic" that is used by the expert. The expert systems converges in more steps than is necessary by human interaction with the statistical al~
gorithms and for some data bases. has trouble defining convergence at the solution. For example. the optimal cut off parameters for variance and distance change between data set.>. These and other problelll5 are best solved by training the expert systelll5 to recognize the structure of a good spec tal soIution in addition to the structure of good statistics.
Correlation Based Hypothesis Testing
Perhaps the most often asked question of large data sets involves finding relationships between the variables or between the variables and an exlernal parameter. Table 2 lists the form of the problem statements included in our data system for this demonstration. The term "relate" invokes one of several multivariate algorithms for the study of correlations in the data. The possible responses are the Pearson correlation coefficient, linear regression, factor analysis or canonical correlation analysis.
Consider the problem statement: What is the relationship of peak 34 (H,S) in the mass spectrum of coal to the total organic sulfur from the conventional data matrix. "Relate current data, mass 34 to old data, organic SUlfur over samples. all" result.> in a computation of the correlation coefficients, a estimate of significance and the confidence interval about the correlation. "Relate currelll data, mass 34 to old daw. organic. sulfur over samples, all; Interprete using old data. organic sulfur" results in the additional computation of (organic sulfur)=a (mass 34)+b with residuals Ei . The residual pattern is tested for randomness. A failure results in a search through the library for a reference residual pattern with similarities to the computed residual pattern.
The next relate function asks for a study of the relationships among variables in the current data set. "Relate current data, all with current data. all over samples. all" results in the factor analysis of the data correlation matix. The loadings of the factor analysis are interpreted for the variable relationships seen along the orthogonal axes of the original rotation. This interpretation is an experts systems. based analysis of the major peak series and will be discussed later.
Interpretation of the factor score is a difficult problem. Consider the two dimensional factor score projection of these data. Figure Sa is a projection without labels. Figure 5b is the same projection after a human expert has assigned sample labels corresponding to the geological source of the samples and an interpretation. Figure Sa is representative of the information about the factor scores stored by the computer. The addition of labels is readily accomplished but. without tmining. patterns formed by the sample labels
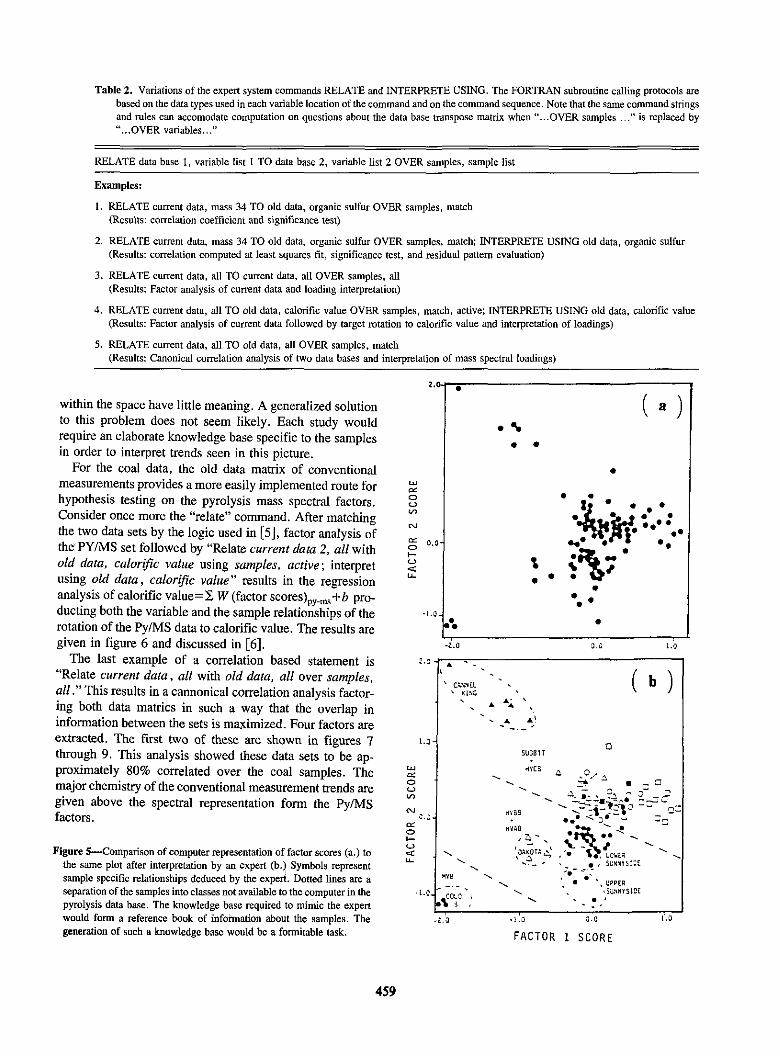
Table 2. Variations of the expert system commands RELATE and INTERPRETE USING. The FORTRAN subroutine calling protocols are based on the data types used in each variable location of the command and on the command sequence. Note that the same command strings and rules can accomodate conlputation on questions about the data base transpose matrix when" ... OVER samples ... " is replaced by " ... OVER variables ... "
RELATE data base 1, variable list 1 TO data base 2, variable list 2 OVER samples, sample list
Examples:
I. RELATE current data, mass 34 TO old data, organic sulfur OVER samples, match (Results: correlation coefficient and significance test)
2. RELATE current data, mass 34 TO old data, organic sulfur OVER samples. match; INTERPRETE USING old data, organic sulfur (Results: correlation computed at least squares fit, significance test, and residual pattern evaluation)
3. RELATE current data, all TO current data, all OVER samples, all (Results: Factor analysis of current data and loading interpretation)
4. RELATE current data, all TO old data, calorific value OVER samples, match, active; INTERPRETE USING old data, calorific value (Results: Factor analysis of current data followed by target rotation to calorific value and interpretation of loadings)
5. RELATE current data, all TO old data, all OVER samples, match (Results: Canonical correlation analysis of two data bases and interpretation of mass spectral loadings)
within the space have little meaning. A generalized solution to this problem does not seem likely. Each study would require an elaborate knowledge base specific to the samples in order to interpret trends seen in this picture.
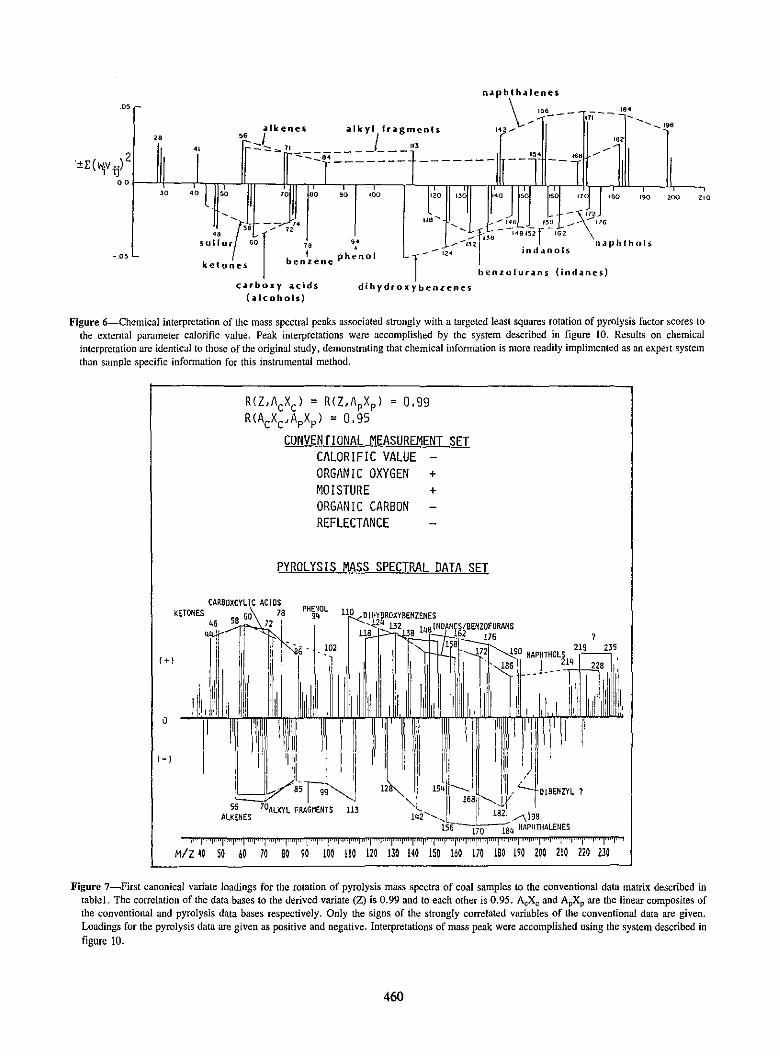
For the coal data, the old data matrix of conventional measurements provides a more easily implemented route for hypothesis testing on the pyrolysis mass spectral factors. Consider once more the "relate" command. After matching the two data sets by the logic used in [5], factor analysis of thePY/MS set followed by "Relate current data 2, all with old data, calorific value using samples, active; interpret using old data, calorific value" results in the regression analysis of calorific value=:£ W (factor scores)py."" +b producting both the variable and the sample relationships of the rotation of the Py/MS data to calorific value. The results are given in figure 6 and discussed in [6].
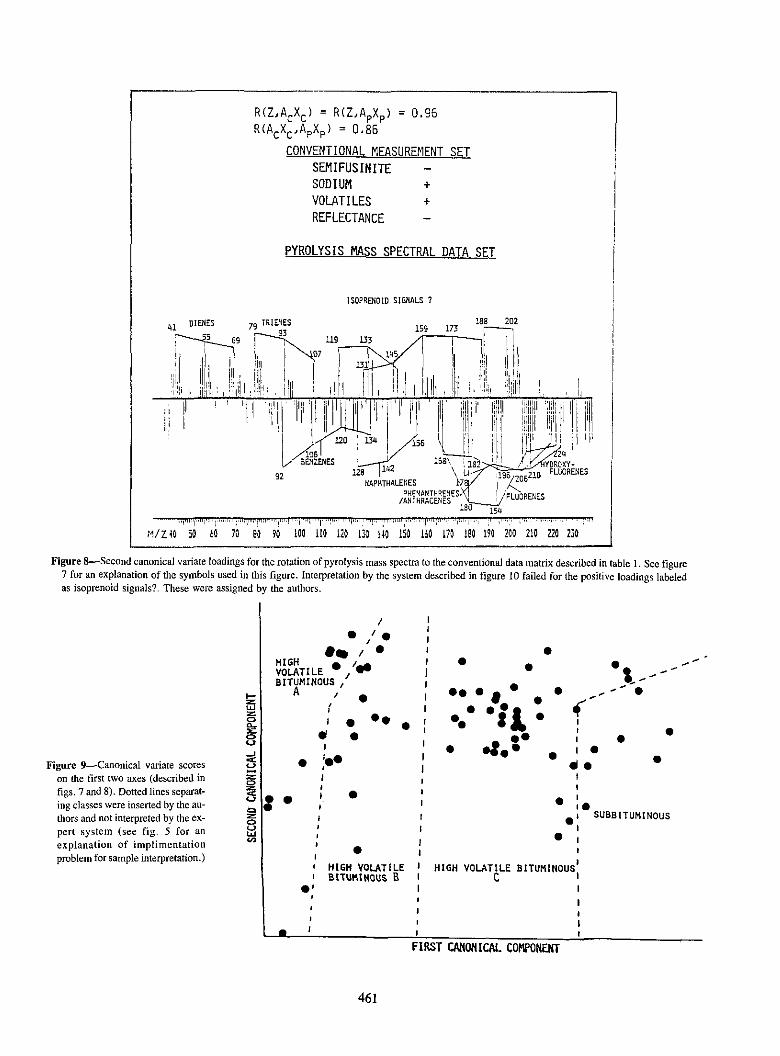
The last example of a correlation based statement is "Relate current data, all with old data, all over samples, all." This results in a cannonical correlation analysis factoring both data matrics in such a way that the overlap in information between the sets is maximized. Four factors are extracted. The first two of these are shown in figures 7 through 9. This analysis showed these data sets to be approximately 80% correlated over the coal samples. The major chemistry of the conventional measurement trends are given above the spectral representation form the Py/MS factors.
Figure 5-Comparison of computer representation of factor scores (a.) to the same plot after interpretation by an expert (b.) Symbols represent sample specific relationships deduced by the expert. Dotted lines are a separation of the samples into classes not available to the computer in the pyrolysis data base. The knowledge base required to mimic the expert would fonn a reference book of information about the samples. The generation of such a knowledge base would be a fonnitable task.
459
z. •
w
'" 0 '-' ~
N
'" 0.0 0 I-'-'
"" ...
·l.0
Ie" -z.o
Z.O • - .
~ C':'lI:iEL ~ Kl~:;
l.J
w
'" 0 '-' ~
N .:.;
'" 0 I-'-'
"" ---... ---
'" . 1.0 ~~~;-o ~ "
-z.o
( a ) ... • •
• • • ~ .. ' . ., M- ••.. ,- .. ~~-' '. \ '\ ,
• • • • ' .. •
o.u 1.0
( b )
SUOB I r o
·1.0 0.0 1.0
FACTOR 1 SCORE
"
" ±E(,,\V i /
00
'0
-,O~
~6 .1lkenes .1lkyl frolgmenls
::.l 7. j H -"'" -----------" '"
- __ 84 ______ _
'0 ,"0 190 ZOO
, -~" " == '::6 _ I!I~ ___ -""'176
s u;i u r'(5860 r-':- }2'4 78 9,4 f' ''''''r '" - " ___ --I~Z naphthots _- 124 indanols t phenol
ketones benzene I benzolurans (indanes)
dihydroxYbenzenes colrboxy olcids hdcohols)
Figure 6-Chemical interpretation of the mass spectral peaks associated strongly with a targeted least squares rotation of pyrolysis factor scores to the external parameter calorific value. Peak interpretations were accomplished by the system described in figure 10. Results on chemical interpretation are identical to those of the original study. demonstrating that chemical infonnation is more readily implimented as an expert system than sample specific infonnation for this instrumental method.
(+)
o
(-)
R(Z,AcXc' = R(Z,ApXpl = 0.99 R(AcXc,ApXpl = 0.95
CONVENT! ONAl MEASUREMENT SET CALORIFIC VALUE -ORGANIC OXYGEN + MOISTURE ORGANIC CARBON REFLECTANCE
+
PYROLYSIS MASS SPECTRAL DATA SET
I,ll/ 12",~ 154 1--;', ", ,/'--tOl''''ZVL'
142'" II l' /\198
I J' "J "" S~ l~l WI FRAGMENTS 113 ALKEtlES " .. " ...
56 iO 1811 tlAPIHHALEUES
,I 1"11''1''''1 1'1 I 'Ii i I Ii I I I' I'" iii Iii I 'I' I I'iiliil 1""11' I'I iilii'l 'i 'i"'1 liil'''lii 1"1 , i [ ! II I t
Mlz ~O 50 60 70 ao 9G 100 110 120 130 140 150 160 170 laO 110 200 210 220 230
Figure 7-First canonical variate loadings for the rotation of pyrolysis mass spectra of coal samples to the conventional data matrix described in tablel. The correlation of the data bases to the derived variate (Z) is 0.99 and to each other is 0.95. AcXc and ApXp are the linear composites of the conventional and pyrolysis data bases respectively. Only the signs of the strongly correlated variables of the conventional data are given. Loadings for the pyrolysis data are given as positive and negative. Interpretations of mass peak were accomplished using the system described in
figure 10.
460
Ii
" Ii
R(Z,AcXcl = R(Z,ApXpl = 0.96 R(AcXc,ApXpl = 0.85
CONVENTIONAL MEASURE/lENT SET SEMIFUSINITE SODIUM +
VOLATILES + REFLECTANCE
PYROLYSIS MASS SPECTRAL DATA SET
ISOPRENOID SIGNALS 1
188 202 159 173 ~ ;;r--,-_ i I I
\1 'II "'I II I ,. ~ ii' I 'I !'I'! I: "I
:.' • I, ! ,i , ,~i Ii I i ,I I, I
, , 'II :\'11 '1111 '1111'1
I d, 120 11134 I /1'56
Vah1ZENES w: 92
128 1142 NAPHTHALEtIES
PHE'IIlJITHRE'IES IANTHRACENES 180
"1''''1''1'' "",,:,1, "i " 'i"f'''i '," 1",'" 'I''' "lIi"","'I''','
154
11/Z;O 50 60 70 BV 90 100 110 120 130 HO 150 160 170 IBO 190 200 210 220 2jQ
I 1
I 1
1
I i
I
---' Figure 8-Second canonical variate loadings for the rotation of pyrolysis mass spectra to the conventional data matrix described in table 1. See figure
7 for an explanation of the symbols used in this figure. Interpretation by the system described in figure 10 failed for the positive loadings labeled as isoprenoid signals? These were assigned by the authors.
Figure 9-Canonical variate scores on the first two axes (described in figs. 7 and 8). Dotted lines separating classes were inserted by the authors and not interpreted by the expert system (see fig. 5 for an explanation of implimentation problem for sample interpretation.)
I . /. •• I • HIGH • I
VOLATILE .. BITUMINOUS /
A I
.' ,
• J ••••
• •
•
• HIGH VOLATILE SnUMIHOUS B
461
I I J J I I
• • • ••• • • '. .
, I
. .. ·'1· •• eI.· • • I •
•• I , . :. • •
•
.' SUBBITUMINOUS I • ,
HIGH VOLATILE BITUMINOUS' C I
FIRST CAlIOItICAl COMI'ONEKT
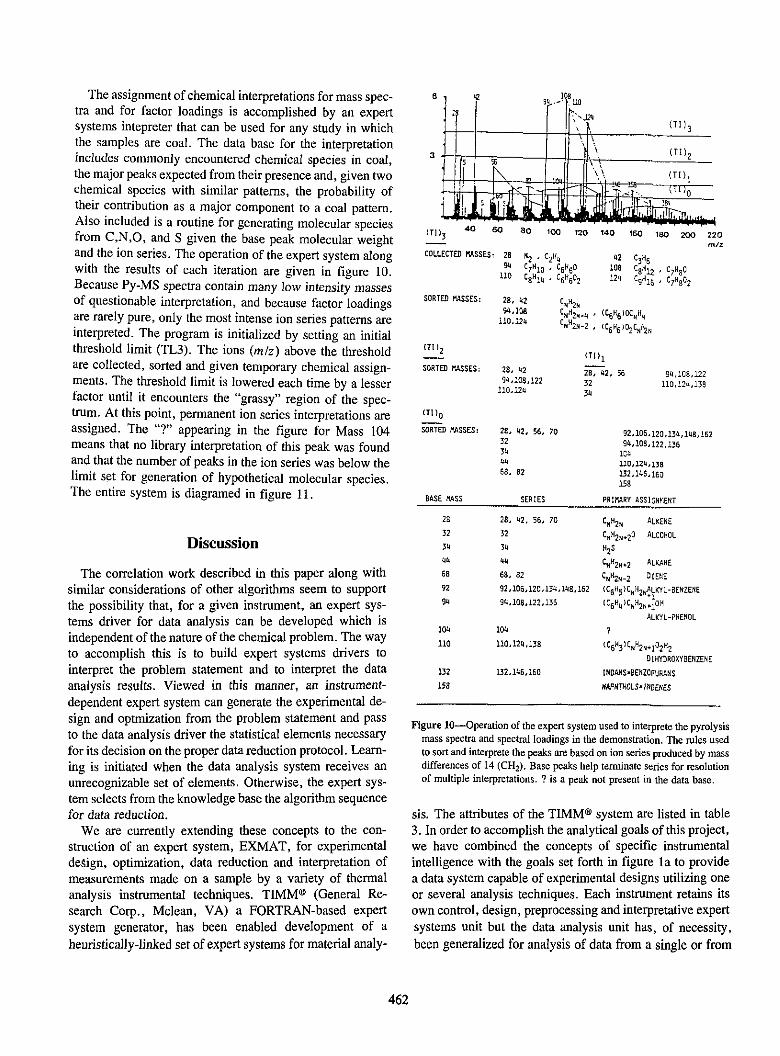
The assignment of chemical interpretations for mass spectra and for factor loadings is accomplished by an expert systems intepreter that can be used for any study in which the samples are coal. The data base for the interpretation includes commonly encountered chemical species in coal, the major peaks expected from their presence and, given two chemical species with similar patterns, the probability of their contribution as a major component to a coal pattern. Also included is a routine for generating molecular species from C,N ,0, and S given the base peak molecular weight and the ion series. The operation of the expert system along with the results of each iteration are given in figure 10. Because Py-MS spectra contain many low intensity masses of questionable interpretation, and because factor loadings are rarely pure, only the most intense ion series patterns are interpreted. The program is initialized by setting an initial threshold limit (TL3). The ions (mlz) above the threshold are collected, sorted and given temporary chemical assignments. The threshold limit is lowered each time by a lesser factor until it encounters the "grassy" region of the spectrum. At this point, pennanent ion series interpretations are assigned. The "?" appearing in the figure for Mass 104 means that no library interpretation of this peak was found and that the number of peaks in the ion series was below the limit set for generation of hypothetical molecular species. The entire system is diagramed in figure II.
Discussion
The correlation work described in this paper along with similar considerations of other algorithms seem to support the possibility that, for a given instrument, an expert systems driver for data analysis can be developed which is independent of the nature of the chemical problem. The way to accomplish this is to build expert systems drivers to interpret the problem statement and to interpret the data analysis results. Viewed in this manner, an instrumentdependent expert system can generate the experimental design and optmization from the problem statement and pass to the data analysis driver the statistical elements necessary for its decision on the proper data reduction protocol. Learning is initiated when the data analysis system receives an unrecognizable set of elements. Otherwise, the expert system selects from the knowledge base the algorithm sequence for data reduction.
We are currently extending these concepts to the construction of an expert system, EXMAT, for experimental deSign, optimization, data reduction and interpretation of measurements made on a sample by a variety of thermal analysis instrumental techniques. TIMM® (General Research Corp., Mclean, VA) a FORTRAN-based expert system generator, has been enabled development of a
heuristically-linked set of expert systems for material analy-
462
6 ~ 10 9~.~· ~110
-; .... J211 III I, ,
... . 3
\ (T1 )2 s $
"- \\ III I, .'.
- ,"i' (! I )0
i ~i ~',
.iN It l ,~ - ,~
I' i r :ill!i;:;n, (TJ)J
40 60 80 100 120 140 160 160 200 220
m" COLLECTED !'lASSES: " "2 ' C21f~ 42 C3H5
SORTED !"ASSES:
1T112
SORTED ".ASSES:
CTI1 0
SORTED MSSES:
BASE .'lASS
.. C7H10 • CSliGO lOS CgH12 ' '7H80 110 CSHI4 ' C611602 "" CgHlG ' C7H802
28, 112 CNH2N 94.108 CNIi2M~4 ' (CSH61OCNHN 110.124
CNH21l-2 • {C6H6 lD:1Si1zN
28. 42 94.:08.122
110.124
2E. ~2. 56. 70
" 44 68. 82
SER! ES
(Till
28, 42. 56 9~.lO8.l22
" " 110.124.139
92.106.120,13~.148.l62 94.108.122.136
lC4 110.124,138 132.1~6.160
158
PR!/'IARV ASS!GN~\ENT
28 28. 42. 56. 70 CNH2N ALKENE 32 32
" " ..
104
llO
m 158
68. 82
92.106,120.134.148,162
911.108.122.135
104
110.124.138
132.1~6.160
CNH2N+2O ALCOHOL
H,' CNH1N+2 ALKANE
CNH2N _2 D[ENE
(C5HS )CNH2N~~KYL -BEltZENE
(C6111; lCNH2N +1 OH
ALKYL -PHENOL
(C6H31 CNH2N+I02H2
DIHYDROXVBENZENE
1 NDANS .. BENZOFURANS
HAPIfTl{OLS"/1'IDENES
Figure IO-Operation of the expert system used to interprete the pyrolysis mass spectra and spectral loadings in the demonstration. The rules used to sort and interprete the peaks are based on ion series produced by mass differences of 14 (CH2). Base peaks help tenninate series for resolution of multiple interpretations. ? is a peak not present in the data base.
sis. The attributes of the TIMM® system are listed in table 3. In order to accomplish the analytical goals of this project, we have combined the concepts of specific instrumental intelligence with the goals set forth in figure la to provide a data system capable of experimental designs utilizing one or several analysis techniques. Each instrument retains its own control, design, preprocessing and interpretative expert systems unit but the data analysis unit has, of necessity, been generalized for analysis of data from a single or from
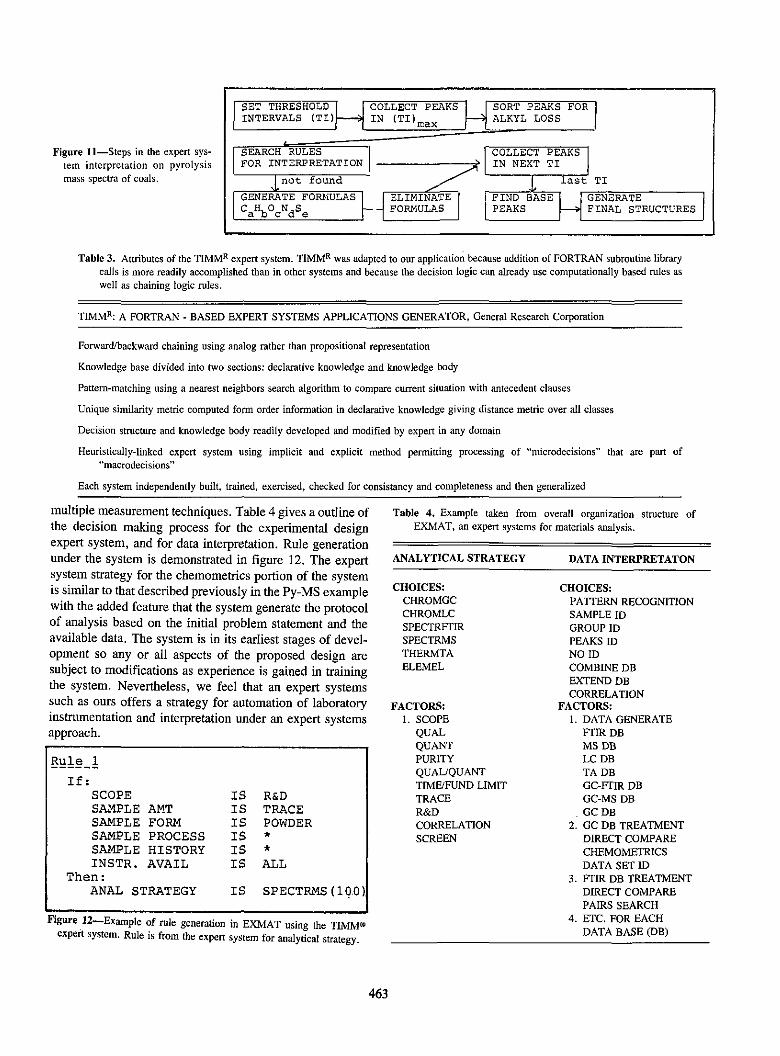
Figure ll-Steps in the expert system interpretation on pyrolysis mass spectra of coals.
SET THRESHOLD INTERVALS (TI)
COLLECT PEAKS IN (TI)max
ELIMINATE FORHULAS
SORT P;2:AKS FOR ALKYL LOSS
TI
GENERATE FINAL STRUCTURES
Table 3. Attributes of the TIMMR expert system. TIMMR was adapted to our application because addition of FORTRAN subroutine library calls is more readily accomplished than in other systems and because the decision logic can already use computationally based rules as well as chaining logic rules.
TIMMR: A FORTRAN - BASED EXPERT SYSTEMS APPLICATIONS GENERATOR, General Research Corporation
Forward/backward chaining using analog rather than propositional representation
Knowledge base divided into two sections: declarative knowledge and knowledge body
Pattern-matching using a nearest neighbors search algorithm to compare current situation with antecedent clauses
Unique similarity metric computed fonn order infonnation in declarative knowledge giving distance metric over all classes
Decision structure and knowledge body readily developed and modified by expert in any domain
Heuristically-linked expert system using implicit and explicit method pennitting processing of "microdecisions" that are part of "macrodecisions"
Each system independently built, trained, exercised, checked for consistancy and completeness and then generalized
multiple measurement techniques. Table 4 gives a outline of the decision making process for the experimental design expert system, and for data interpretation. Rule generation under the system is demonstrated in figure 12. The expert system strategy for the chemometrics portion of the system is similar to that described previously in the Py-MS example with the added feature that the system generate the protocol of analysis based on the initial problem statement and the available data. The system is in its earliest stages of development so any or all aspects of the proposed design are subject to modifications as experience is gained in training the system. Nevertheless, we feel that an expert systems such as ours offers a strategy for automation of laboratory instrumentation and interpretation under an expert systems approach.
g!!!§U If:
SCOPE IS R&D SAI1PLE AMT IS TRACE SAMPLE FORM IS POWDER SAMPLE PROCESS IS • SAMPLE HISTORY IS • INSTR. AVAIL IS ALL
Then: ANAL STRATEGY IS SPECTRMS (1 QO)
Figure,12-Example of rule generation in EXMAT using the TIMM® expert system. Rule is from the expert system for analytical strategy.
463
Table 4. Example taken from overall organization structure of EXMAT, an expert systems for materials analysis.
ANALYTICAL STRATEGY
CHOICES: CHROMGC CHROMLC SPECTRFrIR SPECTRMS THERMTA ELEMEL
FACTORS: I. SCOPE
QUAL QUANT PURITY QUAUQUANT TIME/FUND LIMIT TRACE R&D CORRELATION SCREEN
DATAINTERPRETATON
CHOICES: PATTERN RECOGNITION SAMPLE ID GROUP ID PEAKS ID NO ID COMBINE DB EXTEND DB CORRELATION
FACTORS: I. DATA GENERATE
FrIR DB MSDB LC DB TADB GC-FrJR DB GC-MS DB
. GCDB 2. GC DB TREATMENT
DIRECT COMPARE CHEMOMETRICS DATA SET ID
3. FrIR DB TREATMENT DIRECT COMPARE PAIRS SEARCH
4. ETC. FOR EACH DATA BASE (DB)
References
[I] Harper, A.M., Polymer Characterization Using Gas Chromatography and Pyrolysis, S. Liebman and E.J. Levy, Marcel Dekker. Inc. (1985).
[2] Harper. A.M.; H.C.L. Meuzelaar, G.S. Metcalf, and D.L. Pope, Analytical Pyrolysis Techniques and Applications, K. Voorhees, ed. 157-195 (1984).
[3] Owens, P.M.; R.B. Lamb and T.L. Isenhour. Anal. Chern., S42344 (1982).
[4] McMurry, J.E.; J.A. Pino, P,C. Jues, B. Lavine, and A.M. Harper, Anal. Chern., vol. 57, 295-302 (1985).
DISCUSSION of the Harper-Liebman paper, Intelligent Instrumentation
Richard J. Beckman Los Alamos National Laboratory
There has been an instrumentation revolution in the chemical world which has changed the way both chemists and statisticians think. Instrumentation has lead chemists to multivariate data-much multivariate data. Gone are the days when the chemist takes three univariate measurements and discards the most outlying.
Faced with these large arrays of data the chemist can become somewhat lost in the large assemblage of multivariate methods available for the analysis of the data. It is extremely difficult for the chemist-and the statistician for that matter-to form hypotheses and develop answers about the chemical systems under investigation when faced with large amounts of multivariate chemical data,
Professor Harper proposes an intelligent insttument to solve the problem of the analysis and interpretation of the data. This machine will perform the experiments, formulate
the hypotheses, and "understand" the chemical systems under investigation.
What impact will such an instrument have on both chemists and statisticians? For the chemist, such an instrument will allow more time for experimentation, more time to think about the chemical systems under investigation, a better understanding of the system, and better statistical and numerical analyses, There would be a chemometrician in
[5] Meuzelaar, H.L.e., and A.M. Harper, Characterization and Classification of Rocky Mountain Coals by Curie-Point Mass Spectrometry, Fuels, vol. 63, 639-652 (1984).
[6] Harper, A.M.; H.L.e. Meuzelaar, and P.H. Given, Fuels, vol. 63, 793-799 (1984).
[7] Deming, S.N.; S.L. Morgan, and M.R. Willcott, American Laboratory. October, 13 (1976).
[8] Meuzelaar, H.L.e.; 1. Haverkamp, and F.D. Hileman, Curie Point Pyrolysis Mass Spectrometry of Recent and Fossil Biomaterials. Elsevier, Amsterdam (1982).
[9] Windig, W.; P.O. Kistemaker. and J. Haverkamp, J. Anal. App!. Pyro!., 3, 199 (1982).
[10] Eshwis. W.; P.O. Kistemaker and H.L.e. Meuzelaar, Analytical Pyrolysis. CER, Jones, ed., Elsevier, Amsterdam, 151-166 (1977).
every instrument! For the statistician, the instrument will mean the removal of outliers, trimmed data, automated'regressions, and automated multivariate analyses. Most important, the entire model building process will be automated,
There are some things to worry about with intelligent instruments. Will the chemist know how the data have been reduced and the meaning of the analysis? Instruments made today do some data reduction, such as calibration and trimming, and the methods used in this reduction are seldom known by the chemist. With a totally automated system the chemist is likely to know less about the analysis than he does with the systems in use today.
The statistician when reading the paper of Professor Harper probably asks what is the role of the statistician in this process? Will the statistician be replaced with a microchip? Can the statistician be replaced with a microchip? In my view the statistician will be replaced by a microchip in instruments such as those discussed by Professor Harper, This will happen with or without the help of the statistician, but it is with the statistician's help that good statistical practices will be part of the intelligent insttument.
Professor Harper should be thanked for her view of the future chemical laboratory . This is an exciting time for both the chemist and the statistician to work and learn together,
464