integrating soil moisture and other sensors for …...1 integrating soil moisture and other sensors...
TRANSCRIPT
1
Integrating Soil Moisture and Other Sensors for Precision Irrigation
Marc van Iersel, PhD
Department of Horticulture, University of Georgia, Athens, GA 30602
Abstract. The use of sensors can provide quantitative information to help guide and automate
the decision making process for irrigation. This paper provides an overview of the most
common sensors that can be used for this purpose. Such sensors include those that are
commonly used for weather stations as well as sensors that indicate the water needs of the
crop. Irrigation demand can be determined directly from soil water measurements or indirectly
from the water status of the crop. Pros and cons of these approaches are discussed.
Keywords. Evapotranspiration, Light, modeling, relative humidity, remote sensing, temperature,
water, wind
Introduction
Sensing environmental conditions is becoming easier and cheaper, providing opportunities to
integrate such sensors into irrigation systems. Good, quantitative information can be used to
help guide decision making with regard to a) when to irrigate and b) how much water to apply.
However, simply collecting data may not be useful, unless that data is presented in an
actionable form; the data need to be converted into usable information. Thus, the software
side is at least as important as the hardware. This paper focuses on available sensors for use in
irrigation control systems, while other papers from this workshop discuss the hardware needed
to measure and collect the data, software development to present the data in a user-friendly,
actionable format, the use of sensor networks for irrigation management, and the economic
impact wireless sensor networks can have.
There are different ways in which sensor data can be used to help make irrigation decisions.
The simplest method is to turn irrigation on and of based on whether a particular sensor
reading is below or above a particular threshold. For example, irrigation can be turned on and
off based on the amount of water present in the soil or based a measure that is an indicator of
plants stress. More complex approaches may involve the modeling of crop water use or
evapotranspiration (ET, the total amount of water evaporating from the soil and transpired by
the crop) based on weather conditions and crop factors.
2
Although there are many different ways to estimate ET from weather conditions, the most
common approach is the FAO Penman-Monteith method, which uses commonly measured
weather data to calculate a reference ET value (ET0). The ET0 is an estimate of the ET from an
extensive surface of green grass with a height of 12 cm (about 5”). This ET0 is than multiplied
by a crop coefficient (Kc) to calculate the expected ET for a particular crop. Crop coefficients
depend on the size of the crop, and thus change over time. Detailed information on Kc values is
available for most agronomic crops and some horticultural crops. This approach is difficult to
apply to landscapes with mixed plantings, because of the difficulty of determining an accurate
Kc. Note that the resulting ET estimates assumes that the crop has access to unlimited water
resources, and adjustments need to be made if water availability is limited by drought or
salinity. Weather information needed for the FAO Penman-Monteith method include solar
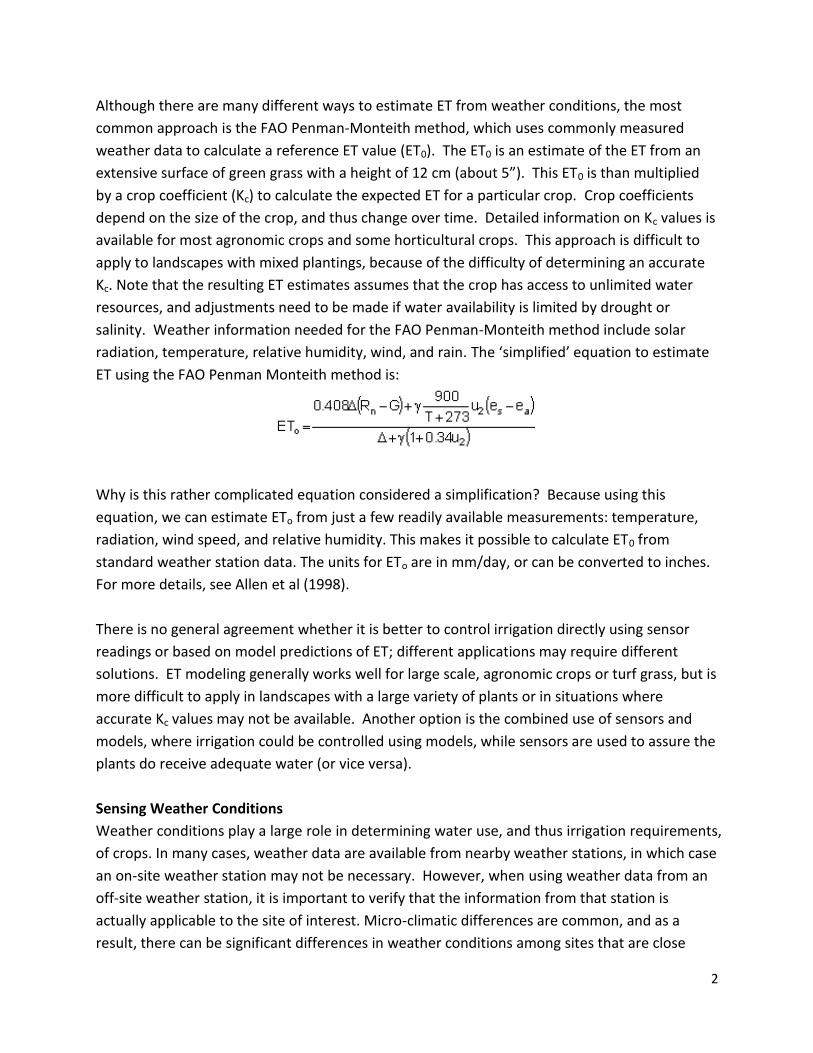
radiation, temperature, relative humidity, wind, and rain. The ‘simplified’ equation to estimate
ET using the FAO Penman Monteith method is:
Why is this rather complicated equation considered a simplification? Because using this
equation, we can estimate ETo from just a few readily available measurements: temperature,
radiation, wind speed, and relative humidity. This makes it possible to calculate ET0 from
standard weather station data. The units for ETo are in mm/day, or can be converted to inches.
For more details, see Allen et al (1998).
There is no general agreement whether it is better to control irrigation directly using sensor
readings or based on model predictions of ET; different applications may require different
solutions. ET modeling generally works well for large scale, agronomic crops or turf grass, but is
more difficult to apply in landscapes with a large variety of plants or in situations where
accurate Kc values may not be available. Another option is the combined use of sensors and
models, where irrigation could be controlled using models, while sensors are used to assure the
plants do receive adequate water (or vice versa).
Sensing Weather Conditions
Weather conditions play a large role in determining water use, and thus irrigation requirements,
of crops. In many cases, weather data are available from nearby weather stations, in which case
an on-site weather station may not be necessary. However, when using weather data from an
off-site weather station, it is important to verify that the information from that station is
actually applicable to the site of interest. Micro-climatic differences are common, and as a
result, there can be significant differences in weather conditions among sites that are close
3
together. The one weather variable that is perhaps most different across relatively small
distances is rainfall.
Light
Light, or solar radiation, is probably the most environmental variable affecting plant water use.
There are two common ways to measure light that are relevant to plants a) the total energy of
the incoming light (shortwave radiation) and b) photosynthetically active radiation. The
difference between these two measures is that shortwave radiation includes near UV, visible,
and near infra-red radiation, spanning radiation of wavelengths from approximately 200 to
3000 nm. These wavelengths span the entire spectrum of radiation coming from the sun and
shortwave radiation measurements thus determine the total energy flux of the incoming sun
light (in units of W/m2). Photosynthetically active radiation only includes light with
wavelengths from 400 to 700 nm, roughly the same wavelengths visible to the human eye.
Light within this part of the spectrum can be used by plants to drive photosynthesis and is
measured in units of µmol/m2/s. Thus, measuring shortwave radiation treats light as an
electromagnetic wave and determines the energy in that radiation, while photosynthetically
active radiation treats light as individual light particles (photons) and determines the number of
photons in the incoming radiation.
Photosynthetically active radiation is normally measured using quantum sensors. Since these
sensors measure the light that plants can use for photosynthesis, quantum sensors are often
used when the collected data are needed for plant growth models. Such models can be
coupled to water use models as well, in which case quantum sensors can be used for irrigation
management. However, weather stations typically do not include quantum sensors.
Photosynthetically active radiation data are used in both very simple (van Iersel et al, 2010) and
complex water use models (Bauerle and Bowden, 2011)
Measuring shortwave radiation is critical in determining the energy balance of a leaf or crop.
Energy balance calculations are used in the FAO Penman-Monteith model of ET and shortwave
radiation measurements are thus critical for weather stations, if the weather data are to be
used for ET modeling. Sensors that measure total solar radiation are referred to as
pyranometers and normally part of weather stations, so these data are readily available.
Light intensities also are commonly measured with photometric sensors (although not as part
of weather stations), in units of lux, lumens, or footcandles. Photometric sensors measure how
well humans can detect the light. Since the sensitivity of the human eye is very different from
the way plants perceive light, these measures should not be used for irrigation control
purposes.
4
The calibration of light sensors drifts gradually over time, and often in an unpredictable way.
To assure long term reliability, sensors need to be recalibrated ever 2-3 years (see
manufacturers info for more details). Recalibration requires a standard light source and
generally needs to be done by the manufacturer.
Temperature and relative humidity
Although very different, temperature and relative humidity are discussed together, because
their effects on plant water are interdependent. Specifically, relative humidity itself does not
have a direct impact on (evapo)transpiration. Instead evapotranspiration depends greatly on
the vapor pressure deficit, which is a function of both temperature and relative humidity. To
better understand this relationship, a clear understanding of some key terms is needed.
Vapor pressure (e) is a measure of the actual amount of water vapor in the air. Vapor
pressure is expressed in pressure units (kPa, mbar).
Saturation vapor pressure (es) is a measure of the maximum amount of water vapor the
air can hold. This is a function of temperature, with warmer air being able to hold more
water. Saturation vapor pressure is expressed in pressure units (kPa, mbar).
Vapor pressure deficit (VPD) is the difference between the maximum amount of water
the air can hold and the actual amount of water vapor in the air (es – e).
Relative humidity (RH) is the ratio between the actual amount of water vapor in the air
and the maximum amount of water vapor the air can hold. It is most commonly
expressed as a % (e/es × 100).
Dew point temperature is the temperature to which the air must be cooled to
completely saturate the air with water vapor (i.e. reach 100% RH). When the dew point
is reached, dew (condensation) will form if the temperature drops further.
Dry bulb temperature is the actual temperature of the air
Wet bulb temperature is the temperature of a thermometer covered with a wet wick
and exposed to air flow. Evaporation of water from the wick will cool the thermometer,
and the wet bulb temperature is thus always lower than the air temperature, but higher
than the dew point(unless RH = 100% in which case wet bulb temperature, dry bulb
temperature, and dew point are the same).
The driving force for evapotranspiration is VPD, but unfortunately, we cannot measure VPD
directly. Weather stations normally determine VPD from the dry bulb temperature and relative
humidity. For applications that require great accuracy, dry bulb and dew point can be measured
and used to calculate VPD, but accurate dew point measurements are too expensive and
technically challenging for use in irrigation management.
5
Typically, weather stations include a temperature sensor and relative humidity sensor. There
are many different types of temperature sensors,, but weather stations most commonly use
either resistance temperature detectors (RTD) or thermistors. Both sensor types are based on
the same principle: the electrical resistance of the RTD element changes with temperature and
the resistance of the element is measured. This measured resistance is then used to determine
the temperature. Although temperature measurements seem simple, larger errors can occur if
the sensor is not used properly. Most importantly, sensors should always be shaded and
preferably aspirated.
Relative humidity is normally measured using capacitive sensors. These sensors contain a
substrate between two electrodes and the amount of water the substrate absorbs depends on
the relative humidity. The two electrodes are then used to measure the capacitance (for more
details, see the section on capacitance soil moisture sensors) of the substrate and the resulting
measurement is converted to a relative humidity value. The calibration of humidity sensors
normally drifts gradually over time and these sensors should be recalibrated every 2-3 years to
assure that the readings are accuracy.
Automated weather stations can then calculate the saturation vapor pressure, actual vapor
pressure, and vapor pressure deficit from the temperature and humidity values.
Wind
Wind affects evapotranspiration, because air movement moves the humid air away from the
canopy or soil and reduces the boundary layer resistance for water movement from the soil or
crop to the air. Wind direction is generally less critical for irrigation management, but is
measured by many common weather stations as well.
The most common method to measure wind speed is with cup anemometers. The wind causes
the cups to rotate around a vertical shaft and the number of rotations within a particular time
interval is measured to determine the wind speed. Thus type of anemometer is normally
present on weather stations.
Another type of anemometer on weather stations is the windmill type, where a propeller is
spun by the wind and the rotations of the propeller are measured. To assure that the propeller
is perpendicular to the wind, a wind vane is normally used to align the instrument to the
prevailing wind direction.
Hot wire anemometers are used more in research applications and consist of wire with an
electrical current going through it. This current changes the temperature and thus the
electrical resistance of the wire. Wind will cool the wire and the actual temperature and
6
resistance of the wire are thus dependent on the wind speed. The resistance of the wire can be
measured using several different approaches, but the basic operating principle of all hot wire
anemometers is the same.
Wind direction. Although generally not critical for irrigation applications, wind direction is
normally measured by weather stations, using a vane. This vane can rotate and its angle
depends on the prevailing wind direction. At very low wind speed, the wind may not have
enough force to push the vane around, and wind direction measurements can become
inaccurate.
Rain
Rainfall is obviously critical in irrigation applications and is generally measured using a tipping
bucket rain gauge. Rainfall is collected into a funnel and the water is directed towards a spoon-
like device. When enough water collects in this spoon, it will tip, causing an electrical signal to
be sent (using a reed switch). Weather station rain gauges typically have a resolution of 0.2 mm
or 0.01”. Rainfall can also be measured using simple rain gauges, which vary greatly in their
design. Simple rain gauges do not allow for automated data collection and are therefore not
used as part of weather stations.
For irrigation purposes, it is not always necessary to know how much rain has fallen. Some
irrigation systems simply have a rain sensor that can turn off irrigation when it is raining,
without measuring how much rain is actually falling
Ideally rain gauges would not just determine the daily amount of rainfall, but also the intensity
of the rainfall. Rainfall intensity in many situations will help determine how much water will
infiltrate the soil and how much water is likely to be lost as surface runoff. Although most
automated weather stations are capable of measuring this, they are often not configured to do
so. This is an area where it would be easy to make progress towards making weather data more
usable.
Soil vs. Plant Sensing
Irrigation decisions can be made by measuring the water status of the soil or crop and there is
no agreement about which of these approaches is better. Proponents of measuring crop water
status argue that the goal of irrigation is to assure adequate water availability to the crop and
that crop water status is therefore the best indicator of whether irrigation is needed. However,
crop water status is generally more difficult and expensive to measure than soil water content.
In addition, crop water status is not only affected by the availability of water in the soil, but also
by short term changes in weather (such as a clouds passing over) and by diseases and pests
(particular those that affect the root system and thus the water uptake of the crop).
7
Soil water measurements have the advantage that they are relatively easy to make and
automate. In addition, using soil water status to make irrigation decisions results in a simple
feedback system: a low soil water content will trigger irrigation, which increases soil water
content and indicates that irrigation is no longer needed.
Both crop and soil water status measurements need to take into account spatial variability.
Soils are often not homogenous, resulting in spatial differences in soil water content. Whenever
possible, such spatial variability should be quantified and the placement of sensors should take
into account this spatial variability. In many cases this means that at least some sensors should
be placed in the driest part of the field to assure that this part of the field receives adequate
water.
Crops, likewise, are not homogenous. Spatial variability in the crop can result from natural
variability among the plants, spatial variability of the soil, fertilizer placement, or environmental
gradients within the field. In addition, there are distinct diurnal patterns in crop water status
that make these data difficult to interpret. If individual plants are monitored to make irrigation
decisions, larger plants may need to be monitored to assure that those plants receive adequate
water. Remote sensing applications can alleviate issues related to spatial variability to some
extent, either by measuring many plants and reporting an average or by mapping the spatial
variability. For an excellent review on the implications of spatial and temporal variation on
irrigation management, see the reviews by Jones (2004, 2007).
In many cases, the largest reason for spatial variability may actually be the design of the
irrigation system itself: if the uniformity of the irrigation system is not good, spatial variability in
soil water content and plant growth will be the inevitable result. Thus, any approach to
precision irrigation needs to start with proper design, installation, and maintenance of the
irrigation system. However, those topics go beyond the scope of this paper and are discussed in
many other irrigation association papers.
Sensing Soil Water
Water content vs. matric potential
Two basic properties of soil (or in the case of greenhouse and nursery production, soilless
substrates) can be measured, soil water potential and soil matric potential. There is no
agreement which measure is better suited for irrigation management (see Jones, 2007).
Soil water content sensors, as the name implies, measure the amount of water in the soil, while
matric potential sensors measure how easy it is for plants to extract water from the soil. Matric
8
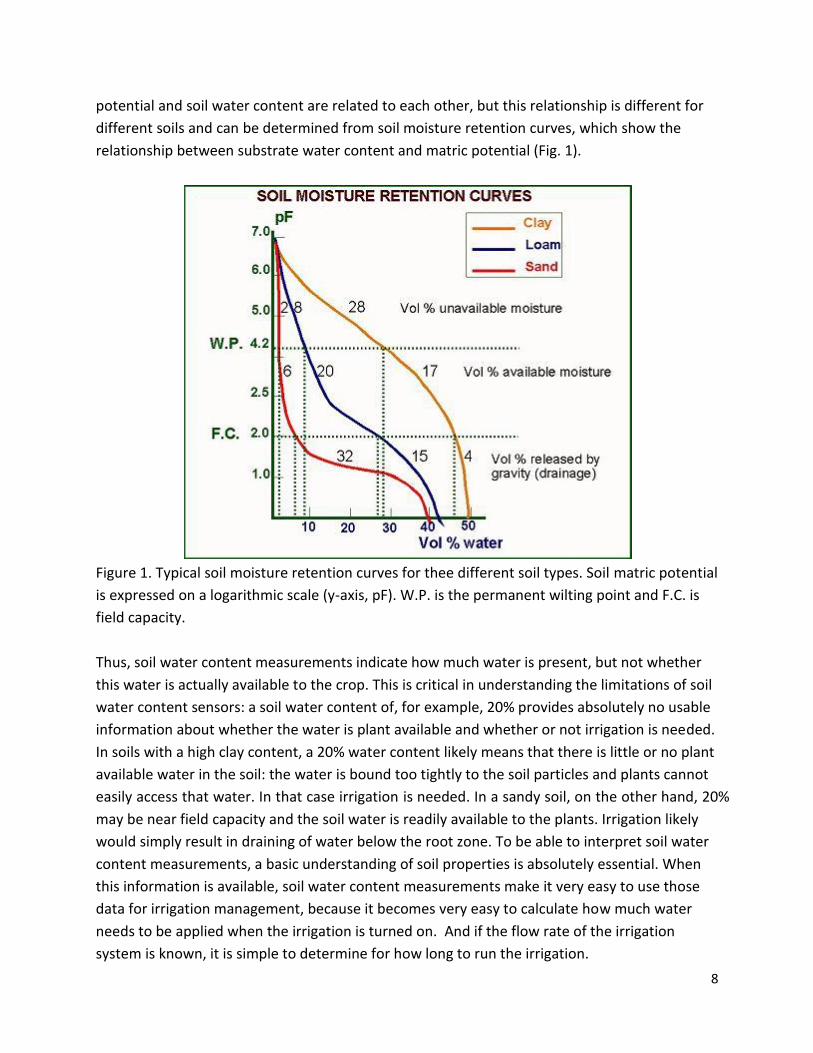
potential and soil water content are related to each other, but this relationship is different for
different soils and can be determined from soil moisture retention curves, which show the
relationship between substrate water content and matric potential (Fig. 1).
Figure 1. Typical soil moisture retention curves for thee different soil types. Soil matric potential
is expressed on a logarithmic scale (y-axis, pF). W.P. is the permanent wilting point and F.C. is
field capacity.
Thus, soil water content measurements indicate how much water is present, but not whether
this water is actually available to the crop. This is critical in understanding the limitations of soil
water content sensors: a soil water content of, for example, 20% provides absolutely no usable
information about whether the water is plant available and whether or not irrigation is needed.
In soils with a high clay content, a 20% water content likely means that there is little or no plant
available water in the soil: the water is bound too tightly to the soil particles and plants cannot
easily access that water. In that case irrigation is needed. In a sandy soil, on the other hand, 20%
may be near field capacity and the soil water is readily available to the plants. Irrigation likely
would simply result in draining of water below the root zone. To be able to interpret soil water
content measurements, a basic understanding of soil properties is absolutely essential. When
this information is available, soil water content measurements make it very easy to use those
data for irrigation management, because it becomes very easy to calculate how much water
needs to be applied when the irrigation is turned on. And if the flow rate of the irrigation
system is known, it is simple to determine for how long to run the irrigation.
9
Soil matric potential has the advantage that it directly determines whether the soil water is
available to the plants. Once an appropriate threshold for a particular plant/crop has been
determined, this threshold can be used in different situations, regardless of soil type. However,
matric potential data provide no information on how much water should be applied. To
determine this, an understanding of the soil properties is required.
Water content sensing
The most accurate method to measure soil water content is with the use of a neutron probe.
Neutron probes contain the radioactive element Beryllium. Beryllium emits ‘fast’ neutrons and
when these neutrons collide with water molecules, they slow down and some of them will
bounce back to a detector inside the probe. These slow neutrons are measured and used to
determine the soil water content. Unfortunately, neutron probes are expensive and require
special handling due to the emitted radiation. Use of neutron probes has thus been largely
limited to research.
More common probes take advantage of the high dielectric of water. The dielectric refers to
the interaction of water molecules and an electromagnetic wave or field that is applied to the
soil. Most soil materials have a dielectric of about 4, air has a dielectric of 1, and water has a
dielectric of about 80. Thus, changes in soil water content have a drastic effect on the total
dielectric of the moist soil. Different sensors detect these changes in the dielectric of the soil
and the dielectric values then are converted to soil water content. Among sensor types that use
the dielectric properties of soils are time-domain reflectivity (TDR) sensors, time domain
transmisometry (TDT), and capacitance sensors. TDR has long been the standard method of
measuring the dielectric properties of soil; the sensors themselves are cheap, but an expensive
meter is needed to measure the sensors. In the last decade, other approaches have been
developed to use the dielectric properties of soils (TDT, capacitance). These newer sensors do
not require an expensive meter and have facilitated the incorporation of soil moisture sensors
into irrigation control systems.
Despite the claims from some manufacturers, all sensors that rely on the dielectric properties
of soils benefit from a soil specific calibration. There are large enough differences in the
dielectric properties of different types of soils to affect the measured dielectric of the soil. This
becomes especially critical if such sensors are used in soils with high organic matter content,
high salinity, or in soilless, highly porous substrates used in horticulture (e.g. Crespo and van
Iersel, 2011).
10
Matric potential sensing
Matric potential of the soil is most commonly measured using tensiometers. Tensiometers
measure soil matric potential (suction) directly, and the data do not depend on soil type or
texture. No soil specific calibration is needed. Tensiometers do require routine maintenance,
because they contain water which needs to be replenished on a regular basis. Tensiometers
only measure matric potential within a fairly limited (wet) range, but this is generally adequate
for irrigation in horticultural or agronomic applications.
A different approach to sensing matric potential is the use of gypsum blocks or Watermark
sensors. These sensors have a matrix that can absorb and desorb water in response to changes
in soil matric potential. The electric resistance of this matrix changes as the amount of water in
the matrix changes, and the electrical resistance is measured and then converted to a soil
matric potential. Gypsum blocks have the disadvantage that they gradually dissolve over time,
which led to the development of the Watermark sensor, which does not have this problem.
Because the electrical resistance of the matrix does not only depend on water content but also
on dissolved ions, these sensors tend to be sensitive to changes in soil electrical conductivity,
and thus fertility and salinity.
More recently, hybrid sensors have been developed that apply the principle of dielectric
sensors to determine matric potential. A dielectric sensor is embedded with a ceramic material
(matrix) and the matric potential of this ceramic material equilibrates with the matric potential
of the surrounding soil. The dielectric sensor is then used to measure the dielectric of the
ceramic material and this value is then converted to a soil matric potential.
Soil Salinity
Salinity measurements are important in irrigation methods, because irrigation not only serves
to apply water to a crop, but also plays a critical role in the prevention of salt build up in the soil.
Salinity levels in soils are generally determined from the ability of a soil to conduct electricity
(electrical conductivity or EC), which can be expressed in dS/m or mS/cm (those units are
equivalent).
The most accurate methods of determining soil salinity are lab-based tests, where soil samples
are collected and sent off to an analytical lab for analysis. It is important to note that different
labs may use different methods to measure salt concentrations in the soil, and that results from
different labs may thus not be comparable. The most common methods are the saturated soil
extracted and 1:2 and 1:5 dilution technique. Dilution techniques results in lower values than
the SSE method when equal amounts of soils are present.
11
Soil EC can also be determined from the dielectric properties of soils, which makes it possible
for techniques like TDR to measure both soil water content and EC simultaneously (Dalton and
van Genuchten, 1986). Likewise, the EC of soils can be measured using electrodes inserted in
the soil and measuring the conductance (the inverse of resistance) of the soil. One drawback to
both of these methods is that they measure a property referred to as the bulk soil EC, or the
ability of the combination of soil particles, air spaces, and the soil solution to conduct electricity.
This property has little practical value, since it is difficult to convert that value to either the total
amount of salts present in the soil (which is critical for salinity management) or the EC of the
soil solution (which determines the physiological responses of plants to salinity. Although
models have been proposed for converting bulk soil EC to solution EC (e.g. Hilhorst, 2000),
there are questions about the accuracy of the various methods. Advances in our ability to
measure soil EC could have great benefits for our ability to manage both salinity and fertilizer
applications.
Sensing Plants
Many different approaches to sensing plant water status have been used, and this is just a
selection of the many methods available. The goal of sensing plant water status is to determine
whether the plant is under stress and thus needs water. This also goes to one fundamental
weakness of any plant-based sensing method: by the time a stress can be detected,
productivity likely has been lost already. That may not matter in most landscape situations, but
in horticultural and agronomic applications, where maximizing yield is an important goal, plant-
based methods may result in yield losses.
Sap flow
Different methods for measuring the flow of xylem sap through plants have been used and
tried for irrigation control. The most common methods are the heat balance method (where a
small part of stem is heated and the heat balance of the stem is calculated) and the heat pulse
method (where needles inserted in the stem are heated and the heat dissipation is measured).
These methods can give accurate information about sap flow through the plants, but the data
can be difficult to use for automated irrigation management. Sap flow not only depends on the
availability of water in the soil, but also on the weather conditions, and health of the plants.
Thus, a decrease in sap flow may not indicate the need for irrigation, but could simple be due to
clouds passing over. This makes automation based on these data difficult, but the results still
provide valuable insights into the water dynamics of the crop.
Leaf temperature
A simple method to get an indication of the level of drought stress a crop is exposed to is to use
of leaf or canopy temperature data and to determine how this differs from air temperature.
12
Measuring leaf (or canopy) and air temperature can be used to calculate a crop water stress
index (CWSI). Irrigation decisions are based on canopy foliage and air temperature under given
meteorological conditions in comparison with canopy foliage temperature of a well-watered
crop. This approach requires an infrared thermometer - a hand-held or remotely mounted
device that can measure canopy temperature. This approach is based on the principle that
transpiration cools the canopy and a well-watered canopy, therefore typically has a
temperature lower than the air temperature, while a drought stressed canopy typically will
have a higher temperature than the air.
The CWSI is calculated as:
(Tf - Ta) - (Tf* - Ta)
CWSI = --------------------------- , where
(Tf - Ta)max - (Tf* - Ta)
Tf - Ta = Foliage-air temperature difference of crop in question
Tf* - Ta = Foliage-air temperature difference of well-watered crop under same
environmental conditions.
(Tf - Ta)max = Foliage-air temperature difference when crop is maximally stressed
(transpiration = 0) under same environmental conditions.
The CWSI is therefore a unitless number between 0 and 1, giving a “relative” indication of stress
level. A value of 0 indicates that the crop is not water stressed at all, while a value of 1 indicates
the maximum stress level.
Leaf wetness
Leaf wetness sensors determine are designed to mimic leaves and measure when and for how
long the leaves are wet. This is particularly important for the prevention of a variety of foliar
diseases, since certain pathogens require liquid water on the leaf surfaces to complete their life
cycle. Leaf wetness can thus be used to help determine how different irrigation schedules may
impact disease development. Two types of leaf wetness sensors are commonly used: a) sensors
that measure the electrical resistance along the outer surface of the sensor. These sensors
normally have two electrodes that form a grid throughout the sensor and the resistance
between those two sensors is measured. When the sensor is wet, the water will conduct
electricity and the resistance drops. The other type of leaf wetness sensor takes advantage of
the dielectric properties of water and is essentially a modified soil moisture sensor. Rather than
measuring soil water, these sensors simply measure the presence of water on the surface of the
sensor. Both types of leaf wetness sensor are sensitive to dirt accumulation and should be kept
clean.
13
Remote sensing
The crop water status can be determined using spectral reflectance measurements. When light
hits a leaf, there are three possible fates for any particular photon (light particle): it can be
absorbed by the leaf (pigments), reflected, or transmitted. Light reflectance can change
dramatically when plants are exposed to drought stress, especially in the near infra-red part of
the spectrum (just above 700 nm and not visible to the human eye). By measuring the
reflectance of light of different wavelengths [normally red (R) and near infra-red (NIR)], a ratio
can be calculated that indicates the stress level of the plant or crop. Among the ratios being
used are:
- The normalized difference vegetation index or NDVI = (NIR-R)/(NIR +R)
- The ratio vegetation index or RVI = NIR/R
Neither index is a direct indicator of drought stress; other factors, and especially how much of
the plant canopy covers the soil, affect these indexes as well. Thus, these indexes do not have
some magical threshold below which the crop needs water; instead it is important to look at
changes in the values of these indexes over time.
Many other methods of remote sensing have been used for irrigation control. For a more
comprehensive overview of remote sensing techniques, see Bastiaanssen (1998).
Sensing the Irrigation System
Sensors are not only useful to determine when and how much to irrigate, but also play an
important role in checking the performance of the irrigation system and can be used to detect
maintenance problems. The two most useful things to measure are flow rate and water
pressure.
Flow meters
Flow meters should be part of any commercial irrigation systems. Not only do they provide a
record of water use, they also can be used for trouble shooting purposes, such as leak detection.
There are many flow meters available that can easily be incorporated into larger sensor
networks. The most common flow meters have a paddle wheel that rotates faster as the flow
rate increases, but many other technologies are available as well.
Water pressure
Measuring the water pressure in the irrigation system is valuable for leak detection (since leaks
can reduce water pressure), but also to assure that there is adequate pressure for proper
operation of the irrigation system. A lack of pressure is especially common in large irrigation
systems that use multiple valves. If too many irrigation valves open at once, water pressure
may be too low for the irrigation system to irrigate properly.
14
Conclusions
Sensing environmental and other conditions can provide information that can be used to
greatly increase the efficiency of irrigation systems. It is important to realize that sensors can be
used to collect large amounts of data, but these data have little value with efficient ways to
collect, store and process them. First of all, for large scale sensing, appropriate hardware is
needed. An example of the development of the hardware needed for wireless sensor networks
is described by Kantor et al (2012). Along with this hardware a software interface (or graphical
user interface is needed to present the data has in such a way that it is converted into usable,
actionable information (see Kohanbash and Kantor, 2012). Our group has successfully used
newly developed hardware and software for on-farm irrigation scheduling (Chappell and van
Iersel, 2012, Lea-Cox and Belyaneh, 2012). Irrigation can be based on soil/substrate water
content measurement or on models that predict crop water use (e.g., Kim, 2012). A survey of
the greenhouse and nursery industry has shown that there is widespread interest in the use of
sensor networks for irrigation monitoring and control (Majsztrik et al, 2012) and this may help
move the industry from irrigation practices that rely heavily on qualitative indicators of crop
water needs to more quantitative methods. We have already seen that such a switch to more
quantitative irrigation methods can help save large amounts of water (van Iersel, et al, 2009)
and increase growers profits (Chappell et al, 2012).
Acknowledgements
The author gratefully acknowledges support from the USDA-NIFA Specialty Crops Research
Initiative Award # 2009-51181-05768.
References
Allen, R.G., L.S. Pereira, D. Raes, M. Smith. 1989. Crop evapotranspiration
(guidelines for computing crop water requirements). FAO irrigation and drainage paper no. 56.
300 pp.
Bastiaanssen, W.G.M. 1998. Remote sensing in water resources management: the state of the
art. Colombo, Sri Lanka: International Water Management Institute. 118 pp.
Bauerle, W.L. and J.D. Bowden. 2011. Separating foliar physiology from morphology reveals the
relative roles of vertically structured transpiration factors within red maple crowns and
limitations of larger scale models. J. Exp. Bot. 62(12): 4295–4307.
Chappell, M., M. van Iersel, E. Lichtenberg, J. Majsztrik, P. Thomas, J. Ruter, and S. Wells. 2012.
Benefits of precision irrigation of Gardenia augusta ‘Heaven Scent’™: reducing shrinkage,
shortening the cropping cycle, and economic impact. Proceedings of the SNA research
conference 57:321-323.
15
Chappell , M. and M.W. van Iersel. 2012. Sensor network deployment and implementation in
commercial nurseries and greenhouses. Irrigation Association. 4-5th November, 2012.
Orlando, FL.
Crespo, J. M. and M.W. van Iersel. 2011. Performance of a soil moisture sensor-based
landscape irrigation controller for automated irrigation of container-grown plants.
HortScience 46:889-894.
Dalton, F.N. and M.T. van Genuchten. 1986. The time-domain reflectometry method for
measuring soil water content and salinity. Geoderma 38:237-250.
Hilhorst, M.A. A pore water conductivity sensor. Soil Sci. Soc. Amer. 64:1922-1925.
Jones HG. 2004. Irrigation scheduling: advantages and pitfalls of plant-based methods. J. Exp.
Bot. 55: 2427-2436.
Jones HG. 2007. Monitoring plant and soil water status: established and novel methods
revisited and their relevance to studies of drought tolerance. J. Exp. Bot. 58:119-130.
Kantor, G., D. Kohanbash, and T. Martin. 2012. Next generation monitoring and control
hardware development. Irrigation Association. 4-5th November, 2012. Orlando, FL.
Kim, J. 2012. Developing and integrating plant models for predictive irrigation. Irrigation
Association. 4-5th November, 2012. Orlando, FL.
Kohanbash, D. and G. Kantor. 2012. Irrigation scheduling software development. Irrigation
Association. 4-5th November, 2012. Orlando, FL.
Lea-Cox, J.D. and Belyaneh, B.E. 2012 Irrigation complexities - using sensor networks for real-
time scheduling in commercial horticultural operations. Irrigation Association. 4-5th
November, 2012. Orlando, FL.
Majsztrik, J., E. Lichtenberg, and J. Lea-Cox. 2012. A National Perspective on Irrigation trends
and Sensor Network adoption in Ornamental Nursery and Greenhouse Operations.
Irrigation Association. 4-5th November, 2012. Orlando, FL.
van Iersel, M.W., S. Dove, J.G. Kang, and S.E. Burnett. 2010. Growth and water use of petunia as
affected by substrate water content and daily light integral. HortScience 45:277-282.
van Iersel, M., R.M. Seymour, M. Chappell, F. Watson, and S. Dove. 2009. Soil moisture sensor-
based irrigation reduces water use and nutrient leaching in a commercial nursery. Proc. SNA
Res. Conf. 54:17-21.