probing the benefits of soil moisture sensors - urnrd · probing the benefits of soil moisture...
TRANSCRIPT
Probing the Benefits of Soil Moisture Sensors
2016 Upper Republican NRD 1st Annual State of the Basin Water ConferenceMarch 25, 2016
Daran R. Rudnick, Ph.D.Assistant Professor: Irrigation Specialist
Department of Biological Systems EngineeringWest Central Research and Extension Center
University of Nebraska-LincolnPhone: (308) 696-6709, Email: [email protected]

Importance of IrrigationWhen precipitation and soil water storage in the crop root zone cannot supply the root system with enough water to meet crop evapotranspiration (ET) demand, irrigation is required.
Insufficient Irrigation can reduce:
• Total Biomass
• Grain Yield
• Grain Quality
• Net Return ($ per acre)
Excessive irrigation can result in:
• Runoff
• Soil Erosion
• Deep Percolation of Water (and Nutrients)
• Environmental Degradation
• Anaerobic Soil Conditions (Yield Penalty)
• Increased Pumping Cost (i.e., energy cost)

Concepts for Managing Irrigation with Soil Moisture Sensors

Soil Water Diagram for Irrigation
MAD: ManagementAllowable Depletion
Water Freely Drains
Crop Water Stress Occurs
Water NotAvailable to the Crop
Dry Soil
Saturation
Field Capacity
Trigger Point
Wilting Point

MAD: Management Allowable Depletion
• Lower limit of available soil water that the crop can use before water stress occurs.
• Taken as a percentage of available water holding capacity (AWHC)
• AWHC = Field Capacity – Permanent Wilting Point
• MAD is typically set at 45 to 50%; however, irrigation should be triggered earlier to allowthe system to complete the revolution prior to the last portion of the field dropping belowMAD.
Soil Type AWHC (in/ft) MAD @ 50% (in/ft)
Silt Loam 2.5 1.25
Sandy Clay Loam 2.0 1.00
Silty Clay Loam 2.0 1.00
Silty Clay 1.6 0.80
Sandy Loam 1.4 0.70
Loamy Sand 1.1 0.55
Fine Sand 1.0 0.50

Effective Rooting Depth
12 in 24 in18 in 36 in 48 in
Soil Depth Used for Scheduling Irrigation
Source: Irmak and Rudnick (2014)

Direct Measurement of Soil Water Content• The success of irrigation management is, in part, contingent upon the accuracy
of soil moisture data.
• Direct soil moisture measurements
• Labor intensive
• Time consuming
• Non-continuous in nature
• Soil Water Content (θv)
1. Remove known volume of soil
2. Dry Soil @ 221ᵒF until constant wt.
3. Calculate Vol. of Water Removed
4. 𝜃𝑣 =𝑉𝑜𝑙𝑢𝑚𝑒 𝑜𝑓 𝑊𝑎𝑡𝑒𝑟
𝐵𝑢𝑙𝑘 𝑉𝑜𝑙𝑢𝑚𝑒
Direct Measurement

Indirect Soil Moisture Monitoring Methods• Indirect methods measure a surrogate property and relate it to soil water
content or potential.
• Indirect methods
• Hand Feel
• Neutron Attenuation
• Capacitance
• Time Domain Reflectometry
• Frequency Domain Reflectometry
• Time Domain Transmissometry
• Electrical Resistance
• Tensiometers
• Thermal (i.e., Heat Dissipation)Estimated
Soil Water Status
Measure Variable“Surrogate”
Relationship(a.k.a. Conversion)

Some In-Situ Soil Moisture Sensor Companies

Soil Moisture Sensors & ETgage
Campbell Scientific CS616SWC
Campbell Scientific CS655SWC, Temp, & EC
MPS-2 or MPS-6 5TE EC-5
SWP & Temp SWC, Temp, & EC SWC
---------- Decagon Devices ----------
Stevens Hydra Probe IISWC, Temp, & EC
Acclima True TDRSWC, Temp, & EC
Irrometer WatermarkSWP
Irrometer TensiometerSWP
ETgage (Atmometer)Reference ET
Legend:SWP: Soil Water PotentialSWC: Soil Water ContentTemp: Soil TemperatureEC: Bulk Electrical Conductivity
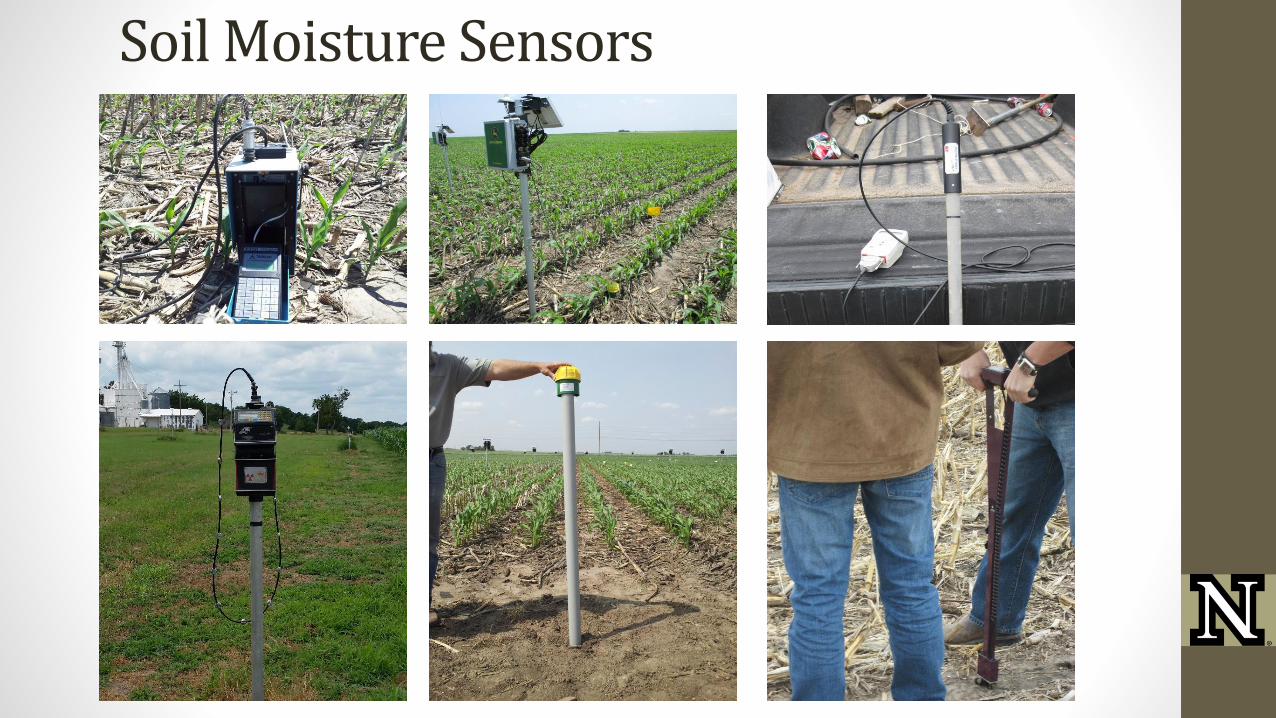
Soil Moisture Sensors

Hand Feel Method
• Summary:
• Viewing and feeling the soil to make an inference on soil water status to determine whether ornot irrigation is required. It is often the least accurate method, because it does not provide aquantitative assessment of soil moisture, but rather a subjective qualitative assessment.
• Description:
• Inexpensive
• Relies on the ability of a user to view and feel the soil
• Challenging when working with layered soils or different soil types due to differences in soil properties
*Not Recommended*

Neutron Attenuation
• Summary:
• Most accurate indirect soil moisture sensor available. Comprised of a neutron source anddetector, which are lowered into access tubes. The source emits fast neutrons, approx. 17,000neutrons per second, where they collide with hydrogen atoms (water) in the soil and slow downenough to be counted by the detector.
• Description:
• Highly accurate
• Not affected by temperature and salinity, but influenced by OMC, clay content, soil texture, & chemical elements
• Field calibration still recommended
• Radioactive source: Requires training, licensing, & safety measures when handling, storing, and transporting
• Expensive (> $10,000)

Neutron Attenuation
Probe 1NG = 1.0627 (GV) - 0.0082
R² = 0.92
Probe 2NG = 1.093 (GV) - 0.0231
R² = 0.93
Probe 3NG = 1.0933 (GV) - 0.0173
R² = 0.93
Probe 4NG = 1.0104 (GV) - 0.0115
R² = 0.93
0.00
0.05
0.10
0.15
0.20
0.25
0.30
0.35
0.00 0.05 0.10 0.15 0.20 0.25 0.30 0.35
Cal
ibra
ted
Neu
tro
n G
auge
(θ
v, in
3 in
-3)
Measured Soil Water Content (θv, in3 in-3)
Probe 1
Probe 2
Probe 3
Probe 4
1:1 Line

Electrical Resistance Sensors
• Summary:
• Comprised of two non-connecting electrodes imbedded in a porous media (usually gypsum). Acurrent is applied across the electrodes, which is affected by water content (θv); as θv increases,resistance decreases. The sensor outputs a voltage that is proportional to the resistance in theporous medium, which is converted to soil matrix potential via a calibration equation.
• Description:• Relatively low cost & easy to use/install
• Reports “tension” not “water content”
• Requires good soil contact• Some issues with high sandy soils at high
tensions or swelling clays
• Minor Temperature effects• Tension decreases by 1% for each 1ᵒF
increase above 70ᵒF & vice versa
• Response Time (potential lag)
• Hysteresis Effects (i.e., wetting and drying curves are not the same)
Watermark Gypsum Blocks

Hysteresis Effects: Wetting versus Drying Cycles
Drying Cycle: Previous 3 days experienced no precipitation and/or irrigation
Wetting Cycle: Previous 3 days experienced precipitation and/or irrigation
Drying
y = 3E-06x2 - 0.0012x + 0.381
R² = 0.74Wetting
y = 1E-05x2 - 0.0023x + 0.3835
R² = 0.71
0.20
0.25
0.30
0.35
0.40
0.45
0 25 50 75 100 125 150 175 200
Vo
l. W
ate
r C
on
ten
t θ
v, in
3 in
-3
Watermark Ψm, cb
Drying
Wetting
Drying
y = 2E-06x2 - 0.0008x + 0.344
R² = 0.71
Wetting
y = 2E-06x2 - 0.0008x + 0.3397
R² = 0.63
0.20
0.25
0.30
0.35
0.40
0.45
0 25 50 75 100 125 150 175 200
Vo
l. W
ate
r C
on
ten
t θ
v, in
3 in
-3
Watermark Ψm, cb
Drying
Wetting
Depth: 1 foot Depth: 3 foot
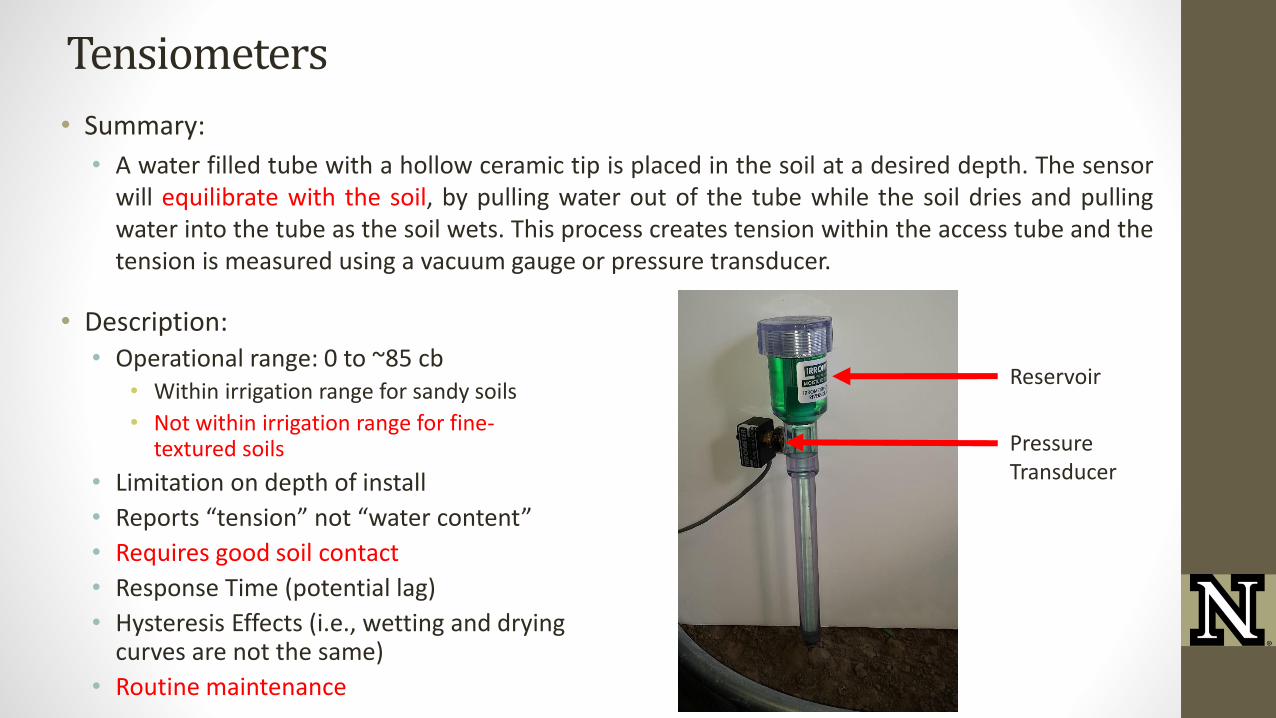
Tensiometers
• Summary:
• A water filled tube with a hollow ceramic tip is placed in the soil at a desired depth. The sensorwill equilibrate with the soil, by pulling water out of the tube while the soil dries and pullingwater into the tube as the soil wets. This process creates tension within the access tube and thetension is measured using a vacuum gauge or pressure transducer.
• Description:• Operational range: 0 to ~85 cb
• Within irrigation range for sandy soils
• Not within irrigation range for fine-textured soils
• Limitation on depth of install
• Reports “tension” not “water content”
• Requires good soil contact
• Response Time (potential lag)
• Hysteresis Effects (i.e., wetting and drying curves are not the same)
• Routine maintenance
Reservoir
PressureTransducer
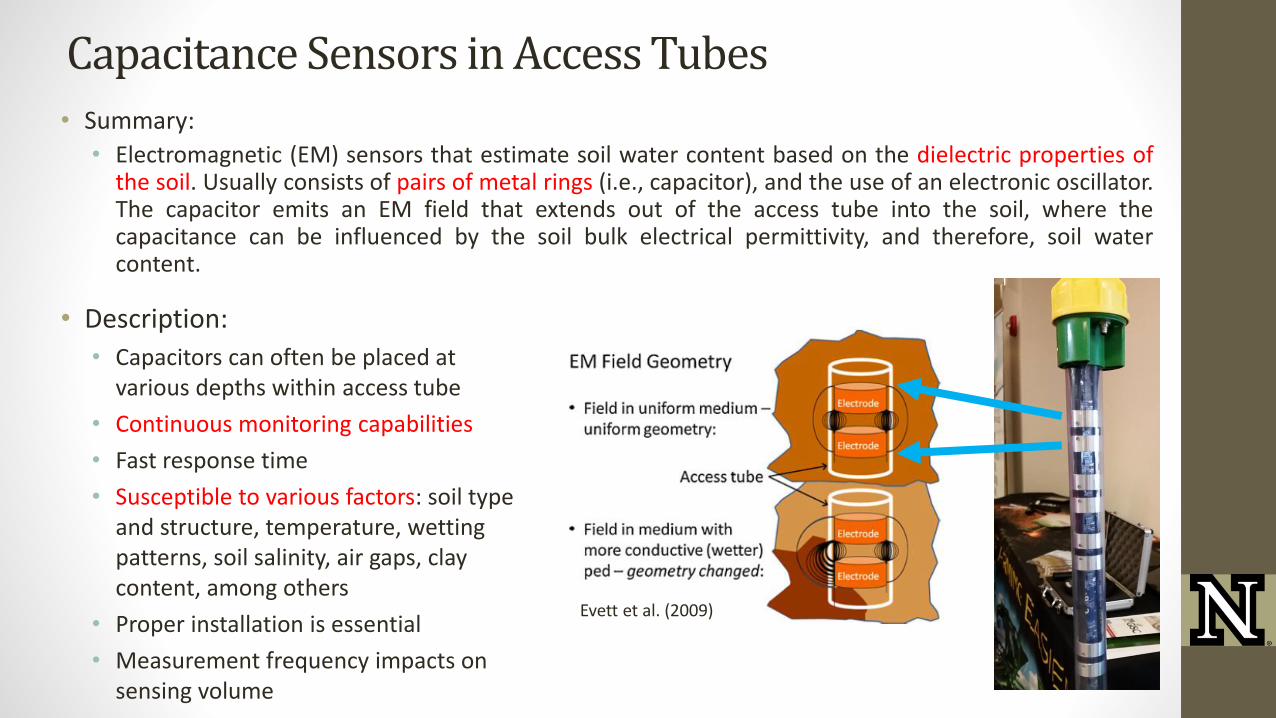
Capacitance Sensors in Access Tubes• Summary:
• Electromagnetic (EM) sensors that estimate soil water content based on the dielectric properties ofthe soil. Usually consists of pairs of metal rings (i.e., capacitor), and the use of an electronic oscillator.The capacitor emits an EM field that extends out of the access tube into the soil, where thecapacitance can be influenced by the soil bulk electrical permittivity, and therefore, soil watercontent.
• Description:
• Capacitors can often be placed at various depths within access tube
• Continuous monitoring capabilities
• Fast response time
• Susceptible to various factors: soil type and structure, temperature, wetting patterns, soil salinity, air gaps, clay content, among others
• Proper installation is essential
• Measurement frequency impacts on sensing volume
Evett et al. (2009)

Greater Fluctuations in Soil Temp near Surface
0
5
10
15
20
25
26-M
ay
15-J
un
5-J
ul
25-J
ul
14
-Aug
3-S
ep
23-S
ep
Soil
Tem
per
atu
re, ⁰C
Date
0.30 m
1.0 m
77
68
59
50
41
32
Soil
Tem
pe
ratu
re, ᵒ
F

Factory Calibration Equations
• Factory calibrations are often performed under controlled laboratory conditions, which are notalways representative of field conditions. The derived factory calibration equations (oftenimbedded into the sensor electronics) are typically developed by pooling a range of soil typestogether and fitting and/or parameterizing the curve. More recently, soil specific curves arebeing developed to improve performance of factory calibrations.
• Since “indirect” soil moisture sensors can be affected by influencing factors, such as soiltemperature and soil physical and chemical properties, the manufacturer supplied calibrationequations may not be suitable for all settings. Depending on sensor type and location thefollowing are possible:
1. The manufacturer calibration is appropriate and no adjustments are needed
2. A site-specific calibration can be performed to correct the manufacturer calibration
3. Additional sensors (e.g., temperature) are needed to adjust sensor output
4. The sensor is not appropriate for the location and a different sensor technology shouldbe adopted

Overview of Factors Effecting Sensor Performance
Sensor Technology:
• Sensing Volume (Related to soil)
• Sensor Spacing (Vertical)
• Response Time
• Operational Range and Frequency
Soil and Climate Related:
• θv Range
• Salinity
• Ion Concentration
• Soil Temperature
• Particle Size Distribution
• Soil Layering
• Wetting and Drying Cycles
Field Calibration:
• Sensor technologies will not necessarily respond the same to the aforementioned
• Spatial and temporal variability of influencing factors, can require separate calibrations
• Soil layers closer to the surface can experience greater fluctuations in soil temperature
and water content; which may consequently result in greater error if un-adjusted as
compared to lower soil depths

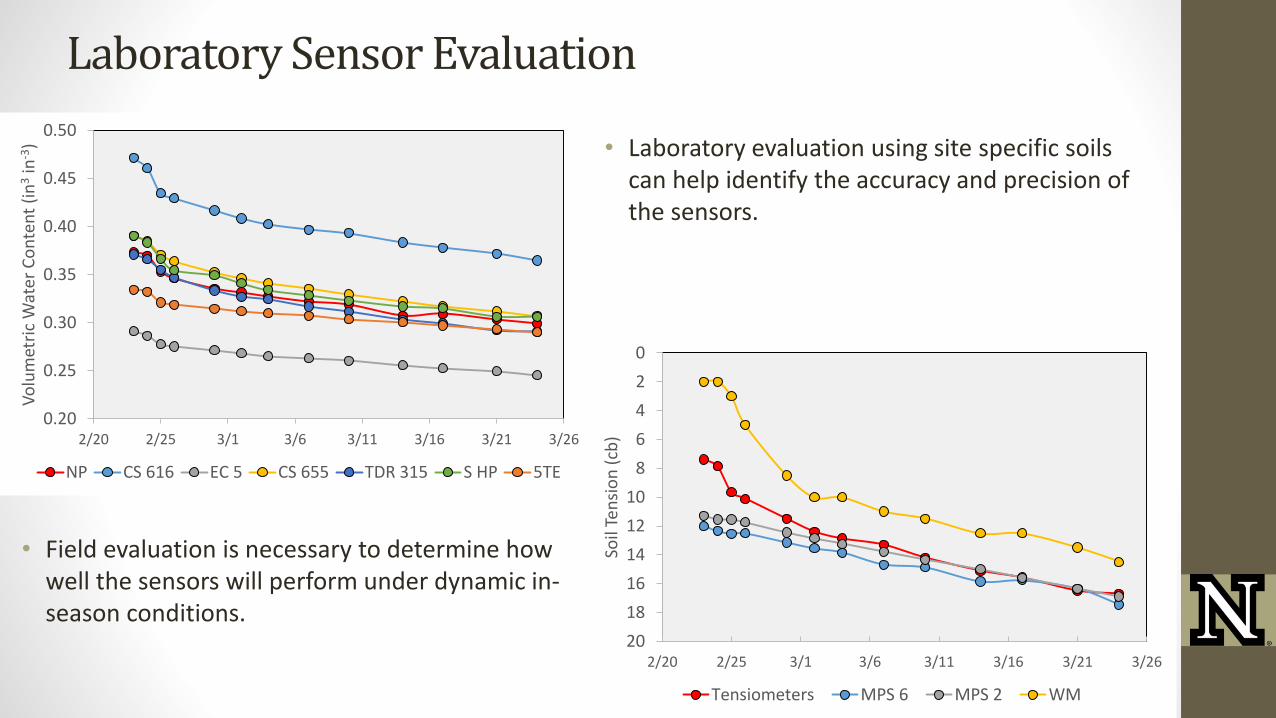
Laboratory Sensor Evaluation
Laboratory Sensor Evaluation
0.20
0.25
0.30
0.35
0.40
0.45
0.50
2/20 2/25 3/1 3/6 3/11 3/16 3/21 3/26
Vo
lum
etri
c W
ater
Co
nte
nt
(in
3in
-3)
NP CS 616 EC 5 CS 655 TDR 315 S HP 5TE
0
2
4
6
8
10
12
14
16
18
202/20 2/25 3/1 3/6 3/11 3/16 3/21 3/26
Soil
Ten
sio
n (
cb)
Tensiometers MPS 6 MPS 2 WM
• Field evaluation is necessary to determine how well the sensors will perform under dynamic in-season conditions.
• Laboratory evaluation using site specific soils can help identify the accuracy and precision of the sensors.

In-Field Sensor Comparison
Irrometer Watermark
Delta-T PR1-C Probe
Troxler 4302 Neutron Gauge
John Deere Capacitance Probe

In-Field Sensor Evaluation

Field Calibration can Improve Sensor Performance
Root Mean Square Error (RMSE)
Unadjusted: 0.066 in3 in-3
Adjusted: 0.043 in3 in-3
0.1
0.2
0.3
0.4
0.5
0.1 0.2 0.3 0.4 0.5
JD
Θv, in
3 in
-3
Neutron Gauge Θv, in3 in-3
0.30 m
2013: Calibrated
1:1 Line
0.1
0.2
0.3
0.4
0.5
0.1 0.2 0.3 0.4 0.5
JD
Θv, in
3 in
-3
Neutron Gauge Θv, in3 in-3
0.30 m
2013: Un-calibrated
1:1 Line

Things to Consider When Selecting Soil Moisture Sensors

Select
Sensor
• Convenience
• Financial Cost
• Remote Access
• Sensor Accuracy
• Product Support
• Soil Type & Condition
• How Many are Needed
• Crop Type and Rooting Depth
• Integration with Other Sensors
Pros vs Cons
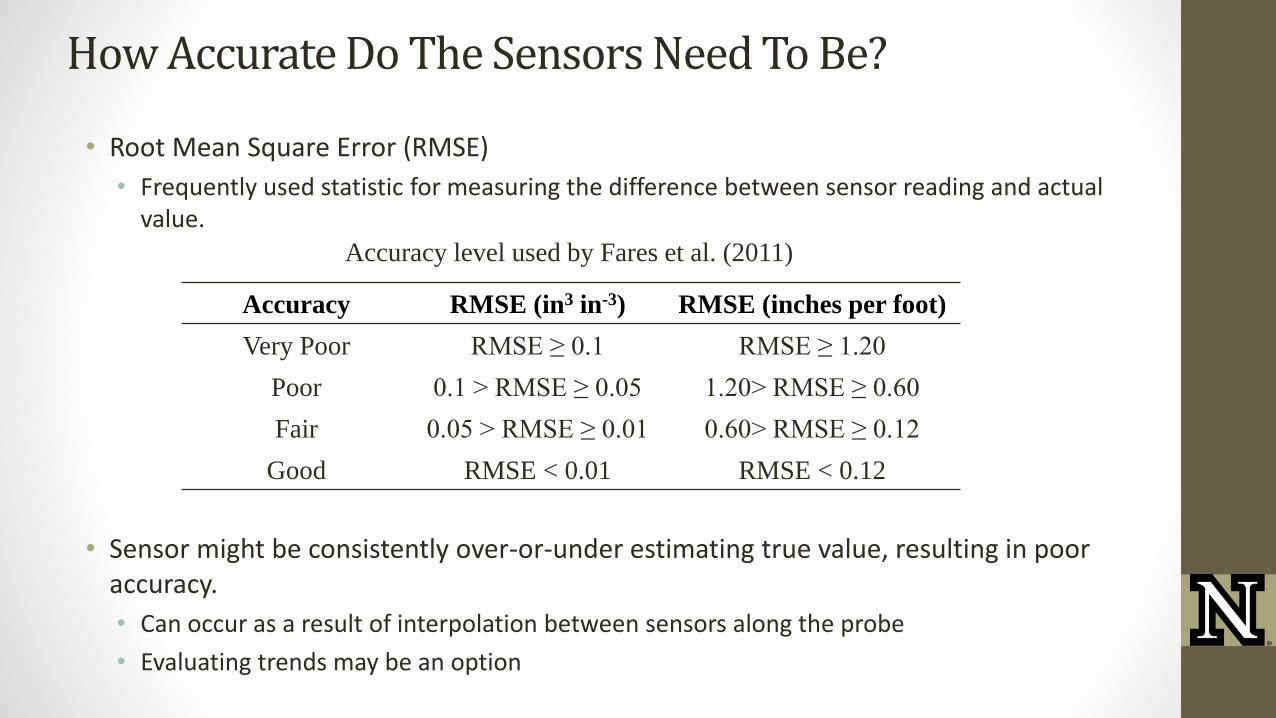
How Accurate Do The Sensors Need To Be?
• Root Mean Square Error (RMSE)
• Frequently used statistic for measuring the difference between sensor reading and actual value.
Accuracy RMSE (in3 in-3) RMSE (inches per foot)
Very Poor RMSE ≥ 0.1 RMSE ≥ 1.20
Poor 0.1 > RMSE ≥ 0.05 1.20> RMSE ≥ 0.60
Fair 0.05 > RMSE ≥ 0.01 0.60> RMSE ≥ 0.12
Good RMSE < 0.01 RMSE < 0.12
Accuracy level used by Fares et al. (2011)
• Sensor might be consistently over-or-under estimating true value, resulting in poor accuracy.
• Can occur as a result of interpolation between sensors along the probe
• Evaluating trends may be an option

Effective Rooting Depth and Water Uptake Patterns
Sugar Beet
Small Grains
Soybean
Maize
Alfalfa
Dep
th (
cm)
• Crops have different root architecture (e.g., density and depth), which can affect water and nutrient availability and uptake
• Consequently, soil moisture will have to be monitored at different depths.
Source: www.FAO.orgSource: Irmak and Rudnick (2014)

Sensor Installation Depth should Coincide with Effective Rooting Depth

Individual Sensors can Show Root Activity
20 inch
40 inch
12 inch
8 inch
4 inch

Managing Trends Can Improve Irrigation Management
0
2
4
6
8
10
12
14
16
18
20
6/19 7/9 7/29 8/18 9/7 9/27
Tota
l Wat
er (
inch
es)
Field Capacity
Refill Point
Wilting Point

Integrating Sensors
Weather Station Parameters:
• Soil Moisture
• Daily Moisture Change
• Battery Voltage
• Solar Radiation
• Rain Gauge
• Leaf Wetness
• Air Temperature
• Relative Humidity
• Wind Speed & Direction
Calculated Values:
• Daily Reference ET
• Growing Degree Days

Example: John Deere Field Connect User Interface

How Many Sensors Do I Need?
• Uniform Irrigation• Ideally 2 sets of sensors
• 1 set at start of revolution and 1 set atend of revolution
• Management Zones• Ideally 2 sets of sensors per zone

Soil Type: Web Soil Survey (websoilsurvey.nrcs.usda.gov)

Field Soil Spatial Variability
24 – 36 in
12 – 24 in
0 –12 in
36 – 48 in
48 – 60 inAvailable Water Capacity, mm
0 – 12 in
12 – 24 in
24 – 36 in
36 – 48 in
48 – 60 in

Soil Physical and Chemical Properties
• Apparent Electrical Conductivity (ECa)• Easy to measure and relatively low cost
• Indirect indicator of important soil physical and chemical characteristics
• Some Factors impacting ECa
• Clay content and mineralogy
• Soil salinity
• Cation exchange capacity
• Soil pore size distribution
• Temperature
• Organic matter content
• Soil moisture content
Source: Rudnick and Irmak (2014)

Financial Cost, Convenience, and Support
• How much are the sensors?
• Is there a yearly subscription fee?
• Will someone install and remove the sensors?
• Do I have to purchase the installation equipment?
• Does the sensor have remote access for easy monitoring?
• Is there local product support incase the sensor malfunctions?
• Are there Cost Share or Leasing Opportunities• Natural Resource Districts
• NRCS

Thank You!
The mention of trade names or commercial products in and during this presentation does not constitute an endorsement or recommendation for use by the University of Nebraska-Lincoln or the author.