integrated_solution of emulsion evaluatio by logs
TRANSCRIPT

SAUDI ARAMCO JOURNAL OF TECHNOLOGY WINTER 2013 55
ABSTRACT fluid velocity (shearing of the oil-water mixture), pressure,temperature, fluid viscosity or any combination of these factors.
These downhole emulsions not only cause pressure drop inthe wellbore and a decline in well productivity, an increase indemulsifier usage, the production of off-spec crude, and occa-sionally, equipment problems in the production station1, butwill also dispute the estimation of the reservoir properties (per-meability, thickness and skin) during testing of these off-speccrude oil wells, which can have significant impact on reservoirevaluation. Inflow profiling of emulsion wells is another majorchallenge, where the standard holdup measurement arrays failto distinguish between water and oil phases.
This article discusses the following:• The theory of downhole water-in-oil emulsion.• The background on tools used to diagnose downhole
emulsions: the multiphase production logging tool (MPLT) and the pulsed neutron logging tool (PNLT).
• The workflow and methodology to diagnose these emul-sions downhole and how to obtain accurate quantification of the downhole zonal oil and water flow contributions using a combination of the MPLT and PNLT.
• Application of the optimized workflow to field examples for successful diagnosis of the emulsion, assessment of theintegrated logging solution used to overcome this chal-lenge in horizontal wells and determination of the root causes of these emulsions in the subject field.
THEORY OF WATER-OIL EMULSIONS
An emulsion is a mixture of two or more liquids that are nor-mally immiscible, such as water and oil, Fig. 12, 3. To form anemulsion, one liquid, present in the form of droplets, must becontinuously dispersed in the other liquid. Depending onwhich liquid is in droplet form, it is named as oil-in-water orwater-in-oil emulsion4. The emulsion discussed in this article iswater-in-oil emulsion, where water is present in the form ofdroplets dispersed in oil.
Emulsion stability refers to the ability of an emulsion toresist change in its properties over time. The stability of anemulsion can be characterized using several techniques, such aslight scattering, centrifugation and rheology. Emulsions can be classified into two types based on their stability: (1) an
Although various logging challenges in highly deviated andhorizontal wells have been addressed in many previous studies,only a few investigations have focused on emulsion diagnosisand multiphase production log (MPL) solutions in such difficultconditions. The emulsion discussed in this article is a water-in-oil emulsion, in which water is present in the form of dropletsdispersed in oil. This is generally expected to happen in a highvelocity, turbulent flow regime, and in a low density contrastbetween oil and water. The logging challenge presented by water-in-oil emulsion is the inability to identify and quantifywater entries using the standard holdup measurement arrays,because the water droplets have the same conductivity as oil andtravel at the same velocity as oil, regardless of well deviation.
A novel workflow and methodology were established forsuccessful diagnosis of this emulsion downhole to enable in-flow profiling of these problematic wells using informationfrom different sources of data: the multiphase production log-ging tool (MPLT), the pulsed neutron logging tool (PNLT) andsurface fluid sampling. The workflow includes job preparation,real-time monitoring during logging operation and post-jobdata interpretation.
The optimized workflow was applied to field examples forsuccessful diagnosis of the emulsion and assessment of the inte-grated logging solution to overcome this challenge in horizon-tal wells. This led to the determination of the downhole flowprofile with high confidence, and to the accurate quantitativeidentification of the source of water production. This informa-tion can then be used to plan suitable well intervention, with-out which the reservoir and/or field development could not beoptimized.
INTRODUCTION
Emulsions of crude oil and water can be encountered along theproduction chain, from the reservoir and wellbore to the flowlines and surface facilities. Emulsions occurring downhole inthe wellbore are probably due to the presence of emulsifyingagent(s) derived from the oil itself (asphaltenes, waxes, inor-ganic solids, etc.) or from the producing formations (clay,brine, etc.), and they are governed by a change in water cut,
Integrated Solution for Emulsion Diagnosisin Horizontal Production Logs
Authors: Nawawi A. Ahmad, Nedhal M. Al-Musharfi, Zouhir Zaouali, Mustafa A. Bawazir and Hussain S. Al-Shabibi

56 WINTER 2013 SAUDI ARAMCO JOURNAL OF TECHNOLOGY
unstable/temporary emulsion, which separates naturally after ashort time (through gravity means, difference in density, etc.), and(2) a stable emulsion, which needs special treatments to separatethe two liquids (e.g., chemical, electrical or heat treatments).
INFLOW PROFILING OF MULTIPHASE HORIZONTALWELLS
In a multiphase flow system, buoyancy due to well deviationcauses the fluid to separate into different phases with a mixinglayer in between. Gravity ensures that the lighter phase fluidtravels at a faster speed than the heavier phase fluid in wellswith deviation less than 90°, and vice versa in wells with deviation above 90°.
Biphasic experiments were carried out in a controlled flowloop with equal flow rates for oil and water to show the dra-matic effects of borehole deviation on flow behavior, Fig. 2. At90° deviation, the velocities and holdups of oil and water arenearly equal. At a deviation lower than 90° (uphill), water
(heavier phase) slows down, and the oil velocity increases,which means the water holdup increases while the oil holdupdecreases. At well deviation above 90° (downhill), flow is stillpredominantly stratified. The water flows much faster than theoil because of its higher fluid density, so the water holdup nowdecreases while the oil holdup increases.
In these complex conditions, the MPLT, Fig. 3, is used tomeasure the velocity profile along the transverse diameter ofthe wellbore. It provides measurements of mixed and segre-gated flow regimes and detects downhole water recirculation5.
PULSED NEUTRON LOGGING TOOL
The PNLT is a combined pulsed neutron capture and pulsedneutron spectroscopy logging tool capable of evaluating oilsaturation in a wide range of environments, Fig. 4. The PNLThas also been developed for use in production logging applica-tions. This includes the three-phase holdup log and the waterflow log measurements.
The three-phase holdup log is a technique for measuring theholdup of water, oil and gas phases in the borehole using theslim 111⁄16” PNLT. This technique was developed especially forhorizontal wells where the wellbore fluids tend to segregate,but it can also be applied in vertical wells. The three-phaseholdup log uses the yields-based carbon/oxygen ratios from thenear and far detectors that are primarily sensitive to oil andwater6 and a net inelastic — capture background removed —count rate ratio between the detectors for providing informa-tion about borehole gas, Fig. 5.
The water flow log is based on neutron activation of oxygen.The basic principle involves the activation of oxygen atoms of themoveable water in the vicinity of the PNLT tool and measuringthe subsequent released gamma rays on the PNLT detectors thatare mounted downstream of the neutron source7. Measuring thetime from the neutron source to the peak of the detector signaland using the distance from the pulsed neutron generator to thedetector allows a velocity to be computed, Fig. 6.
NOVEL WORKFLOW FOR HORIZONTAL WELLS WITHDOWNHOLE WATER-OIL EMULSIONS
Emulsion occurring downhole in the wellbore has been ob-served in many types of completions (open hole and casedhole, and those with inflow devices, perforations, screens, etc.).
Fig. 1. Thin film slide and wellhead sample (water and oil).
Fig. 2. Flow loop experiment for oil and water flow.
Fig. 3. Typical MPLT string run in horizontal wells.

Inflow profiling of biphasic oil and water flow in horizontalwells is, by itself, a challenge for conventional production log-ging tools. The existence of emulsion adds another complica-tion to this challenge. Failure to detect this emulsion duringproduction logging would lead to redoing the job, which canbe very costly in horizontal wells.
The workflow, Fig. 7, developed based on local experiencegives insights into job planning and job execution, and enableslog analysts, field engineers and job operator witnesses to actand respond in a timely manner. This workflow was createdafter encountering emulsion in several wells in the field. It canbe applied in horizontal wells where emulsion is already takingplace or in wells where emulsion has never been observed inthe field.
The workflow is summarized as follows.
Job Planning
1. Meet with all parties to discuss job objectives, the logging procedure and the required equipment, highlighting the following:
a. If emulsion is expected, get agreement to run the MPLT and PNLT in a single run.
b. If emulsion is not expected, get agreement whether the PNLT is required on-site or not.
c. If flow behind the pipe or casing leak detection is required, ensure the required logging interval is mentioned in the logging program.
2. Get relevant well information to ensure effective data acquisition, such as well history, completion detail, open hole and cased hole data (logs, images) and deviation data.
3. Perform conveyance simulation modeling to determine the conveyance method and limitation at the reached depth.
4. Get agreement from well services personnel and operators that the well is cleaned properly before running in hole.
5. Get agreement that the surface rate measurement shows a water rate sufficient to be detected by the tool.
6. Take extra measures if high temperatures, hydrogen sulfide or carbon dioxide is present in the wellbore.
7. Get agreement on the action point if the well is dead or stops flowing.
8. Revise the logging program if any issue(s) were identified during the pre-job discussion.
REAL-TIME MONITORING DURING LOGGING OPERATION (JOB EXECUTION)
Real-Time Quality Checks
1. The field engineer is to hold a meeting at the wellsite to ensure the well is free of debris.
2. The field engineer is to follow the logging procedure and send data regularly to the log analyst for a quality check.
3. The log analyst is to be fully involved during data acquisi-tion and to do a quick analysis at every relevant survey.
4. Additional passes or repeat passes can be performed, as required.
5. If unexpected issues arise (existence of emulsion in bore-hole, existence of cross flow, etc.), the engineer and analyst are to communicate with base/senior personnel.
6. The necessity to change the logging program must be agreedupon with the base or senior personnel.
Real-Time Follow-up
1. Answer the main follow-up questions:a. Is the objective achieved?b. Is an additional tool required?
2. Get cooperation with relevant parties to ensure the logging objective is achieved.
3. Integrate the MPLT result with other dynamic and static
Fig. 4. PNLT.
Fig. 5. Three-phase holdups determination from PNLT.
Fig. 6. Water flow log acquisition from PNLT.
SAUDI ARAMCO JOURNAL OF TECHNOLOGY WINTER 2013 57

Fig. 7. Novel workflow for horizontal wells with downhole water-oil emulsions.
58 WINTER 2013 SAUDI ARAMCO JOURNAL OF TECHNOLOGY

data to properly understand the log result (e.g., well test result).
4. If the well has emulsion, proceed with the emulsion diagnostic steps (below) for better diagnosis.
Emulsion Diagnostics
1. Water is usually seen by electrical probes at the toe section, if the cumulative flow is quite low, and starts to disappear while moving to the heel section, where the cumulative rate increases. To confirm the existence of emulsion at this section, the electrical probe response must be coupled with readings from the minispinners, which are distributed across the wellbore area cross section. If all minispinners overlay between each other, regardless of the well deviation,this indicates flow is not biphasic flow traveling at moderatevelocities (nonsignificant flow mixing), and the possibility of having emulsion is high.
2. Performing measurements with the MPLT at a lower choke will help to decrease the wellbore fluid velocities, and in many cases, will reduce the mixing between water and oil, thereby lessening the chance that emulsion will occur. This can be observed by electric probe water detection and the separation of minispinners with well deviation.
3. In case of suspected emulsion, the logging must be extendedto the tubing so that the fluid can segregate, enabling operators to determine the type of emulsion (stable or unstable emulsion).
4. Once the existence of emulsion is confirmed through a well-head sample, the test separator and/or the gas-oil separationplant (GOSP), the log analyst should highlight the existence of an emulsion to the client and confirm that a PNLT is required.
Data Interpretation
1. MPLT interpretation: Data processing and interpretation of the acquired data are performed to determine water entries and flow rate computations. The data from all sensors is
loaded into the relevant software. The following are computed or checked: depth matching, borehole geometry computation, water and hydrocarbon distribution along thewell trajectory and inflow cross sections.
2. PNLT interpretation: The water velocity is calculated from the PNLT water flow logging stations, using the three-phaseholdup log software to calculate water, oil and gas holdups.
3. MPLT and PNLT integrated interpretation: Integrated inter-pretation involves calculating the total flow rate from the MPLT spinners, then incorporating the PNLT three-phase holdup log and water flow log to compute oil and water rates.
Reporting
1. The report is discussed and delivered on time with details, such as well information/history, logging methodology, log quality checks, flow profile and fluid entry, and tabulation of rates.
2. The report needs to be approved by relevant parties.3. The report is to be shared with other relevant parties.
DISCUSSION ABOUT EMULSION ROOT CAUSES
Well-X, Fig. 8, did not show downhole emulsions. The reasonthis well is presented in this article is to help understand theroot causes of emulsion in this part of the field. Is the creationof downhole emulsion due to the fluid velocity (shear), watercut, completion used or other reasons?
Well-X was completed as a 61⁄8” open hole oil producer andwas drilled in the same area as the field examples described below: Wells A, B and C. The MPLT data illustrated in Fig. 8is the log result of Well-X, which shows excellent distributionof the fluids downhole. Spinners and holdups are reflecting theinflow zones and the change in well deviation “as in a bookexample.” At a deviation lower than 90° (uphill), the water(heavier phase) velocity decreases, and the oil (lighter phase)velocity increases. In addition, the water holdup increaseswhile the oil holdup decreases, e.g., at X030 ft. At a deviationabove 90° (downhill), water flows much faster than the oil
SAUDI ARAMCO JOURNAL OF TECHNOLOGY WINTER 2013 59
Completion TypeMixture Velocity (ft/min)
Shut-In Pressure
(psi)
Flowing Pressure
(psi)
Shut-In Temperature
(°F)
Flowing Temperature
(°F)
Water Cut (%)
Well-X Open Hole 6.125” Screen 107 2,570 2,537 188.4 189.7 23
Well-A Cased Hole 3.958” Screen 176 3,455 3,319 211.6 212 44
Well-B Cased Hole 4” Screen 373 2,680 2,556 193.1 194.1 24
Well-C Cased Hole 4” Screen 324 2,511 2,405 188.3 188.1 30
Table 1. Comparison of non-emulsion well and emulsion wells

60 WINTER 2013 SAUDI ARAMCO JOURNAL OF TECHNOLOGY
Fig. 8. Well-X: MPLT answer in open hole completion.

Fig. 9. Well-A: MPLY and PNLT integrated answer.
SAUDI ARAMCO JOURNAL OF TECHNOLOGY WINTER 2013 61

because of its higher fluid density. The water holdup now decreases while the oil holdup increases, e.g., at X330 ft.
For the root cause investigation, the non-emulsion well(Well-X) was compared with the other emulsion wells (WellsA, B and C), as described in Table 1. In this comparison, themajor difference between a non-emulsion well and an emulsionwell can be observed in two parameters: mixture velocity anddrawdown in wellbore pressure (shut-in pressure minus flowingpressure). The wells that have downhole emulsion have higherfluid velocity and higher drawdown in wellbore pressure.
Both causes are related to the completion; higher velocity isdue to the smaller internal well diameter, and the large draw-down in wellbore pressure is possibly due to flow restrictionby the completion inflow screens. This last statement has to beconfirmed by more log data and laboratory tests.
FIELD EXAMPLES AND OBSERVATIONS
The three field examples discussed in this article are from acarbonate reservoir in Saudi Arabia. The oil is of relativelylight density and the formation water has high salinity. Waterinjection of low salinity water started a few years ago to main-tain reservoir pressure.
For the MPLT-PNLT log combinations, the oil rate was calculated based on the MPLT spinners and the average oilholdup from the three-phase holdup log. Water entries wereidentified and quantified using water holdup from the three-phase holdup log and water velocity from the water flow logstations, from which the water rate is determined.
In all these examples, the detected emulsion was a stableemulsion, as it was seen in both downhole and surface condi-tions. A demulsifier agent was used in some wells to separatewater from oil.
Well-A
Well-A, Fig. 9, was drilled and completed as a cased hole, singlelateral oil producer. The well was completed with inflowscreens and mechanical packers for zonal isolation.
The MPLT was run at a high flowing rate, as per the issuedprogram, without consideration to the possible presence ofemulsion in this field, as it had never been observed before,probably because of low water cut. During the real-time moni-toring of the job, the MPLT data showed a large decrease inwater holdup from the toe to the heel of the well, followed bythe complete disappearance of water at X300 ft (track 9, Fig.9). It was also observed that all minispinners were overlayingeach other above this depth (track 8, Fig. 9), regardless of thechange in well deviation, which suggested that the tool wasmeasuring the velocity of a single-phase fluid above X300 ft.This contradicted the expected initial well production rates(i.e., well producing both oil and water with a water cut above25%). Questions were raised during the job about the MPLTfunctionality and well production rates; no issues were found
with these, so the only problem that could be identified wasemulsion. To integrate with other data, a surface sample wascollected at the wellhead and the GOSP, and both indicated thepresence of emulsions. Further troubleshooting was performedby reducing the well choke and repeating the MPLT job atlower flow velocities (track 6, Fig. 9). The MPLT electricalprobes were able to detect water across the logged interval, asshown by fluid segregation (oil/water) in the horizontal section.Due to a low production rate combined with water recirculation,the exact water entry interval could not be located accurately(track 7, Fig. 9). Therefore, the decision was made to run thePNLT to measure water and oil holdup at a high flow rate, including 18 water flow log stations.
After combining the MPLT-PNLT logs, the oil rate, oilholdup, and oil and water entries were successfully identifiedand quantified. The water rate was determined from the watervelocity from the water flow log stations (tracks 11 and 12,Fig. 9). Additional information was also extracted from thetemperature log; it suggested a packer leak at X380 to X390 ft(track 5, Fig. 9). The MPLT-PNLT combination logs showedlarge water production (87% total water) from interval X580to X610 ft (track 13, Fig. 9) and gradual oil entry over thescreens intervals.
Well-B
Well-B, Fig. 10, was sidetracked and completed as a single lat-eral oil producer. The horizontal well was completed with acombination of perforations and inflow screens.
At lower velocities, below X450 ft (track 6, Fig. 10), spin-ners were reacting to fluid segregation and to well deviation.Water holdups between PNLT and MPLT were matching satis-factorily, indicating that there was no emulsion in this section.Above this depth, emulsion was evident from the spinner read-ings, where all spinners overlay each other (track 6, Fig. 10),and from the large decrease in water holdups measured by theMPLT electrical probes (track 7, Fig. 10). Therefore, duringthe real-time surveillance, it was decided that the PNLT wasrequired to achieve the objective.
With the combined MPLT-PNLT logs, the oil and waterflow profiles and rates were successfully identified and quanti-fied. The water rate was determined from the water velocityfrom the water flow log stations (tracks 9 and 10, Fig. 10).The logs showed that the largest water contributing intervalwas at X485 ft to X515 ft (60% total water production) andthat there was gradual oil entry over the perforated and screenintervals (track 11, Fig. 10).
Well-C
Well-C, Fig. 11, was drilled as an oil producer and has notbeen worked over since first production. The well was com-pleted with inflow screens across two zones separated by twomechanical packers.
62 WINTER 2013 SAUDI ARAMCO JOURNAL OF TECHNOLOGY

Fig. 10. Well-B: MPLT and PNLT integrated answer.
SAUDI ARAMCO JOURNAL OF TECHNOLOGY WINTER 2013 63
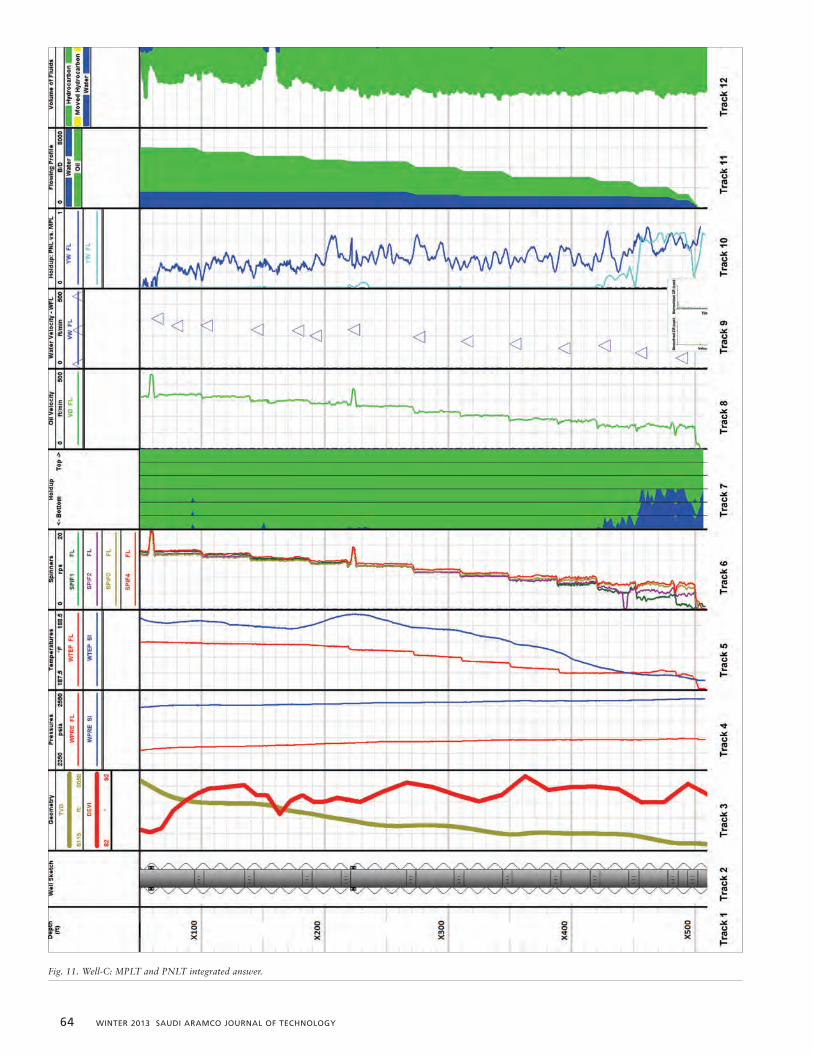
Fig. 11. Well-C: MPLT and PNLT integrated answer.
64 WINTER 2013 SAUDI ARAMCO JOURNAL OF TECHNOLOGY

The same logging workflow and methodology as in Wells Aand B were used for this well. This well also encountered water-in-oil emulsions, as supported by surface samples andMPLT data. The flow profile and water entries could not bemeasured accurately by the MPLT. Therefore, the PNLT wasused to obtain fluid holdup and water velocity.
The MPLT-PNLT log combination showed that most of thewater (43% total water production) was produced from thedeepest inflow screens at X500 ft (track 11, Fig. 11) and thatoil was produced from all the inflow screens.
CONCLUSIONS AND RECOMMENDATIONS
1. The workflow established in this article led to the deter-mination of the downhole flow profile with high confidenceand to the accurate quantitative identification of the source of water production.
2. The combination of MPLT and PNLT logs is an efficient method to diagnose emulsion downhole.
3. In the investigated field, the root cause of emulsion is most likely related to the high-pressure drop in the wellbore and to the higher fluid velocity generated by the downhole completion. Laboratory studies are required to get more evidence and support for this conclusion.
4. The emulsion detected in the field is stable emulsion, as it was seen both at downhole and surface conditions.
ACKNOWLEDGMENTS
The authors would like to thank both Saudi Aramco andSchlumberger management for permission to publish this arti-cle. We also thank Saudi Aramco Senior Production EngineerHemant Sharma for his support during the logging operationsand the Schlumberger Research Center in Dhahran for theiroffer to perform measurements on fluid samples taken fromthe emulsion wells.
The article was presented at the SPE Annual Technical Con-ference and Exhibition, New Orleans, Louisiana, September 30- October 2, 2013.
REFERENCES
1. Al-Ghamdi, A. and Kokal, S.: “Investigation of Causes ofTight Emulsions in Gas Oil Separation Plants,” SPE paper81508-MS, presented at the Middle East Oil Show,Bahrain, June 9-12, 2003.
2. Sarbar, M.A. and Wingrove, M.D.: “Physical and ChemicalCharacterization of Saudi Arabian Crude Oil Emulsions,”SPE paper 38817-MS, presented at the SPE AnnualTechnical Conference and Exhibition, San Antonio, Texas,October 5-8, 1997.
3. Sarbar, M.A. and Wingrove, M.D.: “Characterization ofArab Light Crude Oil Emulsions,” Saudi Aramco Journalof Technology, Spring 1998, pp. 2-12.
4. Jones, T.J., Neustadter, E.L. and Whittingham, K.P.:“Water-in-Crude Oil Emulsion Stability and EmulsionDestabilization by Chemical Demulsifiers,” Journal ofCanadian Petroleum Technology, Vol. 17, No. 2, April-June 1978.
5. Baldauff, J., Runge, T., Cadenhead, J., Faur, M., Marcus,R., Mas, C., et al.: “Profiling and Quantifying ComplexMultiphase Flow,” Oilfield Review, October 1, 2004, Vol.16, No. 3, pp. 62-68.
6. Roscoe, B.A.: “Field-Test Results of a Three-Phase HoldupMeasurement in Horizontal Wells with a Pulsed-NeutronSource,” SPE paper 38704-MS, presented at the SPEAnnual Technical Conference and Exhibition, San Antonio,Texas, October 5-8, 1997.
7. McKeon, D.C., Scott, E.D., Patton, G.L. and Howard, J.J.:“Interpretation of Oxygen Activation Logs for DetectingWater Flow in Producing and Injection Wells,” paper1991-BB, presented at the SPWLA 32nd Annual LoggingSymposium, Midland, Texas, June 16-19, 1991.
SAUDI ARAMCO JOURNAL OF TECHNOLOGY WINTER 2013 65

Mustafa A. Bawazir joinedSchlumberger Oilfield Services in 2007as a Reservoir Engineer in thePetroTechnical Services (PTS) segment.He has 6 years of experience in jobplanning, real-time monitoring andpost-acquisition data processing and
interpretation related to production logging in vertical andhorizontal wells. Mustafa assists the organization in themarketing and support of integrated solutions. He hasreceived several Schlumberger awards recognizing hisprojects and culture of excellence, winning three President’sAwards and two Bronze Awards in 2011, 2012 and 2013.
In 2007, Mustafa received his B.S. degree with honorsin Petroleum Engineering from King Fahd University ofPetroleum and Minerals (KFUPM), Dhahran, Saudi Arabia.
He has published and presented several technical papers,and he has been a member of the Society of PetroleumEngineers (SPE) since 2005.
Hussain S. Al-Shabibi joinedSchlumberger Oilfield Services in 2006as a Borehole Production Engineer inthe Petro-Technical Services (PTS)segment. He has 6 years of experiencein job planning, real-time monitoringand post-acquisition data processing
and interpretation related to production logging in verticaland horizontal wells. Hussain also assists the company inthe marketing and support of integrated solutions.
In 2006, he received his B.S. degree in PetroleumEngineering from King Fahd University of Petroleum andMinerals (KFUPM), Dhahran, Saudi Arabia.
Hussain has been a member of the Society of PetroleumEngineers (SPE) since 2003.
BIOGRAPHIES
Nawawi A. Ahmad is a PetroleumEngineer Specialist and is currently theLead Engineer for day-to-dayevaluation of production logs for allfields in Saudi Aramco. He started hisoil field career in 1989 with Shell inSoutheast Asia as a Well Site
Petroleum Engineer, Operational Petrophysicist and FieldStudy Petrophysicist in new and mature oil and gas fields.Nawawi then worked as a Senior Petrophysicist and fieldstudy leader for Petroleum Development Oman in theMiddle East. His last position before joining Saudi Aramcowas as a division head of one of the petrophysics units in aShell operating company in Southeast Asia.
Nawawi received his B.Eng. degree in Mining andPetroleum Engineering from Strathclyde University,Glasgow, U.K., in 1989 and an M.B.A. from BruneiUniversity, Brunei, in 2005.
He has been a member of the Society of PetroleumEngineers (SPE) since 1989.
Nedhal M. Al-Musharfi is currentlythe Head of Saudi Aramco’s ReservoirDescription Division. He started hiscareer with Schlumberger in 1994 as aWireline Field Engineer, and then hehad a cross-segment move to drillingand measurements. During his time at
Schlumberger, Nedhal worked in several operationalpositions, and as the Recruiting Manager.
In 1994, he received his B.S. degree in MechanicalEngineering from King Fahd University of Petroleum andMinerals (KFUPM), Dhahran, Saudi Arabia.
Nedhal has authored and coauthored several technicalpapers.
Zouhir Zaouali is currently theProduction and Perforation DomainChampion in Schlumberger, SaudiArabia. He has spent his entire careerwith Schlumberger, working in variouspositions in the wireline and dataprocessing centers in Algeria, France,
Congo, the North Sea, Libya and Saudi Arabia. Zouhir hascontributed to enhancing production logging and reservoirsaturation interpretation, perforation optimizationtechniques, surveillance in brown fields, water control ingas wells and underbalanced perforations.
In 2001, Zouhir received his M.S. degree in ReservoirGeosciences and Engineering from the French Institute ofPetroleum (IFP), Paris, France.
66 WINTER 2013 SAUDI ARAMCO JOURNAL OF TECHNOLOGY