integrated system health management: pilot operational ... · integrated system health management:...
TRANSCRIPT

American Institute of Aeronautics and Astronautics
1
Integrated System Health Management: Pilot Operational Implementation in a Rocket Engine Test Stand
Fernando Figueroa 1 and John Schmalzel.2
NASA, Stennis Space Center, MS, 3952, USA
and
Jon Morris 3 and Mark Turowski 4 Jacobs Technology, Stennis Space Center, MS, 39529, USA
and
Richard Franzl 5 Smith Research Company, Stennis Space Center, MS, 39529, USA
Nomenclature ISHM = Integrated Systems Health Management DIaK = Data, Information, and Knowledge FCL = Functional Capability Level FMEA = Failure Modes and Effects Analysis RCA = Root Cause Analysis NASA = National Aeronautics and Space Administration RETS = Rocket Engine Test Stand OSA-CBM = Open Systems Architecture for Condition-Based Maintenance VISE = Virtual Intelligent Sensor Environment LC-20 = Launch Complex 20 SSC = Stennis Space Center KSC = Kennedy Space Center IMBT = ISHM Model Building Toolkit ISHM-DM = ISHM Domain Model CSG = Chemical Steam Generator DR = Discrepancy Report RETS = Rocket Engine Test Stand STE = Special Test Equipment IPA = Isopropyl Alcohol LOX = Liquid Oxygen GN = Gaseous Nitrogen
I. Abstract HIS paper describes a credible implementation of integrated system health management (ISHM) capability, as a pilot operational system. Important core elements that make possible fielding and evolution of ISHM capability
have been validated in a rocket engine test stand, encompassing all phases of operation: stand-by, pre-test, test, and post-test. The core elements include an architecture (hardware/software) for ISHM, gateways for streaming real-time
1 Innovative Partnerships Office, NASA Stennis Space Center, AIAA Associate Fellow. 2 Innovative Partnerships Office, NASA Stennis Space Center. 3 Engineer III, Technology Development and Application, M/S B8306. 4 Engineer III, Technology Development and Application, M/S B8306. 5 Engineer III, Technology Development and Application, M/S B8306.
T
https://ntrs.nasa.gov/search.jsp?R=20100017420 2020-03-26T03:27:19+00:00Z

American Institute of Aeronautics and Astronautics
2
data from the data acquisition system into the ISHM system, automated configuration management employing transducer electronic data sheets (TEDS’s) adhering to the IEEE 1451.4 Standard for Smart Sensors and Actuators, broadcasting and capture of sensor measurements and health information adhering to the IEEE 1451.1 Standard for Smart Sensors and Actuators, user interfaces for management of redlines/bluelines, and establishment of a health assessment database system (HADS) and browser for extensive post-test analysis. The ISHM system was installed in the Test Control Room, where test operators were exposed to the capability. All functionalities of the pilot implementation were validated during testing and in post-test data streaming through the ISHM system. The implementation enabled significant improvements in awareness about the status of the test stand, and events and their causes/consequences. The architecture and software elements embody a systems engineering, knowledge-based approach; in conjunction with object-oriented environments. These qualities are permitting systematic augmentation of the capability and scaling to encompass other subsystems.
II. Introduction ISHM has been defined from many perspectives. This paper will use the definition from reference [1]: “ISHM is a capability that is achieved by integrating data, information, and knowledge (DIaK) that might be
distributed throughout the system elements (which inherently implies capability to manage DIaK associated with distributed sub-systems). DIaK must be available to any element of a system at the right time and in accordance with a meaningful context. ISHM Functional Capability Level (FCL) is measured by how well a system performs the following functions: (1) detect anomalies, (2) diagnose causes, (3) predict future anomalies/failures, and (4) provide the user with an integrated awareness about the condition of every element in the system and guide user decisions.”
Stennis Space Center (SSC) is building a new test stand, A3, to enable rocket engine testing in simulated altitude
conditions (Figure 1). Simulated altitude will be achieved by flowing high speed steam through a diffuser. The steam is generated using a large set of chemical steam generators (CSG’s). Prior to their deployment at the A3 Test Stand, SSC is performing risk-reduction testing on CSG’s. A component of this risk-reduction effort is the validation of a credible ISHM capability. Given the high complexity of the A3 Test Stand, it is expected that an ISHM system will be needed to operate the test stand in a safe, efficient, and timely manner.
ISHM is a fast growing area, and is a capability that might be achieved using different approaches, architectures, and technologies. ISHM technologies include algorithms and software tools to manage data, information and knowledge that is focused on achieving ISHM functions (e.g. anomaly detection, diagnosis, etc.). Examples of ISHM implementations include the on-board ISHM implementation of the Boeing 777 airplane [2]. Boeing’s airplane health management (AHM) incorporates distributed processing elements that capture events and send them to a central processor for transmission to ground, where maintenance needs are assessed before the plane lands. In addition to safety benefits, the objective of the AHM was to decrease unplanned maintenance from 75% to 25% of previous levels. Even though the FCL of AHM might have been minimal initially (threshold detection), the network infrastructure to allow reasoning using data and information from various subsystems was established, thus creating the conditions to augment the FCL in the future. Another ISHM implementation is the Pratt&Witney-Rocketdyne’s (formerly Boeing-Rocketdyne) Advanced Health Management System for the Space Shuttle Main Engine (SSME) [3]. The effort incorporated automated analysis of trending to predict if critical data streams might be approaching out-of-norm values. A system that has been in use for a long time is the Health and Usage Monitoring System (HUMS) for helicopters. The HUMS monitors data from helicopter subsystems and processes it using a set of specialized algorithms. The resulting anomaly indicators and original data are used by experts to infer if critical elements might be trending toward failure. In this system, knowledge and its integrated interpretation is primarily done by people. The level of automated integration and reasoning over multiple process models that is desired in ISHM, is minimally represented by current
Figure 1. A3 Test Stand at NASA Stennis Space Center.

American Institute of Aeronautics and Astronautics
3
implementations. We describe a pilot implementation that emphasizes integrated reasoning; based on concepts, architectures, and tools previously published by the authors [1, 4-12].
III. ISHM Implementation Objectives The objectives of the implementation were as follows:
1. Complete an end-to-end ISHM domain model for the facility/CSG system that focuses on sensor verification & validation for the facilities and test article.
a. Develop an ISHM Domain Model (ISHM-DM) that encapsulates data, knowledge, and other information to enable sensor validation, anomaly detection, diagnosis; and supports other ISHM functional capability. Develop and validate core ISHM-DM elements. Description of the ISHM-DM is provided in Section IV.
b. Emphasize modularity to enable low-effort scale-up of the ISHM-DM, to support future scale up to a 3-CSG skid.
c. Implement transducer electronic data sheet (TEDS) structures to capture transducer data and calibration information according to the IEEE 1451.4 Standard for Smart Sensors and Actuators.
d. Provide capabilities to configure, monitor, analyze and display redline and blueline events. Blueline events monitor sensor readings to assess readiness to begin a test, and redline events monitor sensor readings to cut a test when limits are exceeded.
2. Demonstrate near real time operation of the ISHM capability. a. Achieve real-time capture of sensor data packets from the Ethernet data switch in the test control
room. b. Convert raw data to engineering units using calibration information from the test process. c. Operate on the test data streams in near real-time using anomaly detection algorithms
implemented with two assets: (1) a virtual intelligent sensor environment (VISE) and (2) an ISHM-DM built using the ISHM Model Building Toolkit (IMBT) (The IMBT was developed using G2/Optegrity, which is a commercial software environment to implement knowledge-based applications [13]).
d. Validate flowing test data during tests through the VISE and the ISHM-DM, in order to detect anomalies, diagnose causes, and determine effects. Confirm results findings by test reviews and those recorded in discrepancy reports (DRs) throughout the test process.
e. Develop and validate core ISHM-DM capability for all elements represented in the piping and instrumentation diagrams (P&IDs) including embedded TEDS information.
f. Monitor starting and operating values on bluelines and redlines. g. Compare ISHM outcomes to anomalies found using manual methods. h. Operate ISHM model environment during CSG testing to include data preview, accessing element
descriptions, etc.
IV. ISHM Infrastructure Implementation of ISHM capability for the CSG and a rocket engine test stand (RETS) required the
establishment of a hardware and software infrastructure to manage the flow of DIaK among the system elements. Figure 2 shows a diagram of the pilot implementation. The left box shows a typical data acquisition system, with a computer in the control room publishing data from all sensors to an Ethernet bus. The right box shows the ISHM system, which is essentially a consumer of data, and does not cause any interference to the operation of the data acquisition system. This non-interference quality of the ISHM system makes it very suitable to be matured in operational systems without increasing any risk to the operation, but rather providing opportunity for benefits. A brief description of the components of the ISHM system follows.
A. Virtual Intelligent Sensor Environment (VISE) The VISE’s function is to convert each of the classic sensors in the test facility and CSG into “Intelligent
Sensors.” The bottom box in Figure 2 shows the processing implemented by the VISE. Data from the RETS data bus (labeled Control Room Network), or from storage files are streamed into the VISE. The data is buffered and calibrated according to a calibration file provided by test personnel, but also present in the Transducer Electronic Data Sheet (TEDS) for each sensor. TEDS are uploaded into the VISE from the Health Assessment Database System (HADS). VISE further runs algorithms on each data stream to detect anomalies based on the streams and local information (e.g. from the TEDS). Finally measurements and health information is published to the ISHM

American Institute of Aeronautics and Astronautics
4
Ethernet Bus (labeled IEEE 1451.1 Standard on Ethernet) for storage in the HADS and for consumption by the ISHM DM (the ISHM-DM resides in ISHM Computer).
B. Health Assessment Database System (HADS) HADS is a MySQL database. The HADS is a repository for measurements, electronic data sheets, and any health
information, including: Transducer Electronic Data Sheets (TEDS’s), Component Electronic Data Sheets (CEDS’s), Health Electronic Data Sheets (HEDS’s), and anomalies detected by the VISE and the ISHM-DM. In the future, the HADS will also host algorithms to detect anomalies for use by VISE and the ISHM-DM. The VISE and the ISHM-DM upload and download data and information from/to the HADS.
C. HADS Browser Application (HADS-BA) The HADS-BA is a tool for analysis encompassing information stored in the HADS. For instance, one might use the tool to display data windows from a sensor corresponding to different tests; or multiple data windows from multiple sensors corresponding to multiple tests. The current browser was developed in LabView©, and the plan is to expand it to allow analysis using signal processing algorithms available in LabView©.
D. ISHM Domain Model (ISHM-DM) The ISHM-DM is housed in the ISHM Computer. The ISHM-DM is a model where all elements of a system are
represented by objects; and embeds data, information, and knowledge (DIaK) needed to achieve ISHM capability: detect anomalies, diagnose causes, determine effects, provide guidance and validation to operators, and provide an integrated awareness about every element in the system. Specific user interfaces were developed to improve management of bluelines and redlines as requested by test conductors.
Figure 2. Physical Architecture of the Facility/CSG ISHM Implementation.

American Institute of Aeronautics and Astronautics
5
V. Facility and CSG ISHM Domain Model The ISHM-DM was developed using SSC’s ISHM Model Building Toolkit (IMBT). The ISHM-DM defines
each element of the system as an object; which contains data, information, and knowledge (DIaK) needed to embed ISHM functionality. The ISHM-DM also incorporates DIaK for collections of elements (or process-related subsystems) that have associative relationships needed for reasoning when opportunities arise, e.g. when processes involving those collections are taking place. These are in general process models used for consistency checking (analytic models, statistical models, physics-based models, etc.), focused on detection of anomalies, diagnosis, and other ISHM functional capability. For example, a so called “pressurizable subsystem” might be dynamically defined as a collection of elements that belong to a subsystem that is isolated, and expected to maintain pressure. Typical reasoning in this case would be to check if, in fact, pressure is maintained in this subsystem, providing a means to check for leaks. The ISHM-DM includes multiple windows that allow access to increasing levels of detail down to individual elements. A description of the ISHM-DM for the CSG and facility is depicted in the following subsections.
E. Top Level ISHM-DM Interface The top-level view of the ISHM-DM is shown in Figure 3, and the corresponding as-built photo is shown in Figure 4. The ISHM model is comprised of three logical groupings of subsystems. The first group consists of all of the facility to special test equipment (STE) hardware (ovals), the second is the STE to CSG (left elements in the CSG unit), and the third grouping is the CSG itself. The demarcation between the STE and CSG is made at the point at which the piping branches service to each of the CSGs. By modularizing the ISHM model in this manner, the system can easily be updated for the full CSG skid testing (three CSG units). The top-level view shows four main systems that together feed the CSG. The isopropyl alcohol (IPA) system provides the fuel; the liquid oxygen (LOX) subsystem provides the oxidizer, the cold water system provides cooling for the CSG and is the source of water for steam generation, and the gaseous nitrogen (GN) subsystem is used to purge the system. The output of the CSG is ducted into a steam plenum, which is shown with two additional CSG units disabled and grayed-out but ready to be enabled to comprise a complete ISHM-DM of the 3-unit skid. The steam plenum connects to a steam discharge pipe, which in turn connects to a spool and finally a vent section.
Figure 3 - Top-level G2 System Model of the CSG The top level view provides a quick look of the status of the overall system. If a component that is part of one of the top level subsystems experiences abnormal behavior the top level view reflects this status by highlight the corresponding subsystem to attract the ISHM operator’s attention. The ISHM operator can then “drill down” into the subsystems for more detailed information.

American Institute of Aeronautics and Astronautics
6
Figure 4. Photograph of the CSG Unit with Discharge Piping. Figure 5 shows a typical user interface incorporating multiple windows of information.
Figure 5. Typical ISHM User Interface.

American Institute of Aeronautics and Astronautics
7
F. Test Facility to Special Test Equipment (STE) Interfaces The first grouping of facility hardware encompasses the existing facility infrastructure up to the points were the service of the LOX, CW, IPA, and GN branch to feed the individual CSG units (Figure 6). Each of the subsystems is contained within its own window with logical links bridging one subsystem to another. One can access subsystems by point-and-click with a mouse. An example user interface for the LOX subsystem is shown in Figure 7.
1. LOX Subsystem CSG ISHM Model Figure 6 shows the LOX subsystem detailed domain model accessed by clicking top-level view. Each element (e.g. pipe, junction, sensor, etc.), is an object that encapsulates electronic data sheets (e.g. TEDS, HEDS), and relationships information with other elements for reasoning.
Figure 7. LOX System ISHM-DM.
Figure 6. Top Window of ISHM-DM Highlighting Facility Systems (red box).
American Institute of Aeronautics and Astronautics
8
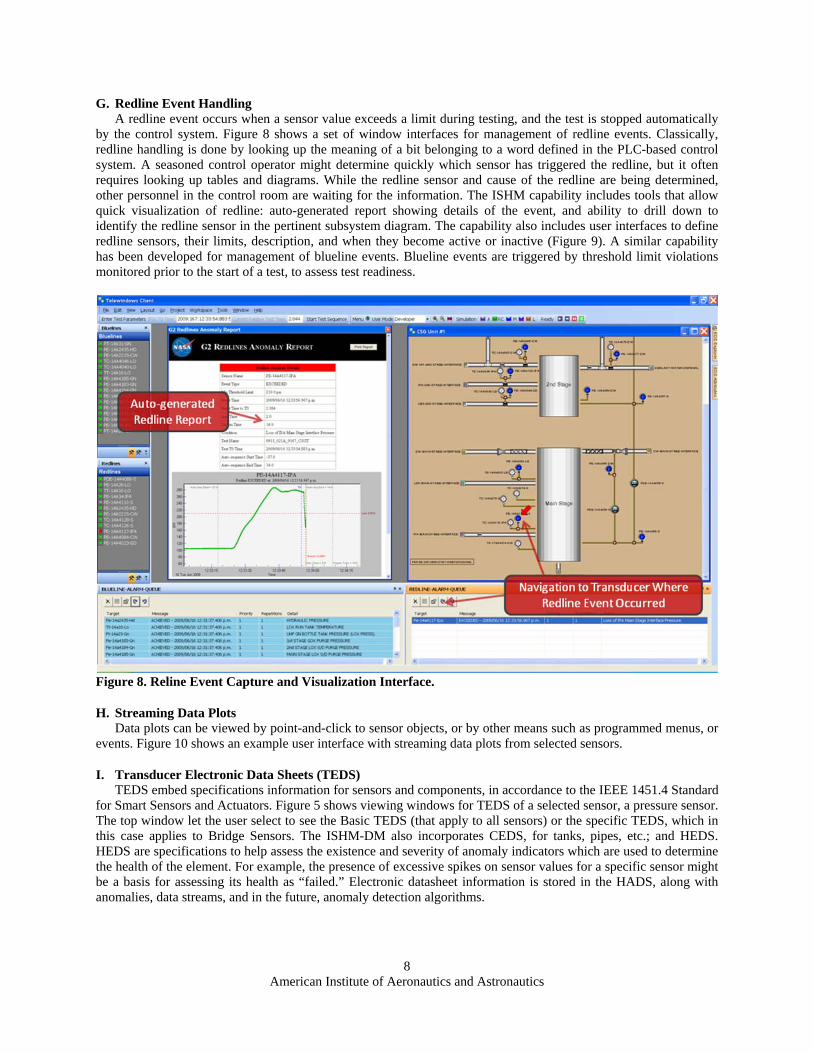
G. Redline Event Handling A redline event occurs when a sensor value exceeds a limit during testing, and the test is stopped automatically
by the control system. Figure 8 shows a set of window interfaces for management of redline events. Classically, redline handling is done by looking up the meaning of a bit belonging to a word defined in the PLC-based control system. A seasoned control operator might determine quickly which sensor has triggered the redline, but it often requires looking up tables and diagrams. While the redline sensor and cause of the redline are being determined, other personnel in the control room are waiting for the information. The ISHM capability includes tools that allow quick visualization of redline: auto-generated report showing details of the event, and ability to drill down to identify the redline sensor in the pertinent subsystem diagram. The capability also includes user interfaces to define redline sensors, their limits, description, and when they become active or inactive (Figure 9). A similar capability has been developed for management of blueline events. Blueline events are triggered by threshold limit violations monitored prior to the start of a test, to assess test readiness.
Figure 8. Reline Event Capture and Visualization Interface.
H. Streaming Data Plots Data plots can be viewed by point-and-click to sensor objects, or by other means such as programmed menus, or
events. Figure 10 shows an example user interface with streaming data plots from selected sensors.
I. Transducer Electronic Data Sheets (TEDS) TEDS embed specifications information for sensors and components, in accordance to the IEEE 1451.4 Standard
for Smart Sensors and Actuators. Figure 5 shows viewing windows for TEDS of a selected sensor, a pressure sensor. The top window let the user select to see the Basic TEDS (that apply to all sensors) or the specific TEDS, which in this case applies to Bridge Sensors. The ISHM-DM also incorporates CEDS, for tanks, pipes, etc.; and HEDS. HEDS are specifications to help assess the existence and severity of anomaly indicators which are used to determine the health of the element. For example, the presence of excessive spikes on sensor values for a specific sensor might be a basis for assessing its health as “failed.” Electronic datasheet information is stored in the HADS, along with anomalies, data streams, and in the future, anomaly detection algorithms.

American Institute of Aeronautics and Astronautics
9
Figure 9. User Interfaces for Configuration of Redlines and Bluelines.
Figure 10. Viewing of Streaming Data Plots from Selected Sensors.

American Institute of Aeronautics and Astronautics
10
J. Failure Modes and Effects Analysis (FMEA) FMEA capability was not used in this particular implementation, but the authors have implemented it in prior
applications, and it is described here for completeness. G2/Optegrity-based toolkit is the software environment used to build the ISHM-DM and includes a tool for automation of FMEA. Using this tool, FMEA information from the standard “MIL-STD-1629A(2) NOT 3” can be represented by root-cause-trees (RCT) in a very expressive and intuitive manner and its execution is automated. The RCT can generically address failure modes in classes of objects belonging to classes of subsystems or collections (collections can be dynamically created and destroyed), that might be associated with a particular process model (e.g. maintaining pressure) at the time a failure related event occurs. Figure 11 shows a partial FMEA Form (MIL-STD-1629A(2) NOT 3) describing a leak failure in a system that is meant to maintain pressure. Figure 12 shows the RCT representing the failure mode. The RCT indicates that for any subsystem that is meant to maintain pressure, a leak is present (Pressure Leak Node - middle), which might be caused by leaks on any of the elements (subcomponents) of the subsystem (left top node). Hence, each element in the subcomponent becomes “Suspect of Leak.” The RCT also separately specifies that any isolation valves of the subsystem are “Suspect of Leak.” This is accomplished by the following example: when an isolation valve separates two pressure subsystems, if one subsystem is leaking and the other is not, then the isolation valve’s “Leak” event (node) is labeled as “False” because that valve is not leaking. An effect of the “Leak” event is that any pressure sensor in the subsystem will show a decrease in pressure (right node). The RCT is activated when any of the nodes receives an event. In the current implementation, the event “Decreasing Pressure” is monitored throughout all pressure sensors in all Pressure Subsystems in the system. When the event occurs in a particular subsystem then the “Leak” event becomes “True,” which, in turn, makes the “Leak” event in all the elements of the subsystem become “Suspect.”
Figure 11. FMEA representation in standard table.
Figure 12. Root-Cause-Tree for the FMEA case in Figure 11.
Figure 13 shows how the RCT is exploded to represent the FMEA result when the pressure sensor pe-1134-go of
the pressure subsystem on the left (green) begins to decrease. The subsystem where pe-1134-go is a subcomponent is determined to be leaking (Node Pressure Leak is True – T with a red background). All elements in the subsystem become “Suspect” of “Leak” (Node Leak is Suspect – S with yellow background), except for the isolation valve mv-1135-go. That particular FMEA result incorporated another RCT describing a leak as a result of a Failure-to-Seat failure mode of valves.
The FMEA in the IMBT provides for very complex reasoning to be implemented with very simple and clearly defined RCT’s. Specifically, use of relationships needed for FMEA are easily defined within the ISHM-DM.

American Institute of Aeronautics and Astronautics
11
Multiple RCT’s can be linked by common nodes. For example, the node “Leak” for valves can be part of another RCT describing causes and effects of such a leak. The link is established virtually and automatically.
VI. Virtual Intelligent Sensor Environment (VISE) The VISE provides what is typically denominated “sensor validation,” but further enhanced to achieve
“intelligent sensors” capability for ISHM. Multiple algorithms process each data stream, and additional algorithms can be easily added to improve capability. Hence, the VISE executes the following functions:
1. Uploads TEDS for each sensor/signal in the system from the HADS. 2. Streams-in live raw data from the data acquisition system. 3. Converts raw data to engineering units. 4. Processes each sensor stream through algorithms that detect anomaly indicators (specification range
violations, spikes, flat line, and noise). 5. Streams data and health to the ISHM Ethernet Bus using the IEEE 1451.1 Standard for communication
with smart sensors and actuators. 6. Streams data and health to the HADS repository for detailed analysis with the HADS Browser
Application. Figure 14 shows an example data stream with overlaid peak detection using an algorithm developed at NASA
Glenn Research Center. Figure 15 shows a stream with multiple anomaly indicators detected by the VISE.
Figure 14. Spike Detection at the VISE.
Figure 16 shows a sequence of four streams from one sensor over four tests. This is an example of potential early
fault detection by the ISHM system. The top left stream shows the sensor functioning normally. The top right stream
Subsystem Leaking
Subsystem not Leaking
Figure 13. Exploded Root-Cause-Tree (left) for a Leak Event on the System Shown (right).
Figure 15. Data Stream with Overlayed Anomaly Indicators.

American Institute of Aeronautics and Astronautics
12
shows a spiky behavior. The bottom left stream shows periods of flat signal, which also happen to be outside the specification limits. The bottom right stream shows complete failure as a flat signal outside specification limits.
VII. Key ISHM Benefits A RETS/CSG ISHM-DM model was constructed and data from a test series was processed through the model. ISHM output results were validated using available Discrepancy Reports (DRs) and other test summaries. The implementation provides configuration management, historical data and health management, and data analysis tools. The key results realized by the ISHM implementation are depicted in the subheadings below.
i. Support for Test Readiness One of the principle tasks associated with configuration management is establishing a database of sensors and all associated parameters such as make, model, in-/out-calibration, calibration scale factors, etc. Maintenance activities include replacement for routine recalibration and for repair. Current Methodology: Sensor configurations are manually entered into a database; anytime an operator wants to verify a sensor configuration requires sorting the database to find the sensor ID and associated data. Although calibration scale factors are entered into a database at a separate facility, the customer only has access to a hardcopy summary of the sensor calibration sheet. This leads to duplication of data effort and increases the probability of error. ISHM: The ISHM-DM includes embedded TEDS for sensors. A complement of 90 TEDS were created for the system and stored in the Health Assessment Database System (HADS). This demonstrated a new method for easily accessing and modifying associated configuration data. The HADS database structure is readily accessible by multiple users.
ii. Support During Test Once the blueline readiness conditions are established, the decision to begin testing can be made. The test sequence is automatic and consists of control actions, establishing redline setpoints, and evaluating key signals against the redlines. If a redline violation is detected, the test is cut. Current Methodology: Redline evaluation during test is critical. If a redline is detected, the current system produces a cryptic summary that is not easily interpreted and may require a substantial amount of time and effort to
Figure 16. Sequence Showing Sensor Failure over Four Tests.

American Institute of Aeronautics and Astronautics
13
decode and analyze. The redline user interfaces (UIs) are only viewed by selected operators and occurring redline events are in turn communicated to the test conductor. ISHM: Blueline and redline critical threshold values are easily updated using a simple UI. Once a test is underway, redline violations are immediately reported with time of exceedance along with details of the redline, the sensor, sensor location, and the trend of the associated data. The report also allows for a printable hard copy for record keeping and an ease of distribution.
iii. Support for Rapid Return to Test Readiness Rapid return to test readiness requires that all system elements be evaluated to determine their condition and readiness for future tests. Current Methodology: Data reviews are performed to identify events that are considered to be anomalous. Some anomalies are documented using a DR that describes the observed problem and captures all steps required for resolution. This is a highly intensive manual process that takes a considerable amount of time. ISHM: The ISHM-DM and associated VISE incorporates automated, continuous, and comprehensive sensor anomaly detection capability that included: (1) noise assessment, (2) flatline signal detection, (3) evaluation of high and low limit exceedances, (4) and spike detection. Additional anomalies not reported in DRs were also detected by the ISHM. Although not implemented in the ISHM-DM, the ISHM system can monitor for any number of anomalies continuously and comprehensively, even unknown ones. Two specific anomalies that have been implemented in prior applications include: (1) leak detection, and (2) valve malfunction detection.
iv. Post-Test Analysis and Data Review There is a need to interpret the results of each test and to understand the differences between the current test and its predecessors, as well as understanding the evolving condition of the test stand. Tracking component variations, especially identifying subtle deterioration, is difficult. For example, changes in valve timing can be sensitive indicators of future valve faults. Current Methodology: A coherent set of tools is not available to support analysis, particularly longitudinal analysis. Plotting tools with simple analysis functions allow a basic set of signal analyses to be performed on a single data set, but it is difficult to analyze and compare with previous test results. Also, the test data and configuration management to support signal analyses are located in separate databases. This requires data mining and analysis to look for relationships that may not be readily apparent. Component tracking is difficult to do, so is not done. ISHM: Data from each test is added to the HADS, which is a database that incorporates TEDS for configuration management, test data over all tests performed, usage such as cycle times on valves or mean time to failure, and anomalies detected by the ISHM system. This allows a variety of longitudinal analyses and comparisons with previous test results. Component condition tracking is readily achievable because all data on component performance is archived in one database and available for routine analysis.
VIII. Conclusions and Recommendations The paper described a pilot implementation of an ISHM system for a rocket engine test stand and a chemical
steam generator under test. Core infrastructure of the ISHM system was implemented and used in an operational mode. This application provides a well defined approach to implement credible ISHM capability. The most crucial element of the implementation is the ISHM Model Building Toolkit, which allows creation of the ISHM Domain Model (ISHM-DM). The ISHM-DM supports key tools to manage data, information, and knowledge (DIaK) needed for ISHM capability. Another crucial element is the Virtual Intelligent Sensor Environment (VISE), which enables sensor validation to be done as a separate process, and also embodies functions that make any classic sensor become an “intelligent sensor.” Finally, the Health Assessment Database System (HADS) is a life repository used to collect data and information from the VISE and ISHM-DM, and also to be used as a resource by the ISHM-DM and advanced analysis browser applications.
The potential capabilities that this infrastructure embodies are limitless. System capabilities exploited were improved management of redlines and bluelines and automated configuration with TEDS. The ISHM Model Building Toolkit (IMBT) is architected for systematic augmentation of ISHM capability, as well as scale up to incorporate systems of systems.
Given that the complexity of the new A3 Test Stand is one order of magnitude larger than any existing test stand, the need for technology support for safety, test readiness activities, test operations, rapid diagnostics, and analysis, is
American Institute of Aeronautics and Astronautics
14
that much greater. Without ISHM capability, operating A3 is likely to be very costly, people intensive, and potentially unaffordable.
XIII. Acknowledgements The authors wish to acknowledge organizations and individuals who supported development of ISHM capability
throughout many years of effort. NASA Innovative Partnerships Program (IPP) and General Atomics for supporting the development of the technologies in a collaborative setting (Cooperative Agreements NNS06AB92A and NNS08AA43A). Special thanks to Dr. Ramona Travis, Manager of the IPP at NASA Stennis. Thanks to Randy Holland for initial investments and later management support and funding of ISHM related projects. Special recognition to Robert Bruce and John Bailey, who as Chiefs of the Technology group, were instrumental in making possible development of the ISHM area. Thanks also to Freddy Douglas and Mike Smiles for their support in their capacity as NESC/SSC Chief Engineers.
References 1. Fernando Figueroa, John Schmalzel, Mark Walker, Meera Venkatesh, Ravi Kapadia, Jon Morris, and Mark
Turowski, and Harvey Smith, “Integrated System Health Management: Foundational Concepts, Approach, and Implementation,” AIAA 2009-1915, AIAA Infotech@Aerospace, 6-9 April 2009, Sheraton Seattle Hotel, Seattle, Washington.
2. Ramohalli, G., 1994, “Honeywell’s Aircraft Monitoring and Diagnostic Systems for the Boeing 777,” Proceedings of the 17th Symposium on Aircraft Integrated Monitoring Systems, pp. 69-71, 73-87.
3. Davidson, M., and Stephens, J., “Advanced Health Management System for the Space Shuttle Main Engine,” 40th AIAA/ASME/SAE/ASEE Joint Propulsion Conference, 11-14 July 2004
4. Park, H. G., and Zak, M., “Grey-box Approach for Fault Detection of Dynamical Systems,” ASME Journal of Dyn. Sys., Meas., & Control, Vol. 125, 2003, pp. 451-454.
5. Figueroa, F., and Schmalzel, J., “Rocket Testing and Integrated System Health Management,” Condition Monitoring and Control for Intelligent Manufacturing, edited by L. Wang and R. Gao, Springer Series in Advanced Manufacturing, Springer Verlag, UK, 2006, pp. 373-392.
6. Figueroa, F., and Aguilar, R., “Test Stand and J-2X Engine End-to-End Integrated System Health Management Demonstration,” 43rd AIAA/ASME/SAE/ASEE Joint Propulsion Conference & Exhibit, 8-11 July 2007
7. Figueroa, F., Holland, R., and Coote, D., “NASA Stennis Space Center Integrated System Health Management Test Bed and Development Capabilities,” SPIE Defense & Security Symposium, Sensors for Propulsion Measurements Applications, 17-24 April 2006.
8. Schmalzel, J., Figueroa, F., Morris, J., Mandayam, S., and Polikar, R., “An Architecture for Intelligent Systems Based on Smart Sensors,” IEEE Transactions on Instrumentation and Measurement, Vol. 54, No. 4, August 2005, pp. 1612-1616.
9. Figueroa, F., Holland, R., Schmalzel, J., and Duncavage, D., “Integrated System Health Management (ISHM): Systematic Capability Implementation,” Sensors Applications Symposium, 2006, Proceedings of the 2006 IEEE, 7-9 February 2006, pp. 202-206.
10. Karl Reichard, Fernando Figueroa, Rebecca Oosdyke, John Schmalzel, and Jose Perotti, “An ISHM Architecture for Ground Operations Health Management,” ISHM Conference, Covington Convention Center, KY, August11-14, 2008.
11. Mahajan, A., Chitikeshi, S., Bandhil, P., Utterbach, L. and Figueroa, F., “Intelligent Sensors – An Integrated Approach,” Proceedings of the 5th International Workshop on Structural Health Monitoring, 12-14 September 2005.
12. Chitikeshi, S., Bandhil, P., Utterbach, L., Mahajan, A. and Figueroa, F., “Intelligent Sensors – Strategies for an Integrated Systems Approach,” Proceedings of the ASME IMECE2005, 6-11 November 2005.
13. Mahajan, A., and Figueroa F., "Dynamic Across Time Autonomous - Sensing, Interpretation, Model Learning, and Maintenance Theory," Mechatronics, Vol. 5, No. 6, 1995, pp. 665-693.
14. Gensym Corporation, www.gensym.com.