integrated report 2019€¦ · 7. shinjuku central park city shinjuku ward 44/2 feb 2010130,695 8....
TRANSCRIPT

1Sumitomo Realty & Development Co., Ltd.
Integrated Report 2019

1Sumitomo Realty & Development Co., Ltd.
Sumitomo’s Business Philosophy
Fundamental Mission
The Sumitomo Realty Group, as the heir of Sumitomo Honsha,
Ltd., has developed into a comprehensive real estate enterprise of
the Sumitomo Group with a history of 400 years. The business
philosophy—“Placing prime importance on integrity and sound
management in the conduct of its business” and “Under no
circumstances, shall it pursue easy gains”—which have been
handed down as a guiding principle throughout the Sumitomo’s
history, live on in the form of our corporate slogan, “Integrity and
Innovation.”
“Create even better social assets for the next generation.”
We have set forth our fundamental mission as “to create even
better social assets for the next generation” through our
businesses closely associated with people’s daily lives. Based on
this fundamental stance, the Sumitomo Realty Group is engaging
in business with the aim of creating cities and urban spaces that
are resilient to disasters, friendly to people and the environment,
and harmonious with history and culture.
2 Sustainable Growth as Tokyo’s No.1 Office OwnerHistory of Corporate Value Creation by "Land Innovation"
4 Our Strengths8 A Message from the Management
16 At a Glance18 Business activities to support value creation
18 LEASING22 SALES24 CONSTRUCTION26 BROKERAGE27 GROUP COMPANIES
28 Addressing Social Issues through Business Activities30 Feature 1 Sustainable urban redevelopment—Osaki Garden City—32 Feature 2 Remodeling—Shinchiku Sokkurisan34 Disaster-resistant Community Development36 Environmentally Friendly Community Development38 Strengthening the basis of value creation
40 Corporate Governance40 Board of Directors and Statutory Auditors42 Matters Concerning Corporate Governance44 Risk Management45 Other Information Concerning Governance
46 Financial Section46 Eleven-year Financial Summary48 Management’s Discussion and Analysis50 Consolidated Balance Sheets52 Consolidated Statements of Income53 Consolidated Statements of Changes in Net Assets54 Consolidated Statements of Cash Flows55 Notes to Consolidated Financial Statements73 Independent Auditor’s Report
74 Company Information74 Corporate Data/Investor Information75 History
Cautionary Statement with Respect to Forward-looking Statements
Statements made in this annual report with respect to plans,
targets and future performance that are not historical fact are
forward-looking statements. These statements are based on
management’s assumptions and beliefs in light of the information
currently available. Sumitomo Realty & Development Co., Ltd.
cautions that a number of factors could cause actual results to
differ materially from those discussed in the forward-looking
statements. Such factors include but are not limited to
macroeconomic conditions, supply and demand in the real estate
market and interest rate trends.
Contents
Continue creating new value with "Integrity and Innovation"Placing top priority on Integrity,
we will go beyond simple development and
relentlessly pursue value creation
through our innovative and challenging spirit.
Editorial Policy
This report was compiled based on this focus with consideration paid to the disclosure framework of the International Integrated Reporting Council (IIRC).
Source: Sumitomo Historical Archives

2 3Integrated Report 2019 Sumitomo Realty & Development Co., Ltd.
Major Building Development Projects
1997 2001 2002 2003 2004 2005 2006 2007 2008 2009 2010 2011 2012 2013 2014 2015 2016 20182017 2019 20212020 2022 20242023 20251974 1975 1976 197719711970 1972 1973 1978 1979 1980 1981 1982 1983 1984 1985 1986 1987 1988 1989 1990 1991 1992 1993 19951994 1996 1999 20001998
5,000
3,000
4,000
2,000
1,000
0
Gross FloorArea
(1,000m2)
250
150
200
100
50
0
Ordinary Profit
(Billions of yen)
8th Plan
1998Shibuya Infoss Tower
2002Izumi Garden Tower
2004Shiodome SumitomoBuilding
2011Sumitomo FudosanShinjuku Grand Tower
History of Corporate Value Creation by "Land Innovation"The real estate leasing business primarily involving office buildings in central Tokyo has been the driving force of our growth to date. Accounting for nearly 70% of the Company’s operating income overall, the leasing business is clearly the main pillar of the Company’s operations and the core of its corporate value. We have been expanding our business platform by promoting development of office buildings with a specific focus on central Tokyo over roughly half a century since the early 1970s. Despite various changes in the business environment, we have consistently persisted with respect to unwaveringly adhering to the management policies based on a long-term perspective, such that, (i) the Company will not pursue temporary gains by selling assets; (ii) the Company will hold ownerships of buildings constructed on sites it has developed; and (iii) the Company will generate stable leasing income over the long term by owning and leasing such buildings. As a result, we have grown to become Tokyo’s No. 1 office building owner with more than 220 buildings for lease in central Tokyo.Acquisition of development sites is the most important aspect of the office building leasing business. We have been redeveloping sites, in other words innovating land, through purchasing and assembling land by coordinating rights and interests of landowners. These capabilities of "Land Innovation" constitute our greatest strength and are the source of corporate value creation. Capitalizing on the capabilities of "Land Innovation" as well as the management foundation and other strengths we have cultivated so far, we intend to further expand our earnings base and increase corporate value.
Ordinary Profit / Gross Floor Area
Sustainable Growth as Tokyo’s No.1 Office Owner
Non-consolidated figures(Years ended / ending March 31)
1998Chiyoda First Building East
2006Sumitomo FudosanMita Twin Building West
2000Sumitomo FudosanShibakoen First Building
2010Shinjuku Central Park City
2004Chiyoda FirstBuilding West
2012Sumitomo FudosanShibuya Garden Tower
2000Sumitomo FudosanIidabashi First Building
2009Sumitomo FudosanAobadai Tower
2003Shinjuku Oak Tower
2010Sumitomo FudosanIidabashi First Tower
2005Tokyo ShiodomeBuilding
2016Sumitomo FudosanShinjuku Garden Tower
1974Shinjuku SumitomoBuilding
2015Tokyo Nihombashi Tower
2016Sumitomo FudosanRoppongi Grand Tower
2018Sumitomo FudosanOsaki Garden Tower
Listed on the Tokyo Stock Exchange and Osaka Securities Exchange.
■ Ordinary Profit ●Gross Floor Area
1997 2001 2002 2003 2004 2005 2006 2007 2008 2009 2010 2011 2012 2013 2014 2015 2016 20182017 2019 20212020 2022 20242023 20251974 1975 1976 197719711970 1972 1973 1978 1979 1980 1981 1982 1983 1984 1985 1986 1987 1988 1989 1990 1991 1992 1993 19951994 1996 1999 20001998
5,000
3,000
4,000
2,000
1,000
0
Gross FloorArea
(1,000m2)
250
150
200
100
50
0
Ordinary Profit
(Billions of yen)

54 Integrated Report 2019 Sumitomo Realty & Development Co., Ltd.
After redevelopmentX: Developer
X
B C
AD
B C
Buildings
Land
E
D
Before redevelopment
ABCD: Rights holdersE: Tenants
Equal value exchange
Through the conversion of the rights of the rights holders,
sites can be acquired with equal value exchanges.
A B C D X
C
A
B
Building
Land
E D
Capabilities of "Land Innovation"Unlike competitors, we did not own real property in Tokyo when we started a business, and we had to purchase land for developing buildings. Therefore, instead of reconstructing buildings we owned or purchasing sites through competitive bidding and constructing new buildings, which tends to be expensive, we focused on redevelopment by integrating multiple small parcels into a larger scale through persistent, long-term efforts to maximize the site value. In this way, we continued to develop superior assets and enhanced our corporate value. The capabilities of "Land Innovation" that we cultivated through engagement in redevelopment over many years are our greatest strength. They are also a driving force enabling us to undertake many large development projects in central Tokyo, an area where it is difficult to acquire excellent large sites. We have an industry-leading track record in urban redevelopment in central Tokyo, including in Roppongi, Nishishinjuku, and Iidabashi, pursuant to the Urban Renewal Act, which involves achieving an agreement with many landowners and consultation with the authorities. Through redevelopment, we are improving central Tokyo’s infrastructure, including enhancement of disaster prevention, such as by eliminating densely built-up areas of wooden houses and widening narrow streets, and are contributing significantly to vitalization of communities. As a result, our projects enjoy benefits of deregulation, such as increased floor-area ratios, contributing to greater profitability.
Major Flagship Buildings Mainly Comprising Redevelopment Projects
Name Location (Tokyo CBD)No. of floors
Completion Gross floorarea (m2)(above ground/
below ground)
1. Izumi Garden Tower Minato Ward 43/4 Oct 2002 204,4442. Sumitomo Fudosan Roppongi Grand Tower Minato Ward 43/2 Oct 2016 202,5493. Sumitomo Fudosan Osaki Garden Tower Shinagawa Ward 24/2 Jan 2018 201,5604. Shinjuku Sumitomo Building Shinjuku Ward 52/4 Mar 1974 177,4675. Sumitomo Fudosan Shinjuku Grand Tower Shinjuku Ward 40/3 Dec 2011 168,3726. Sumitomo Fudosan Shinjuku Garden Tower Shinjuku Ward 37/2 Mar 2016 143,3727. Shinjuku Central Park City Shinjuku Ward 44/2 Feb 2010 130,6958. Shinjuku Oak City Shinjuku Ward 38/2 Jan 2003 117,6069. Tokyo Nihombashi Tower Chuo Ward 35/4 Apr 2015 105,837
10. Shiodome Sumitomo Building Minato Ward 25/3 Jul 2004 99,91311. Sumitomo Fudosan Mita Twin Building West Minato Ward 43/2 Sep 2006 98,33812. Tokyo Shiodome Building Minato Ward 37/4 Jan 2005 95,12813. Shinjuku NS Building Shinjuku Ward 30/3 Sep 1982 75,04614. Sumitomo Fudosan Iidabashi First Tower Bunkyo Ward 34/3 Apr 2010 68,51415. Sumitomo Fudosan Shibakoen First Building Minato Ward 35/2 Jun 2000 63,82216. Chiyoda First Building West Chiyoda Ward 32/2 Jan 2004 61,27417. Sumitomo Fudosan Shibuya Garden Tower Shibuya Ward 24/3 Jun 2012 59,41718. Sumitomo Fudosan Aobadai Tower Meguro Ward 33/3 Aug 2009 55,77319. Sumitomo Fudosan Iidabashi First Building Bunkyo Ward 14/2 Mar 2000 53,32220. Sumitomo Fudosan Iidabashi Building No. 3 Shinjuku Ward 24/2 Oct 2002 53,047Before
After
Redevelopment projectsNote: Figures for gross floor area indicate the area managed by Sumitomo Realty.
Our Strengths
Sumitomo Fudosan Iidabashi First Building Sumitomo Fudosan Iidabashi First Tower
Completion March 2000 April 2010
Gross floor area 63,000 m2 78,400 m2
Purposes Office, residence, retail Office, residence, retail, multipurpose hall
Izumi Garden Tower Sumitomo Fudosan Roppongi Grand Tower
Completion October 2002 October 2016
Gross floor area 208,400 m2 210,500 m2
Purposes Office, residence, hotel, retail, museum, multipurpose hall, conference room Office, residence, retail
Urban Redevelopment under the Urban Renewal Act of Japan
Iidabashi Redevelopment Project
Izumi Garden
(two major redevelopment buildings, Sumitomo Fudosan Iidabashi First Building and Sumitomo Fudosan Iidabashi First Tower)
Example 1
Example 2 (two major redevelopment buildings, Izumi Garden Tower and Sumitomo Fudosan Roppongi Grand Tower)

76 Integrated Report 2019 Sumitomo Realty & Development Co., Ltd.
Leasing Portfolio that Meets Diverse Needs
Tokyo’s No. 1 office building owner, managingmore than 220 buildings in central Tokyo’s major office districts
Our Portfolio’s Strengths (As of March 31, 2019)
Sumitomo Realty's leasing portfolio is highly competitive in terms of the three distinct features of being "central, newest and large" that meet diverse tenants' needs. Going forward, we will endeavor to maintain and enhance our competitive strengths by focusing on providing high-quality office buildings with these qualities.
Diversified throughout major business areasOur leasing portfolio emphasizes on locations in central Tokyo; 94% of our portfolio is in Tokyo’s 23 wards,and 88% is in the Tokyo CBD (Central Business District)*. Proximity to other office buildings and major train and subway stations is a key condition for a prime property, and having been located in such areas is one of our portfolio’s competitive strengths. In particular, the Tokyo CBD is designed as a district with a high concentration of office buildings, and strong and stable demand is expected in this district going forward. Therefore, we will work to enhance our competitive strengths by continuing to acquire development sites in this district.* Tokyo CBD (Central Business District): 7 wards, comprising Chiyoda, Minato, Chuo, Shinjuku, Shibuya, Shinagawa and Bunkyo
Buildings with Excellent BCP ComplianceThe average age of the buildings in our portfolio is 16 years, the lowest figure among major Japanese real estate companies. New buildings are capable of generating strong demand by meeting tenants’ needs for facilities and design to name a few, making the relative age of the buildings in a portfolio a key factor affecting the leasing business. As shown in the table below, our buildings are equipped with the latest facilities and features, and are popular among tenants for their functionality, comfort and safety in the event of a major disaster. 99% of our portfolio meets or exceeds earthquake-resistance standards that took effect in 1981, which are a key yardstick for earthquake safety. Further, approximately 80% of the buildings we own are structured with a seismic isolation system and/or a damping system. In recent years, emergency generators that provide electricity in the event of a power outage have also become a feature sought by tenants as a part of their business continuity planning (BCP). Thus, emergency generators are installed in about 70% of the buildings we own, which include all newly completed buildings after 2001.
State-of-the-art Facilities 1981 and earlier 1982–1996 1997 and after
Earthquake protection Previous quake-resistant structure New quake-resistant structure Anti-sway structure
Ceiling height* 2.5 m 2.7 m 2.9–3.3 m
Floor load 300 kg/m2 300–500 kg/m2 500–1,000 kg/m2
Air-conditioning Central air-conditioning system Climate control zones Separate climate control systems
Power capacity 45 VA/m2 60–70 VA/m2 85 VA/m2 and over
* Includes raised floors
Large-scale Buildings with large amounts of floor space per floorLarge-scale buildings with gross floor area of at least 10,000 square meters make up 87% of our portfolio. Consolidating multiple offices of a business on one floor helps to facilitate internal communication and reduce space redundancies, making operations more efficient. These types of needs are behind the increased demand in recent years for large-scale buildings with large amounts of floor space per floor. Being able to offer such spaces is definitely one of our strengths.
Central
Newest
Large
Tokyo CBD*
New Quake-resistant*1 Structure
Over 10,000 m2 (gross floor area)
23 Wards
Seismic Isolation and/or Damping System Construction
Emergency Power Generators
88%
99%
87%
94%
80%*2
70%*2
Our Strengths
Major flagship buildings
Large-scale buildings
Other buildings
Gross Floor Area
5.04 million m2
Percentage
Minato 30%
Shinjuku 20%
Chiyoda 11%
Chuo 8%
Shibuya 8%
Shinagawa 7%
Bunkyo 4%
Other wards in Tokyo 6%
Others 6%
Tokyo CBD 88 %
* Only buildings owned by the Company are shown on this map.
Bunkyo
Shinjuku
Minato
Shinagawa
Shibuya
Chiyoda
Chuo
TOKYO CBD*
*1 New standards that took effect in 1981
*2 Approx.
* Tokyo CBD (Central Business District): 7 wards, comprising Chiyoda, Minato, Chuo, Shinjuku, Shibuya, Shinagawa and Bunkyo

9Sumitomo Realty & Development Co., Ltd.8 Integrated Report 2019
A Message from the Management
The Seventh Management Plan launched in April 2016 was concluded in the fiscal year ended March 31, 2019. The operating environment remained favorable overall, particularly with respect to leasing of office buildings in Tokyo. As a result, ordinary profit over the cumulative three-year period amounted to ¥557.8 billion, a record-high result exceeding the initial target of ¥480 billion by a wide margin. Moreover, in the fiscal year ended March 2019, the final year of the plan, we achieved record-high financial results for the sixth consecutive fiscal year, with revenue from operations exceeding ¥1 trillion and operating income and ordinary profit exceeding ¥200 billion. The Seventh Management Plan ended on a successful note with the Company having achieved substantial profit growth.
We launched the Eighth Management Plan in April 2019. As indicated in Figure Three-year cumulative earnings targets, the performance targets are to achieve consecutive record results for the three-year period covered, with cumulative ordinary profit of ¥700 billion, by maintaining the pace of growth attained under the Seventh Management Plan with which substantial profit increase was achieved. We also aim to achieve record results for the ninth consecutive fiscal year with respect to results for single fiscal years. Whereas ordinary profit during the Seventh Management Plan totaled slightly more than ¥550 billion, we target ordinary profit of ¥700 billion under the Eighth Management Plan. The pace of profit increase
from the Sixth Management Plan to the Seventh Management Plan was 30% and we intend to maintain this pace of profit increase from the Seventh Management Plan to the Eighth Management Plan. The plan calls for an increase of over ¥140 billion for ordinary profit from the Seventh Management Plan and its core driver is the building leasing business. The current office building market in central Tokyo has been buoyant. In view of the steady progress of tenant acquisition for new buildings to be completed from now on, growth of the building leasing business is foreseeable and thus we believe the targets for the Eighth Management Plan are highly feasible.
Results of the Seventh Management Plan
Outline of the Eighth Management Plan: Office building leasing business as the driving force of growth
Positioning redevelopment and leasing of
office buildings in central Tokyo as growth drivers,
we will continue creating new value.
Targets*(Cumulative Totals)
FY '16Results
FY '17Results
FY '18Results
CumulativeTotals
Change from Targets
Revenue from Operations 2,700 925 948 1,012 2,886 + 186
Operating Income 550 188 206 219 613 +63
Ordinary Profit 480 168 187 203 558 +78
Results for the Seventh Management Plan (Apr 2016 – Mar 2019)
(Billions of yen)
* Announced on May 12, 2016
5th Plan 6th Plan 7th Plan 8th Plan2011-2013 2014-2016 2017-2019 2020-2022
Revenue from Operations 2,170.0(+63.2)
2,442.0(+272.0)
2,885.8(+443.7)
3,100.0(+214.2)
Operating Income 437.2(+2.3)
500.6(+63.3)
613.2(+112.6)
740.0(+126.8)
Ordinary Profit 329.1(10.0)
418.0(+88.8)
557.8(+139.8)
700.0(+142.2)
Note: All figures are cumulative totals within the period of the plan.
(Reference) Comparison of Management Plan results (Years ended/ending March 31)
Performance targetsAchieve consecutive record results for the three-year period covered, with cumulative ordinary profit of ¥700 billion.
Achieve record results for the ninth consecutive fiscal year under the three management plans since the Sixth Management Plan by maintaining the pace of growth attained under the Seventh Management Plan with which substantial profit increase was achieved.
(Billions of yen)
Three-year cumulative earnings targets
Revenue from Operations ¥ 3,100.0 billion ( + ¥ 214.2 billion, + 7%)*
Operating Income ¥ 740.0 billion ( + ¥ 126.8 billion, + 21%)*
Ordinary Profit ¥ 700.0 billion ( + ¥ 142.2 billion, + 25%)*
Kojun Nishima
President
* Compared with results for the Seventh Management Plan
* The Company changed its accounting policy (revenue recognition standards of Sumitomo Real Estate Sales) from the beginning of the fiscal year ending March 31, 2020. The figures provided for the fiscal year ended March 31, 2019 (7th Plan) are those after retrospective application.
* The Company changed its accounting policy (revenue recognition standards of Sumitomo Real Estate Sales) from the beginning of the fiscal year ending March 31, 2020.
The figures provided for the fiscal year ended March 31, 2019 (7th Plan) are those after retrospective application.

1110 Integrated Report 2019 Sumitomo Realty & Development Co., Ltd.
A Message from the Management
We will continue investment in leasing office assets in central Tokyo in order to strengthen the earnings base. We will steadily implement the development plan for over 800 thousand tsubo (one tsubo is roughly 3.3 m²) of gross floor area (equivalent to over 50% of the gross floor area for leasing currently available) to generate profits. Figure below is a graph indicating operating income of the leasing business and gross floor area over some 40 years. At its foundation 70 years ago, the Company owned three buildings with gross floor area of 6 thousand tsubo. Ever since, we have focused on redevelopment by
integrating multiple small parcels into a larger scale, constructed buildings and owned them for leasing without selling them off. As a result, we have now grown to be Tokyo’s No. 1 building owner and operate more than 220 buildings with gross floor area exceeding 1.5 million tsubo. Despite difficulties associated with the bursting of Japan’s bubble economy, financial crises, and the Lehman crisis, we have accumulated building assets step by step. This policy has supported the Company’s sustainable growth and financial stability. In view of our experience, we intend to maintain this policy.
Further investment in leasing office assets in central Tokyo
1978 1980 1985 1990 1995 2000 2005 2010 2015 20222020(Forecast)
50
0
100
150
200
250
500
0
1,000
1,500
2,000
2,500Thousands of tsubo*1Billions of yen
77
155
219
234
(Years ended/ending March 31)
*1 1 tsubo ≈ 3.3 m²*2 Segment information has been disclosed since the March 1991 fiscal year
Consolidated Operating Income and Gross Floor Area
Gross Floor Areaoperated in Leasing Business(right scale)
Operating Income from Leasing Business
Performance targets and strategies by segment
Office building leasing in Tokyo to be the driving force of growth.
Performance targets by segment5th Plan 6th Plan 7th Plan 8th Plan
Leasing 843.0 886.2 1,073.1 1,200.0
Sales 670.0 773.1 957.2 950.0
Construction 500.0 589.3 634.7 720.0
Brokerage 146.8 177.2 207.7 220.0
Revenue from operations 2,170.0 2,442.0 2,885.8 3,100.0
Leasing 272.1 313.7 415.5 530.0
Sales 110.2 127.2 140.1 140.0
Construction 48.9 47.0 50.4 70.0
Brokerage 41.2 52.1 61.6 65.0
Operating income 437.2 500.6 613.2 740.0
Billions of yen
Strategies
LeasingProfit growth of the Seventh Management Plan, supported by the buoyant market environment, to be surpassed.
SalesHigh level of profit of the Seventh Management Plan to be maintained.
ConstructionRemodeling (Shinchiku Sokkurisan): Growth track, recovered in the Seventh Management Plan following the sluggish period until the Sixth Management Plan, to be maintained.Custom Homes: Business base to be strengthened through improvement of construction systems and quality control.
BrokerageGroup collaboration to be strengthened, establishing the base for growth in the Ninth Management Plan onward.
Figure Performance targets and strategies by segment shows performance targets by segment. The Leasing segment is expected to grow significantly from the Seventh Management Plan to the Eighth Management Plan. In addition to the full-year contribution from buildings completed by the Seventh Management Plan and increases in rents, new buildings will steadily be completed under the Eighth Management Plan. As tenant acquisition for these new buildings has been proceeding well at a high pace, the building leasing business will be the driving force for growth in the period covered by the Eighth Management Plan. In the Sales segment, in order to maintain the high level of profit
exceeding ¥40 billion a year achieved under the Seventh Management Plan, we will strive to maintain and enhance product planning and sales capabilities for condominiums. We have already secured land banking for projects for the Eighth Management Plan and contracts have been concluded for projects to be completed in the next 12 months or so. Thus, for the time being, we expect to attain the targets for the Sales segment. Both the Construction segment consisting of remodeling (Shinchiku Sokkurisan) and custom home construction and the Brokerage segment for real estate brokerage contribute to industry-leading profits and the Company aims to maintain and expand those profits.
Performance targets by segment
* The Company changed its accounting policy (revenue recognition standards of Sumitomo Real Estate Sales) from the beginning of the fiscal year ending March 31, 2020. The figures provided for the fiscal year ended March 31, 2019 (7th Plan) are those after retrospective application.
* The Company changed its accounting policy (revenue recognition standards of Sumitomo Real Estate Sales) from the beginning of the fiscal year ending March 31, 2020. The figures provided for the fiscal year ended March 31, 2019 are those after retrospective application.

1312 Integrated Report 2019 Sumitomo Realty & Development Co., Ltd.
In addition to the 1.5 million tsubo we have developed so far, we intend to develop 800 thousand tsubo in total, including 230 thousand tsubo during the Eighth Management Plan and development under the Ninth Management Plan and beyond. The floor area to be newly developed
exceeds 50% of the gross floor area of the buildings currently owned by the Company. The 800 thousand tsubo is the sum of the concrete development projects for which we have already acquired land and redevelopment projects for which we are taking the initiative.
Major New Building Development ProjectsInvestment and financing for growth from now on
A Message from the Management
Project Name Location Gross Floor Area (Tsubo*)
ExpectedCompletion
❶ Sumitomo Fudosan Shinjuku Central Park Tower Shinjuku Ward 18,100 Aug 2019
❷ Sumitomo Fudosan Akihabara Ekimae Building Chiyoda Ward 7,800 Aug 2019
❸ Sumitomo Fudosan Ikebukuro Higashi Building Toshima Ward 4,900 Sep 2019
❹ Sumitomo Fudosan Akihabara first Building Chiyoda Ward 8,200 Oct 2019
❺ Haneda Airport Project Ota Ward 27,700 Mar 2020
❻ Ariake Project Koto Ward 60,000 Mar 2020
❼ Sumitomo Fudosan Kojimachi Garden Tower Chiyoda Ward 14,500 Apr 2020
Kita-shinagawa 5-chome Project Shinagawa Ward 14,300 Mar 2021
Sumitomo Fudosan Tamachi Building East Minato Ward 3,800 Mar 2021
Sumitomo Fudosan Ochanomizu Building Bunkyo Ward 3,800 Mar 2021
Sumitomo Fudosan Kanda Izumicho Building Chiyoda Ward 3,800 Apr 2021
Higashi-gotanda 2-chome Project Shinagawa Ward 6,300 May 2021
Others 56,000
8th Plan Total 229,200
❽ Mita 3- and 4-chome Project (Fudanotsuji) Minato Ward 69,000 Jul 2022
❾ Nishi-shinjuku 5-chome Kita Project Shinjuku Ward 40,800 Oct 2022
Pace of Gross Floor Area Development
1,000
0
1,500
3,000
2,000
2,500
500
Thousands of tsubo
(Years ended/ending March 31)
(Thousands of tsubo)
2001 2004 2007 2010 2013 2016 2019 2022 2025 –
+230thousandsof tsubo1,524
thousandsof tsubo
More than+800
thousands of tsuboGrossFloorArea
5th Plan
+150
6th Plan
+110
7th Plan
+210
8th Plan
+230
* 1 Tsubo ≈ 3.3m2
*1 tsubo ≈ 3.3 m2
❽ Mita 3- and 4-chome Project (Fudanotsuji)
Expected Completion: Jul 2022
❶ Sumitomo Fudosan Shinjuku Central Park Tower
Completion: Aug 2019
❸ Sumitomo Fudosan Ikebukuro Higashi Building
Completion: Sep 2019
❼ Sumitomo Fudosan Kojimachi Garden Tower
Expected Completion: Apr 2020
❺ Haneda Airport Project
Expected Completion: Mar 2020
❻ Ariake Project
Expected Completion: Mar 2020
❷ Sumitomo Fudosan Akihabara Ekimae Building
Completion: Aug 2019
❹ Sumitomo Fudosan Akihabara first Building
Completion: Oct 2019
❾ Nishi-shinjuku 5-Chome Kita Project
Expected Completion: Oct 2022

1514 Integrated Report 2019 Sumitomo Realty & Development Co., Ltd.
5th Plan 6th Plan 7th Plan 8th Plan
Capital Investment (268) (422) (664) (600)
Cash Flows from the Leasing Business 364 410 535 680
Interest-bearing Debt 2,651 3,159 3,343 3,300
* Cash flows from the leasing business: Operating income of the leasing business + Depreciation and amortization
Interest-bearing Debt and Gross Floor Area
Development on this scale will require investment of approximately ¥2 trillion of which around ¥600 billion will be required for the Eighth Management Plan. With a portfolio of buildings with a gross floor area of 1.5 million tsubo, we are now capable of covering the necessary funds for investment in new buildings with cash flows from the leasing business. As shown in Figure below, whereas borrowings increased in step
with the increase in gross floor area through to the end of the Seventh Management Plan, under the Eighth Management Plan expansion of cash flows from the leasing business will enable us to make new investment without increasing borrowings. We have advanced to a new stage in terms of financing thanks to a stable revenue stream from the 1.5 million tsubo of leased assets that we have accumulated step by step.
CSR through Businessmore than 100 years old and restoring streetscapes. In these ways, by working to resolve various social issues through business, we are striving to achieve sustainable growth of the Sumitomo Realty Group and contribute to attainment of SDGs.
Reflecting the record results for the sixth consecutive year, we increased annual dividends for the fiscal year ended March 31, 2019 by ¥1 from the initial plan and paid ¥30 per share (including an interim dividend of ¥14), an increase of ¥3 per share. For the fiscal year ending March 31, 2020, we intend to pay annual dividends of ¥32 per share (including an interim dividend of ¥16), an increase of ¥2 per share. Our basic dividend policy is unchanged, namely, to achieve steady profit growth and sustainable dividend increase reflecting the profit
growth. As our aim is further profit growth by continuing developing and leasing office buildings, we intend to allocate profit to investment in office buildings on a priority basis. Looking back at past results, as shown in Figure Consolidated Operating Income and Gross Floor Area, we maintained dividend payment at the time of the Lehman crisis without decreasing the dividends and subsequently have increased dividends in line with the Company’s financial performance.
Policy for shareholder returns
■ Ordinary Profit ● Cash Dividends per Share (right scale)
Consolidated Operating Income and Gross Floor Area
A Message from the Management
■ Interest-bearing Debt ■ Deposits from Partnership Investors ■ Net Assets ● Gross Floor Area (right scale)
2001 2004 2007 2010 2013 2016 2019 2022(Forecast)
1,000
0
2,000
3,000
4,000
500
0
1,000
1,500
2,000Thousands of tsubo*Billions of yen
(Years ended/ending March 31)* 1 tsubo ≈ 3.3 m²
2003 2007200620052004 2008 2009 2010 2011 2012 2013 2014 2015 2016 2017 2018 2019(Forecast)
100
0
150
200
15
50
0
30YenBillions of yen
(Years ended/ending March 31)
30
242221
1814
96
27
20
10
Based on our fundamental mission “to create even better social assets for the next generation” through our business we are committed to creating cities and urban spaces that are resilient to disasters, friendly to people and the environment, and in harmony with history and culture. In the development of office buildings for lease, we have long focused on redevelopment that makes significant contributions to enhancement of disaster prevention, such as through elimination of areas with densely packed wooden houses and widening of narrow streets, and to vitalization of communities. Together with local residents and various other stakeholders, we are promoting development of thriving communities that are safe and secure. In the Shinchiku Sokkurisan remodeling business, we are extending the lifespan of houses through full remodeling, including seismic reinforcement. Making use of existing buildings to the extent possible leads to far less industrial waste than in the case of rebuilding while also contributing to energy saving and reduction of other environmental impacts. We are also developing communities in harmony with history and culture, such as by remodeling traditional wooden houses that are
Redevelopment business: Izumi Garden (Roppongi, Tokyo)
Shinchiku Sokkurisan remodeling business: Remodeling of traditional wooden houses
The Sumitomo Realty Group will redouble our efforts to reach the targets set out in the Eighth Management Plan and continue moving forward to achieve sustainable growth. We would like to express our gratitude to our shareholders, investors and all our stakeholders, and ask for their continuous, long-term support.
● Please refer to page 30 for further information regarding our redevelopment business.
● Please refer to page 28 for further information regarding our CSR activities through business.
Before
After

1716 Integrated Report 2019 Sumitomo Realty & Development Co., Ltd.
● Vigorous promotion of redevelopment projects in central Tokyo and an extensive track record
● Tokyo’s No. 1 office building owner with a portfolio of over 220 high-performance buildings, primarily in the seven central districts of Tokyo, with cutting-edge exteriors and the latest facilities and specifications
● Strong market competitiveness due to a portfolio centering on buildings that are “located in central Tokyo, new, and large-scale”
● Active promotion of BCP compliance through introduction of seismic isolation/vibration control structures at 80% of the buildings we own as well as by implementing uninterrupted power supply systems
LEASING Unique Features and Competitive Advantages
Remodeling—Shinchiku Sokkurisan● No. 1 in the industry with an innovative “full remodeling package” system, an
alternative option to the conventional rebuilding● Possible to offer seismic reinforcement optimal for implementation at houses of all
ages● 50-70% of the rebuilding cost. Worry-free fixed pricing based on the floor area● Each project managed entirely by a dedicated sales engineer and construction
overseen by a dedicated master carpenter with proven knowledge and skills● In addition to remodeling detached houses, promoting skeleton reform of
exclusively owned areas of condominiums nationwide enabling flexible layout changes. No. 1 in the industry for five consecutive years
Custom Homes● Model home exhibitions at 123 locations primarily in major cities throughout Japan● Offering advanced functional homes with attractive design utilizing expertise in
condominium development● Emphasizing product planning to enhance safety of homes, including development
of proprietary earthquake-resistant technologies, such as “seismic control systems” and “power panels” (patented)
CONSTRUCTION Unique Features and Competitive Advantages
1999 2000 2001 2002 2003 2004 2005 2006 2007 2008 2009 2010 2011 2012 2013 2014 2015 2016 2017 2018 2019 2020
160
140
120
100
80
60
40
20
0
Billions of yen
(Forecast)
Significantly Driving Growth with the Leasing Business
High level of capital,low level of
human capitalRelatively high level ofcapital, relatively highlevel of human capital Relatively low level of
capital, relatively highlevel of human capital
Sumitomo Fudosan Villa Fontaine Co., Ltd.Sumitomo Fudosan Bellesalle Co., Ltd.
Sumitomo Fudosan Syscon Co., Ltd.
Sumitomo Fudosan Esforta Co., Ltd.Izumi Restaurant Co., Ltd. Sumitomo Real Estate Sales Co., Ltd.
At a Glance
Capital
Human Capital
● No.1 supplier of condominium units for five consecutive years both nationwide and in the Tokyo Metropolitan area
● Operating in major cities throughout Japan. Stable supply with properties in the Tokyo Metropolitan area accounting for 80% of the portfolio
● Strengthening product planning to maintain asset value for the future, such as signature stylish exteriors, elegant entrances, rich array of facilities in common areas, disaster-resistant high specifications for standardized performance, and introduction of the latest household appliance
● Operating Grand Mansion Gallery that offers wide-ranging information on selecting condominiums and enables customers to review at a single location all the properties available
SALES Unique Features and Competitive Advantages
● A network of 270 directly operated brokerage offices nationwide with a leading track record in the industry
● Sales system rooted in the community based on the customer-first principle● Operating Mansion Plaza, a brokerage office specialized in premium
condominiums, at five locations in central Tokyo; strengthening initiatives to capture new needs in the expanding market for pre-owned condominiums margins.
BROKERAGE Unique Features and Competitive Advantages
LEASING
OTHERS
Custom home construction and remodeling and related activities
CONSTRUCTION
Mid- and high-rise condominium, detached house and housing lot development and
sales and related activities
Leased propertymanagement consignment
Outsourced management consignment(after sale)
SALES
Brokerage and sales on consignment of real estate and related activities by Sumitomo Real Estate Sales Co., Ltd.
BROKERAGE
Business Portfolio
LEASINGSALES
CONSTRUCTIONBROKERAGE
Office building, condominium and other property leasing and management and related activities
Sumitomo Realty & Development Co., Ltd.
Sumitomo Fudosan Tatemono Service Co., Ltd.
Operating Income (Years ended/ending March 31)
■ LEASING ■ SALES ■ CONSTRUCTION ■ BROKERAGE
■ LEASING ■ SALES ■ CONSTRUCTION ■ BROKERAGE ■ OTHERSLow level of capital,
high level ofhuman capital
Refer to page 18.
Refer to page 27.
Refer to page 22.
Refer to page 24.
Refer to page 26.
Revenue fromOperations
OperatingIncome
37% 62%
33%
20%
22%
7%1%
8%
9%1%
LEASINGLEASING
* The Company changed its accounting policy (revenue recognition standards of Sumitomo Real Estate Sales) from the beginning of the fiscal year ending March 31, 2020. The figures provided for the composition of business portfolios and the fiscal year ended March 31, 2019 are those after retrospective application.

1918 Integrated Report 2019 Sumitomo Realty & Development Co., Ltd.
Review of Operations
Sumitomo Realty made its full-scale entry into the office building leasing business in the latter half of the 1970s. Ever since, we have continued to develop excellent office buildings focusing on redevelopment projects in central Tokyo. We weathered the bursting of Japan’s economic bubble in the 1990s and the Lehman crisis in the 2000s without selling off buildings we own and steadily increased the number of buildings. As a result, Sumitomo Realty has become the No. 1 owner of office buildings in Tokyo with more than 220 buildings in central Tokyo.
Overview of the Fiscal Year
The Tokyo office building market, where more than 90% of our leasing portfolio is concentrated, experienced continued strong new demand from relocations and floor space expansions of existing tenants, against the backdrop of companies’ vigorous recruitment plans and improvement of the working environment in response to work style reform. Vacancy rates remained low and rents for renewed leases continued on an upward trend. Reflecting such an environment, the segment recorded revenue and profit growth for the March 2019 fiscal year based on improved vacancy rate and higher rents from existing buildings as well as full-year contribution from new buildings completed during the previous fiscal year, including Sumitomo Fudosan Osaki Garden Tower. The segment’s revenue from operations and operating income both reached record-high levels for the fourth consecutive year. The vacancy rate for existing buildings decreased below 3% for the first time in 18 years, to 2.8% (4.9% at the end of the previous fiscal year). Buildings completed during the fiscal year under review, including Sumitomo Fudosan Onarimon Tower and Sumitomo Fudosan Shibuya Tower, are already fully occupied and in operation. Buildings scheduled for completion in the next fiscal year and subsequent years, including Sumitomo Fudosan Akihabara First Building and Sumitomo Fudosan Kojimachi Garden Tower, are approaching 100% occupancy. Thus, tenant acquisition for new buildings is on a good track, at a pace exceeding initial expectations.
■ Operating Income ● Operating Margin (right) ■ Outright Ownership ■ Sub-lease
Outlook
For the March 2020 fiscal year, we forecast a 2.2% year-on-year increase in revenue from operations to ¥390.0 billion and an 8.7% year-on-year increase in operating income to ¥163.0 billion, owing to rent increases and lower vacancy rates for existing buildings as well as full-year contribution from new buildings, including Sumitomo Fudosan Onarimon Tower and Sumitomo Fudosan Shibuya Tower. We aim to achieve record-high earnings for the fifth consecutive year.
Business activities to support value creation
LEASING
T O P I C S
All-weather event area available throughout the year
"Sankaku Hiroba" (triangular plaza) of Shinjuku Sumitomo Building will debut in June 2020Our flagship Shinjuku Sumitomo Building is located near Shinjuku Station, which is the world’s busiest railway station, used by more than three million people each day. A large-scale refurbishment plan is underway for the Shinjuku Sumitomo Building and "Sankaku Hiroba" (triangular plaza), a huge event space, will open in June 2020. With capacity sufficient for some 2,000 people, Sankaku Hiroba will be an all-weather atrium unaffected by the weather or the temperature outside while maintaining the look and feel of an outdoor venue. Taking advantage of the lofty structure with a height equivalent to that of a six-story building, Sankaku Hiroba will be suitable for diverse large-scale events, such as sports and festivals. It will also contribute to urban disaster mitigation in the event of an earthquake or other disaster, providing shelter for people unable to return home. In addition to Sankaku Hiroba, taking advantage of the location near Shinjuku Station, plans also call for development of an international conference center for business conferences and large-scale international events. Through this project, the Shinjuku Sumitomo Building will contribute to further vitalization of Shinjuku as a bustling urban hub. This project was approved by the Ministry of Land, Infrastructure, Transport and Tourism as a private urban reconstruction project plans in August 2017. Certified by the Prime Minister of Japan as a project for a national strategic special zone, this project is highly regarded as one that will contribute to enhancement of the international business environment and attractiveness for tourists while also strengthening urban disaster mitigation capabilities.
Sumitomo Fudosan Shibuya TowerLocation: Shibuya Ward Completion: Feb 2019Gross Floor Area: 10,573 tsubo No. of Floor: 21 above ground/2 below ground
2015 2016 2017 2018 2019 20200
100
200
300
400
(Forecast)
Billions of yen
Revenue from Operations
289.1313.3
337.5353.9
381.8 390.0
2015 2016 2017 2018 2019 20200
50
100
150
200
(Forecast)
Billions of yen %
Operating Income and Operating Margin
104.4111.3
126.2139.4
149.9163.0
36.1 35.5 37.4 39.441.839.3
0
25
50
75
100
2015 2016 2017 2018 20190
3,000
1,500
4,500
6,000Thousands of m2
Gross Floor Area
914902
820817 811
3,1893,493
3,7904,026
4,226
Sumitomo Fudosan Shinjuku Central Park Tower
Location: Shinjuku Ward Completion: Aug 2019Gross Floor Area: 18,178 tsubo No. of Floor: 33 above ground/2 below ground
Office Building
Sumitomo Fudosan Akihabara Ekimae BuildingLocation: Chiyoda WardGross Floor Area: 7,819 tsuboCompletion: Aug 2019No. of Floor: 21 above ground/2 below ground
Sumitomo Fudosan Akihabara First BuildingLocation: Chiyoda WardGross Floor Area: 8,216 tsuboCompletion: Oct 2019No. of Floor: 23 above ground/1 below ground
Public viewing
Sports event Exterior rendering

2120 Integrated Report 2019 Sumitomo Realty & Development Co., Ltd.
International Terminal
Domestic Terminal 1
Domestic Terminal 2
Haneda Airport
Project site
Tonomachi KING SKYFRONT
Connecting road to be newly constructed
Haneda Airport Zone 1
Review of Operations
With 1,717 rooms consisting of 160 luxury rooms and 1,557 high-grade rooms, and direct access to Haneda Airport one of the largest airport hotels in Japan
Business activities to support value creation
LEASING
Condominium Leasing
We manage and operate about 5,300 condominium units for leasing primarily in the 23 wards of Tokyo. Of these, 3,400 units of 25 buildings are the La Tour series of premium residences for leasing in central Tokyo, such as in Daikanyama, Roppongi, Shibuya, and Shinjuku. Offering good views, high-grade specifications and facilities, hotel-style bilingual concierge services, and advanced security systems, the La Tour series is well received by affluent clients worldwide. (As of July 31, 2019)
We operate 29 event halls/conference centers in central Tokyo from which customers can select the optimum venues and packages according to their preferred location and purpose. We are an industry leader in terms of the number of facilities in Tokyo Metropolis. All our venues are equipped with an array of equipment and fixtures and are easily accessible, and there is a wide choice of venues to meet diverse needs of events ranging from large events such as exhibitions and entertainment, and seminars such as academic conferences and lectures, to outdoor events. We also operate eight belle salle LOUNGEs, which offer pay-by-the-hour work spaces available even for one person.
The Villa Fontaine series is our high-grade business hotels at prime locations that offer slightly larger guest rooms than average, spacious beds and bathrooms, and stylish interiors. We operate 13 Villa Fontaine hotels in central Tokyo and one each in Osaka and Kobe. We operate 2,764 guest rooms (as of March 31, 2019), including Village Izukogen and Village Kyoto, which are resort/tourist hotels.
Hotels Sumitomo Fudosan Villa Fontaine Co., Ltd.
Multipurpose HallsSumitomo Fudosan Bellesalle Co., Ltd.
A complex consisting of a hotel, retail, a bus terminal, a spa, and other facilities with direct access to Haneda Airport International Terminal, the gateway to Japan, will debut in spring 2020. With 1,717 rooms, this will be one of the largest* airport hotels in Japan, meeting the diverse needs of inbound and outbound tourists and business people as well as VIPs. On the top floor of the hotel, travelers will be able to relieve their fatigue at a natural hot spring offering a view of Mt. Fuji, the first such facility at an airport hotel in Japan.
Plan summaryLocation Koto-ku,Tokyoarea M area S areaSite area 32,000m2 42,810m2
Floor area 161,000m2 172,000m2
Main useHousing, childcare facilities,
parking lotCommercial, hotel, service
apartment, hall, parking lot, etc.
Construction October 2016 October 2017Completion (planned) October 2017 January 2020
Project outlineLocation Haneda Airport 2-chome, Ota ward, TokyoSite area 43,035 m2
Gross floor area 91,680 m2
No. of floors 12 above groundScheduled opening Spring 2020
Ariake Station
Project siteToyosu Market
Daiba
Tokyo Big Sight
Ariake Colosseum
Two Major Large-scale Complex Development Projects
Haneda Airport Project
Ariake Garden
Project outlineLocation Ariake 2-chome, Koto Ward, Tokyo
Site area Approx. 107,000 m2
Gross floor area Commercial district: approx. 172,500 m2
Residential district: approx. 161,000 m2
No. of floors Commercial building: 5 above ground, 1 below ground
Annex: 6 above ground, 1 below ground
Hotel: 16 above ground, 1 below ground
Hall: 5 above ground, 1 below ground
Residential towers: 33 above ground, 1 below ground
Scheduled opening From spring 2020 onward
* The number of rooms, 1,717 rooms, is the largest among hotels located within airport sites in Japan (as of January 2019, based on research by Sumitomo Realty)
Large complex consisting of retail, a hotel, a hall, residences, and a theater
In spring 2020 a large complex is scheduled to open in Ariake of the Tokyo Bay area. The complex will consist of a commercial facility with some 200 retail tenants, a hall to be used for concerts and other events with a maximum audience capacity of about 8,000 people, a high-grade hotel with 749 rooms, a spa, a park, a theater, and a seismically-isolated triple-tower for condominiums with total units of 1,539.

2322 Integrated Report 2019 Sumitomo Realty & Development Co., Ltd.
Business activities to support value creation
Review of Operations
SALES
Having entered the condominium sales business in the first half of the 1960s, Sumitomo Realty is a pioneer in the domestic market for condominium development and sales. We have become a leading company for condominium sales in Japan by staying ahead of our competitors, strategically focusing on city centers and proactively developing large, high-rise properties. We have been the No. 1 supplier of condominium units both nationwide and in the Tokyo Metropolitan area for five consecutive years.
Overview of the Fiscal Year
The condominium market saw continued firm demand from consumers looking to purchase condominiums owing to low interest rates as prices remained high, especially in central Tokyo, reflecting the limited supply of new condominiums. In such an environment, we delivered a total of 5,970 condominium units, detached houses and land lots during the March 2019 fiscal year, an increase of 89 units from the previous fiscal year, owing to the start of delivery of units in projects such as Grand Hills Motoazabu, City Tower Kokubunji the Twin, City Terrace Yokohama Nagatsuta, and City Tower Higashi Umeda Park Front. As a result, the segment achieved record results in terms of the number of units delivered, revenue from operations, and operating income. The segment, with income at a high level, achieved an increase in operating income for the ninth consecutive year. The number of condominium units sold decreased by 2,244 units from the previous fiscal year to 5,111 units. We controlled the pace of concluding contracts, including for units whose sales are to be recorded in the next fiscal year, because progress exceeded our initial expectations. As a result, the number of condominium units sold during the fiscal year under review was lower than the level for the previous fiscal year when the number of new condominium units brought to market was particularly high. Contracts have already been concluded for about 80% (about 65% for the previous fiscal year) of a total of 5,300 condominium units to be delivered in the next fiscal year. We are making good progress toward achievement of the earnings targets for the next fiscal year.
City Tower Kokubunji the Twin
Location: Kokubunji, TokyoNo. of units for sale: 554
No. of Floor: (West) 36 above ground/3 below ground (East) 35 above ground/2 below groundScheduled Delivery: 2019
2015 2016 2017 2018 2019 20200
100
200
300
400
(Forecast)
Billions of yen
Revenue from Operations
264.2 274.8
314.3 311.2331.8 320.0
2015 2016 2017 2018 2019 20200
15
30
45
60
(Forecast)
Billions of yen
0
10
20
30
40%
Operating Income and Operating Margin
43.8 44.2 46.2 46.8 47.1 47.0
16.6 16.1 14.7 15.1 14.714.2
2015 2016 2017 2018 2019 20200
2,000
4,000
6,000
8,000
(Forecast)
Units
Units Delivered*
5,3514,996
5,716 5,881 5,9705,300
Outlook
5,300 condominium units are expected to be delivered and contracts had already been concluded for about 80% of them as of the beginning of the March 2020 fiscal year. Although we forecast a 3.5% year-on-year decrease in revenue from operations to ¥320.0 billion, we plan to maintain operating income of ¥47.0 billion, the same level as for the March 2019 fiscal year. Our target for the number of condominium units sold is 5,000 units for the March 2020 fiscal year, including units to be delivered thereafter.
T O P I C S
In 2018, Sumitomo Realty became the No. 1 supplier of condominium units both nationwide and in the Tokyo Metropolitan area for the fifth consecutive year. In the Eighth Management Plan, numerous projects are scheduled in central Tokyo and in Osaka, Sapporo and other major cities, including City Towers Tokyo Bay, which is a large-scale condominium building with 1,539 units; City Tower Oimachi comprising residences, commercial facilities, and greenery; and City Tower Osaka Honmachi, which is one of the largest projects in Osaka City.
City Tower Ginza Higashi
City Tower Musashi-koyama
City Tower Ebisu
City Tower Osaka Honmachi
Location: Koto Ward, TokyoNo. of units for sale: 1,539No. of floors: (West) 32 above ground 1 below ground (Central) 33 above ground (East) 33 above groundScheduled delivery: 2020
City Towers Tokyo Bay
Location: Shinagawa Ward, TokyoNo. of units for sale: 363No. of floors: 26 above ground/ 1 below groundScheduled delivery: 2020
Shinagawa East City Tower
Name Location No. of Units for sale No. of Floors
City Tower Ginza Higashi Chuo Ward,Tokyo 48322 above ground/1 below ground
Shinagawa East City Tower Shinagawa Ward,Tokyo 36326 above ground/1 below ground
City Tower Ebisu Shibuya Ward,Tokyo 30723 above ground/2 below ground
City Towers Tokyo Bay Koto Ward,Tokyo 1,53932 above ground/1 below ground (West)33 above ground (Central / East)
City Tower Shinagawa Park Front Shinagawa Ward,Tokyo 31223 above ground/1 below ground
City Tower Sapporo Sapporo 16531 above ground/1 below ground
City Tower Oimachi Shinagawa Ward,Tokyo 49329 above ground/1 below ground
City Tower Tokorozawa Classy Tokorozawa 27629 above ground/2 below ground
City Tower Aoi Nagoya 354 20 above ground
City Tower Musashi-koyama Shinagawa Ward,Tokyo 31841 above ground/2 below ground
City Tower Osaka Honmachi Osaka 855 48 above ground
Grand Hills Minami Aoyama Minato Ward,Tokyo 11518 above ground/2 below ground■ Operating Income ● Operating Margin (right) *Number of units includes condominium units, detached houses and land lots.
Condominiums
Principal Condominium Projects in the Eight Management Plan

2524 Integrated Report 2019 Sumitomo Realty & Development Co., Ltd.
Business activities to support value creation
Review of Operations
CONSTRUCTION
2015 2016 2017 2018 2019 20200
60
120
180
240
(Forecast)
Billions of yen
Revenue from Operations
189.0199.1 203.6 209.4
221.7230.0
0
5
10
15
20
25
0
5
10
15
20
25
2015 2016 2017 2018 2019 2020(Forecast)
Billions of yen %
Operating Income and Operating Margin
13.015.3
13.9
16.1
20.422.0
6.9 7.7 6.8 7.79.69.2
2015 2016 2017 2018 2019 20200
3,000
6,000
9,000
12,000
0
1,000
2,000
3,000
4,000
(Forecast)
Units Units
Shinchiku Sokkurisan and Custom Home Units Contracted
7,310 2,4558,454
2,8828,770
2,7619,350 2,990
10,449
3,077
11,000
3,100
One of our projects in Shinchiku Sokkurisan remodeling business received a Special Award (Association of Housing Warranty Insurers Chairman’s Award) at the 35th Housing Renovation Competition held by the Center for Housing Renovation and Dispute Settlement Support. This was the 11th award that we have received at this competition since the March 2006 fiscal year. With this project, the customer, who had initially intended to build a new house, was able to achieve what he had in mind thanks to our renovation technology. Moreover, since remodeling has increased earthquake resistance and improved thermal insulation while also realizing ease of maintenance for water supply and drainage pipes, the house is expected to endure over the long term so that it can be handed down in good condition to the next generation. This renovation project was highly regarded as a proposal for remodeling an aged house so that it would be as good as or better than a newly built house while extending the life of the house.
—For an aged house remodeled to be as good as or superior to a newly built one—
Special Award received at the Housing Renovation Competition
T O P I C S Remodeling—Shinchiku Sokkurisanachieved higher revenue and higher profit owing to an increase in the number of units delivered and improvement in profitability. Operating income increased more than 20%, setting a new record after a five-year hiatus since the March 2014 fiscal year.
Outlook
The segment plans to increase the number of units contracted centering on the Shinchiku Sokkurisan remodeling business. We forecast a 3.7% year-on-year increase in revenue from operations to ¥230.0 billion and a 7.8% year-on-year increase in operating income to ¥22.0 billion. We aim to achieve record highs for both revenue from operations and operating income.
Overview of the Fiscal Year
In the housing construction market, although owner-occupied housing starts were higher than the level for the previous fiscal year, the level remained below 300,000 units. On the other hand, remodeling is a promising growth market, and we expect rising demand for remodeling given that the need to accumulate a stock of high-quality residential properties is an issue in Japan. During the March 2019 fiscal year, both the Shinchiku Sokkurisan remodeling business and the custom homes business achieved new records in terms of the number of units contracted, exceeding 10,000 units and 3,000 units, respectively. Both businesses also set new records in terms of the number of units delivered and revenue from operations. As a result, the segment
Remodeling—Shinchiku Sokkurisan Custom Homes
Before
Before
BeforeAfter
AfterJ・LECONTE
PREMIUM.J
PREMIUM.J
Detached house
Condominium
Before After
■ Operating Income ● Operating Margin (right) ■ Shinchiku Sokkurisan ■ Custom Homes (right)
Sumitomo Realty launched the Shinchiku Sokkurisan, an innovative, first-of-its-kind full remodeling package in the industry, in 1996. Rolled out nationwide step-by-step, it has become the top brand in the market with a cumulative total of more than 130,000 units contracted. Furthermore, we started skeleton renovation business for condominiums in 2000, ahead of industry peers, and have been No. 1 in revenue from condominium remodeling five years running.
In 1972 Sumitomo Realty established a subsidiary in the U.S. where platform wood-frame construction is widely used, subsequently introducing technology cultivated in the U.S. to a business in Japan. We launched American Comfort custom home construction business in 1995, followed by the debut of J∙URBAN urban-style housing series in 2003, and their urban exteriors were well received. Aiming for further expansion of the business, we added the “wood panel method” to our lineup in 2014 to strengthen the appeal of our products.
Remodeling—Shinchiku Sokkurisan Custom Homes

2726 Integrated Report 2019 Sumitomo Realty & Development Co., Ltd.
Business activities to support value creation GROUP COMPANIES
Review of Operations
BROKERAGE
2015 2016 2017 2018 2019 20200
20
40
60
80
(Forecast)
Billions of yen
Revenue from Operations
58.561.5
66.7 69.2 71.9 73.0
2015 2016 2017 2018 2019 20200
6
12
18
24
(Forecast)
Billions of yen
0
15
30
45
60%
Operating Income and Operating Margin
16.517.7
19.1
21.5 21.022.0
28.1 28.8 28.7 31.0 30.129.2
2015 2016 2017 2018 2019 20200
400
800
1,200
1,600
(Forecast)
Billions of yen
0
Transactions
Number of Transactions and Transaction Value
1,065.7 1,065.71,193.0
1,257.51,326.4 1,350.0
33,968 35,987 36,108 37,058 38,00037,643
20,000
40,000
60,000
80,000
year, the network had a total of 270 offices nationwide as of March 31, 2019.
Outlook
We will strive to increase the number of transactions and aim to secure profit on a par with the level for the March 2019 fiscal year. We forecast a 1.6% increase in revenue from operations to ¥73.0 billion and operating income of ¥22.0 billion, the same level as the March 2019 fiscal year.
Overview of the Fiscal Year
In the existing home market, the number of sales contracts concluded for condominium units in the Tokyo metropolitan area remained high and average contract prices continued to rise. In this environment, the segment recorded a 1.6% increase in the number of transactions, to 37,643 units, led by existing-home sale transactions, achieving a record high for the fourth consecutive year. In addition, the total transaction value rose to ¥1,326.3 billion, also a record high, largely attributable to an increase in the unit transaction value that was particularly marked in central Tokyo. As a result, the segment maintained revenue growth for the tenth consecutive year and operating income growth for the fourth consecutive year, resulting in record-high revenue from operations and record-high operating income. With the addition of four directly operated offices during the fiscal
Sumitomo Real Estate Sales Co., Ltd. was established in 1975 to conduct sales of condominiums developed by Sumitomo Realty. Sumitomo Real Estate Sales entered the real estate brokerage sector in 1979, gaining a listing on the Tokyo Stock Exchange in 1998 and achieving significant success. To achieve further growth as the Sumitomo Realty Group, Sumitomo Real Estate Sales delisted in 2017 and became a wholly owned subsidiary of Sumitomo Realty. We will strive to use our sales network more effectively so as to further increase market share.
Mansion Plaza specializing in brokerage of premium condominiums in central Tokyo opens—Services offered by professionals with excellent track records, experience, and knowledge of condominium brokerage—
In July 2019 Sumitomo Real Estate Sales Co., Ltd. opened Mansion Plaza at five locations in central Tokyo. Mansion Plaza specializes in sales and brokerage of premium condominiums in central Tokyo that have high asset value based on a comprehensive assessment in terms of location, scale, management, etc. At Mansion Plaza, professionals who possess the Mansion Expert in-house qualification offer brokerage services. These Mansion Experts have knowledge of condominium structures, facilities, market conditions, transactions, etc., as well as excellent track records and a wealth of experience in brokerage of premium condominiums in central Tokyo.
T O P I C S
Sumitomo Fudosan Tatemono Service Co., Ltd. Sumitomo Fudosan Syscon Co., Ltd.Sumitomo Fudosan Tatemono Service Co., Ltd. conducts property management for about 190,000 units nationwide centering on Sumitomo Realty's condominiums. In pursuit of comfortable, safe and secure living environments for customers, offering services ranging from daily building management to concierge services (consultancy for minor repair of rooms and equipment replacement, introduction of special benefits available from the Sumitomo Group’s businesses), the company responds to various customer needs based on abundant know-how and solid technological capabilities. Residents of condominiums managed by the company can use professional housecleaning services, housekeeping services, and other useful lifestyle-related services and benefits.
Sumitomo Fudosan Syscon Co., Ltd. sells interiors to mainly Sumitomo Realty's customers of their condominiums, custom homes, and remodeling. The company’s interior concierges propose interiors according to customers’ requests from among the products of over 300 manufacturers in Japan and overseas. The company also constructs Mansion Gallery and carries out interior design and finishing for hotels and commercial facilities, as well as offers proposals for effective land use, such as car park operation.
Sumitomo Fudosan Esforta Co., Ltd.Sumitomo Fudosan Esforta Co., Ltd. directly manages six ésforta fitness clubs, primarily in Tokyo. Based on the concept of “assigned instructor system,” at each outlet instructors propose comprehensive fitness menus according to the member’s needs by combining gym, pool, studio, and nutritional programs and provide support. The company also operates a golf academy and fitness studios primarily offering yoga and dance programs. In addition, utilizing the know-how cultivated through operation of a wide range of facilities, the company is contracted by nine municipalities to operate and manage public sports facilities (as of April 1, 2019).
Izumi Restaurant Co., Ltd.
Sumitomo Realty & Development CA., Inc.Sumitomo Realty & Development CA, Inc. owns and manages InterContinental Los Angeles Century City, a luxury hotel that boasts excellent quality.
Sumitomo Fudosan Villa Fontaine Co., Ltd.
Sumitomo Fudosan Bellesalle Co., Ltd.
Izumi Country ClubIzumi Country Club is a golf club with convenient access, located about 50 km, or a one-hour drive, away from central Tokyo. Taking advantage of the flat landscape, the refined layout with effectively placed ponds and greens as well as the scenery replete with seasonal plants and flowers are enjoyed by players.
■ Operating Income ● Operating Margin (right) ■ Transaction Value ● Number of Transactions (right)
270 directly managed stores(As of the end of March 2019)
Hokkaido area 8 stores
Tohoku area 5 stores
Capital Area 155 stores
Tokai area 17 stores
Kansai Area 72 stores
Chugoku area 7 stores
Kyushu area 6 stores
Refer to page 20.
Izumi Restaurant Co., Ltd. provides catering services for social gatherings and various parties. Its services are popular among tenants of Sumitomo Realty’s office buildings and users of Sumitomo Fudosan Bellesalle (event halls). The company runs Rieven House convenience stores within Sumitomo Realty's office buildings that offer a product mix geared to the needs of office workers.
* The Company changed its accounting policy (revenue recognition standards of Sumitomo Real Estate Sales) from the beginning of the fiscal year ending March 31, 2020. The figures provided for the fiscal year ended March 31, 2019 are those after retrospective application.

28 29Integrated Report 2019 Sumitomo Realty & Development Co., Ltd.
Decline in Japan’s working population
Advent of the super-aged society
Concentration of population in cities
Climate change
Increasing need to extend healthy life expectancy
The Sumitomo Realty Group is engaged in a range of businesses, closely related to people's daily lives, such as office buildings, condominiums, remodeling, custom homes and brokerage. Thus, to achieve sustainable development of the Group, it is indispensable to create even better social assets and pass them down to the next generation through these businesses. By accurately responding to changes in the social environment, Sumitomo Realty is committed to development of safe and secure communities that will continue to deliver value far into the future and contribute to the attainment of SDGs.
Addressing Social Issues through Business Activities
Changes in the external environment
Development of safe and secure communities that will continue to deliver value far into the future
Utilization of Sumitomo Realty’s experience, knowhow, and networks Human resources development Customer support
Development of safe and secure communities that withstand disasters, ensure business continuity, and protect the livelihoods of people
Development of vibrant communities where everyone can live with peace of mind
People-friendly community development
Disaster prevention
BCP compliance
Creation of new value in harmony with history and culture by utilizing contemporary design technology
Harmony with history and culture
Introduction of technology and design contributing to reduction of impacts on the global environment
Reduction of environmental impacts
091_0316001371908.indd 全ページ 2019/12/18 16:46:32
3130 Integrated Report 2019 Sumitomo Realty & Development Co., Ltd.
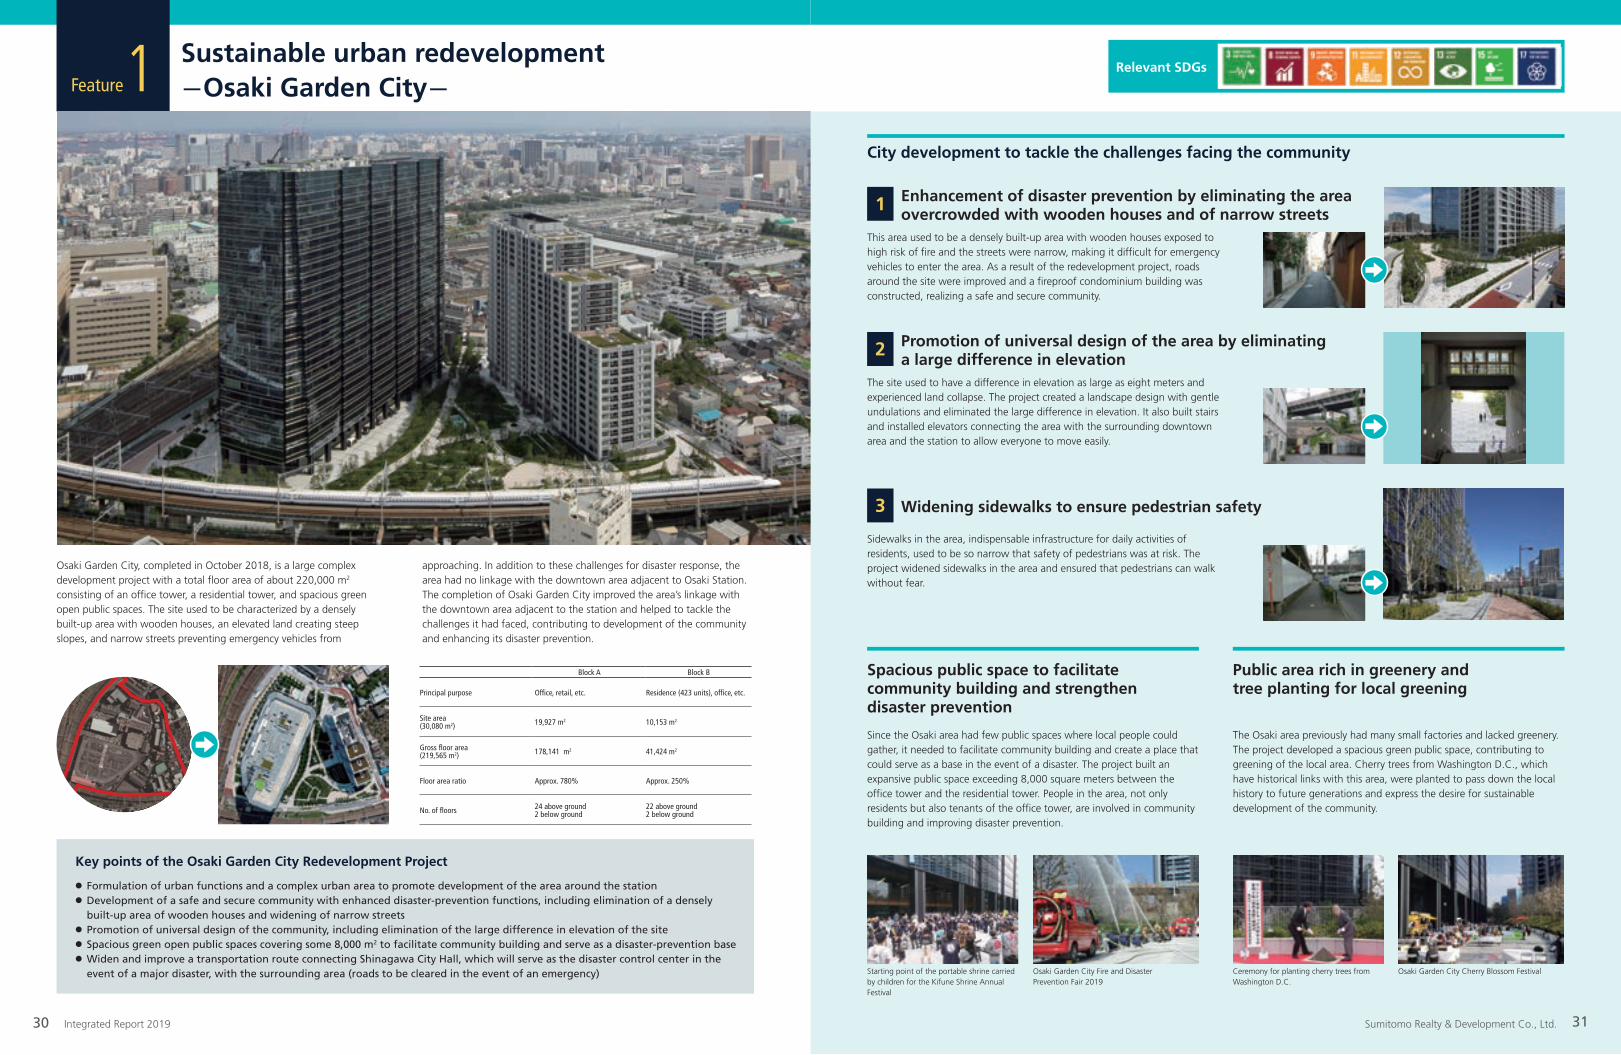
Feature1 Sustainable urban redevelopment -Osaki Garden City-
Relevant SDGs
1
This area used to be a densely built-up area with wooden houses exposed to high risk of fire and the streets were narrow, making it difficult for emergency vehicles to enter the area. As a result of the redevelopment project, roads around the site were improved and a fireproof condominium building was constructed, realizing a safe and secure community.
City development to tackle the challenges facing the community
Enhancement of disaster prevention by eliminating the area overcrowded with wooden houses and of narrow streets
2
The site used to have a difference in elevation as large as eight meters and experienced land collapse. The project created a landscape design with gentle undulations and eliminated the large difference in elevation. It also built stairs and installed elevators connecting the area with the surrounding downtown area and the station to allow everyone to move easily.
Promotion of universal design of the area by eliminating a large difference in elevation
3
Sidewalks in the area, indispensable infrastructure for daily activities of residents, used to be so narrow that safety of pedestrians was at risk. The project widened sidewalks in the area and ensured that pedestrians can walk without fear.
Widening sidewalks to ensure pedestrian safety
Since the Osaki area had few public spaces where local people could gather, it needed to facilitate community building and create a place that could serve as a base in the event of a disaster. The project built an expansive public space exceeding 8,000 square meters between the office tower and the residential tower. People in the area, not only residents but also tenants of the office tower, are involved in community building and improving disaster prevention.
The Osaki area previously had many small factories and lacked greenery. The project developed a spacious green public space, contributing to greening of the local area. Cherry trees from Washington D.C., which have historical links with this area, were planted to pass down the local history to future generations and express the desire for sustainable development of the community.
Spacious public space to facilitate community building and strengthen disaster prevention
Public area rich in greenery and tree planting for local greening
Starting point of the portable shrine carried by children for the Kifune Shrine Annual Festival
Ceremony for planting cherry trees from Washington D.C.
Osaki Garden City Cherry Blossom FestivalOsaki Garden City Fire and Disaster Prevention Fair 2019
approaching. In addition to these challenges for disaster response, the area had no linkage with the downtown area adjacent to Osaki Station. The completion of Osaki Garden City improved the area’s linkage with the downtown area adjacent to the station and helped to tackle the challenges it had faced, contributing to development of the community and enhancing its disaster prevention.
Osaki Garden City, completed in October 2018, is a large complex development project with a total floor area of about 220,000 m2 consisting of an office tower, a residential tower, and spacious green open public spaces. The site used to be characterized by a densely built-up area with wooden houses, an elevated land creating steep slopes, and narrow streets preventing emergency vehicles from
Key points of the Osaki Garden City Redevelopment Project
Block A Block B
Principal purpose Office, retail, etc. Residence (423 units), office, etc.
Site area(30,080 m2) 19,927 m2 10,153 m2
Gross floor area (219,565 m2) 178,141 m2 41,424 m2
Floor area ratio Approx. 780% Approx. 250%
No. of floors 24 above ground 2 below ground
22 above ground 2 below ground
● Formulation of urban functions and a complex urban area to promote development of the area around the station ● Development of a safe and secure community with enhanced disaster-prevention functions, including elimination of a densely
built-up area of wooden houses and widening of narrow streets● Promotion of universal design of the community, including elimination of the large difference in elevation of the site● Spacious green open public spaces covering some 8,000 m2 to facilitate community building and serve as a disaster-prevention base● Widen and improve a transportation route connecting Shinagawa City Hall, which will serve as the disaster control center in the
event of a major disaster, with the surrounding area (roads to be cleared in the event of an emergency)

3332 Integrated Report 2019 Sumitomo Realty & Development Co., Ltd.
Remodeling—Shinchiku SokkurisanFeature2
100%Rebuilding
0%
Types of remodeling Shinchiku Sokkurisan covers
Partial reform
Full remodeling
Renovation
50%60%
70%
Resolve all your problems with your current house
Transform the house into an earthquake-resistant one with peace of
mind while utilizing the existing structural elements as much as possible
Full remodeling
Your dream comes true as if building a custom-built house
Complete renovation of both the interior and the exterior with great flexibility in
terms of change of the layout
Renovation
Social issues concerning houses in Japan
Shinchiku Sokkurisan initiatives concerning social issues
AfterBefore
The Shinchiku Sokkurisan remodeling business based on our concept of safe and secure housing has the industry’s foremost track record for full remodeling with seismic reinforcement as part of the standard package. Shinchiku Sokkurisan has met with a positive response among customers with its remodeling proposals corresponding to the lifestyles of individual households as well as fixed-price system and Sumitomo Realty's unique business model of appointment of a dedicated sales engineer from the first consultation to delivery. The cumulative total of units contracted for Shinchiku Sokkurisan reached 130,000 units (as of December 2018). The lives of houses in Japan are typically much shorter than those of houses in Europe and the U.S. From the viewpoint of efficient utilization of limited resources, Shinchiku Sokkurisan fulfills an important role as the remodeling greatly reduces waste compared with rebuilding. Through Shinchiku Sokkurisan, we will provide highly sustainable houses in which people can live for longer period of time in comfort.
Cumulative total of units contracted for Shinchiku Sokkurisan
Earthquake-resistance of housing stock International comparison of the average age of houses
Industrial waste discharged (construction industry)
1997.3 1998 1999 2000 2001 2002 2003 2004 2005 2006 2007 2008 2009 2010 2011 2012 2013 2014 2015 2016 2017 2018 20190
80
60
40
20
100
120
140Thousand units
Remodeling—Shinchiku Sokkurisan
Full remodeling with a price roughly 50% of rebuilding
New system: neither conventional remodeling nor rebuilding
Seismic reinforcement as standard specification
Clear fixed-price system
No additional charges
Principally remodeling certain parts of the house
Seismic reinforcement by remodeling not considered
unclear pricing
Additional charges incurred due to unexpected circumstances
Although the penetration rate of earthquake-resistant house in Japan is increasing every year, there are still many houses with low earthquake resistance. Moreover, the lives of houses in Japan tend to be short compared with those of houses in Europe and the U.S. and the short rebuilding cycle has emerged as an issue in contemporary Japan. Waste due to demolition of houses accounts for a large share of waste discharged by the construction industry. It is required that lives of houses should be extended, which facilitate the shift to stock-type society where houses could be used by successive generations.
People friendly
Environmentally friendly
Lower cost than rebuilding
Another aspect of Shinchiku Sokkurisan is people-friendly remodeling which includes thermal insulation, waterproofing, and barrier-free design, in addition to seismic reinforcement. Furthermore, in response to change of the family structure and population aging, we offer homes suitable for contemporary lifestyles without rebuilding, such as change of the layout, extension, downsizing, change from a two-story house to a one-story house, and change to a two-family house.
In Shinchiku Sokkurisan remodeling, the principal structural elements of a house are retained, and the life of the house is extended through the reinforcement of earthquake resistance, which makes it possible to minimize discharge of industrial waste, CO2 emissions, and waste of resources. Moreover, customers can live in the house while remodeling work is executed, resulting in elimination of waste, such as packing for moving to temporary accommodation.
The cost of Shinchiku Sokkurisan remodeling is about 50-70% of that of rebuilding. We respond to various customer needs corresponding to lifestyles, desires, and budgets, and execute house remodeling at lower cost than rebuilding. In addition to conventional “partial reform,” we also offer “full remodeling” to transform the existing house into an earthquake-resistant one while utilizing the existing structural elements as much as possible and “renovation” to completely refurbish both the interior and the exterior with great flexibility in terms of change of the layout.
Seismic reinforcementThe launch of Shinchiku Sokkurisan remodeling is the practical expression of our desire to renovate houses, endowing them with earthquake resistance without incurring the high cost associated with rebuilding. This idea was prompted by the collapse of many aged houses in the Great Hanshin Awaji Earthquake of 1995. We introduced a clear fixed-price system with a price roughly 50% of that of normal rebuilding and seismic reinforcement based on earthquake resistance diagnosis as a standard specification. In the Kumamoto Earthquake of 2016, a series of powerful tremors caused houses to collapse that had previously been considered not to need seismic reinforcement. In view of these circumstances, we have developed a proprietary method to address the issues due to such a series of powerful tremors. With the addition of this new method, we now offer seismic reinforcement and damping plans suitable for houses of all ages.
Japan US UK
32.1
66.680.6
0
20
40
60
80
100Without earthquake resistance Approx. 9 million units
With earthquake resistanceApprox. 6 million units
From 1982 onward
1981 or earlier
40,54012,950
3,520
570
15,120
With earthquake resistance Approx. 37 million units
Houses: 7,750
Public Sector Civil Engineering
Private Sector Civil Engineering
Building Work/Renovation
Demolition
RepairYears
Total:72,700
(51% of the discharged waste through demolition)
Source: “Progress of Earthquake Proofing of Houses”Ministry of Land, Infrastructure, Transport and Tourism (data as of 2013)
Source: “International Comparison of the Average Age of Houses Deregistered in 2018” Ministry of Land, Infrastructure, Transport and Tourism
Source: Reference Material 7 of “Residential Land Session, Panel on Infrastructure Development (36th)” Ministry of Land, Infrastructure, Transport and Tourism
Relevant SDGs
Conventional remodeling
Harmony with history and culture
We launched a regional revitalization support service for local cities confronting issues such as depopulation, in order to contribute to invigoration of local regions by utilizing our expertise. The first project was regional revitalization support of Bandai Town in Fukushima Prefecture. Utilizing the expertise of remodeling of traditional wooden houses in the Shinchiku Sokkurisan business, we refurbished buildings with the aim of enhancing functions while retaining the external appearance of the historic townscape. First traditional wooden house remodeling project:
house built over 70 years ago
Unit: thousand tons

3534 Integrated Report 2019 Sumitomo Realty & Development Co., Ltd.
Disaster-resistant Community Development
Action
Example case: Sumitomo Fudosan Osaki Garden Tower
Seismic isolation structure designed to protect people and business
Business continuity planning (BCP) support through multiple safety measures
Disaster prevention for condominiums Sumitomo Realty’s condominiums feature seismic isolation/control structures to prevent deformation of buildings and alleviate shaking during an earthquake. In addition, various disaster countermeasures are implemented, such as installation of emergency power generators, elevator safety functions, storerooms for emergency supplies, and emergency wells.
Providing a regional disaster-response base Public space, created through large-scale development, and halls within office buildings will be used as temporary shelter for people unable to return home in the event of an earthquake or other disaster. In addition to the open space on the site where people can stay, the functionality as an evacuation center has been further enhanced with a warehouse for disaster-response equipment, emergency toilet that can be installed directly to manholes and well water for cleaning the toilet.
Disaster prevention activities involving local residents and customers Sumitomo Realty regularly conducts various disaster drills jointly with tenants of office buildings, local residents, and customers. At Sumitomo Fudosan Shinjuku Garden Tower, in cooperation with the fire station, the police station, and the local government, large-scale drills were conducted, including traffic hand signals exercise with traffic lights off, exercise for rescue from high places, and water-discharge drills. At Hotel Villa Fontaine Tokyo-Shiodome, with the cooperation of an NPO, an emergency instructions and evacuation drill for foreign guests was conducted in four languages.
We consider that creating social assets, such as office buildings and condominiums, and surely handing them over to the next generation are central to the fulfillment of our mission. We aspire to develop safe and secure communities, not only for the residents but also for everyone in the neighborhood, through our focus on buildings that can prevent or withstand damage in the event of disaster, such as a fire or an earthquake, as well as regional disaster preparedness as a communal function.
Key disaster countermeasures (City Towers Tokyo Bay)
Seismic isolation structure
Basic structure
Disaster countermeasures
IsolatorsWhile supporting the building’s weight, they move gently from side to side to reduce intermittent vibrations during an earthquake.
Violent horizontal vibration is caused. Higher floors shake more strongly.
(Conceptual diagram)
Because seismic isolation devices absorb seismic energy,
the building shakes slowly and less deformation occurs.
Earthquake motion (horizontal vibration)
Slow shaking
Seismic isolation devices
Strong shaking
Conventional structure City Towers Tokyo Bay
U-shaped dampersAn earthquake’s seismic energy is absorbed with their stable restoring force characteristics, reducing vibration.
Plaza
multipurpose hall
Traffic hand signals training by the Shinjuku Police Station with traffic lights turned off
Absorb seismic energy
Firm ground and piles
110 piles installedRobust pillars to increase earthquake resistance
Welded closed hoops
For power supply in the event of power outage
Emergency power generator
Automatically stop at the closest floor in the event of an earthquake
Elevator safety device
Useful for extinguishing fire
Fire cistern
Water supply available even if the pump stops
Water supply measures in the event of a disaster
Securing water for domestic use, such as for a toilet
Emergency wellsAvailable even in power outage
Disaster-ready vending machinesUseful in the event of a disaster
Emergency toilets connectable to a manhole
For emergency rescue
Helicopter hovering space
In the event of an emergency, such as an earthquakeEmergency supplies
Provided to each household
2-line power receiving systemUse an extra-high voltage of 66 kV and a 2-line power receiving system in order to cope with emergencies
STEP 1
Electricity generated with fuel oilIn the event of the supply from medium-pressure gas being halted, electricity will be generated with the use of the heavy oil stored in the oil tank installed within the premises.(Supplies 15 VA/m2 for lighting and power sockets, and 7 VA/m2 for air conditioning for 72 hours.)
STEP 3
Electricity generated with medium-pressure gasElectricity is generated with medium-pressure gas in the event of power supplied by substations being cut off due to an emergency. (Supplies 15 VA/m2 for lighting and power sockets, and 7 VA/m2 for air conditioning for at least ten days.)
STEP 2
Seismic isolation devices
Main Line
Auxiliary Line
Transformer substation
Municipal gas facility
oil tank for generator
72-hour supply
Accident
Electrical powertransmission
Medium-pressuregas
Dual-fuel gasturbine
Fuel oil
Break in powertransmission
Power generation
3,000 kVA 2 units
The seismic base-isolation layer cuts down on shaking and reduce shaking in the upper floors.
The seismic base-isolation structureabsorbs the shaking from the ground
Width of earthquake vibration
Relevant SDGs
Cracking of pillars and beams
Deformation of door frames tends to occur
Glass tends to shatter and fall
Concrete tends to fracture and fall
Lighting equipment tends to fall
Sashes tend to come off
Frame tends not to fracture
Deformation of door frames tends not to occur
Furniture tends not to topple over
Lighting equipment shakes less
First-aid kit Long-life drinking water
Three-layer backup system avoids the risk of power outages.
Protection of office workers and businessSumitomo Realty’s office buildings actively employ seismic isolation/control structures whose ability to significantly reduce tremors provides protection for office workers and office automation equipment. Moreover, we are promoting implementation of measures effective for tenants’ business continuity, including installation of large-capacity emergency power generators in buildings to offer sectional supply power in office zones during a blackout.
Emergency backpack

3736 Integrated Report 2019 Sumitomo Realty & Development Co., Ltd.
Environmentally Friendly Community Development
Actions
Sumitomo Realty has gained the S rank (excellent business operator) evaluation under the “Business Operator Classification Evaluation System” (SABC Evaluation System) of the Ministry of Economy, Trade, and Industry whereby business operators are ranked according to the degree of their reduction of energy consumption.
Sumitomo Realty’s office buildings adopt decentralized HVAC systems. Unlike a centralized system for management of an entire building using a single heat source, a decentralized system allows specific air-conditioning setting for each zone, which enhances tenants’ convenience and saves energy. By dividing a floor into zones, it is possible to turn on or off air conditioning and adjust the temperature of each zone. Moreover, the use of natural vents installed at window frames minimizes unnecessary use of air conditioning. This system capable of achieving big energy savings is offered as a standard specification.
Use of recycled waterAt our office buildings and condominium buildings, facilities for reclaiming and treating rainwater and non-fecal wastewater have been vigorously introduced for use of recycled water. Recycled water is used for flushing toilets and for watering greenery and trees.
The strength and rigidity of timber increases in the course of 100 years or so. Short-cycle rebuilding wastes resources, imposing substantial unnecessary costs and generating large amounts of industrial waste because usable robust pillars and beams are discarded. In addition, conventional remodeling involves repeated piecemeal projects, resulting in generation of industrial waste each time. Shinchiku Sokkurisan is a systematic approach to extend the life of existing housing through earthquake-reinforcement work while retaining the main structural elements, thereby minimizing waste of resources and generation of industrial waste.
Extending the life of buildings through architectural design that ensures they are usable for many years with minimal deterioration will minimize resources wasted and industrial waste generated in reconstruction works, thus contributing greatly to reduction of environmental impacts. For office buildings, as well as design for superior earthquake resistance and fire resistance, we emphasize securing of space and design capable of responding to change in workstyles, change in office layout, and evolution of IT. For example, the “ceiling grid system” whereby ceiling equipment is incorporated in lighting panels makes relocation of the equipment easy. Flexible response to changing office layout can minimize waste generation.
Our custom home business employs the “wood panel construction method” for balanced distribution and adsorption of external forces such as earthquakes. In addition, standard specifications include “power panels,” which are strong bearing walls with high magnification. Enhancement of durability of houses extends their life, postponing the need for refurbishment and rebuilding, thus contributing to reduction of industrial waste.
Reduction of energy consumption
Decentralized HVAC system
Sumitomo Realty has introduced a power-sharing, energy-saving system centering on Izumi Garden Tower. In addition to electricity supply from a utility, this system employs private power generation using a co-generation system to supply electricity to Izumi Garden Annex adjacent to Izumi Garden Tower and uses waste heat for highly efficient district heating and cooling on a daily basis, thus contributing to reduction of CO2 emissions (by approx. 2,600 tons, about 8% of current CO2 emissions).
In planning condominium buildings, as well as enhancing insulation performance of floors, walls, and ceilings, we vigorously adopt technologies to enhance energy-saving effects, including roof greening, double glazing, total heat exchange systems, heat pump systems for efficient cooling and heating using heat in the air, heat-recovery-type gas-powered hot water supply systems, bathtubs that retain hot water temperature, and gas cookers with inner flame burners. Photovoltaic power generation facilities and charging stations for electric vehicles are also installed to contribute to energy saving.
Roof greening is an effective and efficient approach to tree planting in urban areas where space is limited. Green rooftops provide insulation by blocking direct sunshine and contribute to energy saving by enhancing the heating and cooling efficiency of the entire building. Roof greening also helps suppress temperature increases due to the heat island phenomenon.
In urban areas with few parks or open spaces, the creation of green open spaces is a vital aspect of new development projects. City Tower Kanamachi has a spacious green area of some 3,800m2, which is open to the public. The planting includes tall trees as well as various shrubs and flowers. This rare place where one can enjoy the changing beauty of the four seasons in an urban setting is a source of delight throughout the year for local residents.
Urban development projects tend to involve the removal of mature trees that are already on sites earmarked for development. In contrast, instead of destroying nature, Sumitomo Realty seeks to preserve them so that they can be utilized as greenery to accomplish attractive urban development in harmony with nature. La Tour Sapporo Ito Garden was developed on the site formerly occupied by Kairakuen, one of the first municipal parks in Japan. The site, which includes a tract of virgin forest conserved since the time of Kairakuen, remains notable as a place where nature flourishes in an urban setting.
Power-sharing, energy-saving system
Initiatives for condominium buildings
Initiatives for office buildings
Roof greening
Green open spaces
Protecting nature
Initiatives through Shinchiku Sokkurisan remodeling
Design of long-life office buildings
Design of long-life detached houses
Energy consumption
2016 2017 2018Energy consumption (kl crude oil equivalent per year)
120,403 123,516 135,320
Intensity (kl/m2 crude oil equivalent per year)
0.03851 0.03785 0.03742
To Protect the Water Environment
Building nameNo. of floors
Gross floor area (m2)
Completion
Shibuya Infoss Tower 21 34,460 March 1998
Sumitomo Fudosan Iidabashi First Building 14 53,322 March 2000
Sumitomo Fudosan Shibakoen First Building 35 63,822 June 2000
Sumitomo Fudosan Shibakoen Tower 30 36,300 October 2001
Sumitomo Fudosan Iidabashi Building No. 3 24 53,047 October 2002
Izumi Garden Tower 43 204,444 October 2002
Sumitomo Fudosan Mita Twin Building West 43 98,338 September 2006
Shinjuku Central Park City 44 130,695 February 2010
Sumitomo Fudosan Shinjuku Grand Tower 40 168,372 December 2011
Sumitomo Fudosan Tamachi First Building 11 21,802 April 2012
Tokyo Nihombashi Tower 35 105,837 April 2015
Sumitomo Fudosan Shinjuku Garden Tower 37 143,372 March 2016
Sumitomo Fudosan Roppongi Grand Tower 43 202,549 October 2016
Sumitomo Fudosan Osaki Garden Tower 24 201,560 January 2018
Sumitomo Fudosan Shibuya Tower 21 34,952 February 2019
Refer to page 32.
Partitions 600
600
Relevant SDGs
Low-e double glazing glass
LED lighting
As well as enhancing insulation performance of external walls for air-conditioning efficiency, low-e double glazing glass is adopted to reduce transmission of solar radiation heat indoors in summer and outflow of heat from indoors in winter.
Energy-efficient LED lighting with brightness sensors is adopted. In addition to low power consumption, it contributes to reduction of CO2 emissions.
To Reduce CO2 EmissionsAlthough various initiatives have been implemented since the adoption of the Kyoto Protocol in 1997, it is reported that CO2 emissions from business operations are still trending upward. Sumitomo Realty is striving to reduce CO2 emissions in various aspects of its business through a shift to energy-saving design and by pursuing other initiatives.
Tokyo Nihombashi TowerFloor zoning for decentralized HVAC installment
To Reduce Industrial WasteIn accordance with the Basic Law for Establishing the Recycling-based Society promulgated in 2000, businesses are required to take action to address the continuing high volume of waste generation, which is considered a pressing issue in Japan. Sumitomo Realty is striving to minimize waste generation when remodeling buildings and upgrading facilities and also working to extend the life of buildings.
To Protect and Promote Greenery—Vigorous promotion of roof greening and tree planting in development projects
Retaining and increasing greenery in cities, that is, creating communities in harmony with natural diversity, is integral to Sumitomo Realty’s approach to environmental protection and urban redevelopment. The provision of public spaces rich in greenery is an indispensable theme incorporated in development plans. These public spaces can be used not only as venues for local people to relax but also contribute to mitigation of global warming and are useful in the event of a disaster.

3938 Integrated Report 2019 Sumitomo Realty & Development Co., Ltd.
Creating a Workplace Environment Suitable for Diverse Human Resources Providing Products and Services to Support Customers' Comfortably Affluent Daily Lives
Sumitomo Realty is working to create a superior workplace environment and implementing various initiatives with the aim of becoming an enterprise where all employees are valued and experience a powerful sense of purpose.
Sumitomo Realty’s products, namely office and residential properties, are important venues where customers conduct business or where their private lives are centered. In order to ensure superior quality management and enhance services, each division is adopting direct marketing and management systems emphasizing communication with customers.
Strengthening the basis of value creation Together with Customers
Hiring of Diverse Human Resources
Sumitomo Realty hires diverse human resources, with an emphasis on individuals with distinctive personalities, through recruitment of new graduates and mid-career professionals with particular expertise and experience. Bonus assessment is conducted on a uniform basis regardless of age and position, promotion is not in accordance with the number of years of service so as to give young employees opportunities, and the progressive performance-linked pay with high-percentage commissions is among the highest in the industry. Within the framework of a flexible personnel system focused on job descriptions and roles, we are working to create a workplace environment where all employees can display their full potential.
Communication with Customers
Sumitomo Realty employees are directly involved in marketing and management of office buildings and condominiums. Directly communicating with customers, they feed back the voice of the customer to product development so that customers’ perspectives are reflected in products attuned to customer needs.
Creating a Good Working Environment
Measures to ensure compliance and prevent harassmentWe are taking steps to raise the awareness of our employees about human rights issues, prevention of different types of harassment, compliance, prevention of long working hours and other issues from various perspectives by periodically holding personnel training programs. Furthermore, internal points of contact have been established for consultation about sexual harassment and other issues and for whistleblowing, respectively. When reports are received at these points of contact, matters are dealt with fairly and strictly, and steps are taken to ensure confidentiality.
Flexible work stylesVarious systems are available to enable flexible work styles, including variable working hours for job categories with considerable variation in workload from month to month or year to year, remote work, and staggered working hours available for female employees with young children. We are endeavoring to create a working environment where all employees can work efficiently by making the best use of the various systems available.
Employees’ Health and Safety
HealthIn addition to financial support for employees receiving a comprehensive medical checkup and free-of-charge influenza vaccination, we conduct an annual health checkup of all employees. Furthermore, employees can seek advice from medical specialists free of charge about mental and physical health. Free-of-charge consultation is also available over the phone, considering privacy. Employees’ working hours are strictly managed to prevent excessively long hours of work. Employees who do more than a certain amount of overtime receive a medical check by an industrial physician based on an interview sheet and, if necessary, employees receive face-to-face health guidance. In these ways, we are implementing careful management of employees’ health. Also, as part of the initiatives to support employee health, Sumitomo Realty has become a corporate member of fitness clubs operated by Sumitomo Fudosan Esforta and has encouraged employees’ use of those facilities.
Elimination of occupational accidentsWith the aim of eliminating occupational accidents, the Construction Divisions hold an annual occupational health and safety conference and each site holds a monthly safety meeting to ensure safety management. Staff of the Construction Safety Management Section which is an organization dedicated to safety management, patrol construction sites throughout Japan and provide guidance.
Initiatives for Empowerment of Women
Our action plan in accordance with the Act on Promotion of Women’s Participation and Advancement in the Workplace is to increase the ratio of women among new hires. Our target is to increase the ratio of women among new hires for sales and engineering, two job categories with promising career opportunities for women, from 17.9% to 25% and from 5.4% to 8%, respectively, in the period from April 2016 to March 2021. The ratio improved every year, and we achieved the target as of March 31, 2019, ahead of the plan, with 26.5% and 9.2%, respectively. We will continue our efforts to create a workplace where women are empowered.
Feedback Meeting
For condominium development, the feedback meeting is held periodically with staff from the after-sales service department as well as sales, architectural design, and management departments participating. Issues reported at the Feedback Meeting are fed back to product development to be reflected as necessary, in review of the architectural design criteria and management, sales, and after-sales service systems. For example, at condominiums with 24-hour manned management, interphones were modified to enable two-way communication between the disaster prevention center and each residence.
Education and Training
In order to enhance the professional and managerial capabilities of individual employees according to the skills they require, we hold various training sessions, conduct OJT, and support employees who are endeavoring to gain qualifications. Moreover, we strive to achieve optimal personnel assignment and to create a workplace where employees can work with peace of mind. For that purpose, we emphasize communication, including through interviews with employees conducted by the Human Resources Department.
Questionnaire Surveys of Customers
Our condominium sales, Shinchiku Sokkurisan remodeling, custom home construction, and hotel operations conduct questionnaire surveys of customers with a view to enhancing customer satisfaction. Sumitomo Fudosan Tatemono Service also conducts questionnaire surveys of directors of home-owner associations of condominium buildings in order to enhance the quality of management.
Customer Center (Call Center)
In 1999, ahead of industry peers, Sumitomo Realty established within the head office a department dedicated to after-sales services, which was previously a unit of a condominium management company. In April 2007 contacts for customers, which were previously separate according to products (condominiums, custom homes, and Shinchiku Sokkurisan remodeling) and regions, were integrated in the Customer Center in order to effectively and speedily respond to the voice of the customer to further enhance customer satisfaction. Calls to the Customer Center’s toll-free number are handled around the clock throughout the year by operators exclusively assigned for that purpose. Customer inquiries, etc. are transferred to appropriate departments to ensure accurate and swift responses. The Customer Center is striving to become a contact point that customers will call whenever they wish to seek advice or for troubleshooting, not just in emergencies.
Review of management, sales, and after-sales service systems
Review of architectural design criteria
Voice of the customer
Feedback meeting
Investor Relations
In addition to swift disclosure of material information to shareholders and investors, the Company posts the latest management information, including the financial summary and other financial data, on its website to enhance management transparency. At a meeting held semiannually to present financial results to analysts and institutional investors, the President and officers in charge make presentations. We also actively engage in small meetings and individual meetings, at which we provide briefings and answer questions, and hold teleconferences in response to inquiries. In addition, we are enriching the provision of information in English.
Information for InvestorsJapanese: http://www.sumitomo-rd.co.jp/ir/ English: http://www.sumitomo-rd.co.jp/english/
Relevant SDGs

4140 Integrated Report 2019 Sumitomo Realty & Development Co., Ltd.
Corporate Governance
Board of Directors and Statutory Auditors (As of September 30, 2019) Outside Director
Statutory Auditors
*Representative Director
Apr 1962 Joined Nippon Sheet Glass Co., Ltd.
June 1996 Managing DirectorJune 1998 Representative Director,
PresidentJune 2004 Representative Director,
ChairmanJune 2008 Director, Chairman of the
BoardOct 2009 Director, Chairman of the
Board - ChairmanJune 2010 Executive AdvisorJune 2012 Honorary Senior Advisor
(present)June 2014 Statutory Auditor of the
Company (present)
Outside Director
Yozo Izuhara
Apr 1970 Joined the CompanyJune 1998 DirectorJune 2007 Director - PresidentSept 2019 Director - Chairman of the Board (present)
Chairman of the Board
Kenichi Onodera
Apr 1983 Joined the Company June 2009 Director June 2010 Representative Director
(present) June 2013 Director - Deputy President
(present) Nov 2017 Head of Residential Business
Division (present)
Deputy President
Masato Kobayashi*
Apr 1984 Joined the Company June 2013 Director (present) Sept 2016 Head of Shinchiku - Sokkurisan
Remodeling Division (present)
Director
Hiroshi Kato
Apr 1985 Joined the Company Sept 2016 Head of Urban Property
Development Division(present) June 2018 Director (present)
Director
Hisatoshi Katayama
Apr 1985 Joined the Company June 2011 Director (present) Nov 2016 General Manager of Finance
and Accounting Department, Management Division (present)
Director
Yoshiyuki Odai
Apr 1984 Joined the Company June 2013 Director (present) Apr 2019 Representative Director -
President of Sumitomo Real Estate Sales Co., Ltd. (present)
(Significant concurrent positions outside the Company) Representative Director - President of Sumitomo Real Estate Sales Co., Ltd. Director
Koji Ito
Apr 1984 Joined the CompanyJune 2009 DirectorJune 2010 Representative Director
(present)June 2013 Director - President (present)May 2017 Head of Building Development
Division(present)
President
Kojun Nishima*
Apr 1981 Joined the Company June 2008 Director June 2010 Representative Director
(present) June 2013 Director - Deputy President
(present) Mar 2016 Head of Management Division
(present)
(Significant concurrent positions outside the Company) Director of Sumitomo Real Estate Sales Co., Ltd.
Deputy President
Nobuaki Takemura*
Sept 1980 Joined Sumitomo Metal Mining Co., Ltd.
June 2006 Director, Managing Executive Officer
June 2007 President, Representative Director
June 2013 Chairman, Representative Director
June 2016 ChairmanJune 2017 Executive Advisor (present)
(Significant concurrent positions outside the Company)Executive Advisor of Sumitomo Metal Mining Co., Ltd.Outside Director of NAGASE & CO., LTD.Outside Director of JFE Holdings, Inc.
Outside Director
Nobumasa Kemori
Yoshifumi Nakamura
Toshikazu Tanaka
Takaaki Ono*
Yoshiyuki Norihisa*
*Outside Statutory Auditors
Relationship with the Company and Reasons for Appointment
Name Designation as Independent Officer Supplementary Explanation of the Relationship Reasons for Appointment
Yozo Izuhara ○
Mr.IzuharapreviouslyworkedforNipponSheetGlassCo.,Ltd.,withwhichtheCompanyhassometransactions,etc.Consideringthescaleandnatureofsuchtransactions,theCompanyjudgesitisunlikelytherelationshipwouldhaveanyimpactondecisionsofshareholdersandinvestors.
Mr.Izuharahasawealthofmanagerialexperienceatanothercompany.Inviewofhispersonality,insight,experience,etc.,theCompanyjudgesheissuitableandqualifiedtoserveasanoutsidedirectorandhasappointedhimtothatposition.
Nobumasa Kemori ○
Mr.KemoripreviouslyworkedforSumitomoMetalMiningCo.,Ltd.,withwhichtheCompanyhassometransactions,etc.Consideringthescaleandnatureofsuchtransactions,theCompanyjudgesitisunlikelytherelationshipwouldhaveanyimpactondecisionsofshareholdersandinvestors.
Mr.Kemorihasawealthofmanagerialexperienceatanothercompany.Inviewofhispersonality,insight,experience,etc.,theCompanyjudgesheissuitableandqualifiedtoserveasanoutsidedirectorandhasappointedhimtothatposition.
Takaaki Ono ○ ThereisnospecialconflictofinterestbetweenMr.OnoandtheCompany.
Mr.Onohasawealthofmanagerialexperience.Inviewofhispersonality,insight,experience,etc.,theCompanyjudgesheissuitableandqualifiedtoserveasanoutsidestatutoryauditorandhasappointedhimtothatposition.
Yoshiyuki Norihisa ○
Mr.NorihisapreviouslyworkedforSumitomoMitsuiConstructionCo.,Ltd.,withwhichtheCompanyhassometransactions,etc.Consideringthescaleandnatureofsuchtransactions,theCompanyjudgesitisunlikelytherelationshipwouldhaveanyimpactondecisionsofshareholdersandinvestors.
Mr.Norihisahasawealthofmanagerialexperienceatanothercompany.Inviewofhispersonality,insight,experience,etc.,theCompanyjudgesheissuitableandqualifiedtoserveasanoutsidestatutoryauditorandhasappointedhimtothatposition.

4342 Integrated Report 2019 Sumitomo Realty & Development Co., Ltd.
Corporate Governance
Matters concerning Corporate Governance them to fulfill their roles and responsibilities. The Internal Audit Division, which has 10 staff members, monitors the operational execution of divisions throughout the Group and the operation of internal control systems. The division also works to prevent misconduct and mistakes, and proposes operational improvements. Moreover, the division reports the results of its audits to the statutory auditors and the independent auditors and exchanges opinions with them in an appropriate manner. These activities help to improve the quality and efficiency of the audit work of the Internal Audit Division, the statutory auditors and the independent auditors. At the same time, the Internal Audit Division, the statutory auditors and the independent auditors provide timely advice and guidance to internal departments that are associated with internal control. At meetings with the independent auditor and by means of communications with the independent auditor, as necessary, the statutory auditors receive information about audits and reports on the audit plan, audit results, etc. from the independent auditor, and exchange opinions with them, and moreover exchange necessary information with them in an effort to achieve smooth and effective audits. The statutory auditors also monitor and examine whether the independent auditor is maintaining independence, and is executing appropriate audits.
Reasons for Adopting the Current Corporate Governance StructureIn addition to directors who are well-acquainted with the Company’s business, we established a structure in June 2015 for appointing two outside directors for further enhancement of management efficiency and strengthening of the corporate governance structure. To strengthen the management oversight system, we have also adopted a structure for the Board of Statutory Auditors that includes two outside statutory auditors, and we therefore believe that sufficient corporate governance functions are in place. Although no voluntary committees have been established, the Company has adopted the following system for strengthening independence and objectivity of the functions of the Board of Directors concerning nomination, compensation, etc. of senior executives and directors as well as accountability. Regarding nomination of candidates for positions as senior executives and directors, persons with rich experience, high-level insight and sophisticated expertise who will contribute to the Company’s sustainable growth and medium- to long-term enhancement of corporate value are selected as candidates, and the candidates are determined by the Board of Directors based on thorough deliberation, reflecting independent and objective opinions of independent outside directors and outside statutory auditors in addition to opinions of internal directors who are familiar with the Company’s business.
Compensation etc. of Directors and Statutory AuditorsAt the ordinary General Meeting of Shareholders held in June 2004, we introduced a new performance-based compensation system for directors. Under this system, the annual compensation for directors is based on the Company’s performance. The new system combines the three elements that made up the previous system—monthly compensation, annual bonuses and retirement allowances. Under the new system, total annual (July to June) compensation for directors is set at just 1% of consolidated ordinary profit. In the year under review, compensation for directors (excluding outside directors) was ¥1,782 million, compensation for statutory auditors (excluding outside statutory auditors) was ¥30 million and compensation for outside directors and outside statutory auditors was ¥64 million. The number of directors at the time of the resolution concerning the system was 12. Compensation of statutory auditors who are independent from business execution is in fixed amounts, and is determined to be within ¥6.5 million per month in accordance with the resolution made at the ordinary general meeting of shareholders held on June 29, 1999. The above-mentioned amount of compensation of directors is not paid to each of the directors in whole in the year under review, but around 50% of the whole amount is paid. Payment of the rest is reserved in preparation for retirement benefit for directors, making up for possible decreases in directors’ compensation if the Company’s financial performance deteriorates in the future, salaries to be paid to persons who will become advisors or counsellors of the Company after retirement, etc. Regarding the reserved amount, the timing of payment and the amount for each director or statutory auditor cannot be determined, and thus, the reserved amount will become subject to calculation of compensation etc. of each director or statutory auditor upon payment in the future or upon confirmation of future payment. The total amount of directors’ compensation is determined clearly based on performance, as
described above, and the allocation is determined based on thorough deliberation at meetings of the Board of Directors also attended by independent outside directors and outside statutory auditors. The total amount etc. of consolidated compensation etc. of each director or statutory auditor is not presented because no one receives compensation amounting to ¥100 million or more.
Overview of Limited Liability AgreementsThe Company has entered into a limited liability agreement with each of its all outside directors and outside statutory auditors in accordance with laws and regulations and provisions of the articles of incorporation. Under the agreements, their liabilities are limited to the minimum limit stipulated by laws and regulations.
Number of DirectorsThe number of directors of the Company shall be 12 or fewer as specified in the articles of incorporation.
Requirements for a Resolution of Election of DirectorsIn the Company’s articles of incorporation, it is specified that a resolution for election of Directors shall be adopted at a General Meeting of Shareholders by a majority vote of the shareholders in attendance who hold one-third (1/3) or more of the voting rights of shareholders entitled to exercise voting rights, and the resolution shall not be adopted by cumulative voting.
Purchase of Own SharesBy the resolution of the Ordinary General Meeting of Shareholders held on June 28, 2007, the Company partially amended the articles of incorporation, and in the amended articles of incorporation it is specified that the Company may purchase its own shares through market transactions, etc. by a resolution of the Board of Directors. The purpose is to enable flexible implementation of a capital policy in response to change in the business environment and to diversify the means of returning profit to shareholders.
Requirements for Special Resolutions of a General Meeting of ShareholdersIn the Company’s articles of incorporation, it is specified that a resolution of a General Meeting of Shareholders pursuant to Article 309, Paragraph 2 of the Japanese Corporate Law shall be adopted by two-thirds (2/3) or more of the votes of the shareholders in attendance who hold one-third (1/3) or more of the voting rights of shareholders entitled to exercise voting rights. The purpose is to ensure smooth operation of a General Meeting of Shareholders by easing the quorum required for special resolutions of a General Meeting of Shareholders.
Interim DividendIn the Company’s articles of incorporation, it is specified that the Company may pay an interim dividend with the record date of September 30 of each year by a resolution of the Board of Directors for flexibly returning profit to shareholders.
Exemptions of Liabilities of Directors and Statutory AuditorsIn the Company’s articles of incorporation, it is specified that the Company may exempt directors and statutory auditors from liability for damages to the Company within the scope stipulated by laws and regulations by a resolution of the Board of Directors so that directors and statutory auditors can fulfill the roles and functions expected of them.
Independent AuditorsIn accordance with the Japanese Corporate Law and the Financial Instruments and Exchange Act, the Company has concluded an auditing contract with KPMG AZSA LLC for the auditing of the Company’s accounts. There are no conflicts of interest between Sumitomo Realty and the independent auditing company or its employees. Regarding election of the independent auditor, the Company makes a comprehensive judgment, taking into consideration the appropriateness of the quality control system, independence of the auditing company, validity of the audit plan and audit fees, etc. The statutory auditors and the Board of Statutory Auditors deem that there are no grounds for dismissal of or refusal to reappoint the independent auditor concerning the status of independent auditor’s execution of duties, audit system, independence, etc. The fees paid to auditing certified public accountants, etc. during the year ended March 31, 2019 amounted to ¥203 million.
Corporate Governance Structure
General Meeting of Shareholders
Board of Directors
President
Departments, Divisions, etc.
Board of Statutory Auditors
Independent Auditors
Internal Audit Division
Corporate Governance BodiesThe Board of Directors consists of 10 directors, including two outsidedirector. The Board makes decisions on important Company mattersand oversees the directors’ execution of duties. Furthermore, internalinformation, awareness of issues and other matters are shared throughthe Board of Directors, internal meetings and other forums, promotingquick and rational decision-making. The Board of Directors as a whole has knowledge, experience, and capabilities necessary for corporate management, and balance, diversity and scale are secured that enable swift decision-making. At the meeting of the Board of Directors held on March 29, 2019, analysis and evaluation of the structure and the operational status of the Board of Directors were performed, and it was confirmed that effectiveness of the Board of Directors is secured appropriately. The Board of Statutory Auditors has four members, includingtwo outside statutory auditors. To strengthen management oversight,we continue working to enhance outside auditing. The statutory auditors attend meetings of the Board of Directors and other important meetings and track internal issues that are important for robust auditing. Two outside directors were elected at the ordinary General Meeting of Shareholders held in June 2019. These directors possess a wealth of management experience and were nominated as a director in light of their appropriate personal character, knowledge and judgment. The Company has appointed outside directors to
further enhance management efficiency and strengthen the corporate governance structure by contributing points of view that are not bound by preconceived ideas of the real estate industry and advice from a global perspective. The professional history of the outside director is on page 41. Both of the outside statutory auditors has abundant managementexperience at other companies, and they were nominated because their character and knowledge were considered to be appropriate for the Company’s statutory auditors. The outside statutory auditors fulfill their roles by expressing objective opinions on governance from an independent standpoint from the Company without being influenced by executives responsible for operational execution. They also work together to improve auditing by, for example, exchanging opinions as needed with other statutory auditors, the Internal Audit Division and the independent auditors. At the same time, they provide timely advice and guidance to internal departments associated with internal control. Sumitomo Realty does not have standards or a policy regardingindependence from the Company for selecting outside directors and outside statutory auditors. However, the Company does refer to the Tokyo Stock Exchange’s evaluation standards regarding the independence of directors and corporate auditors when appointing such individuals. The Company periodically briefs outside directors and statutory auditors on the industry to which the Company belongs, the Company’s history, business overview, financial information, strategies, organizations, etc. The Company also offers all directors and statutory auditors opportunities for gaining information necessary for
Executive Officers Committee
Institutional design Company with Auditors
Number of directors (of whom outside directors) 10 (2)
Number of statutory auditors (of whom outside statutory auditors) 4 (2)
Terms of office of directors 2 years
Analysis and evaluation of effectiveness of the Board of DirectorsAt the meeting of the Board of Directors held on March 29, 2019, analysis and evaluation of the structure and the operational status of the Board of Directors were performed, and it was confirmed that effectiveness of the Board of Directors is secured appropriately.
Opportunities for outside directors and statutory auditors for gaining information
The Company periodically briefs outside directors and statutory auditors on the industry to which the Company belongs, the Company’s history, business overview, financial information, strategies, organizations, etc. and offers all directors and statutory auditors opportunities for gaining information necessary for them to fulfill their roles and responsibilities.
Compensation system for directors and statutory auditors Performance-based compensation system
Auditing company KPMG AZSA LLC
Fundamental Approach to Corporate GovernanceTo achieve sound management, Sumitomo Realty believes that it is important to share information on a companywide basis, ensure that everyone is aware of problems, enhance internal management supervision and achieve highly transparent management through appropriate information disclosure. We have implemented a number of corporate governance initiatives to realize these practices efficiently.
Corporate Governance Overview

4544 Integrated Report 2019 Sumitomo Realty & Development Co., Ltd.
Risk Management Structure
Risk Management Committee Chairman: President
BCP SubcommitteeHosted by General Affairs Department
Internal Control MeetingHosted by Internal Audit Division
Systems for ensuring appropriateness of business operations
The Company considers that establishment of internal control systems is one of the important management issues concerning the enhancement of corporate value and sustainable development of the Company and its subsidiaries (hereinafter referred to as the “Group”) as a whole. With regard to the matters listed below, the Company shall establish systems in which roles and responsibilities of the Group’s directors and employees are clarified, and through operation and appropriate review of such systems, the Company shall strive to establish appropriate systems for governance of the Group’s directors and employees.
(1) Systems for ensuring that the execution of duties of the Group’s directors and employees complies with laws and regulations and with the articles of incorporation
In order to enhance and strengthen internal control of the Group, the Company has established the Risk Management Committee chaired by the Company’s President. The Internal Control Meeting (hosted by the Company’s Internal Audit Division), which is a subordinate organization of the Risk Management Committee, monitors compliance promotion activities of the Group, and reports the result to the Risk Management Committee.
The Company’s Internal Audit Division performs internal audits including those of subsidiaries, and several contacts for whistleblowing are established within and outside the Company to detect and prevent any misconduct or illegal acts.
(2) Systems for retention and management of information concerning the execution of duties of the Company’s directors
Minutes of meetings of the Board of Directors of the Company, requests for managerial decision, and other documents (including electromagnetic records) are prepared, and these documents are retained and managed by the respective responsible departments in accordance with the Criteria for Document Retention Periods and the Information Management Rules.
(3) Rules and other systems related to management of risks of losses of the Group
Among the risks of the Group, the risks associated with the business, such as investment risk and market risk, are monitored and addressed by the respective departments and subsidiaries properly, and important matters are discussed and determined at meetings of the Company’s Board of Directors and other important meetings such as management meetings. Moreover, in order to address risks of large-scale disasters, etc. affecting business continuity, the BCP Subcommittee (hosted by the Company’s General Affairs Department), a subordinate organization of the Risk Management Committee, monitors the status of development of business continuity planning (BCP) by the Group, and reports the result to the Risk Management Committee.
(4) Systems for ensuring that the execution of duties of the Group’s
directors is performed efficiently The Group’s directors direct and supervise business operations of the respective
departments and subsidiaries in accordance with the Company’s management plan. Moreover, the Group’s employees efficiently perform their duties under the direction and supervision of the Board of Directors and heads of respective departments, etc.
(5) Systems for ensuring appropriateness of business operations of the Group consisting of the Company and its subsidiaries and systems related to reporting of matters concerning the execution of duties to the Company
The Company periodically receives reports from each subsidiary on the execution of
duties, such as the status of business execution and financial conditions, and provides advice and guidance concerning business operations properly, depending on the nature of the matter in question.
Moreover, the Company’s statutory auditors and the Company’s Internal Audit Division audit each subsidiary, as necessary.
(6) Particulars related to employees when the Company’s statutory auditors request that employees be appointed to assist with the duties of the statutory auditors and particulars related to ensuring independence of such employees from directors and effectiveness of the instructions of the Company’s statutory auditors to the employees
If the Company’s statutory auditors make requests to personnel of the Company’s Internal Audit Division concerning matters necessary for audit practices, such personnel shall proactively offer cooperation. In such a case, the personnel who provide assistance shall not be in the chain of command of directors or any other personnel concerning the matters for which they are requested to provide assistance.
(7) Systems for reporting to the Company’s statutory auditors by the Group’s directors etc. and employees or by a person who received reports from such persons and other systems related to reporting to the Company’s statutory auditors
When the Group’s directors, etc. and employees or a person who received reports from such persons report to the Company’s statutory auditors, or when they are requested by the Company’s statutory auditors to report, necessary reports shall be provided swiftly and persons who make reports shall not be treated disadvantageously for reasons of making such reports. Moreover, the independent auditor and the Company’s Internal Audit Office shall report to the Company’s statutory auditors concerning the audit status properly.
(8) Particulars related to policies concerning the procedures for advance payment or reimbursement of expenses that arise with regard to the execution of duties of the Company’s statutory auditors or any other processing of expenses or obligations that arise with regard to the execution of duties
When, concerning the execution of duties, a statutory auditor of the Company requests advance payment or reimbursement, etc. of expenses in accordance with the Japanese Corporate Law, the Company shall process such expenses or obligations, excluding any cases deemed unnecessary for the execution of duties of the said statutory auditor.
(9) Other systems for ensuring that audits by the Company’s statutory auditors are performed effectively
Opportunities are ensured for the Company’s statutory auditors to attend meetings of the Board of Directors and other important meetings so that they can comprehend the Group’s important issues, etc., and state opinions, as necessary.
(10) Basic view for elimination of antisocial forces and the status of establishment of such systems
The Company shall take a resolute attitude toward antisocial forces that threaten social order and safety, and have no relationships with such antisocial forces. Designating the General Affairs Department as a division in charge of countermeasures against antisocial forces, the Company has appointed a person responsible for the prevention of unjust claims. Furthermore, the Company collects and manages information concerning antisocial forces by collaborating with the police and other relevant institutions, and shares such information internally along with cautionary notices.
The Policy on Large-Scale Purchase of Shares of the Company (Takeover Defense Measures)
Timely and Appropriate Information Disclosure and Communication with Shareholders and Investors
The real estate leasing business primarily involving office buildings in central Tokyo has been a driving force underpinning the Company’s growth thus far. Given that this business accounts for nearly 70% of the Company’s operating income overall, it clearly forms the core aspect of its corporate value acting as a major pillar of operations. The Eighth Management Plan cites as its secondary objective the notion of steadily promoting new building development plans in central Tokyo to achieve gross floor area exceeding 800,000 tsubo (one tsubo is roughly 3.3m2), which constitutes more than 50% of the 1,520,000 tsubo in gross floor area for leasing as of March 31, 2019. The Company aims to further expand its earnings base, increase its corporate value and augment shareholder returns by successively completing such developments and putting them into operation. Such large-scale development plans involve ultimately generating revenues from the substantial amount of cumulative upfront investment made thus far. The Company has long managed to continuously expand its business platform by developing lease buildings while avoiding exposure to vicissitudes of the real estate market and business conditions, given that it has normally been buoyed by its leasing business cash flows which have been a stable source of revenues. As such, the Company needs to maintain and further expand its cash flows from the leasing business, which have grown to around ¥200 billion, in order to confidently carry out such upfront investment without having to continually resort to interest-bearing debt. Moreover, it is likely to take another six or seven years before the Company achieves full profitability given that the focus has been on large-scale redevelopment. Meanwhile, if the Company adopts a short-term management policy to seek temporary earnings and realizes latent gains by selling real estate holdings prior to having accomplished the objectives of the development plans formulated to contribute to higher corporate value in the future, the leasing business cash flows that act as a stable revenue source will decrease, thereby exposing the development plans to financial risk. As such, the Company is unable to rule out a possible threat of damage to the foundations of the Company’s corporate value. The Company’s management policy aims to steadily increase corporate value based on a medium- to long-term outlook, and is consequently incompatible with such short-term goals. As such, if an investor seeking to orchestrate a takeover emerges, the Company believes that it must seek a mandate from its shareholders upon having ensured sufficient information and time for completing discussions, and the Company deems that preliminary development of procedures through “the Policy on Large-Scale Purchase of Shares of the Company (Takeover Defense Measures)” (hereinafter referred to as the “Policy”) aligns with the common interests of shareholders. The Policy was adopted based on the decision of the meeting of its Board of Directors dated May 17, 2007, was continued or renewed upon receiving approval from shareholders at each of the shareholders’ meetings of the 74th fiscal year dated June 28, 2007, the 77th fiscal year dated June 29, 2010, the 80th fiscal year dated June 27, 2013, the 83rd fiscal year dated June 29, 2016, and the 86th
The Company considers that it is important to ensure soundness and transparency of management by means of timely and appropriate information disclosure. In accordance with this basic policy, the Company has put in place systems that enable swift reporting to the responsible department at the head office and implementation of appropriate information management measures, if a material fact that may have an impact on investors’ investment decisions arises at the Company’s departments or at subsidiaries. Upon emergence of a material fact and reporting thereof, the responsible department, the General Affairs Department, the Finance and Accounting Department, and other relevant departments, discuss whether there is need for timely disclosure, and if it is judged that disclosure is necessary, timely disclosure is performed without delay following the necessary internal procedures. Subsequently, the disclosure materials are posted on the Company’s website for thorough information disclosure.
fiscal year dated June 27, 2019. The term of the Policy will expire upon the conclusion of the shareholders’ meeting of the 89th fiscal year scheduled to be held in June 2022.
The Company believes that if a large-scale purchase of the Company shares (“Large-Scale Purchase”) is initiated, the shareholders should decide to accept or reject the Large-Scale Purchase. In order for the shareholders to correctly recognize the effect on the corporate value and common interests of shareholders, however, it is necessary that both the party making the Large-Scale Purchase (the “Large-Scale Purchaser”) and the Board of Directors of our company provide to the shareholders necessary and sufficient information, opinions, alternative proposals etc., and necessary and sufficient time to consider the provided information, opinions, alternative proposals etc. The Policy sets out rules on Large-Scale Purchases (hereinafter referred to as “Large-Scale Purchase Rules”) and requests the Large-Scale Purchaser to comply with the Large-Scale Purchase Rules. The Large-Scale Purchase Rules state that the Large-Scale Purchaser provide the Board of Directors of the Company necessary and sufficient information regarding the Large-Scale Purchase in advance, and only commence the Large-Scale Purchase after a certain period of evaluation by the Board of Directors of the Company has elapsed. The Board of Directors shall take countermeasures that it deems necessary if the Large-Scale Purchaser does not comply with the Large-Scale Purchase Rules, or even though the Large-Scale Purchaser complies with the Large-Scale Purchase Rules, if it is clear that the Large-Scale Purchase will cause unrecoverable damages to the Company or if the Large-Scale Purchase significantly damages the corporate value and common interests of shareholders. Additionally, the Board of Directors of the Company shall consult with a Special Committee consisting of external academic experts, lawyers, certified public accountants, etc., and shall receive the recommendations of the Committee when taking decisions as to whether or not the Large-Scale Purchaser complies with the Large-Scale Purchase Rules, whether or not it is clear that the Large-Scale Purchase will cause unrecoverable damages to the Company, whether or not the Large-Scale Purchase will significantly damage the corporate value and common interests of shareholders, and whether or not countermeasures should be taken. The Board of Directors of the Company shall take the Special Committee’s recommendations into the fullest account. As stated above, the Policy stipulates rules to secure the necessary information and time for shareholders to deliberate on the Large-Scale Purchase, as well as countermeasures if the Large-Scale Purchaser does not comply with the Large-Scale Purchase Rules or if it is clear that the Large-Scale Purchase will cause unrecoverable damages to the Company. The purpose of the Policy is not to maintain the status of the Company's officers but to contribute to the Company's corporate value and the common interests of its shareholders.
The Company strives to provide explanation of the Company’s corporate management and business activities through General Meetings of Shareholders, financial results briefing sessions, individual meetings, and other opportunities for communication with shareholders and investors. If a shareholder requests a dialogue, the Company’s policy is that the department responsible for IR or other departments respond to such request appropriately under the supervision of the responsible director, etc. depending on the objective of the dialogue, the method of communication, the number of shares held, the attributes, etc. Regarding dialogues with shareholders, the Company exercises due care concerning the handling of insider information, and notifies, as necessary, important meetings such as management meetings attended by directors and senior executives, of the details of the dialogues.
Other Information Concerning Governance
Corporate Governance
Risk Management
•Implementation of internal auditing•Establishment of Internal Reporting Division

Financial Section
Eleven-year Financial SummarySumitomo Realty & Development Co., Ltd. and its consolidated subsidiariesAs of and for the years ended March 31
Millions of yen Thousands of U.S. dollars*1
2019 2018 2017 2016 2015 2014 2013 2012 2011 2010 2009 2019
For the YearRevenue from operations ¥1,013,230 ¥ 948,402 ¥ 925,151 ¥ 854,964 ¥ 806,835 ¥ 780,273 ¥ 736,652 ¥ 688,662 ¥ 744,756 ¥ 719,636 ¥ 695,240 $ 9,128,198
Leasing 381,764 353,881 337,466 313,340 289,117 283,730 278,317 271,812 292,875 293,533 298,359 3,439,315Sales 331,752 311,193 314,299 274,761 264,207 234,093 232,149 198,154 239,709 219,662 191,224 2,988,757Construction 221,693 209,356 203,623 199,115 188,995 201,190 171,082 165,995 162,924 158,214 160,134 1,997,234Brokerage 72,899 69,169 66,714 61,496 58,486 57,211 50,957 49,397 46,430 44,621 43,105 656,748
Cost of revenue from operations 711,052 664,015 664,184 614,191 579,964 558,987 529,913 490,437 551,364 534,270 496,547 6,405,874
SG&A expenses 81,759 78,750 72,796 66,532 60,976 60,815 55,394 50,760 54,929 51,387 52,327 736,567% of revenue from operations 8.1% 8.3% 7.9% 7.8% 7.6% 7.8% 7.5% 7.4% 7.4% 7.1% 7.5%
Operating income 220,419 205,637 188,171 174,241 165,895 160,471 151,345 147,465 138,463 133,979 146,366 1,985,757% of revenue from operations 21.8% 21.7% 20.3% 20.4% 20.6% 20.6% 20.5% 21.4% 18.6% 18.6% 21.1%
Ordinary profit*2 204,257 186,871 167,697 148,424 139,055 130,537 114,916 107,912 106,296 100,464 113,582 1,840,153% of revenue from operations 20.2% 19.7% 18.1% 17.4% 17.2% 16.7% 15.6% 15.7% 14.3% 14.0% 16.3%
Profit attributable to owners of parent 130,817 119,731 103,489 87,798 80,567 69,697 59,825 53,236 50,908 52,662 46,205 1,178,532
Depreciation and amortization 46,313 41,628 39,446 34,574 33,519 35,311 37,761 36,049 23,705 18,065 17,886 417,234
At Year-endCurrent assets ¥ 933,011 ¥1,126,118 ¥1,197,508 ¥1,122,189 ¥1,025,703 ¥ 924,452 ¥ 965,786 ¥ 801,142 ¥ 805,958 ¥ 802,693 ¥ 759,816 $ 8,405,504Inventories 679,903 783,308 845,214 855,816 801,950 715,779 679,496 586,170 558,091 521,871 518,885 6,125,252Total assets 5,127,465 5,167,199 4,980,040 4,675,915 4,523,804 4,220,429 4,105,500 3,859,698 3,234,203 3,168,098 3,006,412 46,193,378Shareholders’ equity*3 1,208,117 1,114,975 1,007,347 888,100 832,462 707,948 627,012 553,844 526,227 488,896 436,667 10,883,936Net interest-bearing debt 3,170,595 3,210,302 3,101,162 2,971,667 2,875,660 2,652,929 2,424,932 2,407,639 1,901,850 1,785,854 1,722,733 28,563,919
Per Share Amounts (Yen)Profit attributable to owners of parent ¥ 276.02 ¥ 252.62 ¥ 218.34 ¥ 185.23 ¥ 169.97 ¥ 147.02 ¥ 126.18 ¥ 112.28 ¥ 107.35 ¥ 111.04 ¥ 97.39 $ 2.49Shareholders’ equity 2,549.09 2,352.53 2,125.36 1,873.71 1,756.25 1,493.48 1,322.52 1,168.11 1,109.78 1,030.93 920.74 22.96Cash dividend applicable to the year 30.00 27.00 24.00 22.00 21.00 20.00 20.00 20.00 20.00 20.00 20.00 0.27
Key RatiosEquity ratio (%) 23.6 21.6 20.2 19.0 18.4 16.8 15.3 14.3 16.3 15.4 14.5ND/E ratio*4 (Times) 2.6 2.9 3.1 3.3 3.5 3.7 3.9 4.3 3.6 3.7 3.9ROE (%) 11.3 11.3 10.9 10.2 10.5 10.4 10.1 9.9 10.0 11.4 10.7ROA (%) 4.5 4.2 4.0 3.9 3.9 4.0 3.9 4.3 4.4 4.4 5.1Long-term debt ratio (%) 99 98 98 98 97 95 93 93 89 83 76Fixed-interest rate debt ratio (%) 96 94 95 94 87 82 80 80 79 81 77Interest coverage ratio*5 (Times) 11.4 10.5 9.0 7.3 6.5 6.1 4.9 4.2 4.7 4.6 4.9
*1. U.S. dollar amounts in this report are translated, for convenience only, at the rate of ¥111.00 = U.S. $1, the prevailing exchange rate at March 31, 2019.*2. Ordinary profit, which equals operating income after adjustment for non-operating gains/losses, is a management index that is widely used in Japan.
Due to differences in accounting standards, ordinary profit is not referred to in the Company’s English-language financial statements but is included here because it plays an important role in the calculation of incentive payments for directors.
*3. Shareholders’ equity = Net assets – Non-controlling interests*4. ND/E ratio = Net interest-bearing debt (Interest-bearing debt – Cash, time and notice deposits) / Shareholders’ equity*5. Interest coverage ratio = (Operating income + Interest and dividend income) / Interest expense
46 47Sumitomo Realty & Development Co., Ltd.Integrated Report 2019

Financial Section
Management’s Discussion and Analysis
Business Results for the Fiscal Year under ReviewDuring the March 2019 fiscal year, the final year of the Seventh
Management Plan, we marked the seventh consecutive year of revenue
growth, the ninth consecutive year of increases in operating income and
ordinary profit, and the sixth consecutive year of record revenue from
operations, operating income, ordinary profit, and profit attributable to
owners of parent.
In addition, revenue from operations exceeded the ¥1 trillion mark,
and ordinary profit the ¥200 billion mark, for the first time.
By segment, the leasing business centered on office building leasing in
Tokyo continued to perform well, driving growth in results, while all four
of our mainstay business segments achieved revenue and profit growth
with both revenue from operations and operating income reaching a
record high. As a result, revenue from operations stood at ¥1,013.2
billion (6.8% increase year on year), and operating income totaled
¥220.4 billion (7.2% increase year on year).
Non-operating gains/losses improved by ¥2.6 billion from the
previous fiscal year due to an increase in dividend income, and
contributed to an increase in ordinary profit. As a result, ordinary profit
amounted to ¥204.2 billion (9.3% increase year on year), and profit
attributable to owners of parent amounted to ¥130.8 billion (9.3%
increase year on year).
Cash FlowsCash flows for the consolidated fiscal year under review were as follows:
Cash flows from operating activities: ¥260,057 million (¥70,124
million increase year on year)
Cash flows from investing activities: ¥(209,212) million (¥11,322
million increase year on year)
Cash flows from financing activities: ¥(146,058) million (¥172,519
million decrease year on year)
Cash and cash equivalents decreased ¥91,338 million to ¥170,707
million.
Cash flows from operating activities
With an ordinary profit of ¥204.2 billion for the fiscal year under review,
net cash provided by operating activities amounted to ¥260.0 billion.
This was an improvement of ¥70.1 billion from the previous fiscal year,
mainly attributable to a decrease in inventories in addition to an increase
in ordinary profit.
Cash flows from investing activities
Investment in property and equipment totaled ¥188.5 billion mainly for
the purpose of augmenting the leasing business, while the net amount
of restitution of deposits from partnership investors was ¥9.4 billion. As
a result, net cash used in investing activities amounted to ¥209.2 billion.
Cash flows from financing activities
Long-term loans payable amounted to ¥198.3 billion to provide
flexibility through financial policy. Redemption of bonds and repayment
of long-term loans payable totaled ¥285.7 billion, and the net amount
of short-term debt repaid was ¥35.7 billion. As a result, net cash used in
financing activities amounted to ¥146.0 billion.
Financial Resources for Capital and Liquidity of FundsAssets
Total assets as of the end of the fiscal year under review amounted to
¥5,127.4 billion (¥39.7 billion decrease from the end of the previous
fiscal year). Although real estate for sale (including real estate for sale in
process) decreased due to an increase in the number of condominium
units delivered, property and equipment increased through investment
in buildings for leasing.
Liabilities
Total liabilities amounted to ¥3,919.3 billion (¥132.8 billion decrease
from the end of the previous fiscal year). Consolidated interest-bearing
debt decreased to ¥3,342.7 billion (¥130.7 billion decrease from the end
of the previous fiscal year). ND/E ratio continued to improve from 2.9
times at the end of the previous fiscal year to 2.6 times.
Net assets
Total net assets amounted to ¥1,208.1 billion (¥93.1 billion increase
from the end of the previous fiscal year). Profit attributable to owners of
parent stood at ¥130.8 billion, shareholders’ equity increased to
¥1,208.1 billion (¥93.1 billion increase from the end of the previous
fiscal year), and the equity ratio improved from 21.6% at the end of the
previous fiscal year to 23.6%. As a result, ROE remains at an industry-
leading level of 11.3%.
Furthermore, unrealized gains on investment and rental properties
increased from ¥2.3 trillion at the end of the previous fiscal year to ¥2.7
trillion as of the end of the fiscal year under review (Refer to page 72.),
and have been highly evaluated by rating agencies as a buffer against
financial risks. JCR and R&I have issued ratings of A+ and A (positive),
respectively.
As of the end of the fiscal year under review, long-term debt
accounted for 99% of consolidated interest-bearing debt, and fixed-rate
debt for 96% (98% and 94% respectively at the end of the previous
fiscal year). We will continue to strive for stable financial management.
ROE and ROA
%
3.9 3.9 4.2 4.54.0
10.5 10.211.3 11.310.9
5
10
15
02015 2016 2017 2018 2019
ROA (Operating income + Interest and Dividend Income / Total Assets)ROE (Net Income / Shareholders‘ Equity)
98
Long-term Debt Ratio andFixed-interest Rate Debt Ratio %
40
60
20
80
100 97 98 98
8794 94 9695
Fixed-interest Rate Debt Ratio
02015 2016 2017 2018 2019
99
Short-term Loans and Commercial PaperLong-term Loans and Bonds
Total Assets
Billions of yen
2,000
4,000
6,000
4,523.8 4,675.95,167.24,980.0 5,127.5
2015 2016 2017 2018 20190
1,007.3
Shareholders’ Equity and Equity Ratio Billions of yen %
500
1,000
1,500
832.5 888.1
1,115.0
18.4 19.021.6 23.6
20.2
15
30
45
Shareholders’ Equity
Equity Ratio (right)
(Net Assets – Profit Attributable to Non-controlling Interests)
0 02015 2016 2017 2018 2019
1,208.1
0
Net Interest-bearing Debt and ND/E Ratio Billions of yen Times
2,875.7 2,971.73,210.3
3.5 3.3 2.9 2.6
3,170.63,101.2
3.1
4
8
12
1,200
2,400
3,600
Net Interest-bearing Debt ND/E Ratio (right)
2015 2016 2017 2018 20190
Interest Coverage Ratio
Billions of yen
Operating Income + Interest and Dividend IncomeInterest ExpenseInterest Coverage Ratio (right scale)
230.5214.1
20.4
171.2 179.8
24.526.2
194.9
21.6
80
160
240
02015 2016 2017 2018 2019
20.2
Times
0
5
10
15
6.57.3
9.0
11.410.5
Operating Income and Operating Margin
Billions of yen %
0
10
20
30
165.9 174.2188.2
20.6 20.4 20.3
22.921.8
205.6
21.7
80
160
240
Operating Income Operating Margin (right)
0
220.4
(Forecast)2015 2016 2017 2018 20202019
234.0
Ordinary Profit* and Profit Attributable to Owners of ParentBillions of yen
* Please see note *2 on page 46.
Ordinary Profit Profit Attributable to Owners of Parent
204.3
140.0
220.0
186.9
119.7139.1
148.4
87.880.6
167.7
103.5
(Forecast)
80
160
240
02015 2016 2017 2018 20202019
130.8
Revenue from Operations
Billions of yen
1,020.0948.4
806.8855.0
925.2
(Forecast)
400
800
1,200
0
1,013.2
2015 2016 2017 2018 20202019
48 49Sumitomo Realty & Development Co., Ltd.Integrated Report 2019
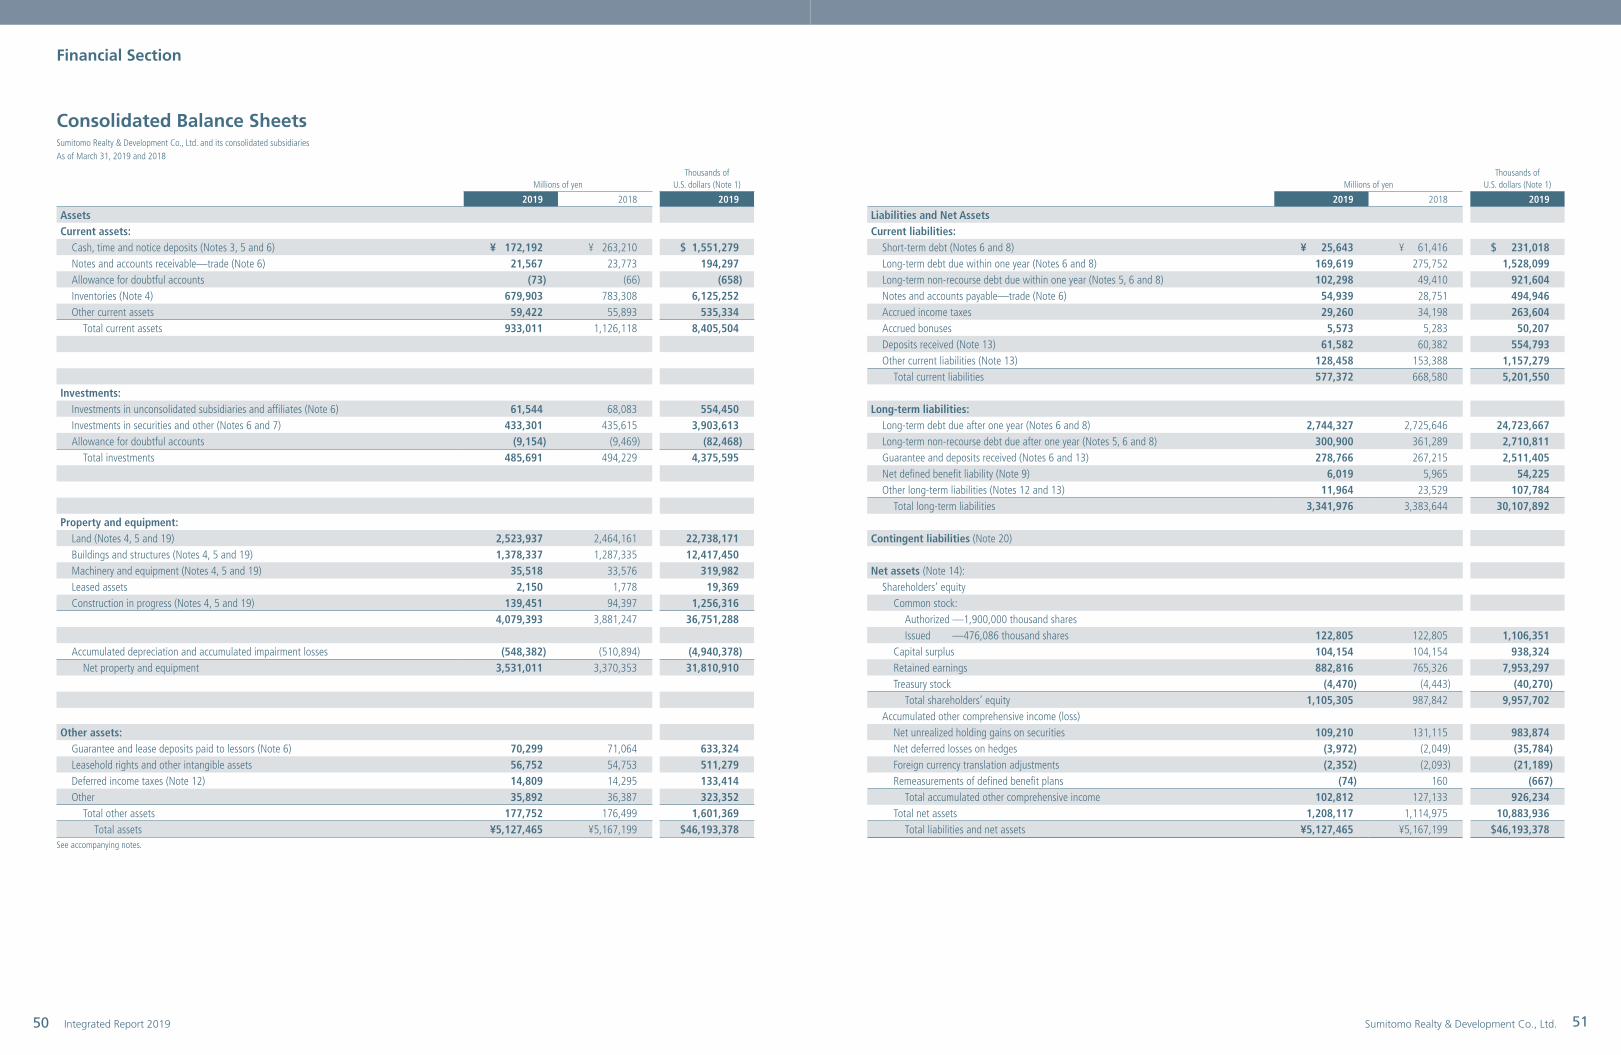
Financial Section
Consolidated Balance SheetsSumitomo Realty & Development Co., Ltd. and its consolidated subsidiariesAs of March 31, 2019 and 2018
Millions of yenThousands of
U.S. dollars (Note 1)
2019 2018 2019
AssetsCurrent assets:
Cash, time and notice deposits (Notes 3, 5 and 6) ¥ 172,192 ¥ 263,210 $ 1,551,279Notes and accounts receivable—trade (Note 6) 21,567 23,773 194,297Allowance for doubtful accounts (73) (66) (658)Inventories (Note 4) 679,903 783,308 6,125,252Other current assets 59,422 55,893 535,334
Total current assets 933,011 1,126,118 8,405,504
Investments:Investments in unconsolidated subsidiaries and affiliates (Note 6) 61,544 68,083 554,450Investments in securities and other (Notes 6 and 7) 433,301 435,615 3,903,613Allowance for doubtful accounts (9,154) (9,469) (82,468)
Total investments 485,691 494,229 4,375,595
Property and equipment:Land (Notes 4, 5 and 19) 2,523,937 2,464,161 22,738,171Buildings and structures (Notes 4, 5 and 19) 1,378,337 1,287,335 12,417,450Machinery and equipment (Notes 4, 5 and 19) 35,518 33,576 319,982Leased assets 2,150 1,778 19,369Construction in progress (Notes 4, 5 and 19) 139,451 94,397 1,256,316
4,079,393 3,881,247 36,751,288
Accumulated depreciation and accumulated impairment losses (548,382) (510,894) (4,940,378)Net property and equipment 3,531,011 3,370,353 31,810,910
Other assets:Guarantee and lease deposits paid to lessors (Note 6) 70,299 71,064 633,324Leasehold rights and other intangible assets 56,752 54,753 511,279Deferred income taxes (Note 12) 14,809 14,295 133,414Other 35,892 36,387 323,352
Total other assets 177,752 176,499 1,601,369Total assets ¥5,127,465 ¥5,167,199 $46,193,378
See accompanying notes.
Millions of yenThousands of
U.S. dollars (Note 1)
2019 2018 2019
Liabilities and Net AssetsCurrent liabilities:
Short-term debt (Notes 6 and 8) ¥ 25,643 ¥ 61,416 $ 231,018Long-term debt due within one year (Notes 6 and 8) 169,619 275,752 1,528,099Long-term non-recourse debt due within one year (Notes 5, 6 and 8) 102,298 49,410 921,604Notes and accounts payable—trade (Note 6) 54,939 28,751 494,946Accrued income taxes 29,260 34,198 263,604Accrued bonuses 5,573 5,283 50,207Deposits received (Note 13) 61,582 60,382 554,793Other current liabilities (Note 13) 128,458 153,388 1,157,279
Total current liabilities 577,372 668,580 5,201,550
Long-term liabilities:Long-term debt due after one year (Notes 6 and 8) 2,744,327 2,725,646 24,723,667Long-term non-recourse debt due after one year (Notes 5, 6 and 8) 300,900 361,289 2,710,811Guarantee and deposits received (Notes 6 and 13) 278,766 267,215 2,511,405Net defined benefit liability (Note 9) 6,019 5,965 54,225Other long-term liabilities (Notes 12 and 13) 11,964 23,529 107,784
Total long-term liabilities 3,341,976 3,383,644 30,107,892
Contingent liabilities (Note 20)
Net assets (Note 14):Shareholders’ equity
Common stock:Authorized —1,900,000 thousand sharesIssued —476,086 thousand shares 122,805 122,805 1,106,351
Capital surplus 104,154 104,154 938,324Retained earnings 882,816 765,326 7,953,297Treasury stock (4,470) (4,443) (40,270)
Total shareholders’ equity 1,105,305 987,842 9,957,702Accumulated other comprehensive income (loss)
Net unrealized holding gains on securities 109,210 131,115 983,874Net deferred losses on hedges (3,972) (2,049) (35,784)Foreign currency translation adjustments (2,352) (2,093) (21,189)Remeasurements of defined benefit plans (74) 160 (667)
Total accumulated other comprehensive income 102,812 127,133 926,234Total net assets 1,208,117 1,114,975 10,883,936
Total liabilities and net assets ¥5,127,465 ¥5,167,199 $46,193,378
50 51Sumitomo Realty & Development Co., Ltd.Integrated Report 2019

Financial Section
Consolidated Statements of IncomeSumitomo Realty & Development Co., Ltd. and its consolidated subsidiariesFor the years ended March 31, 2019, 2018 and 2017
Consolidated Statements of Changes in Net AssetsSumitomo Realty & Development Co., Ltd. and its consolidated subsidiariesFor the years ended March 31, 2019, 2018 and 2017
Millions of yenThousands of
U.S. dollars (Note 1)
2019 2018 2017 2019
Revenue from operations ¥1,013,230 ¥948,402 ¥925,151 $9,128,198Costs and expenses:
Cost of revenue from operations 711,052 664,015 664,184 6,405,874Selling, general and administrative expenses 81,759 78,750 72,796 736,567
792,811 742,765 736,980 7,142,441
Operating income 220,419 205,637 188,171 1,985,757Other income (expenses):
Interest expense, net (19,589) (20,096) (21,469) (176,477)Dividend income 9,472 8,229 6,588 85,333Gain on sale of property and equipment 75 38 15 676Loss on sale of property and equipment (3,724) (217) (3) (33,550)Loss on impairment of fixed assets (Note 10) (8,576) (10,635) (15,538) (77,261)Loss on disposal of property and equipment (1,280) (601) (1,522) (11,532)Gain on sale of investments in securities 12 1,010 43 108Loss on sale of investments in securities — (47) — —Loss on devaluation of investments in securities (1,105) — — (9,955)Other, net (6,115) (6,874) (5,662) (55,090)
(30,830) (29,193) (37,548) (277,748)
Income before income taxes 189,589 176,444 150,623 1,708,009Income taxes (Note 12):
Current 62,823 62,098 53,161 565,973Deferred (4,051) (6,180) (9,533) (36,496)
Total 58,772 55,918 43,628 529,477
Profit 130,817 120,526 106,995 1,178,532
Profit attributable to non-controlling interests — 795 3,506 —
Profit attributable to owners of parent ¥ 130,817 ¥119,731 ¥103,489 $1,178,532
Yen U.S. dollars (Note 1)
2019 2018 2017 2019
Amounts per share of common stock:Profit attributable to owners of parent:
—Basic ¥276.02 ¥252.62 ¥218.34 $2.49—Diluted — — — —
Cash dividend applicable to the year 30.00 27.00 24.00 0.27See accompanying notes.
Consolidated Statements of Comprehensive IncomeSumitomo Realty & Development Co., Ltd. and its consolidated subsidiariesFor the years ended March 31, 2019, 2018 and 2017
Millions of yenThousands of
U.S. dollars (Note 1)
2019 2018 2017 2019
Profit ¥130,817 ¥120,526 ¥106,995 $1,178,532Other comprehensive income (loss) (Note 18)
Net unrealized holding gains (losses) on securities (21,905) 33,935 24,930 (197,342)Net deferred gains (losses) on hedges (1,923) 538 1,705 (17,325)Foreign currency translation adjustments (259) (1,098) (927) (2,333)Remeasurements of defined benefit plans (234) 188 442 (2,108)
Total other comprehensive income (loss) (24,321) 33,563 26,150 (219,108)Comprehensive income ¥106,496 ¥154,089 ¥133,145 $ 959,424
Comprehensive income attributable to:Owners of the parent ¥106,496 ¥153,493 ¥129,719 $ 959,424Non-controlling interests — 596 3,426 —
See accompanying notes.
Thousands Millions of yen
Shareholders’ equity Accumulated other comprehensive income (loss)
Number of shares of common
stockCommon
stockCapital surplus
Retained earnings
Treasury stock
Total shareholders’
equity
Net unrealized holding gains
(losses) on securities
Net deferred gains (losses)
on hedges
Foreign currency
translation adjustments
Remeasure-ments of defined benefit plans
Total accumulated
other comprehensive income (loss)
Non- controlling interests
Total net assets
Balance at April 1, 2016 476,086 ¥122,805 ¥132,748 ¥569,740 ¥(4,335) ¥ 820,958 ¥ 72,262 ¥(4,247) ¥ (510) ¥(364) ¥ 67,141 ¥ 29,178 ¥917,277Profit attributable to owners of parent — — — 103,489 — 103,489 — — — — — — 103,489Foreign currency translation adjustments — — — — — — — — (755) — (755) — (755)Net unrealized holding gains (losses) on securities — — — — — — 24,930 — — — 24,930 — 24,930Acquisition of treasury stock — — — — (47) (47) — — — — — — (47)Disposal of treasury stock — — 2 — 3 5 — — — — — — 5Cash dividends paid:
Final for prior year (¥11 per share) — — — (5,214) — (5,214) — — — — — — (5,214)Interim for current year (¥11 per share) — — — (5,213) — (5,213) — — — — — — (5,213)
Change in treasury shares of parent arising from transactions with non-controlling shareholders — — (2) — — (2) — — — — — — (2)
Profit attributable to non-controlling interests — — — — — — — — — — — 2,578 2,578Net deferred gains (losses) on hedges — — — — — — — 1,718 — — 1,718 — 1,718Remeasurements of defined benefit plans — — — — — — — — — 337 337 — 337
Balance at April 1, 2017 476,086 ¥122,805 ¥132,748 ¥662,802 ¥(4,379) ¥ 913,976 ¥ 97,192 ¥(2,529) ¥(1,265) ¥ (27) ¥ 93,371 ¥ 31,756 ¥1,039,103Profit attributable to owners of parent — — — 119,731 — 119,731 — — — — — — 119,731Foreign currency translation adjustments — — — — — — — — (828) — (828) — (828)Net unrealized holding gains (losses) on securities — — — — — — 33,923 — — — 33,923 — 33,923Acquisition of treasury stock — — — — (64) (64) — — — — — — (64)Disposal of treasury stock — — — — — — — — — — — — —Change in scope of consolidation — — — (4,885) — (4,885) — — — — — — (4,885)Cash dividends paid:
Final for prior year (¥13 per share) — — — (6,161) — (6,161) — — — — — — (6,161)Interim for current year (¥13 per share) — — — (6,161) — (6,161) — — — — — — (6,161)
Change in treasury shares of parent arising from transactions with non-controlling shareholders — — (28,594) — — (28,594) — — — — — — (28,594)
Profit attributable to non-controlling interests — — — — — — — — — — — (31,756) (31,756)Net deferred gains (losses) on hedges — — — — — — — 480 — — 480 — 480Remeasurements of defined benefit plans — — — — — — — — — 187 187 — 187
Balance at April 1, 2018 476,086 ¥122,805 ¥104,154 ¥765,326 ¥(4,443) ¥ 987,842 ¥131,115 ¥(2,049) ¥(2,093) ¥ 160 ¥127,133 ¥ — ¥1,114,975Profit attributable to owners of parent — — — 130,817 — 130,817 — — — — — — 130,817Foreign currency translation adjustments — — — — — — — — (259) — (259) — (259)Net unrealized holding gains (losses) on securities — — — — — — (21,905) — — — (21,905) — (21,905)Acquisition of treasury stock — — — — (27) (27) — — — — — — (27)Disposal of treasury stock — — 0 — 0 0 — — — — — — 0Change in scope of consolidation — — — (57) — (57) — — — — — — (57)Cash dividends paid:
Final for prior year (¥14 per share) — — — (6,635) — (6,635) — — — — — — (6,635)Interim for current year (¥14 per share) — — — (6,635) — (6,635) — — — — — — (6,635)
Profit attributable to non-controlling interests — — — — — — — — — — — — —Net deferred gains (losses) on hedges — — — — — — — (1,923) — — (1,923) — (1,923)Remeasurements of defined benefit plans — — — — — — — — — (234) (234) — (234)
Balance at March 31, 2019 476,086 ¥122,805 ¥104,154 ¥882,816 ¥(4,470) ¥1,105,305 ¥109,210 ¥(3,972) ¥(2,352) ¥ (74) ¥102,812 ¥ — ¥1,208,117
Thousands of U.S. dollars (Note 1)
Shareholders’ equity Accumulated other comprehensive income (loss)
Common stock
Capital surplus
Retained earnings
Treasury stock
Total shareholders’
equity
Net unrealized holding gains
(losses) on securities
Net deferred gains (losses)
on hedges
Foreign currency
translation adjustments
Remeasure-ments of defined benefit plans
Total accumulated
other comprehensive income (loss)
Non- controlling interests
Total net assets
Balance at April 1, 2018 $1,106,351 $938,324 $6,894,829 $(40,027) $8,899,477 $1,181,216 $(18,459) $(18,856) $1,441 $1,145,342 $— $10,044,819Profit attributable to owners of parent — — 1,178,532 — 1,178,532 — — — — — — 1,178,532Foreign currency translation adjustments — — — — — — — (2,333) — (2,333) — (2,333)Net unrealized holding gains (losses) on securities — — — — — (197,342) — — — (197,342) — (197,342)Acquisition of treasury stock — — — (243) (243) — — — — — — (243)Disposal of treasury stock — 0 — 0 0 — — — — — — 0Change in scope of consolidation — — (514) — (514) — — — — — — (514)Cash dividends paid:
Final for prior year ($0.13 per share) — — (59,775) — (59,775) — — — — — — (59,775)Interim for current year ($0.13 per share) — — (59,775) — (59,775) — — — — — — (59,775)
Profit attributable to non-controlling interests — — — — — — — — — — — —Net deferred gains (losses) on hedges — — — — — — (17,325) — — (17,325) — (17,325)Remeasurements of defined benefit plans — — — — — — — — (2,108) (2,108) — (2,108)
Balance at March 31, 2019 $1,106,351 $938,324 $7,953,297 $(40,270) $9,957,702 $ 983,874 $(35,784) $(21,189) $ (667) $ 926,234 $— $10,883,936
See accompanying notes.
52 53Sumitomo Realty & Development Co., Ltd.Integrated Report 2019

Financial Section
Consolidated Statements of Cash FlowsSumitomo Realty & Development Co., Ltd. and its consolidated subsidiariesFor the years ended March 31, 2019, 2018 and 2017
Millions of yenThousands of
U.S. dollars (Note 1)
2019 2018 2017 2019
Cash flows from operating activities:Income before income taxes ¥ 189,589 ¥ 176,444 ¥ 150,623 $ 1,708,009Depreciation and amortization 46,313 41,628 39,446 417,234Loss on impairment of fixed assets (Note 10) 8,576 10,635 15,538 77,261Provision for (Reversal of) allowance for doubtful accounts (309) (525) 411 (2,784)Increase (Decrease) in net defined benefit liability (242) 91 702 (2,180)Loss (Gain) on sale of property and equipment, net 3,649 179 (12) 32,874Loss on disposal of property and equipment 1,280 601 1,522 11,532Loss (Gain) on sale of investments in securities, net (12) (963) (43) (108)Loss (Gain) on devaluation of investments in securities 1,105 — — 9,955Interest and dividend income (10,067) (8,484) (6,707) (90,694)Interest expense 20,184 20,352 21,588 181,838Decrease (Increase) in notes and accounts receivable—trade 2,233 (5,669) 1,090 20,117Decrease (Increase) in inventories 65,981 25,915 5,574 594,423Increase (Decrease) in notes and accounts payable—trade 26,190 (12,536) (12,936) 235,946Increase (Decrease) in advances received (13,104) 17,076 7,816 (118,054)Other, net (1,800) (6,648) 5,029 (16,216)
Total 339,566 258,096 229,641 3,059,153
Proceeds from interest and dividend income 10,066 8,484 6,707 90,685Payments for interest (20,147) (20,395) (22,295) (181,505)Payments for income tax and other taxes (69,427) (56,252) (55,545) (625,468)
Net cash provided by operating activities 260,058 189,933 158,508 2,342,865
Cash flows from investing activities:Payments for purchases of property and equipment (188,573) (220,017) (254,931) (1,698,856)Proceeds from sale of property and equipment 6,617 357 125 59,613Payments for purchases of investments in securities (31,281) (28,835) (21,249) (281,811)Proceeds from sale and redemption of investments in securities 334 2,197 1,858 3,009Payments for guarantee and lease deposits paid to lessors (738) (1,317) (1,720) (6,649)Proceeds from guarantee and lease deposits paid to lessors 4,475 28,462 8,361 40,315Payments for guarantee and lease deposits received (14,324) (11,276) (11,260) (129,045)Proceeds from guarantee and lease deposits received 35,664 25,271 22,974 321,297Receipts of deposits from partnership investors 1,004 2,420 2,757 9,045Restitution of deposits from partnership investors (10,442) (11,544) (13,626) (94,072)Other, net (11,949) (6,252) (7,451) (107,648)
Net cash used in investing activities (209,213) (220,534) (274,162) (1,884,802)
Cash flows from financing activities:Increase (Decrease) in short-term debt, net (35,773) (2,892) (12,610) (322,279)Proceeds from issuance of bonds — 30,000 20,000 —Redemption of bonds (60,000) (80,000) (20,000) (540,541)Proceeds from non-recourse bonds 4,900 1,700 14,500 44,144Redemption of non-recourse bonds (4,900) (1,700) (16,460) (44,144)Proceeds from long-term loans payable 198,300 376,000 520,200 1,786,486Repayment of long-term loans payable (225,752) (209,622) (296,737) (2,033,802)Proceeds from long-term non-recourse loans 37,110 12,610 109,500 334,324Repayment of long-term non-recourse loans (44,611) (21,258) (106,820) (401,901)Decrease (Increase) in treasury stocks, net (27) (64) (43) (243)Cash dividends paid (13,269) (12,337) (11,276) (119,541)Payments for purchases of investments in subsidiaries not resulting
in change in scope of consolidation — (60,910) — —Other, net (2,036) (5,066) (2,257) (18,341)
Net cash provided by (used in) financing activities (146,058) 26,461 197,997 (1,315,838)
Effect of exchange rate changes on cash and cash equivalents 243 (124) (388) 2,189
Net increase (decrease) in cash and cash equivalents (94,970) (4,264) 81,955 (855,586)
Cash and cash equivalents at beginning of year 262,046 267,944 185,989 2,360,775Increase in cash and cash equivalents of a newly consolidated
subsidiary 3,631 — — 32,712Decrease in cash and cash equivalents resulting from exclusion
of subsidiaries from consolidation — (1,634) — —Cash and cash equivalents at end of year (Note 3) ¥ 170,707 ¥ 262,046 ¥ 267,944 $ 1,537,901
See accompanying notes.
Notes to Consolidated Financial StatementsSumitomo Realty & Development Co., Ltd. and its consolidated subsidiariesAs of and for the years ended March 31, 2019, 2018 and 2017
1 Basis of presenting consolidated financial statements
The accompanying consolidated financial statements of Sumitomo Realty & Development Co., Ltd. (“the Company”) and its consolidated subsidiaries have been prepared in accordance with the provisions set forth in the Financial Instruments and Exchange Act and its related accounting regulations, and in conformity with accounting principles generally accepted in Japan (“Japanese GAAP”), which are different in certain respects as to application and disclosure requirements from International Financial Reporting Standards (“IFRS”).
The accounts of the Company’s overseas subsidiaries are based on their accounting records maintained in conformity with generally accepted accounting principles prevailing in the respective countries of domicile. The accompanying consolidated financial statements have been restructured and translated into English (with certain expanded disclosure) from the consolidated financial statements of the Company prepared in accordance with Japanese GAAP and filed with the appropriate Local Finance Bureau of the Ministry of Finance as required by the Financial Instruments and Exchange Act. Certain supplementary information included in the statutory Japanese-language consolidated financial statements, but not required for fair presentation, is not presented in the accompanying consolidated financial statements.
The translation of the Japanese yen amounts into U.S. dollars is included solely for the convenience of readers outside Japan, using the prevailing exchange rate at March 31, 2019, which was ¥111.00 to U.S. $1. The translation should not be construed as representations that the Japanese yen amounts have been, could have been or could in the future be converted into U.S. dollars at this or any other rate of exchange.
2 Accounting policies(1) ConsolidationThe accompanying consolidated financial statements include the accounts of the Company and significant companies over which the Company has power of control through majority voting rights or existence of certain conditions evidencing control by the Company.
In the elimination of investments in subsidiaries, the assets and liabilities of the subsidiaries, including the portion attributable to minority shareholders, are recorded based on the fair value at the time the Company acquired control of the respective subsidiaries.
All significant intercompany balances, transactions and profits have been eliminated in consolidation.
(2) Foreign currency translationReceivables and payables denominated in foreign currencies are translated into Japanese yen at the year-end rate.
Financial statements of consolidated overseas subsidiaries are translated into Japanese yen at the year-end rate, except for shareholders’ equity accounts, which are translated at historical rates, and income statement items resulting from transactions with the Company, which are translated at the rates used by the Company.
Differences arising from translation are presented as “Foreign currency translation adjustments” in net assets.
(3) Cash and cash equivalentsIn preparing the consolidated statements of cash flows, cash on hand, readily available deposits and short-term, highly liquid investments with maturities not exceeding three months at the time of purchase are considered to be cash and cash equivalents.
(4) Recognition of revenueRevenues from sales operations of condominiums, detached houses and land lots are recognized when the units are delivered and customers accepted the delivery. Revenues from leasing operations of office buildings, residences and other properties are recognized as rent accrues over the lease term.
(5) InventoriesInventories are stated at cost, determined by the specific identification method principally. The carrying amount of inventories is written down when the profitability declines.
(6) SecuritiesHeld-to-maturity securities are stated at amortized cost. Investments in subsidiaries and affiliates that are not consolidated or accounted for using the equity method are stated at moving-average cost. Available-for-sale securities with available fair values are stated at fair value. Unrealized gains and losses on these securities are reported, net of applicable income taxes, as a separate component of net assets. Realized gains and losses on the sale of such securities are computed using moving-average cost.
Preferred equity securities are stated at cost determined by the specific identification method, and securities with no available fair value are stated at moving-average cost.
Investments in limited partnerships, which are regarded as securities under the Financial Instruments and Exchange Act, are accounted for in a manner similar to the equity method based on the recent financial statements.
If the market value of held-to-maturity securities, investments in subsid-iaries and affiliates and available-for-sale securities declines significantly, such securities are stated at fair value and the difference between fair value and the carrying amount is recognized as a loss in the period of the decline. If the fair value of investments in unconsolidated subsidiaries and affiliated compa-nies not accounted for using the equity method is not readily available, such securities should be written down to the net asset value with a correspond-ing charge in the income statement in the event net asset value declines significantly. In these cases, such fair value or the net asset value will be the carrying amount of the securities at the beginning of the next fiscal year.
(7) Property and equipmentThe Company and its consolidated domestic subsidiaries depreciate buildings using the straight-line method, and other property and equip-ment (excluding facilities attached to buildings and structures acquired on or after April 1, 2016) using the declining-balance method over their estimated useful lives. The consolidated overseas subsidiaries depreciate property and equipment using primarily the straight-line method in accordance with the accounting principles in the respective countries.
In addition, the Company and its consolidated domestic subsidiaries depreciate facilities attached to buildings and structures acquired on or after April 1, 2016 using the straight-line method.
Leased assets related to finance lease transactions without title trans-fer are depreciated using the straight-line method over the lease periods as their useful lives with no residual value.
Estimated useful lives used in the computation of depreciation are generally as follows:
Buildings and structures ..................... 6 to 60 yearsMachinery and equipment ................. 2 to 20 yearsLeased assets ..................................... Lease periods
54 55Sumitomo Realty & Development Co., Ltd.Integrated Report 2019

Financial Section
(8) Software costsSoftware costs are amortized using the straight-line method over the estimated useful lives (five years).
(9) Allowance for doubtful accountsThe Company and its consolidated subsidiaries provide for doubtful accounts at an estimated uncollectable amount based on the evaluation of certain identified doubtful and bankrupt receivables plus an amount calculated using the percentage of actual collection losses in certain reference periods with respect to remaining receivables.
(10) Lease transactionsLeased assets related to finance lease transactions without title transfer are depreciated using the straight-line method over the lease periods as their useful lives with no residual value.
(11) Income taxesIncome taxes are provided for on the basis of income for financial state-ment purposes. The tax effects of temporary differences between the carrying amounts of assets and liabilities for financial statements and income tax purposes are recognized as deferred income taxes.
(12) Employees’ severance and retirement benefitsThe Company and its certain consolidated subsidiaries provide two types of post-employment benefit plans, lump-sum payment plans and defined benefit corporate pension plans, under which all eligible employees are entitled to benefits based on their current rate of pay, length of service and the conditions under which termination occurs.
For the calculation of retirement benefit obligations, the estimated amount of retirement benefits is allocated to the respective fiscal years by the straight-line method.
Some of the Company’s consolidated subsidiaries calculate net defined benefit liability and retirement benefit expenses by using a simplified method in which retirement benefit obligations are equal to the amount that would be paid if all employees resigned voluntarily at the end of the fiscal year.
Prior service costs are recognized as expenses in the period in which they are incurred, and actuarial gains and losses are recognized as expenses in the following period.
(13) Construction contractsThe construction projects for which the outcome of the portion com-pleted by the end of the fiscal year under review can be reliably esti-mated are accounted for by the percentage-of-completion method (the degree of completion of each construction project is estimated using the cost-comparison method), while other construction projects are accounted for by the completed-contract method.
(14) Derivative transactions and hedge accountingThe Company and its consolidated subsidiaries state derivative financial instruments at fair value and recognize changes in the fair value as gains or losses unless derivative financial instruments are used for hedging purposes and qualify for hedge accounting.
If derivative financial instruments are used as hedges and meet certain hedging criteria, the Company and its consolidated subsidiaries defer recognition of gains or losses resulting from changes in fair value of the derivative financial instruments until the related gains or losses on the hedged items are recognized.
However, in cases where foreign exchange forward contracts are used as hedges and meet certain hedging criteria (regarding foreign exchange contracts), the foreign exchange forward contracts and hedged items are accounted for in the following manner:1. If a foreign exchange forward contract is executed to hedge an exist-
ing foreign currency receivable or payable,(a) the difference, if any, between the Japanese yen amount of the
hedged foreign currency receivable or payable translated using the spot rate at the inception date of the contract and the carrying amount of the receivable or payable is recognized in the income statement in the period which includes the inception date; and
(b) the discount or premium on the contract (that is, the difference between the Japanese yen amount of the contract translated using the contracted forward rate and that translated using the spot rate at the inception date of the contract) is recognized over the term of the contract.
2. If a foreign exchange forward contract is executed to hedge a future transaction denominated in a foreign currency, the future transaction will be recorded using the contracted forward rate, and no gains or losses on the foreign exchange forward contract are recognized.Also, if interest rate swap contracts are used as a hedge and meet
certain hedging criteria (regarding interest rate swap contracts), the net amount to be paid or received under the interest rate swap contracts is added to or deducted from the interest on the assets or liabilities relative to which the swap contract was executed as a hedge.
(15) Amounts per share of common stockThe computation of earnings per share is based on the weighted-average number of shares of common stock outstanding during each year.
Diluted earnings per share is computed based on the amount of profit attributable to owners of parent on common stock and the weighted-av-erage number of shares of common stock outstanding during each year after giving effect to the dilutive potential of shares of common stock to be issued upon the exercise of stock options.
Diluted earnings per share is not presented as there are no potential shares.
Cash dividends per share represent actual amounts applicable to the respective year.
(16) New accounting pronouncements (Accounting standards and guidance issued but not yet effective)
“Accounting Standard for Revenue Recognition” (ASBJ Statement No. 29, March 30, 2018)“Implementation Guidance on Accounting Standard for Revenue Recognition” (ASBJ Guidance No. 30, March 30, 2018)(1) Overview
The standard and guidance provide comprehensive principles for revenue recognition. Under the standard and guidance, revenue is recognized by applying the following 5 steps:Step 1: Identify contract(s) with customersStep 2: Identify the performance obligations in the contractStep 3: Determine the transaction priceStep 4: Allocate the transaction price to the performance obligation in
the contractStep 5: Recognize revenue when (or as) the entity satisfies a perfor-
mance obligation
(2) Effective dateEffective from the beginning of the fiscal year ending March 31, 2022
(3) Effects of the application of the standardsThe Company and its consolidated domestic subsidiaries are currently in the process of determining the effects of these new standards on the consolidated financial statements.
(17) Changes in presentation methods(Changes due to adoption of “Partial Amendments to Accounting Standard for Tax Effect Accounting”)Effective from the beginning of the year ended March 31, 2019, the Company and its consolidated subsidiaries adopted “Partial Amendments to Accounting Standard for Tax Effect Accounting” (ASBJ Statement No. 28, February 16, 2018) and changed the presentation and related notes of deferred tax assets and deferred tax liabilities, such that deferred tax assets and deferred tax liabilities are classified as part of “Other assets” and “Long-term liabilities”, respectively.
As a result, “Deferred income taxes” in “Current assets” decreased by ¥21,793 million and “Deferred income taxes” in “Other assets” increased by ¥2,090 million in the consolidated balance sheet as of March 31, 2018. In addition, “Other current liabilities” and “Other long-term liabilities” decreased by ¥59 million and ¥19,644 million as of March 31, 2018, respectively.
Total assets decreased by ¥19,703 million as of March 31, 2018 as a result of offsetting deferred tax assets and deferred tax liabilities relating to the same taxable entity.
(Consolidated statements of income)“Dividend to partnership investors” previously separately presented in “Other income (expenses)” was included in “Other, net” from the year ended March 31, 2019, because the significance of the amount decreased. Reflecting this change in presentation, the consolidated state-ments of income for the years ended March 31, 2018 and 2017 were reclassified, respectively.
As a result, “Dividend to partnership investors” of ¥795 million was reclassified to “Other, net” for the year ended March 31, 2018, and “Dividend to partnership investors” of ¥1,143 million was reclassified to “Other, net” for the year ended March 31, 2017.(Consolidated statements of cash flows)“Increase (Decrease) in assignment of receivables” previously separately presented in “Cash flows from financing activities” was included in “Other, net” from the year ended March 31, 2019, because the signifi-cance of the amount decreased. Reflecting this change in presentation, the consolidated statements of cash flows for the years ended March 31, 2018 and 2017 were reclassified, respectively.
As a result, “Increase (Decrease) in assignment of receivables” of ¥3,000 million was reclassified to “Other, net” for the year ended March 31, 2018, and “Increase (Decrease) in assignment of receivables” of ¥300 million was reclassified to “Other, net” for the year ended March 31, 2017.
3 Cash and cash equivalentsCash and cash equivalents at March 31, 2019 and 2018 consisted of the following:
Millions of yenThousands of U.S. dollars
2019 2018 2019
Cash, time and notice deposits ¥172,192 ¥263,210 $1,551,279Time deposits (1,485) (1,164) (13,378)Cash and cash equivalents ¥170,707 ¥262,046 $1,537,901
4 InventoriesInventories at March 31, 2019 and 2018 are as follows:
Millions of yenThousands of U.S. dollars
2019 2018 2019
Real estate for sale ¥390,026 ¥380,736 $3,513,748Real estate for sale in process 282,595 395,730 2,545,901Costs on uncompleted construction contracts 5,827 5,015 52,495Other 1,455 1,827 13,108Total ¥679,903 ¥783,308 $6,125,252
The Company transferred amounts between inventories and property and equipment. Such transfers at March 31, 2019 and 2018 are as follows:
Millions of yenThousands of U.S. dollars
2019 2018 2019
Inventories:
Transferred to property and equipment ¥(23,162) ¥(38,047) $(208,666)Transferred from property and equipment 4,822 2,490 43,441
Net decrease ¥(18,340) ¥(35,557) $(165,225)
56 57Sumitomo Realty & Development Co., Ltd.Integrated Report 2019

Financial Section
5 Pledged assetsAssets pledged as collateral at March 31, 2019 and 2018 are as follows:
Millions of yenThousands of U.S. dollars
2019 2018 2019
Cash, time and notice deposits ¥ 2,068 ¥ 2,081 $ 18,631
Buildings and structures 103,708 108,319 934,306
Land 393,316 393,316 3,543,387
Construction in progress 85 99 766
Machinery and equipment 210 268 1,892
Total ¥499,387 ¥504,083 $4,498,982
Secured liabilities at March 31, 2019 and 2018 are as follows:
Millions of yenThousands of U.S. dollars
2019 2018 2019
Long-term non-recourse debt due within one year ¥102,298 ¥ 49,410 $ 921,604Long-term non-recourse debt due after one year 300,900 361,289 2,710,811Total ¥403,198 ¥410,699 $3,632,415
Specified assets for non-recourse debts at March 31, 2019 and 2018 are as follows:
Millions of yenThousands of U.S. dollars
2019 2018 2019
Cash, time and notice deposits ¥ 11,345 ¥ 10,652 $ 102,207Buildings and structures 103,708 108,319 934,306Land 393,316 393,316 3,543,387Construction in progress 85 99 766Machinery and equipment 210 268 1,893Total ¥508,664 ¥512,654 $4,582,559
(Note) “Specified assets for non-recourse debts” includes a portion of the amount of “Assets pledged as collateral” for the years ended March 31, 2019 and 2018.
6 Financial instruments1. Policy for financial instrumentsThe Company and its consolidated subsidiaries (“the Group”) have the policy to limit its fund management to short-term deposits with funds through loans from banks and the issuance of corporate bonds and commercial paper.
The Group utilizes derivative financial instruments only for the pur-pose of hedging the foreign exchange risk associated with foreign cur-rency-denominated transactions or hedging the interest rate risk associated with the Group’s loans payable, and does not utilize derivative financial instruments for any speculative purposes.
2. Details of financial instruments, risks, and policies and systems of risk management
Operating receivables such as notes and accounts receivable—trade are exposed to customers’ credit risk, but this risk is generally avoided through the receipt of deposits.
Investments in securities are business-related equities and are exposed to market price fluctuation risk. The Group regularly checks the market value of the securities and the financial condition of the issuers, and continuously reviews whether it continues to hold securities with consid-eration for its relationships with the issuers.
Guarantee and lease deposits are mostly deposits related to leasing properties, and are exposed to the counterparty credit risk.
In addition, the Group accommodates counterparties with loans and consequently is exposed to the borrowers’ credit risk. However, the Group constantly checks the financial condition of principal borrowers and their performance using the funds lent to those borrowers even after accommodation.
The majority of due dates of operating debt, such as notes and accounts payable, are within one year.
Interest rate swap contracts are used to hedge risks arising from fluctuations in interest rates on certain loans and corporate bonds.
In regard to derivative transactions, the Group utilizes interest rate swaps for bank loans and deposits, and utilizes foreign exchange forward contracts and cross currency swap contracts for foreign currency-denomi-nated transactions. Interest rate swap contracts are exposed to the risks of interest rate changes, and foreign exchange forward contracts and cross currency swap contracts are exposed to the risks of foreign exchange rate changes. The derivative financial instruments are executed with creditworthy financial institutions, and the Group’s management believes there is insignificant risk of default by counterparties. Derivative transactions are executed by the Group’s Finance Department in accor-dance with the decisions of a committee whose chairman is the director of the Finance Department. The Finance Department prepares reports on derivative transactions that are provided to the director of the Finance Department periodically.
3. Supplemental information on fair values of financial instrumentsThe fair values of financial instruments are based on their market prices, and if the market price is not available, other rational valuation tech-niques are used instead. The rational valuation techniques incorporate variable factors, and as a result the values may change due to using different assumptions.
The amounts of derivative transactions shown in Note 16 “Derivative
transactions” are not representing the market risks related to derivative transactions.
The carrying amounts of financial instruments on the consolidated balance sheets, their fair values and the differences between them as of March 31, 2019 and 2018 are as follows. (Financial instruments whose fair value is extremely difficult to estimate are not included; please see (Note 2).)
For 2019Millions of yen Thousands of U.S. dollars
Carrying amount Fair value Difference Carrying amount Fair value Difference
Assets:
(1) Cash, time and notice deposits ¥ 172,192 ¥ 172,192 ¥ — $ 1,551,279 $ 1,551,279 $ —(2) Notes and accounts receivable—trade 21,567 21,567 — 194,297 194,297 —(3) Investments in securities
Available-for-sale securities 414,743 414,743 — 3,736,423 3,736,423 —(4) Guarantee and lease deposits
Held-to-maturity securities 3,169 3,167 (2) 28,550 28,532 (18)Available-for-sale securities 1,170 1,170 — 10,541 10,541 —
Total assets ¥ 612,841 ¥ 612,839 ¥ (2) $ 5,521,090 $ 5,521,072 $ (18)Liabilities:
(1) Notes and accounts payable—trade ¥ 54,939 ¥ 54,939 ¥ — $ 494,946 $ 494,946 $ —(2) Short-term debt 25,643 25,643 — 231,018 231,018 —(3) Long-term debt (including due within one year) 2,913,946 2,964,782 50,836 26,251,766 26,709,747 457,981(4) Long-term non-recourse debt (including due within one year) 403,198 410,218 7,020 3,632,414 3,695,658 63,244Total liabilities ¥3,397,726 ¥3,455,582 ¥57,856 $30,610,144 $31,131,369 $521,225Derivative transactions*:
Hedge accounting ¥ (5,733) ¥ (5,733) ¥ — $ (51,649) $ (51,649) $ —Total derivative transactions ¥ (5,733) ¥ (5,733) ¥ — $ (51,649) $ (51,649) $ —
For 2018Millions of yen
Carrying amount Fair value Difference
Assets:
(1) Cash, time and notice deposits ¥ 263,210 ¥ 263,210 ¥ —
(2) Notes and accounts receivable—trade 23,773 23,773 —
(3) Investments in securities
Available-for-sale securities 417,841 417,841 —
(4) Guarantee and lease deposits
Held-to-maturity securities 789 791 2
Available-for-sale securities 1,180 1,180 —
Total assets ¥ 706,793 ¥ 706,795 ¥ 2
Liabilities:
(1) Notes and accounts payable—trade ¥ 28,751 ¥ 28,751 ¥ —
(2) Short-term debt 61,416 61,416 —
(3) Long-term debt (including due within one year) 3,001,398 3,032,800 31,402
(4) Long-term non-recourse debt (including due within one year) 410,699 415,716 5,017
Total liabilities ¥3,502,264 ¥3,538,683 ¥36,419
Derivative transactions*:
Hedge accounting ¥ (2,983) ¥ (2,983) ¥ —
Total derivative transactions ¥ (2,983) ¥ (2,983) ¥ —
* Derivative transactions are stated at net of assets and liabilities. Figures in parentheses indicate net liabilities.
58 59Sumitomo Realty & Development Co., Ltd.Integrated Report 2019

Financial Section
(Note 1) The calculation methods of fair value for financial instrumentsAssets:(1) Cash, time and notice depositsThe fair value of cash, time and notice deposits approximates their carry-ing amounts because of their short-term maturities.(2) Notes and accounts receivable—tradeThe fair value of notes and accounts receivable—trade approximates their carrying amounts unless the credit standing of debtors has changed significantly since the loan origination.
The allowance for doubtful receivables is estimated based on expected recoverable amounts, considering the possibility of individual collections. Therefore the fair value of doubtful receivables approximates the carrying amount deducted by the estimated allowance for doubtful accounts on the consolidated balance sheets as of the end of the fiscal year.(3) Investments in securitiesThe fair value of listed shares is based on the exchange prices at market. For floating rate notes, the carrying amount is presented as the fair value, as the fair value approximates the carrying amount because the market interest rate is reflected in such notes within a short time period. The fair value of the fixed-coupon debt is determined based on the present value discounted at the interest rate which reflects the period remaining to maturity and the credit risk.
For notes on securities classified by purpose of holding, please see Note 7 “Securities.”(4) Guarantee and lease depositsThe fair value of guarantee and lease deposits are based on the value offered by correspondent financial institutions.
For notes on securities classified by purpose of holding, please see Note 7 “Securities.”
Liabilities:(1) Notes and accounts payable—trade and (2) Short-term debtThe fair value of these items approximates their carrying amounts because of their short-term maturities.(3) Long-term debt (including due within one year)For floating rate notes, the carrying amount is used as the fair value because the market interest rate is reflected in such notes within a short time period and because the credit standing of the Company is the same after borrowing. The fixed-coupon debt is calculated by discounting the combined total of principal and interest at an interest rate assumed for similar new borrowings.
The specific matching criteria of interest rate swaps and cross currency interest rate swaps are applicable to some long-term debts with floating interest rates (please see Note 16 “Derivative transactions”). The fair value of these items is calculated by discounting the combined total of interest and principal, with which the interest rate swap and cross cur-rency interest rate swap have been accounted for, at an interest rate rationally estimated for similar borrowings.
The fair value of corporate bonds issued by the Company (included in (3) Long-term debt (including due within one year)) is based on the market price.(4) Long-term non-recourse debt (including due within one year)For floating rate notes, the carrying amount is used as the fair value because the market interest rate is reflected in such notes within a short time period and the value of its non-exempt properties has not been changed.
The fixed-coupon debt is calculated by discounting the combined total of principal and interest at an interest rate assumed for similar new borrowings or bonds.
The specific matching criteria of interest rate swaps are applicable to some long-term non-recourse debts with floating interest rates (please see Note 16 “Derivative transactions”). The fair value of these items is calculated by discounting the combined total of interest and principal, with which the interest rate swap has been accounted for, at an interest rate rationally estimated for similar borrowings or bonds.
Derivative transactions:Please see Note 16 “Derivative transactions.”
(Note 2) Financial instruments whose fair value is extremely difficult to estimateCarrying amount
Millions of yenThousands of U.S. dollars
2019 2018 2019
Investments in subsidiaries and affiliates*1 ¥ 35,856 ¥ 42,745 $ 323,027
Unlisted equity securities*1 2,327 1,297 20,964
Preferred equity securities, etc.*1 25,688 25,338 231,423
Investments in limited partnerships, etc.*1 352 352 3,171Guarantee and lease deposits
(excluding held-to-maturity securities and available-for-sale securities)*2 65,960 69,095 594,234
Guarantee and deposits received*3 228,959 207,824 2,062,694
*1. The fair value of these items are not disclosed since their market price is unavailable and the assessment of their fair value is deemed extremely difficult.*2. Guarantee and lease deposits (excluding held-to-maturity securities and available-for-sale securities) are not included in “Assets (4) Guarantee and lease deposits” because their remaining terms cannot
be determined and the assessment of their fair value is deemed extremely difficult.*3. The fair value of guarantee and deposits received (mainly consisting of lease deposits) are not disclosed because their remaining terms cannot be determined and the assessment of their fair value is
deemed extremely difficult.
(Note 3) Redemption schedule of pecuniary claims and securities with maturitiesFor 2019
Millions of yen
1 year or less 1 to 5 years 5 to 10 years Over 10 years
Cash, time and notice deposits ¥172,192 ¥ — ¥ — ¥—Notes and accounts receivable—trade 21,567 — — —Guarantee and lease deposits:
Held-to-maturity securities (National government bonds) 2,969 200 — —Available-for-sale securities with maturities (National government bonds) 407 561 171 —
Total ¥197,135 ¥761 ¥171 ¥—
For 2018Millions of yen
1 year or less 1 to 5 years 5 to 10 years Over 10 years
Cash, time and notice deposits ¥263,210 ¥ — ¥ — ¥—
Notes and accounts receivable—trade 23,773 — — —
Guarantee and lease deposits:
Held-to-maturity securities (National government bonds) 328 462 — —
Available-for-sale securities with maturities (National government bonds) — 842 298 —
Total ¥287,311 ¥1,304 ¥298 ¥—
For 2019Thousands of U.S. dollars
1 year or less 1 to 5 years 5 to 10 years Over 10 years
Cash, time and notice deposits $1,551,279 $ — $ — $—Notes and accounts receivable—trade 194,297 — — —Guarantee and lease deposits:
Held-to-maturity securities (National government bonds) 26,748 1,802 — —Available-for-sale securities with maturities (National government bonds) 3,667 5,054 1,541 —
Total $1,775,991 $6,856 $1,541 $—
(Note 4) Repayment schedule of corporate bonds, long-term debt, long-term non-recourse debt and other interest-bearing debtFor 2019
Millions of yen
Year ending March 31 2020 2021 2022 2023 2024 2025 and thereafter
Short-term debt ¥ 25,643 ¥ — ¥ — ¥ — ¥ — ¥ —Long-term debt (including due within one year) 169,619 131,281 211,256 237,196 289,282 1,875,312Long-term non-recourse debt (including due within one year) 102,298 69,913 14,944 3,386 3,240 209,417Total ¥297,560 ¥201,194 ¥226,200 ¥240,582 ¥292,522 ¥2,084,729
For 2018Millions of yen
Year ending March 31 2019 2020 2021 2022 2023 2024 and thereafter
Short-term debt ¥ 61,416 ¥ — ¥ — ¥ — ¥ — ¥ —
Long-term debt (including due within one year) 275,752 169,619 131,281 221,256 237,196 1,966,294
Long-term non-recourse debt (including due within one year) 49,410 101,514 69,129 14,160 2,716 173,770
Total ¥386,578 ¥271,133 ¥200,410 ¥235,416 ¥239,912 ¥2,140,064
For 2019Thousands of U.S. dollars
Year ending March 31 2020 2021 2022 2023 2024 2025 and thereafter
Short-term debt $ 231,018 $ — $ — $ — $ — $ —Long-term debt (including due within one year) 1,528,099 1,182,712 1,903,207 2,136,901 2,606,144 16,894,703Long-term non-recourse debt (including due within one year) 921,604 629,847 134,631 30,504 29,189 1,886,639Total $2,680,721 $1,812,559 $2,037,838 $2,167,405 $2,635,333 $18,781,342
60 61Sumitomo Realty & Development Co., Ltd.Integrated Report 2019

Financial Section
7 SecuritiesFor 2019A. The following tables summarize the acquisition costs, carrying amounts and fair values of securities with available fair values as of March 31, 2019:(a) Held-to-maturity securities:
Millions of yen Thousands of U.S. dollars
Carrying amount Fair value Difference Carrying amount Fair value Difference
Securities whose fair value exceeds carrying amount:National and local government bonds, etc. ¥ 461 ¥ 462 ¥ 1 $ 4,153 $ 4,162 $ 9
Securities whose fair value does not exceed carrying amount:National and local government bonds, etc. 2,708 2,705 (3) 24,397 24,370 (27)Total ¥3,169 ¥3,167 ¥(2) $28,550 $28,532 $(18)
(b) Available-for-sale securities:Millions of yen Thousands of U.S. dollars
Carrying amount Acquisition cost Difference Carrying amount Acquisition cost Difference
Securities whose carrying amount exceeds acquisition cost:Equity securities ¥348,562 ¥180,791 ¥167,771 $3,140,198 $1,628,748 $1,511,450Debt securities* 1,171 1,140 31 10,550 10,270 280Other — — — — — —Subtotal 349,733 181,931 167,802 3,150,748 1,639,018 1,511,730
Securities whose carrying amount does not exceed acquisition cost:Equity securities 65,517 75,824 (10,307) 590,243 683,099 (92,856)Debt securities — — — — — —Other 664 664 — 5,982 5,982 —Subtotal 66,181 76,448 (10,307) 596,225 689,081 (92,856)
Total ¥415,914 ¥258,419 ¥157,495 $3,746,973 $2,328,099 $1,418,874* Debt securities in securities whose carrying amount exceeds acquisition cost are included in “Guarantee and lease deposits paid to lessors” on the consolidated balance sheets.
(Note) The Company recognized impairment loss on investments in securities of ¥1,105 million ($9,955 thousand) related to equity securities in available-for-sale securities.
B. Total sales of available-for-sale securities sold in the year ended March 31, 2019 amounted to ¥264 million ($2,378 thousand) and the related gains amounted to ¥12 million ($108 thousand).
For 2018A. The following tables summarize the acquisition costs, carrying amounts and fair values of securities with available fair values as of March 31, 2018:(a) Held-to-maturity securities:
Millions of yen
Carrying amount Fair value Difference
Securities whose fair value exceeds carrying amount:National and local government bonds, etc. ¥789 ¥791 ¥ 2
Securities whose fair value does not exceed carrying amount:National and local government bonds, etc. — — —Total ¥789 ¥791 ¥ 2
(b) Available-for-sale securities:Millions of yen
Carrying amount Acquisition cost Difference
Securities whose carrying amount exceeds acquisition cost:Equity securities ¥394,231 ¥202,083 ¥192,148Debt securities* 1,180 1,140 40Other — — —Subtotal 395,411 203,223 192,188
Securities whose carrying amount does not exceed acquisition cost:Equity securities 23,281 26,368 (3,087)Debt securities — — —Other 329 329 —Subtotal 23,610 26,697 (3,087)
Total ¥419,021 ¥229,920 ¥189,101* Debt securities in securities whose carrying amount exceeds acquisition cost are included in “Guarantee and lease deposits paid to lessors” on the consolidated balance sheets.
B. Total sales of available-for-sale securities sold in the year ended March 31, 2018 amounted to ¥1,663 million and the related gains and losses amounted to ¥1,010 million and ¥47 million, respectively.
8 Short-term debt and long-term debtShort-term debt at March 31, 2019 and 2018 consisted of the following:
Millions of yenThousands of U.S. dollars
2019Average interest
rate (%) 2018Average interest
rate (%) 2019
Loans, principally from banks ¥25,643 0.27 ¥61,416 0.25 $231,018Commercial paper — — — — —Total ¥25,643 ¥61,416 $231,018
The interest rates represent weighted-average rates in effect at March 31, 2019 and 2018, regardless of borrowing currencies, though the range of the interest rate varies by borrowing currency.
Long-term debt at March 31, 2019 and 2018 consisted of the following:
Millions of yenThousands of U.S. dollars
2019 2018 2019
2.50% domestic straight bonds, due 2019 ¥ 10,000 ¥ 10,000 $ 90,0900.329% domestic straight bonds, due 2018 — 10,000 —0.563% domestic straight bonds, due 2020 10,000 10,000 90,0900.877% domestic straight bonds, due 2020 20,000 20,000 180,1800.462% domestic straight bonds, due 2018 — 10,000 —1.098% domestic straight bonds, due 2023 10,000 10,000 90,0900.426% domestic straight bonds, due 2018 — 20,000 —0.355% domestic straight bonds, due 2018 — 10,000 —0.950% domestic straight bonds, due 2023 10,000 10,000 90,0900.344% domestic straight bonds, due 2018 — 10,000 —0.968% domestic straight bonds, due 2023 10,000 10,000 90,0900.987% domestic straight bonds, due 2024 20,000 20,000 180,1800.914% domestic straight bonds, due 2024 20,000 20,000 180,1800.904% domestic straight bonds, due 2024 20,000 20,000 180,1800.884% domestic straight bonds, due 2024 20,000 20,000 180,1800.836% domestic straight bonds, due 2024 20,000 20,000 180,1800.809% domestic straight bonds, due 2024 20,000 20,000 180,1800.429% domestic straight bonds, due 2021 10,000 10,000 90,0900.392% domestic straight bonds, due 2022 10,000 10,000 90,0900.670% domestic straight bonds, due 2025 10,000 10,000 90,0900.826% domestic straight bonds, due 2025 20,000 20,000 180,1800.992% domestic straight bonds, due 2025 20,000 20,000 180,1800.400% domestic straight bonds, due 2026 10,000 10,000 90,0900.230% domestic straight bonds, due 2026 10,000 10,000 90,0900.400% domestic straight bonds, due 2027 30,000 30,000 270,271Loans, principally from banks and insurance companies, with interest at weighted-average rates of 0.31%
in 2019 and 0.32% in 2018:
Secured — — —Unsecured 2,603,946 2,631,398 23,458,975Subtotal 2,913,946 3,001,398 26,251,766
Amount due within one year (169,619) (275,752) (1,528,099)Total ¥2,744,327 ¥2,725,646 $24,723,667
62 63Sumitomo Realty & Development Co., Ltd.Integrated Report 2019

Financial Section
Non-recourse debt at March 31, 2019 and 2018 consisted of the following:
Millions of yenThousands of U.S. dollars
2019 2018 2019
Non-recourse bonds, with interest at weighted-average rates of 0.07% in 2019 and 0.11% in 2018:
Due within one year ¥ 2,000 ¥ 4,900 $ 18,018Due after one year 37,100 34,200 334,234Subtotal 39,100 39,100 352,252
Non-recourse loans, with interest at weighted-average rates of 0.11% in 2019 and 0.15% in 2018:
Due within one year 100,298 44,510 903,586Due after one year 263,800 327,089 2,376,576Subtotal 364,098 371,599 3,280,162
Total ¥403,198 ¥410,699 $3,632,414
Secured ¥403,198 ¥410,699 $3,632,414Unsecured — — —
Total ¥403,198 ¥410,699 $3,632,414
The aggregate annual maturities of long-term debt at March 31, 2019 are as follows:
Year ending March 31 Millions of yenThousands of U.S. dollars
2020 ¥ 169,619 $ 1,528,0992021 131,281 1,182,7122022 211,256 1,903,2072023 237,196 2,136,9012024 289,282 2,606,1442025 and thereafter 1,875,312 16,894,703Total ¥2,913,946 $26,251,766
The aggregate annual maturities of non-recourse debt at March 31, 2019 are as follows:
Year ending March 31 Millions of yenThousands of U.S. dollars
2020 ¥102,298 $ 921,6042021 69,913 629,8472022 14,944 134,6312023 3,386 30,5042024 3,240 29,1892025 and thereafter 209,417 1,886,639Total ¥403,198 $3,632,414
It is customary in Japan that security must be given if requested by lending banks under certain circumstances, and generally banks have the right to offset cash deposited with them against any debt or obligations payable to the bank that becomes due in the case of default and certain other specified events. The Company and its consolidated subsidiaries have never received such a request.
9 Employees’ severance and retirement benefitsAs explained in Note 2 (12), the liabilities and expenses for severance and retirement benefits are determined based on the amounts obtained by actuarial calculations except for the cases using the simplified method.
For 2019 and 20181. Defined benefit plan(1) Adjustment table of retirement benefit obligations between the beginning and the end of the fiscal year
Millions of yenThousands of U.S. dollars
2019 2018 2019
Retirement benefit obligations at beginning of year ¥11,615 ¥11,316 $104,640Service costs 714 717 6,432Interest costs 48 47 432Actuarial differences (1) (53) (9)Retirement benefits paid (500) (412) (4,504)
Retirement benefit obligations at end of year ¥11,876 ¥11,615 $106,991
(2) Adjustment table of plan assets between the beginning and the end of the fiscal year
Millions of yenThousands of U.S. dollars
2019 2018 2019
Plan assets at beginning of year ¥5,650 ¥5,172 $50,901Expected return on plan assets 113 103 1,018Actuarial differences (67) 176 (604)Employer contributions 388 398 3,496Retirement benefits paid (227) (199) (2,045)
Plan assets at end of year ¥5,857 ¥5,650 $52,766
(3) Adjustment table of retirement benefit obligations and plan assets at the end of the fiscal year and net defined benefit liability on the consolidated balance sheets
Millions of yenThousands of U.S. dollars
2019 2018 2019
Obligations under retirement benefit plans (funded) ¥ 6,295 ¥ 6,241 $ 56,712Fair value of plan assets (5,857) (5,650) (52,766)
438 591 3,946Obligations under retirement benefit plans (unfunded) 5,581 5,374 50,279Net amount of liabilities on the consolidated balance sheets ¥ 6,019 ¥ 5,965 $ 54,225
Net defined benefit liability ¥ 6,019 ¥ 5,965 $ 54,225Net amount of liabilities on the consolidated balance sheets ¥ 6,019 ¥ 5,965 $ 54,225
(4) Components of retirement benefit expenses
Millions of yenThousands of U.S. dollars
2019 2018 2019
Service costs ¥ 714 ¥ 717 $ 6,432Interest costs 48 47 432Expected return on plan assets (113) (103) (1,018)Actuarial differences (229) 41 (2,063)Retirement benefit expenses ¥ 420 ¥ 702 $ 3,783
(5) Remeasurements of defined benefit plans (before deducting tax effect)
Millions of yenThousands of U.S. dollars
2019 2018 2019
Actuarial differences ¥295 ¥(270) $2,658Total ¥295 ¥(270) $2,658
64 65Sumitomo Realty & Development Co., Ltd.Integrated Report 2019

Financial Section
(6) Components of remeasurements of defined benefit plans (before deducting tax effect)
Millions of yenThousands of U.S. dollars
2019 2018 2019
Unrecognized actuarial differences ¥66 ¥(229) $595Total ¥66 ¥(229) $595
(7) Major breakdown of plan assets2019 2018
Debt securities 25.6% 26.8%
Equity securities 34.9 34.4
General life insurance accounts 37.8 37.7
Other 1.7 1.1
Total 100.0% 100.0%
(8) Actuarial assumptions2019 2018
Discount rate 0.4% 0.4%
Rate of expected return on plan assets 2.0 2.0
2. Defined contribution planThe required contribution amount for a defined contribution plan that one of the Company’s consolidated subsidiaries adopted is ¥389 million ($3,505 thousand) and ¥380 million for the years ended March 31, 2019 and 2018, respectively.
10 Loss on impairment of fixed assetsThe Company and its consolidated domestic subsidiaries recognized impairment losses on the following assets for the years ended March 31, 2019, 2018 and 2017, respectively.
For 2019Use Location Number of properties
Asset leased to others Tokyo 1
For 2018Use Location Number of properties
Asset leased to others Tokyo 1
For 2017Use Location Number of properties
Land for development Tokyo, etc. 5
The Company and its consolidated domestic subsidiaries recognized losses on the impairment of certain properties, which are generally assessed individually for impairment. The Company’s houses are treated as common assets.
Loss on sales of property and equipment of ¥8,576 million ($77,261 thousand) was recognized by a consolidated subsidiary by restructuring of assets within the Group for the year ended March 31, 2019. The selling price of the asset, based on evaluation by a real estate appraiser, was determined as its recoverable amount, and loss on sales of property and equipment of the asset was recognized as impairment losses in other expenses for the year ended March 31, 2019.
The carrying value of the asset has been reduced to its recoverable amount by ¥10,635 million since the total amount of its future cash flow
is estimated to be less than the carrying value for the year ended March 31, 2018. The recoverable amount is calculated by discounting the future cash flow at 4.0%.
The carrying values of the land holdings summarized above have been reduced to their recoverable amounts by ¥15,538 million as a result of mainly the determination of reviewing their business plans for the year ended March 31, 2017. The recoverable amounts of the assets for the years ended March 31, 2017 were determined as the net dis-posal value. The net disposal value for land for leased buildings and land for development are based on the amount equivalent to the publicly notified land price.
These write-downs were recognized as impairment losses in other expenses for the years ended March 31, 2018 and 2017, respectively.
11 Asset retirement obligationsEven though removing asbestos is required for some buildings the Company and its consolidated subsidiaries (“the Group”) operate at the time of demolishing, it is difficult to estimate the fair value of obligations associated with such assets reasonably since the timing and/or method of settlement for the retirement obligations are not clear enough. Therefore, for the years ended March 31, 2019 and 2018, asset retirement obligations related to such a case are not recorded (except for the asset retirement obligations recorded on the financial statements).
In addition, under the partial lease contracts, the Group has obligations for restoring office spaces when they move out. For the asset retirement obligations associated with such a case, the duration of use of the assets is not clear enough and these assets do not have any relocation plans. Therefore, the Group is unable to estimate the asset retirement obligations since it is difficult to estimate the timing of fulfillment of the obligations. Consequently, for the years ended March 31, 2019 and 2018, asset retire-ment obligations related to such a case are not recorded (except for the asset retirement obligations recorded on the financial statements).
12 Income taxesThe normal effective statutory income tax rate in Japan arising out of the aggregation of corporate, enterprise and inhabitants’ taxes was approximately 30.62% for the years ended March 31, 2019, and 30.86% for the years ended March 31, 2018 and 2017.
Details of deferred tax assets and liabilities at March 31, 2019 and 2018 are as follows:
Millions of yenThousands of U.S. dollars
2019 2018 2019
Deferred tax assets:
Loss on impairment of fixed assets ¥ 17,077 ¥ 17,146 $ 153,847Loss on devaluation of real estate for sale 14,415 10,885 129,865Depreciation and amortization of consolidated adjustment 7,258 7,977 65,387Loss on adjustment of profit and loss on transfer 4,254 — 38,324Allowance for doubtful accounts 3,439 3,521 30,982Accrued bonuses 1,875 1,739 16,892Accrued enterprise tax and business office tax 1,834 2,165 16,523Net defined benefit liability 1,759 1,873 15,847Net deferred losses on hedges 1,752 951 15,784Net operating loss carryforwards 1,593 1,939 14,351Loss on devaluation of investments in SPEs’ holding properties for sale 1,413 1,413 12,730Elimination of unrealized profit 926 943 8,342Loss on devaluation of investments in securities 797 844 7,180Other 13,113 12,851 118,135Subtotal of deferred tax assets 71,505 64,247 644,189Valuation allowance (9,247) (6,824) (83,306)Total deferred tax assets ¥ 62,258 ¥ 57,423 $ 560,883
Deferred tax liabilities:
Net unrealized holding gains on securities ¥(48,241) ¥(57,916) $(434,604)Retained earnings appropriated for tax allowable reserves (3,731) (3,731) (33,613)Other (637) (738) (5,738)Total deferred tax liabilities ¥(52,609) ¥(62,385) $(473,955)
Net deferred tax assets ¥ 9,649 ¥ (4,962) $ 86,928(Note) Valuation allowance increased by ¥2,423 million ($21,829 thousand) as a result of mainly the recognition of loss on adjustment of profit and loss on transfer.
66 67Sumitomo Realty & Development Co., Ltd.Integrated Report 2019

Financial Section
The difference between the statutory tax rate and the effective tax rate for the years ended March 31, 2019 and 2018 was insignificant and not presented.
The difference between the statutory tax rate and the effective tax rate for the year ended March 31, 2017 is as follows:2017
Statutory tax rate 30.86%
Adjustment:
Tax credit (1.89)
Dividends and other income not taxable permanently (0.70)
Elimination of dividend income 0.41
Inhabitant tax on per capita basis 0.21
Other 0.07
Effective tax rate 28.96%
13 Deposits received and accounts payable with interest rateGuarantee and deposits received at March 31, 2019 and 2018 are as follows:
Millions of yenThousands of U.S. dollars
2019Average interest
rate (%) 2018Average interest
rate (%) 2019
Short-term deposits and long-term deposits due within one year:
Non-interest-bearing ¥ 61,582 ¥ 60,382 $ 554,793Interest-bearing — — — — —
61,582 60,382 554,793Guarantee and lease deposits from tenants:
Non-interest-bearing 228,959 207,824 2,062,693Interest-bearing — — — — —
Long-term deposits:
Non-interest-bearing 49,807 59,391 448,712Interest-bearing — — — — —
278,766 267,215 2,511,405Total ¥340,348 ¥327,597 $3,066,198
Accounts payable with interest rate at March 31, 2019 and 2018 are as follows:
Millions of yenThousands of U.S. dollars
2019Average interest
rate (%) 2018Average interest
rate (%) 2019
Due within one year ¥— — ¥1,543 0.98 $—Due after one year — — — — —Total ¥— ¥1,543 $—
(Note) Accounts payable due within one year are included in “Other current liabilities” and accounts payable due after one year are included in “Other long-term liabilities” on the consolidated balance sheets.
14 Net assetsUnder the Japanese Corporate Law (“the Law”) and its regulations, the entire amount paid for new shares is required to be designated as common stock. However, a company may, by a resolution of the Board of Directors, designate an amount not exceeding one-half of the price of the new shares as additional paid-in capital, which is included in capital surplus.
Under the Law, in cases where a dividend distribution of surplus is made, the smaller of an amount equal to 10% of the dividend or the excess, if any, of 25% of common stock over the total of additional paid-in capital and legal earnings reserve must be set aside as additional paid-in capital or legal earnings reserve. Legal earnings reserve is included in retained earnings on the accompanying consolidated balance sheets.
Under the Law, legal earnings reserve and additional paid-in capital could be used to eliminate or reduce a deficit and capitalized by a resolu-tion of the shareholders’ meeting.
Additional paid-in capital and legal earnings reserve may not be distributed as dividends. Under the Law, all additional paid-in capital and all legal earnings reserve may be transferred to other capital sur-plus and retained earnings, respectively, which are potentially available for dividends.
The maximum amount that the Company can distribute as dividends is calculated based on the non-consolidated financial statements of the Company in accordance with the Law and its regulations.
15 Information for certain lease transactionsFuture lease payments and receipts under such non-cancelable operating leases at March 31, 2019, 2018 and 2017 are as follows:
Millions of yenThousands of U.S. dollars
2019 2018 2017 2019
Operating leases:
Future lease payments:
Due within one year ¥ 1,526 ¥ 1,401 ¥ 1,387 $ 13,748 Due after one year 42,211 38,241 39,053 380,279
Total ¥ 43,737 ¥ 39,642 ¥ 40,440 $ 394,027
Future lease receipts:
Due within one year ¥ 95,607 ¥ 83,254 ¥ 86,294 $ 861,324 Due after one year 142,321 153,777 138,086 1,282,171
Total ¥237,928 ¥237,031 ¥224,380 $2,143,495
16 Derivative transactionsHedge accounting was applied to all derivative transactions for the years ended March 31, 2019 and 2018.
The summary of these transactions is as follows:
(1) Foreign currency-related derivativesFor 2018
Millions of yen
Hedging accounting Types of derivative transactions Hedged items Contract amountsContract amounts due after one year Fair value
Deferred hedge accounting
Foreign exchange forward contracts Receipts in U.S. dollars / Payments in yen Foreign currency-denominated transactions ¥15,105 ¥— ¥133
(Note) Fair value is determined based on the quoted price obtained from relevant financial institutions.
(2) Interest-related derivativesFor 2019
Millions of yen
Hedging accounting Types of derivative transactions Hedged items Contract amountsContract amounts due after one year Fair value
Deferred hedge accounting
Interest rate swap contracts Fixed rate payments / Floating rate receipts Bank loans ¥ 248,600 ¥ 208,600 ¥(5,733)
Exceptional accounting for interest rate swaps
Interest rate swap contracts Fixed rate payments / Floating rate receipts Bank loans and bonds 1,507,198 1,415,693 — (*)
Thousands of U.S. dollars
Hedging accounting Types of derivative transactions Hedged items Contract amountsContract amounts due after one year Fair value
Deferred hedge accounting
Interest rate swap contracts Fixed rate payments / Floating rate receipts Bank loans $ 2,239,640 $ 1,879,279 $(51,649)
Exceptional accounting for interest rate swaps
Interest rate swap contracts Fixed rate payments / Floating rate receipts Bank loans and bonds 13,578,360 12,753,991 — (*)
For 2018Millions of yen
Hedging accounting Types of derivative transactions Hedged items Contract amountsContract amounts due after one year Fair value
Deferred hedge accounting
Interest rate swap contracts Fixed rate payments / Floating rate receipts Bank loans ¥ 243,800 ¥ 233,800 ¥(3,116)
Exceptional accounting for interest rate swaps
Interest rate swap contracts Fixed rate payments / Floating rate receipts Bank loans and bonds 1,577,137 1,454,966 — (*)
Exceptional accounting for interest rate and currency swaps
Interest rate swap contracts Fixed rate payments / Floating rate receipts Receipts in U.S. dollars / Payments in yen
Foreign currency-denominated loans3,000 — — (*)
(Note) Fair value is determined based on the quoted price obtained from relevant financial institutions.(*) Interest rate swap contracts and cross currency interest rate swap contracts which qualify for hedge accounting and meet specific matching criteria are not remeasured at market value, but the
differential paid or received under the swap agreements is recognized and included in interest expenses or income of the long-term debt or the long-term non-recourse debt as hedged items. Thus, the fair value of such interest rate swap contracts is included in the fair value of the long-term debt.
68 69Sumitomo Realty & Development Co., Ltd.Integrated Report 2019

Financial Section
17 Segment informationThe Company and its consolidated subsidiaries mainly operate their business in five segments: (1) Leasing business consists of leasing of office buildings, residences and other properties, and management of these properties; (2) Sales business consists of sale of condominiums,
detached houses and land lots; (3) Construction business consists of construction of housing, condominiums and buildings; (4) Brokerage business; and (5) Other businesses including fitness business and restau-rant business.
Information by business segment for the years ended March 31, 2019, 2018 and 2017 is summarized as follows:
Millions of yen
For 2019 Reportable segments
Leasing business
Sales business
Construction business
Brokerage business Other businesses Total Adjustments
Consolidated financial statements amounts
Revenue from operations:Customers ¥ 378,091 ¥331,516 ¥219,776 ¥72,522 ¥11,325 ¥1,013,230 ¥ — ¥1,013,230Intersegment 3,673 236 1,917 377 1,419 7,622 (7,622) —Total 381,764 331,752 221,693 72,899 12,744 1,020,852 (7,622) 1,013,230
Segment profit ¥ 149,933 ¥ 47,115 ¥ 20,407 ¥22,008 ¥ 1,528 ¥ 240,991 ¥ (20,572) ¥ 220,419Segment assets ¥3,737,136 ¥713,300 ¥ 30,057 ¥14,074 ¥32,545 ¥4,527,112 ¥600,353 ¥5,127,465Other:
Depreciation and amortization ¥ 43,201 ¥ 145 ¥ 1,182 ¥ 458 ¥ 227 ¥ 45,213 ¥ 1,100 ¥ 46,313Loss on impairment of fixed assets 8,576 — — — — 8,576 — 8,576Increase in property and equipment,
and intangible assets 179,872 590 2,015 920 1,001 184,398 397 184,795
Millions of yen
For 2018 Reportable segments
Leasing business
Sales business
Construction business
Brokerage business Other businesses Total Adjustments
Consolidated financial statements amounts
Revenue from operations:Customers ¥ 350,211 ¥310,914 ¥206,839 ¥68,858 ¥11,580 ¥ 948,402 ¥ — ¥ 948,402Intersegment 3,670 279 2,517 311 1,297 8,074 (8,074) —Total 353,881 311,193 209,356 69,169 12,877 956,476 (8,074) 948,402
Segment profit ¥ 139,368 ¥ 46,839 ¥ 16,109 ¥21,457 ¥ 1,628 ¥ 225,401 ¥ (19,764) ¥ 205,637Segment assets ¥3,565,088 ¥826,574 ¥ 27,946 ¥12,200 ¥25,203 ¥4,457,011 ¥710,187 ¥5,167,199Other:
Depreciation and amortization ¥ 38,981 ¥ 174 ¥ 1,022 ¥ 471 ¥ 217 ¥ 40,865 ¥ 763 ¥ 41,628Loss on impairment of fixed assets 10,635 — — — — 10,635 — 10,635Increase in property and equipment,
and intangible assets 220,785 672 1,027 859 428 223,771 4,523 228,294
Millions of yen
For 2017 Reportable segments
Leasing business
Sales business
Construction business
Brokerage business Other businesses Total Adjustments
Consolidated financial statements amounts
Revenue from operations:Customers ¥ 333,605 ¥313,992 ¥200,565 ¥65,616 ¥11,373 ¥ 925,151 ¥ — ¥ 925,151Intersegment 3,861 307 3,058 1,098 843 9,167 (9,167) —Total 337,466 314,299 203,623 66,714 12,216 934,318 (9,167) 925,151
Segment profit ¥ 126,214 ¥ 46,190 ¥ 13,933 ¥19,148 ¥ 1,491 ¥ 206,976 ¥ (18,805) ¥ 188,171Segment assets ¥3,359,262 ¥890,869 ¥ 27,424 ¥18,506 ¥17,271 ¥4,313,332 ¥666,708 ¥4,980,040Other:
Depreciation and amortization ¥ 36,949 ¥ 207 ¥ 970 ¥ 516 ¥ 177 ¥ 38,819 ¥ 627 ¥ 39,446Loss on impairment of fixed assets 14,035 1,502 — — — 15,537 1 15,538Increase in property and equipment,
and intangible assets 219,606 3,244 1,765 1,096 294 226,005 811 226,816
Thousands of U.S. dollars
For 2019 Reportable segments
Leasing business
Sales business
Construction business
Brokerage business Other businesses Total Adjustments
Consolidated financial statements amounts
Revenue from operations:Customers $ 3,406,225 $2,986,631 $1,979,964 $653,351 $102,027 $ 9,128,198 $ — $ 9,128,198Intersegment 33,090 2,126 17,270 3,397 12,784 68,667 (68,667) —Total 3,439,315 2,988,757 1,997,234 656,748 114,811 9,196,865 (68,667) 9,128,198
Segment profit $ 1,350,748 $ 424,459 $ 183,847 $198,270 $ 13,766 $ 2,171,090 $ (185,333) $ 1,985,757Segment assets $33,667,892 $6,426,126 $ 270,784 $126,793 $293,198 $40,784,793 $5,408,585 $46,193,378Other:
Depreciation and amortization $ 389,198 $ 1,306 $ 10,649 $ 4,126 $ 2,045 $ 407,324 $ 9,910 $ 417,234Loss on impairment of fixed assets 77,261 — — — — 77,261 — 77,261Increase in property and equipment,
and intangible assets 1,620,468 5,315 18,153 8,288 9,019 1,661,243 3,577 1,664,820
(Note) Information for the year ended March 31, 2018 has been adjusted retroactively reflecting the adoption of “Partial Amendments to Accounting Standard for Tax Effect Accounting” (ASBJ Statement No. 28, February 16, 2018) effective from the beginning of the year ended March 31, 2019.
Intercompany eliminations between the Company and its consolidated subsidiaries and undistributed corporate expenses to each segment are included in adjustments of segment profit, and the Company classified expenses of the general administrative division in the Company and its certain consolidated subsidiaries to corporate expenses for the years ended March 31, 2019, 2018 and 2017.
Intercompany eliminations between the Company and its consolidated subsidiaries and undistributed corporate assets to each segment are included in adjustments of segment assets, and the Company classified cash, time and notice deposits, investments in securities and assets of the general administrative division in the Company and its certain consolidated subsidiar-ies to corporate assets for the years ended March 31, 2019, 2018 and 2017.
18 Comprehensive incomeAmounts reclassified to profit in the current period that were recognized in other comprehensive income in the current or previous periods and tax effects for each component of other comprehensive income (loss) for the years ended March 31, 2019, 2018 and 2017 are as follows:
Millions of yenThousands of U.S. dollars
2019 2018 2017 2019
Unrealized holding gains (losses) on securities:
Increase (Decrease) during the fiscal year ¥(32,668) ¥ 50,290 ¥ 36,067 $(294,306)Reclassification adjustments 1,088 (1,373) (128) 9,802 Amounts before tax effects (31,580) 48,917 35,939 (284,504) Tax effects 9,675 (14,982) (11,009) 87,162Total ¥(21,905) ¥ 33,935 ¥ 24,930 $(197,342)
Deferred gains (losses) on hedges:
Increase (Decrease) during the fiscal year ¥ (3,628) ¥ (453) ¥ 482 $ (32,685)Reclassification adjustments 876 1,208 1,978 7,892 Amounts before tax effects (2,752) 755 2,460 (24,793) Tax effects 829 (217) (755) 7,468Total ¥ (1,923) ¥ 538 ¥ 1,705 $ (17,325)
Foreign currency translation adjustments:
Increase (Decrease) during the fiscal year ¥ (259) ¥ (1,098) ¥ (927) $ (2,333)Remeasurements of defined benefit plans:
Increase (Decrease) during the fiscal year ¥ (66) ¥ 229 ¥ (41) $ (595)Reclassification adjustments (229) 41 681 (2,063) Amounts before tax effects (295) 270 640 (2,658) Tax effects 61 (82) (198) 550Total ¥ (234) ¥ 188 ¥ 442 $ (2,108)
Total other comprehensive income (loss) ¥(24,321) ¥ 33,563 ¥ 26,150 $(219,108)
70 71Sumitomo Realty & Development Co., Ltd.Integrated Report 2019

Financial Section
To the Board of Directors of Sumitomo Realty & Development Co., Ltd.:
We have audited the accompanying consolidated financial statements of Sumitomo Realty & Development Co., Ltd. and its consolidated subsidiaries, which comprise the consolidated balance sheets as at March 31, 2019 and 2018, and the consolidated statements of income, statements of comprehensive income, statements of changes in net assets and statements of cash flows for each of the years in the three-year period ended March 31, 2019, and a summary of significant accounting policies and other explanatory information.
Management’s Responsibility for the Consolidated Financial StatementsManagement is responsible for the preparation and fair presentation of these consolidated financial statements in accordance with accounting principles generally accepted in Japan, and for such internal control as management determines is necessary to enable the preparation of consolidated financial statements that are free from material misstatement, whether due to fraud or error.
Auditor’s ResponsibilityOur responsibility is to express an opinion on these consolidated financial statements based on our audits. We conducted our audits in accordance with auditing standards generally accepted in Japan. Those standards require that we comply with ethical requirements and plan and perform the audit to obtain reasonable assurance about whether the consolidated financial statements are free from material misstatement.
An audit involves performing procedures to obtain audit evidence about the amounts and disclosures in the consolidated financial statements. The procedures selected depend on our judgment, including the assessment of the risks of material misstatement of the consolidated financial statements, whether due to fraud or error. In making those risk assessments, we consider internal control relevant to the entity’s preparation and fair presentation of the consolidated financial statements in order to design audit procedures that are appropriate in the circumstances, while the objective of the financial statement audit is not for the purpose of expressing an opinion on the effectiveness of the entity’s internal control. An audit also includes evaluating the appropriateness of accounting policies used and the reasonableness of accounting estimates made by management, as well as evaluating the overall presentation of the consolidated financial statements.
We believe that the audit evidence we have obtained is sufficient and appropriate to provide a basis for our audit opinion.
OpinionIn our opinion, the consolidated financial statements present fairly, in all material respects, the financial position of Sumitomo Realty & Development Co., Ltd. and its consolidated subsidiaries as at March 31, 2019 and 2018, and their financial performance and cash flows for each of the years in the three-year period ended March 31, 2019, in accordance with accounting principles generally accepted in Japan.
Convenience TranslationThe U.S. dollar amounts in the accompanying consolidated financial statements with respect to the year ended March 31, 2019 are presented solely for convenience. Our audit also included the translation of yen amounts into U.S. dollar amounts and, in our opinion, such translation has been made on the basis described in Note 1 to the consolidated financial statements.
July 31, 2019Tokyo, Japan
Independent Auditor’s Report
19 Investment and rental propertiesThe Company and its certain consolidated subsidiaries own some rental properties such as office buildings and residences in Tokyo and other areas. Certain domestic office buildings are not recognized as rental properties but as a portion used as investment and rental properties since the Company or its certain consolidated subsidiaries use some of the floor space of these properties.
The carrying amounts of these properties on the consolidated balance sheets, their changes during the fiscal year and their fair values at March 31, 2019 and 2018 are as follows:
Millions of yenThousands of U.S. dollars
2019 2018 2019
Balance at beginning of fiscal year ¥3,208,325 ¥3,001,274 $28,903,829
Investment and rental propertiesChanges during the fiscal year 165,124 207,051 1,487,603Balance at end of fiscal year 3,373,449 3,208,325 30,391,432
Fair value at end of fiscal year 5,838,717 5,316,335 52,601,054Balance at beginning of fiscal year ¥ 141,950 ¥ 143,906 $ 1,278,829
A portion used as investment and rental propertiesChanges during the fiscal year (61) (1,956) (550)Balance at end of fiscal year 141,889 141,950 1,278,279
Fair value at end of fiscal year 379,883 362,081 3,422,369(Notes)* Carrying amounts on the consolidated balance sheets are the amounts determined by deducting accumulated depreciation and accumulated impairment losses from the acquisition costs.* Fair values as of March 31, 2019 and 2018 are calculated by the Company primarily based on their fair values according to Real Estate Appraisal Standards.
Significant changes during the years ended March 31, 2019 and 2018 are as follows:
Millions of yenThousands of U.S. dollars
2019 2018 2019
Increase:Acquired real estate ¥173,144 ¥214,777 $1,559,856Transferred from real estate for sale in process, etc. 23,162 38,047 208,666
Decrease:Depreciation and amortization ¥ (42,374) ¥ (37,177) $ (381,748)Transferred to real estate for sale (4,822) — (43,441)Transferred to real estate for sale in process — (2,490) —Loss on impairment of fixed assets (8,576) (10,635) (77,261)
Income and expenses for investment and rental properties for the years ended March 31, 2019 and 2018 are as follows:
Millions of yenThousands of U.S. dollars
2019 2018 2019
Income ¥269,493 ¥236,446 $2,427,865
Investment and rental propertiesExpenses 137,784 121,736 1,241,297Balance 131,709 114,710 1,186,568Other income (expenses) (9,193) (10,938) (82,820)Income ¥ 18,413 ¥ 21,475 $ 165,883
A portion used as investment and rental propertiesExpenses 9,176 11,926 82,667Balance 9,237 9,549 83,216Other income (expenses) (4) (3) (36)
(Notes)* As a portion used as investment and rental properties includes a portion used by the Company or its certain consolidated subsidiaries for providing services as well as management and administration,
income for these are not recorded above. The expenses primarily consist of rent, depreciation, taxes and dues, and others.* Other income (expenses) for investment and rental properties is mostly the loss on impairment of fixed assets, and Other income (expenses) for a portion used as investment and rental properties is mostly
the loss from prior period adjustment.
20 Contingent liabilitiesThe Company and its consolidated subsidiaries were contingently liable as guarantors of borrowings by customers and others in an amount aggregating to ¥7,316 million ($65,910 thousand) and ¥6,298 million at March 31, 2019 and 2018, respectively.
21 Subsequent eventsOn June 28, 2019, the shareholders of the Company approved payments of a year-end cash dividend of ¥16 ($0.14) per share or a total of ¥7,583 million ($68,315 thousand) to shareholders of record at March 31, 2019. Such appropriations are recognized in the period in which they are approved by the shareholders.
72 73Sumitomo Realty & Development Co., Ltd.Integrated Report 2019

Head OfficeShinjuku NS Building4-1, Nishi-Shinjuku 2-chome,Shinjuku-ku, Tokyo 163-0820, Japan
Corporate Websitehttp://www.sumitomo-rd.co.jp/english/
Date of EstablishmentDecember 1, 1949
Number of Employees13,238 (Consolidated)
Major Consolidated SubsidiariesSumitomo Real Estate Sales Co., Ltd.Sumitomo Fudosan Tatemono Service Co., Ltd.Sumitomo Fudosan Syscon Co., Ltd.Sumitomo Fudosan Villa Fontaine Co., Ltd.Sumitomo Fudosan Bellesalle Co., Ltd.Sumitomo Fudosan Esforta Co., Ltd.Sumitomo Fudosan Finance Co., Ltd.
Stock Price and Trading Volume on Tokyo Stock Exchange
Paid-in Capital¥122,805 million
Number of Common StockAuthorized: 1,900,000,000 sharesIssued: 476,085,978 shares
Number of Shareholders10,365
Stock Exchange ListingTokyo Stock Exchange
Major Shareholders
NameNumber of shares held
(Thousands)Percentage of shares held
The Master Trust Bank of Japan, Ltd. (Trust account) 40,414 8.53%Japan Trustee Services Bank, Ltd. (Trust account) 25,715 5.43%Sumitomo Mitsui Banking Corporation 11,990 2,53%Japan Trustee Services Bank, Ltd. (Trust account 4) 10,561 2.23%Japan Trustee Services Bank, Ltd. (Trust account 5) 8,710 1.84%Daikin Industries, Ltd. 8,367 1.77%Taisei Corporation 7,550 1.59%JP MORGAN CHASE BANK 385151 7,537 1.59%Shimizu Corporation 7,500 1.58%SSBTC CLIENT OMNIBUS ACCOUNT 7,429 1.57%
Company Information (As of March 31, 2019)
Corporate Data Investor Information
Breakdown ofShareholders
Trust Accounts 27.91%Financial Institutions 9.45%Other Companies 34.81%Foreign Companies 24.73%Individuals and Others 3.10%
2014 2015 2016 2017 2018 20197 8 9 10 11 12 8 9 10 11 121 2 3 4 5 6 7 8 9 10 11 121 2 3 4 5 6 7 8 9 10 11 121 2 3 4 5 6 1 2 3 4 5 67 8 9 10 11 121 2 3 4 5 6 7 0
2,000
1,000
3,000
4,000
5,000
6,000YenYen
Stock Price (right)TOPIX (left)
0
400
800
1,200
1,600
2,000
2,400
0
100
75
50
25
Millions of sharesTrading Volume
2014 2015 2016 2017 2018 20197 8 9 10 11 12 8 9 10 11 121 2 3 4 5 6 7 8 9 10 11 121 2 3 4 5 6 7 8 9 10 11 121 2 3 4 5 6 1 2 3 4 5 67 8 9 10 11 121 2 3 4 5 6 7
74 Integrated Report 2019
History
Global Events
1949 • Izumi Real Estate Co., Ltd. established as the successor to the holding company of the Sumitomo zaibatsu following the breakup of the conglomerate.
1964• Tokyo Olympic Games
1973• First oil crisis
1978• Second oil crisis
1957 • Izumi Real Estate Co., Ltd. changed its name to Sumitomo Realty & Development Co., Ltd.
1963 • Merged with the holding company of the former Sumitomo zaibatsu during its liquidation.
1964 • Entered condominium sales business with Hama-Ashiya Mansion in Kobe, Hyogo Prefecture.
1970 • Listed on the Tokyo Stock Exchange and Osaka Securities Exchange.
1972 • Established Sumitomo Realty & Development CA., Inc., a consolidated subsidiary.
1973 • Established Sumitomo Fudosan Tatemono Service Co., Ltd., a consolidated subsidiary.
1974 • Completed construction of 52-story Shinjuku Sumitomo Building in Shinjuku, Tokyo; moved Company head office there from Tokyo Sumitomo Building in Marunouchi, Tokyo.
1975 • Established Sumitomo Real Estate Sales Co., Ltd., a consolidated subsidiary.
1980 • Established Sumitomo Fudosan Syscon Co., Ltd., a consolidated subsidiary.
1982 • Completed construction of 30-story Shinjuku NS Building in Shinjuku, Tokyo; moved Company head office there from Shinjuku Sumitomo Building.
1985• The Plaza Accord
1987• Black Monday
1989• Collapse of Berlin Wall• Nikkei Stock Average
all-time high
1999• Introduction of euro
1984 • Established Sumitomo Fudosan Finance Co., Ltd., a consolidated subsidiary.
1986 • Established Sumitomo Fudosan Fitness Co., Ltd. (currently Sumitomo Fudosan Esforta Co., Ltd.), a consolidated subsidiary.
1995 • Commenced American Comfort custom home construction business.
1996 • Commenced Shinchiku Sokkurisan remodeling business.
1997 • Entered high-quality business hotel market. Opened Villa Fontaine Nihombashi and hotels at two other locations.
1998 • Sumitomo Real Estate Sales Co., Ltd., a consolidated subsidiary, listed on the Tokyo Stock Exchange.
1999• Commenced real estate joint investment trust fund. Launched sales of Sumitomo Realty & Development Fund (SURF) series.
• Implemented the Sumquest bond issue, which was the first public issue of real estate securities in Japan.
2000 • Commenced luxury condominium leasing business. Completed construction of La Tour Shibakoen.2001 • The number of managed STEP brokerage offices exceeded 200. 2001
• September 11 terrorist attacks
2008• Lehman crisis
2011• The Great East Japan
Earthquake• European sovereign
debt crisis• Record-high yen
against the U.S. dollar
2015• China stock market
crash
2016• Brexit referendum
2002 • Completed construction of Izumi Garden Tower (Minato Ward, Tokyo).2003 • Commenced sales of J∙URBAN fixed-price urban-style housing series.2004 • Commenced sales of World City Towers (Minato Ward, Tokyo).
2008• Established Sumitomo Fudosan Bellesalle Co., Ltd., a consolidated subsidiary.
• Commenced sales of City Towers Toyosu (Koto Ward, Tokyo).
2010 • Completed construction of Shinjuku Central Park City (Shinjuku Ward, Tokyo).
2011• Opened Grand Mansion Gallery.
• Completed construction of Sumitomo Fudosan Shinjuku Grand Tower (Shinjuku Ward, Tokyo).
2012• Launched a Custom-order Condominium service.
• Commenced sales of J∙RESIDENCE.
2014 • Number of condominium units brought to market over the full year was the highest in Japan for the first time.
2015• Completed construction of Tokyo Nihombashi Tower (Chuo Ward, Tokyo).
• Cumulative units contracted topped 100,000 in Shinchiku Sokkurisan remodeling operations.
2016• Completed construction of Shinjuku Garden (Shinjuku Ward, Tokyo).
• Completed construction of Sumitomo Fudosan Roppongi Grand Tower (Minato Ward, Tokyo).
2017• Commenced sales of City Towers Tokyo Bay (Koto Ward, Tokyo).
• Sumitomo Real Estate Sales Co., Ltd. delisted as it became a wholly owned subsidiary.
2018• Completed construction of Sumitomo Fudosan Osaki Garden Tower (Shinagawa Ward, Tokyo).
• Number of condominium units brought to market over the full year was the highest in Japan for the fifth consecutive year.
75Sumitomo Realty & Development Co., Ltd.
Shinjuku NS Building, 4-1, Nishi-Shinjuku 2-chome,Shinjuku-ku, Tokyo 163-0820, Japanhttp://www.sumitomo-rd.co.jp/english/
Printed in Japan