integrated math iii instructional focus documents - tn.gov · integrated math ii and integrated...
TRANSCRIPT

Integrated Math III Instructional Focus Documents
Introduction: The purpose of this document is to provide teachers a resource which contains:
• The Tennessee grade level mathematics standards • Evidence of Learning Statements for each standard • Instructional Focus Statements for each standard
Evidence of Learning Statements: The evidence of learning statements are guidance to help teachers connect the Tennessee Mathematics Standards with evidence of learning that can be collected through classroom assessments to provide an indication of how students are tracking towards grade-level conceptual understanding of the Tennessee Mathematics Standards. These statements are divided into four levels. These four levels are designed to help connect classroom assessments with the performance levels of our state assessment. The four levels of the state assessment are as follows:
• Level 1: Performance at this level demonstrates that the student has a minimal understanding and has a nominal ability to apply the grade-/course-level knowledge and skills defined by the Tennessee academic standards.
• Level 2: Performance at this level demonstrates that the student is approaching understanding and has a partial ability to apply the grade-/course-level knowledge and skills defined by the Tennessee academic standards.
• Level 3: Performance at this level demonstrates that the student has a comprehensive understanding and thorough ability to apply the grade-/course-level knowledge and skills defined by the Tennessee academic standards.
• Level 4: Performance at this level demonstrates that the student has an extensive understanding and expert ability to apply the grade-/course-level knowledge and skills defined by the Tennessee academic standards.
The evidence of learning statements are categorized in this same way to provide examples of what a student who has a particular level of conceptual understanding of the Tennessee Mathematics Standards will most likely be able to do in a classroom setting.
Instructional Focus Statements: Instructional focus statements provide guidance to clarify the types of instruction that will help a student progress along a continuum of learning. These statements are written to provide strong guidance around Tier I, on-grade level instruction. Thus, the instructional focus statements are written for level 3 and 4.
Revised July 31, 2019 1

Quantities (N.Q) Standard M3.N.Q.A.1 (Supporting Content) Identify, interpret, and justify appropriate quantities for the purpose of descriptive modeling. Scope and Clarifications: (Modeling Standard) Descriptive modeling refers to understanding and interpreting graphs; identifying extraneous information; choosing appropriate units; etc. There are no assessment limits for this standard. The entire standard is assessed in this course.
Evidence of Learning Statements
Students with a level 1 understanding of this standard will most likely be able to:
Students with a level 2 understanding of this standard will most likely be able to:
Students with a level 3 understanding of this standard will most likely be able to:
Students with a level 4 understanding of this standard will most likely be able to:
Identify the units in a problem. Connect the units to the values in a real-world problem.
Identify individual quantities in context of the real-world problem and label them with appropriate units. Recognize irrelevant or extraneous information in a real-world problem.
Identify and interpret information to select or create a quantity to model a real-world problem. Describe individual quantities in context of the real-world problem. Attend to precision when defining quantities and their units in context. Explain and justify the relationship between a solution to a contextual problem and the values used to compute the solution. Appropriately interpret, explain the meaning of, and draw conclusions about the quantities in a real-world problems.
Identify, interpret, and justify complex information with a variety of descriptors or units to solve contextual problems for the purpose of descriptive modeling. Represent quantities in descriptive modeling situations and explain their relationship using multiple formats such as numeric, algebraic, and graphic representations.
Revised July 31, 2019 2
Students with a level 1 understanding of this standard will most likely be able to:
Students with a level 2 understanding of this standard will most likely be able to:
Students with a level 3 understanding of this standard will most likely be able to:
Students with a level 4 understanding of this standard will most likely be able to:
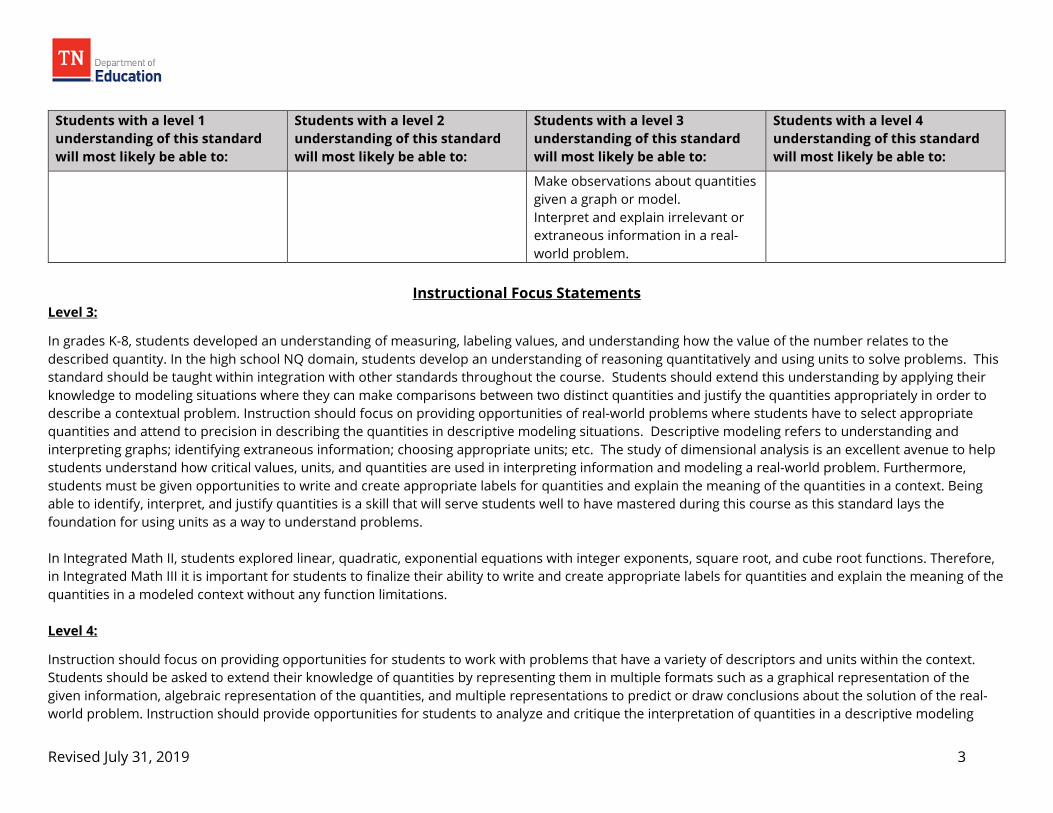
Make observations about quantities given a graph or model. Interpret and explain irrelevant or extraneous information in a real-world problem.
Instructional Focus Statements
Level 3:
In grades K-8, students developed an understanding of measuring, labeling values, and understanding how the value of the number relates to the described quantity. In the high school NQ domain, students develop an understanding of reasoning quantitatively and using units to solve problems. This standard should be taught within integration with other standards throughout the course. Students should extend this understanding by applying their knowledge to modeling situations where they can make comparisons between two distinct quantities and justify the quantities appropriately in order to describe a contextual problem. Instruction should focus on providing opportunities of real-world problems where students have to select appropriate quantities and attend to precision in describing the quantities in descriptive modeling situations. Descriptive modeling refers to understanding and interpreting graphs; identifying extraneous information; choosing appropriate units; etc. The study of dimensional analysis is an excellent avenue to help students understand how critical values, units, and quantities are used in interpreting information and modeling a real-world problem. Furthermore, students must be given opportunities to write and create appropriate labels for quantities and explain the meaning of the quantities in a context. Being able to identify, interpret, and justify quantities is a skill that will serve students well to have mastered during this course as this standard lays the foundation for using units as a way to understand problems. In Integrated Math II, students explored linear, quadratic, exponential equations with integer exponents, square root, and cube root functions. Therefore, in Integrated Math III it is important for students to finalize their ability to write and create appropriate labels for quantities and explain the meaning of the quantities in a modeled context without any function limitations. Level 4:
Instruction should focus on providing opportunities for students to work with problems that have a variety of descriptors and units within the context. Students should be asked to extend their knowledge of quantities by representing them in multiple formats such as a graphical representation of the given information, algebraic representation of the quantities, and multiple representations to predict or draw conclusions about the solution of the real-world problem. Instruction should provide opportunities for students to analyze and critique the interpretation of quantities in a descriptive modeling
Revised July 31, 2019 3

problem. Additionally, students should be given ample opportunities that promote inquiry to design their own contextual problem in which they would have to use quantities appropriately in order to describe the modeled contextual situation. Now that students have more exposure to multiple function types they should be given the opportunity to interpret and distinguish the difference in the quantities produced by different functions, such as square units or cubic units. Instruction should require students to explain why the units of a quantity change depending on the function by which it is represented.
Revised July 31, 2019 4

SEEING STRUCTURE in EXPRESSIONS (A.SSE)
Standard M3.A.SSE.A.1 (Major Work of the Grade) Use the structure of an expression to identify ways to rewrite it. Scope and Clarifications: For example, see 2x4 + 3x2– 5 as its factors (x2– 1) and (2x2+ 5); see x4 – y4 as (x2)2 – (y2)2, thus recognizing it as a difference of squares that can be factored as (x2 – y2) (x2 + y2); see (x2 + 4)/(x2 + 3) as ((x2 + 3) + 1 )/(x2 + 3), thus recognizing an opportunity to write it as 1 + 1/(x2 + 3). Tasks are limited to polynomial, rational, or exponential expressions.
Evidence of Learning Statements Students with a level 1 understanding of this standard will most likely be able to:
Students with a level 2 understanding of this standard will most likely be able to:
Students with a level 3 understanding of this standard will most likely be able to:
Students with a level 4 understanding of this standard will most likely be able to:
Choose a polynomial, rational, or exponential expression that is equivalent to a given expression.
Rewrite polynomial, rational, and exponential expressions into a given form.
Rewrite polynomial, rational, and exponential expressions into a different form and explain why rewriting the expression in that form is beneficial.
Generate multiple forms of a single polynomial, rational, or exponential expression and explain in both verbal and written form the mathematics that was employed to transform the expression. Additionally, explain which form is most useful and provide mathematical justification.
Instructional Focus Statements
Level 3:
Seeing structure in expressions involves critically examining an algebraic expression in which potential rearrangements and manipulations are present. An important skill for college readiness is the ability to try possible manipulations mentally without having to carry them out, and to see which ones might be fruitful and which might not.
Revised July 31, 2019 5

Students should be able to provide a mathematical justification for when different forms of expressions are more beneficial. As polynomials overlap Integrated Math II and Integrated Math III, the focus for integrated III needs to be placed on non-quadratic polynomials. Much of the ability to see and use structure in transforming expressions comes from learning to fluently recognize certain fundamental algebraic situations. Level 4:
Students need to be challenged to write polynomial, rational, and exponential expressions in multiple forms where the initial expressions increase in difficulty over time. The hallmark of this standard is students being able to communicate the importance and benefit gained from writing expressions in various forms. Students should be able to express what the individual terms within the expression mean and how they relate to terms in the other various representations of the same expression.
Revised July 31, 2019 6

Standard M3.A.SSE.B.2 (Major Work of the Grade) Choose and produce an equivalent form of an expression to reveal and explain properties of the quantity represented by the expression. M3.A.SSE.B.2a Use the properties of exponents to rewrite exponential expressions. Scope and Clarifications: (Modeling Standard) For example, the expression 1.15t can be rewritten as ((1.15)1/12)12t ≈ 1.01212t to reveal that the approximate equivalent monthly interest rate is 1.2% if the annual rate is 15%.
i. Tasks have a real-world context. As described in the standard, there is an interplay between the mathematical structure of the expression and the structure of the situation such that choosing and producing an equivalent form of the expression reveals something about the situation.
ii. Tasks are limited to exponential expressions with rational or real exponents.
Evidence of Learning Statements Students with a level 1 understanding of this standard will most likely be able to:
Students with a level 2 understanding of this standard will most likely be able to:
Students with a level 3 understanding of this standard will most likely be able to:
Students with a level 4 understanding of this standard will most likely be able to:
Recognize an exponential expression. Recognize properties of exponents. Choose an equivalent form of an exponential expression without a context.
Choose an equivalent form of an exponential expression from a real-world context and choose the properties used to transform the expression.
Generate an equivalent form of an exponential expression from a real-world context and identify the properties of exponents used to generate the expression.
Generate equivalent forms of an exponential expression from a real-world context, justify each transformation with a property, and explain the benefits of the equivalent expression.
Instructional Focus Statements
Level 3:
The introduction of rational exponents and practice with the properties of exponents in high school further widens the field of operations students will be manipulating. In Integrated Math III focus should be placed on exponential expressions with rational or real exponents furthering the real word contexts that can be used as a backbone for this modeling standard. As this is a modeling standard, it is important to emphasize that the exponential expressions should be embedded in real-world situations. This provides a context for seeing structure in the expression and allows students to see when and why it is beneficial to view them in different forms.
Revised July 31, 2019 7
Additionally, it’s important to note that the focus is not on writing expressions in simplest form as there really is no simplest form. The form that expressions are written in should be driven by what is being done with the expression in the first place. Level 4:
Students should continue to demonstrate an understanding of seeing structure in expressions by not only being able to rewrite exponential expressions in various forms, but also in mathematically justifying the steps to reach the desired rewritten form and describing when and why the rewritten form would be beneficial. Students should encounter exponential expressions of increasing difficulty in increasingly more complex real-world situational problems.
Revised July 31, 2019 8
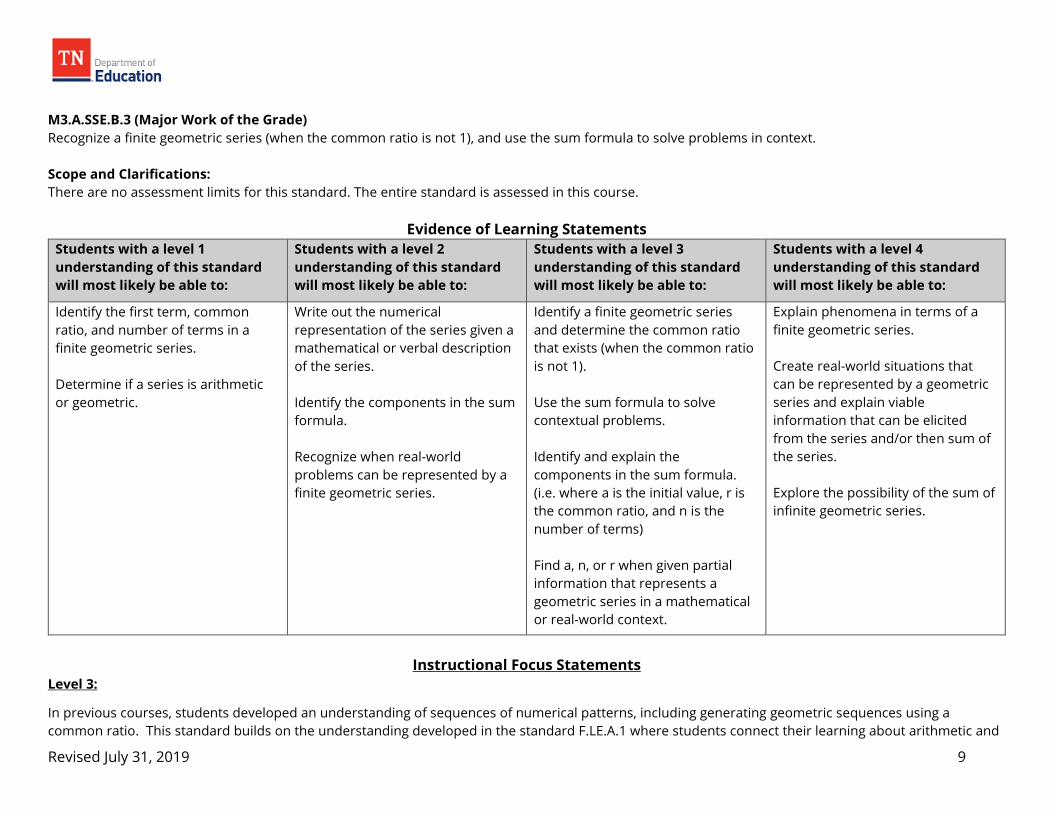
M3.A.SSE.B.3 (Major Work of the Grade) Recognize a finite geometric series (when the common ratio is not 1), and use the sum formula to solve problems in context. Scope and Clarifications: There are no assessment limits for this standard. The entire standard is assessed in this course.
Evidence of Learning Statements Students with a level 1 understanding of this standard will most likely be able to:
Students with a level 2 understanding of this standard will most likely be able to:
Students with a level 3 understanding of this standard will most likely be able to:
Students with a level 4 understanding of this standard will most likely be able to:
Identify the first term, common ratio, and number of terms in a finite geometric series. Determine if a series is arithmetic or geometric.
Write out the numerical representation of the series given a mathematical or verbal description of the series. Identify the components in the sum formula. Recognize when real-world problems can be represented by a finite geometric series.
Identify a finite geometric series and determine the common ratio that exists (when the common ratio is not 1). Use the sum formula to solve contextual problems. Identify and explain the components in the sum formula. (i.e. where a is the initial value, r is the common ratio, and n is the number of terms) Find a, n, or r when given partial information that represents a geometric series in a mathematical or real-world context.
Explain phenomena in terms of a finite geometric series. Create real-world situations that can be represented by a geometric series and explain viable information that can be elicited from the series and/or then sum of the series. Explore the possibility of the sum of infinite geometric series.
Instructional Focus Statements
Level 3:
In previous courses, students developed an understanding of sequences of numerical patterns, including generating geometric sequences using a common ratio. This standard builds on the understanding developed in the standard F.LE.A.1 where students connect their learning about arithmetic and
Revised July 31, 2019 9

geometric sequences verbally, graphically, numerically, and algebraically. Students see how a variety of real-world situations are represented by these sequences. With this foundational knowledge, instruction should focus on contextual problems and guide students to make connections between geometric sequences and series. Students should be given the opportunity to investigate the structure of a set of short geometric series allowing them to discover a, n, and r and their part in the finite geometric sum formula and draw conclusions about the effects of a, n, and r in longer geometric series. Furthermore, students should be able to generalize how to compute the sum of short geometric series and infer how to compute for longer geometric series. Instruction should provide an opportunity to explore attributes of a series with a negative r value and help students draw the conclusion that the signs of the series of numbers will alternate. It is important to note that having students memorize the formula for the sum of a finite geometric series will not help students develop the necessary conceptual understanding of the structure of the formula which is what ultimately allows them to be successful in solving contextual problems. Students must attend to precision and explain their answer in context. In Pre-Calculus, students will be asked to demonstrate an understanding of sequences by writing them recursively and explicitly. Students will also use sigma notation to represent a series and extend their knowledge of summation by identifying whether a series converges or diverges. Level 4:
Once students have a strong understanding of geometric series, they should be able to explain fluently the components of the sum formula, and use the sum formula to solve contextual problems, then they should be given the opportunity to explore these concepts with an infinite geometric series. At this level of understanding students should be able to explain the steps in the derivation of the sum formula, so instruction should give students the opportunity to consider and study the proof of the sum formula.
Revised July 31, 2019 10
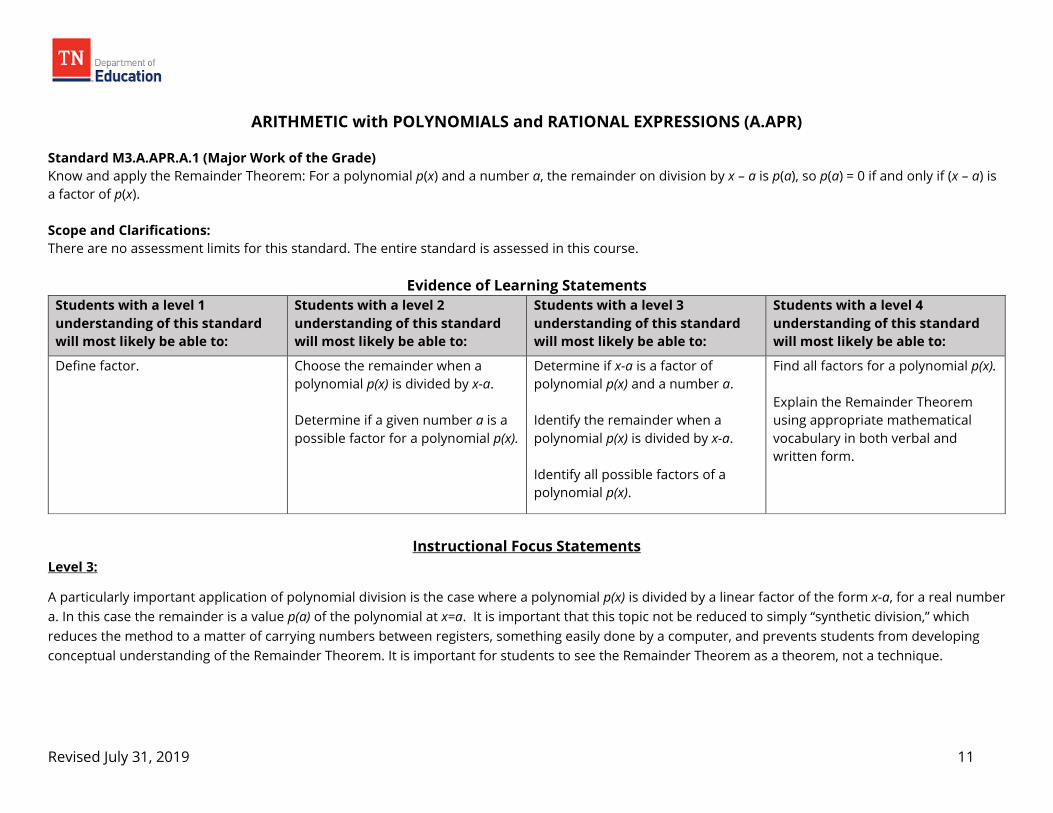
ARITHMETIC with POLYNOMIALS and RATIONAL EXPRESSIONS (A.APR)
Standard M3.A.APR.A.1 (Major Work of the Grade) Know and apply the Remainder Theorem: For a polynomial p(x) and a number a, the remainder on division by x – a is p(a), so p(a) = 0 if and only if (x – a) is a factor of p(x). Scope and Clarifications: There are no assessment limits for this standard. The entire standard is assessed in this course.
Evidence of Learning Statements Students with a level 1 understanding of this standard will most likely be able to:
Students with a level 2 understanding of this standard will most likely be able to:
Students with a level 3 understanding of this standard will most likely be able to:
Students with a level 4 understanding of this standard will most likely be able to:
Define factor. Choose the remainder when a polynomial p(x) is divided by x-a. Determine if a given number a is a possible factor for a polynomial p(x).
Determine if x-a is a factor of polynomial p(x) and a number a. Identify the remainder when a polynomial p(x) is divided by x-a. Identify all possible factors of a polynomial p(x).
Find all factors for a polynomial p(x). Explain the Remainder Theorem using appropriate mathematical vocabulary in both verbal and written form.
Instructional Focus Statements
Level 3:
A particularly important application of polynomial division is the case where a polynomial p(x) is divided by a linear factor of the form x-a, for a real number a. In this case the remainder is a value p(a) of the polynomial at x=a. It is important that this topic not be reduced to simply “synthetic division,” which reduces the method to a matter of carrying numbers between registers, something easily done by a computer, and prevents students from developing conceptual understanding of the Remainder Theorem. It is important for students to see the Remainder Theorem as a theorem, not a technique.
Revised July 31, 2019 11

Level 4:
Students with a deep conceptual understanding of the Remainder Theorem can explain the equivalence between linear factors and zeros. This is the basis of much work with polynomials in high school: the fact that p(a)=0 if and only if x-a is a factor of p(x). They can deduce that if x-a is a factor then p(a)=0. But the Remainder Theorem tells us that p(x)=(x-a) q(x) + p(a) for some polynomial q(x). In particular, if p(a)=0 then p(x)=(x-a) q(x), so x-a is a factor of p(x).
Revised July 31, 2019 12

Standard M3.A.APR.A.2 (Major Work of the Grade) Identify zeros of polynomials when suitable factorizations are available, and use the zeros to construct a rough graph of the function defined by the polynomial. Scope and Clarifications: Tasks include quadratic, cubic, and quartic polynomials and polynomials for which factors are not provided. For example, find the zeros of (x2 - 1)(x2 + 1).
Evidence of Learning Statements Students with a level 1 understanding of this standard will most likely be able to:
Students with a level 2 understanding of this standard will most likely be able to:
Students with a level 3 understanding of this standard will most likely be able to:
Students with a level 4 understanding of this standard will most likely be able to:
Factor a quadratic polynomial with a lead coefficient of 1. Choose the zeros for a given quadratic polynomial with a lead coefficient of 1. Choose a graph to represent a given quadratic polynomial in factored form.
Factor a quadratic polynomial with a lead coefficient of 1, identify the zeros, and construct a rough graph of the function defined by the polynomial. Explain the mathematical term zero using appropriate mathematical vocabulary in both verbal and written form. Choose a graph to represent a given polynomial presented in factored form. Generate a rough graph to represent a given quadratic polynomial presented in factored form.
Factor a quadratic, cubic, or quartic polynomial, identify the zeros, and construct a rough graph of the function defined by the polynomial. Generate a rough graph to represent a given non-quadratic polynomial function presented in factored form.
Explain the process for generating a rough sketch of any factorable polynomial function using accurate mathematical vocabulary in both written and verbal form.
Revised July 31, 2019 13

Instructional Focus Statements Level 3:
Polynomial functions are, on the one hand, very elementary, in that they are built up out of the basic operations of arithmetic. On the other hand, they turn out to be amazingly flexible, and can be used to approximate more advanced functions such as trigonometric and exponential functions in later courses. Experience with constructing polynomial functions satisfying given conditions is useful preparation not only for calculus, but for understanding the mathematics behind curve-fitting methods used in applications to statistics and computer graphics. The first step in developing this understanding is to construct a rough graph for polynomial functions by using their zeros. Eventually, this progression will lead to constructing polynomial functions whose graphs pass through any specified set of points in the plane. It is important that students in this early stage make continue to develop an understanding of the connection that exists between the graphical and algebraic representation of zeros and that they are not simply following a rote procedure but provide evidence of an understanding of this connection. In Integrated Math III, students are focusing on quadratic, cubic, and quartic polynomials when factors are not provided. Quadratic polynomials were also a focus for Integrated Math II. Thus in Integrated Math III, when quadratics are the focus, they should be of appropriate difficulty. Level 4:
At this level of understanding, students should be demonstrating strong command of the relationship that exists between an algebraic representation that elicits zeros of a polynomial function and the graphical representation of zeros moving fluidly between the two. Additionally, they should be able to provide a mathematical explanation of the relationship between algebraic and graphical representations of zeros.
Revised July 31, 2019 14

Standard M3.A.APR.B.3 (Supporting Content) Know and use polynomial identities to describe numerical relationships. Scope and Clarifications: For example, compare (31)(29) = (30 + 1) (30 – 1) = 302 – 12 with (x + y)(x – y) = x2 – y2. There are no assessment limits for this standard. The entire standard is assessed in this course.
Evidence of Learning Statements Students with a level 1 understanding of this standard will most likely be able to:
Students with a level 2 understanding of this standard will most likely be able to:
Students with a level 3 understanding of this standard will most likely be able to:
Students with a level 4 understanding of this standard will most likely be able to:
Match polynomial identities with numerical relationships that are examples of the polynomial identity.
Use it to describe a given numerical relationship, given a polynomial identity.
Identify an appropriate polynomial identity and use it to describe a given numerical relationship.
Identify an appropriate polynomial identity and use it to describe a given numerical relationship and explain the benefit of using that particular polynomial identity to describe the numerical relationship.
Instructional Focus Statements
Level 3:
Polynomials form a rich ground for mathematical explorations that reveal relationships in the system of integers. Instruction should be focused on looking at a wide variety of numerical relationships that are intentionally connected to a polynomial identity. Instruction should not focus simply on the rewriting of numerical relationships, but instead on why it is beneficial to do so. Level 4:
As students master this standard, they show the most conceptual understanding when they are able to explain the benefit of rewriting numerical relationships in multiple ways. Students should experience numerical relationships that can be rewritten using polynomial identities with increasing variance and difficulty over time.
Revised July 31, 2019 15
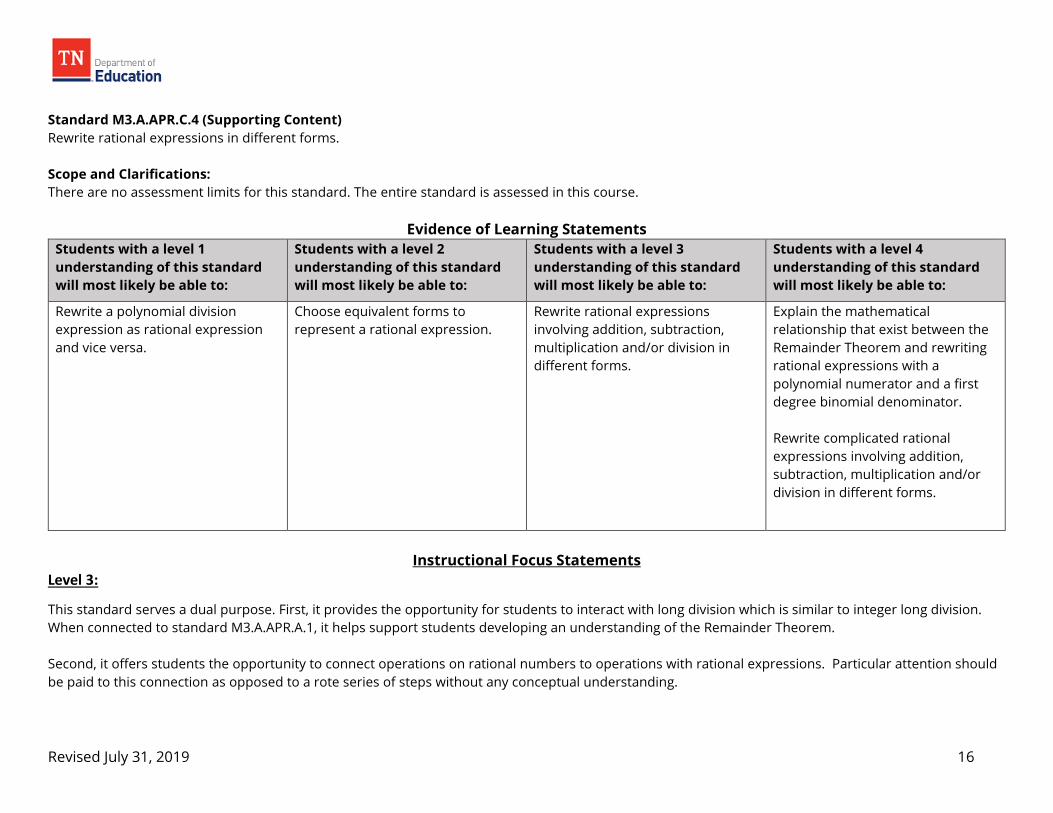
Standard M3.A.APR.C.4 (Supporting Content) Rewrite rational expressions in different forms. Scope and Clarifications: There are no assessment limits for this standard. The entire standard is assessed in this course.
Evidence of Learning Statements Students with a level 1 understanding of this standard will most likely be able to:
Students with a level 2 understanding of this standard will most likely be able to:
Students with a level 3 understanding of this standard will most likely be able to:
Students with a level 4 understanding of this standard will most likely be able to:
Rewrite a polynomial division expression as rational expression and vice versa.
Choose equivalent forms to represent a rational expression.
Rewrite rational expressions involving addition, subtraction, multiplication and/or division in different forms.
Explain the mathematical relationship that exist between the Remainder Theorem and rewriting rational expressions with a polynomial numerator and a first degree binomial denominator. Rewrite complicated rational expressions involving addition, subtraction, multiplication and/or division in different forms.
Instructional Focus Statements
Level 3:
This standard serves a dual purpose. First, it provides the opportunity for students to interact with long division which is similar to integer long division. When connected to standard M3.A.APR.A.1, it helps support students developing an understanding of the Remainder Theorem. Second, it offers students the opportunity to connect operations on rational numbers to operations with rational expressions. Particular attention should be paid to this connection as opposed to a rote series of steps without any conceptual understanding.
Revised July 31, 2019 16

Level 4:
The focus of instruction should emphasize the discovery of the connections that exist between the Remainder Theorem and Rational division so that students can explain the relationship. Additionally, they should encounter and work with simplifying rational expressions involving all operations with increased rigor over time.
Revised July 31, 2019 17

CREATING EQUATIONS* (A.CED) Standard M3.A.CED.A.1 (Major Work of the Grade) Create equations and inequalities in one variable and use them to solve problems. Scope and Clarification: (Modeling Standard)
i. Tasks are limited to polynomial, rational, absolute value, exponential, or logarithmic functions. ii. Tasks have a real-world context.
Evidence of Learning Statements
Students with a level 1 understanding of this standard will most likely be able to:
Students with a level 2 understanding of this standard will most likely be able to:
Students with a level 3 understanding of this standard will most likely be able to:
Students with a level 4 understanding of this standard will most likely be able to:
Identify if a real-world situation can be represented by a polynomial, rational, absolute value, exponential, or logarithmic equation. Determine if the solution to a real-world situation requires a one-variable or two variable equation or inequality. Solve a simple one variable polynomial (quadratic), exponential or rational equation or inequality. Choose a simple polynomial (quadratic), rational or exponential equation or inequality to represent a simple, real-world situation.
Solve a one variable rational, polynomial, absolute value or logarithmic equation or inequality. Choose a polynomial, absolute value, or logarithmic equation or inequality to represent a simple, real-world situation. Create and solve a one variable simple polynomial (quadratic), rational, or exponential equation that represents a real-world situation.
Create and solve a one variable polynomial, absolute value, or logarithmic equation that represents a real-world situation. Create and solve a one-variable polynomial, absolute value, or logarithmic inequality that represents a real-world situation.
Create a real-world situational problem to represent a given polynomial, rational, absolute value, exponential, or logarithmic equation or inequality.
Revised July 31, 2019 18
Instructional Focus Statements Level 3:
In Integrated Math III, the variety of function types that students encounter allows students to create even more complex equations and work within more complex situations than what has been previously experienced. As this is a modeling standard, students need to encounter equations and inequalities that evolve from real-world situations. Students should be formulating equations and inequalities, computing solutions, interpreting findings, and validating their thinking and the reasonableness of attained solutions in order to justify solutions to real-world problems. Real-world situations should elicit equations and inequalities from situations which are polynomial, absolute value, rational, exponential and logarithmic in nature. As quadratic and simple exponential functions are a focus in previous courses, it is imperative that students have the opportunity to work with polynomials with degree greater than 2, rational, logarithmic, and complex exponential equations and inequalities in Integrated Math III. Level 4:
When given an equation or inequality, students can generate a real-world situation that could be solved by a provided equation or inequality demonstrating a deep understanding of the interplay that exists between the situation and the equation or inequality used to solve the problem. Additionally, students should continue to encounter real-world problems that are increasingly more complex. Students should be using the modeling cycle to solve real-world problems.
Revised July 31, 2019 19

Standard M3.A.CED.A.2 (Major Work of the Grade) Create equations in two or more variables to represent relationships between quantities; graph equations with two variables on coordinate axes with labels and scales. Scope and Clarifications: (Modeling Standard) There are no assessment limits for this standard. The entire standard is assessed in this course.
Evidence of Learning Statements Students with a level 1 understanding of this standard will most likely be able to:
Students with a level 2 understanding of this standard will most likely be able to:
Students with a level 3 understanding of this standard will most likely be able to:
Students with a level 4 understanding of this standard will most likely be able to:
Create and graph a two variable linear equation that represents a real-world or mathematical situation. Choose a quadratic, square root, cube root, or simple piecewise equation to represent a real-world or mathematical situation. Choose a quadratic, square root, cube root, or piecewise graph to represent a real-world or mathematical situation. Determine if the solution to a real-world or mathematical situation requires a one-variable or two variable equation.
Create and graph a quadratic, square root, cube root, or simple piecewise equation to represent a real-world or mathematical situation. Choose an equation to represent a real-world or mathematical situation for a wide variety of function types including non-linear, non-quadratic polynomial, absolute value, exponential, logarithmic, step, and more complex piecewise functions. Choose a graph to represent a real-world or mathematical situation for a wide variety of function types including non-linear, non-quadratic polynomial, absolute value, exponential, logarithmic, step, and more complex piecewise functions.
Create and graph a two variable equation that represents a real-world or mathematical situation for a wide variety of function types including non-linear, non-quadratic polynomial, absolute value, exponential, logarithmic, step, and more complex piecewise functions.
Create a real-world situational problem to represent a given equation for a wide variety of function types including non-linear, non-quadratic polynomial, absolute value, exponential, logarithmic, step, and more complex piecewise functions. Create and graph a two variable equation that represents a complex real-world or mathematical situation for a wide variety of function types including non-linear, non-quadratic polynomial, absolute value, exponential, logarithmic, step, and more complex piecewise functions.
Revised July 31, 2019 20

Instructional Focus Statements Level 3:
In Integrated Math III, students should continue to build their understanding of how real-world and mathematical situations can elicit a wide variety of equations and graphs. Students should encounter real-world problems that are increasingly more complex over time. They should be creating more complex equations and working within more complex situations than what had been previously experienced. As this is a modeling standard, it is important for students to encounter equations that evolve from both mathematical and real-world situations. Students should be formulating equations, computing solutions, interpreting findings, and validating their thinking and the reasonableness of attained solutions in order to justify solutions to mathematical and real-world problems. The problems encountered should elicit equations from situations which represent a wide variety of function types including non-linear, non-quadratic polynomial, absolute value, exponential, logarithmic, step, and more complex piecewise functions. It is imperative that students be exposed to creating and graphing each of these function types equally. Level 4:
One of the most natural situations for students to create an equation or graph from is a real-world situation. Students need to be exposed to variety of real world situations that illicit the wide variety of function types embedded within the Integrated Math III course. They should be using the modeling cycle in order to develop and provide justification for their solutions. Additionally, students should be posed with an equation and then asked to generate a real-world situation that could be solved by a provided equation. Students with this capability are demonstrating a deep understanding of the interplay that exists between the situation and the equation used to solve the problem.
Revised July 31, 2019 21

Standard M3.A.CED.A.3 (Major Work of the Grade) Rearrange formulas to highlight a quantity of interest, using the same reasoning as in solving equations. Scope and Clarifications: (Modeling Standard)
i. Tasks have a real-world context. ii. Tasks are limited to polynomial, rational, absolute value, exponential, or logarithmic functions.
Evidence of Learning Statements
Students with a level 1 understanding of this standard will most likely be able to:
Students with a level 2 understanding of this standard will most likely be able to:
Students with a level 3 understanding of this standard will most likely be able to:
Students with a level 4 understanding of this standard will most likely be able to:
Choose equivalent forms of a given linear or quadratic real-world formula.
Rearrange real-world quadratic formulas to highlight a quantity of interest. Choose equivalent forms of a given non-linear, non-quadratic real-world formula. Choose equivalent forms of a given rational real-world formula. Choose equivalent forms of a given absolute value real-world formula. Choose equivalent forms of a given exponential real-world formula. Choose equivalent forms of a given logarithmic real-world formula.
Rearrange real-world non-linear, non-quadratic polynomial formulas to highlight a quantity of interest. Rearrange real-world rational formulas to highlight a quantity of interest. Rearrange real-world absolute value formulas to highlight a quantity of interest. Rearrange real-world exponential formulas to highlight a quantity of interest. Rearrange real-world logarithmic formulas to highlight a quantity of interest.
Rearrange real-world non-linear, non-quadratic polynomial, rational, absolute value, exponential, or logarithmic formulas and explain the benefit of solving the formula for the various variables.
Revised July 31, 2019 22

Instructional Focus Statements Level 3:
In previous grades and courses, students have focused on rearranging linear, quadratic, square root and cube root formulas to highlight a quantity of interest. In Integrated Math III, students should be working with non-linear, non-quadratic polynomial, rational, absolute value, exponential, or logarithmic formulas. As this is a modeling standard, student should be encountering formulas that come from real-world situations. Additionally, students need to be deepening their conceptual understanding of why they might need to write formulas in different ways and what the benefit would be to these various representations of the same real-world formula. Level 4:
Students need to be exposed to a wide variety of real-world formulas increasing in complexity over time. Additionally, it is imperative that they are able to explain why formulas might need to be expressed in different ways and the benefit that each form provides.
Revised July 31, 2019 23
REASONING with EQUATIONS and INEQUALITIES (A.REI)
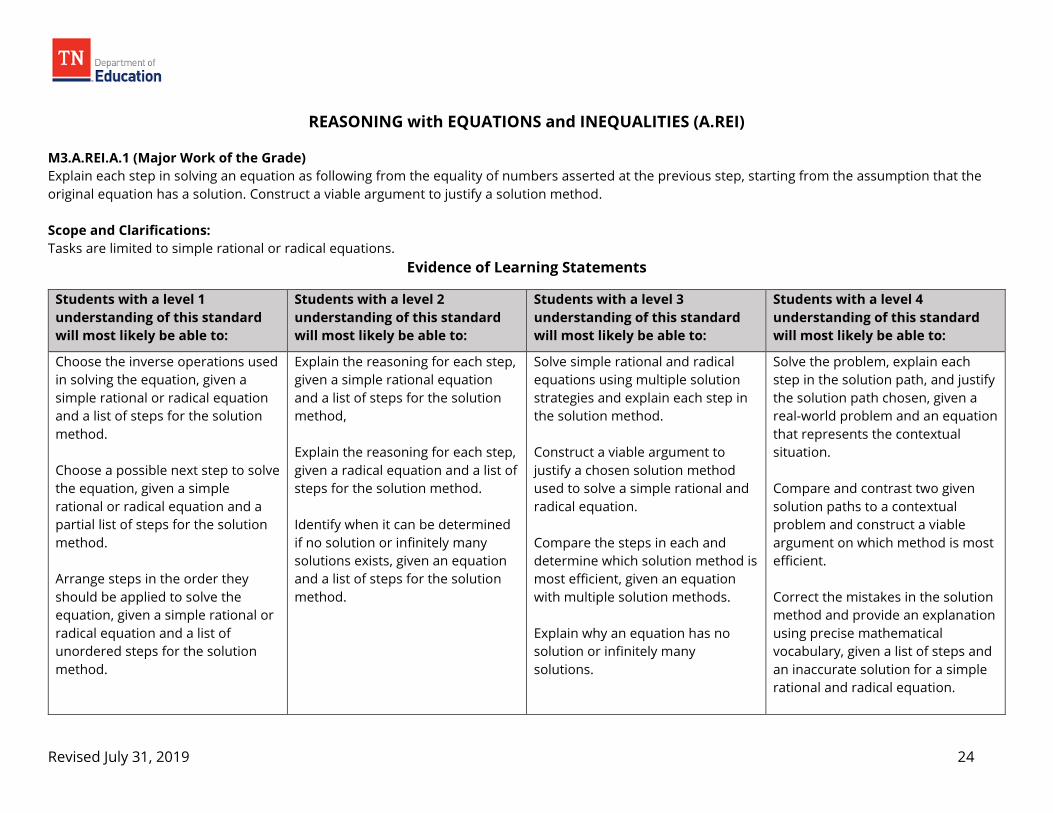
M3.A.REI.A.1 (Major Work of the Grade) Explain each step in solving an equation as following from the equality of numbers asserted at the previous step, starting from the assumption that the original equation has a solution. Construct a viable argument to justify a solution method. Scope and Clarifications: Tasks are limited to simple rational or radical equations.
Evidence of Learning Statements
Students with a level 1 understanding of this standard will most likely be able to:
Students with a level 2 understanding of this standard will most likely be able to:
Students with a level 3 understanding of this standard will most likely be able to:
Students with a level 4 understanding of this standard will most likely be able to:
Choose the inverse operations used in solving the equation, given a simple rational or radical equation and a list of steps for the solution method. Choose a possible next step to solve the equation, given a simple rational or radical equation and a partial list of steps for the solution method. Arrange steps in the order they should be applied to solve the equation, given a simple rational or radical equation and a list of unordered steps for the solution method.
Explain the reasoning for each step, given a simple rational equation and a list of steps for the solution method, Explain the reasoning for each step, given a radical equation and a list of steps for the solution method. Identify when it can be determined if no solution or infinitely many solutions exists, given an equation and a list of steps for the solution method.
Solve simple rational and radical equations using multiple solution strategies and explain each step in the solution method. Construct a viable argument to justify a chosen solution method used to solve a simple rational and radical equation. Compare the steps in each and determine which solution method is most efficient, given an equation with multiple solution methods. Explain why an equation has no solution or infinitely many solutions.
Solve the problem, explain each step in the solution path, and justify the solution path chosen, given a real-world problem and an equation that represents the contextual situation. Compare and contrast two given solution paths to a contextual problem and construct a viable argument on which method is most efficient. Correct the mistakes in the solution method and provide an explanation using precise mathematical vocabulary, given a list of steps and an inaccurate solution for a simple rational and radical equation.
Revised July 31, 2019 24

Instructional Focus Statements Level 3:
In Integrated Math III, students should develop a conceptual understanding of solving equations as a reasoning process to determine a solution that satisfies the equation rather than a procedural list of steps. Instruction should focus on students creating and determining solution paths or each unique equation and providing a viable argument to justify the chosen solution path. Students should also be able to explain how, when, and why equations have no solution or infinitely many solutions. To help give meaning to these solution types, discussion should focus on the solution being a value of the variable that makes the equation true. This will help students make the connections that an equation has no solution because there is no value that can maintain equivalency and an equation has infinitely many solutions because all values used for the variable create a true equivalency statement. Students should understand that a problem can have multiple entry points and instruction should be focused on solving equations using a reasoning process of centered around inverse operations and order of operations. Students develop a conceptual understanding of operations in previous grades and they should deepen their understanding of the interplay that exist between the operations. To illustrate maintaining equivalency, a visual and/or concrete model of a balance scale can be used to aid students in understanding that the same inverse operations are being applied to the whole left side and the whole right side of an equation. Emphasizing equivalency is vital in developing a conceptual understanding of solving equations and preventing common misconceptions. A common misconception is applying an exponent to each term individually instead of applying the power to the entire side of an equation as a quantity. For example, when solving√𝑥𝑥 − 1 = 𝑥𝑥 + 2 , students may make the common misconception of raising each individual term to the second power instead of raising the quantity to the second power resulting in a the inaccurate next step of 𝑥𝑥 − 1 = 𝑥𝑥2 + 4. It is imperative in solving equations for students to understand that inverse operations should be applied to the left side of the equation as one quantity and the right side of the equation as one quantity, not to each term individually. Classroom discussion should address the importance of using grouping symbols when necessary and applying the properties of exponents appropriately as students use inverse operations to solve equations. Students should understand that the solution path they choose to solve any equation must result in a series of equivalent equations all of which have the same solution set. As students apply inverse operations to solve equations, they should be able to explain why equality holds true when performing the selected operation to both sides of the equation. In this course students should be exposed to simple rational and radical functions. Level 4:
As students develop a deeper understanding of solving equations and explaining their solution methods, instruction can be integrated with the application in contextual situation. Students should be able to construct equations that represent a contextual situation as well as create contextual situations to represent a given equation. As students develop a deep understanding of the relationship that exists between the type of function and the context, they can be given functions embedded in real-world situations. When they are given a contextual situation and an equation, students should be able to determine what each part of the equation represents as it relates to the context. They should also be able to solve the equation and create a viable argument to justify their solution path. Students should understand that there are various ways to solve problems and justifying their steps will help them solidify their understanding of solving equations as well as the most efficient solution path. This standards pairs nicely with standard M3.A.CED.A.1 as it
Revised July 31, 2019 25

supports the idea of making connections between an equation and its context. To challenge students to follow a thought process other than their own, they can be asked to critique or correct the solution paths of others. Students will develop a deeper level of understanding if they are given solution paths with incorrect steps in the process or invalid justifications and asked to correct the process or write justifications and defend them.
Revised July 31, 2019 26

Standard M3.A.REI.A.2 (Major Work of the Grade) Solve rational and radical equations in one variable, and identify extraneous solutions when they exist. Scope and Clarifications: There are no assessment limits for this standard. The entire standard is assessed in this course.
Evidence of Learning Statements Students with a level 1 understanding of this standard will most likely be able to:
Students with a level 2 understanding of this standard will most likely be able to:
Students with a level 3 understanding of this standard will most likely be able to:
Students with a level 4 understanding of this standard will most likely be able to:
Simplify expressions with rational exponents when the base number is a variable. Write radical expressions in simplest form. Define extraneous solution.
Rewrite radical expressions using rational exponents. Rewrite expressions with rational exponents as radical expressions in simplest form. Simplify rational expressions by factoring. Perform operations of addition, subtraction, multiplication and division on rational expression containing more than one fraction.
Solve rational equations in one variable. Solve radical equations in one variable. Identify extraneous solutions algebraically Justify solutions graphically using technology.
Solve the equation and justify the solution path, given a partial solution method to a rational or radical equation. Critique the reasoning of others by finding errors and justify changes that could be made to correct mistakes, given the steps to solve a rational or radical equation. Explain why extraneous solutions exist.
Instructional Focus Statements
Level 3:
Standard M3.A.REI.A.2 builds on the concept of retaining equivalency when performing the same operation on both sides of an equation and properties of inverse operations. Students reason from standard M3.A.REI.A.1 that when they perform the same operation on both sides of an equation, equivalency will be retained and the process will end with possible values of an unknown value. Instruction can now focus on solving equations that may have unknown values under the radical or in the denominator.
Revised July 31, 2019 27
To get students ready to solve these equations, instruction needs to include the building blocks that help students develop skills needed to solve rational and radical equations. In integrated math 2, the study of standard M2.N.RN.A.1 and M2.N.RN.A.2 focus on simplifying expressions involving radicals and rational exponents and rewriting them in either form. Those concepts will be necessary to helping students learn to solve radical equations. To solve rational equations, students must first be taught to simplify rational expressions using methods like factoring trinomials and factoring out common factors in the numerator and denominator. Concepts of fractions, such as finding common denominators to add and subtract rational expressions and how to multiply and divide fractions, will be vital to the mastery of solving various complexities of rational equations. As students experience solving a variety of radical and rational equations, they should be led to the realization that not all steps are reversible. Asking students to check their solutions algebraically should lead to discussion on why all resulting solutions may not satisfy the original equation. In addition to identifying extraneous solutions algebraically, students should be expected to explain in their own words why extraneous solutions arise and why they are not correct solutions. This can also be supported by exposing students to the graphs of these rational and radical equations and reconnecting their understanding of solutions as x-intercepts of the function.
Revised July 31, 2019 28
Level 4:
To deepen the level of understanding, instruction could include providing opportunities for students to follow a given solution method on a rational and radical equations. By presenting partially solved problems and asking students to finish the problem to reveal the solution, students will have to follow the reasoning of others and justify their reasoning. To enforce this same concept, students can be provided rational and radical equations that have been completed solved. Students could then be asked to critique the reasoning of others as they examine the problems and determine if mistakes are made. They should be expected to make corrections and justify their reasoning.
Revised July 31, 2019 29

Standard M3.A.REI.B.3 (Major Work of the Grade) Explain why the x-coordinates of the points where the graphs of the equations y = f(x) and y = g(x) intersect are the solutions of the equation f(x) = g(x); find the approximate solutions using technology. Scope and Clarifications: (Modeling Standard) Tasks may include cases where f(x) and/or g(x) are linear, polynomial, rational, absolute value, exponential, or logarithmic functions.
Evidence of Learning Statements Students with a level 1 understanding of this standard will most likely be able to:
Students with a level 2 understanding of this standard will most likely be able to:
Students with a level 3 understanding of this standard will most likely be able to:
Students with a level 4 understanding of this standard will most likely be able to:
Identify the solution of the equation f(x)=g(x), given two linear equations f(x) and g(x).
Approximate the solution(s) for f(x)=g(x) using technology when f(x) and g(x) are absolute value functions, given two equations f(x) and g(x) embedded in a real-world situation. Identify the solution(s) for f(x)=g(x) when f(x) and g(x) are polynomial, rational, exponential, or logarithmic functions, given graphs of two equations f(x) and g(x).
Approximate the solution(s) for f(x)=g(x) using technology when f(x) and g(x) are polynomial, rational, exponential, or logarithmic functions, given two equations f(x) and g(x) embedded in a real-world situation. Explain why the x-coordinates of the points where the graphs of the equations y = f(x) and y = g(x) intersect are the solutions of the equation f(x) = g(x).
Explain why the x-coordinates of the points where the graphs of the equations y = f(x) and y = g(x) intersect are the solutions of the equation f(x) = g(x) and explain the meaning of the solution in terms of a real-world context.
Instructional Focus Statements
Level 3:
In continuing to develop an understanding of what it means to find the solution to two equations using graphing, it is very important that just as we did not want algebraically solving equations to become a series of steps unsupported by reasoning, we want to make sure that graphically solving them the reasoning piece is not left out either. The simple idea that an equation can be solved (approximately) by graphing can often lead to a rote series of steps involving simply finding the intersection point(s) without employing the reasoning of what is actually occurring. Explaining why the x-coordinates of the points where the graphs of the equations y = f(x) and y = g(x) intersect are the solutions of the equation f(x) = g(x) involves a rather sophisticated series of
Revised July 31, 2019 30

thinking as students must connect the idea of two equations in two variables and how that relates to a single equation in one variable and then understand how both connect to a point(s) on a coordinate plane which is built around two variables. Thus, it is imperative that students reason through this process without being given a truncated set of meaningless steps to follow. As this is a modeling standard, Students should be formulating equations, computing solutions, interpreting findings, and validating their thinking and the reasonableness of attained solutions in order to justify solutions built out of real-world situations. In Integrated Math III, students are focusing on linear, polynomial, rational, absolute value, exponential, or logarithmic functions. It I important to note that students have already worked on developing an understanding of this standard with linear and absolute value functions in previous courses. Students need the opportunity to interact with all of these function types. Additionally, they need to encounter situations where f(x) and g(x) are different function types. These should increase in difficulty over time. Level 4:
Students should continue to be exposed to a wide variety of linear, polynomial, rational, absolute value, exponential, or logarithmic functions with increasing difficulty embedded in real-world situations. Additionally, they need to explain the meaning of the solution in terms of the real-world context.
Revised July 31, 2019 31

INTERPRETING FUNCTIONS (F.IF)
Standard M3.F.IF.A.1 (Major Work of the Grade) For a function that models a relationship between two quantities, interpret key features of graphs and tables in terms of the quantities, and sketch graphs showing key features given a verbal description of the relationship. Scope and Clarifications: (Modeling Standard) Key features include: intercepts; intervals where the function is increasing, decreasing, positive, or negative; relative maximums and minimums; symmetries; and end behavior.
i. Tasks have a real-world context. ii. Tasks may involve polynomial, exponential, and logarithmic functions.
Evidence of Learning Statements
Students with a level 1 understanding of this standard will most likely be able to:
Students with a level 2 understanding of this standard will most likely be able to:
Students with a level 3 understanding of this standard will most likely be able to:
Students with a level 4 understanding of this standard will most likely be able to:
Identify intercepts, maximums and minimums when provided a graphical representation of the function.
Identify intervals where a given function is increasing, decreasing, positive or negative when provided a graphical representation of the function. Identify key features of the graph or table of values, and interpret the meaning of the key features in relationship to the context of the problem, given a graph or table of values representing a quadratic function embedded in a real-world context. Identify all evident intercepts, maximums and minimums when
Identify all evident key features when provided a table of values representing a polynomial, exponential, or logarithmic function. Identify key features of the graph or table and interpret the meaning of the key features in relationship to the context of the problem, given a graph or table of values representing an exponential function embedded in a real-world context. Identify key features of the graph or table and interpret the meaning of
Identify key features of the graph, and interpret the meaning of the key features in relationship to the context of the problem, given an exponential function embedded in a real-world context, graph the function. Identify key features of the graph, and interpret the meaning of the key features in relationship to the context of the problem, given a polynomial function embedded in a real-world context, graph the function.
Revised July 31, 2019 32
Students with a level 1 understanding of this standard will most likely be able to:
Students with a level 2 understanding of this standard will most likely be able to:
Students with a level 3 understanding of this standard will most likely be able to:
Students with a level 4 understanding of this standard will most likely be able to:
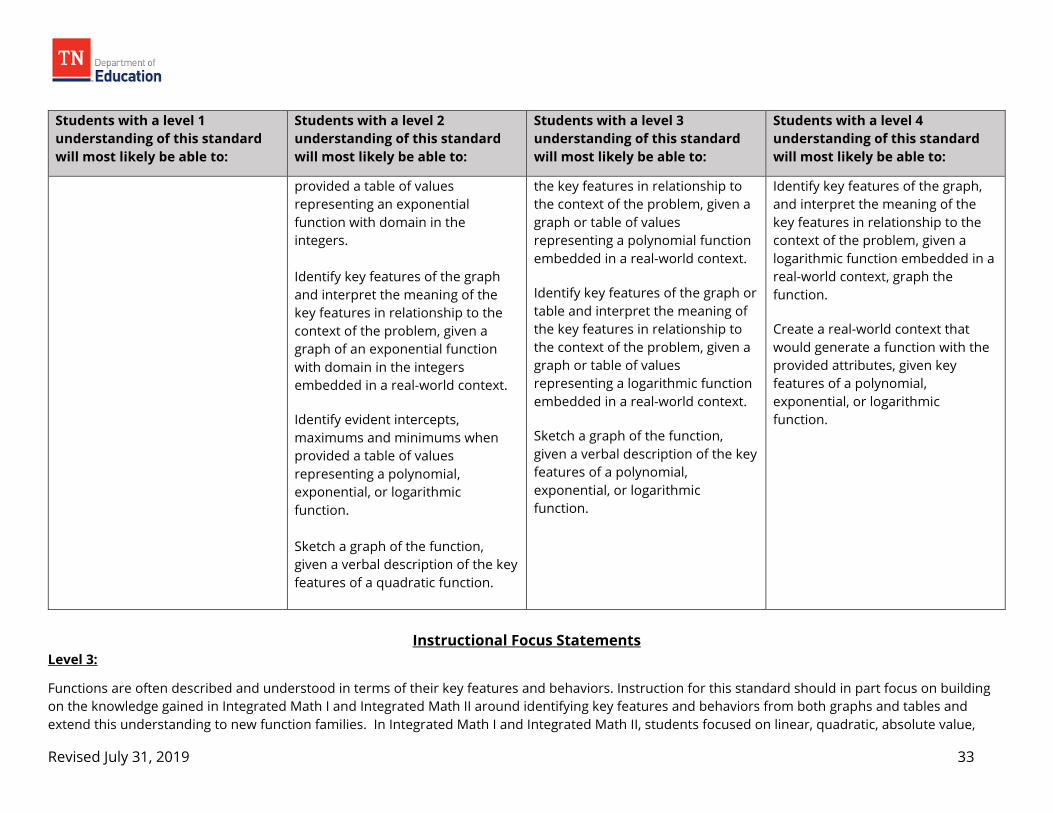
provided a table of values representing an exponential function with domain in the integers. Identify key features of the graph and interpret the meaning of the key features in relationship to the context of the problem, given a graph of an exponential function with domain in the integers embedded in a real-world context. Identify evident intercepts, maximums and minimums when provided a table of values representing a polynomial, exponential, or logarithmic function. Sketch a graph of the function, given a verbal description of the key features of a quadratic function.
the key features in relationship to the context of the problem, given a graph or table of values representing a polynomial function embedded in a real-world context. Identify key features of the graph or table and interpret the meaning of the key features in relationship to the context of the problem, given a graph or table of values representing a logarithmic function embedded in a real-world context. Sketch a graph of the function, given a verbal description of the key features of a polynomial, exponential, or logarithmic function.
Identify key features of the graph, and interpret the meaning of the key features in relationship to the context of the problem, given a logarithmic function embedded in a real-world context, graph the function. Create a real-world context that would generate a function with the provided attributes, given key features of a polynomial, exponential, or logarithmic function.
Instructional Focus Statements
Level 3:
Functions are often described and understood in terms of their key features and behaviors. Instruction for this standard should in part focus on building on the knowledge gained in Integrated Math I and Integrated Math II around identifying key features and behaviors from both graphs and tables and extend this understanding to new function families. In Integrated Math I and Integrated Math II, students focused on linear, quadratic, absolute value,
Revised July 31, 2019 33

square root, cube root, and exponential functions with domain in the integers. The new part of this standard for students will be in the function families as opposed to the types of key features/behaviors. Thus, it is important to note that the overarching concept of key features and behaviors is not new to students. As in Integrated Math I and Integrated Math II, instruction should extend beyond simple identification from isolated graphs and tables. As this is a modeling standard, students need opportunities to develop an understanding of the relationship between key features/behaviors and the real-world situation that the function models. The focus should be on developing a strong understanding of the relationship between key features/behaviors and their meaning within real-world situations. Additionally, instruction should provide students with an opportunity to develop an understanding of not only how to identify key features/behavior in graphs and tables, but also on how to generate a graph when provided the key features/behaviors. Additionally, it is important to note that as quadratics are covered in Integrated Math II, the focus of polynomial functions should be polynomials of degree 3 or higher. Instruction can be very nicely paired with standard M3.F.IF.B.3 where students generate exponential, polynomial, and logarithmic graphs from real-world situations. This pairing allows students the opportunity to generate a graph from a real-world situation, identify key features/behaviors, and then discuss their meaning as related to the real-world situation. Level 4:
As students develop a deep understanding of this standard, they should be exposed to increasingly more complex real-world situations. Students should begin to create their own real-world scenarios that generate functions with a pre-determined list of key features/behaviors. Additionally, students with a deep understanding of this standard can interpret key features/behaviors from non-traditional exponential, polynomial, and logarithmic functions embedded in real-world situations.
Revised July 31, 2019 34
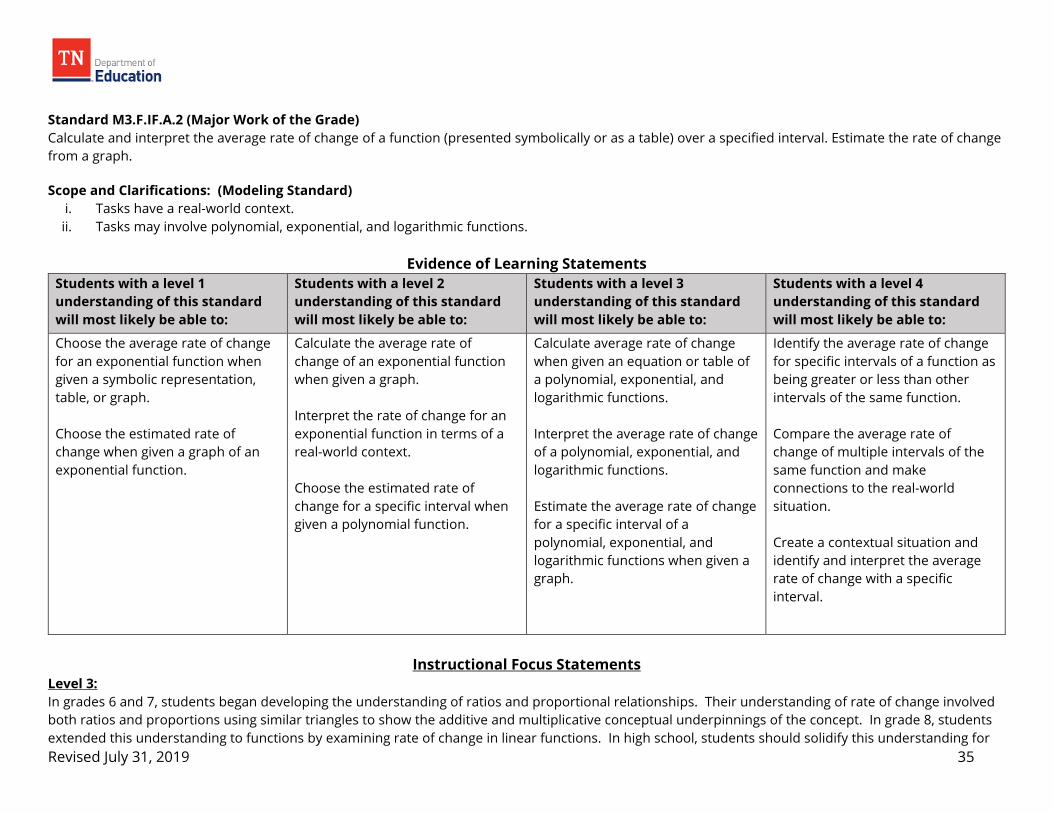
Standard M3.F.IF.A.2 (Major Work of the Grade) Calculate and interpret the average rate of change of a function (presented symbolically or as a table) over a specified interval. Estimate the rate of change from a graph. Scope and Clarifications: (Modeling Standard)
i. Tasks have a real-world context. ii. Tasks may involve polynomial, exponential, and logarithmic functions.
Evidence of Learning Statements
Students with a level 1 understanding of this standard will most likely be able to:
Students with a level 2 understanding of this standard will most likely be able to:
Students with a level 3 understanding of this standard will most likely be able to:
Students with a level 4 understanding of this standard will most likely be able to:
Choose the average rate of change for an exponential function when given a symbolic representation, table, or graph. Choose the estimated rate of change when given a graph of an exponential function.
Calculate the average rate of change of an exponential function when given a graph. Interpret the rate of change for an exponential function in terms of a real-world context. Choose the estimated rate of change for a specific interval when given a polynomial function.
Calculate average rate of change when given an equation or table of a polynomial, exponential, and logarithmic functions. Interpret the average rate of change of a polynomial, exponential, and logarithmic functions. Estimate the average rate of change for a specific interval of a polynomial, exponential, and logarithmic functions when given a graph.
Identify the average rate of change for specific intervals of a function as being greater or less than other intervals of the same function. Compare the average rate of change of multiple intervals of the same function and make connections to the real-world situation. Create a contextual situation and identify and interpret the average rate of change with a specific interval.
Instructional Focus Statements
Level 3: In grades 6 and 7, students began developing the understanding of ratios and proportional relationships. Their understanding of rate of change involved both ratios and proportions using similar triangles to show the additive and multiplicative conceptual underpinnings of the concept. In grade 8, students extended this understanding to functions by examining rate of change in linear functions. In high school, students should solidify this understanding for Revised July 31, 2019 35

linear functions and generalize this concept to applying to additional function types. Students should make the connection that the rate of change is the ratio of the change between the dependent and independent variable. For linear functions, students have discovered that this ratio of change is constant between any two points on the line. Students should now make the connection that, for non-linear functions, the ratio of change is not constant due to the functions curvature. This results in the ability to calculate the average rate of change over a specified interval. For example, for the polynomial function f(x) = x3, the average rate of change from x = 1 to x = 4 is 𝑓𝑓(4)−𝑓𝑓(1)
4−1 = 16−1
4−1 = 64
3. This is the slope of the line from (1, 1) to (4, 64) on the graph f. If f is
interpreted as the volume of a cube of side x, then this calculation means that over this interval the volume changes, on average, 64/3 square units for each unit increase in the side length of the cube. It is imperative that students gain a conceptual understanding of the average rate of change for a specified interval for non-linear functions. To grasp this idea, students should draw illustrations of the graph and the secant line connecting the intended endpoints. Students should not only be able to calculate the average rate of change, but they should also be able to generate a visual representation and use the visual representation to estimate the average rate of change over a specified interval. Students will gain a deeper conceptual understanding when they compare their estimations to the actual average rate of change for a non-linear function. As students solidify their understanding, they should be able to explain what the average rate of change means in the context of a problem when given symbolic representations, tables, graphs, or contextual situations. As students use multiple representations to evaluate the average rate of change, they should be able to explain the relationship between the multiple representations using both appropriate mathematical language and appropriate justifications. Level 4:
Students should extend their understanding of average rate of change by comparing the average rate of change of one interval to another interval of the same function. Students should also further their understanding by creating their own contextual situations and interpreting the average rate of change for a significant interval. Students should be intentional in determining which interval or intervals they select and explain the importance of the interval(s) with respect to the context using both precise mathematical vocabulary and precise justifications.
Revised July 31, 2019 36
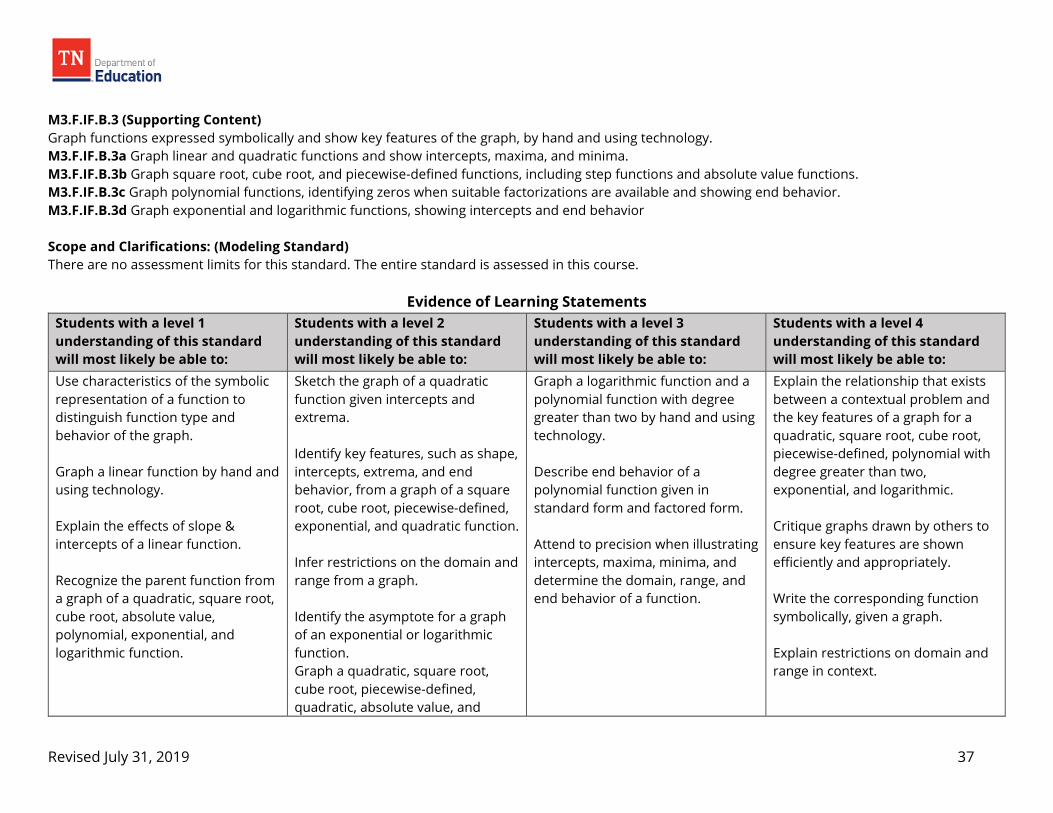
M3.F.IF.B.3 (Supporting Content) Graph functions expressed symbolically and show key features of the graph, by hand and using technology. M3.F.IF.B.3a Graph linear and quadratic functions and show intercepts, maxima, and minima. M3.F.IF.B.3b Graph square root, cube root, and piecewise-defined functions, including step functions and absolute value functions. M3.F.IF.B.3c Graph polynomial functions, identifying zeros when suitable factorizations are available and showing end behavior. M3.F.IF.B.3d Graph exponential and logarithmic functions, showing intercepts and end behavior Scope and Clarifications: (Modeling Standard) There are no assessment limits for this standard. The entire standard is assessed in this course.
Evidence of Learning Statements Students with a level 1 understanding of this standard will most likely be able to:
Students with a level 2 understanding of this standard will most likely be able to:
Students with a level 3 understanding of this standard will most likely be able to:
Students with a level 4 understanding of this standard will most likely be able to:
Use characteristics of the symbolic representation of a function to distinguish function type and behavior of the graph. Graph a linear function by hand and using technology. Explain the effects of slope & intercepts of a linear function. Recognize the parent function from a graph of a quadratic, square root, cube root, absolute value, polynomial, exponential, and logarithmic function.
Sketch the graph of a quadratic function given intercepts and extrema. Identify key features, such as shape, intercepts, extrema, and end behavior, from a graph of a square root, cube root, piecewise-defined, exponential, and quadratic function. Infer restrictions on the domain and range from a graph. Identify the asymptote for a graph of an exponential or logarithmic function. Graph a quadratic, square root, cube root, piecewise-defined, quadratic, absolute value, and
Graph a logarithmic function and a polynomial function with degree greater than two by hand and using technology. Describe end behavior of a polynomial function given in standard form and factored form. Attend to precision when illustrating intercepts, maxima, minima, and determine the domain, range, and end behavior of a function.
Explain the relationship that exists between a contextual problem and the key features of a graph for a quadratic, square root, cube root, piecewise-defined, polynomial with degree greater than two, exponential, and logarithmic. Critique graphs drawn by others to ensure key features are shown efficiently and appropriately. Write the corresponding function symbolically, given a graph. Explain restrictions on domain and range in context.
Revised July 31, 2019 37

Students with a level 1 understanding of this standard will most likely be able to:
Students with a level 2 understanding of this standard will most likely be able to:
Students with a level 3 understanding of this standard will most likely be able to:
Students with a level 4 understanding of this standard will most likely be able to:
exponential function by hand and using technology.
Instructional Focus Statements
Level 3:
In Integrated Math I and Integrated Math II, students were introduced to functions as families and explored key features such as extrema, end behavior, intercepts, shape, domain, and range. Students only focused on the linear functions in Integrated Math I and focused on quadratics, square root, cube root, piece-wise, and the exponential functions in Integrated Math II. Therefore, instruction in Integrated Math III should build on the concept of parent functions by introducing the logarithmic function and higher-degree polynomials. This will help students make the connection between of how transformations affect the graph, equation, and table of a function, which is also explored in standard M2.F.BF.B.2. Students should be presented with function types whose symbolic representation varies (e.g., standard and factored form) and asked to identify the parent function and describe the transformation from its original graph. Students should attend to precision as they graph functions of many types and use their understanding of transformations to support the reasonableness of their graph. Students should have ample opportunity to compare and contrast the graphs of functions, and instruction should support students' developing the ability to efficiently recognize a parent function when expressed symbolically and graph it fluently. Students learned about exponential functions in Integrated Math II, so instruction should allow students to make connections to the inverse relationship that exists between exponential functions and logarithmic functions. Instruction should connect the inverse relationship that exists between the exponential function's initial value, y-intercept, end behavior, and horizontal asymptote to a logarithmic function's base value, x-intercept, end behavior, and vertical asymptote. Asking students to produce a table with these values will help them sketch a graph of the logarithmic curve. The last function type addressed in this standard is polynomial functions. Graphing polynomial functions should be taught in tandem with standard M3.A.APR.A.2 where students have to identify zeros of polynomials when suitable factorizations are available, and use the zeros to construct a rough graph of the function defined by the polynomial. Instruction for this standard should allow students to discover the end behavior of polynomials through an exploration of varying leading coefficients as the degree of the polynomial increases. Teachers should guide the exploration so that students generalize the behavior of positive and negative even-degree functions as well as positive and negative odd-degree functions. Students should be able to graph functions by hand and with the use of technology. It is imperative for teachers to model how to graph with a graphing calculator or other graphing device. Ample time must be given for students to explore how the table aids in identifying key features, domain, and range from a graph. The use of technology should allow students to explore problems whose key features are irrational values which can be located with the use of a device. Students may have struggled with domain restrictions in previous classes, so continue supporting that understanding by integrating
Revised July 31, 2019 38

technology to explore domain restrictions so that students to connect the relationship between the algebraic representation and the resulting domain. Level 4:
Instruction at this level should provide opportunities for students to create a real-world problem that is modeled by a logarithmic or polynomial function. Students should be required to provide a graph, table, equation, and verbal representation of the problem. Instruction should include posing purposeful questions asking students to show and describe key features from their created problem in context. Instruction should also provide graphs drawn by others and require students to analyze and critique the graphs. Students should be given the opportunity to look at graphs drawn by others so they can analyze and critique their peers work. Through the analysis of many graphs, students should develop an understanding of when key features are efficiently and effectively represented, and, if not, provide a suggestion for representing them more appropriately.
Revised July 31, 2019 39

Standard M3.F.IF.B.4 (Supporting Content) Compare properties of two functions each represented in a different way (algebraically, graphically, numerically in tables, or by verbal descriptions). Scope and Clarifications: Tasks may involve polynomial, exponential, and logarithmic functions.
Evidence of Learning Statements Students with a level 1 understanding of this standard will most likely be able to:
Students with a level 2 understanding of this standard will most likely be able to:
Students with a level 3 understanding of this standard will most likely be able to:
Students with a level 4 understanding of this standard will most likely be able to:
Identify the y-intercept of a function from multiple representations. Identify the slope of a linear function from multiple representations. Identify asymptotes of exponential functions from multiple representations. Describe connections among multiple representations of a linear function. Compare properties of two linear functions each represented in a different way. Compare properties of two quadratic functions each represented in a different way.
Identify the zeros of a function from multiple representations. Identify asymptotes of logarithmic functions from multiple representations. Identify the relative extrema of a polynomial function from multiple representations. Identify the end behavior of a polynomial function from multiple representations. Identify the percent rate of change of an exponential function from multiple representations. Describe connections among multiple representations of a polynomial function.
Compare properties of two exponential functions each represented in a different way. Compare properties of two logarithmic functions each represented in a different way. Compare properties of two polynomial functions each represented in a different way. Compare properties of two functions from different function families each represented in a different way.
Compare properties of two functions within a context. Use precise mathematical vocabulary to explain the relationships of the various representations of a function.
Revised July 31, 2019 40
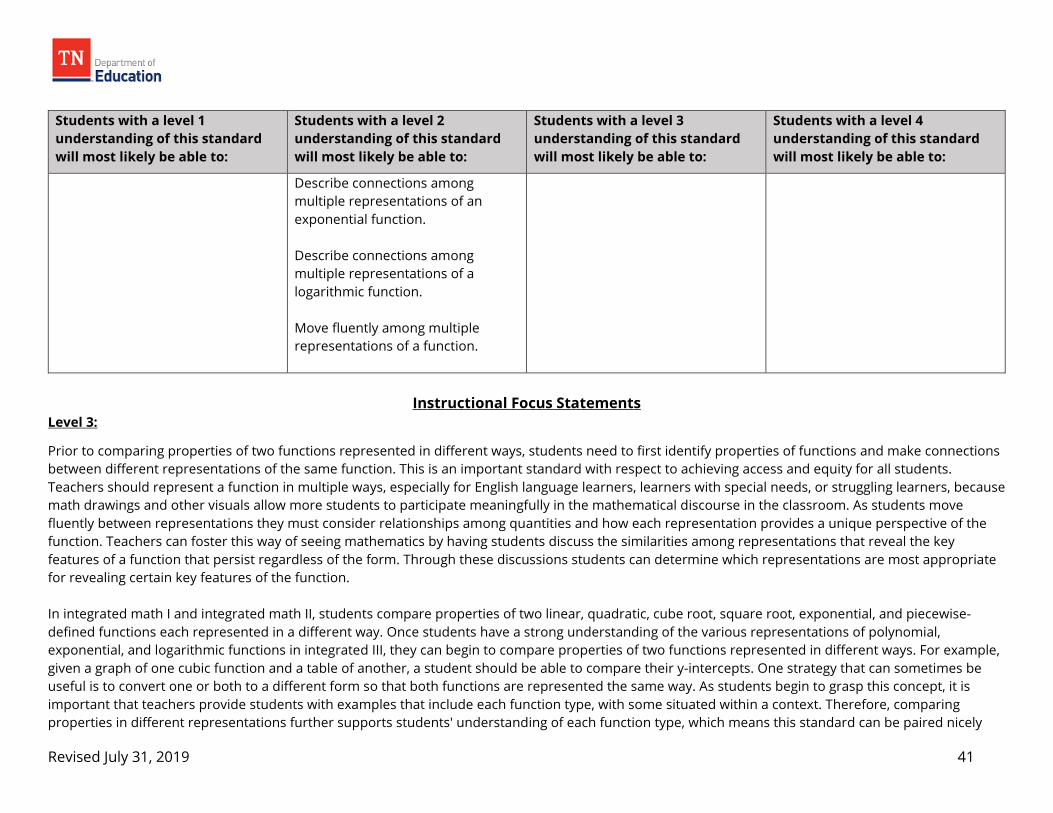
Students with a level 1 understanding of this standard will most likely be able to:
Students with a level 2 understanding of this standard will most likely be able to:
Students with a level 3 understanding of this standard will most likely be able to:
Students with a level 4 understanding of this standard will most likely be able to:
Describe connections among multiple representations of an exponential function. Describe connections among multiple representations of a logarithmic function. Move fluently among multiple representations of a function.
Instructional Focus Statements
Level 3:
Prior to comparing properties of two functions represented in different ways, students need to first identify properties of functions and make connections between different representations of the same function. This is an important standard with respect to achieving access and equity for all students. Teachers should represent a function in multiple ways, especially for English language learners, learners with special needs, or struggling learners, because math drawings and other visuals allow more students to participate meaningfully in the mathematical discourse in the classroom. As students move fluently between representations they must consider relationships among quantities and how each representation provides a unique perspective of the function. Teachers can foster this way of seeing mathematics by having students discuss the similarities among representations that reveal the key features of a function that persist regardless of the form. Through these discussions students can determine which representations are most appropriate for revealing certain key features of the function. In integrated math I and integrated math II, students compare properties of two linear, quadratic, cube root, square root, exponential, and piecewise-defined functions each represented in a different way. Once students have a strong understanding of the various representations of polynomial, exponential, and logarithmic functions in integrated III, they can begin to compare properties of two functions represented in different ways. For example, given a graph of one cubic function and a table of another, a student should be able to compare their y-intercepts. One strategy that can sometimes be useful is to convert one or both to a different form so that both functions are represented the same way. As students begin to grasp this concept, it is important that teachers provide students with examples that include each function type, with some situated within a context. Therefore, comparing properties in different representations further supports students' understanding of each function type, which means this standard can be paired nicely
Revised July 31, 2019 41

with other standards that focus on properties and graphs of polynomial, exponential, and logarithmic functions, such as M3.F.IF.A.1 and M3.F.IF.B.3. As students recognize various function types in multiple representations, discussion should lead to the comparison of functions from different families represented in different ways. For example, compare y-intercepts given a table of values representing a cubic function and a verbal description of an exponential function. Instruction should support students in first recognizing the function family prior to comparing properties. Level 4:
Students with a deep understanding of the various function types and representations should also be able to compare functions from different families represented in different ways and applied to a context. Once conclusions are formed, teachers can ask questions related to the context. For example, given a graph of a quartic function and an algebraic representation of an exponential function each describing the cost of a cell phone plan, decide which plan is better. Students should be given the opportunity to describe how to identify function types and compare the properties of functions in various forms. At this level, teachers should expect students to use precise mathematical vocabulary to describe and justify these relationships and qualities.
Revised July 31, 2019 42
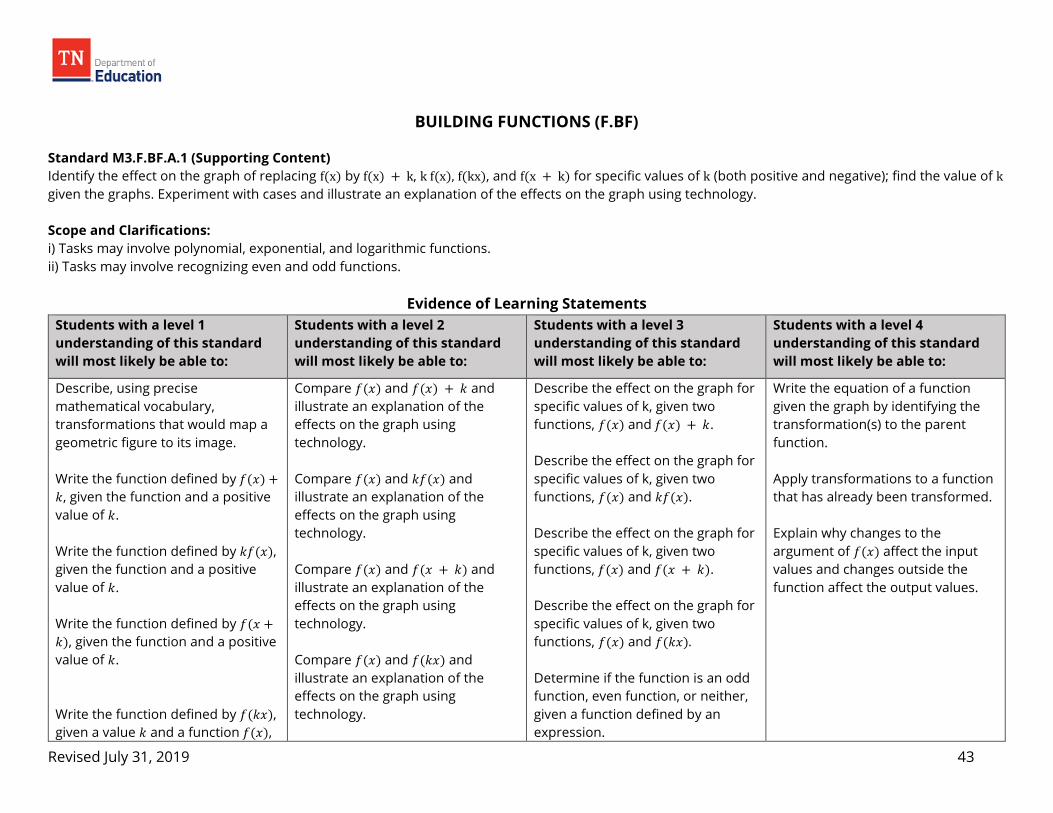
BUILDING FUNCTIONS (F.BF)
Standard M3.F.BF.A.1 (Supporting Content) Identify the effect on the graph of replacing f(x) by f(x) + k, k f(x), f(kx), and f(x + k) for specific values of k (both positive and negative); find the value of k given the graphs. Experiment with cases and illustrate an explanation of the effects on the graph using technology. Scope and Clarifications: i) Tasks may involve polynomial, exponential, and logarithmic functions. ii) Tasks may involve recognizing even and odd functions.
Evidence of Learning Statements Students with a level 1 understanding of this standard will most likely be able to:
Students with a level 2 understanding of this standard will most likely be able to:
Students with a level 3 understanding of this standard will most likely be able to:
Students with a level 4 understanding of this standard will most likely be able to:
Describe, using precise mathematical vocabulary, transformations that would map a geometric figure to its image. Write the function defined by 𝑓𝑓(𝑥𝑥) +𝑘𝑘, given the function and a positive value of 𝑘𝑘. Write the function defined by 𝑘𝑘𝑓𝑓(𝑥𝑥), given the function and a positive value of 𝑘𝑘. Write the function defined by 𝑓𝑓(𝑥𝑥 +𝑘𝑘), given the function and a positive value of 𝑘𝑘. Write the function defined by 𝑓𝑓(𝑘𝑘𝑥𝑥), given a value 𝑘𝑘 and a function 𝑓𝑓(𝑥𝑥),
Compare 𝑓𝑓(𝑥𝑥) and 𝑓𝑓(𝑥𝑥) + 𝑘𝑘 and illustrate an explanation of the effects on the graph using technology. Compare 𝑓𝑓(𝑥𝑥) and 𝑘𝑘𝑓𝑓(𝑥𝑥) and illustrate an explanation of the effects on the graph using technology. Compare 𝑓𝑓(𝑥𝑥) and 𝑓𝑓(𝑥𝑥 + 𝑘𝑘) and illustrate an explanation of the effects on the graph using technology. Compare 𝑓𝑓(𝑥𝑥) and 𝑓𝑓(𝑘𝑘𝑥𝑥) and illustrate an explanation of the effects on the graph using technology.
Describe the effect on the graph for specific values of k, given two functions, 𝑓𝑓(𝑥𝑥) and 𝑓𝑓(𝑥𝑥) + 𝑘𝑘. Describe the effect on the graph for specific values of k, given two functions, 𝑓𝑓(𝑥𝑥) and 𝑘𝑘𝑓𝑓(𝑥𝑥). Describe the effect on the graph for specific values of k, given two functions, 𝑓𝑓(𝑥𝑥) and 𝑓𝑓(𝑥𝑥 + 𝑘𝑘). Describe the effect on the graph for specific values of k, given two functions, 𝑓𝑓(𝑥𝑥) and 𝑓𝑓(𝑘𝑘𝑥𝑥). Determine if the function is an odd function, even function, or neither, given a function defined by an expression.
Write the equation of a function given the graph by identifying the transformation(s) to the parent function. Apply transformations to a function that has already been transformed. Explain why changes to the argument of 𝑓𝑓(𝑥𝑥) affect the input values and changes outside the function affect the output values.
Revised July 31, 2019 43

Students with a level 1 understanding of this standard will most likely be able to:
Students with a level 2 understanding of this standard will most likely be able to:
Students with a level 3 understanding of this standard will most likely be able to:
Students with a level 4 understanding of this standard will most likely be able to:
Determine if the graph is symmetric across the y-axis, given a graph. Determine if the graph has 180 degree rotational symmetry about the origin, given a graph.
Describe multiple effects on a graph for specific values of 𝑎𝑎, 𝑏𝑏, ℎ, and 𝑘𝑘 given two functions, 𝑓𝑓(𝑥𝑥) and 𝑎𝑎𝑓𝑓(𝑏𝑏(𝑥𝑥 + ℎ)) + 𝑘𝑘. Find the value of k for a specific vertical or horizontal translation, stretch, or compression, given two graphs, the image and pre-image.
Instructional Focus Statements
Level 3:
In grade 8, students verify experimentally the properties of rotations, reflections, and translations of simple figures. Students expanded on this concept in integrated math II by applying similar transformations to linear, quadratic, and absolute value functions and describing the transformations using function notation. Finally, in integrated math III, the function types are expanded to include polynomial, exponential, and logarithmic functions. One specific change that teachers need to address is the multiple arguments (i.e., terms including x) found in polynomial functions. In integrated math II, most functions types only had one argument, so students may not realize that they need to change all the terms including 𝑥𝑥 to write 𝑓𝑓(𝑥𝑥 + ℎ), for example. To understand how 𝑎𝑎, ℎ, and 𝑘𝑘 impact the graph of 𝑓𝑓(𝑥𝑥) when compared to 𝑎𝑎𝑓𝑓(𝑥𝑥 + ℎ) + 𝑘𝑘, students can use technology (i.e., calculator or online graphing tool) to experiment with 𝑓𝑓(𝑥𝑥) + 𝑘𝑘, 𝑎𝑎𝑓𝑓(𝑥𝑥), and 𝑓𝑓(𝑥𝑥 + ℎ). As students vary one value at a time, they can begin to discern how each component affects the graph of 𝑓𝑓(𝑥𝑥). Careful attention should be made to why ℎ translates the graph −ℎ units horizontally. One explanation is to compare 𝑓𝑓(𝑥𝑥) with 𝑓𝑓(𝑥𝑥 − 5) and see that 𝑓𝑓(3), for example, will produce the same output value as 𝑓𝑓(8 − 5). In this example, an input of 3 into 𝑓𝑓(𝑥𝑥) is equivalent to an input of 8 into 𝑓𝑓(𝑥𝑥 − 5), and 8 is 5 units to the right of 3, not left. Students can think about it as having to undo what has been done to 𝑥𝑥 inside the argument, which leads nicely to understanding 𝑓𝑓(𝑘𝑘𝑥𝑥) stretches the graph horizontally by a factor of 1
𝑏𝑏 . Meanwhile, 𝑓𝑓(𝑥𝑥) represents the output values. So, any operations performed to
𝑓𝑓(𝑥𝑥) outside the argument only affect the y values, which results in vertical transformations. Once students understand the effects of each component individually, they should then attempt to describe changes to a graph involving multiple transformations at once.
Revised July 31, 2019 44

Connections between transformations and vertex form of a quadratic should be made. Converting to the vertex form of a quadratic reveals the transformations being made to 𝑦𝑦 = 𝑥𝑥2, which allows students to easily locate the vertex and determine the concavity of the parabola. Making this connection will help support a deep conceptual understanding of transformations and vertex form. Students should realize that the same transformations will be applied to other function types such as rational and trigonometric functions in future courses. Additionally, transformations should be used to describe even and odd functions. Given a graph or function, students should be able to determine if 𝑓𝑓(−𝑥𝑥) = 𝑓𝑓(𝑥𝑥) or −𝑓𝑓(−𝑥𝑥) = 𝑓𝑓(𝑥𝑥) and thus, classify functions as even functions, odd functions, or neither. Recognizing even and odd functions is especially useful in calculus when finding efficient ways to calculate the area underneath a curve. Level 4:
Students with a deep understanding of this standard should be able to write the equation of a function given the graph by identifying the transformation(s) to the parent function. Teachers should focus students' attention on the order of each transformation. For example, given −𝑓𝑓(𝑥𝑥) + 9, the graph is first reflected across the x-axis, then shifted up 9, rather than shifted up 9 then reflected across the x-axis due to the order of operations. It is also important that teachers place an emphasis on factoring out b from inside the argument so that the horizontal shift can be found. For example, write 𝑙𝑙𝑙𝑙𝑙𝑙(2𝑥𝑥 − 6) as log (2(𝑥𝑥 − 3)) instead, revealing a horizontal shift of 3 to the right, not 6. Teachers should help students understand that transformations can be made to functions that have already been transformed. For example, given 𝑓𝑓(𝑥𝑥) =(𝑥𝑥 + 2)2, write an equation for 𝑓𝑓(𝑥𝑥 − 5) and describe the overall change in the graph. In addition, students at this level should be able to explain concepts such as why changes inside the argument of a function have the inverse effect on a graph. Taken collectively, these students should understand a function as a process that generates output values from particular input values. Building on this understanding, students should make connections with which transformations perform operations to the input values prior to the function's operations and which transformations perform operations to the output values after the function has been applied.
Revised July 31, 2019 45

Standard M3.F.BF.A.2 (Supporting Content) Find inverse functions. M3.F.BF.A.2a Find the inverse of a function when the given function is one-to-one. Scope and Clarifications: There are no assessment limits for this standard. The entire standard is assessed in this course
Evidence of Learning Statements Students with a level 1 understanding of this standard will most likely be able to:
Students with a level 2 understanding of this standard will most likely be able to:
Students with a level 3 understanding of this standard will most likely be able to:
Students with a level 4 understanding of this standard will most likely be able to:
Reflect a graph across horizontal, vertical, and diagonal lines. Solve linear and cube root equations. Identify the domain of the function, given a graph.
Draw the graph of 𝑓𝑓−1(𝑥𝑥) by reflecting 𝑓𝑓(𝑥𝑥) across the line 𝑦𝑦 = 𝑥𝑥, given the graph of 𝑓𝑓(𝑥𝑥). Find 𝑓𝑓−1(𝑏𝑏), given 𝑓𝑓(𝑎𝑎) = 𝑏𝑏, where a and b are real numbers. Write a point on the graph of 𝑓𝑓−1(𝑥𝑥), given a point on the graph of 𝑓𝑓(𝑥𝑥). Find the inverse of a relation from a list of points or a table. Determine if a given graph is one-to-one.
Find the inverse of a function when the given function is one-to-one. Graph the inverse of a given linear function. Graph the inverse of a given cubic function. Graph the inverse of a quadratic function with a restricted domain. Find the inverse of a quadratic function by first restricting the domain to make it one-to-one.
Explain how an inverse function undoes the operations of the original function. That is, 𝑓𝑓−1(𝑓𝑓(𝑥𝑥)) = 𝑥𝑥 and 𝑓𝑓(𝑓𝑓−1(𝑥𝑥)) = 𝑥𝑥. Explain why functions that are not one-to-one do not have an inverse that is a function. Determine if a function has an inverse that is a function, given a function represented by an expression. Restrict the domain of a function so that it is one-to-one.
Revised July 31, 2019 46

Instructional Focus Statements Level 3:
In Integrated math I and II, students used inverse operations to rearrange formulas to highlight a quantity of interest (standard M1.A.CED.A.4) and solve linear (standard M1.A.REI.A.1) and quadratic, square root, cube root, and exponential equations (standard M2.A.REI.A.1). Students also began to understand a function as a process that produces output values corresponding to certain input values. In Integrated Math III, students continue to use inverse operations to write the inverse of a function, which produces the input values corresponding to particular output values. So that each output value produces one unique input value, the original function must be one-to-one. Otherwise, the inverse of the function would not be a function itself. For example, students should be able to find the inverse of one-to-one functions such as linear, cube root, cubic, exponential, and logarithmic functions or restrict the domain of a function that is not one-to-one (e.g., quadratics). Instruction should provide students with opportunities to see the need for a inverse function. If a set of output values are given, it would be tedious to solve for the corresponding input values individually. For example, 𝐹𝐹 = 9
5𝐶𝐶 + 32 is the formula to convert from Celsius to Fahrenheit. If given multiple
Fahrenheit temperatures, it would be time consuming to solve for each of the corresponding Celsius temperatures individually using this function. Instead, the inverse function can be used to convert the values much quicker, and thus create a formula to convert any Fahrenheit temperature to Celsius (i.e., 𝐶𝐶 =59
(𝐹𝐹 − 32)). Other relationships that may be helpful examples include: the perimeter of a square and its side length (𝑃𝑃 = 4𝑥𝑥), the area of a circle and its radius (𝐴𝐴 = 𝜋𝜋𝑟𝑟2), and the circumference of a circle and its radius (𝐶𝐶 = 2𝜋𝜋𝑟𝑟). Although switching x and y works algebraically, instruction should be carefully organized to ensure that students solve for the input variable to create a new function whose operations undo the original function's operations. This way, students understand that they are using inverse operations in the opposite order to solve for the independent variable (e.g., x), which addresses a common misconception of simply reciprocating numbers and changing operations. Encoding and decoding using functions is a great way for students to think about the undoing process. Also, allowing students to experience inverse functions through multiple representations can strengthen their' understanding of this concept. For example, asking questions from a table of values requires new ways of thinking about an inverse function because it does not have an equation to manipulate. Level 4:
As students develop a deep understanding of this standard, they should be able to explain inverse functions as an undoing process using the composition of functions. In addition, if the original function is not one-to-one (e.g., 𝑦𝑦 = 𝑥𝑥2), students at this level should restrict the domain so that every output value corresponds to a unique input value, which means its inverse is a function. Restricting the domain will be very useful in future courses when learning about inverse trigonometry functions. Furthermore, students should understand the differences when finding the inverse of a function with a context (e.g., 𝐹𝐹 = 9
5𝐶𝐶 + 32). Students at this level
should understand why switching the variables does not make sense in a real-world context and that they are simply changing which variable is the input Revised July 31, 2019 47
and output. Therefore, graphing a function and its inverse on the same coordinate plane no longer makes sense because the axes need to be switched on a separate plane in order to graph the inverse function.
Revised July 31, 2019 48

Linear, Quadratic, and Exponential Models (F.LE)
M3.F.LE.A.1 (Supporting Content) Observe using graphs and tables that a quantity increasing exponentially eventually exceeds a quantity increasing linearly, quadratically, or (more generally) as a polynomial function. Scope and Clarifications: (Modeling Standard) There are no assessment limits for this standard. The entire standard is assessed in this course.
Evidence of Learning Statements Students with a level 1 understanding of this standard will most likely be able to:
Students with a level 2 understanding of this standard will most likely be able to:
Students with a level 3 understanding of this standard will most likely be able to:
Students with a level 4 understanding of this standard will most likely be able to:
Understand what is meant by an increasing function. Describe numerically why an increasing graph visually rises. Identify the interval(s) where a function is increasing and decreasing given a graph or a table of values.
Calculate the average rate of change of linear, quadratic, polynomial, and exponential functions over a given interval. Describe interval(s) where a function is increasing and decreasing using interval notation or inequality notation given a graph or table of values. Understand that an exponential function will eventually exceed a linear function.
Compare the end behavior of graphs of lines, quadratics, polynomials, and exponentials to determine which increases faster. Find and compare the average rate of change of lines, quadratics, polynomials, and exponentials over equal intervals and make conclusions. Defend why a quantity increasing exponentially will eventually exceed a linear, quadratic, or polynomial function and justify the conclusion by testing values.
Verify and explain why a quantity in one function type will eventually exceed a quantity in another function type. Observe graphs that model real-world scenarios and explain in context the reasonableness of why one graph increases faster than the other. Find the exact quantity where an exponential function exceeds another using technology and explain what it means in context of the real-world situation.
Revised July 31, 2019 49

Instructional Focus Statements Level 3:
In Integrated math I, students were introduced to this concept by observing that an exponential function will eventually exceed a linear function. In integrated math III, students are asked to make that observation for quadratic and, more generally, polynomials as well. Students should be provided examples of all these different types of functions in multiple representations to compare which type function will increase faster. It is important that students understand what is meant by "increasing faster". This will typically be easier for students to see in a table of values with the independent variable values listed in numerical order. When analyzing graphs, students should be instructed to read the graph left to right and can consider end behavior to help them draw a conclusion. As this is a modeling standard, it is important that students interpret the graphs in context to understand the relationship between the variables. Students have more experience with linear functions and should be able to tell if it is increasing or decreasing since the rate of change remains constant. To help students understand the rate at which a function is increasing for functions other than linear, they should compare rates of change over equal intervals for the functions being compared. This concept was covered in integrated math I through standard M1.F.IF.B.5 for linear, piecewise, and exponential functions and expanded in integrated math III in standard M3.F.IF.A.2 to include polynomial and logarithmic functions. Therefore, this skill is a pre-requisite to this standard. Organizing this data in a table will help students draw conclusions. Comparing graphs of functions on the same coordinate plane will also help students see what "increasing faster" looks like. If students struggle with getting the two graphs confused when they are on the same coordinate plane, have them graph them with different colors, or put one on tracing paper so that it can be placed over the other one. This can also be alleviated by having students compare the graphs using technology. Level 4:
At this level of understanding, students should be able to explain precisely how they know a quantity that increases exponentially will eventually exceed that of a quantity that increases linearly, quadratically, or in another polynomial function. Students should be asked to explain in context the reasonableness of why a graph that models one situation would increase faster than a graph that models another situation. Allowing students to work in pairs or small groups when analyzing pairs of functions will provide students opportunities to construct viable arguments and critique the reasoning of others.
Revised July 31, 2019 50
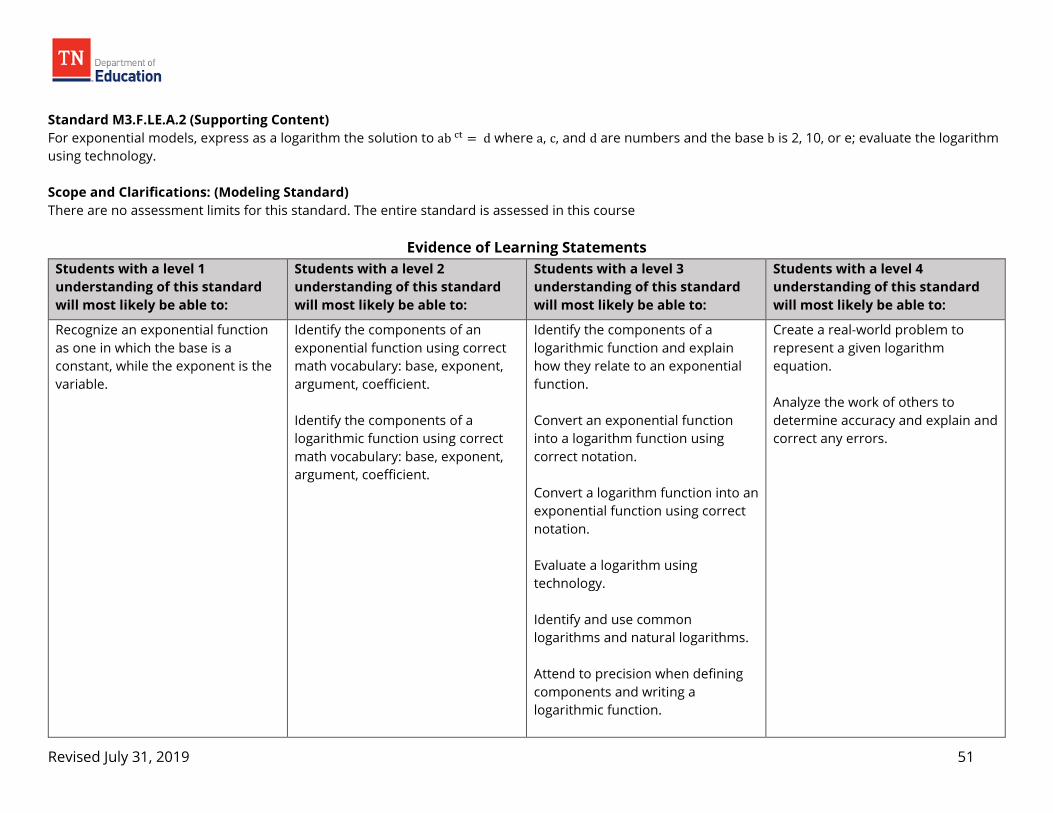
Standard M3.F.LE.A.2 (Supporting Content) For exponential models, express as a logarithm the solution to ab ct = d where a, c, and d are numbers and the base b is 2, 10, or e; evaluate the logarithm using technology. Scope and Clarifications: (Modeling Standard) There are no assessment limits for this standard. The entire standard is assessed in this course
Evidence of Learning Statements Students with a level 1 understanding of this standard will most likely be able to:
Students with a level 2 understanding of this standard will most likely be able to:
Students with a level 3 understanding of this standard will most likely be able to:
Students with a level 4 understanding of this standard will most likely be able to:
Recognize an exponential function as one in which the base is a constant, while the exponent is the variable.
Identify the components of an exponential function using correct math vocabulary: base, exponent, argument, coefficient. Identify the components of a logarithmic function using correct math vocabulary: base, exponent, argument, coefficient.
Identify the components of a logarithmic function and explain how they relate to an exponential function. Convert an exponential function into a logarithm function using correct notation. Convert a logarithm function into an exponential function using correct notation. Evaluate a logarithm using technology. Identify and use common logarithms and natural logarithms. Attend to precision when defining components and writing a logarithmic function.
Create a real-world problem to represent a given logarithm equation. Analyze the work of others to determine accuracy and explain and correct any errors.
Revised July 31, 2019 51

Students with a level 1 understanding of this standard will most likely be able to:
Students with a level 2 understanding of this standard will most likely be able to:
Students with a level 3 understanding of this standard will most likely be able to:
Students with a level 4 understanding of this standard will most likely be able to:
Know when to use a logarithmic function to solve a contextual problem. Use a logarithmic function with a base of 2, 10, or e to solve a contextual problem
Instructional Focus Statements
Level 3:
Students need to have a good understanding of exponential functions before learning logarithms so they can make the necessary connections between these two functions. Exponential function: 𝑎𝑎𝑏𝑏𝑐𝑐𝑐𝑐 = 𝑑𝑑 Logarithmic function: 𝑙𝑙𝑙𝑙𝑙𝑙𝑏𝑏𝑑𝑑𝑎𝑎 = 𝑐𝑐𝑐𝑐, where 𝑎𝑎 is the coefficient of the exponential, 𝑏𝑏 is the base, 𝑐𝑐 is the coeficient of 𝑐𝑐, 𝑐𝑐 is the exponent, and 𝑑𝑑 is the argument. It is important for students to attend to precision when writing the notation for a logarithm. Students often do not understand that the base is written as a subscript and therefore can get confused between the base and the argument. One way to help build understanding of these components is to have students write both the exponential and logarithmic functions side by side identifying all the components. Students will learn additional properties of logarithms in more advanced courses, including that a logarithm is the inverse of an exponential function. Level 4:
When given an equation or inequality, students can generate a real-world situation that could be solved by a provided equation demonstrating a deep understanding of the interplay that exists between the situation and the equation used to solve the problem. Students should be asked to critique the reasoning of others by analyzing the set-up and conversion process they did to find the solution as well as the interpretation of the solution in context. Having students explain any mistakes or misconceptions and correct them can be very beneficial to deepening the level of understanding as well.
Revised July 31, 2019 52

Trigonometric Functions (F.TF) M3.F.TF.A.1 (Supporting Content) Understand and use radian measure of an angle. M3.F.TF.A.1a Understand radian measure of an angle as the length of the arc on the unit circle subtended by the angle. M3.F.TF.A.1b Use the unit circle to find sin θ, cos θ, and tan θ when θ is a commonly recognized angle between 0 and 2𝜋𝜋. Scope and Clarifications: Commonly recognized angles include all multiples n π/6 and n π /4, where n is an integer. There are no assessment limits for this standard. The entire standard is assessed in this course.
Evidence of Learning Statements Students with a level 1 understanding of this standard will most likely be able to:
Students with a level 2 understanding of this standard will most likely be able to:
Students with a level 3 understanding of this standard will most likely be able to:
Students with a level 4 understanding of this standard will most likely be able to:
Identify and label the degree measure of commonly recognized angles between 0 and 360 degrees on the unit circle, when given a plotted point on the unit circle. Identify and label the radian measure of 𝜋𝜋/2, 𝜋𝜋, 3𝜋𝜋/2, and 2𝜋𝜋 on the unit circle, when given a degree measure. Identify the sine, cosine, and tangent of both acute angles, given all three sides of a right triangle. Convert between radian and degree measure using the ratio of 𝜋𝜋
180 or
180𝜋𝜋
.
Choose an appropriate definition for a radian measure of an angle is equal to the ratio of the length of the subtended arc of the angle to the radius. Identify and label the radian measure of commonly recognized angles between 0 and 2𝜋𝜋 on the unit circle. Identify the sin θ, cos θ, and tan θ, where θ is a commonly recognized angle between 0 and 2𝜋𝜋, given the coordinates of a point on the unit circle.
Explain that a radian measure of an angle is equal to the ratio of the length of the subtended arc of the angle to the radius. Draw a unit circle to represent θ and find sin θ, cos θ, and tan θ, given a common radian measure for θ.
Choose the radian measure of the central angle formed by the arc, given a circle of radius other than 1 and an arc length that is a whole number multiple of the radius. Find csc θ, sec θ, and cot θ where θ is a commonly recognized angle between 0 and 2𝜋𝜋.
Instructional Focus Statements
Revised July 31, 2019 53

Level 3:
Previously, students learned how to measure angles in degrees. Integrated Math III this concept shifts to describing angles of rotation about a point using radians. Radians should be introduced as the number of radius lengths it would take to get from (1, 0) to a specified point on the unit circle (going along the circumference). It can be shown that it takes a little over 3 radians to get from (1, 0) to (-1, 0) on unit circle, which is 180 degrees. In fact, it takes exactly 𝜋𝜋 radius lengths or 𝜋𝜋 radians. Therefore, 180 degrees is equivalent to 𝜋𝜋 radians. Students should make the connection between fractions of 180 degrees and fractions of 𝜋𝜋. For example, 30 degrees is a sixth of 180 degrees and thus, is 𝜋𝜋/6 radians. Students should identify commonly recognized angles in the first quadrant of the unit circle and use multiples of those to describe angles in the other three quadrants. Radian measure, instead of degree measure, will be used to solve problems with greater efficiency in future courses. In geometry, students are introduced to special right triangles, 45°-45°-90° and 30°-60°-90°, and define trigonometric ratios. In Integrated Math III instruction should extend a students' knowledge of special right triangles to construct the x and y coordinates on the unit circle. Given this information, students will find the cosine and sine of each commonly recognized angle. Special attention should put on the simplicity of using a circle with radius 1, as cos θ = x/r and sin θ = y/r become simply cos θ = x and sin θ = y. However, students should recognize that all circles would have these same properties since all similar right triangles having the same side ratios. Fluency with trigonometric ratios of commonly recognized angles will aid students in graphing trigonometric functions in future courses, as well as, solve problems involving trigonometric functions. Level 4:
In addition to seeing the unit circle as a set of points on the coordinate plane and instruction should focus on helping students visualize the cosine and sine of each angle as the legs of the special right triangles formed by the origin and the point. This will allow students to see the mathematics instead of memorizing values. Students at this level can use their knowledge of the unit circle to find the value of the reciprocal trigonometric functions as well. In addition, students with a deep understanding of this standard can calculate the radian measure when the given circle has a radius other than 1.
Revised July 31, 2019 54

Standard M3.F.TF.A.2 (Supporting Content) Explain how the unit circle in the coordinate plane enables the extension of trigonometric functions to all real numbers, interpreted as radian measures of angles traversed counterclockwise around the unit circle. Scope and Clarifications: There are no assessment limits for this standard. The entire standard is assessed in this course.
Evidence of Learning Statements Students with a level 1 understanding of this standard will most likely be able to:
Students with a level 2 understanding of this standard will most likely be able to:
Students with a level 3 understanding of this standard will most likely be able to:
Students with a level 4 understanding of this standard will most likely be able to:
Identify the degree measure of commonly recognized angles between 0 and 360 degrees on the unit circle Identify the radian measure of commonly recognized angles between 0 and 2𝜋𝜋 on the unit circle. Find the two missing side lengths, given one side length of a 45°-45°-90° or 30°-60°-90° special right triangle.
Identify the degree measure of angles coterminal to commonly recognized angles on the unit circle. Identify the radian measure of angles coterminal to commonly recognized angles on the unit circle.
Explain why coterminal angles have the same sine, cosine, and tangent values. Explain how the unit circle can be used to find the sine, cosine, and tangent of all real numbers. Identify sin θ, cos θ, and tan θ when θ is coterminal to a commonly recognized angle on the unit circle, given a graphical representation of theta.
Find sin θ, cos θ, and tan θ given θ is coterminal to commonly recognized angle on the unit circle. Identify multiple angle measures that would have a given sine, cosine, or tangent value and explain why there could be more than one answer. Identify the degree measure of negative angles coterminal to commonly recognized angles on the unit circle. Identify the radian measure of negative angles coterminal to commonly recognized angles on the unit circle
Revised July 31, 2019 55
Instructional Focus Statements
Level 3:
Standard M3.F.TF.1 focuses on developing the unit circle and identifying the degree measure, radian measure, sine, cosine, and tangent for all commonly recognized angles between 0 and 2𝜋𝜋. Once students understand the values on the unit circle, instruction should shift for M3.F.TF.2 towards expanding the unit circle to all real numbered values of theta. In particular, students should identify angles that are coterminal to those on the unit circle and understand how a single point represents multiple angles of rotation (an infinite amount actually). This includes angles greater than 2𝜋𝜋 that are coterminal to commonly recognized angles in the unit circle. It is also important that students know that there are an infinite number of angles in between the commonly recognized angles, which together, extends trigonometric functions to all real numbers. Instruction should help students notice the periodic nature of trigonometric functions that results from extending the domain to all real numbers. In future courses, students will build on their understanding to graph trigonometric functions and understand why the graphs have a domain of all real numbers and why the graph is periodic. Level 4:
As students develop a deep understanding of this standard, they should have opportunities to discover patterns in the unit circle. For example, students can investigate even and odd multiples of 𝜋𝜋 to generalize the cosine, sine, and tangent of both sets of angles. Students may notice that the sine and tangent of any integer multiple of 𝜋𝜋 is 0, odd multiples have a cosine of -1, or even multiples have a cosine of 1. They can then use their understanding to find certain values, such as sin (43pi) or cos (-16pi) to solve problems. In addition, students at this level should extend their understanding of coterminal angles to include negative angles when measuring clockwise on the unit circle.
Revised July 31, 2019 56

Standard M3.F.TF.B.3 (Supporting Content) Know and use trigonometric identities to find values of trig functions. M3.F.TF.B.3a Given a point on a circle centered at the origin, recognize and use the right triangle ratio definitions of sin θ, cos θ, and tan θ to evaluate the trigonometric functions. M3.F.TF.B.3b Given the quadrant of the angle, use the identity sin2 θ + cos2 θ = 1 to find sin θ given cos θ, or vice versa. Scope and Clarifications: Commonly recognized angles include all multiples n π/6 and n π/4, where n is an integer. There are no assessment limits for this standard. The entire standard is assessed in this course.
Evidence of Learning Statements Students with a level 1 understanding of this standard will most likely be able to:
Students with a level 2 understanding of this standard will most likely be able to:
Students with a level 3 understanding of this standard will most likely be able to:
Students with a level 4 understanding of this standard will most likely be able to:
Use the Pythagorean theorem to find the exact value of the third side, given two sides of a right triangle. Find sin θ given cos θ, or vice versa, given the Pythagorean identity sin2 θ + cos2 θ = 1 and the quadrant of θ.
Evaluate the other two trigonometric functions for the same angle, given the sine, cosine, or tangent of an angle, Know the Pythagorean identity sin2 θ + cos2 θ = 1
Recognize and use the right triangle ratio definitions of sin θ, cos θ, and tan θ to evaluate the trigonometric functions, given a point on a circle centered at the origin. Know and use the identity sin2 θ +cos2 θ = 1 to find sin θ given cos θ, or vice versa, given the quadrant of θ.
Recognize and use the right triangle ratio definitions of csc θ, sec θ, and cot θ to evaluate the trigonometric functions, given a point on a circle centered at the origin. Use properties from the unit circle and the Pythagorean theorem to explain the Pythagorean identity sin2 θ + cos2 θ = 1.
Instructional Focus Statements
Level 3:
In Geometry, students find missing side lengths using the Pythagorean Theorem and trigonometry functions. In Algebra II, this skill is transferred to the context of the unit circle. By drawing the reference triangle for the given point on a circle centered at the origin, students can label the legs of the triangle using the coordinates and thus, find the tan θ. Finding the hypotenuse using the Pythagorean theorem enables students to also evaluate the sin θ and cos θ. Because students are describing trigonometric functions instead of just side lengths, both positive and negative values are now appropriate based on the given trigonometric function and quadrant. By relating cos θ to 𝑥𝑥 and sin θ to 𝑦𝑦, students should be able to assign the correct sign without Revised July 31, 2019 57

memorizing which trigonometric functions are positive and negative in each quadrant. In future courses, students will use this concept in various situations, including converting from Cartesian coordinates to polar coordinates. Students can use similar ideas to find the sin θ given the cos θ, and vise versa. However, there is a unique relationship between sin θ and cos θ that can be used more efficiently. As cos θ is 𝑥𝑥, or the horizontal leg of the reference triangle, sin θ is 𝑦𝑦, or the vertical leg of the reference triangle, and the hypotenuse is 1, the Pythagorean theorem can be applied to these three side lengths. This produces sin2 θ + cos2 θ = 1. Because|𝑎𝑎| = 𝑎𝑎2, this equation is true in all quadrants and even if θ lies on an axis. This equation can be easily displayed by trying examples of commonly recognized angles that students
know from the unit circle. For example, for 𝜋𝜋/6, this would be �12�2
+ �√32 �
2= 1
4 + 34 = 1. This is known as one of the Pythagorean identities. This
trigonometric identity, along with others, will be frequently used in future courses as students simplify trigonometric expressions. Level 4:
As students develop a deep understanding of this standard, they should be able to explain the Pythagorean identity and how it can be used. In addition, as students study the unit circle, they should begin to recognize relationships between trigonometric values in the unit circle. For instance, students may recognize other identities such as cos (-θ) = cos (θ), sin (-θ) = -sin (θ), and sin (θ) = cos (90 - θ). As students discover these patterns, they can then use these identities to evaluate trigonometric functions more efficiently.
Revised July 31, 2019 58

Congruence (G.CO)
Standard M3.G.CO.A.1 (Supporting Content) Make formal geometric constructions with a variety of tools and methods (compass and straightedge, string, reflective devices, paper folding, dynamic geometric software, etc.). Scope and Clarifications: Constructions include but are not limited to: copying a segment; copying an angle; bisecting a segment; bisecting an angle; constructing perpendicular lines, including the perpendicular bisector of a line segment; constructing a line parallel to a given line through a point not on the line, and constructing the following objects inscribed in a circle: an equilateral triangle, square, and a regular hexagon.
Evidence of Learning Statements Students with a level 1 understanding of this standard will most likely be able to:
Students with a level 2 understanding of this standard will most likely be able to:
Students with a level 3 understanding of this standard will most likely be able to:
Students with a level 4 understanding of this standard will most likely be able to:
Define congruency and recognize symbols that indicate congruent line segments or symbols in a picture. Define bisect and recognize symbols that indicate a bisected line segment or angle in a picture. Define parallel and perpendicular and recognize symbols that indicate parallel and perpendicular lines in a picture.
Understand that copying a segment or angle means creating an exact replica that is congruent to the original. Understand that a bisector lies exactly in the middle of a figure. Use a compass to construct circles and curves. Define a circle, equilateral triangle, square, and regular hexagon.
Develop methods using a variety of appropriate tools (compass, straightedge, string, reflective device, paper folding, etc.) to precisely construct geometric objects such as a perpendicular bisector and parallel lines. Use the virtual compass and line tool in dynamic geometry software to construct various geometric objects. Construct an equilateral triangle, square, and regular hexagon in a circle using appropriate tools such as a compass, straightedge, paper folding, graph paper, etc.
Compare various constructions to determine similarities and differences (ie. bisecting a segment and bisecting and angle). Write an informal or formal proof using precise math vocabulary why these construction methods work using the geometric relationships between the objects in the construction.
Revised July 31, 2019 59
Students with a level 1 understanding of this standard will most likely be able to:
Students with a level 2 understanding of this standard will most likely be able to:
Students with a level 3 understanding of this standard will most likely be able to:
Students with a level 4 understanding of this standard will most likely be able to:
Explain informally why and how these construction methods work. Understand the importance of precision in these constructions. Attend to precision when performing geometric constructions.
Instructional Focus Statements
Level 3:
Students must be allowed to develop a method to make these constructions rather than be given specific instructions to follow. They will need a basic understanding of the expected outcome. However, it is through the process of the construction and particularly developing the method that students will develop a deeper understanding of the properties of these objects. Students will want to use a ruler to bisect a line segment or a protractor to bisect an angle, but when performing these formal constructions, students should not use tools that measure. Instead they need to focus on the properties of the figures in the construction. Likewise, when students are using the dynamic geometry software, they should avoid using the automatic commands for bisecting or copying and use the virtual compass and line tool instead. Precision is essential in performing these constructions or they will not work. For example, a perpendicular bisector construction may not end up exactly in the middle or perpendicular. Dynamic geometry software may help students perform the constructions precisely, particularly for students who struggle with using the tools precisely, but they need to also experience other methods. Developing the process of the methods is equally important for developing the understanding of the properties. Therefore, it is important that students be required to show their understanding by informally explaining what the methods used does and why it works. Level 4:
The different constructions have some similarities. Allowing students to compare the methods for the different constructions to find those similarities will help them develop a deeper understanding of what makes them work. It will also help students better realize the importance of precision. This will in turn help students develop a more formal proof of the fact that each method works.
Revised July 31, 2019 60

Circles (G.C) Standard M3.G.C.A.1 (Supporting Content) Recognize that all circles are similar. Scope and Clarifications: There are no assessment limits for this standard. The entire standard is assessed in this course.
Evidence of Learning Statements Students with a level 1 understanding of this standard will most likely be able to:
Students with a level 2 understanding of this standard will most likely be able to:
Students with a level 3 understanding of this standard will most likely be able to:
Students with a level 4 understanding of this standard will most likely be able to:
Define a circle. Identify the center and radius of a circle. Use transformations to define similar figures.
Apply dilations to segments. Apply translations to points and segments. Recognize when translations and dilations have been applied to a circle. Explain the relationship between the original figure and the transformed figure. Understand that the length of the radius is what determines the size of the circle.
Recognize any two circles are similar. Explain in terms of transformations and by the definition of similar figures why any two circles are similar. Construct similar circles using dynamic geometry software or traditional tools.
Develop a logical argument using transformations conjecturing why any two circles can be proven similar. Draw conclusions about real-world problems using similarity between circles. Explain real-world phenomena using the relationship of similarity between circles. Explore and conjecture about the similarity of other curvilinear figures.
Instructional Focus Statements
Level 3:
Students begin understanding and describing the effects of transformations on two dimensional figures in the grade 8. Foundationally, the standard 8.G.A.2 requires students to describe the effect of dilations, translations, rotations, and reflections on two dimensional figures using coordinates which
Revised July 31, 2019 61

prepares students to apply similarity in terms of transformations to figures. Through the study of transformations students should be able to recognize that all circles are similar. Instruction should focus on giving students the opportunity to explore similarity in terms of transformations that will relate two circles. This is an excellent opportunity to allow students time to utilize dynamic geometry software or traditional tools to construct similar circles through transformations. When circles share the same center, students can perform a dilation on the radius and draw conclusions about the resulting transformed circle. Furthermore, when circles do not share the same center, students can perform translations and dilations on one circle so that it maps onto the other and draw conclusions about their similarity. These two experiences should lead students to the understanding that all circles are similar and can be explained in terms of transformations. Instruction of similarity in terms of transformations is much more conducive to student understanding because the similarity definition that relies on the measures of angles and sides cannot be applied to circles. While circles do not have angles and sides, students should recognize that the length of the radius is what determines the size of a circle, while they all have the same shape (by the definition of a circle). Level 4:
Instruction should allow students time to utilize dynamic geometry software or traditional tools to develop logical arguments about why all circles can be proven similar to one another. The use of manipulatives will help students lay the foundation for proving circles are similar. Instruction at this level should also provide students the opportunity to explore other curvilinear figures and develop conjectures about their similarity. Furthermore, instruction should provide students with circles in real-world context and ask them to make observations and draw conclusions about the modeled phenomena.
Revised July 31, 2019 62
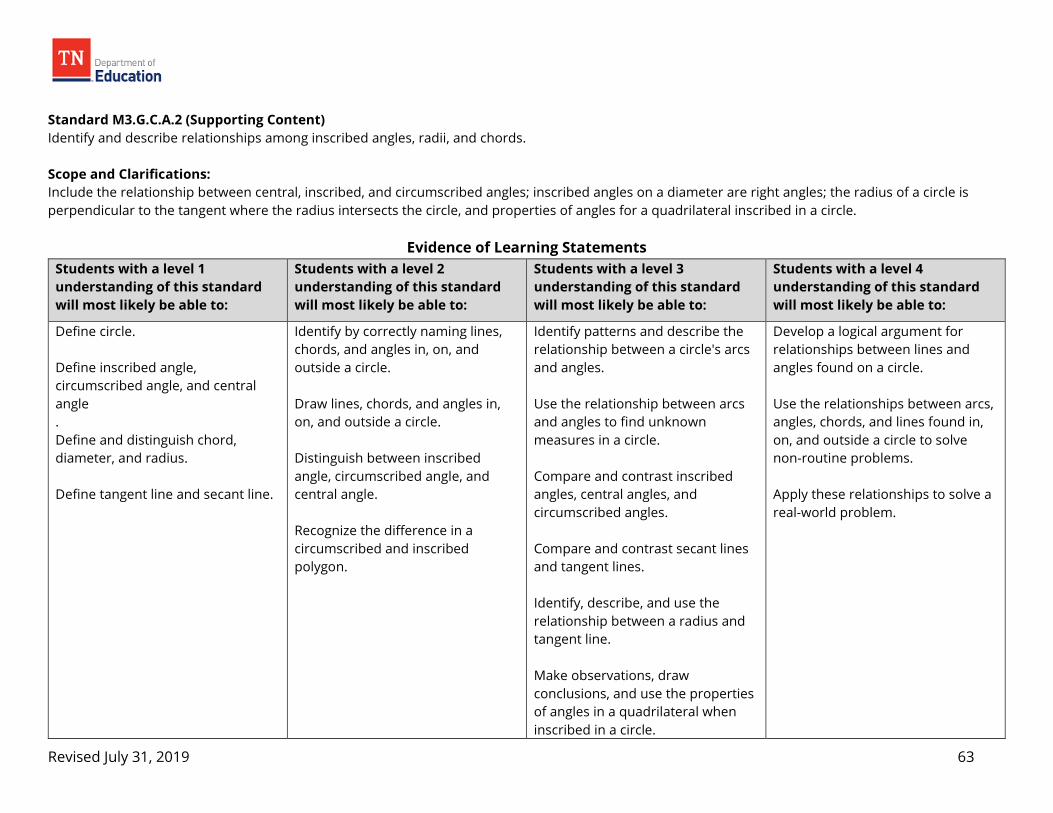
Standard M3.G.C.A.2 (Supporting Content) Identify and describe relationships among inscribed angles, radii, and chords. Scope and Clarifications: Include the relationship between central, inscribed, and circumscribed angles; inscribed angles on a diameter are right angles; the radius of a circle is perpendicular to the tangent where the radius intersects the circle, and properties of angles for a quadrilateral inscribed in a circle.
Evidence of Learning Statements Students with a level 1 understanding of this standard will most likely be able to:
Students with a level 2 understanding of this standard will most likely be able to:
Students with a level 3 understanding of this standard will most likely be able to:
Students with a level 4 understanding of this standard will most likely be able to:
Define circle. Define inscribed angle, circumscribed angle, and central angle . Define and distinguish chord, diameter, and radius. Define tangent line and secant line.
Identify by correctly naming lines, chords, and angles in, on, and outside a circle. Draw lines, chords, and angles in, on, and outside a circle. Distinguish between inscribed angle, circumscribed angle, and central angle. Recognize the difference in a circumscribed and inscribed polygon.
Identify patterns and describe the relationship between a circle's arcs and angles. Use the relationship between arcs and angles to find unknown measures in a circle. Compare and contrast inscribed angles, central angles, and circumscribed angles. Compare and contrast secant lines and tangent lines. Identify, describe, and use the relationship between a radius and tangent line. Make observations, draw conclusions, and use the properties of angles in a quadrilateral when inscribed in a circle.
Develop a logical argument for relationships between lines and angles found on a circle. Use the relationships between arcs, angles, chords, and lines found in, on, and outside a circle to solve non-routine problems. Apply these relationships to solve a real-world problem.
Revised July 31, 2019 63

Students with a level 1 understanding of this standard will most likely be able to:
Students with a level 2 understanding of this standard will most likely be able to:
Students with a level 3 understanding of this standard will most likely be able to:
Students with a level 4 understanding of this standard will most likely be able to:
Formulate conjectures and generalize findings about the relationships between angles, arcs, chords, and lines in, on, and outside a circle. Justify conjectures and use precise language.
Instructional Focus Statements
Level 3:
This standard encompasses many relationships between angles, arcs, chords, and lines found in, on, and outside a circle. Instruction should provide students ample opportunity to explore and discover these relationships. Allow students to make observations, conjecture, and justify their conjectures. Giving students the opportunity to explore, predict, and develop their own understanding of these relationships is much more beneficial than being shown a proof of the relationship. This standard lends itself well to exploration through dynamic geometry software so students can make observations about the relationships in a fluid environment. This will allow students to conjecture, test, and develop logical arguments about the relationships. Instruction should require students to attend to precision in measuring and use precise mathematical language. The next standard in this cluster, G.C.A.3, will require students to extend their knowledge of inscribed angles and circumscribed angles when exploring an incenter and circumcenter of a triangle. Level 4:
Students at this level should focus on developing logical arguments, potentially leading into an informal proof of the relationships found in, on, and outside a circle with arcs, angles, chords, and lines. Students should be given the opportunity to use these relationships to solve for unknown values in a complex drawing where applying a variety of relationships is necessary to find all of the missing values. Furthermore, instruction should provide students problems with real-world context so that students see the benefit in knowing and being able to apply these relationships. For example, students should use these relationships to determine the location of buildings, designing the appropriate location for appliances in a kitchen remodel, or points of interest on a city map and justify the location with mathematical reasoning.
Revised July 31, 2019 64

Standard M3.G.C.A.3 (Supporting Content) Construct the incenter and circumcenter of a triangle and use their properties to solve problems in context. Scope and Clarifications: There are no assessment limits for this standard. The entire standard is assessed in this course.
Evidence of Learning Statements Students with a level 1 understanding of this standard will most likely be able to:
Students with a level 2 understanding of this standard will most likely be able to:
Students with a level 3 understanding of this standard will most likely be able to:
Students with a level 4 understanding of this standard will most likely be able to:
Define angle bisector and perpendicular bisector. Identify an angle bisector and perpendicular bisector in a drawing. Identify symbols used to indicate an angle bisector or a perpendicular bisector.
Bisect an angle and construct a perpendicular bisector using a compass, tracing paper, or dynamic geometry software. Recognize a point of intersection between angle bisectors or perpendicular bisectors.
Use a compass and/or dynamic geometry software to construct a triangle's incenter and circumcenter. Identify equal distances formed from the incenter and circumcenter. Know and use the properties of a triangle's incenter to find unknown measures in a figure. Know and use the properties of a triangle's circumcenter to find unknown measures in a figure. Solve real-world problems involving a triangle's incenter and circumcenter.
Create a real-world problem using properties of a triangle's incenter and circumcenter. Make observations about the relationship between an incenter and an inscribed triangle and a circumcenter and a circumscribed triangle.
Revised July 31, 2019 65
Instructional Focus Statements Level 3:
This standard allows students to see the connection between challenging geometrical concepts and real-world context. Instruction should provide students ample opportunity to utilize their construction skills both with a compass and with dynamic geometry software in order to explore the relationship between a triangle's angle bisectors and a triangle's perpendicular bisectors. It is important to prevent students from using a ruler or protractor in these constructions so that they complete the formal construction appropriately and not by estimating the center through measurement. Students should have the opportunity to discover that the angle bisectors in any triangle intersect to form a point of concurrency called an incenter, and students should also discover that the perpendicular bisectors of any triangle intersect to form a point of concurrency called a circumcenter. It is imperative students see this relationship in a fluid, dynamic environment in order to convince themselves this relationship holds true despite how the triangle's sides and angles are manipulated. Furthermore, students should then explore and find equal distances from the point of concurrency to the sides or vertices of the triangle. Other explorations might include how the incenter divides the lengths of the angle bisector and the distance of points located on a perpendicular bisector in relation to the endpoints on the side of the triangle it is bisecting. Instruction should require students to attend to precision in measuring so that students can recognize that an incenter is equidistant to the sides of a triangle when measured perpendicularly and that a circumcenter is equidistant to the vertices of a triangle. Once students have had ample opportunity to explore and construct an incenter and a circumcenter with a variety of different types of triangles, students should then use these properties to find unknown values in a real-world context. Instruction should provide students with many applications of these special centers and require students to make decisions about appropriately locating points of interest on a map in order to meet certain guidelines. For instance, students should have to grapple with directing a community decision on where to build a park so that it is equidistant from three elementary schools. This standard is an excellent opportunity for students to apply mathematical truths in a real-world context. Level 4:
Instruction should give students the opportunity to apply the relationships of an incenter and a circumcenter to explore these mathematical truths to a real-world problem. This standard serves as a great opportunity to develop a relationship with industry or community organizations to model a problem they are potentially facing and help them make an informed decision about the location of a point of interest. For instance, an industrial company in the area may be trying to decide the best location on the premises for a water bottle refill station. Students could develop a logical argument using their knowledge of incenters and circumcenters to help the company decide the best location for the water bottle refill station so that it is convenient to many departments. Furthermore, instruction should guide students toward making connections between these points of concurrency and the center of an inscribed or circumscribed circle.
Revised July 31, 2019 66

Standard M3.G.C.B.4 (Supporting Content) Know the formula and find the area of a sector of a circle in a real-world context. Scope and Clarifications: For example, use proportional relationships and angles measured in degrees or radians. There are no assessment limits for this standard. The entire standard is assessed in this course.
Evidence of Learning Statements Students with a level 1 understanding of this standard will most likely be able to:
Students with a level 2 understanding of this standard will most likely be able to:
Students with a level 3 understanding of this standard will most likely be able to:
Students with a level 4 understanding of this standard will most likely be able to:
Recognize a sector is formed by two rays of a central angle and the subtended arc. Calculate the area of a circle. Define and recognize a central angle on a circle.
Recognize a sector as a part of the whole measure of the area of a circle. Identify the measure of the degrees of a central angle of the sector as a part of the whole 360 degrees. Identify the measure of the radians of a central angle of the sector as a part of the whole 2𝜋𝜋 radians.
Represent the measure of a sector as a fraction of degrees or a fraction of radians. Explain that the formula for area of a sector is a fraction of the circle's whole area. That is, the fraction of the circle multiplied by 𝜋𝜋𝑟𝑟2. Recognize the need for finding the area of fractional portions of a circle in a real-world context. Identify a sector in context of a real-world problem. Know and use the formula to find the area of a sector in a real-world context.
Create a real-world context that requires finding the area of a sector. Critique others' solutions and identify any errors in reasoning, misconceptions, misrepresentation of the fractional form, or errors in formula. Explore finding the area of a segment of a circle. Explore how to modify the formula for area of a sector to find arc length.
Revised July 31, 2019 67

Instructional Focus Statements Level 3:
Instruction should guide students into recognizing that a sector is simply a fractional piece of the whole circle. Students should make use of the fact that since a sector is a fraction of the circle, then the area of a sector is a fraction of the circle's area. Instruction should encourage students to generalize the formula for area of a sector instead of memorize it. Students should see the conceptual relationship between the fractional piece of the circle and the circle's whole area. Then students can use the formula or conceptual understanding to calculate the area of sectors represented in a real-world context. It is important to note this is the first time students will be using radians to measure angles. Instruction should provide an opportunity for students to realize radians is another way to measure angles and arcs. Radians will be developed further in Algebra II, but students need a basic understanding of them now in order to connect to the concept of this standard. Instruction should develop students' understanding that a circle has 2𝜋𝜋 radians which is equivalent to 360 degrees. Show students what a quarter, a half, and three-quarters of 2𝜋𝜋 is so students become more familiar with the notation of radians. Instruction should help students realize that central angles measured in radians are a portion of 2𝜋𝜋 just like central angles measured in degrees are a portion of 360 degrees. Level 4:
Students at this level of understanding should be given the opportunity to see and hear others' solution of the area of a sector and be required to critique their reasoning and identify errors or misconceptions. Instruction should provide students with incorrect examples so students can identify errors in reasoning, misconceptions, misrepresentation of the fractional form, or errors in using the formula. This is a great opportunity to provide students the experience of this concept in a real-world setting by finding their own example of the need for the area of a sector. An excellent extension of this standard is the exploration of finding the area of a segment of a circle. Students should be allowed to discover that they will need to compute the area of the sector and then subtract the area of the included triangle in the sector. This standard also easily extends to other geometrical truths like arc length. Provide examples of arc length and ask students to generalize a formula similar to the formula for area of a sector.
Revised July 31, 2019 68
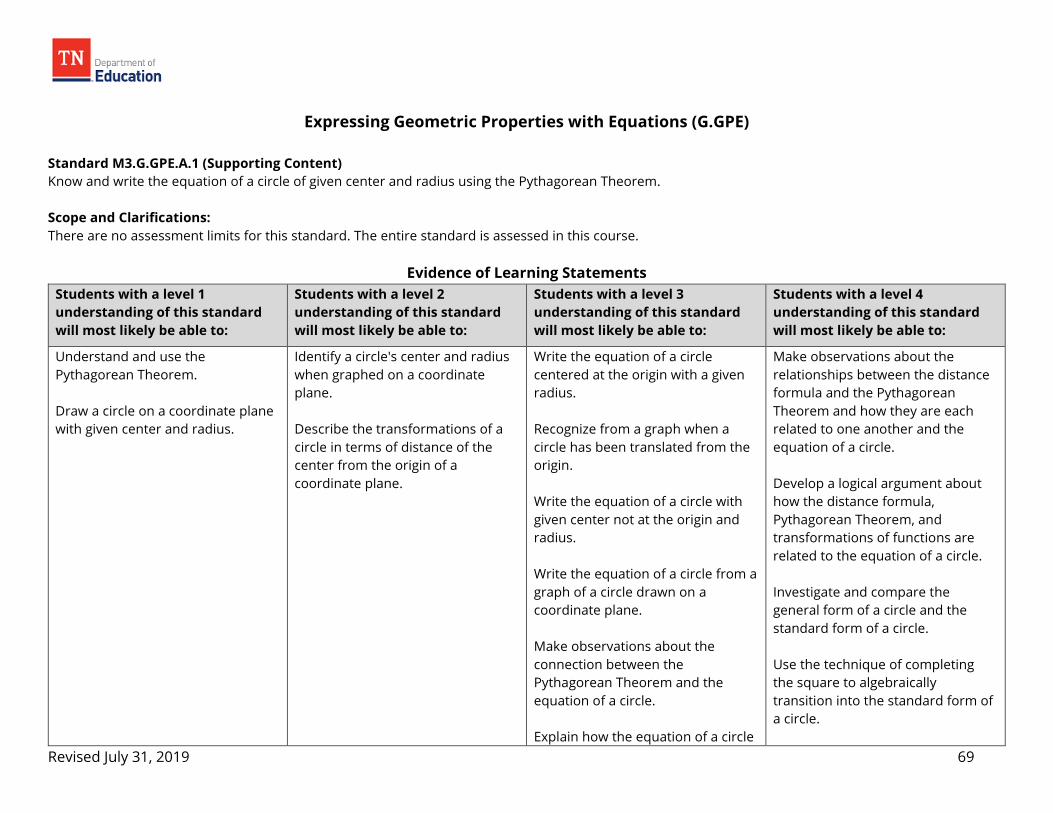
Expressing Geometric Properties with Equations (G.GPE)
Standard M3.G.GPE.A.1 (Supporting Content) Know and write the equation of a circle of given center and radius using the Pythagorean Theorem. Scope and Clarifications: There are no assessment limits for this standard. The entire standard is assessed in this course.
Evidence of Learning Statements Students with a level 1 understanding of this standard will most likely be able to:
Students with a level 2 understanding of this standard will most likely be able to:
Students with a level 3 understanding of this standard will most likely be able to:
Students with a level 4 understanding of this standard will most likely be able to:
Understand and use the Pythagorean Theorem. Draw a circle on a coordinate plane with given center and radius.
Identify a circle's center and radius when graphed on a coordinate plane. Describe the transformations of a circle in terms of distance of the center from the origin of a coordinate plane.
Write the equation of a circle centered at the origin with a given radius. Recognize from a graph when a circle has been translated from the origin. Write the equation of a circle with given center not at the origin and radius. Write the equation of a circle from a graph of a circle drawn on a coordinate plane. Make observations about the connection between the Pythagorean Theorem and the equation of a circle. Explain how the equation of a circle
Make observations about the relationships between the distance formula and the Pythagorean Theorem and how they are each related to one another and the equation of a circle. Develop a logical argument about how the distance formula, Pythagorean Theorem, and transformations of functions are related to the equation of a circle. Investigate and compare the general form of a circle and the standard form of a circle. Use the technique of completing the square to algebraically transition into the standard form of a circle.
Revised July 31, 2019 69

Students with a level 1 understanding of this standard will most likely be able to:
Students with a level 2 understanding of this standard will most likely be able to:
Students with a level 3 understanding of this standard will most likely be able to:
Students with a level 4 understanding of this standard will most likely be able to:
can be derived from the Pythagorean Theorem.
Instructional Focus Statements
Level 3:
This standard ties together the work students have been doing to understand the Pythagorean Theorem and the precise definition of a circle. The cluster of standards that cover the Pythagorean Theorem are focus standards for grade 8, and students develop the precise definition of a circle in standard G.CO.A.1. It is important for instruction to make the connection between these two concepts and should first be introduced to students by examining a circle graphed on a coordinate plane and centered at the origin. Instruction should guide students through a series of questions asking students to make connections between the points on a circle and the center and grapple with how they know points lie on a circle's edge. It may be helpful for the teacher to draw in a right triangle and translate it around the circle so students can make the connection between the hypotenuse of the right triangle and the radius of the circle as well as the legs of the right triangle and the coordinates of the points that lie on the circle's edge. Hence, connecting the Pythagorean Theorem to the formal definition of a circle. This exploration should help students generalize the standard form of the equation of a circle and understand its derivation. Instruction should require students to explain the connection of the Pythagorean Theorem and the equation of a circle to peers. After students have formulated the equation of a circle, instruction should present students with circles graphed on a coordinate plane that are not centered at the origin. Students should then explore how the translations effect the standard form of the equation of the circle. This is an excellent opportunity for instruction to connect to students' prior knowledge of transformations of functions from their study of the standard F.BF.B.2 in Algebra I. Instruction should help students see the relationship between the center of the circle (not at the origin) and the origin itself. For instance, a circle centered at (2, 1) is two horizontal units away from the origin and one vertical unit away from the origin. Instruction should connect this graphical relationship to the structure of the equation of the circle. These connections will help students be able to explain the relationship of the Pythagorean Theorem to the standard form of the equation of a circle (𝑥𝑥 − ℎ)2 + (𝑦𝑦 − 𝑘𝑘)2 = 𝑟𝑟2 and use that relationship to write the equation of a circle given center (ℎ, 𝑘𝑘) and radius, 𝑟𝑟. This strong foundation of understanding the Pythagorean Theorem and the equation of a circle will serve useful as students explore trigonometric functions and the unit circle. Level 4:
Students at this level can build on their knowledge of the equation of a circle by investigating the relationship between the Pythagorean Theorem and the distance formula. Students should be provided opportunities to explore both and make connections to how these two concepts are also related to
Revised July 31, 2019 70

transformations of functions. Furthermore, students should explore the general form of the equation of a circle: 𝑥𝑥2 + 𝑦𝑦2 + 𝐶𝐶𝑥𝑥 + 𝐷𝐷𝑦𝑦 + 𝐸𝐸 = 0 by multiplying the factors in standard form: (𝑥𝑥 − ℎ)2 + (𝑦𝑦 − 𝑘𝑘)2 = 𝑟𝑟2. Instruction should provide opportunities for students to make generalizations and draw conclusions about the relationship between the two forms. This is an excellent opportunity for students to see how their skills in completing the square from A1.A.REI.B.3.b can be used to interpret efficiently between the two equations of a circle.
Revised July 31, 2019 71

Standard M3.G.GPE.B.2 (Major Work of the Grade) Use coordinates to prove simple geometric theorems algebraically. Scope and Clarifications: For example, prove or disprove that a figure defined by four given points in the coordinate plane is a rectangle; prove or disprove that the point (1,√3 ) lies on the circle centered at the origin and containing the point (0, 2). There are no assessment limits for this standard. The entire standard is assessed in this course.
Evidence of Learning Statements Students with a level 1 understanding of this standard will most likely be able to:
Students with a level 2 understanding of this standard will most likely be able to:
Students with a level 3 understanding of this standard will most likely be able to:
Students with a level 4 understanding of this standard will most likely be able to:
Know the properties of a given geometric figure. Recognize a geometric figure based on its properties.
Find measures, lengths, or distances from a given figure on a coordinate plane. Use algebraic notation or expressions to represent coordinates or measures on a coordinate plane. Know the conditions necessary for applying a geometric theorem to a figure. Logically organize an informal proof to justify a geometric theorem algebraically. Write an informal explanation of a geometric theorem.
Identify what measures will be needed in order to prove a geometric theorem. Justify properties of geometric figures algebraically using coordinates. Recognize when a geometric theorem is applicable to a given figure and use it appropriately in a proof. Prove geometric theorems algebraically using notation or expressions that represent coordinates or measures on a coordinate plane.
Analyze and critique proofs written by others by either verifying the logic and language for accuracy and precision or providing counterexamples that disprove the argument. Improve their own proofs based on what they have seen from others' proofs. Use coordinates to prove complex geometric theorems algebraically.
Revised July 31, 2019 72

Instructional Focus Statements Level 3:
Students will likely begin this standard with the prior knowledge of using geometric theorems, but it is unlikely students have spent much time proving them. However, in grade 8 students explored the proof of the Pythagorean Theorem, so instruction should build off of that experience and extend to other geometric theorems. Instruction should provide students with the opportunity to explore geometric theorems at play on a coordinate plane. Students may struggle with representing important lengths, measures, or coordinates abstractly, so teachers should allow students the opportunity to grapple with how to represent geometric measures algebraically using coordinates. Instruction should provide students with a variety of contexts that utilize different properties of geometric figures. This standard is an excellent opportunity to help students see the vital connection between Algebra and Geometry. Give students ample opportunity to demonstrate algebraically and justify through proof why a particular geometric theorem holds true on a coordinate plane. During instruction, students should reason quantitatively and make generalizations about coordinates, the algebraic representation of measures of a figure, and geometric theorems. Coordinate proofs should be taught simultaneously with other types of proofs such as paragraph proofs, two-column proofs, etc. This will help students see proofing has many avenues with which to accomplish it. It is imperative students be required to use precise mathematical language and make use of the structure on the coordinate plane to aide them in their proof writing. Level 4:
Instruction at this level should provide the opportunity for students to fine tune their proof writing skills by analyzing other proofs and critiquing them to find best practices in proof writing. Students should then apply what they learned through the analysis to improve their own proofs. Furthermore, students should be challenged to prove more complex geometric theorems such as Euler's quadrilateral theorem, geometric mean theorem, or Heron's formula.
Revised July 31, 2019 73

Standard M3.G.GPE.B.3 (Major Work of the Grade) Prove the slope criteria for parallel and perpendicular lines and use them to solve geometric problems. Scope and Clarifications: For example, find the equation of a line parallel or perpendicular to a given line that passes through a given point. There are no assessment limits for this standard. The entire standard is assessed in this course.
Evidence of Learning Statements Students with a level 1 understanding of this standard will most likely be able to:
Students with a level 2 understanding of this standard will most likely be able to:
Students with a level 3 understanding of this standard will most likely be able to:
Students with a level 4 understanding of this standard will most likely be able to:
Define parallel lines by discussing properties of slopes and intersections. Identify parallel lines in a picture using symbols or given notation. Define perpendicular by discussing properties of slopes and intersections. Identify perpendicular lines in a picture using symbols or given notation. Recognize slope criteria for parallel lines and perpendicular lines.
Explain how to determine if lines are parallel or perpendicular. Sketch a parallel line or a perpendicular line in a drawing given a point and a line. Use symbolic notation to write a parallel and perpendicular statement. (e.g. 𝐴𝐴𝐴𝐴���� || 𝐶𝐶𝐷𝐷���� or 𝑃𝑃𝑃𝑃���� ⊥ 𝑃𝑃𝑃𝑃����) Informally justify why two lines in a drawing are parallel, perpendicular, or neither. Relate parallel lines and perpendicular lines to geometric problems.
Explain how the slopes of parallel lines are equivalent. Use the translation of the slope triangle (the right triangle formed by horizontal and vertical distances to form a triangle with the line as the hypotenuse) to justify slopes of parallel lines. Explain how the slopes of perpendicular lines are opposite reciprocals. Use the rotation of the slope triangle to justify slopes of perpendicular lines. Prove lines are parallel or perpendicular using slope criteria. Apply the properties of parallel lines and perpendicular lines to solve
Explain and provide examples of the necessity of knowing whether or not lines are parallel or perpendicular in real-world context. Critique the work of others in using and proving slope criteria. Make observations and develop logical arguments about normal lines.
Revised July 31, 2019 74

Instructional Focus Statements
Level 3:
Understanding parallelism and perpendicularity is a vital concept to students' understanding of many different venues in mathematics. These concepts apply to geometric shapes and extend into concepts in Calculus where students will be asked to write the equation of a tangent line. Because conceptual understanding of this standard is so important, instruction should focus on allowing the students to explore and discover the relationship between slopes of parallel lines and slopes of perpendicular lines. It is beneficial to build on students' understanding of transformations, 8.G.A.1, by constructing the slope triangle for a line (i.e. a triangle that demonstrates visually the horizontal distance and the vertical distance used to create the steepness of the line) and translating the slope triangle onto the other line to determine congruence. Students can then conclude that since the slope triangles are congruent, the slope of the hypotenuse (which is a portion of the line) has the same steepness. Students should follow a similar exploration of the slope triangles of perpendicular lines where they discover the slope triangles are congruent by a 90 degree rotation. This rotation results in slopes of the hypotenuse (i.e. a segment of the line) being opposite reciprocals to one another. It is important to help students understand the reasoning behind the properties of the slopes of parallel lines and the perpendicular lines and not just memorize these properties. These explorations will prepare students to begin informally designing proofs and eventually writing their own formal proof of parallel or perpendicular lines. When writing proofs, students must use precise mathematical language and appropriate symbolic representation. This standard is an excellent connection of Geometry and Algebra. Once students understand the reasoning behind the properties of parallel lines and perpendicular lines, they should extend their ability to write equations of lines to writing lines that are parallel to a line at a certain point or perpendicular to a line at a certain point. Instruction should provide students with problems where the student can ascertain the slope from a graph, a table, or from words. Furthermore, students should experience a variety of problems where they must apply the criteria for slope in order to solve a problem.
geometric problems. Write equations of parallel lines or perpendicular lines given a point and a slope. Write equations of parallel lines or perpendicular lines by identifying a point and a slope from a drawing. Use precise mathematical language and symbolic notation to describe parallel and perpendicular lines.
Revised July 31, 2019 75

Level 4:
Instruction should provide students ample opportunity to see the necessity of parallelism and perpendicularity in real-world contexts. Students should be expected to recognize the necessity of proving lines parallel or perpendicular and be able to reason about slopes. Giving students the opportunity to hear the reasoning of how others' applied slope criteria to solve problems and analyze others' proofs can increase their level of understanding. Finally, more in depth instruction could introduce students to the concept of a normal line and present students with problems where they write the equation of a tangent line.
Revised July 31, 2019 76

Standard M3.G.GPE.B.4 (Major Work of the Grade) Find the point on a directed line segment between two given points that partitions the segment in a given ratio. Scope and Clarifications: There are no assessment limits for this standard. The entire standard is assessed in this course.
Evidence of Learning Statements Students with a level 1 understanding of this standard will most likely be able to:
Students with a level 2 understanding of this standard will most likely be able to:
Students with a level 3 understanding of this standard will most likely be able to:
Students with a level 4 understanding of this standard will most likely be able to:
Identify the part in a ratio. Identify the whole in a ratio. Explain the concept of part to whole in a ratio. Find the slope of a segment.
Estimate where a point would lie on a directed line segment given a ratio. Match ratios to partitioned directed line segments. Identify the direction of a line segment in terms of a given ratio. Determine to which endpoint the located point will be closest. Identify the resulting lengths of the partitioned line segment and describe their relationship to the whole segment, given a ratio. Partition a directed line segment on a coordinate plane.
Explain the importance to following the direction of the ratio when partitioning a line segment. Explain what it means to partition a segment into a given ratio. Observe patterns when subdividing line segments and draw conclusions about the effects the ratio has on the segment and its lengths. Use the ratio of vertical change to horizontal change (slope) to find a point that partitions a line segment into a given ratio. Explain the ratio of parts of a segmented line 𝑎𝑎: 𝑏𝑏, as 𝑎𝑎
𝑎𝑎+𝑏𝑏
Partition a directed line segment using a compass.
Make observations and draw conclusions about the cause and effect of different ratios on a directed line segment. Explain how to subdivide a segment given a ratio using precise mathematical vocabulary. Create a real-world problem where partitioning a segment appropriately is critical.
Revised July 31, 2019 77

Instructional Focus Statements Level 3:
This standard requires students to apply their knowledge of ratios in a geometric form by partitioning a directed line segment given a ratio. Instruction should begin with having students to divide a segment on a number line and foster a discussion about what it means to a segment in a given ratio. This is a great opportunity to tie in a real-world connection like the interstate system. Students might be asked to consider a familiar section of interstate and find the midpoint of that section. Students should then be given the opportunity to explore other partitions on that section of interstate. This will help students understand the importance of direction when partitioning and how partitioning effects the lengths of the parts of the segment in regards to the length of the whole segment. This real world connection will allow students to understand the importance of attending to precision when considering the direction of partitioning and allow students to model the partitioning process using mile markers on the interstate. Opportunities should be provided for students to investigate patterns in partitioning a segment on a coordinate plane. This investigation should begin by asking students to find the midpoint and discuss the resulting ratio of 1:1 and the lengths of the parts of the segment to the whole segment. By having students place another midpoint on one of the partitioned segments they can be guided to understanding of this new ratio of 1:3. Explore with students the lengths of the smallest part of the segment to the whole segment and ask advancing questions to help students see the relationship of a ratio 𝑎𝑎: 𝑏𝑏 when comparing lengths as 𝑎𝑎
𝑎𝑎+𝑏𝑏 and 𝑏𝑏
𝑎𝑎+𝑏𝑏. Instruction should also provide students with ample opportunity to explore how applying the slope to the directed
line segment can partition it into a ratio. Students can apply the change in vertical distance and the change in horizontal distance repetitively in order to place the point appropriately to meet the given ratio. To aide students in their visual understanding of partitioning a segment, instruction should show students how to partition with a compass by constructing similar triangles on a line segment. Instruction should connect the numerical representation of the process of partitioning a line segment by guiding students in an exploration and having them make observations about the relationship between the x and y coordinates of the endpoints and the point of the segment's partition. Engaging in classroom discourse will drive students to their understanding of this standard. Teachers should carefully plan their explorations and scaffold their ratios to aide in students' conceptual understanding. Level 4:
There is much essential understanding to unpack in this standard, so requiring students to explain the process of partitioning a line segment to someone with little to no prior knowledge will be a good indicator of a student's ability to extend this concept. Instruction should give students the opportunity to develop their understanding of the ratio and the resulting lengths of the segments by examining patterns and the cause and effect of a variety of ratios. Furthermore, students should recognize real-world problems that will require appropriate partitioning and explain the necessity of partitioning accurately with direction in mind.
Revised July 31, 2019 78

Standard M3.G.GPE.B.5 (Major Work of the Grade) Know and use coordinates to compute perimeters of polygons and areas of triangles and rectangles. Scope and Clarifications: (Modeling Standard) For example, use the distance formula. There are no assessment limits for this standard. The entire standard is assessed in this course.
Evidence of Learning Statements
Students with a level 1 understanding of this standard will most likely be able to:
Students with a level 2 understanding of this standard will most likely be able to:
Students with a level 3 understanding of this standard will most likely be able to:
Students with a level 4 understanding of this standard will most likely be able to:
Identify which lengths need to be used in order to compute area and perimeter of a polygon. Calculate the length of a horizontal or vertical segment.
Identify the altitude of a triangle and compute its length. Calculate distance between two coordinates using distance formula or the Pythagorean Theorem. Calculate the area of triangles graphed on a coordinate plane. Calculate the area of rectangles graphed on a coordinate plane. Use correct units when reporting answers.
Calculate the perimeter of polygons on a coordinate plane. Calculate the area of a triangle or a rectangle on a coordinate plane. Explain the relationship between distances or measures on a figure in terms of variables in a formula. Attend to precision in calculating measures. Justify the solution pathway for calculating area and perimeter. Operate with irrational numbers in radical form and write the result in simplest radical form. Recognize extraneous or unnecessary information.
Find the area of a complex figure by decomposing it into familiar shapes. Construct viable arguments when defending a solution pathway. Compare and contrast solution pathways and identify errors.
Revised July 31, 2019 79

Students with a level 1 understanding of this standard will most likely be able to:
Students with a level 2 understanding of this standard will most likely be able to:
Students with a level 3 understanding of this standard will most likely be able to:
Students with a level 4 understanding of this standard will most likely be able to:
Model real-world problems by sketching them on a coordinate plane and interpret the results in context of the problem.
Instructional Focus Statements
Level 3:
This standard lends itself to a variety of solution pathways, so classroom instruction should provide opportunities for students to explain their thinking, justify their solution, and defend their chosen pathway. Students have prior experience with this standard from grade 6 where they had to find the area of triangles, special quadrilaterals, and polygons by composing into rectangles or decomposing into triangles and other shapes (6.G.A.1). To continue this trajectory of learning, instruction should promote student understanding through modeling and explaining real-world phenomena in terms of area and perimeter. Students should be expected to report exact answers with correct units and allowed ample opportunity to explore and discuss multiple solution pathways. Because this is a modeling standard, students should experience a variety of examples asking them to model real-world problems and represent them to scale on a coordinate plane. Instruction should help students relate distances or lengths on a figure to the variable in the formula. For example, students may need help identifying the altitude of a figure, so it is important for students to see a variety of polygons without obvious altitudes. Explore non-routine problems and provide atypical figures that challenge students in determining the classification of the polygon. Through classroom discourse, help students recognize the base, altitude, or other important distances or lengths in formulas from a picture. Instruction should promote the use of the distance formula or the Pythagorean Theorem when computing distances or lengths, and it is imperative for students to attend to precision in their computations. In fact, students should leave their answers in simplest radical form when appropriate. This may be challenging for the students, so instruction should provide some additional support in simplifying, adding, subtracting, and multiplying numbers in radical form. Level 4:
This standard can easily be extended by supplying students with more complex figures of which to compute perimeter and area. Allow students the freedom to explore multiple solution pathways on their own and provide for them the solution pathways of others. Ask students to find errors in the solution pathway and make suggestions for correcting it. Provide opportunities for students to construct viable arguments and defend pathways, even some they did not choose themselves. Revised July 31, 2019 80

MODELING with GEOMETRY (MG)
Standard M3.G.MG.A.1 (Major Work of the Grade) Use geometric shapes, their measures, and their properties to describe objects. Scope and Clarification: (Modeling Standard) For example, modeling a tree trunk or a human torso as a cylinder. There are no assessment limits for this standard. The entire standard is assessed in this course.
Evidence of Learning Statements Students with a level 1 understanding of this standard will most likely be able to:
Students with a level 2 understanding of this standard will most likely be able to:
Students with a level 3 understanding of this standard will most likely be able to:
Students with a level 4 understanding of this standard will most likely be able to:
List real-world objects that can also be described by the shape, given a geometric shape.
Choose a geometric shape that can describe an object.
Use geometric shapes, their measures, and their properties to describe objects.
Determine a geometric shape or combination of geometric shapes that can describe a real-world object.
Instructional Focus Statements
Level 3:
As students solve real-world problems that involve objects, they should make the connection that geometric shapes can be used to model real-world objects. This is imperative for students to understand and apply as they solve real-world problems in future course work in G.MG.A.2. As students make this connection, they should be able to assign geometric shapes to describe objects, such as understanding that a cylinder’s measure and properties can be used to model a tree truck or a rocket ship. Level 4:
As students solidify the understanding of using geometric shapes to describe real-world objects, they should also be able to translate this understanding to using a combination of shapes to model real-world situations. As a natural integration of G.MG.A.1 and G.MG.A.2, students solidify their understanding by applying geometric methods to solve real-world problems.
Revised July 31, 2019 81
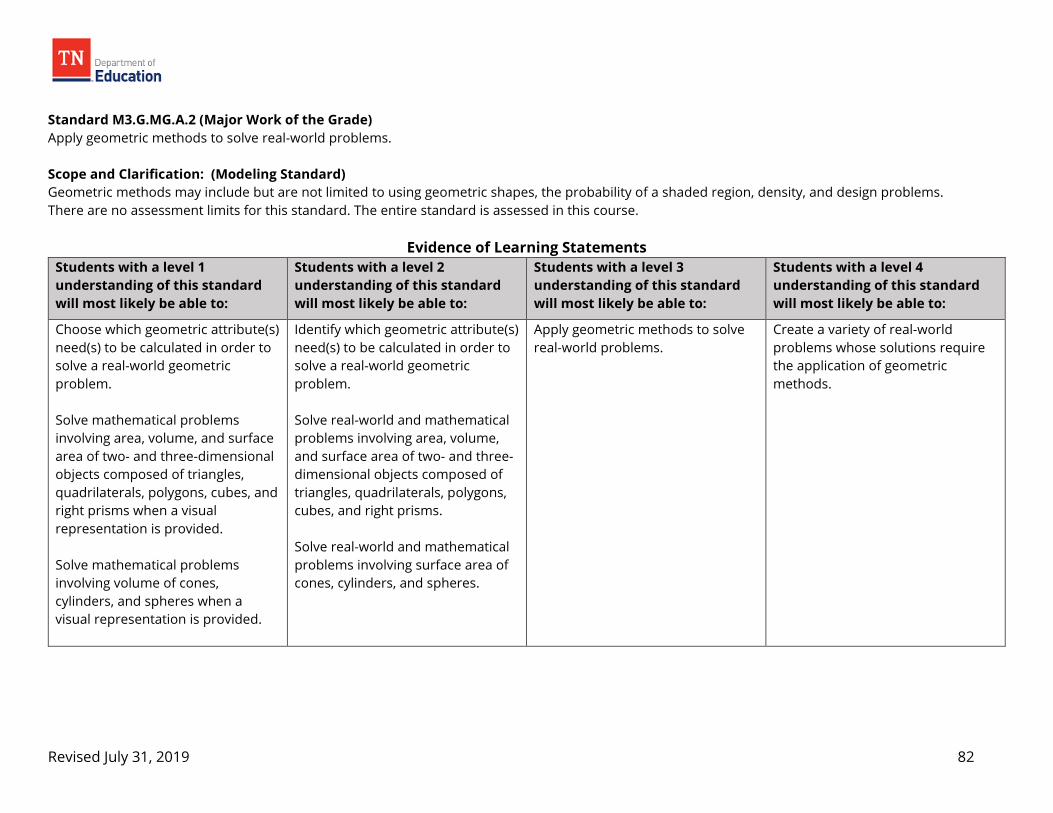
Standard M3.G.MG.A.2 (Major Work of the Grade) Apply geometric methods to solve real-world problems. Scope and Clarification: (Modeling Standard) Geometric methods may include but are not limited to using geometric shapes, the probability of a shaded region, density, and design problems. There are no assessment limits for this standard. The entire standard is assessed in this course.
Evidence of Learning Statements Students with a level 1 understanding of this standard will most likely be able to:
Students with a level 2 understanding of this standard will most likely be able to:
Students with a level 3 understanding of this standard will most likely be able to:
Students with a level 4 understanding of this standard will most likely be able to:
Choose which geometric attribute(s) need(s) to be calculated in order to solve a real-world geometric problem. Solve mathematical problems involving area, volume, and surface area of two- and three-dimensional objects composed of triangles, quadrilaterals, polygons, cubes, and right prisms when a visual representation is provided. Solve mathematical problems involving volume of cones, cylinders, and spheres when a visual representation is provided.
Identify which geometric attribute(s) need(s) to be calculated in order to solve a real-world geometric problem. Solve real-world and mathematical problems involving area, volume, and surface area of two- and three-dimensional objects composed of triangles, quadrilaterals, polygons, cubes, and right prisms. Solve real-world and mathematical problems involving surface area of cones, cylinders, and spheres.
Apply geometric methods to solve real-world problems.
Create a variety of real-world problems whose solutions require the application of geometric methods.
Revised July 31, 2019 82

Instructional Focus Statements Level 3:
Students are applying geometric concepts learned in previous grades in order to solve real-world geometric application problems. Students should have familiarity with not only how to calculate area, volume, and surface area, but also the hallmark attributes of each. Counter to its predecessor standards, geometric modeling is considered major work of the grade in Geometry. Students should be formulating a strategy to solve the problem based on a mathematical understanding of the situation, computing solutions, interpreting findings, and validating their thinking and the reasonableness of attained solutions in order to justify solutions to real-world problems. Level 4:
Students should be formulating a strategy to solve the problem based on a mathematical understanding of the situation, computing solutions, interpreting findings, and validating their thinking and the reasonableness of attained solutions in order to justify solutions to real-world problems geometric problems with increased rigor over the course.
Revised July 31, 2019 83
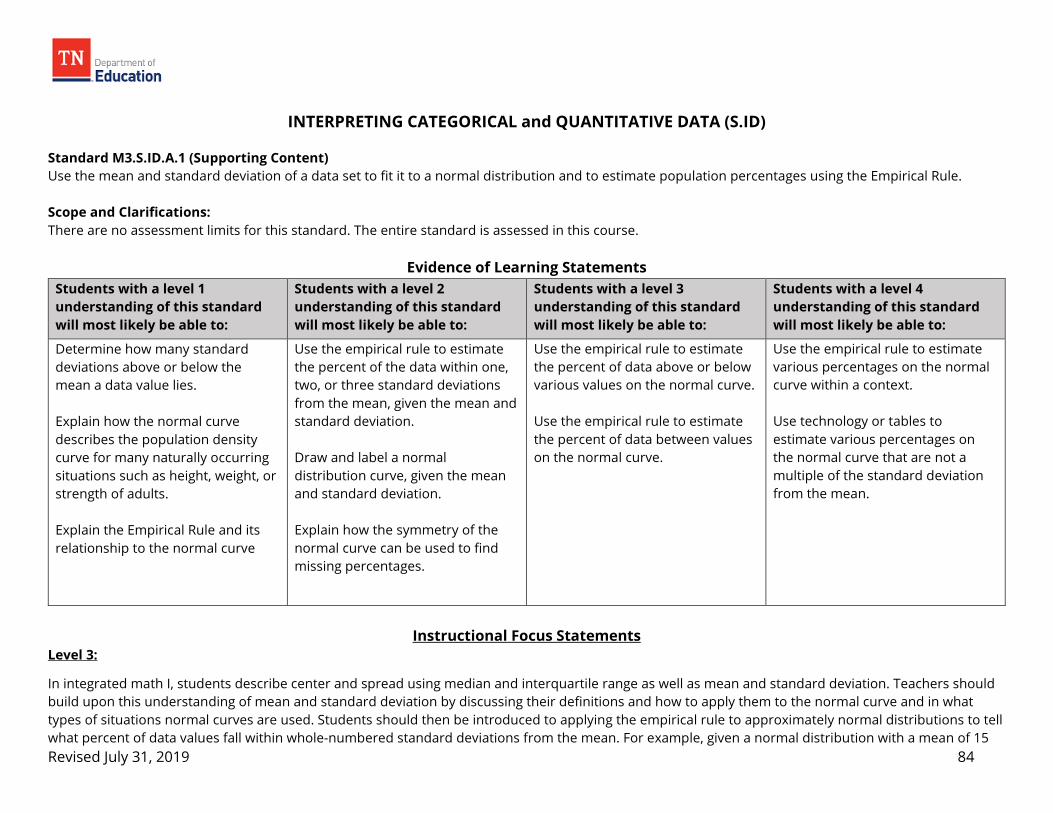
INTERPRETING CATEGORICAL and QUANTITATIVE DATA (S.ID)
Standard M3.S.ID.A.1 (Supporting Content) Use the mean and standard deviation of a data set to fit it to a normal distribution and to estimate population percentages using the Empirical Rule. Scope and Clarifications: There are no assessment limits for this standard. The entire standard is assessed in this course.
Evidence of Learning Statements Students with a level 1 understanding of this standard will most likely be able to:
Students with a level 2 understanding of this standard will most likely be able to:
Students with a level 3 understanding of this standard will most likely be able to:
Students with a level 4 understanding of this standard will most likely be able to:
Determine how many standard deviations above or below the mean a data value lies. Explain how the normal curve describes the population density curve for many naturally occurring situations such as height, weight, or strength of adults. Explain the Empirical Rule and its relationship to the normal curve
Use the empirical rule to estimate the percent of the data within one, two, or three standard deviations from the mean, given the mean and standard deviation. Draw and label a normal distribution curve, given the mean and standard deviation. Explain how the symmetry of the normal curve can be used to find missing percentages.
Use the empirical rule to estimate the percent of data above or below various values on the normal curve. Use the empirical rule to estimate the percent of data between values on the normal curve.
Use the empirical rule to estimate various percentages on the normal curve within a context. Use technology or tables to estimate various percentages on the normal curve that are not a multiple of the standard deviation from the mean.
Instructional Focus Statements
Level 3:
In integrated math I, students describe center and spread using median and interquartile range as well as mean and standard deviation. Teachers should build upon this understanding of mean and standard deviation by discussing their definitions and how to apply them to the normal curve and in what types of situations normal curves are used. Students should then be introduced to applying the empirical rule to approximately normal distributions to tell what percent of data values fall within whole-numbered standard deviations from the mean. For example, given a normal distribution with a mean of 15 Revised July 31, 2019 84
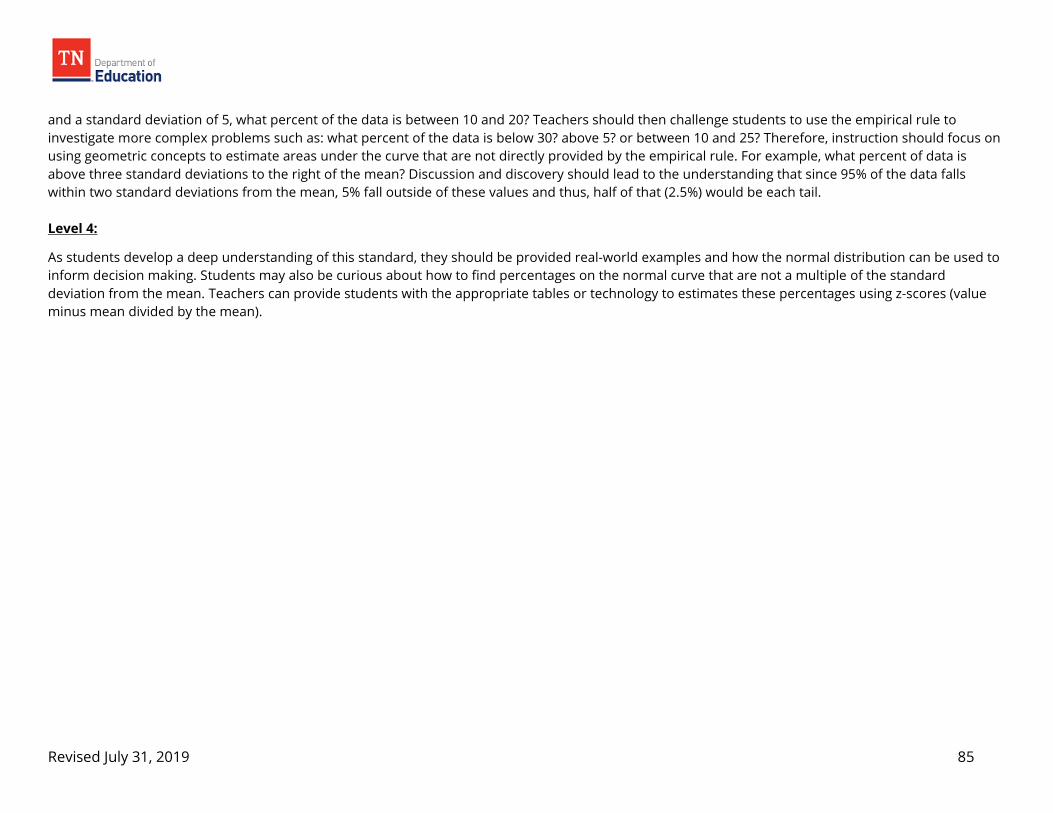
and a standard deviation of 5, what percent of the data is between 10 and 20? Teachers should then challenge students to use the empirical rule to investigate more complex problems such as: what percent of the data is below 30? above 5? or between 10 and 25? Therefore, instruction should focus on using geometric concepts to estimate areas under the curve that are not directly provided by the empirical rule. For example, what percent of data is above three standard deviations to the right of the mean? Discussion and discovery should lead to the understanding that since 95% of the data falls within two standard deviations from the mean, 5% fall outside of these values and thus, half of that (2.5%) would be each tail. Level 4:
As students develop a deep understanding of this standard, they should be provided real-world examples and how the normal distribution can be used to inform decision making. Students may also be curious about how to find percentages on the normal curve that are not a multiple of the standard deviation from the mean. Teachers can provide students with the appropriate tables or technology to estimates these percentages using z-scores (value minus mean divided by the mean).
Revised July 31, 2019 85

Standard M3.S.ID.B.2 (Supporting Content) Represent data on two quantitative variables on a scatter plot, and describe how the variables are related. M3.S.ID.B.2a Fit a function to the data; use functions fitted to data to solve problems in the context of the data. Use given functions or choose a function suggested by the context. M3.S.ID.B.2b Fit a linear function for a scatter plot that suggests a linear association Scope and Clarifications: Use given functions or choose a function suggested by the context.
i) Tasks have a real-world context. ii) Tasks are limited to linear, quadratic, and exponential functions with domains not in the integers.
Evidence of Learning Statements
Students with a level 1 understanding of this standard will most likely be able to:
Students with a level 2 understanding of this standard will most likely be able to:
Students with a level 3 understanding of this standard will most likely be able to:
Students with a level 4 understanding of this standard will most likely be able to:
Choose a linear function to fit a given data set. Choose if a given scatter plot is best represented by a linear, quadratic, or exponential function.
Choose a quadratic function that fits a given data set. Use a given linear function to solve a problems in the context of the data. Fit a linear function to a given set of data. Create a line of best fit and discuss reasons for choosing the line, given a scatter plot.
Fit a quadratic function to a given set of data. Fit an exponential function to a given set of data, where exponential functions are limited to domains not in the integers. Solve problems using a linear, quadratic, and exponential function in the context of the data, where exponential function are limited to domains not in the integers. Describe the similarities and differences between their chosen line of best fit and the line of best fit created using technology, given a scatter plot.
Create a contextual situation with an embedded data set derived from a given function. Explain the relationship between the function, data set, and the contextual situation using precise mathematical language and justifications. Use a given function to explain the relationship between two quantities in a created context. Explain the difference between association and causation, given a set of data within context that suggests a linear relationship.
Revised July 31, 2019 86

Instructional Focus Statements Level 3:
In grade 8, students developed an understanding of how to create a scatterplot, evaluate the scatterplot in order to describe any pattern associations between the two quantities, and informally fit a straight line to data when it visually resembled a straight line. In high school, students should extend this understanding to summarize, represent, and interpret data on two categorical and quantitative variables. This allows students to use mathematical models to capture key elements of the relationship between the two variables and explain what the model tells about the relationship. Students should gain a conceptual understanding of how to draw conclusions in addition to finding the equation for the line of best fit. As students’ progress through algebra it should become apparent to them that many real-world situations produce data that can be modeled using functions that are not linear. The exposure to quadratic and exponential functions broadens the options students have for modeling data sets, where data sets can be represented in tabular, graphical, or as a discrete set of points. Students should be exposed to real-world situations where it is apparent that the scatter plot suggests a pattern that is more curved than linear in its visual depiction. Thus leading the student to realize that a linear function does not provide the closest fit to the data causing the student to consider other function types. It is imperative that students discover that sometimes obvious patterns may not tell the whole story. Students should develop an understanding that sometimes curves fit better than lines. Students should not only discover this algebraically but also develop an understanding of the connection that exists between the model and the contextual situation that it represents and understand that this connection is essential in identifying and building appropriate models. As students solidify their understanding, they should be able to describe how the variables are related within the context of the situation. Students should also use various forms of technology to explore and represent scatterplots as this will enhance their ability to see the relationship that exits between the variables. Level 4:
As students extend their understanding, they should be able to create a contextual situation with an embedded data set derived from a given function. Students should also be able to explain and provide justifications for the relationships that exist between the function, data set, and the contextual situation using precise mathematical language. Particular attention should be put on creating situations that differentiate between linear, quadratic, and exponential functions. Students should be able to explain why one function is more appropriate than another function for the contextual situation.
Revised July 31, 2019 87

MAKING INFERENCES and JUSTIFING CONCLUSIONS (S.IC)
Standard M3.S.IC.A.1 (Major Work of the Grade) Recognize the purposes of and differences among sample surveys, experiments, and observational studies; explain how randomization relates to each. Scope and Clarifications: For example, in a given situation, is it more appropriate to use a sample survey, an experiment, or an observational study? Explain how randomization affects the bias in a study. There are no assessment limits for this standard. The entire standard is assessed in this course.
Evidence of Learning Statements Students with a level 1 understanding of this standard will most likely be able to:
Students with a level 2 understanding of this standard will most likely be able to:
Students with a level 3 understanding of this standard will most likely be able to:
Students with a level 4 understanding of this standard will most likely be able to:
Identify a study as a sample survey from a given verbal description of the context. Identify a study as an observational study from a given verbal description of the context. Identify a study as an experiment from a given verbal description of the context.
Determine if a sample survey, experiment, or observational study would be most appropriate, given a contextual situation,
Identify bias in a given study. Explain the differences among sample surveys, experiments, and observational studies. Describe what type of situations would be most appropriately studied with sample surveys, experiments, and observational studies. Explain the limitations of sample surveys, experiments, and observational studies related to randomization.
Create a research question best answered through a sample survey and with a sound methodology that minimizes bias. Create a research question best answered through an experiment and with a sound methodology that minimizes bias. Create a research question best answered through an observational study and with a sound methodology that minimizes bias.
Revised July 31, 2019 88

Instructional Focus Statements Level 3:
In previous courses, students learn that correlation does not imply causation. One way to determine causation is to conduct an experiment in which all other confounding factors are controlled. Teachers should emphasize the importance of randomization in selecting a sample for the study and random assignment to the control and treatment groups so that inferences can be made to the intended population. For example, if studying Tennessee males, randomly selecting 200 Tennessee males then randomly assigning 100 to the control group and 100 to the treatment group would suffice. If randomization is not met, the results will not be as useful, as the data may be biased (e.g., if only males from east Tennessee were selected). Although a simple random experiment is the best-case scenario, students should recognize it is often difficult to conduct due to ethical concerns, uncontrollable factors (e.g., weather), or financial barriers. In these situations, an observational study can be conducted instead. Teachers should lead conversations on various research questions and whether an experiment would be most appropriate. Observational studies are best conducted when natural conditions allow for studying existing control and/or treatment groups (researchers do not intervene in any way). Due to using existing groups, observational studies are rarely, if ever, considered random. For example, an experiment researching the effect of spider bites on children would have major ethical concerns. Therefore, students should realize that researchers in this study would only be able to conduct an observational study with children that have already been bitten by a spider. The sample was not randomly selected, therefore students should have some concerns about bias with this study. In a sample survey (a type of observational study), participants are surveyed on the research topic. Again, randomly selecting participants from the population is best. If this is not possible, other methods can be used to select participants, such as stratified random sampling, systematic sampling, cluster sampling, or multi-stage sampling. A discussion about other sampling methods including convenience sampling and volunteer sampling should focus on how these can create bias. Another way a sample survey can introduce bias is through the wording of the questions. For example, a question might lead participants to answer in a certain way based on how the question is asked. Students should also consider the location and time when participants are surveyed to decrease bias. For example, students should recognize that researchers should not survey peoples' interest in fruit with people in the fruit aisle of the grocery store or call homes to survey adults at 1pm, while most are at work. Level 4:
As students develop a deep understanding of the three types of studies, they should progress to designing their own studies. Beginning with a topic that interests them, students should create a research question, describe their methodology, and justify the chosen type of study. Other students should have opportunities to critique the shared methodology and describe its limitations. In future courses, students may learn about hypothesis tests that are used to analyze the data gathered through experiments, observational studies, and a sample survey.
Revised July 31, 2019 89

Standard M3.S.IC.A.2 (Major Work of the Grade) Use data from a sample survey to estimate a population mean or proportion; use a given margin of error to solve a problem in context. Scope and Clarifications: There are no assessment limits for this standard. The entire standard is assessed in this course.
Evidence of Learning Statements
Students with a level 1 understanding of this standard will most likely be able to:
Students with a level 2 understanding of this standard will most likely be able to:
Students with a level 3 understanding of this standard will most likely be able to:
Students with a level 4 understanding of this standard will most likely be able to:
Identify if study as a sample survey from a given verbal description of context.
Explain what a margin of error is in either verbal or written form using appropriate mathematical vocabulary. Choose a confidence interval given a population mean and margin of error from a sample survey. Choose a population mean from given data from a sample survey.
Use data from a sample survey to estimate a population mean. Use data from a sample survey to estimate proportion. Solve problems in a contextual situation, given a margin of error.
Explain the relationship to a contextual situation, given a margin of error. Explain how increasing or decreasing a sample size can affect the margin of error. Explain what this means with respect to a contextual situation. Choose a population and use data from a sample survey to estimate the population mean, calculate the margin of error, and explain the margin of error with respect to the population.
Instructional Focus Statements
Level 3:
In previous grades, students developed an understanding of population means and proportions for contextual situations. In high school, students couple this understanding with making inferences about populations through sample surveys. Students should first understand that a sample survey is exactly as it states a representative “sample” of the population rather than the entire population. Students should also understand the relevance for using a sample
Revised July 31, 2019 90

survey in contextual situations. In conjunction with this understanding, students should understand that the size of the sample survey can vary. A larger sample will result in a more accurate population mean and proportions. A smaller sample will result in a less accurate population mean and proportion. Depending on the context, increasing the size may not always be realistic. For example, in manufacturing sample surveys are used to determine the quality of a product since testing the entire population could result in little to no products left for production. Understanding the importance of using a sample survey is key prior to developing an understanding of a margin of error. In this standard, the focus is on understanding the use of a given margin of error and not calculating the margin of error. Students should understand that a margin of error is the largest expected size of the difference between an estimate and the actual population value that is being estimated. For example, when students estimate the average weight of a population based on a proper sample and your margin of error is "4 pounds," that is saying that you would be very confident that the actual population mean weight is within 4 pounds of your sample estimate. Thus concluding that if the sample average weight is 45 pounds and the margin of error is 4 pounds, you would be confident that the actual population mean weight would be somewhere between 41 pounds and 49 pounds. Additionally, students should develop an understanding of when it is appropriate to use a sample population mean and when it is appropriate to use a sample proportion, the fraction of samples which were successes, based on the contextual situation. This should include making judgements of the size of the sample and the meaning of the margin of error. Level 4:
As students solidify their understanding, they should be able to choose a population and use data from a sample survey to estimate the population mean, calculate the margin of error, and explain the margin of error with respect to the population. They should also be able to estimate the margin of error and explain what it means with respect to the sample population mean and/or proportion. Additionally, students should be able to explain that the sample survey will not always yield a sample estimate that is equal to the value of the population parameter it is estimating. They should understand that there will always be some sample variability. Students should also understand that using a larger sample leads to less sampling variability and results a smaller margin of error when estimating parameters. They should also understand that using smaller sample leads to more sampling variability and results a larger margin of error when estimating parameters. Additionally, students should be able to explain the appropriateness of the sample survey that was used with respect to the contextual situation.
Revised July 31, 2019 91