intangible capital and the choice of external … · intangible capital and the choice of external...
TRANSCRIPT

DPRIETI Discussion Paper Series 17-E-080
Intangible Capital and the Choice of External Financing Sources
HOSONO KaoruRIETI
TAKIZAWA MihoToyo University
The Research Institute of Economy, Trade and Industryhttp://www.rieti.go.jp/en/
1
RIETI Discussion Paper Series 17-E-080
May 2017
Intangible Capital and the Choice of External Financing Sources*
HOSONO Kaoru† Gakushuin University and RIETI
TAKIZAWA Miho‡ Toyo University
Abstract Using a dataset of Japanese listed firms from 2002 to 2013, we examine how firms’ asset structure in terms of
the ratio of intangible to tangible capital is related to their choice of financing sources among bank loans, equity
issues (seasoned equity offerings: SEO), and bond issues. We further investigate how the choice of financing is
related to post-financing investment in tangible and intangible capital. We find that firms with higher intangible
capital ratios are more likely to choose equity issuance and less likely to choose loans than bond issues. Using
propensity score matching and difference-in-differences approach (PSM-DID), we further find that firms that
chose loans invest less in intangible capital than those that did not. Finally, we also obtain results that are
consistent with a number of existing theories on capital structure such as the market timing (mispricing)
hypothesis on equity issuance, the tradeoff and the pecking order hypotheses on debt and equity, and the holdup
hypothesis on bank loans.
Keywords: Intangible capital, External finance, Seasoned equity offering
JEL classification: E22; G30; G39
RIETI Discussion Papers Series aims at widely disseminating research results in the form of professional
papers, thereby stimulating lively discussion. The views expressed in the papers are solely those of the
author(s), and neither represent those of the organization to which the author(s) belong(s) nor the Research
Institute of Economy, Trade and Industry.
*This study is conducted as a part of the “Corporate Finance and Firm Dynamics” project undertaken at the Research Institute of Economy, Trade and Industry (RIETI). This study utilizes the micro data of the questionnaire information based on the “Basic Survey of Japanese Business Structure and Activities (BSJBSA)” which is conducted by the Ministry of Economy, Trade and Industry (METI) and the converter to match security codes with firm ids in BSJBSA by RIETI. We thank Makoto Yano, Atsushi Nakajima, Masayuki Morikawa, Iichiro Uesugi and the seminar participants at RIETI for helpful suggestions. The authors also gratefully acknowledge the financial support received from the Grant-in-Aid for Scientific Research (B) No. 17H02526, JSPS and the INOUE ENRYO Memorial Foundation for Promoting Sciences in Toyo University. † Gakushuin University, Mejiro 1-5-1, Toshima-ku, Tokyo 171-8588, Japan. Email: [email protected] ‡ Toyo University, Hakusan 5-28-20, Bunkyo-ku, Tokyo 112-8606, Japan. Email: [email protected]
2
Intangible Capital and the Choice of External Financing Sources
1. Introduction
The choice of external financing sources has been one of the central questions of corporate
finance. While a huge number of theoretical and empirical studies have been accumulated on this
issue, firm-level evidence on the effect of intangible capital on external financing is still scarce
despite an increasing role of intangible capital in firm growth. This is possibly due to a lack in
firm-level data on intangible capital except for research and development (R&D) expenditures.
This paper tries to fill in this void using a large dataset of Japanese firms that enables us to
construct firm-level data on intangible capital.
Tangible assets, such as property, plant, and equipment, are easier for outsiders to value
than intangibles, leading to lower expected distress costs. In addition, tangible assets are difficult
to substitute high-risk assets for low-risk ones, resulting in fewer debt-related agency problems.
On the other hand, intangible capital, such as R&D stock, brand, and software, is rarely pledgeable
as collateral, and hence likely to result in credit constraints (e.g., Kiyotaki and Moore, 1997;
Almeida and Campello, 2007). Given its role in output and productivity growth (e.g.,
Brynjolfsson and Hitt, 2003), intangible capital may be suitable for equity financing.
A vast literature on capital structure provides evidence on the positive relationship between
leverage and asset tangibility. Harris and Raviv (1991), a classical survey on capital structure,
note that the available studies “generally agree” that leverage decreases with advertising
expenditures and R&D expenditures (p.334), both of which are substantial parts of intangible
investment. As an example of recent studies on capital structure, Frank and Goyal (2009) show
that leverage is positively correlated with asset tangibility. However, leverage is a result of the
choice of external financing sources and the accumulation of internal savings. As such, we cannot

3
distinguish equity financing and internal savings. We cannot tell the difference between bank
loans and bond issues as well from the leverage from capital structure.
As for the choice of external financing sources, a number of studies have focused on the
choice of public debt (e.g., corporate bonds) vs. private debt (e.g., bank loans and nonbank loans),
as is detailed in Section 2. However, there is scarce literature on the choice of equity issues and
debt issues. As for equity issues, Kim and Weisbach (2008) examine the motivations for public
equity offers, finding that R&D is one of the primary motivations for them. However, few studies
the choice among bank loans, bond issues, and equity issues.
We thus contribute to the relevant literature in two ways. First, we analyze the role of
intangible assets on the choice of external financing sources by constructing firm-level data on
intangible assets. In contrast, most of the preceding studies on leverage and external finance
measure asset tangibility using the ratio of tangible fixed assets to total assets both based on
balance sheets, meaning that a substantial part of intangible capital such as R&D, brand and
software is not appropriately captured. Second, we analyze the choice among loans, bond issues,
and equity issues.
We find that firms with higher intangible capital ratios are more likely to choose equity
issuance and less likely to choose loans than to choose bond issues. Using propensity score
matching and difference-in-differences approach (PSM-DID), we further find that firms that
chose loans invest less in intangible capital than firms that did not choose loans. Finally, we also
obtain results that are consistent with a number of existing theories on capital structure such as
the market timing (mispricing) hypothesis on equity issuance, the tradeoff and the pecking order
hypotheses on debt and equity, and the holdup hypothesis on bank loans.
The rest of the paper proceeds as follows. Section 2 presents hypotheses on equity and bond
issues, while Section 3 reviews the related extant literature. Section 4 explains the data and the

4
selection of the sample we use for our analysis. Sections 5 presents the empirical methodology
and the results for the ex-ante characteristics of the firms that choose financing sources. Section
6 presents the methodology and the results of the ex-post investment of the firms that issued equity
and bonds. Section 7 concludes
2. Hypotheses
In this section we state the hypotheses on the choice of external financing source focusing
on the role of intangible capital. We first present hypotheses on the choice of equity and debt and
then those on the choice of private debt (bank- and non-bank loans) and public debt (e.g.,
corporate bonds).
2.1 Debt vs. Equity
Intangible assets is less likely to serve as collateral and retain less value in liquidation than
tangible capital, increasing the agency costs of debt (like risk shifting). Therefore, the greater the
proportion of intangible assets, the less willing should lenders be to supply loans. On the other
hand, if firms with higher intangible asset ratios have richer growth opportunities, investors
should be willing to invest in the shares of such firms. Based on these discussions, we test the
following hypothesis.
H1. Firms with more intangible asset ratios depend more on share issues and less on loans or
bond issues.
2.2 Private vs. public debt
Private debt such as bank and nonbank loans are beneficial especially for firms that are

5
susceptible to information and agency problems because private-debt holders are concentrated
and hence have advantages in monitoring borrowers and renegotiating debt as compared to public-
debt holders. Given that intangible capital involves with severe information problems, firms with
higher ratios of intangible assets to total assets are likely to depend more on private debt and less
on public debt (e.g., Diamond, 1984, 1991). Furthermore, if firms with higher intangible asset
ratios have richer growth opportunities, monitoring by private lenders are particularly valuable
for them (Myers, 1979).
However, private lenders may hold up borrowers based on their informational monopoly
power. If this rent extraction is substantial, firms with rich intangible capital and growth
opportunities may rely more on public debt or multiple private lenders and less on a single private
lender to avoid the hold-up problem by the single private lender (Rajan, 1991).
Based on these arguments, we propose the two opposing hypotheses on role of intangible
capital in the choice of private and public debt.
H2A. Firms with more intangible assets depend more on loans and less on bonds if the monitoring
by private lenders is beneficial for them.
H2B. Firms with more intangible assets depend more on bonds and less on loans if the hold-up
problem is costly for them.
3. Related Studies
There are three strands of literature that analyze the relationship between tangible or
intangible assets and financing sources. The first one focuses on R&D among intangibles and
studies the role of equity issuance as a financing source of R&D. The second one analyses the

6
effect of asset tangibility on the choice between private and public debt, while the last one
examines the relation with asset tangibility and capital structure, although asset tangibility in these
strands of literature has been typically measured by the ratio of tangible fixed assets to total assets
based on firms’ balance sheets. We briefly review each of these strands of literature below.
3.1 R&D and Equity Finance
Although almost all intangible assets are susceptible to information problems and not
pledgeable as collateral, and hence likely subject to credit constraints, financing of R&D activities
has been intensively analyzed by preceding studies. Many existing studies find that firms finance
R&D expenditures mainly by equity issuance when they need external funds. Kim and Weisbach
(2008), using a sample of both initial and seasoned equity offerings from 38 countries, find that
firms use funds raised by equity issuance to increase capital expenditures and R&D as well as
cash holdings. Brown et al. (2009), using data from US high-tech firms, estimate dynamic R&D
models to find significant effects of cash flow and external equity for young, but not mature, firms.
Martinsson (2010) estimate dynamic R&D regression models similar to Brown et al. (2009) for
high-tech firms, separately for the U.K. and Continental Europe, and find a significant effect of
external equity only for the new, high-tech firms in the U.K. Brown et al. (2012) study a sample
of European firms to find evidence that the availability of finance matters for R&D after
controlling for the use of external equity finance as well as for firm efforts to smooth R&D with
cash reserve, suggesting a major role for equity issues. Brown et al. (2013), using a sample of
firms across 32 countries, find that strong shareholder protections and better access to stock
market financing lead to substantially higher long-run rates of R&D investment, particularly in
small firms. Magri (2014) studies Italian unlisted high-tech firms to find that equity increases both
the probability of undertaking R&D and the R&D-to-sales ratio. Hertzel et al. (2012) examine

7
financing activities of newly public firms in the US and find that initial public offering (IPO)
proceeds relative to external financing requirements are smaller for firms with more intangible
assets and more R&D-intensive firms. Asset intangibility and R&D intensity are also both
negatively related with the length of time from a firm’s IPO to its first post-IPO capital infusion.
These results suggest that capital staging (or sequential financing) is employed to help control the
overinvestment problem in public firms.
These studies all show that one of the primary uses for funds raised by equity issues is to
finance R&D. We contribute to this strand of literature in three ways. First, unlike these studies,
we study financing of intangible capitals, which is broadly measured, covering brand and software
as well as R&D. Secondly, we compare the effects on intangible capital of equity issuance with
those of bond issuance and loans while most of the preceding studies focus on equity. Lastly, we
clearly identify the effect of equity- (, bond- or loan-) financing on investment by comparing
financing firms and non-financing firms whose ex-ante characteristics are similar to financing
firms. On the other hand, Kim and Weisbach (2008), who is the closes to our study in that they
examine capital expenditures and R&D subsequent to equity issues, do not adequately control for
ex-ante characteristics of the control group, i.e., non-financing firms (except for the firm size in
terms of total assets, year, and country).
3.2 Asset Tangibility and Choice between Private and Public Debt
Evidences on the effects of asset tangibility on the choice of debt structure is mixed.
Houseton and James (1996), using US data from Compustat and CRSP, support the hold-up
hypothesis. Specifically, they find that among firms that use a single bank lender, there is a
negative relationship between the proportion of bank financing and the growth opportunities,
measured by the market-to-book ratio and the ratio of R&D to sales. They further find that

8
multiple banking relationships and access to public debt markets mitigate or even overturn the
negative association between growth opportunities and bank financing. Johnson (1997), using
data from Compustat firms, find that the fixed asset ratio is positively correlated both with the
proportion of bank debt and that of publicly-held debt (except for firms that have highly
specialized assets) while it is negatively correlated with the proportion of debt held by private
nonbank lenders. Cantillo and Wright (2000), using data from Compustat and other US data
sources, find that firms with higher tangible assets as a proportion of total assets are more likely
to tap bond markets, consistent with the hold-up hypothesis. On the other hand, Denis and Mihov
(2005) investigate the choice among public debt, non-bank debt, and bank debt by US public
firms and find that firms with higher ratios of fixed assets to total assets and lower ratios of R&D
expenditures to sales, both suggesting less severe information asymmetry, are more likely to select
public debt rather than bank or non-bank debt.1 Using data from Japanese firms listed on the First
Section of the Tokyo Stock Exchange over the period of 1993 to 1997, Shirasu and Xu (2007)
find that the ratio of tangible fixed assets to total liability is negatively associated with the ratio
of bond financing to the sum of bond and loan financing for the period.
While these empirical studies measure the asset tangibility either by tangible fixed assets
on the balance sheets or R&D expenditures, these measures are far from complete. In the case of
tangible fixed assets, cash and deposits are included in total assets while little of R&D stock, and
other intangible capital are not included in total assets. Using R&D expenditures captures a part
of intangible assets but misses other intangible assets. We measure intangible capital including
R&D, brand, and software. Furthermore, we analyze the choice among equity, public debt (i.e.,
corporate bonds), and private debt (loans) rather than the choice between the latter two.
1 Denis and Mihov (2005) find that the market-to-book ratio is not significant in the choice of debt structure. On the other hand, Krishnaswami, Spindt and Subramaniam (1999), using data from US listed firms, find that the ratio of privately placed long-term debt to total long-term debt is positively associated with the market-to-book ratio, while, they do not analyze the effects of R&D or other intangible capital as a determinant of debt structure.

9
3.3 Asset Tangibility and Leverage
A number of empirical studies find a positive correlation between asset tangibility and
leverage. Rajan and Zingales (1995), among others, use data from the major industrialized
countries and find that the ratio of fixed assets to total assets is positively correlated with the debt-
to-total assets in 6 or 5 out of 7 countries depending on whether capital is book-based or market-
valued. More recently, Frank and Goyal (2009) show that leverage is positively correlated with
asset tangibility.
While few studies explicitly analyze the role of intangible capital in leverage, R&D and
advertisement expenditures are often taken into consideration as a determinant of leverage. Haris
and Raviv (1991), summarize the empirical studies available then, stating that leverage decreases
with advertising expenditures and R&D (p.334)
Although studies on leverage are related with our study on the choice of debt and share
issuance, a lower (higher) leverage does not necessarily imply that firms issue more (less) shares,
because a substantial part of the equity, either measured based on book or market-valued equity,
consists of retained earnings.
4. Data Sources and Sample Selection
A. Financing Sources
Data sources for share issues, bond issues, new loans, and commercial paper (CP) issues
are cash flow statements contained in the Nikkei Financial Quest, a database compiled by Nikkei
Media Marketing. We use financial statements as well from the Nikkei Financial Quest. We refer
to the Public and Corporate Bond Handbook published by the Japan Securities Dealers
Association for the maturities of bonds when we classify bonds by maturity.

10
Cash flow statements are available for the firms listed on the first section of the Tokyo
Stock Exchange from fiscal year 2002. The data we use for the determinants of loan issues, bond
issues, and share issues cover the period from fiscal year 2002 to 2010 while those for the ex-post
firm investment cover the period from fiscal year 2002 to 2013. We exclude banks, insurance,
security firms and other financial institutions from our sample. From the 13,458 firm-year
observations for which cash flow statements are available, we exclude outliers: those firms for
which the variables required for estimation are not available, those whose market-to-book ratios,
the growth rate of employment, the growth rate of tangible assets or the growth rate of sales lie
in the top and bottom 0.5% ranges, those whose bond issues, new loans, or share issues are
negative, those whose coverage ratios are negative, and those whose managerial ownership ratio
exceeds unity. At this point, we are left with 9588 firm-year observations. Finally, we match these
data with the data on intangible capitals from the Business Survey, reducing the number of
observations to 7779.
Loans include nonbank loans and loans from affiliated firms as well as bank loans.
Bonds include those issued domestically and abroad. They also include warrant bonds as well as
straight bonds. However, warrant bond issues are rare: the share of the amounts raised by warrant
bond issues is only 0.23% according to the Handbook. When we analyze bond issues by maturity,
we cover only domestically issued bonds because the Handbook covers only them. All share
issues are covered regardless of whether they are public offerings or allocation to third parties.
We aggregate loans, bonds and shares within a year at the firm level.
B. Tangible and Intangible Assets
The data source for tangible and intangible assets is the Basic Survey of Japanese
Business Structure and Activities (BSJBSA) published by the Ministry of Economy, Trade and
Industry. The survey covers the universe of enterprises in Japan with more than 50 employees and
11
with paid-up capital of over 30 million yen. We apply the perpetual inventory (PI) method to such
a large firm-level panel data set in order to construct the data for intangible capital. The sample
period for measuring intangible capital is from 1994FY to 2013FY.
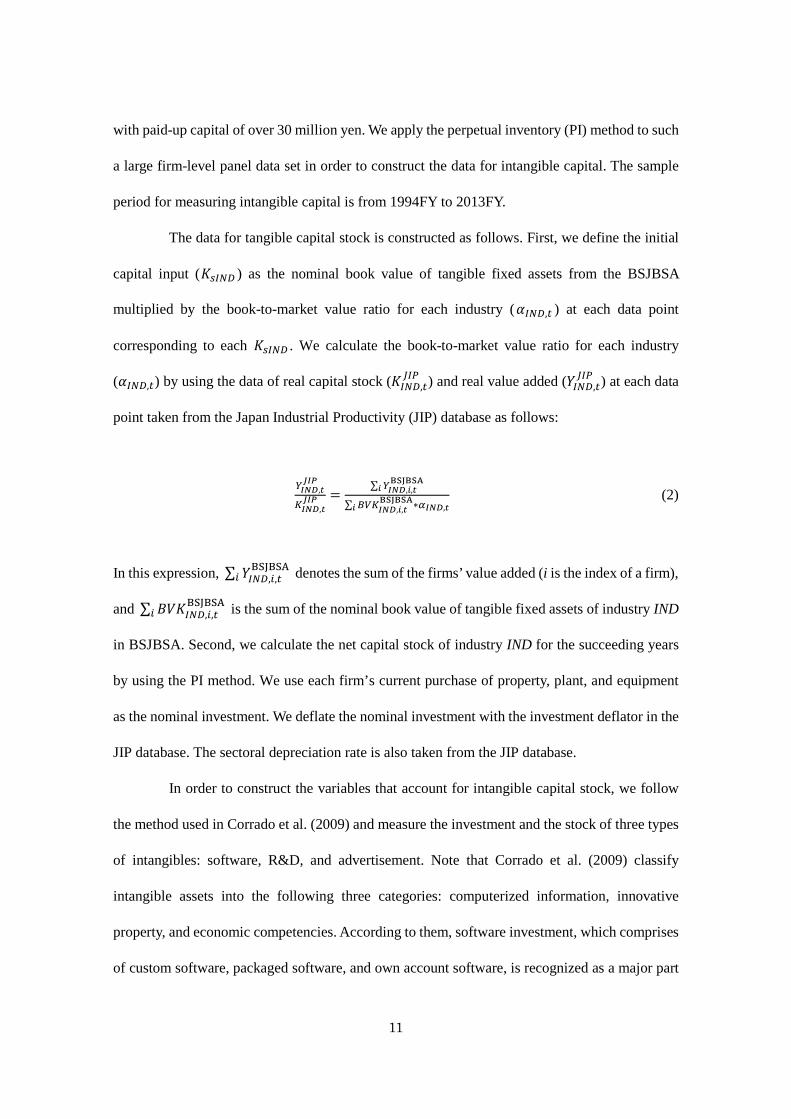
The data for tangible capital stock is constructed as follows. First, we define the initial
capital input (𝐾𝐾𝑠𝑠𝑠𝑠𝑠𝑠𝑠𝑠 ) as the nominal book value of tangible fixed assets from the BSJBSA
multiplied by the book-to-market value ratio for each industry (𝛼𝛼𝑠𝑠𝑠𝑠𝑠𝑠,𝑡𝑡 ) at each data point
corresponding to each 𝐾𝐾𝑠𝑠𝑠𝑠𝑠𝑠𝑠𝑠 . We calculate the book-to-market value ratio for each industry
(𝛼𝛼𝑠𝑠𝑠𝑠𝑠𝑠,𝑡𝑡) by using the data of real capital stock (𝐾𝐾𝑠𝑠𝑠𝑠𝑠𝑠,𝑡𝑡𝐽𝐽𝑠𝑠𝐽𝐽 ) and real value added (𝑌𝑌𝑠𝑠𝑠𝑠𝑠𝑠,𝑡𝑡
𝐽𝐽𝑠𝑠𝐽𝐽 ) at each data
point taken from the Japan Industrial Productivity (JIP) database as follows:
𝑌𝑌𝐼𝐼𝐼𝐼𝐼𝐼,𝑡𝑡𝐽𝐽𝐼𝐼𝐽𝐽
𝐾𝐾𝐼𝐼𝐼𝐼𝐼𝐼,𝑡𝑡𝐽𝐽𝐼𝐼𝐽𝐽 =
∑ 𝑌𝑌𝐼𝐼𝐼𝐼𝐼𝐼,𝑖𝑖,𝑡𝑡BSJBSA
𝑖𝑖
∑ 𝐵𝐵𝐵𝐵𝐾𝐾𝐼𝐼𝐼𝐼𝐼𝐼,𝑖𝑖,𝑡𝑡BSJBSA
𝑖𝑖 ∗𝛼𝛼𝐼𝐼𝐼𝐼𝐼𝐼,𝑡𝑡 (2)
In this expression, ∑ 𝑌𝑌𝑠𝑠𝑠𝑠𝑠𝑠,𝑖𝑖,𝑡𝑡BSJBSA
𝑖𝑖 denotes the sum of the firms’ value added (i is the index of a firm),
and ∑ 𝐵𝐵𝐵𝐵𝐾𝐾𝑠𝑠𝑠𝑠𝑠𝑠,𝑖𝑖,𝑡𝑡BSJBSA
𝑖𝑖 is the sum of the nominal book value of tangible fixed assets of industry IND
in BSJBSA. Second, we calculate the net capital stock of industry IND for the succeeding years
by using the PI method. We use each firm’s current purchase of property, plant, and equipment
as the nominal investment. We deflate the nominal investment with the investment deflator in the
JIP database. The sectoral depreciation rate is also taken from the JIP database.
In order to construct the variables that account for intangible capital stock, we follow
the method used in Corrado et al. (2009) and measure the investment and the stock of three types
of intangibles: software, R&D, and advertisement. Note that Corrado et al. (2009) classify
intangible assets into the following three categories: computerized information, innovative
property, and economic competencies. According to them, software investment, which comprises
of custom software, packaged software, and own account software, is recognized as a major part
12
of the investment in computerized information; and R&D accounts for a large part of the
innovative property, while advertisement represents a part of the investment in economic
competencies, which comprises brand equity, firm-specific human capital, and organizational
change. In this sense, the three items we measure for the present study account for the three
categories of intangibles considered in Corrado et al. (2009).
To measure the abovementioned three items (i.e., software, R&D, and advertisement)
for each firm, we follow Miyagawa et al. (2013). For software, first, the ratio of workers engaged
in information processing to the total number of employees is multiplied by the total cash earnings
in order to measure the value of software investment. Then, we add the cost of information
processing to this number to compute the total software investment. Finally, we deflate the
nominal software investment by the deflator for software investment obtained from the JIP
database to obtain the real software investment. For R&D, we subtract the cost of acquiring fixed
assets for research from the cost of R&D (i.e., in-house R&D and contract R&D) to compute the
value of the investment in R&D. We use the output deflator for (private) research in the JIP
database to deflate the nominal R&D investment. Finally, for advertisement, we obtain the data
for advertising expenses from the BSJBSA. We use the output deflator for advertising in the JIP
database as the deflator for advertising investments. Note that all of the information is obtained
from the BSJBSA.
For all of the data in the three intangible investment categories, we use the PI method
where we use FY1994 as the base year to construct a data series of intangible assets from FY2000.
All of the depreciation rates used for this computation follow those of Corrado et al. (2012). The
depreciation rates for software, R&D, and advertising are 31.5%, 15%, and 55%, respectively.
We define the total intangible assets as the sum of software stocks, R&D stocks, and
advertisement stocks. According to the JIP database, software, science and engineering R&D, and
13
brand equity account for about 70% of the total intangible assets in Japan.
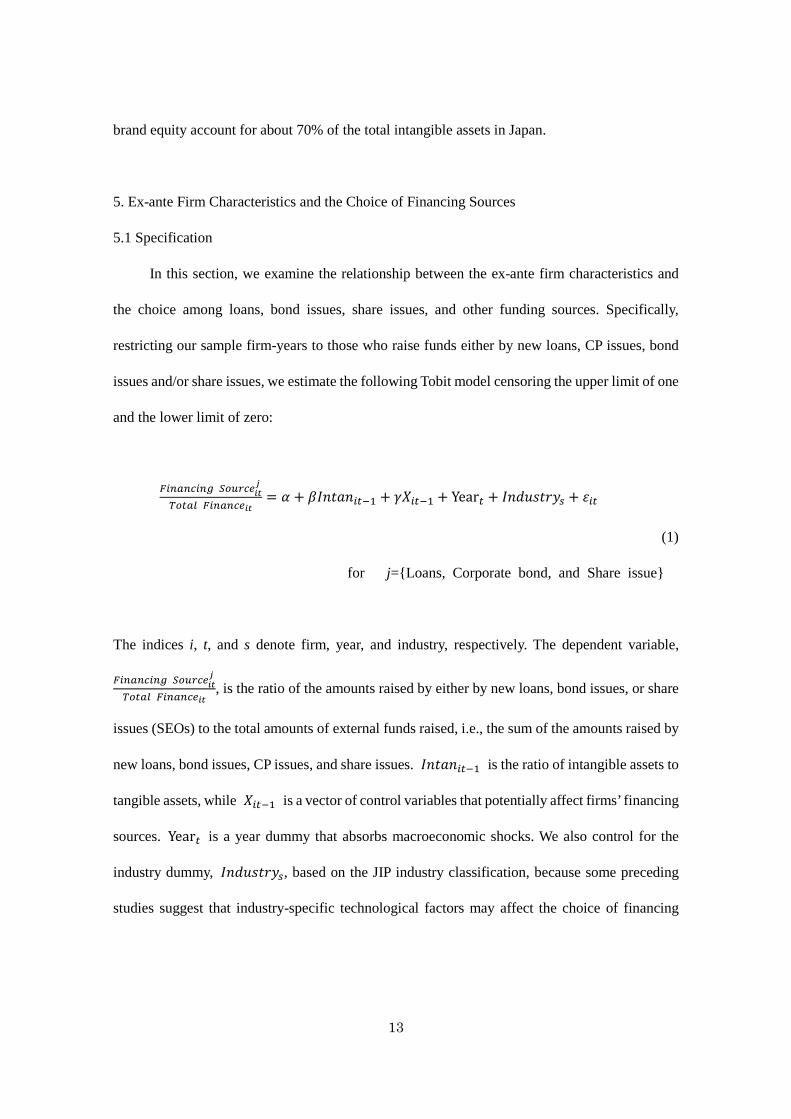
5. Ex-ante Firm Characteristics and the Choice of Financing Sources
5.1 Specification
In this section, we examine the relationship between the ex-ante firm characteristics and
the choice among loans, bond issues, share issues, and other funding sources. Specifically,
restricting our sample firm-years to those who raise funds either by new loans, CP issues, bond
issues and/or share issues, we estimate the following Tobit model censoring the upper limit of one
and the lower limit of zero:
𝐹𝐹𝑖𝑖𝐹𝐹𝐹𝐹𝐹𝐹𝐹𝐹𝑖𝑖𝐹𝐹𝐹𝐹 𝑆𝑆𝑆𝑆𝑆𝑆𝑆𝑆𝐹𝐹𝑆𝑆𝑖𝑖𝑡𝑡𝑗𝑗
𝑇𝑇𝑆𝑆𝑡𝑡𝐹𝐹𝑇𝑇 𝐹𝐹𝑖𝑖𝐹𝐹𝐹𝐹𝐹𝐹𝐹𝐹𝑆𝑆𝑖𝑖𝑡𝑡= 𝛼𝛼 + 𝛽𝛽𝐼𝐼𝐼𝐼𝐼𝐼𝐼𝐼𝐼𝐼𝑖𝑖𝑡𝑡−1 + 𝛾𝛾𝑋𝑋𝑖𝑖𝑡𝑡−1 + Year𝑡𝑡 + 𝐼𝐼𝐼𝐼𝐼𝐼𝐼𝐼𝐼𝐼𝐼𝐼𝐼𝐼𝐼𝐼𝑠𝑠 + 𝜀𝜀𝑖𝑖𝑡𝑡
(1)
for j={Loans, Corporate bond, and Share issue}
The indices i, t, and s denote firm, year, and industry, respectively. The dependent variable,
𝐹𝐹𝑖𝑖𝐹𝐹𝐹𝐹𝐹𝐹𝐹𝐹𝑖𝑖𝐹𝐹𝐹𝐹 𝑆𝑆𝑆𝑆𝑆𝑆𝑆𝑆𝐹𝐹𝑆𝑆𝑖𝑖𝑡𝑡𝑗𝑗
𝑇𝑇𝑆𝑆𝑡𝑡𝐹𝐹𝑇𝑇 𝐹𝐹𝑖𝑖𝐹𝐹𝐹𝐹𝐹𝐹𝐹𝐹𝑆𝑆𝑖𝑖𝑡𝑡, is the ratio of the amounts raised by either by new loans, bond issues, or share
issues (SEOs) to the total amounts of external funds raised, i.e., the sum of the amounts raised by
new loans, bond issues, CP issues, and share issues. 𝐼𝐼𝐼𝐼𝐼𝐼𝐼𝐼𝐼𝐼𝑖𝑖𝑡𝑡−1 is the ratio of intangible assets to
tangible assets, while 𝑋𝑋𝑖𝑖𝑡𝑡−1 is a vector of control variables that potentially affect firms’ financing
sources. Year𝑡𝑡 is a year dummy that absorbs macroeconomic shocks. We also control for the
industry dummy, 𝐼𝐼𝐼𝐼𝐼𝐼𝐼𝐼𝐼𝐼𝐼𝐼𝐼𝐼𝐼𝐼𝑠𝑠, based on the JIP industry classification, because some preceding
studies suggest that industry-specific technological factors may affect the choice of financing

14
sources.2 𝜀𝜀𝑖𝑖𝑡𝑡 is a disturbance term.
As control variables, we include Size, Profit, Growth, DefaultProb, Leverage, Collateral, and
ManageOwn. representing the firm’s size, profitability, growth opportunities, default probability,
leverage, collateral, and managerial ownership. We explain the control variables in details below.
The Size variable is the logarithm of total assets. A larger firm is less likely to be affected by
asymmetric information problems because securities analysts and rating agencies analyze a larger
firm more elaborately. Moreover, a larger firm tends to raise a larger amount and hence incurs
relatively smaller unit costs of bond and share issuance. Given such tendencies, a larger firm is
expected to raise a larger share of funds by issuing bonds and equity.
The Growth variables are the market-to-book ratio of equity, the growth rate of sales from the
previous year, the growth rate of fixed tangible assets from the previous year, and the ratio of
research and development (R&D) to sales. The debt-overhang hypothesis posits that a firm with
more abundant growth opportunities raises funds less by debt, i.e., loans and bonds (Myers, 1977).
The market-timing hypothesis, on the other hand, posits that a firm that is more highly appreciated
at the stock market and hence faces a higher market-to-book ratio tends to raise funds more by
share issuance (Baker and Wurgler, 2002). Finally, the hold-up hypothesis postulates that a firm
with abundant growth opportunities is likely to depend less on bank loans and more on bond
issues to avoid banks’ rent extraction when it raises funds by debt (Rajan, 1992). 3
The Profit variable is earnings before interest taxes, depreciation, and amortization (EBITDA),
calculated as the sum of before-tax earnings, extraordinary items, interests paid, and depreciation,
2 Rajan and Zingales (1998) use the industry-level external financing dependence ratio as a proxy for the demand for external finance to examine the effect of financial development on sectoral growth, while Claessens and Laeven (2003) use the industry-level intangible-to-fixed asset ratio as a measure of asset structure to investigate the effect of property rights on sectoral growth. 3 In Diamond (1991) and Rajan (1992), the choice among debts depends on the firm’s quality. That is, high quality firms tend to conduct financing in the open markets while mid-level firms choose loans. In the case of low-level firms, however, the choice is corporate bonds because the benefits of bank loans are outweighed by the costs of monitoring.

15
as a ratio of total assets. According to the hypotheses that stress the role of banks in information
production or renegotiation, a less profitable firm relies more on bank loans and less on bonds
(Diamond, 1984; Fama, 1985; Berlin and Loeys, 1988; Chammanur and Fulghieri, 1994). To the
extent that EBTDA is positively correlated with free cash flow given total amounts of investment,
the hypothesis that asserts the role of debt in disciplining firms predicts that a firm with a higher
EBITDA raises funds more by debt (i.e., loans and bonds) and less by equity (Jensen, 1986;
Aghion and Bolton, 1992).
The DefaultP rob variables are the indices of default probability, which we call SAF dummies
B, C, and D, and the low coverage ratio dummy. SAF dummies are proxies for ratings based on
the SAF indices proposed by Shirota (2003). For the construction of SAF indices and SAF
dummies, see Appendix. SAF A, which we use as a benchmark, shows the lowest default
probability while SAF D shows the highest. The coverage ratio is defined as the ratio of operating
profits to the sum of interest paid and discount expenses. We construct a low coverage dummy
that takes one if the coverage ratio is less than two, following Hosono (2003) and Shirasu and Xu
(2007). The hypotheses of banks’ information production and renegotiation predict that a firm
with a lower ability of debt repayment and a higher probability of default depends more on bank
loans and less on bond issues (Diamond, 1984; Fama, 1985; Berlin and Loeys, 1988; Chammanur
and Fulghieri, 1994).
The Leverage variable is the ratio of book-valued debt to book-valued total assets. The trade-
off theory of capital structure (Kraus and Litzenberger, 1973; Scott 1976) and the pecking order
theory (Myers and Majluf, 1984) predict that a firm with a higher leverage ratio relies more on
equity than on debt as a source of external finance. Moreover, as the leverage ratio is higher, a
firm is more likely to face severe debt-overhang problems and hence depends more on bank loans
and less on bond issues if it raises funds by debt. On the other hand, Denis and Mihov (2003)

16
posit that a higher leverage reflects higher reputation in credit markets and hence that a firm with
a higher leverage can issue bonds with more favorable conditions.
The Collateral variable is the ratio of fixed tangible assets to total assets. A firm with a higher
fixed tangible asset ratio can repay more when it defaults, and hence is expected to depend more
on debt (i.e., loans and bonds) than on share. Although this variable is far from complete as a
measure of asset tangibility, as we discuss above, we include this variable to compare our result
from many previous studies.
The ManageOwn variable is the share of stocks owned by managers in total outstanding stocks.
This variable measures the degree to which the interests of managers and shareholders coincide
with each other. The hypothesis of managerial discretion predicts that a firm with a higher
managerial ownership tends to depend more on loans and less on bonds.
5.2 Descriptive Sample Statistics
Table 1 shows share of each financing sources in total external funds raised. The
average share of long-term loans is the largest, 44%, followed by short-term loans, 26%, CPs
14%, bonds 13%, and equity the smallest, 3%.
We classify the firm-year observations by the four categories: (1) no funding, (2) new
loans, (3) bond issues, and (4) share issues, and show in Table 2 the median values of the variables
used in the estimation for each category. If a firm funds by two or more sources within a year, we
count the observation for each funding source. Table 2 shows that the intangible asset ratio is the
largest for equity-issuing firms, followed by loan-issuing firms, and bond-issuing firms the
smallest. Bond-issuing firms are larger in size and exhibit higher values for the fixed tangible
asset ratio, the leverage ratio, and the default probability in terms of (the inverse of) the SAF
index than non-bond-issuing firms or no-external-funding firms. Share-issuing firms, on the other
17
hand, exhibit higher values for the growth opportunities measured by the market-to-book ratio,
and the growth rates of sales and tangible fixed assets. Finally, firms that choose loans exhibit
lower EBITDA ratio and the market-to-book ratio, but exhibit higher values for the growth rates
of sales and tangible fixed assets than bond-issuing firms.
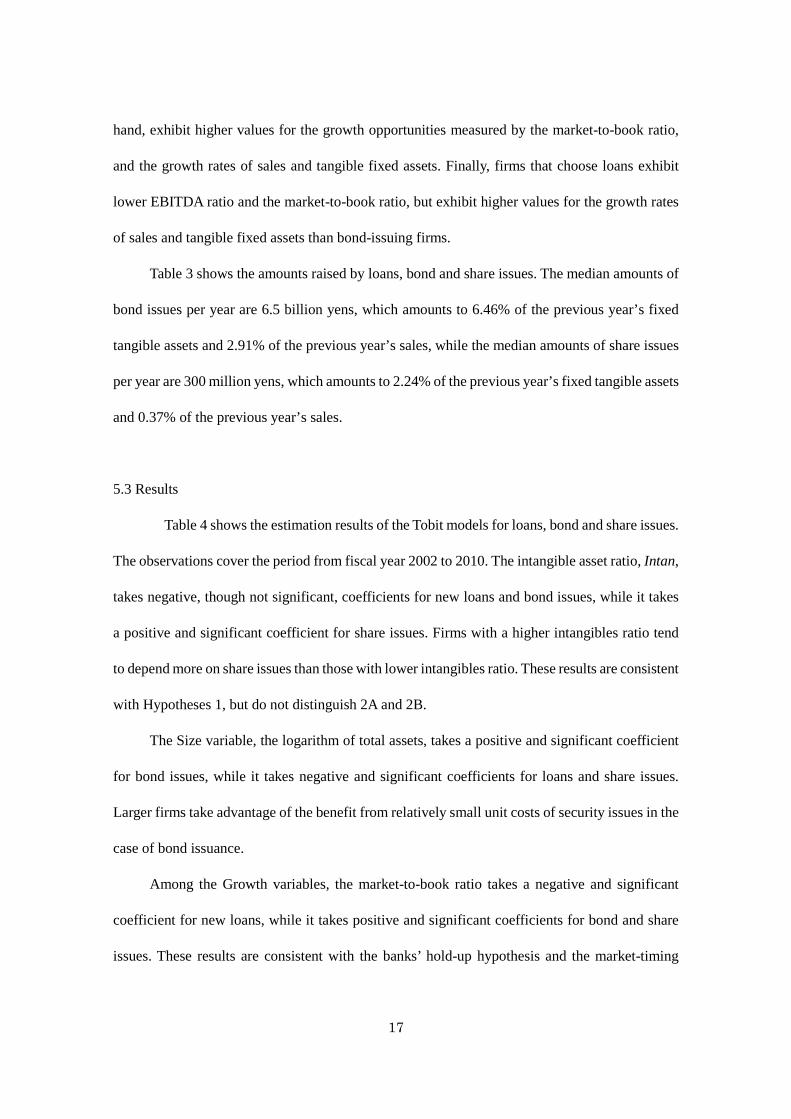
Table 3 shows the amounts raised by loans, bond and share issues. The median amounts of
bond issues per year are 6.5 billion yens, which amounts to 6.46% of the previous year’s fixed
tangible assets and 2.91% of the previous year’s sales, while the median amounts of share issues
per year are 300 million yens, which amounts to 2.24% of the previous year’s fixed tangible assets
and 0.37% of the previous year’s sales.
5.3 Results
Table 4 shows the estimation results of the Tobit models for loans, bond and share issues.
The observations cover the period from fiscal year 2002 to 2010. The intangible asset ratio, Intan,
takes negative, though not significant, coefficients for new loans and bond issues, while it takes
a positive and significant coefficient for share issues. Firms with a higher intangibles ratio tend
to depend more on share issues than those with lower intangibles ratio. These results are consistent
with Hypotheses 1, but do not distinguish 2A and 2B.
The Size variable, the logarithm of total assets, takes a positive and significant coefficient
for bond issues, while it takes negative and significant coefficients for loans and share issues.
Larger firms take advantage of the benefit from relatively small unit costs of security issues in the
case of bond issuance.
Among the Growth variables, the market-to-book ratio takes a negative and significant
coefficient for new loans, while it takes positive and significant coefficients for bond and share
issues. These results are consistent with the banks’ hold-up hypothesis and the market-timing

18
hypothesis, respectively, but not necessarily supportive of the debt-overhang hypothesis positing
that a firm with abundant growth opportunities relies less on debt. The R&D intensity and the
sales growth rate are not significant for any of the financing sources, while the tangible fixed asset
growth rate takes a positive and marginally significant coefficient for new loans.
The Profit variable, the EBITDA-to-asset ratio, takes negative and positive coefficients
both with marginal significance levels for new loans and bond issues, respectively, which is
consistent with the banks’ information production hypothesis. The EBITDA-to-asset ratio also
takes a positive and significant coefficient for share issues, which is not consistent with the
hypothesis emphasizing the role of debt in disciplining managers.
Among the Default Prob variables, the coefficients of SAF dummies B, C and D are all
positive and significant for bond issues. The size of the coefficient is the largest for SAF D,
followed by SAF C and SAF B. Given that these coefficients measure the differences from SAF
dummy A, which represents the safest class, this result suggests that the share of bond issues is
higher for the class of firms with higher default probability. On the other hand, the coefficient on
SAF B is positive and marginally significant for new loans, but neither of the coefficients on SAF
C or D is significant for new loans. These results do not support the hypothesis positing that
banks can renegotiate debt contracts with firms in financial distress better than bondholders, The
coefficients on SAF B and SAF C are negative and significant and the coefficient on SAF D is
negative and marginally significant for share issues. Firms depend more on share issues when
they are ranked at either A, the safest, or D, the riskiest. There may be two types of firms that
issue shares: one type of firms are financially healthy and issue share through a public offering
while the other face financial difficulty and issue share through allocation to third parties. The
other default measure, the low coverage dummy, takes a positive and significant coefficient for
share issues..

19
The Leverage variable, the debt-to-asset ratio, takes a negative and significant
coefficient for new loans and a positive and significant coefficient for bond issues. These results
are not consistent with the hypothesis based on banks’ renegotiation ability. Rather, the results are
consistent with the hypothesis positing that leverage reflects reputation in the credit market. On
the other hand, the debt-to-asset ratio takes a positive and significant coefficient for share issues,
which is consistent with the trade-off theory of capital structure and the pecking order hypothesis.
The Collateral variable, the ratio of fixed tangible assets to total assets, takes a positive
and significant coefficient for bond issues, while it takes a negative and significant coefficient for
share issues. It does not take a significant coefficient for new loans, suggesting that fixed assets
other than land may not be suitable as collateral of bank loans as compared to cash, securities and
other liquid assets.
Finally, the ManageOwn variable, the share of stocks owned by managers in total
outstanding stocks, is not significant either for bond or share issues, which do not support the
managerial discretion hypothesis.
We now summarize the results from the control variables and compare them with the
preceding studies. As for share issues, we have obtained the results that are consistent with the
market-timing hypothesis like the preceding studies. We have also obtained the results that are
consistent with the trade-off theory of capital structure and the pecking order hypothesis. Further,
we have found that firms depend more on share issues when their default probability is very low
or high.
As for bond issues, we have obtained results that are consistent with the banks’ hold-up
hypothesis, but we have not obtained results supporting the hypotheses based on banks’
information production and renegotiation ability. The latter result is different from preceding
studies. Shirasu and Xu (2007), for example, examine the funding choices by Japanese listed firms

20
during 1993-1997, and find that firms with high leverage tend to choose loans while firms with
low leverage tend to choose bonds. Shimatani et al. (2005) investigate the funding choices of
Japanese firms during 1996-2003 and find that firms with high ratings tend to choose bonds while
firms with low ratings tend to choose loans. The difference between these preceding studies and
our results may be accounted for by the difference in the observation periods. The bond market
in Japan has gradually become deeper and spread widely since the beginning of the 2000s and
now even firms that are not financially sound can issue bonds like in the US bond market, while
only those firms that were highly rated could issue bonds in the 1990s in Japan. In fact, examining
the U.S. firms’ funding choices during 1995-1996, Denis and Mihov (2003), like us, find that a
firm with a higher leverage ratio is more likely to issue debt.
6. Post-funding Investment
6.1 Methodology
In this section we analyze how post-funding investment differs across funding sources.
To this aim, we first estimate a Probit model for each of loan, bond and share issues, and obtain
the estimated probability, score, for issuing each of them. Then, we select firms in the control
group using the propensity score matching (PSM), in particular, the nearest-neighbor matching.
Finally, we compare changes in tangible and intangible capital investment between firms in the
treated group, i.e., those firms that raised funds by one of the three sources with firms in the
control group, i.e., those firms that did not raise funds by that source using the difference-in-
differences (DID) approach. When we choose firms in the treated and control groups of loans, we
select only those firms that did not issue loans, bonds or shares from t-1 to t+5 except for the firm
in the treated group in t, where t denotes the year of bond (share) issuance in order to lessen the
effect of the other funding sources than loans. When we choose firms in the treated and control

21
groups of bonds (or shares), we select only those firms that did not issue bonds or shares from t-
1 to t+4 except for the firm in the treated group in t, where t denotes the year of bond (or share)
issuance. For the bond and share issuance, we do not exclude those firms that borrowed loans
from t-1 to t+4 because such exclusion would greatly reduce the number of observations. The
explanatory variables for the Probit model estimation are the same as those in the Tobit model
(equation (1)). Those firms that raised no external funds are included now in the sample of the
Probit model while they are not in that of the Tobit model.
Based on the estimation results of the Probit model, we use the PSM to select firms in
the control group from those who are included in our sample in year t and fall into the same
industry s, and whose probability of issuing loans (bonds, or share) is close to the loan- ( bond-,
or share-) issuing firms but did not issue loans (bonds, or shares) at all. We then conduct DID
analyses using all the firms in the treated group and the corresponding firms in the control groups
whose data is available for each period from t to t+4. In other words, we do not restrict our sample
to the firms whose data is available throughout the period from t to t+4.
We analyze the accumulated tangible capital investment ratio, the accumulated
intangible capital investment ratio, and cash and debt, respectively, as a proportion of assets.
Specifically, we analyze the following variables for S = 0, … 4:
Accumulated tangible capital investment ratio: ∑ 𝑠𝑠𝑖𝑖𝑡𝑡+𝑠𝑠
𝑡𝑡𝑡𝑡𝑡𝑡𝑆𝑆𝑠𝑠=0,𝑆𝑆𝐾𝐾𝑖𝑖𝑡𝑡−1𝑡𝑡𝑡𝑡𝑡𝑡 − 𝑠𝑠𝑖𝑖𝑡𝑡−1
𝑡𝑡𝑡𝑡𝑡𝑡
𝐾𝐾𝑖𝑖𝑡𝑡−2𝑡𝑡𝑡𝑡𝑡𝑡
Accumulated intangible capital investment ratio: ∑ 𝑠𝑠𝑖𝑖𝑡𝑡+𝑠𝑠
𝑖𝑖𝑡𝑡𝑡𝑡𝑡𝑡𝑡𝑡𝑆𝑆𝑠𝑠=0,𝑆𝑆
𝐾𝐾𝑖𝑖𝑡𝑡−1𝑖𝑖𝑡𝑡𝑡𝑡𝑡𝑡𝑡𝑡 − 𝑠𝑠𝑖𝑖𝑡𝑡−1
𝑖𝑖𝑡𝑡𝑡𝑡𝑡𝑡𝑡𝑡
𝐾𝐾𝑖𝑖𝑡𝑡−2𝑖𝑖𝑡𝑡𝑡𝑡𝑡𝑡𝑡𝑡
Cash ratio: 𝐶𝐶𝐹𝐹𝑠𝑠ℎ𝑖𝑖𝑡𝑡+𝑆𝑆𝐴𝐴𝑠𝑠𝑠𝑠𝑆𝑆𝑡𝑡𝑖𝑖𝑡𝑡−1
− 𝐶𝐶𝐹𝐹𝑠𝑠ℎ𝑖𝑖𝑡𝑡−1𝐴𝐴𝑠𝑠𝑠𝑠𝑆𝑆𝑡𝑡𝑖𝑖𝑡𝑡−1
Debt ratio: 𝑠𝑠𝑆𝑆𝐷𝐷𝑡𝑡𝑖𝑖𝑡𝑡+𝑆𝑆𝐴𝐴𝑠𝑠𝑠𝑠𝑆𝑆𝑡𝑡𝑖𝑖𝑡𝑡−1
− 𝑠𝑠𝑆𝑆𝐷𝐷𝑡𝑡𝑖𝑖𝑡𝑡−1𝐴𝐴𝑠𝑠𝑠𝑠𝑆𝑆𝑡𝑡𝑖𝑖𝑡𝑡−1

22
6.2 Results
Table 5 shows the estimation results of the Probit model for loans, bond, and share issues
with data from fiscal year 2002 to 2010. The results for the Probit model are similar to those of
the Tobit model in many respects, Importantly, the coefficient on the intangible asset ratio is
positive, though not significant, for the probability of equity issues, and it is negative and
significant for the probability of loan issues. The latter result is consistent with Hypothesis 2B in
section 2.2. However, there are some differences between the two models, which we explain
below. For loans, the coefficients on the asset size, the three SAF dummies, the leverage ratio,
and the fixed asset ratio are all positive and significant. Although the coefficients of the SAF
dummies and the leverage ratio for the loan issuing probability may be consistent with the banks’
renegotiation hypothesis, it should be noted that the coefficients on the three SAF dummies for
bond issuing probability are also significant and larger in size. For the bond issuance probability,
no qualitative difference can be observed between the Tobit and the Probit models. Lastly, for the
share issuing probability, the growth measures of the R&D intensity, the sales growth and the
tangible fixed asset growth are all positive and significant, while the fixed asset ratio is negative
but not significant.
Table 6A shows the results for the DID analysis of loans. For loan-issuing firms, the
tangible capital investment ratio is not significant for any year, while the intangible capital
investment ratio becomes negative and significant in year t+3 and t+4. The accumulated
intangible capital investment ratio is significantly lower for loan-issuing firms by 0.444 in year
t+3 and 0.836 in year t+4, suggesting that it is lower by about 0.1-0.2 per annum. These are
economically significant considering that the counterparts of the control group are 1.361 and
2.076 in year t+3 and year t+4, respectively (or about 0.3-0.4 per annum). The cash ratio remains
insignificant, while the debt ratio is negative and significant for the first three years subsequent

23
to issuing loans. These results suggest that funds raised by loans are spent mainly on
reimbursement of debt outstanding.
Table 6B shows the results for the DID analysis of bonds. Tangible and intangible capital
investment ratios are both negative, but not significant up to t+4. The cash ratio is positive and
marginally significant in t+2, while the debt ratio is not significant in any year. These results
suggest that bond issuing-firms hoard cash after bond issuing.
Finally, Table 6C shows the results for the DID analysis of shares. The tangible capital
investment ratios turn from positive to negative from t+3, but none is significant. The intangible
capital investment ratios are positive up to t+4, but not significant. The cash ratios are positive for
t+1 and t+2. Share-issuing firms seem to spend the funds raised on cash holding, which is
consistent with the market-timing hypothesis. It is also consistent with the hypothesis of the
precautionary motives for cash holdings positing that firms that have ample investment
opportunities have strong incentives to hold on to cash because a lack of funds could lead to
missed investment opportunities (McLean, 2010).
7. Conclusion
Using a dataset of Japanese listed firms from 1995 to 2013, we examine how firms’ asset
structure in terms of the ratio of intangible to tangible capital is related to their choice of financing
sources among bank loans, equity issues (seasoned equity offerings: SEO), and bond issues. We
further investigate how the choice of financing are related to post-financing investment in tangible
and intangible capital. We find that firms with higher intangible capital ratios are less likely to
choose loans and more likely to choose equity issuance than to choose bond issues. Using
propensity score matching and difference-in-differences approach (PSM-DID), we further find
that firms that finance by loans invest less in intangible capital than firms that do not finance by

24
loans. Such a negative impact of loans is economically significant. Finally, we also obtain results
that are consistent with a number of existing theories on capital structure such as the market timing
(mispricing) hypothesis on equity issuance, the tradeoff and the pecking order hypotheses on debt
and equity, and the holdup hypothesis on bank loans.
Our results have shed a new light on firms’ choice of external financing sources from the
viewpoint of intangible capital. Our results are also suggestive of the relationship between
financial development and firm growth: development of stock markets is beneficial while
development of banking system is not sufficient for growth through the accumulation of
intangible capital.4
One possible future work is to use exogenous shocks that increased investment
opportunities for intangible capital in order to more clearly identify how firms choose financing
sources to invest for intangible capital investment.
4 As a related work, Claessens and Laeven (2003) find that strong property rights lead to higher sectoral growth in the sector where intangible-to-fixed asset ratios are higher, suggesting that property rights lead to higher growth through improve asset allocation. However, they do not examine the difference in bank loans and bond or stock markets in improving asset allocation.

25
Appendix. Construction of Default Probability (SAF dummies)
We construct a measure of the default probability, SAF, following Shirata (2003) and
group it into four categories: SAF A to D.
First, SAF is measured as follows:
SAF = 0.01036X1 + 0.02682X2 − 0.06610X3 − 0.02368X4 + 0.70773
, where
X1= Retained earnings/ total assets (as the average at beginning and end of the period) ×100
X2=Current before-tax profit/ total assets (as the average at beginning and end of the period)
×100
X3=inventory (as the average at beginning and end of the period) ×12 / sales
X4=interests and discounts paid / sales ×100
Next, we group SAF values into the following four categories.
Category Criteria Default ProbabilitySAF A 1.44<SAF LowSAF B 0.9<SAF<1.44SAF C 0.7<SAF<0.9SAF D SAF<0.7 High

26
References
Aghion, P. , P. Bolten (1992), “An Incomplete Contracts’ Approach to Financial Contracting,”
Review of Economic Studies 59.
Almazan, A. and J. Suarez (2003), ”Entrenchment and severance pay in optimal governance
structures,” Journal of Finance 58, pp.519-547.
Almeida, H. and M. Campello, 2007. Financial Constraints, Asset Tangibility, and Corporate
Investment. Review of Financial Studies 20(5): 1429-1460.
Asker, J , Farre-Mensa, Joan , and Ljungqvist, Alexander (2011) “Comparing the Investment
Behavior of Public and Private Firms.”
Albornoz, Belen Gill de and Pope, Peter F. (2004) “The Determinants of the Going Public
Decision: Evidence from the U.K.”
Baker, M., Wurgler, J. (2000), “The equity shares in new issues and aggregate stock returns.”
Journal of Finance 55, pp.2219-2257.
Baker, M., Wurgler, J. (2002), “Market timing and capital structure.” Journal of Finance 57, pp.1-
32.
Baker, M., J. C. Stein and H. Wurgler (2003), “When Does the Market Matter? Stock Prices and
the Investment of Equity Dependent Firms,” Quarterly Journal of Economics 188 (3),
pp.969-1005.
Barclay, M. J., and Smith, C. W., Jr. (1995), “The maturity structure of corporate debt”, Journal
of Finance, 50(2) pp.609-631.
Barro, R.J.(1990), “The stock market and investment.” Review of Financial Studies 3, pp.115-
132.
Berlin, M., Loeys, J. (1988), “Bond Covenants and Delegated Monitoring.” Journal of Finance
43, pp.397-412.

27
Blanchard, O., Rhee, C., Summers, L. (1993), “The stock market, profit, and investment.”
Quarterly Journal of Economics 108, pp.115-136.
Brau, James C., and Stanley E. Fawcett (2006), “Initial Public Offerings: An Analysis of Theory
and Practice” Journal of Finance 61, pp.399-436.
Brown, J.R., S.M. Fazzari and B.C. Petersen, 2009. Financing Innovation and Growth: Cash flow,
External Equity and the1990s R&D Boom. Journal of Finance 64(1):151–185.
Brown, J.R., G. Martinsson and B.C. Petersen, 2013. Law, Stock Markets and Innovation. Journal
of Finance 68(4): 1517-1549.
Brown, J.R. and B.C. Petersen, 2009. Why Has the Investment-Cash Flow Sensitivity Declined
so Sharply? Rising R&D and Equity Market Developments. Journal of Banking and
Finance 33: 971–984.
Brown, J.R. and B.C. Petersen, 2011. Cash Holdings and R&D Smoothing. Journal of
CorporateFinance17(3): 694–709.
Brynjolfsson, E. and Hitt, L.M., 2003. Computing Productivity: Firm-level Evidence. Review of
Economics and Statistics 85(4): 793–808.
Cantillo, M. and J. Wright (2000), “How do Firms Choose their Lenders? An Empirical
Investigation,” Review of Financial Studies, 13(1), pp.155-189.
Celikyurt, Ugur , Sevilir, Merih and Shivdasani Anil (2010), “Going public to acquire? The
acquisition motive in IPOs” Journal of Financial Economics 96 (2010) pp.345–363.
Chemmanur, T.J., Fulghieri, P. (1999), “A theory of the going public decision.” Review of
Financial Studies 12, pp.249-279.
Claessens, S. and L. Laeven, 2003. Financial Development, Property Rights, and Growth. Journal
of Finance 58: 2401–2436.
Denis. D.J. and V.T. Mihov (2003), “The choice among bank debt, non-bank private debt, and

28
public debt: evidence from new corporate borrowings” Journal of Financial Economics
70 (2003) pp.3–28.
Diamond, D.W. (1984), “Financial intermediation and delegated monitoring”, Review of
Economic Studies 51.
Diamond, D.W. (1991), “Monitoring and reputation: the choice between bank loans and directly
placed debt”, Journal of Political Economy 99.
Diamond, D. W. (1993), “Seniority and maturity of debt contracts”, Journal of Financial
Economics, 33(3): pp.341-368.
David, J. Denis, Vassil T. Mihov (2003), “The choice among bank debt, non-bank private debt,
and public debt: evidence from new corporate borrowings”, Journal of Financial
Economics 70.
Fama, Eugene F. (1985), “What’s different about banks?” Journal of Monetary Economics 15.
Fischer, S., Merton, R.C.(1984), “Macroeconomics and finance: the role of the stock market.”
Carnegie-Rochester Conference Series on Public Policy XXI, pp.57-108.
Frank, M.Z. and V.K. Goyal, 2009. Capital Structure Decisions: Which Factors Are Reliably
Important? Financial Management, Spring 2009: 1-37.
Fukuda, S, 2003. The Choice of Corporate Bonds (in Japanese). In S. Fukuda ed., Long-term
Finance in Japan (in Japanese), Yuhikaku, Tokyo.
Harris, M. and A. Raviv, 1991. The Theory of Capital Structure. Journal of Finance 46 (1): 297-
355.
Henderson, B., Jegadeesh, N., Weisbach, M. (2006), “World markets for raising new capital.”
Journal of Financial Economics 82: 63-101.
Hertzel, M.Z., M.R. Huson, and R. Parrino, 2012. Public Market Staging: The Timing of Capital
Infusions in Newly Public Firms. Journal of Financial Economics 106:72-90.

29
Hoshi, T., Kashyap, A., Sharfstein, D.(1993), ”The Choice between Public and Private Debt: An
Analysis of Post-deregulation Corporate Financing in Japan.” NBER Working Paper.
Hosono, K. (1998), “R&D Expenditure and The Choice between Private and Public Debt -Do the
Japanese Main Banks Extract the Firm's Rents?” Institute of Economic Research,
Hitotsubashi University, Discussion Paper No. 353.
Hosono, K.(2003), “Growth opportunities, collateral and debt structure: the case of the Japan
machine manufacturing firms”, Japan and the World Economy 15.
Houston, J., James, C.(1996), “Bank information monopolies and the mix of public and private
debt claims”, Journal of Finance 51.
Jensen,M. C.(1986), “Agency Costs of Free Cash Flow, Corporate Finance, and Takeovers”,
American Economic Review 76.
Johnson, S.(1997), “An Empirical Analysis of the Determinants of Corporate Debt Ownership
Structure,” Journal of Financial and Quantitative Analysis 32(1): 47-69.
Kale, J., Meneghetti, C.(2010), “The choice between public and private debt: a survey.” Working
paper, Georgia State University.
Kim, W., and M. Weisbach, 2008. Motivations for Public Equity Offers: An International Perspective. Journal of Financial Economics 87, pp.281-307.
Kiyotaki, N. and J. Moore, 1997. Credit Cycles. Journal of Political Economy 105(2): 211-248.
Kraus, A. and R.H. Litzenberger.(1973), “A State-Preference Model of Optimal Financial
Leverage”, Journal of Finance, September 1973, pp. 911-922.
Krishnaswami, S., Spindt, P., Subramaniam, V. (1999), “Information asymmetry, monitoring and
the placement structure of corporate debt”, Journal of Financial Economics 51.
Loughran, T., Ritter, J. (1995), “The new issues puzzle”, The Journal of Finance, vol. 50, pp.23-
51.
Loughran, T., Ritter, J. (1997), “The operating performance of firms conducting seasoned equity
30
offerings.” Journal of Finance 52, pp.1823-1850.
Magri, S., 2014. Does Issuing Equity Help R&D Activity? Evidence from Unlisted Italian High-
tech Manufacturing Firms. Economics of Innovation and New Technology 23 (8): 825-
854.
Martinsson, G., 2010. Equity Financing and Innovation: Is Europe Different from the United
States? Journal of Banking and Finance34:1215–1224.
McLean, R.D. (2011), “Share Issuance and Cash Savings” Journal of Financial Economics 99,
pp.693–715.
Meneghetti, C. (2011),“Managerial Incentives and the Choice between Public and Bank Debt,”
Journal of Corporate Finance, 2011.
McLean, R. David, (2010), “Share Issuance and Cash Saving, Forthcoming”, Journal of Financial
Economics.
Myers, S. (1977),”Determinants of corporate borrowing”, Journal of Financial Economics 20.
Myers, S., and N. Majluf (1984), “Corporate Financing and Investment Decisions When Firms
have Information that Investors Do not Have,” Journal of Financial Economics, 13,
pp.187-221.
Pagano, Marco, Fabio Panetta, and Luigi Zingales (1998), “Why do companies go public? An
empirical analysis”, Journal of Finance 53, pp.27-64.
Rajan, R. (1992), “Insiders and outsiders: the choice between informed and arm’s-length debt”,
Journal of Finance 47.
Rajan, R. and L. Zingales (1995), “What Do We Know about Capital Structure? Some Evidence
from International Data,” Journal of Finance 50(5): 1421-1460.
Rajan, R. and L. Zingales (1998), “Financial Dependence and Growth,” American Economic
Review 88(3): 559-586.Roberts, Michael R. & Amir Sufi (2009b), “Control Rights and

31
Capital Structure: An Empirical Investigation,” Journal of Finance, 64, 1657-1695.
Rock, K. (1986), “Why new issues are underpriced?”, Journal of Financial Economics, vol. 15,
pp.187-212.
Scott Jr., J H (1976), "A Theory of Optimal Capital Structure," Bell Journal of Economics, Spring,
pp 33-54.
Sharpe, Steven A., (1990), “Asymmetric Information, Bank Lending and Implicit Contracts: A
Stylized Model of Customer Relationships”, Journal of Finance 45, 1069-1087.
Shimatani, T., H. Kawai, and N. Baba (2005) “The Choice of Financing Sources by Japanese
Firms: Multi-nominal Logit Analyses” (in Japanese) Bank of Japan Working Paper
No.05-J-3.
Shirasu, Y.A. and P. Xu (2007), “The Choice of financing with public debt versus private debt:
new evidence from Japan after critical binding regulations were removed,” Japan and
World Economy,19, pp. 393-424.
Shirota, Y. (2003) Forecast Model of Firm Bankruptcy (in Japanese) Chuo Keizai-sha, Tokyo.
Stein, J.C. (1996), “Rational capital budgeting in an irrational world.” Journal of Business 69,
pp.429-455.
Subrahmanyam, A.,Titman,S. (1999), “The going public decision and the development of
financial markets.” Journal of Finance 54, pp.1045-1082.
Whited, T. (2006), “External finance constraints and the intertemporal pattern of intermittent
investment” Journal of Financial Economics 81 (2006) pp.467–502.
Wilcoxon, F. (1945), “Individual comparisons by ranking methods”, Biometrics, Vol. 1, pp. 80-
83.
Yosha, O. (1995), “‘Information disclosure costs and the choice of financing source”, Journal of
Financial Intermediation, vol. 4, pp.3-20.

32
Table 1. Share of External Financing Sources by Listed Firms in Japan: 2002-2010
Table 2. Descriptive Sample Statistics: Median
Table 3. Amounts of Funds Raised by Loans, Bonds, and Equity
Long-term loans 44%Short-term loans 26%Commercial Papers 14%Bonds 13%Equities 3%Source: NEEDS-Financial QUEST
No loan,debt andequityissues
Loan issues Bond issues Equityissues
Observations 31 7,469 1,719 904Intangible asset ratio 0.764 0.720 0.642 0.765log(Total Assets) 11.580 11.486 12.324 11.104EBITDA/Total Assets 0.081 0.082 0.083 0.098Market-to-book ratio 1.023 1.125 1.137 1.363Sales growth 0.002 0.021 0.017 0.055Tangible fixed assets growth -0.017 -0.004 -0.008 0.007R&D/Sales 0.015 0.010 0.009 0.005SAF(inverse measure of default probability) 1.002 0.975 0.857 1.049Low coverage ratio dummy 0.000 0.000 0.000 0.000Leverage ratio 0.467 0.573 0.665 0.553Fixed assets ratio 0.370 0.504 0.549 0.475Insider ownership 0.000 0.000 0.000 0.000
No. of Obs. Mean Median Std. dev.Amount of loans(million yen) 7,469 21631.33 3848.00 85999.08Amount of loans(t)/Tangible fixed assets(t-1) 7,469 0.70 0.13 11.16Amount of loans(t)/Sales(t-1) 7,469 0.09 0.04 0.23Amount of bond issues(million yen) 1,719 48379.29 6479.00 187702.20Amount of bond issues(t)/Tangible fixed assets(t-1) 1,719 0.22 0.06 1.62Amount of bond issues(t)/Sales(t-1) 1,719 0.07 0.03 0.14Amount of equity issues(million yen) 904 7596.67 299.50 38894.11Amount of equity issues(t)/Tangible fixed assets(t-1) 904 0.49 0.02 5.20Amount of equity issues(t)/Sales(t-1) 904 0.05 0.00 0.38

33
Table 4. The Share of External Funds Raised: The Two-sided Tobit Models
Coef. Std. Err Coef. Std. Err. Coef. Std. ErrIntangiblesIntangible asset ratio -0.007 0.004 -0.004 0.005 0.014 0.007 **SizeTotal assets -0.100 0.008 *** 0.132 0.009 *** -0.095 0.016 ***GrowthMarket-to-book ratio -0.238 0.023 *** 0.052 0.028 * 0.343 0.037 ***R&D/Sales 0.121 0.457 -0.073 0.513 0.685 0.809Sales growth -0.076 0.094 0.048 0.104 0.223 0.170Tangible fixed assets growth 0.127 0.073 * -0.063 0.083 -0.047 0.123ProfitEBITDA/Total Assets -0.474 0.287 * 0.556 0.332 * 1.514 0.491 ***Default ProbabilitySAF D -0.061 0.067 0.533 0.085 *** -0.201 0.117 *SAF C 0.046 0.058 0.466 0.077 *** -0.540 0.102 ***SAF B 0.077 0.047 * 0.357 0.066 *** -0.320 0.075 ***Low coverage ratio dummy -0.021 0.034 -0.019 0.036 0.208 0.068 ***LeverageLeverage ratio -0.426 0.078 *** 0.282 0.086 *** 0.776 0.145 ***CollateralFixed assets ratio -0.066 0.069 0.395 0.078 *** -0.519 0.124 ***OwnershipManagerial Ownership 0.151 1.471 -52.132 49.445 -1.030 2.081YearYear2003 -0.088 0.042 ** 0.104 0.044 ** 0.121 0.091Year2004 -0.159 0.042 *** 0.081 0.044 * 0.381 0.087 ***Year2005 -0.224 0.042 *** 0.085 0.045 * 0.540 0.086 ***Year2006 -0.111 0.043 ** 0.013 0.047 0.448 0.086 ***Year2007 -0.064 0.044 -0.040 0.048 0.373 0.087 ***Year2008 0.071 0.044 -0.044 0.047 0.056 0.091Year2009 -0.023 0.043 0.045 0.045 0.112 0.092Year2010 -0.021 0.045 0.008 0.047 0.177 0.094 *Constant 2.936 0.193 *** -2.611 0.220 *** -1.102 0.355 ***Industy dummy Yes Yes YesNumberof obs 7,582 7,582 7,582LR chi 945.82 960.63 808.99Prob >chi2 0 0 0PseudoR2 0.0855 0.1169 0.1361Note : *** , ** , and * denote the significance levels of 0.01, 0.05, and 0.1, respectively.
Loans Bonds Equities

34
Table 5. The Probability of External Financing: The Probit Models
Coef. Std. Err Coef. Std. Err. Coef. Std. Err.IntangiblesIntangible asset ratio -0.013 0.006 ** -0.009 0.008 0.005 0.007SizeTotal assets 0.142 0.015 *** 0.269 0.014 *** -0.093 0.017 ***GrowthMarket-to-book ratio -0.104 0.034 *** 0.066 0.045 0.328 0.037 ***R&D/Sales 1.195 0.625 * -0.201 0.797 1.594 0.811 **Sales growth 0.162 0.147 0.145 0.163 0.519 0.176 ***Tangible fixed assets growth 0.713 0.121 *** 0.103 0.131 0.241 0.129 *ProfitEBITDA/Total Assets 0.102 0.426 0.856 0.514 * 1.380 0.514 ***Default ProbabilitySAF D 0.476 0.100 *** 0.956 0.132 *** 0.006 0.124SAF C 0.529 0.084 *** 0.834 0.119 *** -0.344 0.107 ***SAF B 0.332 0.059 *** 0.571 0.103 *** -0.108 0.078Low coverage ratio dummy -0.107 0.061 * -0.026 0.059 0.209 0.073 ***LeverageLeverage ratio 1.768 0.117 *** 1.053 0.133 *** 1.258 0.151 ***CollateralFixed assets ratio 1.789 0.111 *** 1.176 0.123 *** -0.014 0.128OwnershipManagerial Ownership -1.669 2.000 -48.557 70.854 -0.087 2.254YearYear2003 0.047 0.070 0.152 0.071 ** 0.113 0.095Year2004 0.111 0.071 0.143 0.072 ** 0.379 0.091 ***Year2005 0.089 0.071 0.165 0.074 ** 0.544 0.089 ***Year2006 0.152 0.072 ** 0.080 0.076 0.461 0.090 ***Year2007 0.179 0.072 ** -0.002 0.077 0.395 0.090 ***Year2008 0.325 0.072 *** 0.036 0.076 0.101 0.095Year2009 0.075 0.069 0.088 0.073 0.071 0.096Year2010 0.045 0.070 0.004 0.076 0.114 0.099Constant -2.151 0.356 *** -5.447 0.385 *** -1.607 0.369 ***Industy dummy Yes Yes YesNumberof obs 9,312 9,357 9,317LR chi 1670.68 1709.4 713.57Prob >chi2 0 0 0PseudoR2 0.1674 0.194 0.1221Note : *** , ** , and * denote the significance levels of 0.01, 0.05, and 0.1, respectively.
Loans Bonds Equities

35
Table6. The Effect of External Financing on Post-funding Investment: Difference-in-differences
A. Loans
B. Bonds
Variable Treated Controls Difference S.E.Accumulated tangible capital investment ratio_from (t-1) to (t) -0.012 -0.045 0.034 0.054Accumulated tangible capital investment ratio_from (t-1) to (t+1) 0.436 0.399 0.037 0.091Accumulated tangible capital investment ratio_from (t-1) to (t+2) 0.961 1.015 -0.054 0.174Accumulated tangible capital investment ratio_from (t-1) to (t+3) 1.546 1.597 -0.051 0.284Accumulated tangible capital investment ratio_from (t-1) to (t+4) 2.224 1.975 0.250 0.433Accumulated intangible capital investment ratio_from (t-1) to (t) -0.028 -0.080 0.053 0.041Accumulated intangible capital investment ratio_from (t-1) to (t+1) 0.303 0.293 0.010 0.064Accumulated intangible capital investment ratio_from (t-1) to (t+2) 0.626 0.707 -0.081 0.100Accumulated intangible capital investment ratio_from (t-1) to (t+3) 0.917 1.361 -0.444 0.210 **Accumulated intangible capital investment ratio_from (t-1) to (t+4) 1.239 2.076 -0.836 0.317 **Cash ratio_from (t-1) to (t) 0.004 0.007 -0.002 0.004Cash ratio_from (t-1) to (t+1) 0.008 0.009 0.000 0.006Cash ratio_from (t-1) to (t+2) 0.012 0.003 0.009 0.008Cash ratio_from (t-1) to (t+3) 0.016 0.016 0.000 0.011Cash ratio_from (t-1) to (t+4) 0.022 0.008 0.014 0.015Debt ratio_from (t-1) to (t) -0.100 0.112 -0.212 0.078 **Debt ratio_from (t-1) to (t+1) -0.185 0.213 -0.398 0.147 **Debt ratio_from (t-1) to (t+2) -0.275 0.473 -0.748 0.183 **Debt ratio_from (t-1) to (t+3) -0.249 0.070 -0.319 0.193Debt ratio_from (t-1) to (t+4) -0.363 0.132 -0.495 0.393
Variable Treated Controls Difference S.E.Accumulated tangible capital investment ratio_from (t-1) to (t) -34.270 -0.057 -34.213 34.254Accumulated tangible capital investment ratio_from (t-1) to (t+1) -42.881 0.481 -43.362 43.294Accumulated tangible capital investment ratio_from (t-1) to (t+2) -56.173 1.073 -57.246 57.160Accumulated tangible capital investment ratio_from (t-1) to (t+3) -75.351 1.796 -77.147 77.086Accumulated tangible capital investment ratio_from (t-1) to (t+4) -109.401 2.855 -112.256 111.825Accumulated intangible capital investment ratio_from (t-1) to (t) -0.874 -0.031 -0.843 0.864Accumulated intangible capital investment ratio_from (t-1) to (t+1) -0.742 0.353 -1.094 1.090Accumulated intangible capital investment ratio_from (t-1) to (t+2) -0.757 0.762 -1.520 1.437Accumulated intangible capital investment ratio_from (t-1) to (t+3) -0.889 1.017 -1.907 1.931Accumulated intangible capital investment ratio_from (t-1) to (t+4) -1.446 1.381 -2.827 2.797Cash ratio_from (t-1) to (t) 0.004 0.004 0.000 0.003Cash ratio_from (t-1) to (t+1) 0.012 0.003 0.009 0.005 *Cash ratio_from (t-1) to (t+2) 0.013 0.006 0.007 0.006Cash ratio_from (t-1) to (t+3) 0.016 0.012 0.004 0.008Cash ratio_from (t-1) to (t+4) 0.019 0.013 0.006 0.009Debt ratio_from (t-1) to (t) -0.147 -0.001 -0.146 0.132Debt ratio_from (t-1) to (t+1) -0.144 -0.115 -0.029 0.185Debt ratio_from (t-1) to (t+2) -0.153 -0.290 0.137 0.402Debt ratio_from (t-1) to (t+3) 0.079 -0.119 0.197 0.399Debt ratio_from (t-1) to (t+4) 0.084 -0.164 0.248 0.540

36
C. Equity
Note: ** t-statistics>2.0, * 1.7<= t-statistics <2.0
Variable Treated Controls Difference S.E.Accumulated tangible capital investment ratio_from (t-1) to (t) 0.005 -0.016 0.021 0.074Accumulated tangible capital investment ratio_from (t-1) to (t+1) 0.483 0.415 0.068 0.122Accumulated tangible capital investment ratio_from (t-1) to (t+2) 0.974 0.914 0.061 0.188Accumulated tangible capital investment ratio_from (t-1) to (t+3) 1.469 1.943 -0.474 0.398Accumulated tangible capital investment ratio_from (t-1) to (t+4) 2.100 2.584 -0.484 0.535Accumulated intangible capital investment ratio_from (t-1) to (t) -0.015 -0.020 0.005 0.066Accumulated intangible capital investment ratio_from (t-1) to (t+1) 0.370 0.342 0.028 0.121Accumulated intangible capital investment ratio_from (t-1) to (t+2) 0.922 0.787 0.135 0.186Accumulated intangible capital investment ratio_from (t-1) to (t+3) 1.322 1.095 0.227 0.239Accumulated intangible capital investment ratio_from (t-1) to (t+4) 1.683 1.640 0.042 0.339Cash ratio_from (t-1) to (t) 0.007 0.000 0.008 0.006Cash ratio_from (t-1) to (t+1) 0.018 0.001 0.017 0.008 **Cash ratio_from (t-1) to (t+2) 0.024 0.006 0.018 0.010 *Cash ratio_from (t-1) to (t+3) 0.026 0.021 0.005 0.014Cash ratio_from (t-1) to (t+4) 0.028 0.025 0.003 0.014Debt ratio_from (t-1) to (t) -0.088 -0.126 0.038 0.112Debt ratio_from (t-1) to (t+1) -0.076 -0.091 0.015 0.118Debt ratio_from (t-1) to (t+2) -0.108 0.036 -0.143 0.191Debt ratio_from (t-1) to (t+3) -0.111 0.145 -0.256 0.362Debt ratio_from (t-1) to (t+4) -0.091 0.815 -0.906 0.624