insulin resistance and alzheimer’s disease: a novel ... · insulin resistance and alzheimer’s...
TRANSCRIPT

Insulin Resistance and Insulin Resistance and AlzheimerAlzheimer’’s Disease: s Disease:
A Novel Therapeutic TargetA Novel Therapeutic Target
Suzanne CraftSuzanne Craft
Geriatric Research, Education, and Clinical CenterGeriatric Research, Education, and Clinical CenterVA Puget SoundVA Puget Sound
Professor of Psychiatry and Behavioral SciencesProfessor of Psychiatry and Behavioral SciencesUniversity of Washington School of MedicineUniversity of Washington School of Medicine

OverviewOverview
•• Insulin plays a role in cognition and normal Insulin plays a role in cognition and normal brain functionbrain function
•• Dysregulation of insulin increases risk for AD Dysregulation of insulin increases risk for AD and other neurodegenerative diseasesand other neurodegenerative diseases
•• Potential mechanisms of increased risk: Potential mechanisms of increased risk: Effects on inflammation and Effects on inflammation and ββ--amyloidamyloid
•• Therapeutic applications: Effects of treating Therapeutic applications: Effects of treating insulin resistance and insulin resistance and normalzingnormalzing CNS insulin CNS insulin

Insulin and the BrainInsulin and the Brain•• Insulin crosses BBB via Insulin crosses BBB via saturablesaturable receptorreceptor--
mediated mediated trancytosistrancytosis (Banks et al, 97)(Banks et al, 97)
•• Insulin receptors have synaptic localization in Insulin receptors have synaptic localization in hippocampus and throughout cortexhippocampus and throughout cortex ((ApeltApelt et al, 2001)et al, 2001)
•• Increases glucose utilization in specific brain Increases glucose utilization in specific brain regions regions (Bingham et al, 2002)(Bingham et al, 2002)
•• Increases levels of dopamine, acetylcholine, Increases levels of dopamine, acetylcholine, norepinephrinenorepinephrine ((FiglewiczFiglewicz et al, 1993)et al, 1993)
•• Modulates membrane potentials, membrane Modulates membrane potentials, membrane expression of NMDA receptors, and neuronal expression of NMDA receptors, and neuronal firing/LTP in hippocampus and EC firing/LTP in hippocampus and EC ((SkeberdisSkeberdis et al, 2001)et al, 2001)
•• Enhances memory at Enhances memory at optimaloptimal dosedose

Chronic Effects of Insulin:Chronic Effects of Insulin:Too Much of a Good ThingToo Much of a Good Thing
•• Insulin typically secreted and cleared quicklyInsulin typically secreted and cleared quickly
•• High, chronic elevations problematicHigh, chronic elevations problematic
Reduced brain insulin uptakeReduced brain insulin uptake(Schwartz et al, 1990; Stein et al, 1987)(Schwartz et al, 1990; Stein et al, 1987)
Reduced neurotransmitter levelsReduced neurotransmitter levelsReduced glucose utilization (periphery Reduced glucose utilization (periphery and CNS?) and CNS?) Memory impairmentMemory impairment

Insulin Resistance and Insulin Resistance and AlzheimerAlzheimer’’s Diseases Disease
• Insulin resistance/hyperinsulinemia increase risk of AD and memory impairment (Ott et al, 1999; Peila et al, 2002; Luchsinger et al, 2004)
• Risk increases with age (Ryan et al, 2001)
• Insulin resistance a particular risk factor for AD patients without the APOE-e4 allele (Kuusisto et al, 97; Liotsa et al, 02; Craft et al, 03)
• Insulin may modulate risk in part through effects on Aβ42
Modulates Aβ42 levels in vitroEnhances release, regulates degradation by IDE (Gasparini et al, 2001; Qiu et al, 2001; Zhao et al, 2004)

Does Insulin Affect CNSDoes Insulin Affect CNSLevels of ALevels of Aββ??
•• Will insulin administration raise AWill insulin administration raise Aββ42 levels in 42 levels in CSF, consistent with CSF, consistent with in vitroin vitro effects of insulin effects of insulin on Aon Aββ release & degradation?release & degradation?
•• Will effects differ according to age?Will effects differ according to age?
•• Will results be related to changes in Will results be related to changes in biomarkers associated with inflammation?biomarkers associated with inflammation?

MethodsMethods
IVIV
90 90 minmin
105 105 minmin
Insulin/dextrose or saline infusionInsulin/dextrose or saline infusion
CognitiveCognitivetestingtesting
Plasma glucosePlasma glucosemeasured everymeasured every
55--10 min10 minLP for CSF LP for CSF collectioncollection
SalineSaline Insulin Insulin ( 85 µU/ml ) )
Dextrose Dextrose ( 95 mg/dl )
Fasted Subjects (n=16, mean age = 68.7)Fasted Subjects (n=16, mean age = 68.7)
Separate days, counterbalanced order

Effects of Insulin on CSF AEffects of Insulin on CSF Aßß42 Levels in 42 Levels in Normal Older Adults: ResultsNormal Older Adults: Results
-30
-10
10
3030
50
70
50 60 70 80 90Age
% Change in CSF Aβ42 Levels
( pg / ml )
r = .64, p < .008r = .64, p < .008
r = .85r = .85p < .008p < .008
< 70 yrs≥ 70 yrs
InsulinInsulin--induced change in Ainduced change in Aββ42 42 is correlated with ageis correlated with age
Watson GS, et al. Watson GS, et al. Neurology 2003;60(12):1899-903

Results Results CytokinesCytokines3.5
00.51
1.52
2.53
InsulinSaline
CSF IL-1β(pg / ml)
Saline Insulin0
0.6
1.2
1.8CSF IL-6 (pg / ml)
5CSF IL-1α(pg / ml)
Saline01
2
34
Insulin
0
1
2
3
InsulinSaline
CSF TNFα
(pg / ml)
*p-values < .0001-.002 Fishel et al. Neurology, 2005

ResultsResults CSF F2CSF F2--IsoPIsoPCSF F2-Isoprostane levels increase
in response to insulin
* p < .01
F2-IsoP(pg / ml)
Insulin
3030
00
1010
2020
4040
5050
Saline

ResultsResultsInsulin-induced change in CSF Aβ42 is correlated with F2-Isoprostane levels for the OLDER normal adultsnormal adultsOLDER
ALL : r = .15, p = ns
-400
-200
0
200
400
600
800
-20 0 20 40 60
Insulin - Saline CSF Aβ42 Levels
( pg / ml )
Insulin - Saline CSF F2-IsoP Levels ( pg / ml )
OLD : r = .87, p = .005

Does insulin have similar role Does insulin have similar role in in AAββ regulation in periphery?regulation in periphery?
•• AAββ cleared in liver and other peripheral sitescleared in liver and other peripheral sites((GhisoGhiso et al 04)et al 04)
•• Plasma APlasma Aββ elevated for some AD patients, declines elevated for some AD patients, declines with progressionwith progression ((MayeuxMayeux et al. 03; et al. 03; ErtekinErtekin--TanerTaner et al. 04)et al. 04)
•• AAββ transported between periphery and braintransported between periphery and brain((MackicMackic et al. 02; et al. 02; DeMattosDeMattos et al. 02)et al. 02)
•• IGFIGF--1 and insulin increase levels of carrier proteins 1 and insulin increase levels of carrier proteins that bind Athat bind Aββ and regulate its transportand regulate its transport ((CarroCarro et al. 02)et al. 02)
•• High plasma AHigh plasma Aββ may obstruct clearance from or may obstruct clearance from or increase transport into brainincrease transport into brain

DoseDose--response effects of response effects of intravenous insulin on plasma Aintravenous insulin on plasma Aββ42 42
--100100
--5050
00
5050
100100
150150
200200
% change in plasma
Aβ42
ADADNormalNormal
--0.330.33 11 1.671.67*p=0.009*p=0.009 Infusion Rate Infusion Rate
((µµU/kg/min)U/kg/min)RegerReger et al. et al. in pressin press

Model of Peripheral Insulin Resistance &Model of Peripheral Insulin Resistance &HyperinsulinemiaHyperinsulinemia Effects on AEffects on Aββ RegulationRegulation

Therapeutic ImplicationsTherapeutic Implications
•• Raising plasma insulin invoked ageRaising plasma insulin invoked age--related related increases in CSF Aincreases in CSF Aββ42 & inflammatory markers for 42 & inflammatory markers for normal adults, raised plasma Anormal adults, raised plasma Aββ for AD patientsfor AD patients
•• Mechanisms through which insulin resistance Mechanisms through which insulin resistance increases risk of AD with age?increases risk of AD with age?
•• Treatment of insulin resistance that lowers insulin Treatment of insulin resistance that lowers insulin and improves its effectiveness may be of and improves its effectiveness may be of therapeutic benefit therapeutic benefit
•• PPARPPARγγ agonists (agonists (TZDsTZDs) promising because they ) promising because they increase peripheral insulin sensitivity, reduce increase peripheral insulin sensitivity, reduce peripheral insulin and inflammationperipheral insulin and inflammation

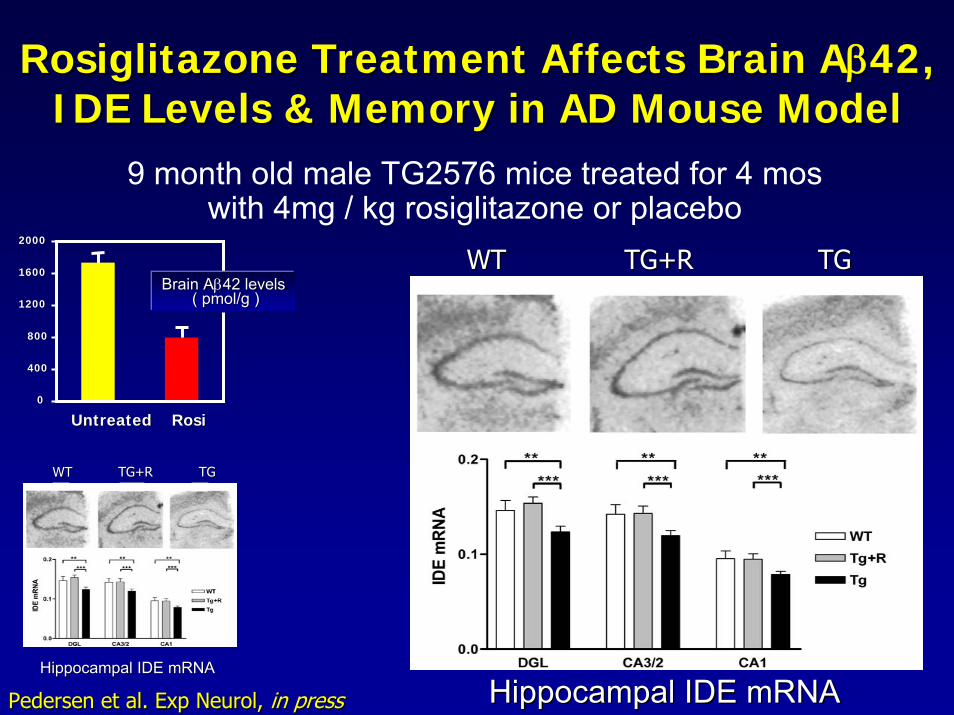
RosiglitazoneRosiglitazone Treatment Affects Brain ATreatment Affects Brain Aββ42, 42, IDE Levels & Memory in AD Mouse ModelIDE Levels & Memory in AD Mouse Model
9 month old male TG2576 mice treated for 4 moswith 4mg / kg rosiglitazone or placebo
Pedersen et al. Exp Pedersen et al. Exp NeurolNeurol, , in pressin press
00
400400
800800
12001200
16001600
20002000
UntreatedUntreated RosiRosi
Brain ABrain Aββ42 levels42 levels( ( pmol/gpmol/g ))00
400400
800800
12001200
16001600
20002000
UntreatedUntreated RosiRosi
Brain ABrain Aββ42 levels42 levels( ( pmol/gpmol/g ))
RosiglitazoneRosiglitazone Treatment Affects Brain ATreatment Affects Brain Aββ42, 42, IDE Levels & Memory in AD Mouse ModelIDE Levels & Memory in AD Mouse Model
9 month old male TG2576 mice treated for 4 moswith 4mg / kg rosiglitazone or placebo
00
400400
800800
12001200
16001600
20002000
UntreatedUntreated RosiRosi
Brain ABrain Aββ42 levels42 levels( ( pmol/gpmol/g ))
TGTGTG+RTG+RWTWT
Hippocampal IDE mRNAHippocampal IDE mRNA
TGTGTG+RTG+RWTWT
Hippocampal IDE mRNAHippocampal IDE mRNA
Pedersen et al. Exp Pedersen et al. Exp NeurolNeurol, , in pressin press

RosiglitazoneRosiglitazone Treatment Affects Brain ATreatment Affects Brain Aββ42, 42, IDE Levels & Memory in AD Mouse ModelIDE Levels & Memory in AD Mouse Model
9 month old male TG2576 mice treated for 4 moswith 4mg / kg rosiglitazone or placebo
00
400400
800800
12001200
16001600
20002000
UntreatedUntreated RosiRosi
Brain ABrain Aββ42 levels42 levels( ( pmol/gpmol/g ))
Day 1Day 1 Day 2Day 2 Day 3Day 30.00.0
0.50.5
1.01.0
1.51.5
2.02.0
2.52.5
3.03.0
*WTTG+RTG
TGTGTG+RTG+RWTWT
Hippocampal IDE mRNAHippocampal IDE mRNA Working Memory ErrorsWorking Memory ErrorsPedersen et al. Exp Pedersen et al. Exp NeurolNeurol, , in pressin press

Effects of Effects of RosiglitazoneRosiglitazone on Cognition in on Cognition in Patients with Early AD or Patients with Early AD or AmnesticAmnestic MCIMCI
SubjectsSubjects•• AmnesticAmnestic MCI or early AD MCI or early AD (Petersen et al. 2003 or (Petersen et al. 2003 or
NINCDS/ADRDA criteria)NINCDS/ADRDA criteria), CDR = 0.5 or 1.0, MMSE > 15, CDR = 0.5 or 1.0, MMSE > 15•• No diabetes or other relevant medical conditionsNo diabetes or other relevant medical conditions•• No meds with known CNS effects other than No meds with known CNS effects other than ChEIChEI
Cognitive Testing Cognitive Testing TreatmentTreatmentInitiatedInitiated
Wk 32Wk 32WashoutWashout
Wk 8Wk 8 Wk 16Wk 16Wk 0Wk 0 Wk 24Wk 24
DoubleDouble--blindblindRandomized (2:1)Randomized (2:1)
RosiglitazoneRosiglitazone (n=20)(n=20)
Placebo (n=10)Placebo (n=10)
Watson et al. Watson et al. Am J Geriatr PsychiatryAm J Geriatr Psychiatry 20052005

Sample Sample Demographics
Cognitive Cognitive BatteryBatteryDemographics
•• General CognitionGeneral CognitionMini Mental State ExamMini Mental State Exam
•• MemoryMemoryBuschkeBuschke Reminding TestReminding TestStory RecallStory Recall
•• AttentionAttentionStroopStroop Interference TestInterference TestTrailTrail--Making TestMaking Test
•• LanguageLanguageSemantic FluencySemantic FluencyPicture NamingPicture NamingNarrative WritingNarrative Writing
Rosi(n = 20)
Placebo(n = 10)
Age years 72.8 (6.6) 73.3 (6.0)
AD/MCI 14/6 7/3
Sex (F/M) 6/14 3/7
MMSE 22.7 (4.5) 23.3 (5.4)
BMI 24.2 (2.7) 24.4 (4.2)
ChEI + 25% 20%

Results Results Delayed Verbal MemoryDelayed Verbal Memory
p = 0.04p = 0.04 p = 0.001p = 0.001
Tota
l Wor
ds R
ecal
led
Tota
l Wor
ds R
ecal
led
placebo rosiglitazone
55
66
77
Month 2Month 2 Month 4Month 4 Month 6Month 6Watson GS, et al. Watson GS, et al. Am J Geriatr PsychiatryAm J Geriatr Psychiatry (In press).(In press).

ResultsResults
•• Plasma insulin levels lower after 6 Plasma insulin levels lower after 6 months for months for rosirosi--treated group (p=.0026)treated group (p=.0026)
•• Improvement in memory, selective Improvement in memory, selective attention, and verbal fluency related to attention, and verbal fluency related to metabolic treatment response metabolic treatment response –– indexed indexed by reduced insulin levelsby reduced insulin levels
•• No relationship between treatment No relationship between treatment response and stage of diseaseresponse and stage of disease

RosiglitazioneRosiglitazione XR Study AVA100193XR Study AVA100193RisnerRisner et al., et al., PharmacogenomicsPharmacogenomics J, 2006J, 2006
•• Population:Population:–– Mild to moderate AlzheimerMild to moderate Alzheimer’’s Disease (MMSE 16 s Disease (MMSE 16 –– 26)26)
–– Treatment naTreatment naïïve, receiving no AD pharmacotherapiesve, receiving no AD pharmacotherapies
•• Primary ObjectivesPrimary Objectives::
–– Cognitive function: Cognitive function: ADASADAS--cogcog
–– Clinical response: Clinical response: CIBIC+CIBIC+
•• Secondary Objectives:Secondary Objectives:–– Other Cognitive/Functional assessments: Other Cognitive/Functional assessments: NPI, MMSENPI, MMSE–– Safety, tolerability: Safety, tolerability: AEs, AEs, hematologyhematology, etc, etc
–– Insulin sensitivity, glycemic control: Insulin sensitivity, glycemic control: insulin, glucose, etcinsulin, glucose, etc
–– Pharmacogenetics:Pharmacogenetics: interaction by APOE genotypeinteraction by APOE genotype

GlaxoSmithKline AVA100193GlaxoSmithKline AVA1001932424--week, DB, PBOweek, DB, PBO--controlled, dosecontrolled, dose--ranging ranging
study to investigate rosiglitazone in ADstudy to investigate rosiglitazone in AD
-2 wk 0 2 wk 4 wk 8 wk 12 wk 16 wk 24 26 wkV1 V2 V3 V4 V5 V6 V7 V8 V9
ScreeningScreening
End of TreatmentEnd of TreatmentRandomizationRandomization
FollowFollow--upup
Placebo n = 125
2 mg RSG n = 125
4 mg RSG n = 125
8 mg RSG n = 1254 mg RSG
RisnerRisner et al. et al. PharmacogenomicsPharmacogenomics JJ, 2006, 2006

GSK GSK RosiglitazoneRosiglitazone Trial : AVA100193Trial : AVA100193DemographicsDemographics
PlaceboPlacebo(N=122)(N=122)
RSG 2mgRSG 2mg(N=127)(N=127)
RSG 4mgRSG 4mg(N=130)(N=130)
RSG 8mgRSG 8mg(N=132)(N=132)
Gender: Gender: FemaleFemaleMaleMale
77 (63%)77 (63%)45 (37%)45 (37%)
71 (56%)71 (56%)56 (44%)56 (44%)
73 (56%)73 (56%)57 (44%)57 (44%)
87 (66%)87 (66%)45 (34%)45 (34%)
Age: Age: Mean (SD)Mean (SD)MinMin--MaxMax
71.8 (8.2)71.8 (8.2)50 50 -- 8585
70.9 (8.5)70.9 (8.5)50 50 -- 8585
69.7 (9.0)69.7 (9.0)50 50 -- 8585
70.5 (8.5)70.5 (8.5)51 51 -- 8585
BMI: BMI: Mean (SD)Mean (SD) 25.67 (3.8)25.67 (3.8) 25.51 (4.0)25.51 (4.0) 25.88 (3.4)25.88 (3.4) 25.82 (3.9)25.82 (3.9)
MMSE : MMSE : MeanMean 20.8 (3.44)20.8 (3.44) 21.3 (3.07)21.3 (3.07) 21.6 (2.87)21.6 (2.87) 21.4 (3.20)21.4 (3.20)

Analysis Summary : Analysis Summary : Change from Baseline in ADASChange from Baseline in ADAS--Cog at Cog at Week 24 (LOCF) Week 24 (LOCF)
TreatmentTreatment NN Least SquaresLeast SquaresMean (SE)Mean (SE)
Treatment ComparisonTreatment Comparison(RSG vs. Placebo)(RSG vs. Placebo)
DifferenceDifference pp--valuevalue
PlaceboPlacebo 122122 --0.4 (0.55)0.4 (0.55)
RSG 2 mgRSG 2 mg 126126 --0.2 (0.54)0.2 (0.54) 0.250.25 0.740.74
4 mg4 mg 129129 --0.9 (0.54)0.9 (0.54) --0.460.46 0.520.52
8 mg8 mg 131131 --0.7 (0.53)0.7 (0.53) --0.270.27 0.710.71
ADASADAS--cog assesses various cognitive abilities such as memory, orientacog assesses various cognitive abilities such as memory, orientation in tion in time and place, etc. Scores range from 0 to 70; higher scores itime and place, etc. Scores range from 0 to 70; higher scores indicate greater ndicate greater dysfunction while negative change indicates improvementdysfunction while negative change indicates improvement
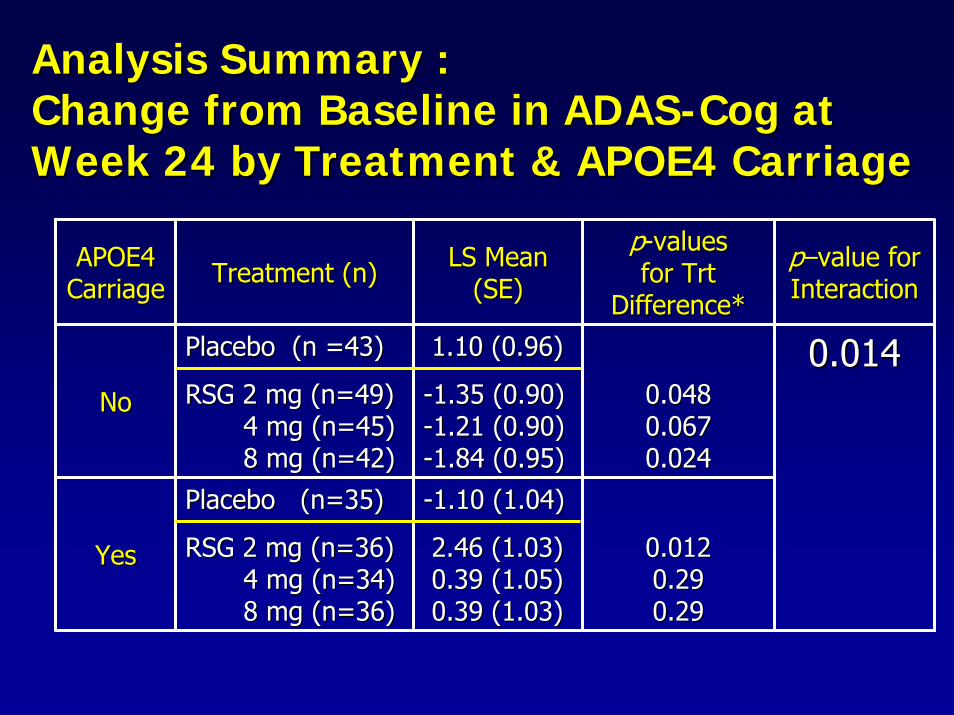
Analysis Summary : Analysis Summary : Change from Baseline in ADASChange from Baseline in ADAS--Cog at Cog at Week 24 by Treatment & APOE4 Carriage Week 24 by Treatment & APOE4 Carriage
APOE4 APOE4 CarriageCarriage Treatment (n)Treatment (n) LS Mean LS Mean
(SE)(SE)
pp--values values for for TrtTrt
Difference*Difference*
pp––value for value for InteractionInteraction
NoNo
Placebo (n =43)Placebo (n =43)
RSG 2 mg (n=49)RSG 2 mg (n=49)4 mg (n=45)4 mg (n=45)8 mg (n=42)8 mg (n=42)
1.10 (0.96)1.10 (0.96)
--1.35 (0.90)1.35 (0.90)--1.21 (0.90)1.21 (0.90)--1.84 (0.95)1.84 (0.95)
0.0480.0480.0670.0670.0240.024
YesYes
Placebo (n=35)Placebo (n=35)
RSG 2 mg (n=36)RSG 2 mg (n=36)4 mg (n=34)4 mg (n=34)8 mg (n=36)8 mg (n=36)
--1.10 (1.04)1.10 (1.04)
2.46 (1.03)2.46 (1.03)0.39 (1.05)0.39 (1.05)0.39 (1.03)0.39 (1.03)
0.0120.0120.290.290.290.29
0.0140.014

Mean Change from Baseline in ADASMean Change from Baseline in ADAS--Cog Cog for APOE4for APOE4-- Subjects OnlySubjects Only
--2.52.5Clinical improvement
Clinical decline
RSG 8 mg (p=0.01)
RSG 2 mg (p=0.04)RSG 4 mg (p=0.04)
--22
--1.51.5
--11
--0.50.5
00
0.50.5
11
1.51.5 PLACEBO22
2.52.5
Baseline Week 8 Week 16 Week 24

Intranasal Insulin & the CNSIntranasal Insulin & the CNSIntranasal insulin administration:Intranasal insulin administration:•• Increases CSF insulin and improves memory within 30Increases CSF insulin and improves memory within 30--
min in young, healthy adults without changing plasma min in young, healthy adults without changing plasma glucose or insulin glucose or insulin (Born et al. 02; Benedict et al. 04)(Born et al. 02; Benedict et al. 04)
•• Can intranasal insulin administration Can intranasal insulin administration ““normalizenormalize””reduced CNS insulin that characterizes some patients reduced CNS insulin that characterizes some patients with AD, and thereby improve memory?with AD, and thereby improve memory?
•• InsulinInsulin--like peptide signal measurable in rat like peptide signal measurable in rat hippocampus, amygdala, frontal cortex 30 min after hippocampus, amygdala, frontal cortex 30 min after intranasal administration intranasal administration (Thorne et al. 04)(Thorne et al. 04)

Intranasal Pathways to the BrainIntranasal Pathways to the Brainin Humansin Humans
•• Bulk flow along Bulk flow along rostralrostral(olfactory) or caudal (olfactory) or caudal (trigeminal) (trigeminal) perivascularperivascularchannels; agents reach channels; agents reach brain in minutes brain in minutes (Thorne et al. 01)(Thorne et al. 01)
•• Axonal transport Axonal transport through olfactory through olfactory neurons, which require neurons, which require hours to reach brainhours to reach brain

Study 1Study 1 MethodsMethods
ProcedureProcedure
Blood draw
Saline20 IU Ins40 IU Ins
Blood draw
1212--hour hour fastfast
Intranasal Intranasal AdministrationAdministration
8:008:00 8:158:15 8:458:45
Cognitive Cognitive TestingTesting

Study 1Study 1 MethodsMethods
SubjectsSubjects
NormalNormalControls Controls
ADADεε44-- εε4+4+Mean (Mean (sdsd))
NNAge ( yrs ) Age ( yrs )
BMI ( kg/mBMI ( kg/m22 ))( max=144 )( max=144 )DRSDRS
EducationEducation
141477 (6)77 (6)
25 (3)25 (3)127 (10)127 (10)
14 (2)14 (2)
353575 (6)75 (6)
26 (3)26 (3)140 (4)140 (4)
15 (2)15 (2)
121277 (5)77 (5)
25 (3)25 (3)125 (11)125 (11)
15 (2)15 (2)

Study 1Study 1 ResultsResultsTotal Story RecallTotal Story Recall
*
*
130
110
Perc
ent C
hang
e
90
70 20 IU Ins40 IU Ins50
30
10
-10
Normal AD/e4+ AD/e4-RegerReger et al. et al. NeurobioNeurobio Aging 2006Aging 2006

Study 2Study 2 MethodsMethods
ADADεε44-- εε4+4+Mean (Mean (sdsd))
NNAge ( yrs ) Age ( yrs )
BMI ( kg/mBMI ( kg/m22 ))( max=144 )( max=144 )DRSDRS
EducationEducation
111176 (4)76 (4)
26 (3)26 (3)131 (9)131 (9)
14 (3)14 (3)
232377 (8)77 (8)
26 (5)26 (5)130 (13)130 (13)
15 (3)15 (3)
Subjects

Study 2Study 2 ResultsResultsTotal Story RecallTotal Story Recall
2020
2525
3030
3535
4040
00 1010 2020 4040 6060
Reca
ll Sc
ore
Reca
ll Sc
ore
E4-E4+
Insulin Dose (IU)Insulin Dose (IU)
****
**
* p<0.05* p<0.05

SummarySummary•• Insulin has numerous actions in CNS that affect Insulin has numerous actions in CNS that affect
cognitioncognition
•• HyperinsulinemiaHyperinsulinemia / insulin resistance increases / insulin resistance increases inflammation and CSF Ainflammation and CSF Aββ4242
•• These conditions may be potent AD risk factors, These conditions may be potent AD risk factors, particularly for patients particularly for patients withoutwithout APOE APOE εε44--
•• Treatment with PPARTreatment with PPARγγ agonist agonist rosiglitazonerosiglitazone & & intranasal insulin intranasal insulin enhance cognition in AD / enhance cognition in AD / amnesticamnestic MCI MCI –– may represent novel therapeutic may represent novel therapeutic strategies for this subgroup of patientsstrategies for this subgroup of patients

CollaboratorsCollaborators
Steven Kahn, MB, Steven Kahn, MB, ChBChBJames Leverenz, MDJames Leverenz, MDThomas Montine, MD, PhDThomas Montine, MD, PhDWard Pedersen, PhDWard Pedersen, PhDElaine Peskind, MDElaine Peskind, MDStephen Plymate, MDStephen Plymate, MDMurray Raskind, MD
Sanjay Asthana, MDSanjay Asthana, MDJohn Breitner, MD, MPHJohn Breitner, MD, MPHDavid Cook, PhDDavid Cook, PhDMark Fishel, MDMark Fishel, MDPattie Green, PhDPattie Green, PhDWilliam Frey, II, PhDWilliam Frey, II, PhD
Murray Raskind, MD
This work was funded by the Department of Veterans Affairs, This work was funded by the Department of Veterans Affairs, NIA R01 AG10880, ISOA, and GlaxoSmithKline.NIA R01 AG10880, ISOA, and GlaxoSmithKline.

Insulin and Neurodegenerative Insulin and Neurodegenerative Disease Research TeamDisease Research Team
Maggie GilletMaggie GilletKaren Hyde, RNKaren Hyde, RNJamie IliffJamie IliffJake KulstadJake KulstadMarcos Marques, MDMarcos Marques, MDPamela McMillan, PhDPamela McMillan, PhDAmy MorganAmy MorganMark Reger, PhDMark Reger, PhDStennis Watson, PhDStennis Watson, PhDMagdalena Magdalena Wojtowicz
Pamela Pamela AsberryAsberry, RN, RNLaura Baker, PhDLaura Baker, PhDMeabhMeabh CarterCarterDarla Chapman, RNDarla Chapman, RNBrenna Cholerton, PhDBrenna Cholerton, PhDTraciaTracia ClarkClarkDonna Davis, RNDonna Davis, RNKaren Enstrom, RNKaren Enstrom, RNMark Fishel, MDMark Fishel, MDLaura FisherLaura FisherLaura Frank, PhD
WojtowiczLaura Frank, PhD

Exclusionary CriteriaExclusionary Criteria• Significant neurological disease other than AD• Use of antidepressants, antipsychotics, anticonvulsants,
anticoagulants, anxiolytics or sedatives• Major psychiatric disorders• Severe head trauma with LOC >30 min or with permanent sequelae• Uncontrolled chronic pain • Radiation treatment (current or recent)• CVA• CHF • COPD• Vision loss• Diabetes (diagnosed)• Alcohol and drug abuse/dependence• Liver disease• Severe medical illness (e.g., uncontrolled HTN, cancer not in remission
> 1 year, thyroid disease, cardiac arrhythmia, renal and hepatic disease)

ModelModel--adjusted Mean Change from Baselineadjusted Mean Change from Baselinein ADASin ADAS--cog by APOE4 statuscog by APOE4 status
-2.0
-1.0
0.0
1.0
2.0
Mea
n ch
ange
in A
DA
S-c
og s
core
0 4 8 12 16 20 24
E4-, placebo E4-, RSG 2mg E4-, RSG 4mg E4-, RSG 8mg
E4+, placebo E4+, RSG 2mg E4+, RSG 4mg E4+, RSG 8mg
Weeks of Treatment
Clinical improvement
Clinical decline

Safety DataSafety Data
•• Safety monitoring (labs, physical exam) Safety monitoring (labs, physical exam) at weeks 2 and 4, then monthlyat weeks 2 and 4, then monthly
•• No changes in fasting glucose, lipids, No changes in fasting glucose, lipids, LFTsLFTs, renal indices, renal indices
•• Two Two SAEsSAEs: Myocardial infarction (1 : Myocardial infarction (1 placebo) and placebo) and lacunarlacunar infarction (1 infarction (1 rosirosi))
•• Other Other AEsAEs: mild anemia (1 placebo, 3 : mild anemia (1 placebo, 3 rosirosi), mild edema (1 ), mild edema (1 rosirosi))

AVA100193: Key Safety Results, ITT PopulationAVA100193: Key Safety Results, ITT PopulationPlaceboPlacebo
(N = 124)(N = 124)RSG 2mgRSG 2mg(N = 128)(N = 128)
RSG 4mgRSG 4mg(N = 131)(N = 131)
RSG 8mgRSG 8mg(N = 135)(N = 135)
Any Tx emergent AEAny Tx emergent AE 44 (35%)44 (35%) 36 (28%)36 (28%) 41 (31%)41 (31%) 46 (34%)46 (34%)Any SAEAny SAE 7 (6%)7 (6%) 6 (5%)6 (5%) 3 (2%)3 (2%) 9 (7%)9 (7%)
Summary of AEs/SAEs
AEs of Special InterestAEs of Special InterestPlaceboPlacebo
(N = 124)(N = 124)RSG 2mgRSG 2mg(N = 128)(N = 128)
RSG 4mgRSG 4mg(N = 131)(N = 131)
RSG 8mgRSG 8mg(N = 135)(N = 135)
OedemaOedema 00 3 (2%)3 (2%) 1 (<1%)1 (<1%) 3 (2%)3 (2%)
AnaemiaAnaemia 00 1 (<1%)1 (<1%) 00 2 (1%)2 (1%)
Oedema peripheralOedema peripheral 00 00 4 (3%)4 (3%) 3 (2%)3 (2%)Eyelid oedemaEyelid oedema 00 1 (<1%)1 (<1%) 00 1 (<1%)1 (<1%)Periorbital oedemaPeriorbital oedema 1 (<1%)1 (<1%) 00 00 00
Cardiac failureCardiac failure 1 (<1%)1 (<1%) 00 00 1 (<1%)1 (<1%)Cardiac failure (acute)Cardiac failure (acute) 00 00 1 (<1%)1 (<1%) 00AlanineAlanine
aminotransferaseaminotransferase ↑↑00 00 00 1 (<1%)1 (<1%)
AspartateAspartateaminotransferaseaminotransferase ↑↑
00 00 00 1 (<1%)1 (<1%)
No new safety concerns identified in AVA100193 compared with the well established safety profile of rosiglitazone