demonstrated brain insulin resistance in alzheimer’s ...ibg.colorado.edu/pdf/halter3_2012.pdf ·...
TRANSCRIPT
Research article
TheJournalofClinicalInvestigation http://www.jci.org Volume 122 Number 4 April 2012 �
Demonstrated brain insulin resistance in Alzheimer’s disease patients is associated with IGF-1 resistance, IRS-1 dysregulation,
and cognitive declineKonrad Talbot,1 Hoau-Yan Wang,2 Hala Kazi,1 Li-Ying Han,1 Kalindi P. Bakshi,2 Andres Stucky,2
Robert L. Fuino,1 Krista R. Kawaguchi,1 Andrew J. Samoyedny,1 Robert S. Wilson,3 Zoe Arvanitakis,3 Julie A. Schneider,3 Bryan A. Wolf,4,5 David A. Bennett,3
John Q. Trojanowski,5 and Steven E. Arnold1
1Department of Psychiatry, University of Pennsylvania, Philadelphia, Pennsylvania, USA. 2Department of Physiology, Pharmacology, and Neuroscience, Sophie Davis School of Biomedical Education, City University of New York Medical School, New York, New York, USA. 3Rush Alzheimer’s Disease Center and
Department of Neurological Sciences, Rush University Medical Center, Chicago, Illinois, USA. 4Children’s Hospital of Philadelphia, Philadelphia, Pennsylvania, USA. 5Department of Pathology and Laboratory Medicine, University of Pennsylvania, Philadelphia, Pennsylvania, USA.
WhileapotentialcausalfactorinAlzheimer’sdisease(AD),braininsulinresistancehasnotbeendemonstrat-eddirectlyinthatdisorder.Weprovidesuchademonstrationherebyshowingthatthehippocampalforma-tion(HF)and,toalesserdegree,thecerebellarcortexinADcaseswithoutdiabetesexhibitmarkedlyreducedresponsestoinsulinsignalingintheIR→IRS-1→PI3KsignalingpathwaywithgreatlyreducedresponsestoIGF-1intheIGF-1R→IRS-2→PI3Ksignalingpathway.ReducedinsulinresponsesweremaximalatthelevelofIRS-1andwereconsistentlyassociatedwithbasalelevationsinIRS-1phosphorylatedatserine616(IRS-1pS616)andIRS-1pS636/639.IntheHF,thesecandidatebiomarkersofbraininsulinresistanceincreasedcommonlyandprogressivelyfromnormalcasestomildcognitivelyimpairedcasestoADcasesregardlessofdiabetesorAPOEε4status.LevelsofIRS-1pS616andIRS-1pS636/639andtheiractivatedkinasescorrelatedpositivelywiththoseofoligomericAβplaquesandwerenegativelyassociatedwithepisodicandworkingmemory,evenafteradjustingforAβplaques,neurofibrillarytangles,andAPOEε4.BraininsulinresistancethusappearstobeanearlyandcommonfeatureofAD,aphenomenonaccompaniedbyIGF-1resistanceandcloselyassociatedwithIRS-1dysfunctionpotentiallytriggeredbyAβoligomersandyetpromotingcognitivedeclineindependentofclassicADpathology.
IntroductionAlzheimer’s disease (AD) shares many age-related pathophysi-ological features of type 2 diabetes (T2D). These include the defining features of T2D, insulin resistance and disrupted glu-cose metabolism in non-neural tissues (1, 2), as well as peripheral oxidative and inflammatory stress, amyloid aggregation, neural atrophy and/or degeneration, and cognitive decline (3, 4). Such a large set of shared features suggests shared etiologies, a view sup-ported by epidemiologic studies showing that AD risk is increased 50%–100% by diabetes (5–8), including T2D (9), which accounts for 90% of all diabetic cases (10).
Of the shared features of AD and T2D, the one most likely to be an etiological factor in AD is insulin resistance, defined broadly here as reduced cellular responsiveness to insulin, in keeping with Goldstein’s description (1). This factor is not only associated with, but can cause, many shared features of the 2 disorders (3, 4, 11–13). Moreover, peripheral insulin resistance without T2D is a risk factor for AD (8, 14) within 3 years of diagnosis (14); is a common feature of AD cases (15); and is associated with reduced basal (16) and insu-lin-induced (17, 18) activation of cerebral IRs, higher cerebral neu-
ritic plaque loads (16, 19), lower hippocampal volume and cognitive performance (20), and lower cerebrocortical glucose metabolism correlated with reduced memory recall (11). As detailed in many reviews (11, 21–25), peripheral insulin resistance could promote AD onset by reducing brain insulin uptake and by raising brain levels of Aβ, τ phosphorylation, oxidative stress, proinflammatory cytokines, advanced glycation end products, dyslipidemia, and apoptosis.
An increasing number of investigators, however, propose that insulin resistance in AD is not limited to peripheral tissues. In par-ticular, they propose that in AD, with or without comorbid T2D, the brain itself becomes insulin resistant and that this promotes or even triggers key pathophysiological events in the disorder (4, 12, 26–35). This is consistent with observed alterations in levels of many insulin signaling molecules in the forebrain of AD cases (27–29, 33, 35–37) and with memory improvements in such cases and those at high risk for AD after selective elevation of forebrain insulin via intranasal administration of the hormone (38, 39).
While insulin activates several signaling pathways (40), the logi-cal starting point for studies on brain insulin resistance has been the signaling pathway commonly disrupted under conditions causing peripheral insulin resistance, including T2D and obesity. As diagrammed in Supplemental Figure 1 (supplemental mate-rial available online with this article; doi:10.1172/JCI59903DS1), the upstream portion of that pathway uses the following activa-tion sequence: IR→IRS-1/2→PI3K→Akt (the last of which is also
Authorshipnote: Konrad Talbot and Hoau-Yan Wang contributed equally to this work.
Conflictofinterest: The authors have declared that no conflict of interest exists.
Citationforthisarticle: J Clin Invest. 2012;122(4):xxxx–yyyy. doi:10.1172/JCI59903.

research article
� TheJournalofClinicalInvestigation http://www.jci.org Volume 122 Number 4 April 2012
referred to as PKB) (41–44). A well-established, albeit not exclusive (45), cause of insulin resistance in T2D is chronic upregulation of a normally adaptive feedback/feed-forward mechanism that attenu-ates insulin signaling via phosphorylation of IRS-1 at S312, S616, and/or S636 (equivalent to S307, S612, and S632, respectively, in rodents) (42, 43, 46, 47), although S312 phosphorylation can also promote such signaling (48). Phosphorylation at 1 or more of these sites results from feedback inhibition exerted mainly by ERK2, gly-cogen synthase kinase–3 (GSK-3), mammalian target of rapamycin/S6K1 (mTOR/S6K1), and PKCζ/λ and from feed-forward inhibi-tion exerted by Iκβ kinase β (IKKβ) and JNK1/2 (42, 47, 49–51).
The insulin signaling pathway and regulating kinases described above have been the subject of many postmortem brain studies in AD (27–29, 33, 35–37, 52–55). A number of the findings at upstream levels of the pathway are consistent with insulin resis-tance as defined above, notably decreased basal activation of IRs (28); reduced insulin binding of the IR, even early in the disorder (27); increased serine phosphorylation (pS) of IRS-1 (29, 33, 37); and reduced cytosolic and/or membranous levels of PI3K (33, 35) and PI3K-dependent kinase 1 (PDK1) (35).
Yet, to our knowledge, the work to date has not established brain insulin resistance in AD nor its potential intracellular causes or cognitive consequences, for several reasons. First, only basal states of insulin signaling molecules have been tested, not their insulin-induced states. Second, discordant findings are reported in AD brains on levels of IR and IRS-1 (27, 28, 33, 35) and on basal activa-tion states of Akt and GSK-3β (28, 35, 36). Third, evidence of reduced insulin signaling at the level of IR and IRS-1/2 (27–29, 33) remains to be reconciled with evidence of increased downstream signaling at the level of Akt, GSK-3, and mTOR (36, 52–55). Fourth, while some caus-al possibilities have been supported in small data sets (33, 35–37), their replicability has not been tested. Finally, only limited cognitive information has been available on the cases investigated.
Using ex vivo stimulation, Western blotting, and quantitative immunohistochemistry (qIHC), we tested the hypothesis that brain insulin resistance occurs in AD even without T2D by evaluating both basal and insulin-stimulated levels of signaling and regulating kinases upstream and downstream in the IR→IRS-1/2→PI3K→Akt pathway in case cohorts from the University of Pennsylvania (UPenn) and the Religious Orders Study (ROS), the latter of which was extensively tested for cognitive abilities. For comparison pur-poses, we evaluated the same tissue samples for signaling responses to IGF-1, which has been reported to activate similar signaling cas-cades via the IR and its own receptor, IGF-1R (56–59). There is also some evidence for IGF-1R resistance in AD (27, 28, 33).
We tested insulin and IGF-1 responsiveness in 2 brain areas, which at death are at different stages in AD pathology. One was the cerebellar cortex, which develops limited pathology only late in AD (60–62). The other was the hippocampal formation (HF; consisting of hippocampus fields CA1–CA3, the dentate gyrus, and the subiculum), which develops marked pathology starting early in the disorder (61, 63). Both these brain areas express the IR and IGF-1R (64, 65), as well as insulin-sensitive GLUT4 (66–70). We then focused on the HF to study the causes and consequences of brain insulin resistance, since it is more directly involved in AD pathogenesis (61, 63) and cognitive decline (71, 72).
ResultsTo simplify description of the results, all noted differences between diagnostic groups were significant unless otherwise indicated (see
figures and tables for P values). Differences reported across diag-nostic groups were significant in both sexes. All IR, IGF-1R, and IRS-1 phosphorylation sites are numbered according to the human sequences. IR amino acid numbers are those for the isoform found in the brain (IR-A; see Discussion). Demographic, autopsy, neuro-pathological features, and cognitive data on all subjects are sum-marized in Supplemental Table 1.
Total basal levels of insulin and IGF-1 signaling molecules in the cer-ebellar cortex and HF are normal in AD. In contrast to some earlier reports (28, 35) on the HF and/or frontal cortex in AD, Western blotting and qIHC showed that total non-phosphospecific levels of signaling molecules in the IR/IGF-1R→IRS→PI3K pathway (IRβ, IGF-1Rβ, IRS-1, IRS-2, Akt1, GSK-3β, mTOR, and ERK2) were normal in the cerebellar cortex and HF of AD cases compared with normal controls (referred to herein as N cases) matched in sex, age, and low postmortem interval (PMI; 6–12 hours). There was, how-ever, a trend toward elevated IRS-1 in the HF (P = 0.06).
If insulin signaling is impaired in AD, then it would be evident only in the activation states of its signaling molecules, especially in response to applied insulin. We tested such responses using an ex vivo stimulation protocol with which we previously showed that nicotinic, neuregulin-1, and NMDA signaling is intact in human postmortem tissue obtained 6–11 hours after death on average (73, 74). Such findings are not surprising, since neurons in thick brain sections from postmortem N and AD cases with PMIs up to 8 hours can be kept alive in culture media at least 3 weeks without significant loss in numbers, morphology, or measures of viability (75). To validate the ex vivo protocol for insulin signaling studies on postmortem tissue, we tested it first on normal brain tissue.
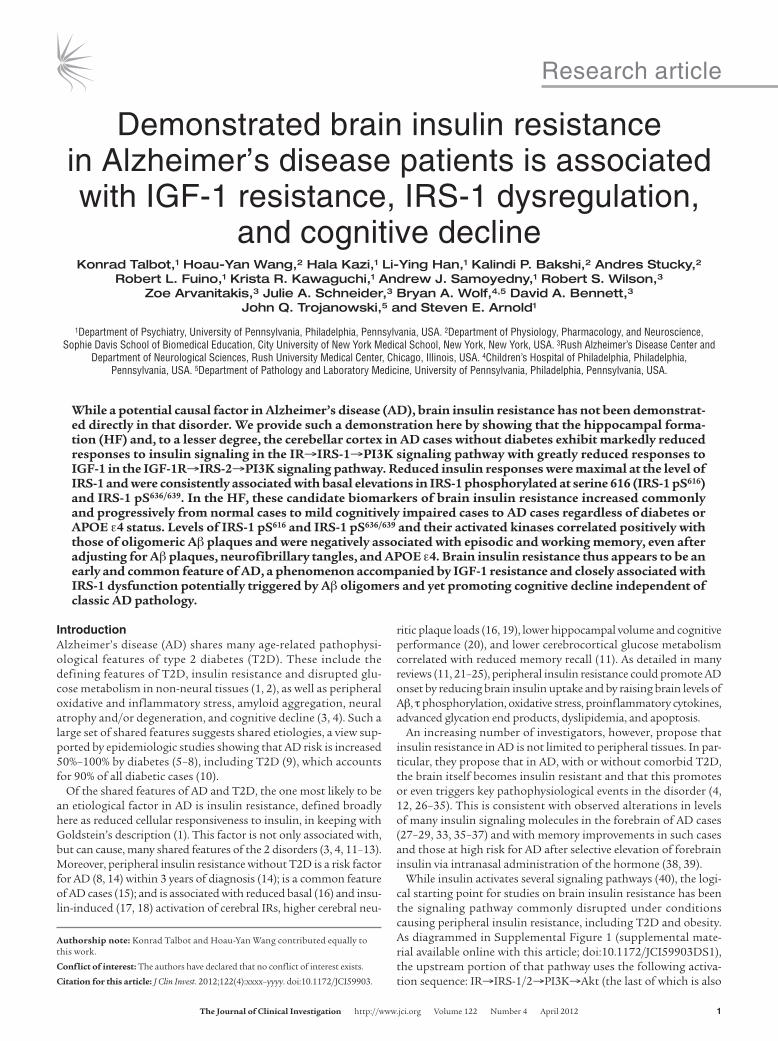
Insulin signaling mechanisms are intact in low-PMI brain tissue. Ex vivo tests on human HF slices from 5 N cases with PMIs of 5–19 hours demonstrated that 0.1–100 nM insulin evoked clear, reliable, dose-dependent activation of the insulin signaling pathway under study. Increasing doses caused increasing tyrosine phosphorylation (pY) of the IR kinase regulatory domain (Y1150, Y1151), IRβ binding (i.e., recruitment) of IRS-1, and activation of such downstream molecules as Akt1 pS473 and ERK2 pT185/pY187 (Figure 1A). The functional integrity of the postmortem tissue was further indicated by its strong responsiveness to glutamate-induced glucose uptake (see below).
Since responses at 10 nM approached those at 100 nM, we lim-ited further testing to the 1-nM dose, close to physiological levels of brain insulin (76, 77), and the 10-nM dose, commonly used in studies on insulin signaling in peripheral tissues (58, 59). Tests on rat HF showed that the magnitude of insulin signaling responses did not diminish significantly with PMIs as long as 16 hours (Figure 1, B–D). In human HF from cases with mean PMIs of 6 hours, the magnitude of the same insulin signaling responses was as large as in the rat HF (compare Figure 1, C and D, and Figure 2, A and E).
Near-physiological doses of brain insulin and IGF-1 selectively activate their cognate receptors. When tested in adult mammalian brains, lev-els of extracellular IGF-1 range 1.12–2.38 ng/ml (0.14–0.31 nM) (78). Corresponding extracellular data are not available for insulin, but the upper limit can be estimated from total insulin levels in the mammalian brain, commonly ranging 0.2–8 ng/g wet weight (76, 77). Given that the density of brain tissue (1.05 g/cc) is about that of water (1.05 g/ml), extracellular brain insulin would normally be no higher than 0.19–7.6 ng/ml (0.033–1.31 nM). Thus, a 1-nM dose of insulin or IGF-1 is probably close to, or somewhat above, physiological levels of those hormones in the brain. A 10-nM dose is supraphysiological for both hormones.
research article
TheJournalofClinicalInvestigation http://www.jci.org Volume 122 Number 4 April 2012 �
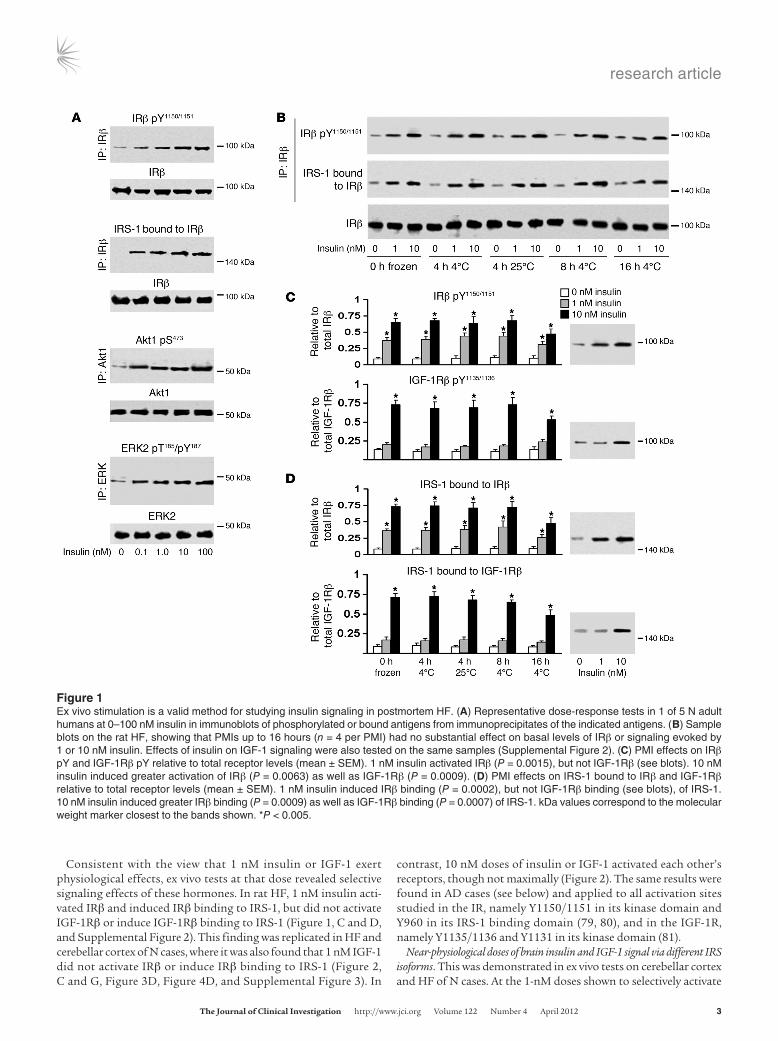
Consistent with the view that 1 nM insulin or IGF-1 exert physiological effects, ex vivo tests at that dose revealed selective signaling effects of these hormones. In rat HF, 1 nM insulin acti-vated IRβ and induced IRβ binding to IRS-1, but did not activate IGF-1Rβ or induce IGF-1Rβ binding to IRS-1 (Figure 1, C and D, and Supplemental Figure 2). This finding was replicated in HF and cerebellar cortex of N cases, where it was also found that 1 nM IGF-1 did not activate IRβ or induce IRβ binding to IRS-1 (Figure 2, C and G, Figure 3D, Figure 4D, and Supplemental Figure 3). In
contrast, 10 nM doses of insulin or IGF-1 activated each other’s receptors, though not maximally (Figure 2). The same results were found in AD cases (see below) and applied to all activation sites studied in the IR, namely Y1150/1151 in its kinase domain and Y960 in its IRS-1 binding domain (79, 80), and in the IGF-1R, namely Y1135/1136 and Y1131 in its kinase domain (81).
Near-physiological doses of brain insulin and IGF-1 signal via different IRS isoforms. This was demonstrated in ex vivo tests on cerebellar cortex and HF of N cases. At the 1-nM doses shown to selectively activate
Figure �Ex vivo stimulation is a valid method for studying insulin signaling in postmortem HF. (A) Representative dose-response tests in 1 of 5 N adult humans at 0–100 nM insulin in immunoblots of phosphorylated or bound antigens from immunoprecipitates of the indicated antigens. (B) Sample blots on the rat HF, showing that PMIs up to 16 hours (n = 4 per PMI) had no substantial effect on basal levels of IRβ or signaling evoked by 1 or 10 nM insulin. Effects of insulin on IGF-1 signaling were also tested on the same samples (Supplemental Figure 2). (C) PMI effects on IRβ pY and IGF-1Rβ pY relative to total receptor levels (mean ± SEM). 1 nM insulin activated IRβ (P = 0.0015), but not IGF-1Rβ (see blots). 10 nM insulin induced greater activation of IRβ (P = 0.0063) as well as IGF-1Rβ (P = 0.0009). (D) PMI effects on IRS-1 bound to IRβ and IGF-1Rβ relative to total receptor levels (mean ± SEM). 1 nM insulin induced IRβ binding (P = 0.0002), but not IGF-1Rβ binding (see blots), of IRS-1. 10 nM insulin induced greater IRβ binding (P = 0.0009) as well as IGF-1Rβ binding (P = 0.0007) of IRS-1. kDa values correspond to the molecular weight marker closest to the bands shown. *P < 0.005.
research article
� TheJournalofClinicalInvestigation http://www.jci.org Volume 122 Number 4 April 2012
their cognate receptors, insulin stimulated IRβ binding to IRS-1, not IRS-2, whereas IGF-1 stimulated IGF-1Rβ binding to IRS-2, not IRS-1 (Figure 2, E–H, Figure 3, and Figure 4). As that result pre-dicted, 1 nM insulin activated IRS-1, not IRS-2, whereas 1 nM IGF-1 activated IRS-2, not IRS-1 (Figure 2, I–L, Figure 3, and Figure 4). Thus, as expected, 1 nM insulin induced IRS-1, not IRS-2, bind-ing to PI3K p85α, whereas 1 nM IGF-1 induced IRS-2, not IRS-1, binding to PI3K p85α (Figure 2, M–P, Figure 3, and Figure 4). These dichotomous responses to 1 nM insulin and IGF-1 (seen to a lesser degree at 10 nM doses) were also found in AD cases of both brain areas studied (Figures 3 and 4). At near-physiological doses, then, these insulin and IGF-1 signaling pathways did not converge upstream of PI3K. Our tests of resistance to insulin and IGF-1 thus focused on results with 1-nM doses of these hormones.
Insulin resistance associated with IRS-1 dysfunction occurs in the cerebel-lar cortex and more markedly in the HF of AD cases. Ex vivo responses to 1 and 10 nM insulin were tested in 8 pairs of N and AD cases from the set of cases characterized in Supplemental Table 1. Mem-
bers of each pair were well matched for age (N, 85.5 ± 7.9 years; AD, 84.2 ± 5.3 years; mean ± SD), sex (6 female, 2 male in both groups), and PMI (N, 6.02 ± 2.6 hours; AD, 5.92 ± 2.7). None of the N or AD cases had a history of diabetes. The same cases were studied for comparison of the cerebellar cortex and HF. For testing insulin resistance, the antigen panel was extended to IRS-1 pY941 (IRS-1 pY939 in rodents), which is critical for activating the regulatory sub-unit (p85) of PI3K (47).
Testing IRβ pY1150/1151 distinct from the homologous sequence in IGF-1Rβ pY1135/1136 was accomplished by first immunoprecipi-tating each receptor with an antibody to nonhomologous regions of the 2 receptors and then immunoblotting with an antibody to the shared phosphospecific region (see Methods). The phos-phorylation levels of all molecules were expressed as ratios of phosphorylated to total antigen levels and were thus independent of neuronal numbers in the samples studied.
In the cerebellar cortex and HF of both the AD and N cases, insulin induced activation of IRβ (pY1150/1151 and pY960) and IRS-1
Figure �At near-physiological doses (1 nM), insulin and IGF-1 activate different IRS signaling pathways. This was demonstrated with ex vivo stimulation of HF and cerebellar cortex samples from 8 N humans with low PMIs. Data from the HF are shown. The effect of 0, 1, and 10 nM insulin and IGF-1 is shown on IRβ and IGF-1Rβ activation (A–D), IRS-1 and IRS-2 binding of IRβ and IGF-1Rβ (E–H), IRS-1 and IRS-2 activation (I–L), and PI3K p85α binding to IRS-1 and IRS-2 (M–P). 1 nM insulin activated IRβ, but not IGF-1Rβ, and bound IRS-1, but not IRS-2, to its receptor. In contrast, 1 nM IGF-1 activated IGF-1Rβ, but not IRβ, and bound IRS-2, but not IRS-1, to its receptor. Values (mean ± SEM) are ratios of phosphorylated or bound molecules to total levels of those molecules or of the molecules to which they were bound. #P < 0.01, *P < 0.001 vs. baseline (0 nM). Sample Western blots on which these graphs were based are shown in Figures 3 and 4.

research article
TheJournalofClinicalInvestigation http://www.jci.org Volume 122 Number 4 April 2012 �
(total pY and pY612) as well as IRβ binding of IRS-1 and IRS-1 binding of PI3K p85α (Figures 3 and 4 and Supplemental Tables 2 and 3). In AD cases, however, the percent increase in these insulin responses above baseline levels was less than in N cases at all levels of the insulin signaling pathway studied (Figure 5 and Tables 1 and 2). Except for activation of IRβ pY960 in the cerebellar cortex, the reduced responsiveness to 1 nM insulin in both structures was modest at the level of the IR, but moderate to strong with respect to IRS-1 and its interactions with PI3K p85α (Figure 5 and Tables 1 and 2). While there were marked reductions in IRS-1 activation and binding of IRβ and PI3K p85α in response to 1 nM insulin in
AD, there were no such reductions in IRS-2 responses to that dose of insulin (Tables 1 and 2).
Insulin resistance in AD cases was more advanced in the HF than in the cerebellar cortex. While cerebellar responses to 1 nM insu-lin were significantly lower at all levels of the signaling pathway tested, such responses to 10 nM insulin were reduced to a lesser degree and were often insignificant (Figure 5 and Table 1). Insulin resistance in cerebellar cortex was thus ameliorated at the 10-nM dose. However, that was not the case in the HF, where significant insulin resistance was seen at both 1 and 10 nM insulin (Table 2). At the 1-nM dose, moreover, the HF displayed greater reductions
Figure �Ex vivo stimulation revealed IRS-1–associated insulin resistance and IRS-2–associated IGF-1 resistance in the cerebellar cortex of AD cases. (A–C) Western blots from a representative matched pair of N and AD cases showed decreased signaling responses in the AD case to 1 and 10 nM insulin without affecting IRS-2 (specifically, reductions in IRβ activation; IRS-1 binding of IRβ, IRS-1 activation [pY] and suppression [pS]; and PI3K p85α binding of IRS-1). (D–F) Western blots from a representative matched pair of N and AD cases showed decreased signaling responses in the AD case to 1 and 10 nM IGF-1 without affecting IRS-1 (specifically, reductions in IGF-1Rβ activation; IRS-2 binding of IGF-1Rβ, IRS-2 activation and suppression; and PI3K p85α binding of IRS-2). See Figure 5 and Tables 1–4 for quantification.

research article
� TheJournalofClinicalInvestigation http://www.jci.org Volume 122 Number 4 April 2012
in responsiveness below the IR, as seen in insulin-induced IRS-1 pY (90% reduced in the HF vs. 42% in cerebellar cortex), IRS-1 pY612 (86% vs. 54%), IRS-1 pS616 (90% vs. 68%), and IRS-1 binding to PI3K p85α (96% vs. 76%) (compare Tables 1 and 2).
The more pronounced insulin resistance below IR seen in the HF compared with the cerebellar cortex was associated with increased basal levels of IRS-1 pY and IRS-1 pS. Total basal IRS-1 pY and IRS-1 pY612 in the AD cases were normal in the cerebellar cortex (Table 1), but were highly elevated in the HF, along with elevated basal levels of IRS-1 bound to PI3K p85α (Table 2). These condi-tions are known to attenuate IRS-1 signaling (82, 83). Total basal IRS-1 pS in AD was also normal in the cerebellar cortex (Table 1),
but highly elevated in the HF (Table 2), another condition known to attenuate insulin signaling (42, 43, 46, 47).
IGF-1 resistance associated with IRS-2 dysfunction is severe in both the cerebellar cortex and the HF of AD cases. In the same samples that showed insulin resistance in AD, IGF-1 resistance was discovered in the IGF-1R→IRS-2→PI3K pathway. Responses to 1 and 10 nM IGF-1 were reduced at all tested levels of that pathway (Figures 3–5) and were nearly always greater in the HF than the cerebellar cor-tex (Tables 3 and 4). In other respects, however, IGF-1 resistance clearly differed from insulin resistance. First, stimulus-induced receptor activation, as shown by IGF-1Rβ pY1135/1136 and IGF-1Rβ pY1131 levels, was strongly reduced and was not significantly ame-
Figure �Ex vivo stimulation revealed IRS-1–associated insulin resistance and IRS-2–associated IGF-1 resistance in HF of AD cases. (A–C) Western blots from a representative matched pair of N and AD cases showed decreased signaling responses in the AD case to 1 and 10 nM insulin with-out affecting IRS-2 (specifically, reductions in IRβ activation; IRS-1 binding of IRβ, IRS-1 activation [pY] and suppression [pS]; and PI3K p85α binding of IRS-1). (D–F) Western blots from a representative matched pair of N and AD cases showed decreased signaling responses in the AD case to 1 and 10 nM IGF-1 without affecting IRS-1 (specifically, reductions in IGF-1Rβ activation; IRS-2 binding of IGF-1Rβ, IRS-2 activation and suppression; and PI3K p85α binding of IRS-2). See Figure 5 and Tables 1–4 for quantification.

research article
TheJournalofClinicalInvestigation http://www.jci.org Volume 122 Number 4 April 2012 �
Figure �Direct demonstration of insulin and IGF-1 resistance in the cerebellar cortex (A–L) and HF (M–X) of AD cases without diabetes. Both structures showed reduced responsiveness to near-physiological doses (1 nM) of insulin and IGF-1, as seen in receptor activation (A, B, G, H, M, N, S, and T); IRS-1 bound to IRβ and IRS-2 bound to IGF-1Rβ (C, I, O, and U); IRS-1 or IRS-2 activation (pY) or suppression (pS) (D, E, J, K, P, Q, V, and W); and PI3K p85α bound to IRS-1 or IRS-2 (F, L, R, and X). Values (mean ± SEM) for N and AD cases denote percent increase in signaling responses above baseline (0 nM) in the same diagnostic group. Percentages were calculated from response strengths expressed as ratios of the phosphorylated or bound molecule to the total level of the same molecule or of the molecule to which it was bound (Supplemental Tables 2–5). Unlike the HF, insulin resistance to 1 nM insulin in the cerebellar cortex was overcome at most levels of the signaling pathway by 10 nM insulin. Unlike insulin resistance, IGF-1 resistance was profound even at the receptor level. †P < 0.05, #P < 0.01, *P < 0.001 vs. N. See Tables 1–4 for quantification.

research article
� TheJournalofClinicalInvestigation http://www.jci.org Volume 122 Number 4 April 2012
liorated at 10 nM IGF-1, even in the cerebellar cortex (Tables 3 and 4). Second, while the AD cases showed marked reductions in 1 nM IGF-1–induced activation of IRS-2 and of IRS-2 binding to IGF-1Rβ and PI3K p85α, they showed no such corresponding effects of IGF-1 on IRS-1 (Tables 3 and 4). The increase in total basal levels of IRS-2 in both brain areas studied was thus probably associated with resistance to IGF-1, not insulin. Since we lacked clues to the proximal causes of brain IGF-1 resistance, we did not pursue that phenomenon further. Instead, we next focused on the many clues to the potential proximal causes of brain insulin resistance.
IRS-1 pS616 and IRS-1 pS636/639 are candidate biomarkers of brain insulin resistance. While total basal levels of IRS-1 pS were normal in the cerebellar cortex, basal levels of IRS-1 pS616 and IRS-1 pS636 were elevated there and in the HF of AD cases, unlike IRS-1 pS312 levels. These elevations, which were also seen in cases of mild cognitive impairment (MCI; see below), were among the few basal abnormal-ities in insulin signaling molecules consistently associated with insulin resistance (compare Tables 1 and 2). Consequently, IRS-1 pS616 and IRS-1 pS636 are candidate biomarkers of brain insulin resistance, especially since their elevation is a feature of insulin resistance in peripheral tissues (43, 46, 47). The cause of such elevations was suggested by further study of the HF, where basal elevations in IRS-1 pS616 and IRS-1 pS636/639 in AD were accom-panied by basal elevations in activated forms of kinases directly or indirectly phosphorylating IRS-1 at S616 and/or S636. These activated kinases were Akt1 (pS473), mTOR (pS2448), and ERK2 (pT185/pY187), basal levels of which were elevated above normal
levels in AD cases by 193%, 107%, and 179%, respectively (Table 2 and Supplemental Table 3B). Such activation was not triggered by increased downstream insulin signaling via non–IRS-1 pathways, because 1 and 10 nM insulin in AD induced markedly less activa-tion of these kinases and of both GSK-3β pY216 and GSK-3β pS9 (activated and suppressed forms, respectively; Table 2).
Candidate biomarkers IRS-1 pS616 and IRS-1 pS636/639 and their acti-vated kinases are commonly and markedly elevated in HF neurons of AD cases without diabetes. To test the generality and cellular locus of IRS-1 pS elevations in AD and to identify their likely causes and consequences, we studied the relatively large UPenn and ROS cohorts described above. We began with our discovery cohort from UPenn, a set of 24 N and 24 AD cases without a history of diabe-tes matched pairwise for sex, age within 5 years, and PMI within 5 hours (Supplemental Table 1).
qIHC was chosen for this phase of our study, since it allows selec-tive quantification of neuronal (as opposed to glial) proteins in a precisely defined anatomical field and simultaneous processing of many cases. We focused on hippocampal field CA1, given its relatively high levels of IRs (64) and IRS-1 (84); its vulnerability to AD pathology (61, 63, 85, 86); and its large size, encompassing as many as 3,200 neuronal profiles per 6-μm section. The findings necessarily reflect chronic antigen levels, given that the PMIs were on the order of hours, not minutes.
To study IRS-1 pS species in the context of other changes that may occur in the IR→PI3K signaling pathway of AD cases, a large set of insulin signaling and regulating molecules was quantified
Table �Difference in cerebellar cortex signaling responses to insulin stimulation between AD cases and matched controls
Signaling molecule Signaling Basal Percent difference in response to insulinC
or interaction effectA levelB 1 nm 10 nm
IRβ
IRβ pY1150/1151 + –2 ± 1 (0.74052) –26 ± 4 (0.01033) –13 ± 6 (0.28444)IRβ pY960 + 20 ± 3 (0.26034) –58 ± 15 (0.00753) –38 ± 12 (0.19612)
IRS-1Total IRS-1 pY + 9 ± 1 (0.62443) –42 ± 10 (0.03911) –31 ± 13 (0.10854)IRS-1 pY612 + 7 ± 1 (0.74321) –54 ± 10 (0.00452) –23 ± 12 (0.06322)Total IRS-1 pS – 17 ± 5 (0.12290) –67 ± 4 (<0.00001) –54 ± 4 (<0.00001)IRS-1 pS312 +/–D 8 ± 1 (0.65022) –26 ± 13 (0.23974) –16 ± 6 (0.37883)IRS-1 pS616 – 43 ± 9 (0.00323) –68 ± 12 (0.00023) –56 ± 10 (<0.00001)IRS-1 pS636/639 – 71 ± 3 (<0.00001) –86 ± 5 (<0.00001) –77 ± 7 (<0.00001)
IRS-1 interactionsIRS-1 bound to IRβ + –9 ± 1 (0.31452) –24 ± 9 (0.04601) –24 ± 9 (0.04581)PI3K p85α bound to IRS-1 +/–E 34 ± 6 (0.01554) –76 ± 7 (<0.00001) –51 ± 5 (0.000143)
IRS-2IRS-2 pY + 11 ± 3 (0.41354) –22 ± 7 (0.28484) –70 ± 7 (0.00215)IRS-2 pS – 58 ± 4 (0.00102) –42 ± 17 (0.19944) –77 ± 10 (0.00553)
IRS-2 interactionsIRS-2 bound to IRβ + 10 ± 4 (0.35799) 12 ± 4 (0.43798) 14 ± 5 (0.12184)PI3K p85α bound to IRS-2 +/–E –2 ± 2 (0.87813) 19 ± 7 (0.55330) –75 ± 6 (0.00223)
Values (mean ± SEM; P in parentheses) denote percentages relative to the normal level, based on ratios shown in Supplemental Table 2. AActivation (facilita-tion; +) or inhibition (suppression; –) of insulin signal transduction. BPercent difference in the mean level of a phosphorylated or bound molecule relative to total levels of that molecule or of the molecule to which it was bound. CRelative to basal level. DAlthough a number of studies have deduced that phosphorylation of IRS-1 at S312 (S307 in rodents) suppresses insulin signaling (42, 47), recent work on mice lacking S307 indicates that it may actually facilitate such signaling (48). EThe regulatory p85 subunit of PI3K binds and activates the p110 catalytic subunit of PI3K, but p85 monomers can also sequester IRS-1 pY (and prob-ably IRS-2 pY) in cytosolic complexes and thereby prevent IRS-1 (and probably IRS-2) stimulation of PI3K activity (see Discussion and refs. 82, 83).

research article
TheJournalofClinicalInvestigation http://www.jci.org Volume 122 Number 4 April 2012 �
in CA1 using the antibodies and IHC conditions shown in Supple-mental Table 6. Since antibodies to IRβ pY1150/1151 also recognize IGF-1Rβ pY1135/1136, we refer to the antigen as IR/IGF-1Rβ pY here-after. In the gray matter of CA1, all signaling molecules tested were restricted to pyramidal neurons, except for activated mTOR in a small set of glial cells in AD cases. We measured cytoplasmic dif-ferences between N and AD cases, since the cytoplasm was the site at which the molecules tested were most consistently detected in AD. Measures of cytoplasmic antigen levels are detailed in Table 5 and Supplemental Methods.
The heat map in Figure 6 summarizes the relative cytoplasmic levels of neuronal insulin signaling and regulating molecules in
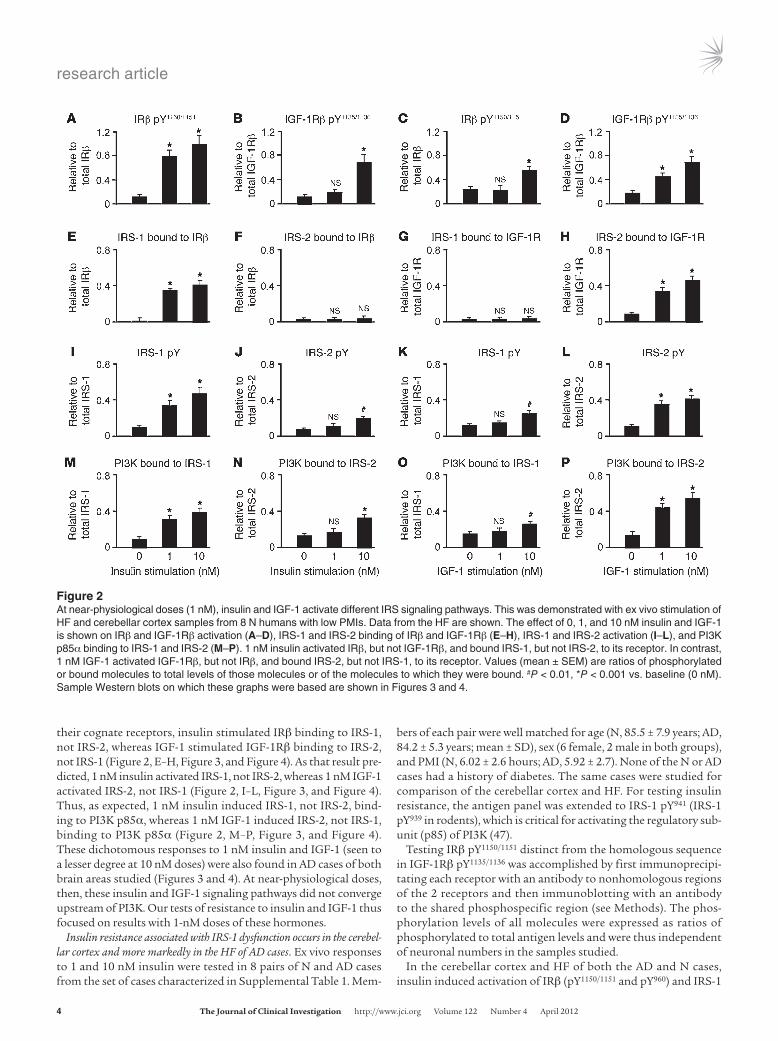
the CA1 of the UPenn cohort. Since the data are based on qIHC, they capture only basal levels of the molecules tested. Total levels of the signaling molecules were variably altered in AD. Levels of IRβ, PTEN, and Akt1 were unaffected. IRS-1 itself was increased, and GSK-3β was decreased. Activation states of these and related molecules, however, were abnormal in a large percentage of the AD cases. Levels of IR/IGF-1Rβ pY and IRβ pY960 were reduced 13% and 21%, respectively, in contrast to normal levels of basal IR pY in Western blots on the HF as a whole (Table 2). Activated forms of IRS-1 were higher in AD (IRS-1 pY612, 162%; IRS-1 pY941, 73%), but its suppressed forms were much higher in the same cases (IRS-1 pS616, 1,564%; IRS-1 pS636/639; 259%). IRS-1 pS312 was also elevated
Table �Difference in hippocampal formation signaling responses to insulin stimulation between AD cases and matched controls
Signaling molecule Signaling Basal Percent difference in response to insulinC
or interaction effectA levelB 1 nm 10 nm
IRβ
IRβ pY1150/1151 + –5 ± 2 (0.10031) –29 ± 2 (0.01118) –14 ± 1 (0.04137)IRβ pY960 + –6 ± 3 (0.14113) –34 ± 3 (0.00313) –21 ± 1 (0.00384)
IGF-1Rβ
IGF-1Rβ pY1135/1136 + –15 ± 6 (0.14369) –22 ± 10 (0.13085) –42 ± 6 (0.00340)
IRS-1Total IRS-1 pY + 147 ± 34 (0.00064)D –90 ± 14 (0.000473) –91 ± 12 (0.00015)IRS-1 pY612 + 126 ± 11 (0.00091)D –86 ± 4 (<0.00001) –88 ± 4 (0.00010)Total IRS-1 pS – 100 ± 13 (0.00026) –97 ± 6 (0.00057) –89 ± 4 (0.00014)IRS-1 pS312 +/–E 73 ± 4 (0.00050) 7 ± 1 (0.60747) –6 ± 1 (0.60443)IRS-1 pS616 – 104 ± 10 (0.00001) –90 ± 8 (0.00001) –85 ± 7 (0.00001)IRS-1 pS636/639 – 51 ± 5 (0.01102) 6 ± 1 (0.9837) 12 ± 1 (0.0505)
IRS-1 interactionsIRS-1 bound to IRβ + –5 ± 2 (0.43973) –25 ± 2 (0.00978) –15 ± 1 (0.01216)IRS-1 bound to IGF-1Rβ + –15 ± 6 (0.56314) –12 ± 5 (0.69323) –56 ± 9 (0.01085)PI3K p85α bound to IRS-1 +/–F 164 ± 18 (0.00080)D –96 ± 11 (0.00006) –89 ± 12 (<0.00001)
IRS-2IRS-2 pY + 95 ± 11 (0.00013) –41 ± 17 (0.15562) –90 ± 9 (<0.00001)IRS-2 pS – 115 ± 16 (0.00139) –48 ± 16 (0.07730) –78 ± 8 (<0.00001)
IRS-2 interactionsIRS-2 bound to IRβ + 3 ± 1 (0.73374) –8 ± 2 (0.23419) –6 ± 1 (0.51197)PI3K p85α bound to IRS-2 +/–F 84 ± 6 (<0.00001) –39 ± 14 (0.22139) –84 ± 6 (<0.00001)
Akt1Akt1 pS473 + 193 ± 26 (0.00001) –89 ± 13 (0.00092) –88 ± 10 (0.00035)
GSK-3β
GSK-3β pY216 + –31 ± 4 (0.00782) –76 ± 25 (0.04303) –77 ± 17 (0.00381)GSK-3β pS9 – 4 ± 2 (0.25830) –83 ± 18 (0.00321) –59 ± 11 (0.01414)
mTORmTOR pS2448 + 107 ± 18 (0.00081) –74 ± 13 (0.00465) –76 ± 13 (0.00463)
ERK2ERK2 pT185/pY187 + 179 ± 13 (0.00033) –90 ± 11 (0.00147) –90 ± 19 (0.00244)
Values (mean ± SEM; P in parentheses) denote percent relative to the normal level, based on ratios shown in Supplemental Table 3. AActivation (facilita-tion; +) or inhibition (suppression; –) of insulin signal transduction. BPercent difference in the mean level of a phosphorylated or bound molecule relative to total levels of that molecule or of the molecule to which it was bound. CRelative to basal level. DThese basal elevations do not necessarily indicate elevated IRS activation, because they may simply indicate an increase in IRS-1 pY (and probably IRS-2 pY) chronically bound to p85 in the cytosolic complexes (see Discussion). EAlthough a number of studies have deduced that phosphorylation of IRS-1 at S312 (S307 in rodents) suppresses insulin signaling (42, 47), recent work on mice lacking S307 indicates that it may actually facilitate such signaling (48). FThe regulatory p85 subunit of PI3K binds and activates the p110 catalytic subunit of PI3K, but p85 monomers can also sequester IRS-1 pY (and probably IRS-2 pY) in cytosolic complexes and thereby prevent IRS-1 (and probably IRS-2) stimulation of PI3K activity.

research article
�0 TheJournalofClinicalInvestigation http://www.jci.org Volume 122 Number 4 April 2012
(1,093%), perhaps reflecting a compensatory process, since such phosphorylation can promote IRS-1 function in mice despite the conclusion of cell-based studies that IRS-1 pS312 is suppressive (48). Elevated basal IRS-1 pS and IRS-1 pY may impair insulin’s ability to further increase those IRS-1 species, helping explain why insulin’s effect on them was typically blunted in AD.
Activated forms of downstream molecules were also elevated in AD: Akt1 pS473 (103%), Akt2 pS474 (166%), PKCζ/λ pT410/403 (248%), mTOR pS2448 (843%), IKKα/β pS176/180 (85%), and JNK1/2 pT183/pY185 (31%). Suppressed GSK-3α/β pS21/9 was elevated 25%. Reli-able IHC reactions were not obtained for GSK-3 α/β pS279/216 (87) or ERK2 pT185/pY187. These increases were not the result of anti-gen compression caused by cell atrophy, because the average CA1 neuronal size in AD cases was not different from that of matched N cases in the UPenn cohort (Supplemental Table 1).
Nitrotyrosine, a marker of inflammatory and oxidative stress asso-ciated with insulin resistance in T2D (88), was elevated in AD cases along with both total and oligomeric Aβ plaque load. No alterations were found in levels of protein phosphatases (i.e., PP2A, PP2B, and PTP1B) known to act on the IR, IRS-1, and Akt (89–92).
IRS-1 pS616 and IRS-1 pS636/639 are elevated in HF neurons of MCI and AD, regardless of APOE ε4 status. All the significant findings made in our discovery cohort were next tested in CA1 of the ROS cohort, consisting of 30 N, 29 MCI, and 31 AD cases (Supplemental Table 1). The 3 diagnostic groups did not differ significantly in age, sex ratio, PMI, or years of education. A few cases in each group had a history of T2D, but the results were the same with or without them. In the AD cases, the mean size of CA1 neurons was 27% less than normal, which may account for the higher total IRS-1 and GSK-3α/β pS21/9 in the AD cases, but antigen compression is unlikely to account for the 144%–699% increases in IRS-1 pS616, IRS-1 pS636/639, IRS-1 pY612, and IRS-1 serine kinases (Table 5).
In addition to replicating the findings in the UPenn cohort (Table 5), testing the ROS cohort provided information not obtained in the discovery cohort. First, those cases carrying 1 or 2 copies of APOE ε4 did not differ significantly from noncarriers in levels of the tested insulin signaling or regulating molecules. Second, reli-able IHC detection of phosphatidylinositol-triphosphate (PIP3), which was achieved only in the ROS cohort, showed that this was reduced in AD (Table 5). Third, compared with N cases, MCI cases showed (a) reduced IR/IGF-1Rβ pY, but not IRβ pY960; (b) elevated IRS-1 pS616 and IRS-1 pS636/639 without elevated IRS-1 pS312, IRS-1 pY612, or IRS-1 pY941; (c) lower levels of PIP3 and total GSK-3β; and (d) increased nitrotyrosine (Table 5, Figure 7, Supplemental Figure 5, D–F and J–L, and Supplemental Figure 6, M–O). These findings were made not only in our MCI group as a whole, but also in its amnestic (n = 12) and nonamnestic (n = 17) subgroups. Since MCI cases, especially amnestic cases, have a higher than normal risk of developing AD (93), our data suggest that brain insulin resistance may begin at a predementia stage of AD.
Contrary to first impressions (Supplemental Figure 5, M–O, and Supplemental Figure 6, A–L), MCI cases showed no signifi-cant increases in Akt1 pS473, Akt2 pS474, GSK-3α/β pS21/9, IKKα/β pS176/180, JNK1/2 pT183/pY185, or PKCζ/λ pT410/403 (Table 5). Wheth-er the same is true for activated levels of ERK known to phosphor-ylate IRS-1 at S616 and S636 (50, 51) could not be determined in the qIHC studies, because as noted above, we were unable to get reliable IHC reactions with antibodies specific to activated ERK.
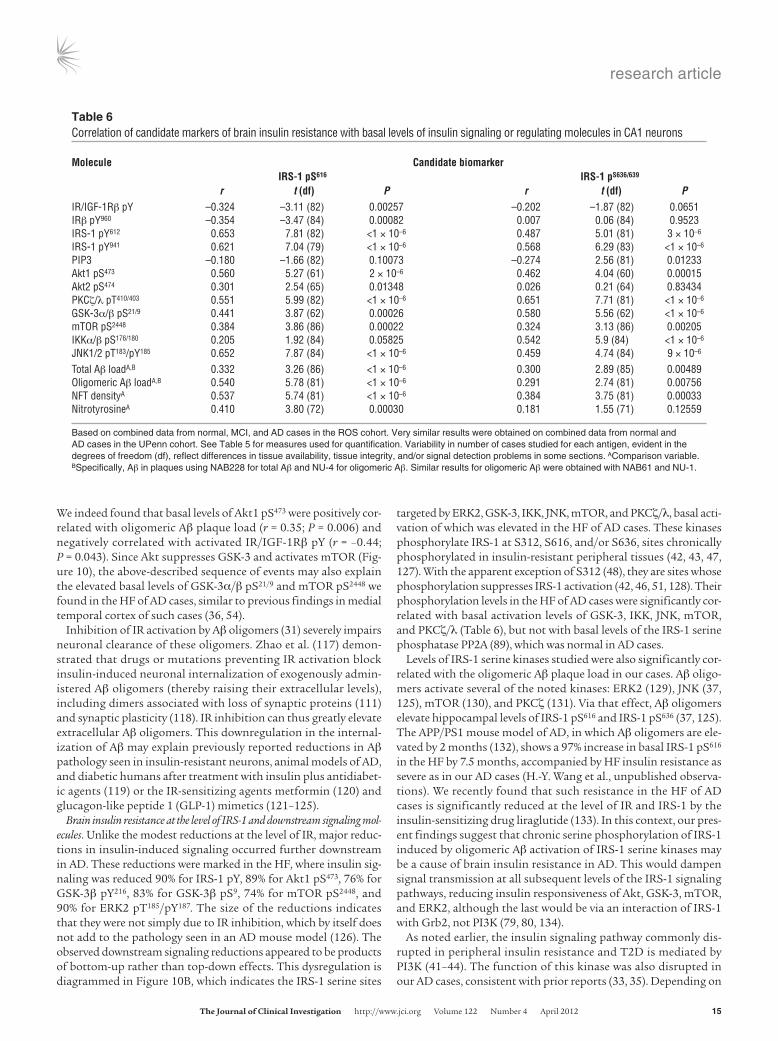
Neuronal IRS-1 pS616 and IRS-1 pS636/639 are negatively correlated with basal activation of IR/IGF-1Rβ and positively correlated with basal activa-tion of IRS-1 serine kinases and oligomeric Aβ plaque load. Correlational analyses were run on the 90 ROS cases to assess the relationship of IRS-1 pS616 and IRS-1 pS636/639 to relevant insulin signaling and regulating molecules in CA1 (Table 6). Consistent with a role for
Table �Difference in cerebellar cortex signaling responses to IGF-1 stimulation between AD cases and matched controls
Signaling molecule Signaling Basal Percent difference in response to IGF-1C
or interaction effectA levelB 1 nm 10 nm
IGF-1Rβ
IGF-1Rβ pY1135/1136 + 5 ± 1 (0.72098) –52 ± 6 (0.00514) –54 ± 10 (0.02939)IGF-1Rβ pY1131 + 9 ± 1 (0.50077) –73 ± 4 (0.00016) –47 ± 7 (0.00020)
IRS-1Total IRS-1 pY + 3 ± 1 (0.74941) –6 ± 1 (0.68220) –20 ± 2 (0.03327)Total IRS-1 pS + 9 ± 2 (0.39241) –2 ± 1 (0.57407) –8 ± 2 (0.47167)
IRS-1 interactionsIRS-1 bound to IGF-1Rβ + 11 ± 1 (0.60944) 10 ± 1 (0.77737) 8 ± 1 (0.78131)PI3K p85α bound to IRS-1 +/–D 19 ± 4 (0.13070) 10 ± 2 (0.28751) 5 ± 1 (0.38644)
IRS-2Total IRS-2 pY + 21 ± 2 (0.19324) –79 ± 3 (<0.00001) –53 ± 8 (0.00029)Total IRS-2 pS – 70 ± 9 (0.0032) –82 ± 6 (<0.00001) –68 ± 5 (<0.00001)
IRS-2 interactionsIRS-2 bound to IGF-1Rβ + 38 ± 6 (0.19132) –69 ± 6 (0.00032) –52 ± 9 (0.00069)PI3K p85α bound to IRS-2 +/–D 8 ± 1 (0.48043) –57 ± 11 (0.00022) –42 ± 10 (0.00337)
Values (mean ± SEM; P in parentheses) denote percentages relative to the normal level, based on ratios shown in Supplemental Table 4. AActivation (facilitation; +) or inhibition (suppression; –) of insulin signal transduction. BPercent difference in the mean level of a phosphorylated or bound molecule relative to total levels of that molecule or of the molecule to which it was bound. CRelative to basal level. Human sequence numbers are used. DThe regula-tory p85 subunit of PI3K binds and activates the p110 catalytic subunit of PI3K, but p85 monomers can also sequester IRS-1 pY (and probably IRS-2 pY) in cytosolic complexes and thereby prevent IRS-1 (and probably IRS-2) stimulation of PI3K activity.

research article
TheJournalofClinicalInvestigation http://www.jci.org Volume 122 Number 4 April 2012 ��
these IRS pS species in brain insulin resistance, their basal lev-els were negatively correlated with basal levels of activated IR/ IGF-1Rβ pY, IRβ pY960, and PIP3 (r = –0.26 to –0.35). Consistent with a role for IRS-1 serine kinases in elevated basal IRS-1 pS616 and IRS-1 pS636/639, basal levels of these IRS-1 species were posi-tively correlated with activated levels of mTOR (r = 0.32–0.38), JNK (r = 0.0.46–0.65), and PKCζ/λ (r = 0.55–0.65) as well as with levels of activated Akt1 (r = 0.46–0.56) indirectly phosphorylating IRS-1 via mTOR. Basal levels of these activated IRS-1 serine kinases were in turn positively and often highly correlated with total and oligo-meric Aβ plaque loads (Supplemental Table 7).
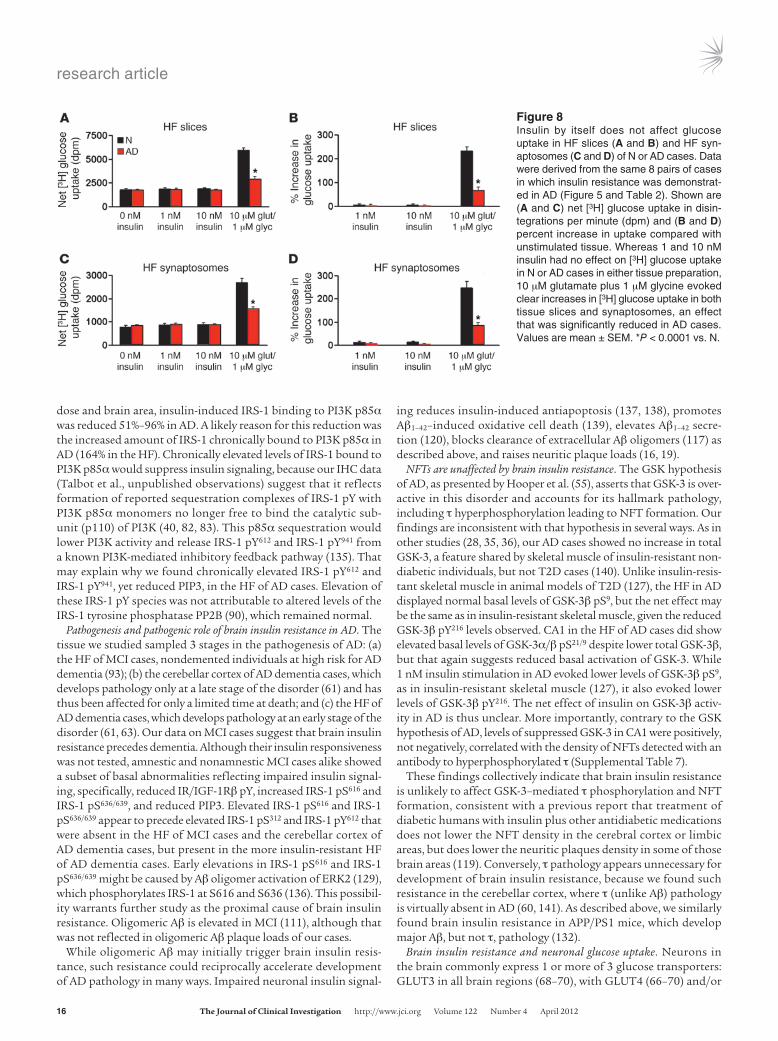
Insulin by itself has no effect on HF glucose uptake. Searching for the physiological consequences of brain insulin resistance, we looked for evidence that insulin-induced glucose uptake is reduced in AD. Among the molecules mediating such uptake in periph-eral tissues are activated Akt2 (pS474), deactivated AS160 (i.e., TBC1D4; pT642), and activated GluT4 (pS488) (94–96). Basal levels of these markers in CA1 of the UPenn cases were uninformative, however, being elevated for Akt2 pS474, normal for AS160 pT642, and reduced for GLUT4 pS488 (Figure 6). More informative were ex vivo tests on the 8 matched pairs of N and AD cases, which showed that neither 1 nor 10 nM insulin affected HF levels of GLUT4 pS488 or AS160 pT642 in either group (Supplemental Fig-ure 7). Since it is still possible for insulin to stimulate glucose uptake independent of AS160 (95) and perhaps GLUT4 pS488, we used the ex vivo stimulation paradigm to test the effect of 1 and 10 nM insulin on glucose uptake in HF slices and synaptosomes.
The latter preparations were included to test predominantly neuronal tissue. Insulin had no effect on basal (i.e., non–depolar-ization-induced) [3H] glucose uptake in whole or synaptosomal tissue of either N or AD cases (Figure 8). As a positive control, we tested the ability of 10 μM glutamate to induce glucose uptake; 1 μM glycine was also added to facilitate NMDAR activation, in light of reports that NMDA (97, 98) and depolarization (99, 100) trigger such uptake in neural tissue. This stimulus readily evoked glucose uptake in both HF preparations, but the magnitude of the uptake was reduced in AD by 68% in tissue slices and 72% in synaptosomes (see Figure 8).
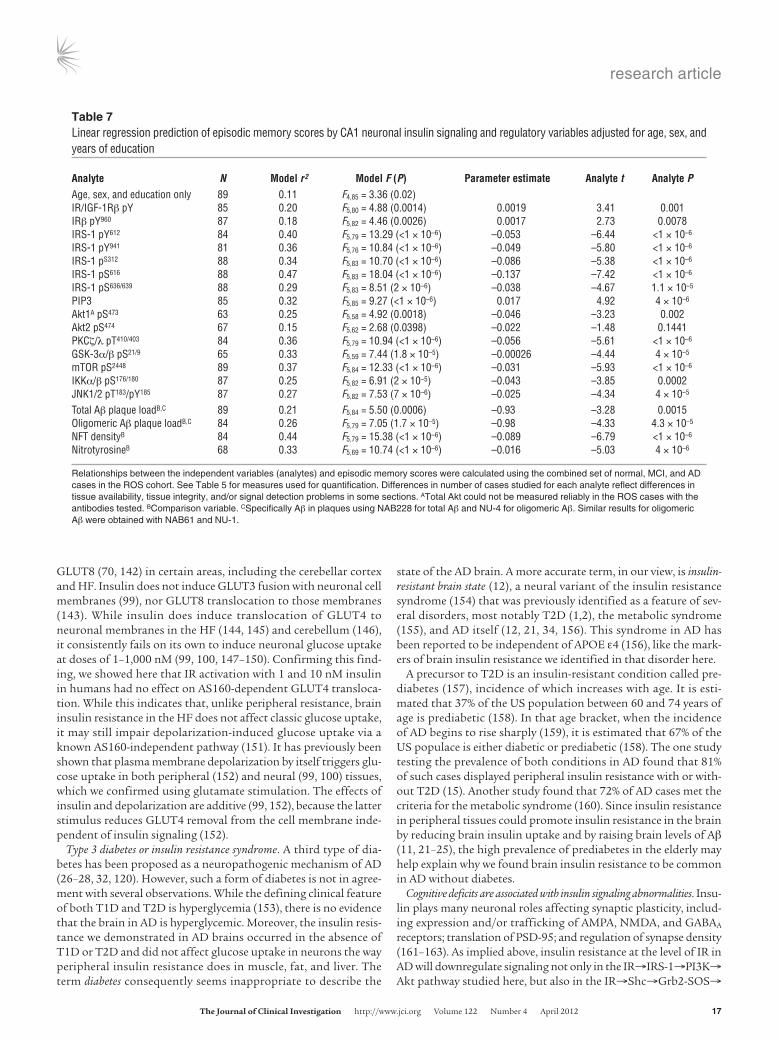
Basal activation states of neuronal insulin signaling molecules are closely related to cognitive ability. Using the available neuropsychological data on the ROS cohort (Supplemental Table 1), we focused on the relationship of neuronal insulin signaling and regulating mol-ecules in CA1 to episodic memory, given the close association of CA1 atrophy in AD to this type of memory (72). Linear regression analyses revealed that, apart from Akt 2, basal activation states of insulin signaling and regulating molecules in CA1 were highly related to episodic memory (Table 7). The relationships were posi-tive for molecular forms driving insulin signaling (IR/IGF-1Rβ pY, IRβ Y960, and PIP3) and negative for those attenuating such signal-ing (IRS-1 pS, GSK-3 pS21/9, IKKα/β pS176/180, JNK1/2 pT183/pY185, mTOR pS2448, and PKCζ/λ pT410/403) or likely to do so (chronic IRS-1 pY612 and IRS-1 pY941; see Discussion). The same pattern of relationships was found with respect to working memory and an index of global cognition.
Table �Difference in hippocampal formation signaling responses to IGF-1 stimulation between AD cases and matched controls
Signaling molecule Signaling Basal Percent difference in response to IGF-1C
or interaction effectA levelB 1 nm 10 nm
IGF-1Rβ
IGF-1Rβ pY1135/1136 + 14 ± 3 (0.30320) –90 ± 7 (<0.00001) –69 ± 7 (<0.00001)IGF-1Rβ pY1131 + 24 ± 4 (0.07011) –77 ± 9 (0.00019) –80 ± 10 (0.00112)
IRIRβ pY1150/1151 + 2 ± 1 (0.94184) 2 ± 1 (0.91495) –66 ± 5 (<0.00001)IRβ pY960 + 15 ± 7 (0.29355) 17 ± 8 (0.20104) –69 ± 9 (0.00029)
IRS-1Total IRS-1 pY + 92 ± 6 (<0.00001)D –34 ± 16 (0.08618) –90 ± 8 (0.00117)Total IRS-1 pS + 66 ± 7 (<0.00001) –21 ± 11 (0.34152) –88 ± 4 (<0.00001)
IRS-1 interactionsIRS-1 bound to IGF-1Rβ + 5 ± 1 (0.97267) 6 ± 1 (0.70993) –3 ± 1 (0.80955)IRS-1 bound to IRβ + 2 ± 1 (0.92747) 10 ± 5 (0.24861) –55 ± 9 (0.00131)PI3K p85α bound to IRS-1 +/–E 94 ± 4 (<0.00001)D 28 ± 15 (0.28751) –81 ± 5 (<0.00001)
IRS-2Total IRS-2 pY + 99 ± 8 (<0.00001)D –94 ± 4 (<0.00001) –84 ± 6 (<0.00001)Total IRS-2 pS – 112 ± 3 (<0.00001) –93 ± 6 (<0.00001) –86 ± 5 (<0.00001)
IRS-2 interactionsIRS-2 bound to IGF-1Rβ + 23 ± 5 (0.13927) –85 ± 6 (<0.00001) –73 ± 5 (<0.00001)PI3K p85α bound to IRS-2 +/–E 112 ± 13 (<0.00001)D –93 ± 7 (<0.00001) –86 ± 6 (<0.00001)
Values (mean ± SEM; P in parentheses) denote percentages relative to the normal level, based on ratios shown in Supplemental Table 5. Human sequence numbers are used. AActivation (facilitation; +) or inhibition (suppression; –) of insulin signal transduction. BPercent difference in the mean level of a phosphorylated or bound molecule relative to total levels of that molecule or of the molecule to which it was bound. CRelative to basal level. DThese basal elevations do not necessarily indicate elevated IRS activation, because they may simply indicate an increase in IRS-1 pY (and probably IRS-2 pY) chroni-cally bound to p85 in the cytosolic complexes. EThe regulatory p85 subunit of PI3K binds and activates the p110 catalytic subunit of PI3K, but p85 monomers can also sequester IRS-1 pY (and probably IRS-2 pY) in cytosolic complexes and thereby prevent IRS-1 (and probably IRS-2) stimulation of PI3K activity.

research article
�� TheJournalofClinicalInvestigation http://www.jci.org Volume 122 Number 4 April 2012
The density of neurons with detectable cyto-plasmic levels of IRS-1 pS616 showed the strongest association with cognitive ability (Table 7 and Figure 9). Its correlations with episodic memory, working memory, and global cognition were –0.66, –0.52, and –0.63, respectively. In a linear regression model, IRS-1 pS616 levels in CA1 adjusted for age, sex, and education together accounted for 47% of the variance in episodic memory scores (parameter estimate, –0.137; Table 7 and Figure 9A). Inclusion of neurofibrillary tangle (NFT) densities and Aβ plaque load in the model did not notably diminish the association of IRS-1 pS616 levels with episodic memory scores, which remained highly significant (parameter estimate, –0.14). This suggests that the contribution of IRS-1 pS616 levels in CA1 to cognitive dysfunction in AD is independent of Aβ plaques and NFTs.
DiscussionUsing an ex vivo stimulation protocol with near-physiological doses of insulin or IGF-1, we here pro-vide the first direct demonstration to our knowl-edge that the brain in AD is insulin and IGF-1 resistant and further show that this occurred in the absence of diabetes and did not affect basal neuronal glucose uptake. The ex vivo experiments also led to identification of 2 candidate biomark-ers of brain insulin resistance shared by insulin-resistant liver and muscle in obesity and/or T2D (43, 46, 47), namely, elevated levels of IRS-1 pS616 and IRS-1 pS636/639. In the absence of diabetes and regardless of APOE ε4 status, these candidate bio-markers proved a significant feature of HF field CA1 in MCI, a more prominent and very com-mon feature of that field in AD, and a major cor-relate of impaired cognition. By measuring basal activation of molecules regulating levels of IRS-1 pS616 and IRS-1 pS636/639, we discovered evidence that they reflect convergent effects of chronically active IRS-1 serine kinases. Our discussion focuses on the relevance of these and other findings of this study to mechanisms and consequences of brain insulin resistance in AD after addressing the con-trasting nature of insulin and IGF-1 resistance in that disorder.
Association of insulin resistance with IRS-1 versus asso-ciation of IGF-1 resistance with IRS-2. It is commonly stated that insulin and IGF-1 both signal via IRS-1 and IRS-2 (56, 57, 59), a view supported mainly by studies on cells genetically engineered to express or not express IR or IGF-1R (57, 59, 101). To our knowledge, this has not been confirmed in wild-type cells or tissue exposed to insulin or IGF-1 at doses selectively activating their cognate receptors (<10 nM). We are not aware of any prior stud-ies testing brain insulin or IGF signaling using near-physiological doses of these hormones. In the cerebellar cortex and HF of adult humans, we discovered that 1 nM insulin and IGF-1 selectively
Tab
le �
CA1
neur
onal
leve
ls o
f ins
ulin
sig
nalin
g an
d re
gula
ting
mol
ecul
es in
ROS
cas
es
Mol
ecul
e M
easu
reA
Valu
e (m
ean
± SD
) Ch
ange
(P)
N M
CI
AD
N vs
.MCI
M
CI v
s. A
D N
vs. A
DIR
β Ce
ll OD
13
08.7
3 ±
278.
2 11
80.6
6 ±
248.
2 13
54.8
8 ±
243.
3 –9
.78%
(0.2
655)
14
.76%
(0.0
850)
3.
53%
(0.8
477)
IR/IG
F-1R
β pY
Ce
ll OD
23
21.8
4 ±
39.1
21
24.3
0 ±
39.1
20
62.1
8 ±
38.4
–8
.51%
(0.0
017)
–2
.92%
(0.4
964)
–1
1.18
% (9
× 1
0–5)
IRβ
pY96
0 Ce
ll OD
11
66.2
2 ±
38.0
11
24.4
8 ±
37.3
96
2.25
± 3
6.7
–3.5
8% (0
.714
1)
–14.
43%
(0.0
074)
–1
7.49
% (6
× 1
0–4)
IRS-
1 Ce
ll OD
13
10.9
9 ±
209.
1 15
03.6
8 ±
190.
6 16
67.9
7 ±
180.
4 14
.70%
(0.0
012)
10
.93%
(0.0
071)
27
.23%
(5 ×
10–5
)IR
S-1
pY61
2 Ce
lls/m
m2
12.7
3 ±
2.3
16.5
2 ±
2.3
31.1
1 ±
2.2
29.7
7% (0
.484
3)
88.3
2% (2
× 1
0–5)
144.
38%
(2.3
× 1
0–6)
IRS-
1 pY
941
Cells
/mm
2 9.
00 ±
2.4
13
.27
± 2.
4 25
.45
± 2.
5 47
.44%
(0.4
360)
91
.79%
(0.0
026)
18
2.78
% (2
× 1
0–5)
IRS-
1 pS3
12
Cells
/mm
2 5.
06 ±
1.2
8.
42 ±
1.2
14
.64
± 1.
2 66
.40%
(0.1
435)
73
.87%
(0.0
015)
18
9.33
% (3
.6 ×
10–6
)IR
S-1
pS61
6 Ce
lls/m
m2
4.42
± 2
.1
12.9
3 ±
2.1
28.2
2 ±
2.0
192.
53%
(0.0
157)
11
8.25
% (9
.5 ×
10–6
) 53
8.46
% (2
.8 ×
10–1
0 )IR
S-1
pS63
6/63
9 Ce
lls/m
m2
9.20
± 2
.5
17.2
7 ±
2.5
27.1
6 ±
2.5
87.7
2% (0
.032
8)
57.2
7% (0
.018
8)
195.
22%
(2.3
× 1
0–5)
PIP3
Ce
lls/m
m2
96.1
± 3
0.1
74.3
± 3
1.6
47.9
± 3
1.5
–22.
68%
(0.0
358)
–3
5.53
% (0
.006
1)
–50.
16%
(2.6
× 1
0–6)
Akt1
pS47
3 Ce
lls/m
m2
9.64
± 6
.8
11.4
8 ±
1.5
26.7
± 1
4.1
19.1
0% (0
.803
5)
132.
58%
(2.3
× 1
0–5)
176.
97%
(4.5
× 1
0–6)
Akt2
pS47
4 Ce
lls/m
m2
9.47
± 7
.1
9.71
± 1
0.3
16.9
6 ±
13.2
2.
53%
(0.9
971)
74
.67%
(0.0
732)
79
.09%
(0.0
618)
PKCζ
/λ p
T410/
403
Cells
/mm
2 5.
97 ±
1.8
8.
40 ±
1.8
23
.36
± 1.
7 40
.70%
(0.5
965)
17
8.10
% (3
.81
× 10
–7)
291.
30%
(6.7
× 1
0–9)
GSK-
3β
Cell
OD
2035
.81
± 51
8.3
1550
.65
± 20
2.1
1539
.75
± 33
2.9
–23.
83%
(9 ×
10–5
) –0
.70%
(0.9
934)
–2
4.37
% (5
× 1
0–5)
GSK-
3α/β
pS21
/9
Cell
OD
1073
.67
± 19
9.5
1134
.18
± 23
7.3
1422
.78
± 19
1.3
5.64
% (0
.628
9)
25.4
5% (0
.000
2)
32.5
2% (1
× 1
0–5)
mTO
R pS
2448
Ce
lls/m
m2
4.88
± 6
.4
8.51
± 7
.7
39.0
± 2
7.0
74.3
9% (0
.702
7)
358.
28%
(4.8
× 1
0–7)
699.
18%
(1 ×
10–1
1 )IK
Kα/β
pS17
6/18
0 Ce
lls/m
m2
4.01
± 5
.3
7.87
± 7
.9
16.8
3 ±
13.7
96
.26%
(0.3
112)
11
3.85
% (0
.002
3)
319.
70%
(4.2
× 1
0–5)
JNK1
/2 p
T183 /p
Y185
Cells
/mm
2 15
.03
± 10
.7
19.7
3 ±
17.1
43
.92
± 23
.5
31.2
7% (0
.609
8)
122.
61%
(2.4
× 1
0–5)
192.
22%
(6.3
× 1
0–7)
Nitro
tyro
sine
B Ce
lls/m
m2
47.5
8 ±
27.6
72
.81
± 31
.1
112.
86 ±
35.
1 53
.03%
(0.0
227)
55
.01%
(3.3
× 1
0–5)
137.
20%
(8.5
× 1
0–10 )
Bas
ed o
n qI
HC
test
s of
30
norm
al (
N),
29
mild
cog
nitiv
e im
pairm
ent (
MC
I), a
nd 3
1 A
D c
ases
. The
cel
l den
sity
dat
a w
as n
orm
aliz
ed to
tota
l neu
rona
l den
sity
to c
ontr
ol fo
r ce
ll lo
ss in
AD
. Tot
al le
vels
of A
kt
and
activ
ated
ER
K w
ere
not d
eter
min
ed d
ue to
unr
elia
ble
IHC
rea
ctio
ns w
ith th
ose
antig
ens.
AF
or a
ntig
ens
fillin
g ne
uron
al c
ytop
lasm
in n
orm
al c
ases
, the
opt
ical
den
sity
(O
D)
of im
mun
orea
ctiv
ity w
as m
ea-
sure
d. F
or a
ntig
ens
typi
cally
con
cent
rate
d in
(or
res
tric
ted
to)
cell
nucl
ei in
nor
mal
cas
es, t
he d
ensi
ty o
f neu
rons
(ce
lls/m
m2 )
dis
play
ing
dete
ctab
le e
xtra
-nuc
lear
(i.e
., cy
topl
asm
ic)
imm
unor
eact
ivity
was
mea
-su
red
as d
escr
ibed
in S
uppl
emen
tal M
etho
ds. B
Com
paris
on v
aria
ble.
research article
TheJournalofClinicalInvestigation http://www.jci.org Volume 122 Number 4 April 2012 ��
activating their cognate receptors signal via different IRS isoforms: insulin via IRS-1 and IGF-1 via IRS-2. Even at 10-nM doses, insulin signaled predominantly via IRS-1, and IGF-1 via IRS-2, in these brain areas. This dichotomy may reflect the fact that the brain, unlike many peripheral tissues, expresses only the shorter form of the IR known as IR-A, as opposed to full-length IR-B (102–104). Indeed, embryonic mouse fibroblasts expressing only the IR-A iso-form respond to 10 nM insulin with a strong, sustained activation of IRS-1 and only a weaker, transient activation of IRS-2 (59).
As expected, then, the brain areas we studied in AD showed insu-lin resistance that was associated with dysfunctional IRS-1 as well as IGF-1 resistance that was associated with dysfunctional IRS-2. In response to 1 nM insulin, there was less IRβ bound to IRS-1, less
IRS-1 activation, and less IRS-1 bound to PI3K p85α. In response to 1 nM IGF-1, however, there was less IGF-1Rβ bound to IRS-2, less IRS-2 activation, and less IRS-2 bound to PI3K p85α. Except for insulin responses in the cerebellar cortex, neither type of resis-tance was ameliorated by 10-nM doses.
IGF-1 resistance differed conspicuously from insulin resistance in AD by its more advanced state in the cerebellar cortex and its magnitude at the receptor level there and in the HF. These differ-ences imply different causes of IGF-1 and insulin resistance. While elevated basal levels of IRS-2 pS may be a factor, we did not pursue that possibility, given the absence of antibodies specific for serine sites on IRS-2 known to affect its functions. Judging from known and likely brain functions of IGF-1, IGF-1 resistance may impair
Figure �CA1 pyramidal cells in AD display marked elevation in cytosolic levels of IRS-1 pS species and their activated kinases. The heat map sum-marizes relative basal levels of select insulin signaling molecules (A), activation states of those and related molecules (B), activation states of IRS-1 serine kinases (C), protein phosphatases that regulate insulin signaling (D), and neuropathological parameters (E). Data are shown for the 24 N and 24 matched AD cases in the UPenn cohort. Each row displays mean qIHC data on the respective analyte; each cell shows mean cel-lular levels of an analyte in a given case relative to all 48 cases studied. See Table 5 for measures used to quantify each analyte. P values denote differences between N and AD cases. Note that AD cases typically showed high levels of IRS-1 pS species and of activated IRS-1 pS kinases (GSK-3, IKK, JNK, mTOR, and PKCζ/λ). All amino acid sequence numbers are for the human proteins. tAβ, total Aβ; oAβ, oligomeric Aβ.

research article
�� TheJournalofClinicalInvestigation http://www.jci.org Volume 122 Number 4 April 2012
neurogenesis, neuron viability, glucose uptake, and cognition (105, 106). Brain IGF-1 resistance in AD may nevertheless be adaptive, because deficient IGF-1 signaling (via IRS-2) delays Aβ accumula-tion and toxicity in animal models of AD (107, 108).
Brain insulin resistance at the level of IR. In our AD cases, the cerebel-lar cortex and, to a greater degree, the HF showed reduced responses to 1 nM insulin at all levels of the signaling pathway investigated (Figure 5 and Figure 10A). Relatively modest, albeit significant resis-tance occurred at the level of IR, with activation reduced 26%–29% in the kinase domain (Y1146, Y1150, and Y1151; equivalent to Y1158, Y1162, and Y1163 in IR-B) and 34%–58% at the IRS-1 dock-ing site (Y960; equivalent to Y972 in IR-B). The reduction in the kinase domain implies downregulation of all insulin signaling pathways, not just the IR→IRS-1→PI3K→Akt pathway studied. The proximal cause does not appear to be reduced levels of IR or elevated levels of the IR phosphatase PTP1B (92), both of which were normal in our AD cases. In Western blots and qIHC in our 2 cohorts, there was no indication of the large reductions in total IR and IGF-1R reported in the HF of AD cases by Steen et al. (28).
Elevated Aβ oligomers in the brain, potentially due in part to insulin resistance in peripheral tissues (25), offer a plausible expla-nation for the reductions we observed in insulin-induced IR acti-vation in AD. Where measured, brain levels of Aβ oligomers are greatly elevated in this disorder (109–111). Relatively low doses of Aβ oligomers (100 nM) induce rapid IR translocation from den-drites to cell bodies in cultured hippocampal neurons, probably reflecting receptor internalization (31). While such translocation of neuronal IRs has been deduced in the temporal cortex of AD cases (33), we saw no evidence of that with respect to total IRβ, IRβ pY960, or IR/IGF-1Rβ pY in the temporal cortex or hippocampus of AD cases, perhaps due to more effective epitope retrieval methods yielding enhanced detection of membrane-bound receptors.
However, Aβ oligomers can also inhibit IRs (31) by a mechanism consistent with our findings. Such oligomers increase cytosolic free Ca2+ (112), which is known to inhibit insulin-induced hippocampal IR pY (113). Aβ oligomers trigger Ca2+ influx, in part by activating NMDA receptors (114), which elevates Akt1 pS473 (115), an event capable of inhibiting insulin-induced IR pY (116).
Figure �Key insulin signaling molecules seen immunohistochemically in CA1 neurons of N, MCI, and AD cases of the ROS cohort. See Table 5 for numeric data on the anti-gens. IR/IGF-1Rβ pY (A–C) was reduced in MCI. Total neuronal IRS-1 (D–F) was not reduced in MCI or AD. IRS-1 pS was normally confined to cell nuclei (e.g., arrow in G) with few exceptions, but the density of neurons with detectable cytoplasmic IRS-1 pS616 (G–I) or IRS-1 pS636/639 (J–L) increased markedly from N to MCI to AD. What appears to be high background lev-els of IRS-1 pS616 in I was actually elevated antigen in the neuropil. (M–O) Akt1 pS473 was barely detectable in N cases, but the density of neurons with detectable cyto-plasmic levels of the activated molecule rose markedly from N or MCI to AD. See Supplemental Figures 5 and 6 for other insulin signaling molecules studied in the ROS cohort. Scale bar: 70 μm.
research article
TheJournalofClinicalInvestigation http://www.jci.org Volume 122 Number 4 April 2012 ��
We indeed found that basal levels of Akt1 pS473 were positively cor-related with oligomeric Aβ plaque load (r = 0.35; P = 0.006) and negatively correlated with activated IR/IGF-1Rβ pY (r = –0.44; P = 0.043). Since Akt suppresses GSK-3 and activates mTOR (Fig-ure 10), the above-described sequence of events may also explain the elevated basal levels of GSK-3α/β pS21/9 and mTOR pS2448 we found in the HF of AD cases, similar to previous findings in medial temporal cortex of such cases (36, 54).
Inhibition of IR activation by Aβ oligomers (31) severely impairs neuronal clearance of these oligomers. Zhao et al. (117) demon-strated that drugs or mutations preventing IR activation block insulin-induced neuronal internalization of exogenously admin-istered Aβ oligomers (thereby raising their extracellular levels), including dimers associated with loss of synaptic proteins (111) and synaptic plasticity (118). IR inhibition can thus greatly elevate extracellular Aβ oligomers. This downregulation in the internal-ization of Aβ may explain previously reported reductions in Aβ pathology seen in insulin-resistant neurons, animal models of AD, and diabetic humans after treatment with insulin plus antidiabet-ic agents (119) or the IR-sensitizing agents metformin (120) and glucagon-like peptide 1 (GLP-1) mimetics (121–125).
Brain insulin resistance at the level of IRS-1 and downstream signaling mol-ecules. Unlike the modest reductions at the level of IR, major reduc-tions in insulin-induced signaling occurred further downstream in AD. These reductions were marked in the HF, where insulin sig-naling was reduced 90% for IRS-1 pY, 89% for Akt1 pS473, 76% for GSK-3β pY216, 83% for GSK-3β pS9, 74% for mTOR pS2448, and 90% for ERK2 pT185/pY187. The size of the reductions indicates that they were not simply due to IR inhibition, which by itself does not add to the pathology seen in an AD mouse model (126). The observed downstream signaling reductions appeared to be products of bottom-up rather than top-down effects. This dysregulation is diagrammed in Figure 10B, which indicates the IRS-1 serine sites
targeted by ERK2, GSK-3, IKK, JNK, mTOR, and PKCζ/λ, basal acti-vation of which was elevated in the HF of AD cases. These kinases phosphorylate IRS-1 at S312, S616, and/or S636, sites chronically phosphorylated in insulin-resistant peripheral tissues (42, 43, 47, 127). With the apparent exception of S312 (48), they are sites whose phosphorylation suppresses IRS-1 activation (42, 46, 51, 128). Their phosphorylation levels in the HF of AD cases were significantly cor-related with basal activation levels of GSK-3, IKK, JNK, mTOR, and PKCζ/λ (Table 6), but not with basal levels of the IRS-1 serine phosphatase PP2A (89), which was normal in AD cases.
Levels of IRS-1 serine kinases studied were also significantly cor-related with the oligomeric Aβ plaque load in our cases. Aβ oligo-mers activate several of the noted kinases: ERK2 (129), JNK (37, 125), mTOR (130), and PKCζ (131). Via that effect, Aβ oligomers elevate hippocampal levels of IRS-1 pS616 and IRS-1 pS636 (37, 125). The APP/PS1 mouse model of AD, in which Aβ oligomers are ele-vated by 2 months (132), shows a 97% increase in basal IRS-1 pS616 in the HF by 7.5 months, accompanied by HF insulin resistance as severe as in our AD cases (H.-Y. Wang et al., unpublished observa-tions). We recently found that such resistance in the HF of AD cases is significantly reduced at the level of IR and IRS-1 by the insulin-sensitizing drug liraglutide (133). In this context, our pres-ent findings suggest that chronic serine phosphorylation of IRS-1 induced by oligomeric Aβ activation of IRS-1 serine kinases may be a cause of brain insulin resistance in AD. This would dampen signal transmission at all subsequent levels of the IRS-1 signaling pathways, reducing insulin responsiveness of Akt, GSK-3, mTOR, and ERK2, although the last would be via an interaction of IRS-1 with Grb2, not PI3K (79, 80, 134).
As noted earlier, the insulin signaling pathway commonly dis-rupted in peripheral insulin resistance and T2D is mediated by PI3K (41–44). The function of this kinase was also disrupted in our AD cases, consistent with prior reports (33, 35). Depending on
Table �Correlation of candidate markers of brain insulin resistance with basal levels of insulin signaling or regulating molecules in CA1 neurons
Molecule Candidate biomarker IRS-1 pS616 IRS-1 pS636/639
r t (df) P r t (df) PIR/IGF-1Rβ pY –0.324 –3.11 (82) 0.00257 –0.202 –1.87 (82) 0.0651IRβ pY960 –0.354 –3.47 (84) 0.00082 0.007 0.06 (84) 0.9523IRS-1 pY612 0.653 7.81 (82) <1 × 10⁻⁶ 0.487 5.01 (81) 3 × 10⁻⁶
IRS-1 pY941 0.621 7.04 (79) <1 × 10⁻⁶ 0.568 6.29 (83) <1 × 10⁻⁶
PIP3 –0.180 –1.66 (82) 0.10073 –0.274 2.56 (81) 0.01233Akt1 pS473 0.560 5.27 (61) 2 × 10⁻⁶ 0.462 4.04 (60) 0.00015Akt2 pS474 0.301 2.54 (65) 0.01348 0.026 0.21 (64) 0.83434PKCζ/λ pT410/403 0.551 5.99 (82) <1 × 10⁻⁶ 0.651 7.71 (81) <1 × 10⁻⁶
GSK-3α/β pS21/9 0.441 3.87 (62) 0.00026 0.580 5.56 (62) <1 × 10⁻⁶
mTOR pS2448 0.384 3.86 (86) 0.00022 0.324 3.13 (86) 0.00205IKKα/β pS176/180 0.205 1.92 (84) 0.05825 0.542 5.9 (84) <1 × 10⁻⁶
JNK1/2 pT183/pY185 0.652 7.87 (84) <1 × 10⁻⁶ 0.459 4.74 (84) 9 × 10⁻⁶
Total Aβ loadA,B 0.332 3.26 (86) <1 × 10⁻⁶ 0.300 2.89 (85) 0.00489Oligomeric Aβ loadA,B 0.540 5.78 (81) <1 × 10⁻⁶ 0.291 2.74 (81) 0.00756NFT densityA 0.537 5.74 (81) <1 × 10⁻⁶ 0.384 3.75 (81) 0.00033NitrotyrosineA 0.410 3.80 (72) 0.00030 0.181 1.55 (71) 0.12559
Based on combined data from normal, MCI, and AD cases in the ROS cohort. Very similar results were obtained on combined data from normal and AD cases in the UPenn cohort. See Table 5 for measures used for quantification. Variability in number of cases studied for each antigen, evident in the degrees of freedom (df), reflect differences in tissue availability, tissue integrity, and/or signal detection problems in some sections. AComparison variable. BSpecifically, Aβ in plaques using NAB228 for total Aβ and NU-4 for oligomeric Aβ. Similar results for oligomeric Aβ were obtained with NAB61 and NU-1.
research article
�� TheJournalofClinicalInvestigation http://www.jci.org Volume 122 Number 4 April 2012
dose and brain area, insulin-induced IRS-1 binding to PI3K p85α was reduced 51%–96% in AD. A likely reason for this reduction was the increased amount of IRS-1 chronically bound to PI3K p85α in AD (164% in the HF). Chronically elevated levels of IRS-1 bound to PI3K p85α would suppress insulin signaling, because our IHC data (Talbot et al., unpublished observations) suggest that it reflects formation of reported sequestration complexes of IRS-1 pY with PI3K p85α monomers no longer free to bind the catalytic sub-unit (p110) of PI3K (40, 82, 83). This p85α sequestration would lower PI3K activity and release IRS-1 pY612 and IRS-1 pY941 from a known PI3K-mediated inhibitory feedback pathway (135). That may explain why we found chronically elevated IRS-1 pY612 and IRS-1 pY941, yet reduced PIP3, in the HF of AD cases. Elevation of these IRS-1 pY species was not attributable to altered levels of the IRS-1 tyrosine phosphatase PP2B (90), which remained normal.
Pathogenesis and pathogenic role of brain insulin resistance in AD. The tissue we studied sampled 3 stages in the pathogenesis of AD: (a) the HF of MCI cases, nondemented individuals at high risk for AD dementia (93); (b) the cerebellar cortex of AD dementia cases, which develops pathology only at a late stage of the disorder (61) and has thus been affected for only a limited time at death; and (c) the HF of AD dementia cases, which develops pathology at an early stage of the disorder (61, 63). Our data on MCI cases suggest that brain insulin resistance precedes dementia. Although their insulin responsiveness was not tested, amnestic and nonamnestic MCI cases alike showed a subset of basal abnormalities reflecting impaired insulin signal-ing, specifically, reduced IR/IGF-1Rβ pY, increased IRS-1 pS616 and IRS-1 pS636/639, and reduced PIP3. Elevated IRS-1 pS616 and IRS-1 pS636/639 appear to precede elevated IRS-1 pS312 and IRS-1 pY612 that were absent in the HF of MCI cases and the cerebellar cortex of AD dementia cases, but present in the more insulin-resistant HF of AD dementia cases. Early elevations in IRS-1 pS616 and IRS-1 pS636/639 might be caused by Aβ oligomer activation of ERK2 (129), which phosphorylates IRS-1 at S616 and S636 (136). This possibil-ity warrants further study as the proximal cause of brain insulin resistance. Oligomeric Aβ is elevated in MCI (111), although that was not reflected in oligomeric Aβ plaque loads of our cases.
While oligomeric Aβ may initially trigger brain insulin resis-tance, such resistance could reciprocally accelerate development of AD pathology in many ways. Impaired neuronal insulin signal-
ing reduces insulin-induced antiapoptosis (137, 138), promotes Aβ1–42–induced oxidative cell death (139), elevates Aβ1–42 secre-tion (120), blocks clearance of extracellular Aβ oligomers (117) as described above, and raises neuritic plaque loads (16, 19).
NFTs are unaffected by brain insulin resistance. The GSK hypothesis of AD, as presented by Hooper et al. (55), asserts that GSK-3 is over-active in this disorder and accounts for its hallmark pathology, including τ hyperphosphorylation leading to NFT formation. Our findings are inconsistent with that hypothesis in several ways. As in other studies (28, 35, 36), our AD cases showed no increase in total GSK-3, a feature shared by skeletal muscle of insulin-resistant non-diabetic individuals, but not T2D cases (140). Unlike insulin-resis-tant skeletal muscle in animal models of T2D (127), the HF in AD displayed normal basal levels of GSK-3β pS9, but the net effect may be the same as in insulin-resistant skeletal muscle, given the reduced GSK-3β pY216 levels observed. CA1 in the HF of AD cases did show elevated basal levels of GSK-3α/β pS21/9 despite lower total GSK-3β, but that again suggests reduced basal activation of GSK-3. While 1 nM insulin stimulation in AD evoked lower levels of GSK-3β pS9, as in insulin-resistant skeletal muscle (127), it also evoked lower levels of GSK-3β pY216. The net effect of insulin on GSK-3β activ-ity in AD is thus unclear. More importantly, contrary to the GSK hypothesis of AD, levels of suppressed GSK-3 in CA1 were positively, not negatively, correlated with the density of NFTs detected with an antibody to hyperphosphorylated τ (Supplemental Table 7).
These findings collectively indicate that brain insulin resistance is unlikely to affect GSK-3–mediated τ phosphorylation and NFT formation, consistent with a previous report that treatment of diabetic humans with insulin plus other antidiabetic medications does not lower the NFT density in the cerebral cortex or limbic areas, but does lower the neuritic plaques density in some of those brain areas (119). Conversely, τ pathology appears unnecessary for development of brain insulin resistance, because we found such resistance in the cerebellar cortex, where τ (unlike Aβ) pathology is virtually absent in AD (60, 141). As described above, we similarly found brain insulin resistance in APP/PS1 mice, which develop major Aβ, but not τ, pathology (132).
Brain insulin resistance and neuronal glucose uptake. Neurons in the brain commonly express 1 or more of 3 glucose transporters: GLUT3 in all brain regions (68–70), with GLUT4 (66–70) and/or
Figure �Insulin by itself does not affect glucose uptake in HF slices (A and B) and HF syn-aptosomes (C and D) of N or AD cases. Data were derived from the same 8 pairs of cases in which insulin resistance was demonstrat-ed in AD (Figure 5 and Table 2). Shown are (A and C) net [3H] glucose uptake in disin-tegrations per minute (dpm) and (B and D) percent increase in uptake compared with unstimulated tissue. Whereas 1 and 10 nM insulin had no effect on [3H] glucose uptake in N or AD cases in either tissue preparation, 10 μM glutamate plus 1 μM glycine evoked clear increases in [3H] glucose uptake in both tissue slices and synaptosomes, an effect that was significantly reduced in AD cases. Values are mean ± SEM. *P < 0.0001 vs. N.
research article
TheJournalofClinicalInvestigation http://www.jci.org Volume 122 Number 4 April 2012 ��
GLUT8 (70, 142) in certain areas, including the cerebellar cortex and HF. Insulin does not induce GLUT3 fusion with neuronal cell membranes (99), nor GLUT8 translocation to those membranes (143). While insulin does induce translocation of GLUT4 to neuronal membranes in the HF (144, 145) and cerebellum (146), it consistently fails on its own to induce neuronal glucose uptake at doses of 1–1,000 nM (99, 100, 147–150). Confirming this find-ing, we showed here that IR activation with 1 and 10 nM insulin in humans had no effect on AS160-dependent GLUT4 transloca-tion. While this indicates that, unlike peripheral resistance, brain insulin resistance in the HF does not affect classic glucose uptake, it may still impair depolarization-induced glucose uptake via a known AS160-independent pathway (151). It has previously been shown that plasma membrane depolarization by itself triggers glu-cose uptake in both peripheral (152) and neural (99, 100) tissues, which we confirmed using glutamate stimulation. The effects of insulin and depolarization are additive (99, 152), because the latter stimulus reduces GLUT4 removal from the cell membrane inde-pendent of insulin signaling (152).
Type 3 diabetes or insulin resistance syndrome. A third type of dia-betes has been proposed as a neuropathogenic mechanism of AD (26–28, 32, 120). However, such a form of diabetes is not in agree-ment with several observations. While the defining clinical feature of both T1D and T2D is hyperglycemia (153), there is no evidence that the brain in AD is hyperglycemic. Moreover, the insulin resis-tance we demonstrated in AD brains occurred in the absence of T1D or T2D and did not affect glucose uptake in neurons the way peripheral insulin resistance does in muscle, fat, and liver. The term diabetes consequently seems inappropriate to describe the
state of the AD brain. A more accurate term, in our view, is insulin-resistant brain state (12), a neural variant of the insulin resistance syndrome (154) that was previously identified as a feature of sev-eral disorders, most notably T2D (1,2), the metabolic syndrome (155), and AD itself (12, 21, 34, 156). This syndrome in AD has been reported to be independent of APOE ε4 (156), like the mark-ers of brain insulin resistance we identified in that disorder here.
A precursor to T2D is an insulin-resistant condition called pre-diabetes (157), incidence of which increases with age. It is esti-mated that 37% of the US population between 60 and 74 years of age is prediabetic (158). In that age bracket, when the incidence of AD begins to rise sharply (159), it is estimated that 67% of the US populace is either diabetic or prediabetic (158). The one study testing the prevalence of both conditions in AD found that 81% of such cases displayed peripheral insulin resistance with or with-out T2D (15). Another study found that 72% of AD cases met the criteria for the metabolic syndrome (160). Since insulin resistance in peripheral tissues could promote insulin resistance in the brain by reducing brain insulin uptake and by raising brain levels of Aβ (11, 21–25), the high prevalence of prediabetes in the elderly may help explain why we found brain insulin resistance to be common in AD without diabetes.
Cognitive deficits are associated with insulin signaling abnormalities. Insu-lin plays many neuronal roles affecting synaptic plasticity, includ-ing expression and/or trafficking of AMPA, NMDA, and GABAA receptors; translation of PSD-95; and regulation of synapse density (161–163). As implied above, insulin resistance at the level of IR in AD will downregulate signaling not only in the IR→IRS-1→PI3K→Akt pathway studied here, but also in the IR→Shc→Grb2-SOS→
Table �Linear regression prediction of episodic memory scores by CA1 neuronal insulin signaling and regulatory variables adjusted for age, sex, and years of education
Analyte N Model r 2 Model F (P) Parameter estimate Analyte t Analyte PAge, sex, and education only 89 0.11 F4,85 = 3.36 (0.02)IR/IGF-1Rβ pY 85 0.20 F5,80 = 4.88 (0.0014) 0.0019 3.41 0.001IRβ pY960 87 0.18 F5,82 = 4.46 (0.0026) 0.0017 2.73 0.0078IRS-1 pY612 84 0.40 F5,79 = 13.29 (<1 × 10⁻⁶) –0.053 –6.44 <1 × 10⁻⁶
IRS-1 pY941 81 0.36 F5,76 = 10.84 (<1 × 10⁻⁶) –0.049 –5.80 <1 × 10⁻⁶
IRS-1 pS312 88 0.34 F5,83 = 10.70 (<1 × 10⁻⁶) –0.086 –5.38 <1 × 10⁻⁶
IRS-1 pS616 88 0.47 F5,83 = 18.04 (<1 × 10⁻⁶) –0.137 –7.42 <1 × 10⁻⁶
IRS-1 pS636/639 88 0.29 F5,83 = 8.51 (2 × 10⁻⁶) –0.038 –4.67 1.1 × 10⁻⁵
PIP3 85 0.32 F5,85 = 9.27 (<1 × 10⁻⁶) 0.017 4.92 4 × 10⁻⁶
Akt1A pS473 63 0.25 F5,58 = 4.92 (0.0018) –0.046 –3.23 0.002Akt2 pS474 67 0.15 F5,62 = 2.68 (0.0398) –0.022 –1.48 0.1441PKCζ/λ pT410/403 84 0.36 F5,79 = 10.94 (<1 × 10⁻⁶) –0.056 –5.61 <1 × 10⁻⁶
GSK-3α/β pS21/9 65 0.33 F5,59 = 7.44 (1.8 × 10⁻⁵) –0.00026 –4.44 4 × 10⁻⁵
mTOR pS2448 89 0.37 F5,84 = 12.33 (<1 × 10⁻⁶) –0.031 –5.93 <1 × 10⁻⁶
IKKα/β pS176/180 87 0.25 F5,82 = 6.91 (2 × 10⁻⁵) –0.043 –3.85 0.0002JNK1/2 pT183/pY185 87 0.27 F5,82 = 7.53 (7 × 10⁻⁶) –0.025 –4.34 4 × 10⁻⁵
Total Aβ plaque loadB,C 89 0.21 F5,84 = 5.50 (0.0006) –0.93 –3.28 0.0015Oligomeric Aβ plaque loadB,C 84 0.26 F5,79 = 7.05 (1.7 × 10⁻⁵) –0.98 –4.33 4.3 × 10⁻⁵
NFT densityB 84 0.44 F5,79 = 15.38 (<1 × 10⁻⁶) –0.089 –6.79 <1 × 10⁻⁶
NitrotyrosineB 68 0.33 F5,69 = 10.74 (<1 × 10⁻⁶) –0.016 –5.03 4 × 10⁻⁶
Relationships between the independent variables (analytes) and episodic memory scores were calculated using the combined set of normal, MCI, and AD cases in the ROS cohort. See Table 5 for measures used for quantification. Differences in number of cases studied for each analyte reflect differences in tissue availability, tissue integrity, and/or signal detection problems in some sections. ATotal Akt could not be measured reliably in the ROS cases with the antibodies tested. BComparison variable. CSpecifically Aβ in plaques using NAB228 for total Aβ and NU-4 for oligomeric Aβ. Similar results for oligomeric Aβ were obtained with NAB61 and NU-1.

research article
�� TheJournalofClinicalInvestigation http://www.jci.org Volume 122 Number 4 April 2012
MAPK signaling pathway. Both pathways are active at postsynaptic sites in the HF and are engaged in memory consolidation (161).
With cognitive data available in the ROS cohort, we discovered that basal activation states of many insulin signaling molecules in CA1 pyramidal cells were highly related to episodic memory. The relationships were positive for molecules promoting insulin signaling and negative for those attenuating or reflecting attenu-ation of such signaling. Of all the molecules tested, IRS-1 pS616 had the strongest and most negative relationship to episodic, as well as working, memory. Since the relationship of IRS-1 pS616 to cognitive ability remained highly significant after adjusting not only for age, sex, and years of education, but also for NFT and Aβ plaque load (total or oligomeric), it appears to be a major factor in cognitive decline, one more proximally associated with the molec-ular causes of that decline than the 2 above-described hallmark pathologies of AD. Given the ability of oligomeric Aβ to raise levels of IRS-1 pS616 (37, 125), this species of IRS-1 may in part mediate the effects of these oligomers on cognition.
Translational implications. Given recent advances in detecting pre-clinical AD (164), there is a growing demand for safe, effective treat-ments slowing or preventing early pathogenic events in the disorder. The present findings suggest one such treatment may be attenu-ating brain insulin resistance, as opposed to simply compensat-ing for it, since even 10 nM insulin failed to ameliorate HF insulin resistance. Metformin (120, 165) and 2 GLP-1 mimetics (121, 124, 125, 165, 166) are antidiabetic agents approved by the FDA without
restriction; all have excellent safety profiles, readily cross the blood-brain barrier, and raise insulin-induced IR and IRS-1 activation. These agents are all neuroprotectants (120, 167, 168) that reduce extracellular Aβ levels in cultures of insulin-resistant neurons (120, 122) and in AD mouse models (122, 124). In such mice, the GLP-1 mimetic liraglutide decreases oligomeric Aβ, neuritic plaque load, and microglial activation; elevates neurogenesis; restores LTP; and improves object recognition and spatial memory (124, 169). The same GLP-1 mimetic reduces insulin resistance in the HF from AD cases (133). Such discoveries underscore the therapeutic potential of future work on brain insulin resistance in MCI and AD.
Methods
SubjectsSee Supplemental Methods for descriptions of the UPenn and ROS cohorts and Supplemental Table 1 for cohort demographic, cognitive, autopsy, and neuropathological data. None of the AD cases in the 2 cohorts was comorbid for other neurological disorders or for psychiatric conditions. The presence or absence of diabetes was indicated by detailed medical records available for all cases. Data were not available on periph-eral insulin resistance in either cohort.
Diagnoses, cognitive testing, tissue collection, anatomical origin of samples, and neuropathology assessmentSee Supplemental Methods. The number of cases tested in ex vivo experi-ments and qIHC runs is specified in Results or the figure legends.
Ex vivo stimulation experimentsValidation tests of the ex vivo method in postmortem tissue. Dose-response effects of 0, 0.1, 1, 10, and 100 nM insulin on IRβ binding to IRS-1, as well as phosphorylation of IRβ, IRS-1, Akt1, and ERK2, were tested in the HF of human N subjects (4 female; 1 male) aged 56–99 years with PMIs of 5–19 hours. PMI effects on responses to 0, 1, or 10 nM insulin were tested in the HF from 2.5-month-old male Sprague-Dawley rats (Taconic Farms) tested for the integrity of α7 nicotinic and NMDA receptor signaling in postmortem frontal cortex (74). In compliance with the NIH Guide for the Care and Use of Laboratory Animals, the animals were sacrificed by quick CO2 asphyxiation. Brains were removed at death (PMI, 0 hours) or left in the intact body at 4°C for 4, 8, or 16 hours, mimicking human postmortem conditions. In other animals, the intact body was kept at 25°C for 4 hours before brain extraction. Upon removal, brains were frozen and stored at –80°C for 7 days.
Tissue preparation. Fresh-frozen tissue from the cerebellar cortex or HF was gradually thawed from –80°C to –20°C and cut into 100-μm × 100-μm × 3-mm slices in a chilled McIlwain tissue chopper. Slices equaling about 20 mg of tissue were suspended in 1 ml ice-cold oxygenated Krebs-Ringer solu-
Figure �The density of CA1 neurons displaying cytoplasmic IRS-1 pS616 is inversely associated with episodic memory (A), working memory (B), and global cognition (C). Linear regression graphs plot data on all the ROS cases (N, MCI, and AD; n = 88) adjusted for age, sex, and years of education; the linear regression line (solid) is shown flanked by 95% confidence intervals (dashed). Episodic memory, working memory, and global cognition scores are composites of the multiple measures used to assess those cognitive abilities. Raw scores on individual tests were converted to z scores (using population esti-mates of the mean and SD) and averaged to yield the composite scores (see Supplemental Methods).

research article
TheJournalofClinicalInvestigation http://www.jci.org Volume 122 Number 4 April 2012 ��
tion (K-R) containing 25 mM HEPES (pH 7.4), 118 mM NaCl, 4.8 mM KCl, 1.3 mM CaCl2, 1.2 mM KH2PO4, 1.2 mM MgSO4, 25 mM NaHCO3, 10 mM glucose, 100 μM ascorbate, 50 μg/ml leupeptin, 0.2 mM PMSF, 25 μg/ml pepstatin A, and 0.01 U/ml soybean trypsin inhibitor and centrifuged briefly. After 2 additional washes with 1 ml ice-cold K-R, brain slices were suspended in 1 ml K-R, or 1 ml low-Mg2+ (0.3 mM) K-R (LMKR) in the case of sections used to test glucose uptake.
Synaptosomes for the glucose uptake experiments were prepared from postmortem HF slices as described previously (73, 74). Briefly, using 10 strokes of a Teflon/glass homogenizer, the slices were homogenized in 10 volumes of ice-cold homogenization buffer (10 mM HEPES, pH 7.4; 0.32 M sucrose; 0.1 mM EDTA homogenization solution containing 50 μg/ml leupeptin, 0.2 mM PMSF, 25 μg/ml pepstatin A, and 0.01 U/ml soybean trypsin inhibitor and 2-mercaptomethanol). The homogenates were cleared by centrifugation (1,000 g for 10 minutes), and the super-natants were centrifuged at 15,000 g at 4°C for 30 minutes to pellet the synaptosomes (P2 fraction). The synaptosomes were then washed twice at 4°C in 1 ml ice-cold K-R and resuspended in 1 ml LMKR. Protein concen-trations were determined by the Bradford method (Bio-Rad) according to the manufacturer’s instructions.
Ex vivo insulin stimulation. Approximately 20 mg of brain slices were incu-bated for 30 minutes at 37°C with vehicle (K-R) alone or with vehicle plus
human recombinant insulin (Invitrogen 12585-014) or human recom-binant IGF-1 (Invitrogen PHG0071). The incubation mixture (total vol-ume, 0.5 ml) was aerated every 10 minutes with 95% O2 and 5% CO2 for 1 minute. Signaling was terminated with 1.5 ml ice-cold Ca2+-free K-R. The tissue was collected by brief centrifugation and homogenized in 250 μl ice-cold immunoprecipitation buffer (25 mM HEPES, pH 7.5; 200 mM NaCl; 1 mM EDTA; 50 μg/ml leupeptin; 10 μg/ml aprotinin; 2 μg/ml soybean trypsin inhibitor; 0.04 mM PMSF; 5 mM NaF; 1 mM sodium vanadate; 0.5 mM β-glycerophosphate; and 0.02% 2-mercaptoethanol containing 0.5% digitonin, 0.2% sodium cholate, and 0.5% NP-40). Homogenates were centrifuged at 1,000 g for 5 minutes at 4°C, and the supernatant (postmi-tochondrial fraction) was sonicated for 10 seconds on ice. Proteins were solubilized in 0.5% digitonin, 0.2% sodium cholate, and 0.5% NP-40 for 60 minutes at 4°C with end-to-end rotation. The resultant lysates were then cleared by centrifugation at 50,000 g for 5 minutes and diluted with 750 μl immunoprecipitation buffer. Protein concentrations were measured using the Bradford method (Bio-Rad).
Immunoprecipitation. To isolate proteins of interest, 200 μg of tissue lysates were immunoprecipitated overnight at 4°C with 1.0–1.5 μg of antibodies to IRβ, IGF-1β, IRS-1, Akt1, GSK-3β, mTOR, ERK2, AS160, or GLUT4 covalently conjugated to protein A–agarose beads (Pierce-Endogen). The antibodies used are shown in Supplemental Table 8. Immunoprecipitates
Figure �0Evidence for insulin resistance and its likely proximal causes in the HF of AD cases. The summary is consistent with the more limited data collected on insu-lin responses in the cerebellar cortex of these cases. (A) Compared with N cases, AD cases responded to 1 nM insulin with lower IR-A pY1150/1151 and IR-A pY960; less IRS-1 bound to IRβ; lower total IRS-1 pY, including IRS-1 pY612; less IRS-1 bound to PI3K p85α; less activation of downstream molecules, reflected in lesser elevations in Akt1 pS473, GSK-3β pY216, mTOR pS2448, and ERK2 pT185/pY187; and less suppres-sion of GSK-3β, reflected in lesser eleva-tion of GSK-3β pS9. GSK-3β pY216 is not a product of Akt1 activity, but of unknown mammalian kinases and autophosphoryla-tion (87). The question mark indicates an expected, but not tested, reduction in insu-lin-induced binding of the regulatory and catalytic subunits of PI3K (p85α and p110, respectively) in AD. (B) Basal activation states of insulin signaling and regulating molecules in AD vs. N cases. Consistent with decreased insulin signaling, reduced levels of IR/IGF-1Rβ pY, IRβ pY960, and PIP3 were found with qIHC. The question mark indicates uncertainty regarding the phosphorylation state of the IR catalytic domain, since IHC cannot distinguish this domain in IR and IGF-1R. The increases in IRS-1 pS312, IRS-1 pS616, and IRS-1 pS636/639 are probably caused by correlated increases in activated IRS-1 serine kinases (ERK2, IKK, JNK1/2, mTOR, and PKCζ/λ), potentially resulting from elevated oligo-meric Aβ. See Discussion for details.

research article
�0 TheJournalofClinicalInvestigation http://www.jci.org Volume 122 Number 4 April 2012
were incubated with 75 μl antigen elution buffer and 2% SDS for 2 minutes on ice, centrifuged to remove antibody–protein A–agarose complexes, and neutralized immediately with 10 μl of 1.5 M Tris buffer (pH 8.8) followed by addition of 65 μl 2× PAGE sample buffer and boiled for 5 minutes. Supernatants were probed for any residual target proteins, which showed that greater than 90% of the target proteins were immunoprecipitated in all cases (Supplemental Figure 8).
Immunoblotting. Solubilized immunoprecipitates derived from 100 μg tissue lysates were loaded on 7.5% or 10% gels, separated by SDS-PAGE, and then electrophoretically transferred to nitrocellulose membranes. Samples from a pair of N and AD cases were run on the same blots. Mem-branes were washed with PBS, blocked overnight at 4°C with 10% milk in PBS containing 0.1% Tween-20 (PBST), and washed 3× in 0.1% PBST baths (2 minutes each). To assess protein activation, membranes loaded with the above-described immunoprecipitates were incubated for 2 hours at room temperature with antibodies (Supplemental Table 9) to IRβ pY1150/1151/IGF-1Rβ pY1135/1136, IRβ pY960, IRS-1 pS312, IRS-1 pS616, IRS-1 pS636/639, Akt1 pS473, GSK-3β pS9, GSK-3β pY216, mTOR pS2448, or ERK1/2 pT185/pY187. To assess total protein levels (and IRS-1 binding to IRβ, IGF-1Rβ, or PI3Kα), membranes were stripped and reprobed for 2 hours at room tem-perature with antibodies (Supplemental Table 9) to IRβ, IGF-1Rβ, IRS-1, PI3K p85α, Akt, GSK-3β, mTOR, or ERK2. After initial probing and again after reprobing, membranes were washed 3× in 0.1% PBST baths (2 min-utes each), incubated for 1 hour with 1:5,000 dilution of species-appropri-ate, HRP-conjugated secondary antibodies, and washed 3× in 0.1% PBST baths (2 minutes each). Immunoreactivity was visualized by reaction in ECL Plus chemiluminescent reagent for exactly 5 minutes, followed by immediate exposure of the blot to X-ray film (Z & Z Medical). Bands at the relevant molecular masses were quantified using a GS-800 calibrated densitometer (Bio-Rad Laboratories). Ratios of phosphorylated to total levels of each antigen were used to compare N and AD cases independent of neuronal numbers sampled.
Ex vivo testing of insulin-induced glucose uptake. Aliquots of LMKR-suspended HF tissue totaling about 200 μg of slices or 100 μg of synaptosomes were preincubated for 5 minutes at 37°C in a shaking water bath. Next, 0.1 μCi [3H]glucose (glucose, d-[6-3H(N)]; 45.7 Ci/mmol; PerkinElmer) was added, followed immediately by vehicle, 1 or 10 nM insulin, or 10 μM glutamate/1 μM glycine, bringing the incubation volume to 250 μl. The incubation continued for 5 minutes, after which it was stopped by the addition of 1.25 ml ice-cold LMKR containing 0.5 mM EGTA. After centrifugation, the supernatant was discarded, and the pellet was resus-pended in 1.5 ml fresh 0.5 mM EGTA containing LMKR and then centri-fuged. The final pellet was resuspended in 500 μl distilled water and kept at room temperature overnight. The entire suspension was then added to a scintillation cocktail (Fisher Scientific BP458-4), and its radioactiv-ity was measured by scintillation spectrometry. Background values were estimated in lysed tissue sections (200 μg) or synaptosomes (100 μg) soni-cated in LMKR and subtracted from readings on the unlysed tissue. The final data were expressed as mean percent ± SEM of stimulated versus basal readings in LMKR alone.
Immunohistochemical testsIn total, 33 antigens were studied with the antibodies shown in Supple-mental Table 6. The oligomeric Aβ antibodies NU1 and NU4 were sup-plied by W.L. Klein (Northwestern University, Chicago, Illinois, USA). In Western blots, the antibodies recognized only 1 major band (often only a single band) located at or near the predicted molecular mass of the tar-get antigens. Their specificity was confirmed by greatly diminished tissue immunoreactivity after preadsorption with the immunogen. In the case of antibodies to IRS-1 pS312, IRS-1 pS616, and IRS-1 pS636/639, such tests
showed that their tissue immunoreactivity was totally blocked by pread-sorption with 5× molar concentrations of phosphorylated immunogen, but not perceptively by the nonphosphorylated immunogen.
Quantitative immunohistochemistry. A protocol was used in which all sec-tions to be compared for a given antigen were reacted simultaneously with the same solutions for the same amount of time using a standard avidin-biotin-peroxidase method (170). See Supplemental Methods and Supple-mental Table 6 for details of the protocol and the epitope retrieval and signal amplification techniques used.
Image analysis. On each coverslipped slide, an investigator outlined in ink the region of interest (ROI), CA1, as defined by Lorente de Nó (171) and Amaral and Insausti (172), under a Reichert-Jung dissecting micro-scope. Using the same lighting conditions for all sections in a given IHC experiment, gray-scale photomicrographs at ×100 covering the ROI were taken on a Leitz DMRB microscope (Leica Microsystems) equipped with a Retiga Exi/QEi digital camera (QImaging) distinguishing 4,095 shades of gray and with a MAC 2000 motorized stage (Ludl Electronic Products) driven by the Turboscan feature of Image-Pro Plus software (Media Cyber-netics Inc.). That software was used to create composite images of the entire ROI in each section and to quantify relevant features of the images: (a) neuronal parameters (areas of cell nuclei and cell bodies), (b) Aβ load (percent area covered by Aβ plaques), (c) NFT density per mm2, (d) OD of immunoreactive neurons, and (e) immunoreactive neurons per mm2, with neuron defined as an immunoreactive cell larger than the maximal size of cell nuclei (70.4 μm2), as measured in hematoxylin-stained sections from our tissue samples. The large size of cells immunoreactive for the antigens studied identified them as neurons.
Statistics2-tailed Student’s t tests were used to assess between-group differences (N vs. AD) in the ex vivo stimulation experiments and in immunohistochemical tests on the UPenn cohort. ANOVAs were used to assess differences among N, MCI, and AD cases in immunohistochemical tests on the ROS cohort followed by post-hoc Tukey-Kramer honestly significant difference tests (173) to compare pairs of diagnostic groups. Since neuron loss in CA1 of AD cases varies, the reported densities of neurons with cytoplasmic levels for any given antigen were normalized to total neuron densities. Pearson r was used to quantify relationships between the density of cells with cytoplas-mic IRS-1 pS and potential causes of such phosphorylation. Mixed-model regression analyses were used to assess the association between measures of cognition and measures of insulin signaling molecules or neuropathology. Statistical analyses were performed using JMP software (version 7.0.2; SAS Institute). P values less than 0.05 were considered statistically significant.
Study approvalFor the human postmortem studies, informed consent was obtained for collection and use of clinical, psychometric, genetic, and postmortem data from all subjects of the present study or their next of kin in accordance with the Institutional Review Boards at the University of Pennsylvania and Rush University Medical Center. For rat studies, all procedures were reviewed and approved by the IACUC of City College of New York, where the animal facilities for CUNY Medical School are located.
AcknowledgmentsThis work was supported by grants from the Alzheimer’s Associa-tion (a T.L.L. Temple Foundation Discovery Award to S.E. Arnold and K. Talbot), from the National Institute on Aging (NIA) to the ROS (R01 AG15819) and the Alzheimer Disease Centers at the University of Pennsylvania (P30 AG10124) and Rush University (P30 AG10161), and from the Allen H. and Selma W. Berkman

research article
TheJournalofClinicalInvestigation http://www.jci.org Volume 122 Number 4 April 2012 ��
Charitable Trust to S.E. Arnold. We thank William L. Klein for the NU-1 and NU-4 antibodies to oligomeric Aβ. We are deeply indebted to all the patients contributing to this study, to the fami-lies supporting them, the volunteers in the Rush Religious Order Study, and the staff and residents engaged in subject assessment, autopsy, and brain banking at the Alzheimer’s Disease Centers of University of Pennsylvania and Rush University.
Received for publication July 11, 2011, and accepted in revised form February 16, 2012.
Address correspondence to: Konrad Talbot, Translational Research Laboratories, University of Pennsylvania, 125 South 31st Street, Philadelphia, Pennsylvania 19104-3403, USA. Phone: 215.589.2483; Fax: 215.573.2041; E-mail: [email protected].
1. Goldstein BJ. Insulin resistance as the core defect in type 2 diabetes mellitus. Am J Cardiol. 2002; 90(5A):3G–10G.
2. DeFronzo RA. Pathogenesis of type 2 diabetes mel-litus. Med Clin North Am. 2004;88(4):787–835.
3. Li L, Holscher C. Common pathological processes in Alzheimer disease and type 2 diabetes: a review. Brain Res Rev. 2007;56(2):384–402.
4. Zhao W-Q, Townsend M. Insulin resistance and amyloidogenesis as common molecular founda-tion for type 2 diabetes and Alzheimer’s disease. Biochim Biophys Acta. 2009;1792(5):482–496.
5. Biessels GJ, Staekenborg S, Brunner E, Brayne C, Scheltens P. Risk of dementia in diabetes mellitus: a systematic review. Lancet Neurol. 2006;5(1):64–74.
6. Ahtiluoto S, et al. Diabetes, Alzheimer disease, and vascular dementia, a population-based neuropatho-logic study. Neurology. 2010;75(13):1195–1202.
7. Profenno LA, Porsteinsson AP, Faraone SV. Meta-analysis of Alzheimer’s disease risk with obesity, diabetes, and related disorders. Biol Psychiatry. 2010; 67(6):505–512.
8. Ohara T, et al. Glucose tolerance status and risk of dementia in the community, the Hisayama study. Neurology. 2011;77(12):1126–1134.
9. Haan MN. Therapy insight: type 2 diabetes melli-tus and the risk of late-onset Alzheimer’s disease. Nat Clin Pract Neurol. 2006;2(3):159–166.
10. Shaw JE, Sicree R. Epidemiology of type 2 diabe-tes. In: Feinglos MN, Bethel MA, eds. Contemporary Endocrinology: Type 2 Diabetes Mellitus: An Evidence Based Approach to Practical Management. Totowa, New Jersey, USA: Humana Press; 2008:1–16.
11. Baker LD, Cross DJ, Minoshima S, Belongia D, Watson GS, Craft S. Insulin resistance and Alzheimer-like reductions in regional cerebral glucose metabolism for cognitively normal adults with prediabetes or early type 2 diabetes. Arch Neu-rol. 2011;68(1):51–57.
12. Correia SC, Santos RX, Perry G, Zhu X, Moreira PI, Smith MA. Insulin-resistant brain state: the cul-prit in sporadic Alzheimer’s disease? Ageing Res Rev. 2011;10(2):264–273.
13. Tan ZS, et al. Association of metabolic dysregula-tion with volumetric brain magnetic resonance imaging and cognitive markers of subclinical brain aging in middle-aged adults, the Framingham Off-spring Study. Diabetes Care. 2011;34(8):1766–1770.
14. Schrijvers EM, Witteman JC, Sijbrands EJ, Hofman A, Koudstaal PJ, Breteler MM. Insulin metabolism and the risk of Alzheimer disease: the Rotterdam Study. Neurology. 2010;75(22):1982–1987.
15. Janson J, Laedtke T, Parisi JE, O’Brien P, Petersen RC, Butler PC. Increased risk of type 2 diabetes in Alzheimer disease. Diabetes. 2004;53(2):474–481.
16. Ho L, et al. Diet-induced insulin resistance pro-motes amyloidosis in a transgenic mouse model of Alzheimer’s disease. FASEB J. 2004;18(7):902–904.
17. Mielke JG, et al. A biochemical and functional characterization of diet-induced brain insulin resis-tance. J Neurochem. 2005;93(6):1568–1578.
18. Pratchayasakul W, Kerdphoo S, Petsophonsakul P, Pongchaidecha A, Chattipakorn N, Chattipakorn SC. Effects of high–fat diet on insulin receptor func-tion in rat hippocampus and the level of neuronal corticosterone. Life Sci. 2011;88(13–14):619–627.
19. Matsuzaki T, et al. Insulin resistance is associ-ated with the pathology of Alzheimer disease: the
Hisayama study. Neurology. 2010;75(9):764–770. 20. Rasgon NL, et al. Insulin resistance and
hippocampal volume in women at risk for Alzheim-er disease. Neurobiol Aging. 2011;32(11):1942–1948.
21. Craft S. Insulin resistance syndrome and Alzheim-er’s disease: age- and obesity-related effects on memory, amyloid, and inflammation. Neurobiol Aging. 2005;26(suppl 1):65–69.
22. Cole AR, Astell A, Green C, Sutherland C. Molecu-lar connexions between dementia and diabetes. Neurosci Biobehav Rev. 2007;31(7):1046–1063.
23. Neumann KF, Rojo L, Navarrete LP, Farías G, Reyes P, Maccioni RB. Insulin resistance and Alzheimer’s disease: molecular links & clinical implications. Curr Alzheimer Res. 2008;5(5):438–447.
24. Sims-Robinson C, Kim B, Rosko A, Feldman EL. How does diabetes accelerate Alzheimer disease pathology? Nat Rev Neurol. 2010;6(10):551–559.
25. Cholerton B, Baker LD, Craft S. Insulin resis-tance and pathological brain ageing. Diabet Med. 2011;28(12):1463–1475.
26. Hoyer S. Is sporadic Alzheimer disease the brain type of non–insulin dependent diabetes mellitus? A challenging hypothesis. J Neural Transm. 1998; 105(4–5):415–422.
27. Rivera EJ, Goldin A, Fulmer N, Tavares R, Wands JR, de la Monte SM. Insulin and insulin-like growth factor expression and function deteriorate with progression of Alzheimer’s disease: link to brain reductions in acetylcholine. J Alzheimers Dis. 2005; 8(3):247–268.
28. Steen E, et al. Impaired insulin and insulin-like growth factor expression and signaling mecha-nisms in Alzheimer’s disease--is this type 3 diabe-tes? J Alzheimers Dis. 2005;7(1):63–80.
29. Talbot K, et al. O3-02-02: Expression of pIRS-1 (S312 and S616) is elevated in MCI and AD and cor-relates with cognitive impairment and neurofibril-lary pathology. Alzheimers Dement. 2006;2(3):S54.
30. Salkovic-Petrisic M, Hoyer S. Central insulin resis-tance as a trigger for sporadic Alzheimer-like pathol-ogy: an experimental approach. J Neural Transm Suppl. 2007;(72):217–233.
31. Zhao W-Q, et al. Amyloid beta oligomers induce impairment of neuronal insulin receptors. FASEB J. 2008;22(1):246–260.
32. de la Monte SM. Insulin resistance and Alzheimer’s disease. BMB Reports. 2009;42(8):475–481.
33. Moloney AM, Griffin RJ, Timmons S, O’Connor R, Ravid R, O’Neill C. Defects in IGF-1 receptor, insulin receptor and IRS-1/2 in Alzheimer’s disease indicate possible resistance to IGF-1 and insulin signalling. Neurobiol Aging. 2010;31(2):224–243.
34. Kuljiš RO, Salkovic-Petrišic M. Dementia, diabe-tes, Alzheimer’s disease, and insulin resistance in the brain: progress, dilemmas, new opportunities, and a hypothesis to tackle intersecting epidemics. J Alzheimers Dis. 2011;25(1):29–41.
35. Liu Y, Liu F, Grundke-Iqbal K, Gong C-X. Deficient brain insulin signalling pathway in Alzheimer’s dis-ease and diabetes. J Pathol. 2011;225(1):54–62.
36. Griffin RJ, et al. Activation of Akt/PKB, increased phosphorylation of Akt substrates and loss and altered distribution of Akt and PTEN are features of Alzheimer’s disease pathology. J Neurochem. 2005;93(1):105–117.
37. Ma QL, et al. β-amyloid oligomers induce phos-phorylation of tau and inactivation of insulin
receptor substrate via c-Jun N-terminal kinase signaling: suppression by omega-3 fatty acids and curcumin. J Neurosci. 2009;29(28):9078–9089.
38. Reger MA, et al. Intranasal insulin administra-tion dose-dependently modulates verbal memory and plasma amyloid-β in memory-impaired older adults. J Alzheimers Dis. 2008;13(3):323–331.
39. Craft S, et al. Intranasal insulin therapy for Alzheimer disease and amnestic mild cognitive impairment, a pilot clinical trial. Arch Neurol. 2012; 69(1):29–38.
40. Taniguchi CM, Emanuelli B, Kahn CR. Critical nodes in signalling pathways: insights into insulin action. Nat Rev Mol Cell Biol. 2006;7(2):85–96.
41. Sesti G. Pathophysiology of insulin resistance. Best Pract Res Clin Endocrinol Metab. 2006;20(4):665–679.
42. Boura-Halfon S, Zick Y. Phosphorylation of IRS proteins, insulin action, and insulin resistance. Am J Physiol Endocrinol Metab. 2009;296(4):E581–E591.
43. Fröjdö S, Vidal H, Pirola L. Alterations of insulin signaling in type 2 diabetes: a review of the cur-rent evidence from humans. Biochim Biophys Acta. 2009;1792(2):83–92.
44. Abdul-Ghani MA, DeFronzo RA. Pathogenesis of insulin resistance in skeletal muscle. J Biomed Bio-technol. 2010;2010:476279.
45. Hoehn KL, et al. IRS1-independent defects define major nodes of insulin resistance. Cell Metab. 2008;7(5):421–433.
46. Morino K, et al. Muscle-specific IRS-1 Ser → Ala transgenic mice are protected from fat-induced insulin resistance in skeletal muscle. Diabetes. 2008; 57(10):2644–2651.
47. Sun XJ, Liu F. Phosphorylation of IRS proteins: yin-yang regulation of insulin signaling. Vitam Horm. 2009;80:351–387.
48. Copps KD, Hancer NJ, Opare-Ado L, Qiu W, Walsh C, White MF. Irs1 serine 307 promotes insulin sen-sitivity in mice. Cell Metab. 2010;11(1):84–92.
49. Boura-Halfon S, Zick Y. Serine kinases of insulin receptor substrate proteins. Vitam Horm. 2009; 80:313–349.
50. Gual P, Le Marchand-Brustel Y, Tanti JF. Posi-tive and negative regulation of insulin signaling through IRS-1 phosphorylation. Biochimie. 2005; 87(1):99–109.
51. Tanti J-F, Jager J. Cellular mechanisms of insulin resistance: role of stress-regulated serine kinases and insulin receptor substrates (IRS) serine phosphory-lation. Curr Opin Pharmacol. 2009;9(6):753–762.
52. Pei JJ, et al. Role of protein kinase B in Alzheimer’s neurofibrillary pathology. Acta Neuropathol. 2003; 105(4):381–392.
53. Rickle A, Bogdanovic N, Volkman I, Winblad B, Ravid R, Cowburn RF. Akt activity in Alzheimer’s disease and other neurodegenerative disorders. Neuroreport. 2004;15(6):955–959.
54. Li X, Alafuzoff I, Soininen H, Winblad B, Pei JJ. Levels of mTOR and its downstream targets 4E-BP1, eEF2, and eEF2 kinase in relationships with tau in Alzheimer’s disease brain. FEBS J. 2005; 272(16):4211–4220.
55. Hooper C, Killick R, Lovestone S. The GSK3 hypoth-esis of Alzheimer’s disease. J Neurochem. 2008; 104(6):1433–1439.
56. Le Roith D. The insulin-like growth factor system. Exp Diabesity Res. 2003;4(4):205–212.
57. Entingh-Pearsall A, Kahn CR. Differential roles of

research article
�� TheJournalofClinicalInvestigation http://www.jci.org Volume 122 Number 4 April 2012
the insulin and insulin-like growth factor-I (IGF-I) receptors in response to insulin and IGF-I. J Biol Chem. 2004;279(36):38016–38024.
58. Denley A, et al. Differential activation of insulin receptor isoforms by insulin-like growth factors is determined by the C domain. Endocrinology. 2006; 147(2):1029–1036.
59. Denley A, et al. Differential activation of insulin receptor substrates 1 and 2 by insulin-like growth factor-activated insulin receptors. Mol Cell Biol. 2007; 27(10):3569–3577.
60. Herrmann M, et al. ELISA-quantification of phosphorylated tau protein in the Alzheimer’s dis-ease brain. Eur Neurol. 1999;42(4):205–210.
61. Thal DR, Rüb U, Orantes M, Braak H. Phases of Aβ-deposition in the human brain and its rel-evance for the development of AD. Neurology. 2002; 58(12):1791–1800.
62. Hashimoto M, Bogdanovic N, Volkmann I, Aoki M, Winblad B, Tjernberg LO. Analysis of microdis-sected human neurons by a sensitive ELISA reveals a correlation between elevated intracellular concen-trations of Aβ42 and Alzheimer’s disease neuropa-thology. Acta Neuropathol. 2010;119(5):543–554.
63. Braak H, Braak E. Neuropathological stageing of Alzheimer-related changes. Acta Neuropathol. 1991; 82(4):239–259.
64. Unger JW, Livingston JN, Moss AM. Insulin recep-tors in the central nervous system: localization, signalling mechanisms and functional aspects. Prog Neurobiol. 1991;36(5):343–362.
65. Kar S, Chabot J-G, Quirion R. Quantitative autora-diographic localization of [125I]insulin-like growth factor I, [125I]insulin-like growth factor II, and [125I]insulin receptor binding sites in developing and adult rat brain. J Comp Neurol. 1993;333(3):375–397.
66. El Messari S, Leloup C, Quignon M, Brisorgueil MJ, Penicaud L, Arluison M. Immunocytochemical localization of the insulin-responsive glucose trans-porter 4 (Glut4) in the rat central nervous system. J Comp Neurol. 1998;399(4):492–512.
67. El Messari S, Ait-Ikhlef A, Ambroise DH, Penicaud L, Arluison M. Expression of insulin-responsive glucose transporter GLUT4 mRNA in the rat brain and spinal cord: an in situ hybridization study. J Chem Neuroanat. 2002;24(4):225–242.
68. Apelt J, Melhorn G, Schliebs R. Insulin-sensitive GLUT4 glucose transporters are colocalized with GLUT3-expressing cells and demonstrate a chemi-cally distinct neuron-specific localization in rat brain. J Neurosci Res. 1999;57(5):693–705.
69. Choeiri C, Staines W, Messier C. Immunohisto-chemical localization and quantification of glu-cose transporters in the mouse brain. NeuroScience. 2002;111(1):19–34.
70. McEwen BS, Reagan LP. Glucose transporter expression in the central nervous system: relation-ship to synaptic function. Eur J Pharmacol. 2004; 490(1–3):13–24.
71. Dickerson BC, Sperling RA. Functional abnormali-ties of the medial temporal lobe memory system in mild cognitive impairment and Alzheimer’s dis-ease: insights from functional MRI studies. Neuro-psychologia. 2008;46(6):1624–1635.
72. Sarazin M, et al. The amnestic syndrome of hippocampal type in Alzheimer’s disease: an MRI study. J Alzheimers Dis. 2010;22(1):285–294.
73. Hahn C-G, et al. Altered neuregulin 1-erbB4 signal-ing contributes to NMDA receptor hypofunction in schizophrenia. Nat Med. 2006;12(7):824–828.
74. Wang HY, Stucky A, Liu J, Shen C, Trocme-Thibierge C, Morain P. Dissociating beta-amyloid from alpha 7 nicotinic acetylcholine receptor by a novel therapeutic agent, S 24795, normalizes alpha 7 nicotinic acetyl-choline and NMDA receptor function in Alzheimer’s disease brain. J Neurosci. 2009;29(35):10961–10973.
75. Verwer RWH, et al. Cells in human postmortem brain tissue slices remain alive for several weeks in
culture. FASEB J. 2002;16(1):54–60. 76. Le Roith D, et al. Insulin in brain and other extra-
pancreatic tissues of vertebrates and nonverte-brates. Adv Metab Disord. 1983;10:303–340.
77. Baskin DG, Figlewicz DP, Woods SC, Porte D Jr, Dorsa DM. Insulin in the brain. Ann Rev Physiol. 1987;49:335–347.
78. Yamaguchi F, et al. Insulin-like growth factor 1 (IGF-1) distribution in the tissue and extracellular compartment in different regions of rat brain. Brain Res. 1990;533(2):344–347.
79. Cheatham B, Kahn CR. Insulin action and the insulin signaling network. Endocr Rev. 1995;16(2):117–142.
80. Combettes-Souverain M, Isaad T. Molecular basis of insulin action. Diabetes Metab. 1998;24(6):477–489.
81. LeRoith D, Werner H, Beitner-Johnson D, Rob-erts CT Jr. Molecular and cellular aspects of the insulin-like growth factor I receptor. Endocr Rev. 1995;16(2):143–163.
82. Luo J, Field SJ, Lee JY, Engelman JA, Cantley LC. The p85 regulatory subunit of phosphoinositide 3-kinase down-regulates IRS-1 signaling via the for-mation of a sequestration complex. J Cell Biol. 2005; 170(3):455–464.
83. Ikegami Y, Inukai K, Awata T, Asano T, Katayama S. SH3 domain of the phosphatidylinositol 3-kinase regulatory subunit is responsible for the forma-tion of a sequestration complex with insulin recep-tor substrate-1. Biochem Biophys Res Commun. 2008; 365(3):433–438.
84. Folli F, Bonfanti L, Renard E, Kahn CR, Merighi A. Insulin receptor substrate-1 (IRS-1) distribution in the rat central nervous system. J Neurosci. 1994; 14(11 pt 1):6412–6422.
85. Van Hoesen GW, Hyman BT. Hippocampal forma-tion: anatomy and the patterns of pathology in Alzheimer’s disease. Prog Brain Res. 1990;83:445–457.
86. Arnold SE, Hyman BT, Flory J, Damasio AR, Van Hoesen GW. The topographical and neuroanatomi-cal distribution of neurofibrillary tangles and neu-ritic plaques in the cerebral cortex of patients with Alzheimer’s disease. Cereb Cortex. 1991;1(1):103–116.
87. Simón D, et al. Pharmacological inhibition of GSK-3 is not strictly correlated with a decrease in tyrosine phosphorylation of residues 216/279. J Neurosci Res. 2008;86(3):668–674.
88. Torres SH, De Sanctis JB, de L Briceño M, Hernán-dez N, Finol HJ. Inflammation and nitric oxide production in skeletal muscle of type 2 diabetic patients. J Endocrinol. 2004;181(3):419–427.
89. Hartley D, Cooper GM. Role of mTOR in the deg-radation of IRS-1: regulation of PP2A activity. J Cell Biochem. 2002;85(2):304–314.
90. Hallak H, Ramadan B, Rubin R. Tyrosine phos-phorylation of insulin receptor substrate-1 (IRS-1) by oxidant stress in cerebellar granule neurons: modulation by N-methyl-D-aspartate through cal-cineurin activity. J Neurochem. 2001;77(1):63–70.
91. Park CH, et al. Calcineurin mediates AKT dephos-phorylation in the ischemic rat retina. Brain Res. 2008;1234:148–157.
92. Salmeen A, Andersen JN, Myers MP, Tonks NK, Bar-ford D. Molecular basis for the dephosphorylation of the activation segment of the insulin receptor by protein tyrosine phosphatase 1B. Mol Cell. 2000; 6(6):1401–1412.
93. Mitchell AJ, Shiri-Feshki M. Rate of progression of mild cognitive impairment to dementia--meta-analysis of 41 robust inception cohort studies. Acta Psychiatr Scand. 2009;119(4):252–265.
94. Manning BD, Cantley LC. AKT/PKB signaling: nav-igating downstream. Cell. 2007;129(7):1261–1274.
95. Zaid H, Antonescu CN, Randhawa VK, Klip A. Insulin action on glucose transporters through molecular switches, tracks and tethers. Biochem J. 2008;413(2):201–215.
96. Garippa RJ, Johnson A, Park J, Petrush RL, McGraw TE. The carboxyl terminus of GLUT4 contains a
serine-leucine-leucine sequence that functions as a potent internalization motif in Chinese hamster ovary cells. J Biol Chem. 1996;271(34):20660–20668.
97. Tuong MDT, Brion F, Schwartz J-C. Stimulation of deoxy[3H]glucose uptake into slices from cerebral cortex elicited by excitatory amino acids. NeuroSci-ence. 1984;12(2):385–393.
98. Bak LK, Walls AB, Schousboe A, Ring A, Son-newald U, Waagepetersen HS. Neuronal glucose but not lactate utilization is positively correlated with NMDA-induced neurotransmission and fluc-tuations in cytosolic Ca2+ levels. J Neurochem. 2009; 109(suppl 1):87–93.
99. Uemura E, Greenlee HW. Insulin regulates neuronal glucose uptake by promoting translocation of glucose transporter GLUT3. Exp Neurol. 2006; 198(1):48–53.
100. Fernando RN, Albiston AL, Chai SY. The insulin-regulated aminopeptidase IRAP is colocalized with GLUT4 in the mouse hippocampus – potential role in modulation of glucose uptake in neurons? Eur J Neurosci. 2008;28(3):588–598.
101. Rother KI, Imai Y, Caruso M, Beguinot F, Formisa-no P, Accili D. Evidence that IRS-2 phosphorylation is required for insulin action action in hepatocytes. J Biol Chem. 1998;273(28):17491–17497.
102. Heidenreich KA, Zahniser NR, Berhanu P, Branden-burg D, Olefsky JM. Structural differences between insulin receptors in the brain and peripheral target tissues. J Biol Chem. 1983;258(14):8527–8530.
103. Gammeltoft S, Fehlmann M, Van Obberghen E. Insulin receptors in the mammalian central ner-vous system: binding characteristics and subunit structure. Biochimie. 1985;67(10–11):1147–1153.
104. Seino S, Bell GI. Alternative splicing of human insulin receptor messenger RNA. Biochem Biophys Res Commun. 1989;159(1):312–316.
105. Sonntag WE, Ramsey M, Carter CS. Growth hor-mone and insulin-like growth factor-1 (IGF-1) and their influence on cognitive aging. Ageing Res Rev. 2005;4(2):195–212.
106. Cheng CM, Reinhardt RR, Lee WH, Joncas G, Patel SC, Bondy CA. Insulin-like growth factor 1 regu-lates developing brain glucose metabolism. Proc Natl Acad Sci U S A. 2000;97(18):10236–10241.
107. Freude S, et al. Neuronal IGF-1 resistance reduces Abeta accumulation and protects against premature death in a model of Alzheimer’s disease. FASEB J. 2009;23(10):3315–3324.
108. Cohen E, et al. Reduced IGF-1 signaling delays age-associated proteotoxicity in mice. Cell. 2009; 139(6):1157–1169.
109. Kuo YM, et al. Water-soluble Abeta (N-40, N-42) oligomers in normal and Alzheimer disease brains. J Biol Chem. 1996;271(8):4077–4081.
110. Gong Y, et al. Alzheimer’s disease-affected brain: presence of oligomeric A beta ligands (ADDLs) sug-gests a molecular basis for reversible memory loss. Proc Natl Acad Sci U S A. 2003;100(18):10417–10422.
111. Pham E, et al. Progressive accumulation of amyloid-β oligomers in Alzheimer’s disease and in amyloid precursor protein transgenic mice is accompanied by selective alterations in synaptic scaffold pro-teins. FEBS J. 2010;277(14):3051–3067.
112. Demuro A, Mina E, Kayed R, Milton SC, Parker I, Glabe CG. Calcium dysregulation and membrane disruption as a ubiquitous neurotoxic mechanism of soluble amyloid oligomers. J Biol Chem. 2005; 280(17):17294–17300.
113. Zhao W-Q, et al. Brain insulin receptors and spatial memory. Correlated changes in gene expression, tyrosine phosphorylation, and signaling molecules in the hippocampus of water maze trained rats. J Biol Chem. 1999;274(49):34893–34902.
114. Alberdi E, et al. Amyloid b oligomers induce Ca2+ dysregulation and neuronal cell death through activation of iontotropic glutamate receptors. Cell Calcium. 2010;47(3):264–272.

research article
TheJournalofClinicalInvestigation http://www.jci.org Volume 122 Number 4 April 2012 ��
115. Perkinton MS, Ip JK, Wood GL, Crossthwaite AJ, Williams RJ. Phosphatidylinositol 3-kinase is a central mediator of NMDA receptor signalling to MAP kinase (Erk1/2), Akt/PKB and CREB in stria-tal neurones. J Neurochem. 2002;80(2):239–254.
116. Morisco C, et al. Akt mediates the cross-talk between beta-adrenergic and insulin receptors in neonatal cardiomyocytes. Circ Res. 2005;96(2):180–188.
117. Zhao W-Q, et al. Insulin receptor dysfunction impairs cellular clearance of neurotoxic oligomeric Aβ. J Biol Chem. 2009;284(28):18742–18753.
118. Shankar GM, et al. Amyloid-beta protein dimers isolated directly from Alzheimer’s brains impair synaptic plasticity and memory. Nat Med. 2008; 14(8):837–842.
119. Beeri MS, et al. Insulin in combination with other diabetes medication is associated with less Alzheim-er neuropathology. Neurology. 2008;71(10):750–757.
120. Gupta A, Bisht B, Dey CS. Peripheral insulin-sensi-tizer drug metformin ameliorates neuronal insulin resistance and Alzheimer’s-like changes. Neurophar-macology. 2011;60(6):910–920.
121. Gao H, et al. GLP-1 amplifies insulin signaling by up-regulation of IRbeta, IRS-1 and Glut4 in 3T3-L1 adipocytes. Endocrine. 2007;32(1):90–95.
122. Li Y, et al. GLP-1 receptor stimulation reduces amy-loid-β peptide accumulation and cytotoxicity in cellular and animal models of Alzheimer’s disease. J Alzheimers Dis. 2010;19(4):1205–1219.
123. Hölscher C. Diabetes as a risk factor for Alzheimer’s disease: insulin signaling impairment in the brain as an alternative model of Alzheimer’s disease. Bio-chem Soc Trans. 2011;39(4):891–897.
124. McClean PL, Parthsarathy V, Faivre E, Hölscher C. The diabetes drug liraglutide prevents degenerative processes in a mouse model of Alzheimer’s disease. J Neurosci. 2011;31(17):6587–6594.
125. Bomfim TR, et al. An anti-diabetes agent protects the mouse brain from defective insulin signaling caused by Alzheimer’s disease–associated Aβ oligo-mers. J Clin Invest. doi:10.1172/JCI57256.
126. Murakami K, et al. Insulin receptor mutation results in insulin resistance and hyperinsulinemia but does not exacerbate Alzheimer’s-like phenotypes in mice. Biochem Biophys Res Comm. 2011;409(1):34–39.
127. Henriksen EJ, Teachey MK. Short-term in vitro inhibition of glycogen synthase kinase 3 potentiates insulin signaling in type I skeletal muscle of Zucker diabetic fatty rats. Metabolism. 2007;56(7):931–938.
128. Mothe I, Van Obberghen E. Phosphorylation of insulin receptor substrate-1 on multiple serine residues, 612, 632, 662, and 731, modulates insulin action. J Biol Chem. 1996;271(19):11222–11227.
129. Chong YH, Shin YJ, Lee EO, Kayed R, Glabe CG, Tenner AJ. ERK1/2 activation mediates Aβ oligomer-induced neurotoxicity via caspase-3 activation and tau cleavage in rat organotypic hippocampal slice cultures. J Biol Chem. 2006;281(29):20315–20325.
130. Bhaskar K, Miller M, Chludzinski A, Herrup K, Zagorski M, Lamb BT. The PI3K-Akt-mTOR path-way regulates Aβ oligomer induced neuronal cell cycle events. Mol Neurodegener. 2009;4:14.
131. Miscia S, et al. Aβ1-42 stimulated T cells express P-PKC-δ and P-PKC-ζ in Alzheimer disease. Neurobiol Aging. 2009;30(3):394–406.
132. Radde R, et al. Aβ42-driven cerebral amyloidosis in transgenic mice reveals early and robust pathology. EMBO Rep. 2006;7(9):940–946.
133. Wang H-Y, et al. The diabetes drug liraglutide ameliorates insulin resistance in the hippocampal formation of Alzheimer’s disease (AD) cases. 2011 Neuroscience Meeting Planner. Washington, DC,
USA: Society for Neuroscience, 2011. 134. Zhande R, et al. Dephosphorylation by default,
a potential mechanism for regulation of insulin receptor substrate-1/2, Akt, and ERK1/2. J Biol Chem. 2006;281(51):39071–39080.
135. Hers I, et al. Reciprocal feedback regulation of insulin receptor and insulin receptor substrate tyrosine phos-phorylation by phosphoinositide 3-kinase in primary adipocytes. Biochem J. 2002;368(pt 3):875–884.
136. Yi Z, Luo M, Carroll CA, Weintraub ST, Mandarino LJ. Identification of phosphorylation sites in insu-lin receptor substrate-1 by hypothesis-driven high-performance liquid chromatography-electrospray ionization tandem mass spectrometry. Anal Chem. 2005;77(17):5693–5699.
137. Ryu BR, Ko HW, Jou I, Noh JS, Gwap BJ. Phos-phatidylinositol 3-kinase-mediated regulation of neuronal apoptosis and necrosis by insulin and IGF-1. J Neurobiol. 1999;39(4):536–546.
138. Tseng Y-H, Ueki K, Kriauciunas KM, Kahn CR. Differ-ential roles of insulin receptor substrates in the anti-apoptotic function of insulin-like growth factor-1 and insulin. J Biol Chem. 2002;277(35):31601–31611.
139. Picone P, et al. Insulin activated Akt rescues Aβ oxida-tive stress-induced cell death by orchestrating molec-ular trafficking. Aging Cell. 2011;10(5):832–843.
140. Nikoulina SE, Ciaraldi TP, Mudaliar S, Mohideen P, Carter L, Henry RR. Potential role of glycogen syn-thase kinase-3 in skeletal muscle insulin resistance of type 2 diabetes. Diabetes. 2000;49(2):263–271.
141. Larner AJ. The cerebellum in Alzheimer’s disease. Dement Geriatr Cogn Disord. 1997;8(4):203–209.
142. Ibberson M, Riederer BM, Uldry M, Guhl B, Roth J, Thorens B. Immunolocalization of GLUTX1 in the testis and to specific brain areas and vasopressin-con-taining neurons. Endocrinology. 2002;143(1):276–284.
143. Shin B-C, McKnight RA, Devaskar SU. Glucose trans-porter GLUT8 translocation in neurons is not insu-lin responsive. J Neurosci Res. 2004;75(6):835–844.
144. Piroli GG. Corticosterone impairs insulin-stimu-lated translocation of GLUT4 in the rat hippocam-pus. Neuroendocrinology. 2007;85(2):71–80.
145. Grillo CA, Piroli GG, Hendry RM, Reagan LP. Insu-lin-stimulated translocation of GLUT4 to the plas-ma membrane in rat hippocampus is PI3-kinase dependent. Brain Res. 2009;1296:35–45.
146. Bakirtzi K, et al. Cerebellar neurons possess a vesicu-lar compartment structurally and functionally simi-lar to Glut4-storage vesicles from peripheral insulin-sensitive tissues. J Neurosci. 2009;29(16):5193–5201.
147. Diamond I, Fishman RA. High affinity transport and phosphorylation of 2-deoxy-D-glucose in syn-aptosomes. J Neurochem. 1973;20(6):1533–1542.
148. Bhattacharyya MV, Brodsky JL. Characterization of the glucose transporter from rat brain synaptosomes. Biochem Biophys Res Commun. 1988;155(2):685–691.
149. Heidenreich KA, Gilmore PR, Garvey WT. Glucose transport in primary cultured neurons. J Neurosci Res. 1989;22(4):397–407.
150. Miichi Y, Sakurai T, Akisaki T, Yokono K. Effects of insulin and amyloid β1–42 oligomers on glucose incorporation and mitochondrial function in cul-tured rat hippocampal neurons. Geriatr Gerontol Int. 2011;11(4):517–524.
151. Klip A. The many ways to regulate glucose transport-er 4. Appl Physiol Nutr Metab. 2009;34(3):481–487.
152. Wijesekara N, Tung A, Thong F, Klip A. Muscle dell depolarization induces a gain in surface GLUT4 via reduced endocytosis independently of AMPK. Am J Physiol Endocrinol Metab. 2006;290(6):E1276–E1286.
153. Sacks DB, et al. Guidelines and recommendations for laboratory analysis in the diagnosis and management
of diabetes mellitus. Clin Chem. 2011;57(6): e1–e47. 154. Reaven G. The metabolic syndrome or the insulin
resistance syndrome? Different names, different concepts, and different goals. Endocrinol Metab Clin North Am. 2004;33(2):283–303.
155. Huang PL. A comprehensive definition for metabol-ic syndrome. Dis Model Mech. 2009;2(5–6):231–237.
156. Kuusisto J, et al. Association between features of the insulin resistance syndrome and Alzheimer’s disease independently of apolipoprotein E4 pheno-type: cros sectional population based study. BMJ. 1997;315(7115):1045–1049.
157. Abdul-Ghani MA, DeFronzo RA. Pathophysiology of prediabetes. Curr Diab Rep. 2009;9(3):193–199.
158. Cowie CC, et al. Full accounting of diabetes and pre-diabetes in the U.S. population in 1988-1994 and 2005-2006. Diabetes Care. 2009;32(2):287–294.
159. Qiu C, Kivipelto M, von Strauss E. Epidemiology of Alzheimer’s disease: occurrence, determinants, and strategies toward intervention. Dialogues Clin Neurosci. 2009;11(2):111–128.
160. García-Lara JM, Aguilar-Navarro S, Gutiérrez-Robledo LM, Avila-Funes JA. The metabolic syn-drome, diabetes, and Alzheimer’s disease. Rev Invest Clin. 2010;62(4):343–349.
161. Zhao WQ, Chen H, Quon M, Alkon DL. Insulin and the insulin receptor in experimental models of learning and memory. Eur J Pharmacol. 2004; 490(1–3):71–81.
162. van der Heide LP, Ramakers GMJ, Smidt MP. Insu-lin signaling in the central nervous system: learn-ing to survive. Prog Neurobiol. 2006;79(4):205–221.
163. Chiu S-L, Cline HT. Insulin receptor signaling in the development of neuronal structure and func-tion. Neural Dev. 2010;5:7.
164. Sperling RA, et al. Toward defining the preclini-cal stages of Alzheimer’s disease: recommenda-tions from the National Institute on Aging and the Alzheimer’s Association workgroup. Alzheimers Dement. 2011;7(3):280–292.
165. Łabuzek K, Suchy D, Gabryel B, Bielecka A, Liber S, Okopien B. Quantification of metformin by the HPLC method in brain regions, cerebrospinal fluid and plasma of rats treated with lipopolysaccharide. Pharmacol Rep. 2010;62(5):956–965.
166. Li L, et al. Exenatide prevents fat-induced insulin resis-tance and raises adiponectin expression and plasma levels. Diabetes Obes Metab. 2008;10(10):921–930.
167. Hölscher C. The role of GLP-1 in neuronal activity and neurodegeneration. Vitam Horm. 2010;84:331–354.
168. Hölscher C. Incretin analogues that have been developed to treat type 2 diabetes hold promise as a novel treatment strategy for Alzheimer’s disease. Recent Pat CNS Drug Discov. 2010;5(2):109–117.
169. Hamilton A, Patterson S, Porter D, Gault VA, Holscher C. Novel GLP-1 mimetics developed to treat type 2 diabetes promote progenitor cell proliferation in the brain. J Neurosci Res. 2011;89(4):481–489.
170. Talbot K, et al. Dysbindin-1 is reduced in intrin-sic, glutamatergic terminals of the hippocampal formation in schizophrenia. J Clin Invest. 2004; 113(9):1353–1363.
171. Lorente de Nò R. Studies on the structure of the cerebral cortex. II. Continuation of the study of the ammonic system. J Psychol Neurol. 1934;46:113–177.
172. Amaral DG, Insausti R. Hippocampal forma-tion. In: Paxinos G, ed.The Human Nervous System. 1st ed. San Diego, California, USA: Academic Press;1990:711–755.
173. Ramsey PH, Ramsey PP. Power of pairwise compar-isons in the equal variance and unequal sample size case. Br J Math Stat Psychol. 2008;61(pt 1):115–131.