instrumental neutron activation analysis of french geochemical reference samples
TRANSCRIPT

117
Instrumental NEutron Activation Analysis Of French G ~ o c hcmical REferEncE Samples
THEODORE 3. BORNHORST
Department of Geology, University of New Mexico Albuquerque, New Mexico 87131 U.S.A."
JOHN P. BALAGNA
University of California, Los Alamos Scientific Laboratory Los Alamos, New Mexico 87544 U.S.A.
Instrwnental neutron act ivat ion analytical data $017 e igh teen trace eZements (Ba, Co, C r , CS, Hf, Rb, Sb, :%, l'a, Th, La, Cc, Nd, Sm, Eu, Tb, Yb, Lu), ?Ja,t3 and Fe203 i n elcven French geoche- mical r e f e r e m e samples are presented and dis- cussed brief Zg.
French geochemical reference samples (GRS): Basalt BR, Granites, GA, GH and GS-N, Diorite DR-N, Bioti';e Mica-Fe, Phlogopite Mica-Mg, Feldspath FK-N, Glauconi te GI.-0, Serpentine UB-N and Disthene DT-N were analyzed for 20 major and trace elements by intrumental neutron activation analysis (INAA). INAA is a widely used method for trace elements, especially the rare earth elements ( R E E . ) . The INAA technique is described by Gordon et a1 . (1).
ANALYTICAL DETAILS
Between 96 and 110 mg of' powder was weighed into high purity polyethylene vials. These vials and a small plece of Cr wire (18 to 26 mg), used as a flux monitor, were placed into a larger polyethylene container to be irradiated. The irradiations (7 to 8 hours) were carried out in the Los Alamos Scientific Laboratory 8 MW Omega West Reactor thermal column at a neutron f l u x density of approximately 1 x 10¹³ n/cm2-sec. For y-spectrum measurements, a Ge (Li) detector with 110 cm3 active volume, 7.41 Kev resolution, 23.1% efficiency, and a peak to Compton ratio of 36.3:1 was used. The y spectra were directly transmitted to a minicomputer and evaluated for peak position and intensity. Nuclides and gamma-ray peaks used are listed in Table 1. Calibrations were carried out on a desk calcula- tor.
'Also: V i s i t i n p S t a f f Mevber, L o s Alanos Scientific Lahora to ry
Table 1. Nuc l i des and gamna-ray peaks o f elements determined
Element
Fe Na Ba co Cr cs Hf Rb Sb
sc l a l h La
Ce Nd Sm
Eu Tb Yb Lu
Nuclide Measured
Fes 24 Na
Bal 31 C060 Cr51 Csl 34 H f l " Rb86 Sbl 24
Tale'
La140
Ce14l Nd147 ~m' 53
EulS2 Tbl 6o YbI7'
sc46
Lu177
y-Ray Peak (kev)
1,100 1,369
496 1.332
321 795 483
1,078 1,691
891 1.221
31 1 1,596
146 531 103
1 . 4 m 87 9 284 2 08
CALIBRATIONS
U.S.G.S. geochemical reference samples, W - 1 , G-2, GSP-1, AVG-1, PCC-1, DTS-1 and BCR-1, were used as primary standards for calibration (2). The C s calibration included two Cs spiked DTS-1 samples. Calibration lines were obtained by linear least squares regression.
Table 2 lists the estimated precision and accuracy for the INAA data presented. These
Geostandards k m k t t s r , VoZ. 3, N o 2, Octohre 1979, p. 177 d 180
accuracy estimates are considered to be conserva- tive since by using a multi-standard calibration line one should get a better estimate of the true slope and intercept of the calibration line than an estimate based on few standards. Also, these accuracy estimates assume the primary standard values are correct. Accuracy of these calibration lines was checked in most cases by analyzing measured amounts of pure elements. In addition, Geological Survey of Japan GRS: JB-1 and JG-1 (3), and the new U.S.G.S. GRS: QLO-1, STM-1, SDC-1 and BHVO-1 (4) were used to check the validity of the accuracy estimates. In some cases the accuracy estimates change with concentration. The change in accuracy with concentration is probably gradual but due to the limited number of standards it is shown as a discrete value. The deviation of the primary standards upon replica- tion (precision) is generally smaller than the deviation about the calibration line (accuracy). The precision estimates assume the primary standards are homogenous, A l l replicate (two) determinations on the French samples fall within the precision estimates.
2240-
2080-
1920-
Table 2. P r e c i s i o n , accuracy, and minimum d e t e c - t i o n l i m i t es t ima tes f o r t h e I N A A d a t a presented. The p r e c i s i o n was es t ima ted f r o m t h e d e v i a t i o n o f t h e s tandards upon r e p l i c a t i o n . The accuracy was est imated frm t h e d e v i a t i o n o f t h e p r i m a r y s tan - da rds from t h e c a l i b r a t i o n l i n e
Fe203 ( t o t a l Fe)
k 2 0 Ba
GI
Cr
cs
H f
Rb
Sb
sc
Ta
Th
La
t e
Nd
sm Eu
Tb
Yb
LU
Prec is ion
9%
*l %
4%
3.3%
4% *15%
4% f5%
21 5%
2% *9%
,3%
dX *5%
~ 1 5 %
*2%
23%
&%
t 6 I
f7%
Minimum Accuracy Detec t ion L i m i t
9.5%
c0.5 w t . % 25%;>0.5wt .%?l . 5%
f 4% c500ppm YO%
2 5 % <2ppmY5%
4 5% >1 Z5pw 3%
YO% >15ppm4%
f 6%
* 6%
*lo%
i 7%
4 0%
f 2%
t 5%
2 5% c25ppmiZ54
20% >125ppni10:
f 3%
* 5 1
*15%
51 0%
$1 0%
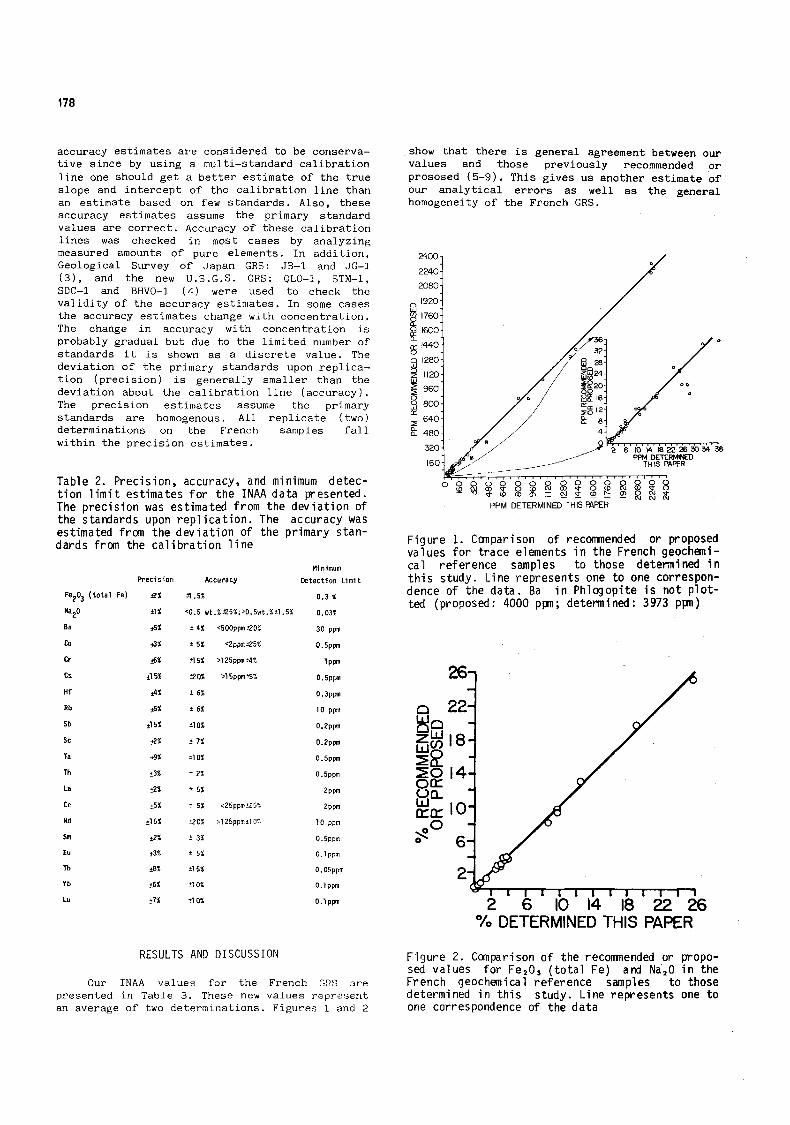
show that there is general agreement between our values and those previously recommended or prososed (5-9). This gives u s another estimate of our analytical errors as well as the general homogeneity of the French GRS.
/
F i g u r e 1. Canparison o f recommended o r proposed va lues f o r t r a c e elements i n t h e French g e o c h m i - c a l r e f e r e n c e samples t o those determined i n t h i s s tudy. L i n e r e p r e s e n t s one t o one correspon- dence o f t h e da ta . Ba i n P h l q o p i t e i s n o t p l o t - ted (proposed: 4000 ppn; determined: 3973 ppn)
26
22
18
14
10
6
2
2 6 10 14 18 22 26 O/o DETERMINED THIS PAPER
RESULTS AND DISCUSSION F i g u r e 2. Comparison o f t h e recornended o r propo- sed va lues f o r Fe,O, ( t o t a l Fe) and Na,O i n t h e
Our INAA values for the French GRR are French geochemical r e f e r e n c e samples t o those presented in Table 3 . These new values represent determined i n t h i s s tudy . L i n e r e p r e s e n t s one t o an average of two determinations. Figures 1 and 2 one correspondence o f t h e d a t a

Tab
le 3
. Ne
b: IN
AA d
ata
on s
elec
ted
maj
or
and
trac
e el
emen
ts i
n t
he
Fren
ch g
eoch
mic
al r
efer
ence
sam
ples
Ele
men
ts
Bas
alt
(wt.
%)
8R
Fe20
3 12
.58
(to
tal
Fe)
Na2
0
(ppm
)
Ba
co
Cr
cs
Hf
Rb
Sb
sc
Ta
Th
La
Ce
Nd
Sm
Eu
Tb
Yb
Lu
3.04
lo8
8
348 58.7
1.6
6.0
43
(0.2
22.7
5.
9 11
.1
86.3
15
1 84
12.7
3.
80
1.34
1.
86
0.25
Gra
nite
GA
2 .8
1
3.53
807 5.
3 10
.0
6.3
3.6
10.2
7.4
1.3
17.3
43.6
75
45
174 5.
9 1.
29
0.90
1.
72
0.32
Gra
nit
e
GH
1.38
3.80
(30 0.
9 4.
8 2.
2 6.
2
0.24
1 .
o 4.
8
38 3 9 1.
25.7
69
25
11
.2
0.14
1.
56
6.17
1.
12
Gra
nit
e
GS-N
3.72
3.72
1431
63
.1
60 4.9
6.7
0.25
7.
2 2.
7
188
41
81.9
13
4 49 8.3
1.71
0.
60
2.02
0.
24
Di o
ri te
OR- N
-9.6
8
2.95
461 38
.4
38 6.0
3.8
87 0.70
27
.6
0.9
4.6
20.7
59
21
5.4
1.52
1.
44
2.57
0.
39
Bio
tf te
25.2
0
0.30
(1 5
0 25.8
90
28.3
30
5
2247
0.40
14
.8
32.7
16
5
21 0
463
185
41.8
0.
80
2.41
1.
65
0.92
Phl
ogo
pi te
9.36
0.1
5
3973
27
.5
91
84
1370
0.5
0.40
1.
3 4.
6 0.
5
(2.0
(2
.0
C0.
5 <0
.1
<0.1
<lo
0.64
0.
70
Fel
dsp
ath
c0.3
FK-N
2.54
299 16
.2
4.1
6.4
0.3
0.20
91
1
C0.3
(0.5
0.
7
(2.0
<2
.0
(0.5
<
lo
0.41
0.
18
0.40
co
.1
G1 au
coni
te
19.1
5
GL-0
0.03
130
132 16
.0
4.5
1.2
0.46
26
0 8.3
10.5
4.
3
20.0
22
32
6.1
1.28
0.
62
0.73
0.
12
Ser
pent
ine
8.52
LIB-N
0.13
50
100.
9 22
85
18
10.3
13
13.1
<0
.5
1.1
(2 .O
(2.0
<10
(0.5
0.
15
<O. 0
5 co
.1
co.1
0.46
Dis
then
e
0.69
DT-N
0.04
111
235 15
.3
10.5
10.5
<
lo
0.35
2.
4 2.
7 12
.3
96.0
12
4 50 8.6
1.42
0.
64
0.42
0.
16
NOTE
: Le
ss t
han
repr
esen
ts t
he
app
roxi
mat
e m
inim
um d
ete
ctlo
n l
imit

180
Chondrite normalized REE plots (not shown here) reveal an overall smooth curve for the REE data, except Eu, which is typical of REE normalized distributions in geologic materials. Biotite and Granite GH have large negative Eu anomalies and Diorite DR-N and Granite GA have small negative Eu anomalies. These plots indicate that for some samples our Yb values are low.
Our data which do not agree .well with recommended or proposed values include: Co in Biotite Mica-Fe and Phlogopite Mica-Mg, Ba in Feldspath FK-N and Diorite DR-N and Cs, Hf and Ce in Biotite Mica-Fe. Our disparate values are all higher than the recommended or proposed values. Our apparent difficulty in analyzing the Biotite is due in part to difficulty in standardization for extreme concentrations. Preferred values for Biotite Mica-Fe are not as well established as they are for some of the other French GRS (9).
ACKNOWLEDI; EMENTS
We thank D.G. Brookins and E.E. Erb of the University of New Mexico for their helpful criticism of the manuscript. Bornhorst acknow- ledges financial support from National Science Foundation grant EAR 77-24501 and New Mexico Energy and Mineral Department grants EMB 77-3104 EMD 78-2123 (W.E. Elston, Principal Investi- gator). Instrumental equipment was furnished by LASL, Group CNC-11.
RESUME
Les donnees analyt iques obtenues par ac t i va - t i o n neutronique instrumentale pour d i x hu i t & \ b e n t s en traces (Ba, Coy C r y Cs, Hf , Rb, Sb, Sc, Ta, Thy La, Ce, Nd, Sm, Eu, Tb, Yb,.Lu), Na10 e t Fe,O, dans onze echan t i l l ons g6ochimiques de reference f ranca is sont presentees e t brievement canmentees.
REFERENCES
(1) G.E. Gordon, K. Randle, G.G. Goles. J.B. Corliss, M.H. Beeson and S.S. Oxley (1968) Instrumental activation analysis of standard rocks with high resolution gamma ray detectors, Geochimica et Cosmochimica Acta, 32: 369-396.
( 2 ) F.J. Flanagan (1976) 1972 Compilation of data on USGS standards, U.S. Geolo- gical Survey Professional Paper 840: 131-183.
(3) A. Ando, H. Kurasawa, T. Ohmori and E. Takeda (1971) 1971 Compilation of data on rock standards JG-1 and JB-1 issued from the Geological Survey of Japan, Geochemical Journal, 5: 151-164.
( 4 ) F.J. Flanagan, ed. (1976) Descriptions and analyses of eight new USGS rock stan- dards, U.S . Geological Survey Professional Paper 840: 1-192.
( 5 ) H. de la Roche et K. Govindaraju (1973) Rapport (1972) sur quatre standards geochimiques de 1'Association Nationale de l a Recherche Technique: Diorite DR-N, Serpentine UB-N, Bauxite BX-N et Disthene DT-N, Bulletin de la SocietE! FranCaise de CBramique, 100: 49-75.
( 6 ) H. de la Roche et K. Govindaraju (1976) Nouveaux Ctalons geochimiques: Granite GS-N et Feldspath FK-N, Analusis, 4: 347-372.
( 7 ) H. de la Roche, K. Govindaraju et G.S. Odin (1976) Preparation d'un Ctalon analytique de glauconite, Analu- sis, 4 : 385-397.
(8) K. Govindaraju et H. de la Roche (1977) Rapport (1966-1976) sur les ClCments en traces-dans trois roches standards g€ochimiques du CRPG: Basalte BR et Granite GA et GH. Geostandards Newsletter, 1: 67-100.
(9) K. Govindaraju (1979) Rapport (1968-1378) on two mica reference samples: Biotite Mica-Fe and Phlogopite Mica-Mg, Geostandards Newsletter, 3: 3-24.