instrumental neutron activation analysis …nautarch.tamu.edu/theses/for sam/johnson-ma2006.pdf ·...
TRANSCRIPT
INSTRUMENTAL NEUTRON ACTIVATION ANALYSIS (INAA)
CHARACTERIZATION OF PRE-CONTACT BASALT QUARRIES ON
THE AMERICAN SAMOAN ISLAND OF TUTUILA
A Thesis
by
PHILLIP RAY JOHNSON II
Submitted to the Office of Graduate Studies of Texas A&M University
in partial fulfillment of the requirements for the degree of
MASTER OF ARTS
December 2005
Major Subject: Anthropology
INSTRUMENTAL NEUTRON ACTIVATION ANALYSIS (INAA)
CHARACTERIZATION OF PRE-CONTACT BASALT QUARRIES ON
THE AMERICAN SAMOAN ISLAND OF TUTUILA
A Thesis
by
PHILLIP RAY JOHNSON II
Submitted to the Office of Graduate Studies of Texas A&M University
in partial fulfillment of the requirements for the degree of
MASTER OF ARTS
Approved by: Chair of Committee, Frederic B. Pearl Committee Members, Suzanne L. Eckert William D. James Head of Department, David L. Carlson
December 2005
Major Subject: Anthropology

iii
ABSTRACT
Instrumental Neutron Activation Analysis (INAA)
Characterization of Pre-contact Basalt Quarries on
the American Samoan Island of Tutuila. (December 2005)
Phillip Ray Johnson II, B.A., University of Kentucky
Chair of Advisory Committee: Dr. Frederic B. Pearl
This thesis presents a material-centered characterization of 120 geologic samples
from four fine-grained basalt quarries on the Samoan Island of Tutuila. Previous
unsuccessful attempts at definitive Tutuilan quarry differentiation have utilized x-ray
fluorescence (XRF). In this study, clear differentiation of each analyzed quarry was
achieved using instrumental neutron activation analysis (INAA). Biplots of canonical
discriminant function scores for the INAA data illustrate clear separation based on the
variation in chemical composition between each quarry. The samples analyzed not only
define quarry separation, but also provide the "core group" for a preliminary baseline
necessary for future artifact-centered provenance studies. Inclusion of these "core group"
samples in the baseline was confirmed by stepwise discriminant analysis. These findings
suggest the ability to determine quarry of origin on the island of Tutuila, which can
elucidate the importance of individual Tutuilan quarries in the export and exchange of
fine-grained basalts.

iv
ACKNOWLEDGEMENTS
I would first like to thank the wonderful people of American Samoa whose
friendship and hospitality have been the most rewarding aspect of the thesis process.
So many people on Tutuila helped with this project along the way. To everyone who has
touched this project from its inception to its completion, I would like to say fa'afetai tele.
Thank you to the villages of Alega, Alofau, Leone, and Tula. Very special thanks are in
order for Mr. David Herdrich, territorial archaeologist, deputy SHPO, and all around nice
guy. Without his moral support, enthusiasm, and expertise this project could have never
been successful.
I also owe an enormous amount of gratitude to Dr. John Enright and Ms. June
Auelua of the American Samoa Historic Preservation Office, whose generous funding
and logistical support made this project possible. For their wonderful hospitality, great
thanks go to the ASPA archaeology team: David Addison, Tim Currey, Natasha Lynch,
Jackie Maisano and Siaki Vaueli. Thanks guys for the nicest digs I've ever had on the
island, Thanksgiving dinner fa'a Samoa, and the scariest movie of all time. Thank you to
NPS archaeologist Ms. Epi Suafoa and her husband John for their assistance and, most
importantly, their friendship. Great thanks go to Tisa and Candyman for the fantastic
umu dinner and allowing me in their "backyard".
I would also like to thank my committee chair, Dr. Pearl, and my committee
members, Dr. Eckert and Dr. James. I could not have survived without their guidance
and support. Thanks to Michael Raulerson for working so hard to make sure all of my
samples saw their way to the reactor. I have a tremendous amount of gratitude for the

v
encouragement from my cohort at Texas A&M. Special thanks to Ms. Kristine Nicole
Ferre for the wonderful illustration of basalt tools on page 5.
Last and most certainly never least, I need to thank my parents and my girlfriend
Holly for their love, patience and support. Throughout this entire process they have kept
me confident, sane and happy. I love you all very much.

vi
TABLE OF CONTENTS
Page ABSTRACT ............................................................ . iii ACKNOWLEDGEMENTS .............................................. iv TABLE OF CONTENTS ................................................ vi LIST OF FIGURES ...................................................... viii LIST OF TABLES ....................................................... ix CHAPTER I INTRODUCTION ....................................... 1
Project and Goals ................................. 1 Basalt Tools in Polynesian Prehistory ............. 4 Types of Provenance Studies in Polynesia ......... 6 II RESEARCH AREA ...................................... 9 Geography ........................................ 9 Geology ........................................... 12 Tutuilan Quarries .................................. 15 Summary .......................................... 22 III PREVIOUS RESEARCH ................................. 23 Samoan Archaeology .............................. 23 Samoan Provenance Studies ....................... 24 Tutuilan Geochemical Characterization Studies..... 28 Summary .......................................... 39

vii
CHAPTER Page IV METHODS ................................................. 40
Introduction ......................................... 40 Sample Selection .................................... 41 Sample Processing .................................. 46 Instrumental Neutron Activation Analysis (INAA)... 48 Statistical Methodology ............................. 52 V RESULTS .................................................. 58 Project .............................................. 58 Results .............................................. 58 VI CONCLUSION AND DISCUSSION ....................... 71 Factors for Success .................................. 73 Caveats ............................................. 75 Future Research ..................................... 75 Conclusion .......................................... 78 REFERENCES CITED..................................................... 79 APPENDIX ................................................................ 86 VITA ...................................................................... 102

viii
LIST OF FIGURES Figure Page 1 The Polynesian triangle ............................................. 2 2 Basalt adze and flake from Tutuila, American Samoa ................ 5 3 The major islands of Samoa ......................................... 11 4 Fiji, Samoa, and Tonga ............................................. 13 5 Tutuilan volcanic provinces as described by Stearns (1944)
and MacDougall (1985) ............................................. 15 6 Biplot of CDA scores one and two for INAA data ................... 63 7 Biplot of first two PCA scores for INAA data ....................... 69
ix
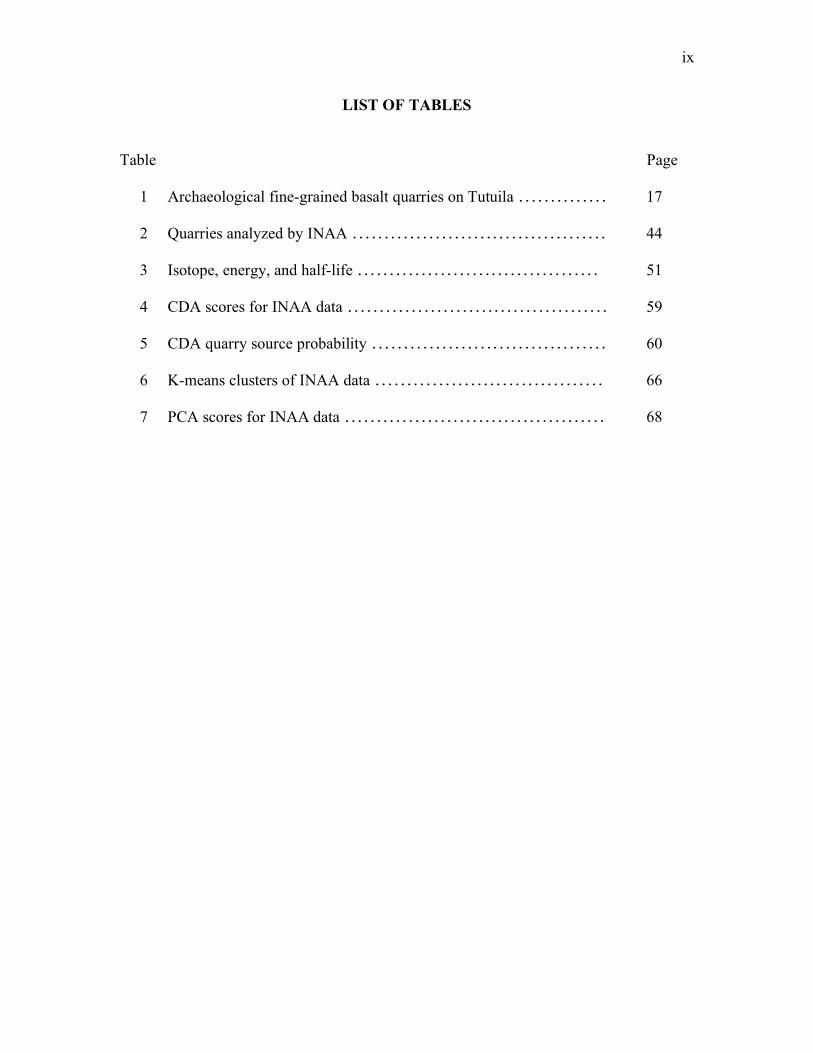
LIST OF TABLES Table Page 1 Archaeological fine-grained basalt quarries on Tutuila .............. 17 2 Quarries analyzed by INAA ........................................ 44 3 Isotope, energy, and half-life ...................................... 51 4 CDA scores for INAA data ......................................... 59 5 CDA quarry source probability ..................................... 60 6 K-means clusters of INAA data .................................... 66 7 PCA scores for INAA data ......................................... 68

1
CHAPTER I
INTRODUCTION Project and Goals
This project attempts to distinguish between individual fine-grained basalt
quarries on the Samoan island of Tutuila utilizing geochemical characterization. It is
designed to differentiate Tutuilan basalt-quarries based on chemical composition. The
key objective of this research is to establish the intraisland source variation of four
Tutuilan basalt quarries, providing a preliminary baseline for future artifact-centered
endeavors. Prior to definition of Tutuilan quarry variability, artifacts cannot be
confidently sourced to their quarry of origin. This analysis of Tutuilan basalt samples
definitively differentiated the four quarries included, creating a baseline or “core group”
of samples for future artifact-centered provenance studies. The definitive
characterization of these four quarries creates the foundation for confident provenance
studies on the fine-grained basalt artifacts of Tutuila.
The archipelagos of Polynesia (Figure 1) stretch great distances across the
Pacific. Some islands are isolated by hundreds of kilometers of open water, but
Polynesian ocean voyaging tradition allowed for continued contact and societal
interaction based on interisland trade networks (Davidson 1977; Kaeppler 1978).
_____________ This thesis follows the style of American Antiquity.

2
Figure 1. The Polynesian triangle.
Certain Polynesian societies may have heavily relied on this interaction to augment the
marginal environments they inhabited and subsequently abandoned before European
contact (Weisler 1997, 2002, 2003b). Considering the rapid displacement of lithic
industries by European introduced metal implements and the subsequent loss of
knowledge of stone tool trade, basalt provenance studies potentially offer the best
evidence for continued Polynesian seafaring and the complex socioeconomic
machinations of interisland contact and exchange.
There are three objectives inherent in the successful completion of this project.
Initially, the analysis must determine whether geochemical variation in Tutuilan basalts

3
is detectable with INAA. Second, any detected variation must be sufficient to
distinguish intra-island quarries. Third, and finally, if the first two objectives are met, I
will have established a preliminary baseline data of Tutuilan quarry variation.
Successful completion of these objectives creates the foundation for Tutuilan
artifact-centered provenance studies. Without properly established quarry variation,
individual artifacts cannot be confidently assigned a source of origin. With the continued
progress of chemical characterization in Polynesia (Weisler 2002, 2003a) and the
complexity of questions centered on Samoan involvement in Polynesian basalt trade
networks (Best et al. 1992), this level of analysis stands to be a valuable and necessary
contribution to Polynesian archaeological research.
Church (1994) describes two major types of lithic provenance studies, artifact-
centered and material-centered. Artifact-centered studies attempt to source artifacts to
their source. Material-centered studies are focused on source material and are designed
toward gathering baseline information, or estimating the mean and spatial distribution of
the geological variability. Material-centered research is the initial comprehensive
approach that allows further elaboration and progressive provenance analysis. A
material-centered analysis is the proper initial method for determining source variation,
and definitive characterization of source variation is a necessity for successful artifact-
centered analysis. The research reported herein is material centered by design, and the
necessary first step towards properly defining the variation of Tutuilan basalt quarries.
This project is the next step necessary for comprehensive basalt artifact provenance
studies in Samoa. I examine whether or not individual basalt quarries on the Samoan

4
Island of Tutuila can be identified and separated by discrete elemental signatures derived
through geochemical characterization. The research was designed to address the
problems associated with the characterization of multiple intraisland quarries.
Basalt Tools in Polynesian Prehistory
Lithic tools are the most robust and enduring cultural component of the
Polynesian archaeological record. However the Pacific islands that comprise Polynesia
lack a variety of high quality lithic sources for tool making. Although some obsidian,
volcanic glass and other tool quality materials are intermittently available, fine-grained
basalt is the best material found throughout the Polynesian expanse. Polynesians were
left with no choice but to develop a flaked and ground stone tool technology utilizing
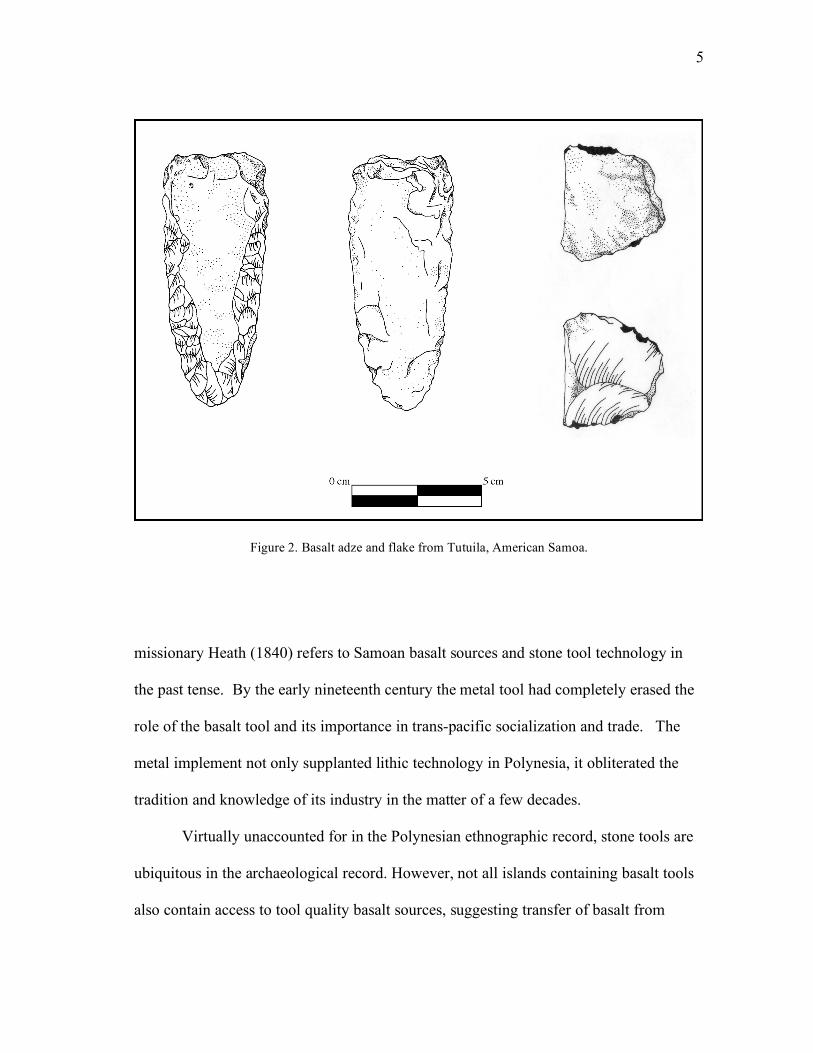
this basalt. The basalt adze is the archetypal Polynesian artifact, and it has been
recovered and described throughout the island Pacific (Figure 2). The adze may be the
most celebrated artifact form in Polynesia, but bifacial and unifacial basalt flaked tools
also pervade the prehistoric record.
Prior to the European introduction of metal in the late eighteenth century, the
basalt tool was the pith of Polynesian technology. Such tools were an integral
component of pre-contact society. They facilitated daily life. Tasks such as butchery,
woodcarving, and even felling trees depended on various basalt tools. Although its
physical form continues to litter Polynesian shores, the stone tool was so rapidly
displaced by the introduction of metal implements that even the earliest European
accounts and ethnographic sources are practically void of any notion of basalt industry.
A mere two generations after European contact and subsequent introduction of metal, the
5
Figure 2. Basalt adze and flake from Tutuila, American Samoa.
missionary Heath (1840) refers to Samoan basalt sources and stone tool technology in
the past tense. By the early nineteenth century the metal tool had completely erased the
role of the basalt tool and its importance in trans-pacific socialization and trade. The
metal implement not only supplanted lithic technology in Polynesia, it obliterated the
tradition and knowledge of its industry in the matter of a few decades.
Virtually unaccounted for in the Polynesian ethnographic record, stone tools are
ubiquitous in the archaeological record. However, not all islands containing basalt tools
also contain access to tool quality basalt sources, suggesting transfer of basalt from

6
another island. This apparent transfer of material across the Pacific presents a distinct
and meaningful opportunity for provenance study. Provenance studies, which trace the
origin and dispersal of material culture, have aided archaeologists in the research of
prehistoric economy and interaction. The most successfully and often utilized artifacts in
provenance studies have been obsidian tools and ceramic vessels. However, considering
the paucity of obsidian and the early prehistoric abandonment of pottery, basalt tools
present the best vehicle for comprehensive provenance studies in Polynesia.
Types of Provenance Studies in Polynesia
Provenance studies in Polynesia have generally consisted of three categories of
analysis: macroscopic observation, thin-section description and geochemistry (Weisler
1993b). Macroscopic observation of ceramic or lithic material culture is the most
established order of determining geographic or geological affiliation. However, such
methods have proven limited when applied in Polynesia (Weisler 1993b). Although the
method serves as a first step in the winnowing process, ultimately it is incapable of
defining the origin of the source material, and cannot alone definitively account for the
possible transfer of raw material (Weisler 1993b).
Petrographic analysis of lithic material has been used by geologists (and
subsequently adopted by archaeologists) to source lithic material via microscopic
analysis of thin section slides. Petrographic characterization defines lithic material by
analyzing its mineral composition. Slides of the unprovenanced material are examined
for characteristic geologic attributes that can be traced to previously identified sources.
7
This method has been utilized on both ceramic and lithic materials in Polynesia (e.g.
Cleghorn et al. 1985, Dickinson and Shutler 1979, Weisler 1990).
Although this method can be most effective in eliminating possible sources of
lithic material, issues of subjectivity have often plagued its reproducibility (Weisler
1993b, Weisler & Kirch 1996). Subsequently these methodological discrepancies and
advances in technology have limited the practice of petrographically sourcing
Polynesian stone tools (Best et al. 1992; Weisler 1993a, 1993b). It must be noted that
these authors are not suggesting the demise of petrographic analysis in provenance
studies, only a preference to geochemical characterization when working with
Polynesian fine-grained basalts. It must also be noted that petrographic differentiation
may be the only method available in cases of geochemical homogeneity (Rice 1987).
The third and most popular method of provenance study is geochemical
characterization. Geochemical characterization defines lithic material by analyzing its
chemical composition. It is considered the most powerful, precise and reliable method
of sourcing lithic material, and provides the most quantitative and readily reproducible
results (Weisler & Kirch 1996). Weisler (1993a: 185) argues for the value of
geochemical characterization over petrography because,
(1) results are reproducible; (2) instrument operating conditions can be reported
in full facilitating comparison databases; (3) identification of elements is not
subject to human error as with thin-section descriptions; (4) elemental
abundances can be reported with precision and accuracy values for specimens
and standards; and (5) geochemical sampling locales on specimens more closely

8
represent the population rather than thin-sections which are limited by two-
dimensional surfaces.
These attributes have established geochemical characterization as the touchstone of
Polynesian provenance, and a multitude of such research over the past two decades has
provided discrete evidence for the transfer of basalts throughout the Pacific (e.g. Allen
and Johnson 1997; Best et al. 1992; Weisler 1993a, 1997, 1998, 2002).
Chemical characterization was chosen for this project as the best method of
differentiating Tutuilan fine-grained basalt quarries. The technique of chemical
characterization chosen for this analysis was instrumental neutron activation analysis
(INAA). INAA was chosen for several reasons but first and foremost for its sensitivity.
The sensitivity of INAA allows for greater characterization than techniques previously
employed in Tutuilan basalt quarry characterization. This sensitivity played an integral
role in the successful differentiation of each quarry analyzed, as it detected ample
variation between the samples to provide distinct differentiation among the represented
quarries.
9
CHAPTER II
RESEARCH AREA
Geography
American Samoa lies at the heart of the “Polynesian Triangle,” over 250 islands
that stretch across an expanse of the Pacific ranging from the Hawaiian Islands in the
extreme north, Rapa Nui (Easter Island) to the east, and the islands of New Zealand in
the southwest (Figure 1). Due to their significant isolation, the islands of Polynesia were
some of the last places on the planet to be inhabited by humans. It is a commonly held
belief that the Polynesian diaspora began with the colonization of the West Polynesian
islands of Samoa and Tonga around 3000 BP by the advancing Lapita culture (Kirch and
Green 2001).
The Lapita culture is named for the Lapita site on the island of New Caledonia,
one of the first sites that yielded the cultures indicative ornately decorated pottery.
Lapita culture spread across East Melanesia and into Western Polynesia some 3500-3000
BP (Kirch 1997). Sites in Samoa and Tonga attributed to Lapita settlements are the
oldest sites recorded for all of Polynesia (Burley 1998; Kirch 1997). Although Lapita
archaeological sites are undoubtedly the earliest in Polynesia, the attribution of Lapita’s
role in the development of an Ancestral Polynesian Society is a highly contested subject
in Pacific archaeology (see Kirch 1984, 1997; Kirch and Green 2001; Smith 2002).
Regardless of their origin, Polynesian navigators advanced across the Pacific. After
disembarking from somewhere in Samoa or Tonga these prehistoric seafarers settled

10
East Polynesian archipelagos, but ultimately advanced north into the Hawaiian Islands
and southwest into New Zealand (Kirch 1984). Since initial European contact, the
existence of Polynesian societies on lost and isolated shores has captured the
imagination of the western academic community. The seemingly impossible task of
prehistoric Pacific island colonization has inspired archaeological investigation into the
foundation and propagation of Polynesian island societies, investigations often focused
on the Western Polynesian island chain of Samoa (Green and Davidson 1969,1974;
Kirch and Hunt 1993).
The Samoan archipelago is located at the western fringes of the Polynesian
triangle at approximately 14° South Latitude and 170° West Longitude. Just east of the
International Dateline, its nine islands of varying size extend approximately 370 km
southeasterly. Although islands have been divided politically for over 100 years (Figure
3), the independent nation of Samoa and the unincorporated United States territory of
American Samoa have strong cultural ties. Apolima, Manono, Savaii, and Upolu
comprise the independent nation of Samoa (previously referred to as Western Samoa).
These four major islands represent the majority of Samoan land area. The remaining
islands of Manua (Ofu, Olosega, and Tau), the Rose atoll and Tutuila compose
American Samoa. Swains Island, some of 320 km northwest of Tutuila, is politically an
entity of the territory of U.S. Samoa, however it is not a geologic affiliate of the Samoan
archipelago.
Tutuila lies in the center of Samoan island chain (Figure 3). The largest of the
American Samoan islands and third largest of the archipelago, Tutuila is a long narrow

11
Figure 3. The major islands of Samoa.
landform, bolstered by a spine of steep ridges that supports numerous radiating ridges
reaching north and south towards the sea. Taking the shape of a tilted hourglass, its
overall length is approximately 31.0 km, but its width varies greatly from nearly 9.8 km
at its widest western reaches, to only 1.6 km at its narrowest margins in Pago harbor.
The landscape is deeply dissected and marked by broad amphitheater-headed valleys.
Severe erosion has carved the jagged landscape from the once gently sloping mountains
formed by shield volcanoes. A precipitously abrupt montane backdrop contrasts narrow
coastal flats. The steep mountain ridges of inland Tutuila are remnants of the long
extinct volcanoes that thrust the island into existence (Stearns 1944). The tallest point
on the mountainous island is Matafao Peak at approximately 653 m asl. The only
substantial uninterrupted portion of the island is the broad level Tafuna plain. This area
of geologically recent origin on the southwestern flank of the island was formed in the
Holocene by the post-erosional Leone volcanism.
12
Geology
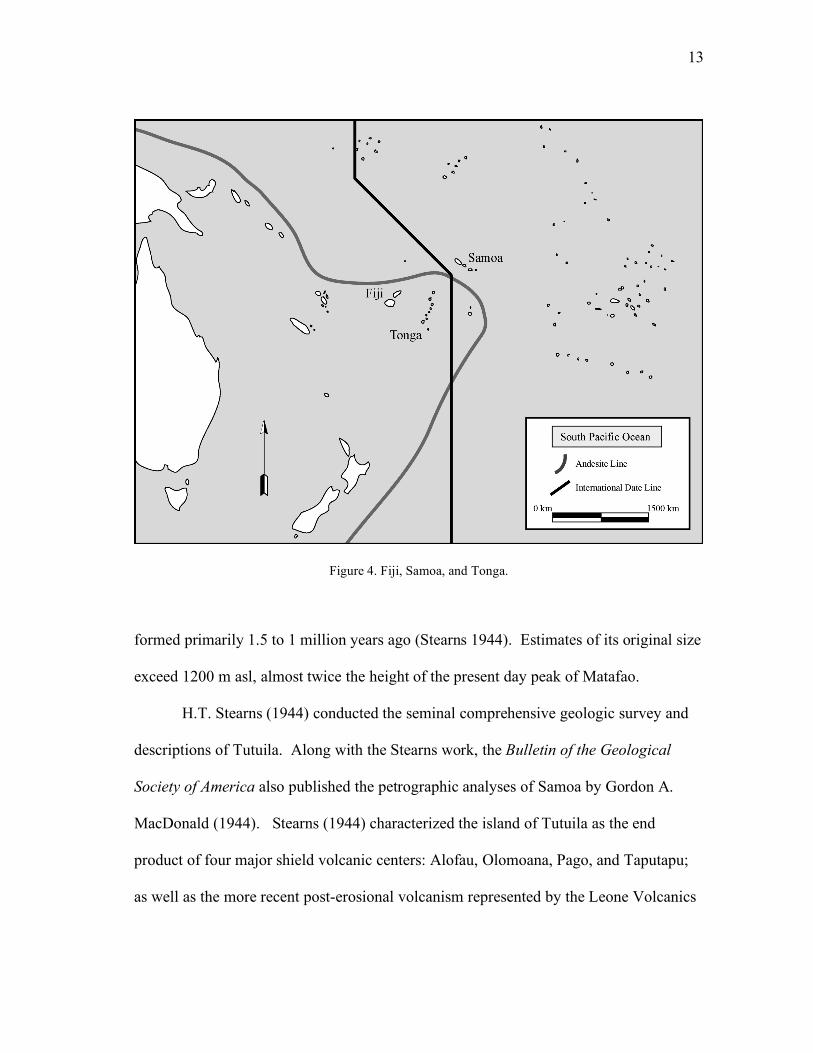
The Samoan archipelago lies east of the andesite line (Figure 4). The andesite
line is a petrographic boundary that splits the South Pacific into separate geologic
divisions. The extrusive rocks found on volcanic islands to either side of the boundary
are comprised of distinctly separate igneous composition. The volcanic islands to the
east or Pacific side of the island (this includes Samoa and the majority of Polynesian
islands) are composed of basalt. The volcanic islands to the west of the line (this
includes Tonga and Niue) are all of andesitic composition. This demarcation in
petrographic composition is extremely significant in differentiation of lithic artifacts in
the Fiji, Samoa, Tonga interaction sphere.
The Samoan archipelago is a series of oceanic basalt shield volcanoes that trend
easterly (MacDougall 1985). The shield-building lavas are mostly alkalic olivine basalts
and hawaiities that produce fine-grained basalt for lithic manufacture (MacDonald
1968). Samoan shield building volcanism began several million years ago, and ceased
around 1 mya. Post erosional volcanism trends against the shield activity, substantially
impacting the western islands, especially Savaii (MacDougall 1985; Natland 1980). The
western Samoan islands are the oldest and Manua the youngest, although possible
rejuvenation of volcanism on Savaii gives the island a deceivingly younger appearance
(McDougall 1985; Natland 1980). This more recent volcanism has left much of the
shield material inaccessible. Conversely, access to the fine-grained shield material of
Tutuila is not seriously impacted by post-erosional flows. Tutuila represents the
subaerial remainder of a highly eroded Pleistocene volcanic construct that
13
Figure 4. Fiji, Samoa, and Tonga.
formed primarily 1.5 to 1 million years ago (Stearns 1944). Estimates of its original size
exceed 1200 m asl, almost twice the height of the present day peak of Matafao.
H.T. Stearns (1944) conducted the seminal comprehensive geologic survey and
descriptions of Tutuila. Along with the Stearns work, the Bulletin of the Geological
Society of America also published the petrographic analyses of Samoa by Gordon A.
MacDonald (1944). Stearns (1944) characterized the island of Tutuila as the end
product of four major shield volcanic centers: Alofau, Olomoana, Pago, and Taputapu;
as well as the more recent post-erosional volcanism represented by the Leone Volcanics

14
(Figure 5). He proposed that while major shield-building episodes were essentially
geologically synchronous, the Olomoana Volcanics were older than Taputapu (Stearns
1944).
Although Stearns’s (1944) original study remains a comprehensive analysis of
Tutuilan geology, his shield-building chronology has been disputed by more recent
interpretations. Natland (1980) proposed that the shield building of Tutuila trended east,
with the Taputapu volcanics being the oldest and Olomoana the youngest. In 1985, Ian
MacDougall conducted Potassium-argon dating that furthered the argument over the
sequence of the island’s geologic development. The results of this geochemical dating
showed contemporaneous shield-building activity of Pago, Olomoana and Taputapu, and
that Olomoana is slightly older than Taputapu (MacDougall 1985). Although the
MacDougall (1985) dating supports Stearns’ (1944) chronology, it disputes the presence
of five distinct volcanic provinces. MacDougall (1985) argues that the Alofau volcanics
are not a discrete shield episode, but in fact the “eastern flank” of the central Pago
volcano. For the purpose of this project the Alofau volcanics are not considered a
distinct volcanic episode, and in accordance to MacDougall (1985) are included in the
Pago volcanic province (Figure 5).
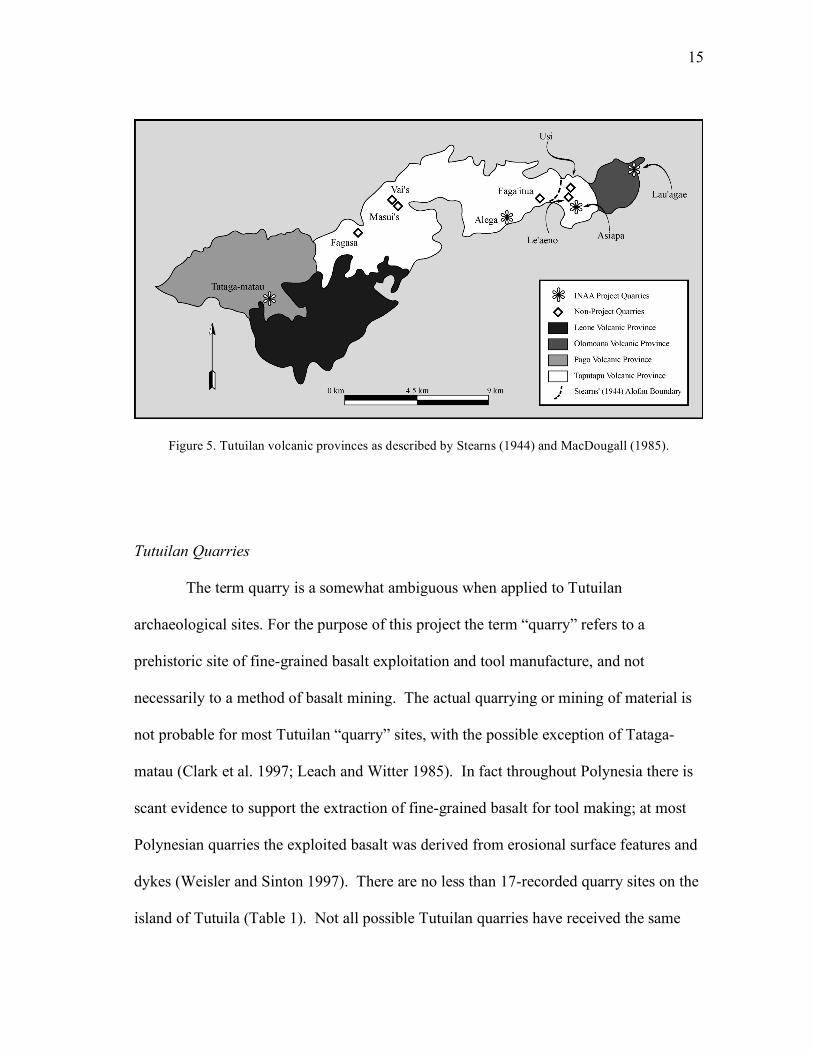
15
Figure 5. Tutuilan volcanic provinces as described by Stearns (1944) and MacDougall (1985).
Tutuilan Quarries
The term quarry is a somewhat ambiguous when applied to Tutuilan
archaeological sites. For the purpose of this project the term “quarry” refers to a
prehistoric site of fine-grained basalt exploitation and tool manufacture, and not
necessarily to a method of basalt mining. The actual quarrying or mining of material is
not probable for most Tutuilan “quarry” sites, with the possible exception of Tataga-
matau (Clark et al. 1997; Leach and Witter 1985). In fact throughout Polynesia there is
scant evidence to support the extraction of fine-grained basalt for tool making; at most
Polynesian quarries the exploited basalt was derived from erosional surface features and
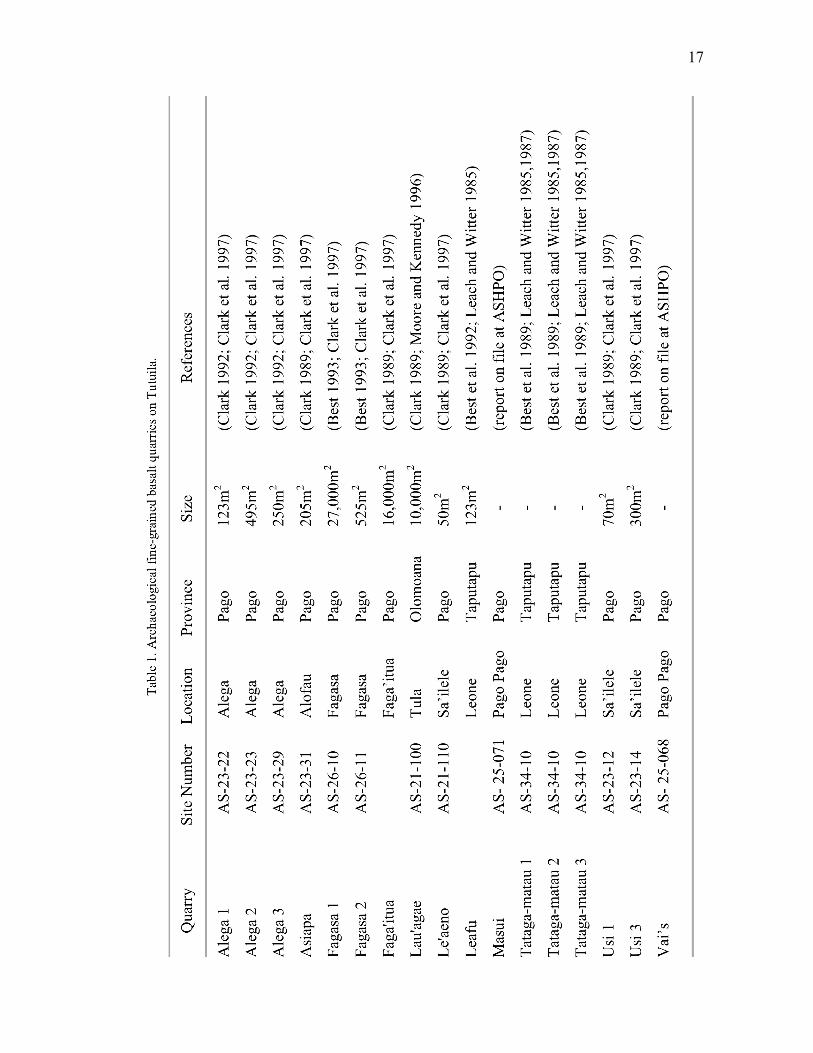
dykes (Weisler and Sinton 1997). There are no less than 17-recorded quarry sites on the
island of Tutuila (Table 1). Not all possible Tutuilan quarries have received the same
16
level of scrutiny; some have only been briefly documented (e.g. Clark 1989), while
others have undergone more detailed discussions (e.g. Best et al. 1989; Brophy 1986;
Clark 1992; Leach and Witter 1985, 1987, 1990; Moore and Kennedy 1996). The
following is a brief description of the reported quarry sites on Tutuila (Table 1).
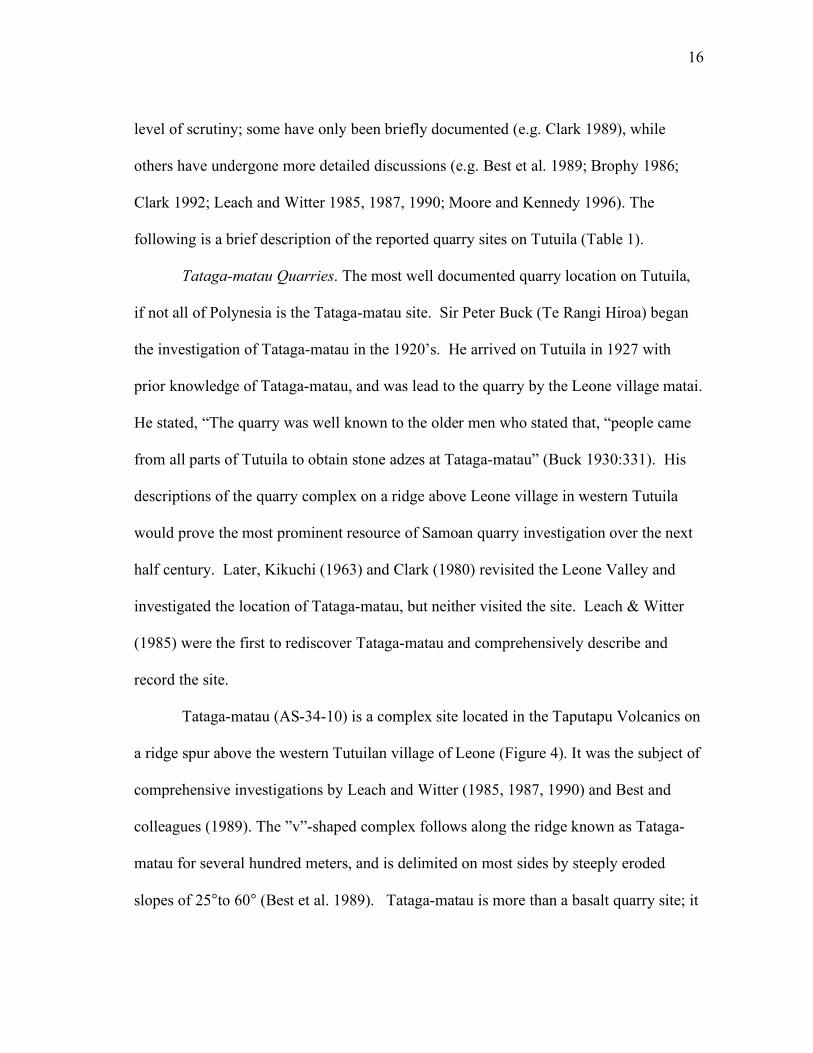
Tataga-matau Quarries. The most well documented quarry location on Tutuila,
if not all of Polynesia is the Tataga-matau site. Sir Peter Buck (Te Rangi Hiroa) began
the investigation of Tataga-matau in the 1920’s. He arrived on Tutuila in 1927 with
prior knowledge of Tataga-matau, and was lead to the quarry by the Leone village matai.
He stated, “The quarry was well known to the older men who stated that, “people came
from all parts of Tutuila to obtain stone adzes at Tataga-matau” (Buck 1930:331). His
descriptions of the quarry complex on a ridge above Leone village in western Tutuila
would prove the most prominent resource of Samoan quarry investigation over the next
half century. Later, Kikuchi (1963) and Clark (1980) revisited the Leone Valley and
investigated the location of Tataga-matau, but neither visited the site. Leach & Witter
(1985) were the first to rediscover Tataga-matau and comprehensively describe and
record the site.
Tataga-matau (AS-34-10) is a complex site located in the Taputapu Volcanics on
a ridge spur above the western Tutuilan village of Leone (Figure 4). It was the subject of
comprehensive investigations by Leach and Witter (1985, 1987, 1990) and Best and
colleagues (1989). The ”v”-shaped complex follows along the ridge known as Tataga-
matau for several hundred meters, and is delimited on most sides by steeply eroded
slopes of 25°to 60° (Best et al. 1989). Tataga-matau is more than a basalt quarry site; it
17

18
is a complex system of cultural landscape modification. Best and colleagues (1989)
describe 13 different types of features at Tataga-matau including but not limited to:
terraces, pits (defined both as quarrying and defensive), defensive fortifications, mounds
(including star-mounds or tia ave, pigeon snaring mounds), three separate lithic quarry
sites, and lithic manufacture areas.
Best and colleagues (1992) identify several distinct basalt quarry localities within
the Tataga-matau area that likely comprise the Tataga-matau intra-site variability. They
refer to this area as a greater “Leone quarry complex” (Best et al. 1992:50). The
complex includes the three quarrying areas identified by Best and colleagues (1989) as
well as the nearby Leafu quarry subsource situated below the Tataga-matau complex.
Samples from the complex were included in this study. Limited access to
characterization for this project precluded proper definition of intra-complex variation.
With this in mind, it was decided that samples would be collected in order to define a
single quarry area. To this end, samples were collected only from Tataga-matau Quarry
Area 1.
Alega Quarries. The valley of Alega on the southeast coast contains what
remains of several medium sized quarry areas among the Pago Volcanics (Figure 4). In
1992, Clark surveyed the area during an impact assessment for the proposal of a modern
basalt quarry in the valley, and reported three quarries on the northern slopes of the
valley: Alega 1 (AS-23-22), Alega 2 (AS-23-22), and Alega 3 (AS-23-29). The quarry
sites begin at approximately 40 m asl, and continue upslope 10-30 m (Clark 1992).
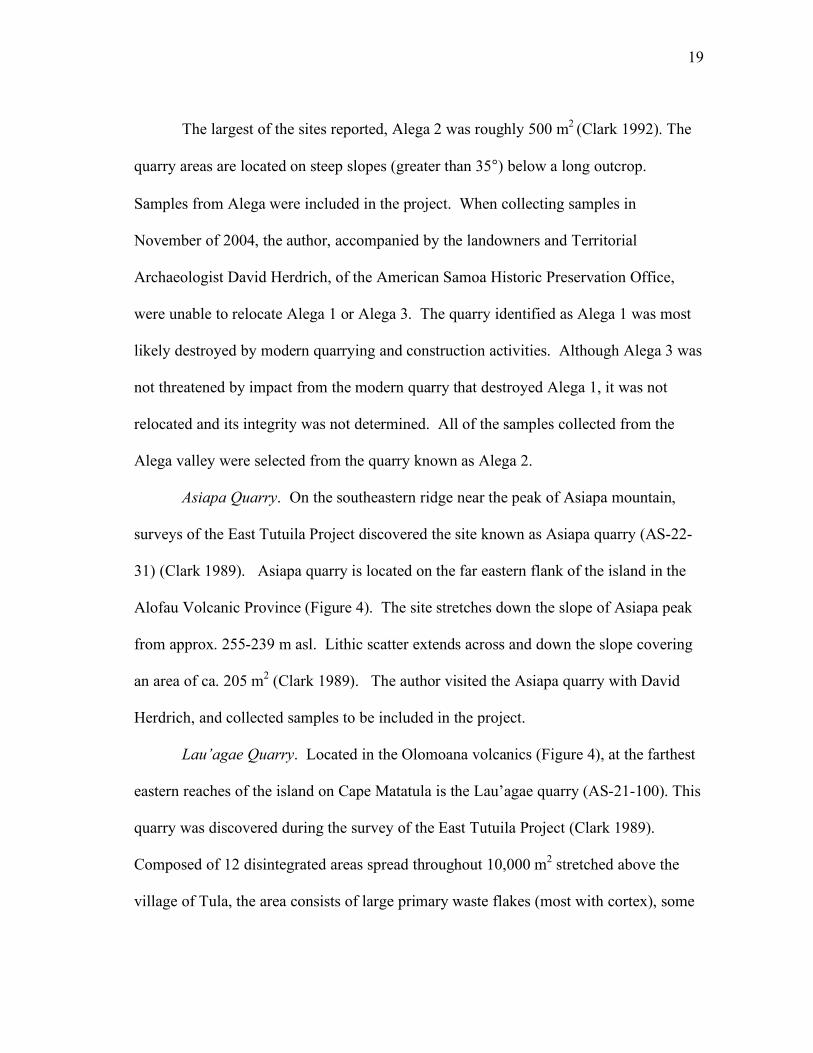
19
The largest of the sites reported, Alega 2 was roughly 500 m2 (Clark 1992). The
quarry areas are located on steep slopes (greater than 35°) below a long outcrop.
Samples from Alega were included in the project. When collecting samples in
November of 2004, the author, accompanied by the landowners and Territorial
Archaeologist David Herdrich, of the American Samoa Historic Preservation Office,
were unable to relocate Alega 1 or Alega 3. The quarry identified as Alega 1 was most
likely destroyed by modern quarrying and construction activities. Although Alega 3 was
not threatened by impact from the modern quarry that destroyed Alega 1, it was not
relocated and its integrity was not determined. All of the samples collected from the
Alega valley were selected from the quarry known as Alega 2.
Asiapa Quarry. On the southeastern ridge near the peak of Asiapa mountain,
surveys of the East Tutuila Project discovered the site known as Asiapa quarry (AS-22-
31) (Clark 1989). Asiapa quarry is located on the far eastern flank of the island in the
Alofau Volcanic Province (Figure 4). The site stretches down the slope of Asiapa peak
from approx. 255-239 m asl. Lithic scatter extends across and down the slope covering
an area of ca. 205 m2 (Clark 1989). The author visited the Asiapa quarry with David
Herdrich, and collected samples to be included in the project.
Lau’agae Quarry. Located in the Olomoana volcanics (Figure 4), at the farthest
eastern reaches of the island on Cape Matatula is the Lau’agae quarry (AS-21-100). This
quarry was discovered during the survey of the East Tutuila Project (Clark 1989).
Composed of 12 disintegrated areas spread throughout 10,000 m2 stretched above the
village of Tula, the area consists of large primary waste flakes (most with cortex), some
20
preforms and a few hammerstones (Moore and Kennedy 1996). The lithic debris covers
the area in a dense mat, however, no finished tools have been observed. Smaller
debitage concentrations indicative of refined shaping are also absent. A number of
WWII fortifications have impacted the site. The most obvious impact to the site
integrity is a large concrete bunker that is built directly into the uppermost area of the
quarry. However, the quarry extends down slope and much of it remains in good
condition. Samples were collected from across the Lau’agae quarry to be included in
this project.
Faga’itua Quarry. The site is located on the Palapala ridge approximately 400 m
above the village of Faga’itua (Figure 4), in the Pago Volcanic Province (Clark et al.
1997). The quarry was first discovered in 1995 after archaeologists followed a
substantial basalt flake and tool scatter from Faga’itua. Upon inspection the site proved
one of the largest basalt exploitation sites on the island. The site has yet to be fully
sampled, surveyed or recorded, but preliminary estimates place its overall size over
10,000 m2 (Clark et al. 1997). This quarry was not included in the project.
Fagasa Quarries. Perhaps better referred to as a complex of industrial basalt
manufacture, the Fagasa quarries are located in the Pago volcanic province on the
western slopes of Fagasa Bay (Figure 4). The Fagasa complex (AS-26-10, AS-26-11) is
also located in the Pago volcanics. Though the Fagasa quarries are not well
documented, it is a substantial series of sites consisting of multiple quarry and
manufacturing areas, grinding stones, lithic scatters, terraces, and pits that cover an
21
mpressive 27,000 m2 of upland valley floor and ridges (Best 1993; Clark et al. 1997).
No samples from Fagasa were collected for this project.
Le’aeno Quarry. Nested in the crown of several peaks, the Le’aeno quarry
complex (AS-21-110) is in the center of the eastern mountains in the Pago volcanic
province (Figure 4). The quarry locus is on the slope of Sua ridge and is flanked by
defensive fortifications in the surrounding peaks (Clark et al. 1997). Although the area
is extensive and complex, the quarrying activity represented is nominal and limited to a
small portion of the site roughly 50 m2 (Clark et al. 1997). Le’aeno samples were not
collected.
Usi Quarries. North of the Le’aeno quarry lie two small quarries along Usi ridge
(Figure 4). The two Usi quarries are larger than the neighboring Le’aeno quarry. Usi 1
(AS-23-12) is approximately 70 m2, while Usi 2 (AS-23-14) covers a portion of the ridge
and slope comprising nearly 300 m2 (Clark et al. 1997). Neither of the two Usi quarries
was sampled for inclusion in this project.
Other Quarry Sites and Possible Quarry Areas. Recently archaeologists from
the American Samoa Power Authority archaeology division have located two small
quarries above the village of Pago Pago (Figure 4). The quarries were referred to as
Masui’s quarry (AS-25-071) and Vai’s quarry (AS-25-068). There is a small possible
quarry locus near Faga’itua that is named Leutele quarry (AS-23-041). Ayres and Eisler
(1987) also make the case for the possibility of quarrying activity in the Maloata valley,
based on the high frequency of basalt tool material recovered during investigation.
Several other sites throughout the island have been suspected of containing quarries, due
22
to the appearance of grinding stones in streambeds, and tool forms in stream washes (e.g.
above Nu’u’uli and Auto villages) (Clark et al. 1997). However, there has been little
survey in the uplands since the late 1980’s and early 1990s, and much of the area
thought to have the highest potential to contain quarries has yet to be surveyed.
Summary
The unique geological and archaeological setting of Tutuila presents a
challenging test for artifact provenance research. The basalt quarries of Tutuila create a
compelling paradox; in that the close proximity of multiple quarry sites not only presents
challenges to the viability of artifact provenance, but ignites significant questions of
economy, industry, and interaction that can only be answered through definitive artifact
provenance. The lineage of Samoan geological and archaeological research provides the
answers to successful characterization of these quarries, and the eventuality of artifact
provenance. The geological background for this project was discussed previously; the
following chapter elucidates the foundation of archaeological research that lead to this
project.

23
CHAPTER III
PREVIOUS RESEARCH
Samoan Archaeology
Archaeological investigations of Samoa began in the early twentieth century.
The first work was mostly survey. In the 1920’s the Bishop Museum undertook
investigations of the Samoan archipelago. The earliest structured archaeological
fieldwork in Samoa was focused on the islands of Western Samoa. Golson (1957 and
1969) guided the first methodological Samoan excavations, on the island of Upolu.
Other early Samoan archaeology included Kikuchi (1963), and the seminal work of
Green and Davidson (1969, 1974). The Green and Davidson work on Savaii and Upolu
created the foundation for all future work in Samoa. Jesse Jennings continued research
in Western Samoa in the 1970’s (Jennings et al. 1976, Jennings and Holmer 1980). In
the late 1970’s and 1980’s fieldwork in Samoa shifted decidedly to the eastern islands of
American Samoa (especially Tutuila). A major impetus for this shift was the
establishment of the American Samoa Historic Preservation Office, and a growing need
for Section 106 mandated cultural resource management. The influx of federally
mandated archaeology created projects on Tutuila, as well as the Manuan islands of Ofu,
Olosega and Tau.
Although a great deal of archaeological investigation has been accomplished on
Tutuila in the last two decades, limited assessment of montane archaeology has been
undertaken. The overwhelming majority of that research was conducted on the coastal
24
plains, and inland valleys. This is most often due to the search for earliest Polynesian
settlements, and possible Lapita sites. Also, difficult accessibility presented by the
often exceedingly inhospitable terrain of upland Tutuila deters federally funded
infrastructure and leads to the lack of government-sponsored projects in the mountains.
The investigations of Best et al. (1989), Clark (1989, 1992), Clark and Herdrich (1993),
Frost (1979), Herdrich (1991), Leach and Witter (1985), Moore and Kennedy (1996) and
Pearl (2005) represent the bulk of upland archaeological investigation on Tutuila. These
upland projects also provide the majority of data on Tutuilan quarry sites, because those
quarries are all located on ride tops and mountain slopes. Archaeological investigations
of quarries conducted by Best and colleagues (1989), Brophy (1986), and Leach and
Witter (1985) were the first comprehensive archaeological evaluations of Tutuilan basalt
exploitation, and provided the foundation for questions of provenance.
Samoan Provenance Studies
Chemical characterization of Polynesian lithic material began with investigation
of volcanic glass (Smith et al. 1979). In the 1980’s Simon Best (1984, 1989) integrated
chemical characterization into the analysis of Polynesian basalts. Samoan basalt
quarrying inspired some of the earliest efforts in Polynesian geochemical
characterization (e.g. Best et al. 1992; Weisler 1993a). The preliminary success of these
efforts encouraged a wave of new research throughout Polynesia (e.g. Clark et al. 1997;
Parker and Sheppard 1997; Sheppard et al. 1997; Weisler 1993a, 1997, 1998; Weisler
and Kirch 1996; Weisler and Woodhead 1995, Weisler et al. 1994). The analytical

25
methods utilized and discussed in these studies include but are not limited to; x-ray
fluorescence (XRF), instrumental neutron activation analysis, and Pb isotope analysis.
X-ray fluorescence was the chemical characterization method most heavily
utilized in Polynesian sourcing analysis throughout the 90’s. This method gained favor
for four key reasons: XRF is less expensive, less time consuming, less destructive and
more readily available than most other methods of geochemical characterization. These
factors, combined with its successful characterization of Polynesian basalts throughout
the Pacific continue to make this method attractive to archaeologists. Throughout the
90’s the utilization of XRF flourished in Polynesian provenance studies; establishing
spheres of interaction by tracing the movement of fine-grained basalts (e.g. Allen and
Johnson 1997; Best et al. 1992; Clark et al. 1997; Parker & Sheppard 1997; Rolett et al.
1997; Sheppard et al. 1997; Weisler 1993a, 1998, 2004; Weisler and Kirch 1996;
Weisler et al. 1994).
Some of these XRF provenance studies proposed the interarchipelago transfer of
Tutuilan basalt. Allen and Johnson (1997) suspected provenance of Samoan style adzes
from the Cooks to uncharacterized quarries on Tutuila. Best et al. (1992) displayed a
geochemical affiliation between Samoan style adzes recovered in Fiji and quarry source
material from Tataga-matau. Other projects sought to characterize the variability of
individual basalt quarries in an effort to document the spatial and temporal distribution
of quarry production via artifact provenance (e.g. Best et al. 1992; Weisler 2003a).
Although XRF has successfully characterized individual quarry sources and identified

26
interisland movement of Polynesian basalts, researchers have had more difficulty
differentiating between intra-island sources using that technique.
Tutuila presents a unique setting for archaeological investigation of prehistoric
basalt exploitation. Several factors have lead to the proposal of Tutuila as an area of
industrial basalt tool manufacture meant for interisland exchange: the abundance of
known quarry sites; The size and scope of several quarry complexes; and the association
of these quarries with large-scale assemblages of stone tool grinding dishes (fo’aga)
(Best et al. 1993; Clark et al. 1997). The largest, most well-studied, and celebrated
Samoan quarry, Tataga-matau, is situated on Tutuila (Best et al. 1989, 1992; Clark et al.
1997; Leach and Witter 1985,1987, 1990). Tutuila has long been thought of as a unique
source of fine-grained basalt that was desired throughout the Pacific for its high quality.
The missionary Heath (1840) noted in a communication to the weekly Honolulu paper
The Polynesian,
that it has been stated that the surface of this group is volcanic, so that the
geologist won’t find much variety. At Tutuila, however is found the hard stone
(Trap,) of which the Polynesian adzes and other tools were made previously to
the introduction of iron. At the other islands the stone is almost uniformly
porous of a dull black color.
Roger Green (1974) used this historical reference as well as the lack of identified basalt
quarries on the islands of Savaii and Upolu as evidence suggesting the infrequency of
Samoan fine-grained basalt exploitation.

27
Relative to other Polynesian islands, Tutuila contains an overwhelming wealth of
fine-grained basalt quarry sites. There are 17 recorded quarry sites on Tutuila, including
the major quarry complexes of Tataga-matau, Fagasa, and Faga’itua. These vast
complexes and concentrations of fo’aga have been interpreted as evidence of large-scale
pre-contact industrial basalt quarrying and tool manufacture (Clark et al. 1997; Leach
and Witter 1985). This industry was certainly too large for Tutuila and likely too large
for the entire Samoan archipelago, and probably was developed specifically for trade
throughout Polynesia (Best et al. 1992; Clark et al. 1997). This wealth of quarrying sites
in close proximity on Tutuila presents a challenging yet ideal opportunity to determine
the limitations of characterizing individual Polynesian quarry sites.
The geochemical methods employed to date have succeeded in determining the
archipelago or island of origin for Samoan basalts. This level of accuracy is more than
suitable for areas and islands with limited basalt resources (see Weisler 1993c), however
the Samoan archipelago and more specifically the island of Tutuila contain multiple
exploited sources. The unique circumstances of Tutuilan quarrying demands further
elucidation. Samoan basalt provenance studies would most benefit from definitive
quarry level identification of source material and artifacts. Several attempts to
provenance basalt tools to Tutuilan quarries (specifically Tataga-matau) have met
varying degrees of success (Best et al. 1992, Clark et al. 1997). However, no attempt, to
date, has definitively distinguished individual Tutuilan quarries.
In 1993, Marshall Weisler addressed the issue of appropriate scale of provenance
studies. He proposed a hierarchy of “geological and artifactual” sampling units
28
appropriate for answering questions of provenance, the more specific the question the
more precise the sampling unit (Weisler 1993c: 63). One of the most specific targets of
the past decade was sourcing an artifact to the individual quarry of its origin. In
response to this quest Weisler (1993c: 68) warned, ”until most of the major sources of
adze material in Polynesia (or a particular study area) have been identified and their
chemical variability understood, specifying a particular quarry for each artifact may not
be possible”.
Before an artifact can be definitively sourced to the Tutuilan quarry of its origin,
a comprehensive analysis of each known Tutuilan quarry must be completed to properly
define the study area. Numerous studies have linked Tutuila with stone tools recovered
throughout the Pacific (e.g. Best et al. 1992; Weisler 1993a, 1993b; Weisler and Kirch
1996). Basalts of Tutuilan origin have been identified as far as 1600km from their
source, on Mangaia (Cook islands), an island that contains local utilized basalt sources
(Weisler and Kirch 1996). Yet, limited attempts to distinguish intraisland quarry
signatures have not displayed definitive separation of all tested Tutuilan quarries (Best et
al. 1992, Clark et al. 1997). Identifying quarry level provenance of Tutuilan basalts will
allow advanced understanding and interpretation of the intricacies of Samoan
socioeconomic and political interactions both within the archipelago and throughout the
Pacific. In order to achieve that goal, the rubric of Samoan provenance study must shift.
Tutuilan Geochemical Characterization Studies
To date there have been three substantial attempts towards the chemical
characterization of Tutuilan quarries, and the sourcing of artifacts to a quarry of Tutuilan

29
origin. The most prominent subject of Tutuilan chemical characterization provenance
study has been the quarry at Tataga-matau. Both geologic and artifact samples collected
from Tataga-matau are included in each of the major attempts at Tutuilan provenance
studies: Best and colleagues (1992); Clark and colleagues (1997); Weisler (in Kirch &
Hunt 1993). Each of those projects focuses primarily on Tutuilan or Samoan sources.
All of these projects utilize XRF in an attempt to characterize Tutuilan quarries and
source artifacts with those quarries. Each of these projects varies slightly in both method
and purpose. However, the intent of determining Tutuilan quarry provenance was
accomplished with varying degrees of success.
Best and colleagues 1992. Best and colleagues (1992) is the compilation of
geochemical characterization performed on samples from across the Pacific. In this
compilation the authors argued that samples recovered elsewhere in Samoa or across
Polynesia clustered favorably with samples used to characterize Tataga-matau. The
focus of this paper is an attempt to source artifacts to Tataga-matau. The authors
assumed that the basalt exploitation at Tataga-matau was meant for trade beyond
Tutuila. The impetus of this project was to determine the spatial and temporal scope of
the Tataga-matau basalt trade. Although the project focused mainly on the
characterization of Tataga-matau and its possible traded commodities, it remains one of
the most prolific attempts at Tutuilan provenance. During the compilation of data for
this project very little was known about the scope of Tutuilan quarry sites. It is
important to note that until the surveys of the East Tutuila Project (Clark 1989), the
30
overwhelming majority of currently recorded Tutuilan quarries were yet to be
discovered.
In total Best and colleagues (1992) characterized 161 archaeological and
geological samples. The sample area for the scope of this project was extremely large,
”bounded by Hawaii, Pitcairn, Easter Island, Tonga, Lau and Samoa” (Best et al.
1992:49). Samples representing islands contained within the geographic constraints of
the project design were compiled via donation from various researchers of the particular
areas of interest. The donated samples had not been collected specifically for this
provenance study. The destructive methods employed for characterization limited the
type and amount of samples that were included in the project; due to the reluctance of
potential lenders at the prospect of losing irreplaceable material culture (Best et al.
1992).
Samples analyzed were collected from the Samoan islands of Savai’i, Tutuila,
Tau, and Upolu (n=68); the Cooks (n=19); the Lau group of Fijian islands (n=9);
Henderson (n=1); the Hawaiian Islands (n=13); the Marquesas (n=5); Nupani Island
(n=2); Pitcairn (n=12); Pukapuka (n=1); Raiatea (n=1); Rapa Nui (n=2); San Cristobal
(n=1); Taumako (n=4); the Tokelaus (n=7); Tonga (n=3); and Tuvalu (n=2) (Best et al.
1992:71-76). All of the samples were analyzed for major elements using XRF at the
Department of Geology at the University of Auckland, and 36 samples were further
characterized by trace element analysis to confirm contested XRF results (Best et al.
1992).
31
Of the Tutuilan samples included in the project, 47 were collected from Tataga-
matau, and three others from the Taputapu volcanics (Best et al. 1992). The majority of
the samples representing Tataga-matau were artifacts, but four were geological samples
(Best et al. 1992). The Tataga-matau samples represent various loci across the complex,
but the majority was collected from Quarry 1. In addition to Tataga-matau
archaeological flakes from Asiapa (n=2), Le’aeno (n=1), and Lau’agae (n=2) were also
included (Best et al. 1992:72). Outside of the Tutuilan basalt source material analyzed,
Oceanic basalt source material from Hawaii (n=9), Henderson (n=1), the Marquesas
(n=4), Pitcairn (n=13), and Rapa Nui (n=2) (Best et al. 1992:63). In total, over half of
the samples analyzed were collected from quarry sources and a quarter of the 161
samples were intended to characterize Tataga-matau and the Leone complex. However
the majority of the samples were archaeological flakes and artifacts.
In order to interpret the variation of the chemical composition represented within
the sample population, the elemental composition of each sample was analyzed using the
multivariate statistical methods of average linkage cluster analysis, and stepwise
discriminant function analysis (Best et al. 1992). The raw data was transformed (log10)
to normalize the distribution. The statistical analyses were carried out using the
statistical software SAS (6.01) (Best et al. 1992). Best and colleagues (1992) reported
that stepwise discriminant function scores presented (in the following order) CaO, TiO2,
Fe2O3, P2O5, MnO, SiO2, MgO, K2O, and Al2O3 as the most distinguishable between the
samples. Graphical differentiation was displayed via biplots of phosphorous (P2O5)
against titanium (LogTiO2) or iron (LogFe2O3).

32
The cluster analysis resulted in 17 clusters determined by an average squared
Euclidean distance of .05 (Best et al. 1992). Cluster one contained a wide variety of
samples (including a majority of the Tutuila samples) and was further subdivided by the
authors into four subgroups. The bivariate plots presented display differentiation of
samples, and in some cases display differentiation between the Tutuilan quarries that
were analyzed. However based upon the small amount of samples that were used to
characterize many of the individual sources outside of Tataga-matau (e.g. Asiapa (n=2),
Le’aeno (n=1), and Lau’agae (n=2)), the variation of these sources was not properly
characterized for comparison against each other. The authors recognized the
shortcomings of the sample populations for the quarries included in the project, but were
undeterred from proposing artifact provenance.
Ultimately, the results of the analysis did not define Tataga-matau (upper quarry
loci) as the dominant quarry of origin of the Polynesian artifacts that were analyzed.
However the authors claimed that adequate compositional affiliation was determined
between samples to propose a Tutuilan origin for the majority of the typologically
Samoan adzes recovered outside of the island; and claim Leone complex origin for many
of the artifacts sampled (especially the Fijian adzes) (Best et al. 1992). Given the high
number of samples from the Leone complex that were analyzed in comparison to other
areas of Tutuila this proposition is problematic. The very low numbers of samples from
outside the Taputapu volcanics would not properly characterize the variation of those
areas, and therefore would be much more likely to differentiate from other samples
analyzed, especially the Taputapu samples. Without the proper characterization of

33
intraisland variation on Tutuila, claims by Best et al. (1992) of artifact provenance
cannot be definitively supported.
The sampling design of Best and colleagues (1992) concentrated on the Leone
complex of west Tutuila and failed to define Tutuilan intraisland variation. At the time
of the study, many of the currently recorded quarries on Tutuila had not or had only
recently been discovered. A few samples from those quarries were integrated into the
project, but too few to properly characterize the sources. Without properly defining the
variation outside of the Leone complex artifact provenance cannot be achieved at the
quarry or local source, or even volcanic province level. The provenance study of Best
and colleagues (1992) was the first of its kind in Samoa. Although the sampling strategy
proved insufficient for addressing the question of quarry level provenance, the ambitious
nature of the analysis was invaluable to the nascent field of Samoan geochemical
characterization. The questions posed, data presented and conclusion drawn by Best and
colleagues (1992) provided an invaluable foundation for the future of provenance studies
on Tutuila.
Weisler 1993a. In 1993 Kirch and Hunt released a report on fieldwork at the
To’aga site on the American Samoan island of Ofu. In this volume Dr. Marshall Weisler
contributed a chapter on the chemical characterization of artifacts recovered during the
excavations. The Weisler (1993a) chapter presents the first provenance study to focus
solely on Samoan source material and artifacts. The chapter outlines a provenance study
incorporating basalt artifacts recovered on Ofu and Ta’u as well as source material from
Mako Ridge and Fa’ala’aga (Ofu) and Tataga-matau on Tutuila (Weisler 1993a). The

34
samples were analyzed using XRF. The author sought to address two questions of
provenance: (1) define variation of basalt artifact composition for the Manuan
assemblage; (2) determine if fine-grained basalt from Tataga-matau had contributed to
the assemblages from Ofu and Ta’u (Weisler 1993a:168). In addition to questions of
provenance, this project served as a pilot test of destructive XRF versus nondestructive
ED-XRF (Weisler 1993a).
In total 13 source samples were analyzed from Tataga-matau (n=9), Mako Ridge
(n=4), and Fa’ala’aga (n=3). The artifacts selected for analysis were mostly polished
flakes that were assumed to be adze fragments (n=22), although unmodified flakes
(n=16) were also included to augment the macroscopic variability not wholly
represented by the adze fragments (Weisler 1993a). Weisler, as well as Dr. Peter R.
Hooper from the University of Washington Department of Geology conducted the XRF
analysis in 1989 (Weisler 1993a). Weisler reported the standards for preparation and
analysis.
Weisler (1993a) noted that due to the trial nature of ED-XRF on Oceanic basalt
artifacts the results could only be considered “semi-quantitative” at that time, and for
this reason samples were analyzed by XRF and ED-XRF (Weisler 1993a: 170). Weisler
(1993) briefly discusses methods for interpretation of results, including bivariate plots of
elements and multivariate statistics. The results of the analysis were not manipulated
statistically, and were fully reported in the chapter in tables and graphical displays.
The interpretation of the results was made through elemental ratios: Rb/Sr
against Y/Sr, Zr/Sr against Nb/Sr (Weisler 1993a). Weisler proposed that the results
35
differentiated Tataga-matau and the Manuan sources, and assigned over half of the
analyzed artifacts to a probable Tataga-matau provenance (Weisler 1993a). He
determined that the results display intrasource variation between Quarries 1 and 3 at
Tataga-matau; but conceded that the sample population was too small to be definitive
(Weisler 1993a). He stated, “this underscores the need to collect sufficient samples to
define geochemical variability of adz quarry resources” (Weisler 1993a: 179).
Although this project was undertaken in the nascent stages of Polynesian
provenance studies, it provided a clear and concise design that elegantly tested questions
of source and artifact composition variability in Samoa. This project not only tested the
variation of Samoan fine-grained basalts, but also the suitability of a new analytical
technology (ED-XRF) that had not previously been employed in the characterization of
Polynesian basalts and artifacts. Overall the analysis made a contribution to the
methodology of Polynesian provenance studies as well as to the database of Samoan
quarry characterization and basalt adze provenance.
Clark et al. (1997). The two previous projects, Best and colleagues (1992) as
well as Weisler (1993a), represent pioneering attempts at Polynesian basalt provenance
studies. These early analyses both centered on questions of Tutuilan provenance
(specifically Tataga-matau). During the sample collection and analyses for Best and
colleagues (1992) and Weisler (1993a) many Tutuilan quarries were yet undiscovered.
With the discoveries of multiple quarries in the late eighties, the landscape of Samoan
provenance studies quickly changed. Although a limited number of samples from East
Tutuilan quarries were added by Best and colleagues (1992), those quarries were

36
discovered towards the end of a six year period spent compiling and analyzing samples,
and at the time of publication very little was know about the quarries outside of Tataga-
matau. Until the quarry discoveries of the East Tutuila Project surveys, Tataga-matau
was the only recorded Samoan quarry and was considered possibly the only major
source of fine-grained basalt in all of Samoa.
The work of Clark and colleagues (1997) also focused on Tutuilan chemical
characterization, but the design and intent differ from Best et al. (1992) and Weisler
(1993a). The impetus of Clark and colleagues (1997) was to determine the intraisland
variability presented by the multiple quarry sites across Tutuila. The authors revisited
the previous efforts of Best and colleagues (1992) and added the analysis of 26 samples
representing Tutuilan quarries in an effort to determine intraisland quarry signatures.
This project was more material-centered in its design. The impetus of the project was
not sourcing artifacts to particular quarries, but to define the variability represented by
those separate quarries in an effort to determine the viability of quarry level provenance
on Tutuila.
Clark and colleagues (1997) began with a geologic description of Tutuilan
volcanic composition. After establishing the geologic variation of the island they
presented a synopsis of the Tutuilan quarry landscape (which as previously stated had
changed drastically). They briefly described each reported Tutuilan quarry and the
prospects of other unreported quarries on the island. They also reported quarry
complexes such as Fagasa and Faga’itua that rivaled the size and scope of the venerable
Tataga-matau complex. The authors determined an anomalous wealth of quarry sites
37
and determined that even more sites were most likely yet undiscovered; this evaluation
leads to the inference of a basalt export industry on Tutuila (Clark et al. 1997). This
background frames the impetus for comprehensive Tutuilan quarry characterization; in
that questions of artifact provenance cannot be addressed on Tutuila prior to establishing
comprehensive intraisland quarry variation.
To that end Clark and colleagues (1997) analyzed and compared both
archaeological and geologic samples from quarries across the island. The samples
included were defined by both quarry and volcanic province. The samples included in
the project were analyzed by XRF, and those results were compared to data from Tutuila
reported by Best et al. (1992) and Weisler (1993a). Eight quarry sites contributed to the
samples analyzed as well as seven non-quarry sites for a total of 26 samples from 15
Tutuilan sites (Clark et al. 1997). The eight quarries included were: Asiapa (n=1), Alega
1 (n=1), Alega 3 (n=1), Fagasa (n=10), Le’aeno (n=1), Lau’agae (n=1), Tataga-matau
(n=1), Usi 1 (n=1).
The results of the analysis were interpreted by comparison of TiO2, FeO, CaO,
P2O5, and K2O (Clark et al. 1997). The analysis determined ranges in elemental
composition of the Samoan quarry material analyzed, but overlap in those ranges
between quarries was too great to determine specific quarry signatures. Although some
differentiation was evident, the results displayed a significant amount of overlap
between quarries. The authors declared,
attempts to assign artifacts from non-quarry sites to specific quarries on the basis
of oxides is premature. Instead, artefact geochemistry is best used to identify the
38
island of origin and to eliminate unsuitable source possibilities. Consequently,
the statements of Best et al. (1992) regarding the quarry source of numerous
artefacts throughout the central Pacific should be regarded as hypotheses, not
facts (Clark et al. 1997).
The concerns about quarry level provenance on Tutuila addressed by Clark and
colleagues (1997) were valid considering the level of Tutuilan quarry characterization.
The compositional overlap between quarry sources displayed the necessity of
comprehensive definition of variation within a study area in order to confidently ascribe
provenance of an artifact (Weisler 1993b). However the sample size used to
characterize the individual quarries was too limited to definitively capture intrasource
variation and without definitive intrasource variation it is not possible to define
intersource variation.
Although the results of Clark and colleagues (1997) display overlap in quarry
composition, more powerful and sensitive analytical methods for analysis (i.e. INAA or
ICP-MS), more robust sampling, and application of powerful multivariate statistical
techniques could elucidate the problems encountered. With this in mind, claims by the
authors that apparent overlap in chemical composition between quarries precludes the
differentiation of Tutuilan quarries and subsequent artifact provenance are premature.
The design of Clark et al. (1997) most significantly inspired the analyses conducted for
this project. It was created to address the problems encountered with definitive
differentiation between Tutuilan quarry sources.

39
Summary
The contents of this chapter (and indeed this thesis in entirety) draw on over a
century of Tutuilan research. Each contribution be it geology, geography, or
anthropology was integral in the formation of Tutuilan provenance study. Without the
contributions towards an understanding of Samoa offered by: the missionary Heath, Sir
Peter Buck, Harold Stearns, Gordon MacDonald, Janet Davidson, Roger Green, William
Kikuchi, Helen Leach, Daniel Witter, Simon Best, Patrick Kirch, Terry Hunt, Jeffrey
Clark, David Herdrich and countless others, the proposition of geochemical provenance
analysis of Tutuilan quarries would not exist.
The three pioneering characterization projects discussed, created a substantial
foundation for the utilization of chemical characterization in Tutuilan provenance
studies. The questions posed and problems encountered served to create and foster
geochemical provenance studies throughout Polynesia. These studies together have
significantly guided the purpose and method of the research conducted for this project;
specifically issues of proper sampling procedures and geochemical techniques were
drawn directly from the experience, results and advice of these authors. These
contributions are ultimately responsible for the successful propagation of Tutuilan
geochemical characterization.

40
CHAPTER IV
METHODS
Introduction
For this project, basalt samples from four select Tutuilan quarries were analyzed
using instrumental neutron activation analysis to determine their elemental signatures.
Geochemical analysis of Tutuilan quarries will determine whether intra-island quarry
signatures are discernable from each other, and establish a comparative baseline for
future reference. All samples included in this project were processed and analyzed at the
Texas A&M University Center for Chemical Characterization, under the supervision of
Dr. William D. James, of the Elemental Analysis Laboratory. Dr. James performs all
archaeometric analysis in close consultation to protocol established by the NSF
Archaeometry lab at the Missouri University Research Reactor (MURR).
The state-of-the-art Elemental Analysis Laboratory at Texas A&M University is
a component of the Department of Chemistry's Center for Chemical Characterization and
Analysis. The laboratory provides research support in the area of elemental and trace
analysis as well as service analyses to TAMU users, other university and government
agencies and private industry. It is unique in that it features fast neutron activation
analysis (FNAA) capabilities in addition to thermal instrumental neutron activation
using the University's Nuclear Science Center 1 megawatt research reactor.

41
Sample Selection
I collected all quarry samples in November of 2004. In addition to my
committee, ASHPO territorial archaeologist David Herdrich provided consultation and
assistance for the development of specific quarry selection and sampling procedures.
The primary purpose of these analyses is to establish geochemical signatures of intra-
island quarry sites. A guideline for sample procurement was established to ensure that
the geochemistry of each quarry site included for analysis was accurately and adequately
represented. This project was designed as a preliminary attempt of defining variation
between Tutuilan quarries. With this goal in mind, criteria were established for the
quarry selection and sample collection.
Defining the variation of all known quarries on Tutuila was not the goal of this
project; as such limitations were placed on the number of quarries sampled in order to
succinctly address the design of the project. There were several limitations that were
considered when selecting which quarries would be included in this project. The first
limitation was the high number of quarries present on the island of Tutuila. There are no
less than 17-reported quarry sites on Tutuila (Table 1), and most likely more
undiscovered quarries. The number of samples necessary to define the variation of each
quarry made it impractical to attempt to characterize all reported quarries.
Time and money were very definitive limitations on the scope of this project.
INAA can be a labor and time intensive procedure. Limited monetary funding for this
project was allocated from the Texas A&M University Anthropology Department and
the American Samoa Historic Preservation Office. The total amount only covered travel

42
costs associated with a two-week sampling project on Tutuila. That short time frame
required a strict and succinct field sampling strategy that could only address the
minimum number of quarries required to adequately fulfill the research design.
The INAA process from sample preparation to final analysis can take several
months. The actual INAA method takes several weeks to complete each irradiation and
gamma ray count. Texas A&M has an active research reactor and access to neutrons
must be shared with other projects. The overall length of the analytical process in
conjunction with other projects using the reactor can lead to a timeframe of several
months for characterization of each quarry. When considering these constraints,
unreasonably high sample size could lead to very long delays in the analysis. These
limitations along with the costs associated with transport and curation of basalt rock
samples made it necessary to restrict quarry inclusion and sample populations to
addressing the research design as succinctly as possible.
Considering the aforementioned limitations on the scale of this project, two
overarching criteria were chosen to guide quarry selection. The first criterion was that
all samples must be selected from quarries that had previously been chemically
characterized. Only previously tested quarries were included to allow for the
comparison of differentiation results with those previous attempts. Tutuilan quarries that
had been previously characterized included: Alega, Asiapa, Faga’itua, Fagasa, Lau’agae,
Le’aeno, Tataga-matau, and Usi (Best et al. 1992, Clark et al. 1997, Weisler 1993a,
Weisler and Kirch 1996).
43
The second step in the winnowing process was to choose quarries that were
located in separate volcanic episodes. This criterion was motivated as much by an
assumption of compositional variation as sample size. It was assumed that the highest
order of chemical variation between quarries would be derived by different volcanic
origins (Weisler and Sinton 1997). The most obvious method for accomplishing this
task was division by Stearns (1944) volcanic provinces. As discussed in Chapter II, each
of Stearns (1944) provinces represents an individual shield episode. One quarry was
chosen from each of the volcanic provinces, with the exception of the Leone province.
No samples were tested from the Leone province because there are no known quarry
sources in the Leone volcanics.
The quarries chosen represented three volcanic provinces of Tutuila that contain
previously studied quarry sites: Olomoana, Pago, and Taputapu (Stearns 1944,
MacDougall 1985). Initially, one quarry from each province was chosen to define
possible inter-province variation. A fourth quarry was chosen from the Pago volcanics to
test possible intra-province variation. Samples were selected from these four quarries
(Table 2). The quarries included: Alega from the Pago Volcanics (n=30), Asiapa also
from the Pago Volcanics (n=30), Lau’agae from the Olomoana Volcanics (n=30), and
Tataga-matau from the Taputapu Volcanics (n=30). Only fresh geologic samples were
used in this analysis because it is a material-centered attempt at defining the quarry

44
Table 2. Quarries analyzed by INAA.
source variation. Lithic artifacts and debitage found on site were not eligible because
they may be intrusive to the site.
I conducted every step of sample selection, preparation and processing from the
initial to final procedures involved in this analysis. Sample preparation and processing
began in the field. In order for the chemical characterization to be statistically valid, the
number of samples analyzed per quarry must be greater than the number of elements (n-
1) used in the analysis. The EAL typically reports 28 or 29 elements (based on their
significance) in INAA characterization. Consequently, no less than thirty samples were
collected and analyzed from each of the four quarries (Table 2).
Samples were chosen from untested boulders that were indicative of material
exploited prehistorically. As discussed in Chapter II, the term quarry when used to
describe Polynesian basalt exploitation is somewhat spurious, in that there is little to no
evidence of material excavation in Samoa. Most basalt exploited was surface collected
from naturally occurring cobbles and boulders (Leach and Witter 1985, Clark et al.

45
1997, Weisler and Sinton 1997). Outside of certain areas at Tataga-matau, there is no
evidence that suggests extraction of material for lithic tool manufacture at Tutuilan
quarry sites (Weisler and Sinton 1997).
Fist sized chunks of basalt were separated from the fresh boulders and labeled. A
simple recording method was utilized to minimize confusion. The samples collected
were numbered sequentially in order of collection. Every sample collected was
numbered in the order that it was collected, from 1-150. Samples 1-30 were collected
from Lau’agae, 31-60 were collected at Asiapa, 61-90 were collected from Tataga-
matau, and 121-150 were collected at Alega (note that samples 91-120 were collected
from a previously unknown and untested quarry in the Pago volcanics. They were not
included in this analysis).
The size of each sample collected was also determined ultimately by INAA. Each
raw sample must produce at least 200mg of inner (non-cortical and non-weathered)
“fresh” material for neutron activation analysis. One ounce is roughly the equivalent of
300,000 mg, so a relatively small sample (the size of a nickel) yields the appropriate
amount. However, 200mg is the minimum amount required for initial INAA and is not
large enough to fulfill all proper sample size requirements. Proper characterization
sampling protocol should allow enough material for several characterizations,
petrographic thin section of the sample, and curation for inclusion in future research. To
achieve this goal the standard sample size collected in the field was approximately 16
ounces.

46
Only a small portion of each field sample was required for transport back to
Texas A&M. A thumb size portion was chipped away using an Estwing geologic rock
hammer and taken to Texas. The remaining portion of the corresponding sample was
bagged and tagged and saved for future chemical characterization or petrographic
analyses. Those samples are currently being curated at the Jean P. Haydon Museum in
Pago Pago, American Samoa.
Sample Processing
Sample processing for INAA was conducted in the Elemental Analysis
Laboratory over a four-week period spanning December of 2004 and January of 2005.
Once the samples were in the lab, every precaution was taken to eliminate commingling
of individual samples. Each individual sample was handled with a fresh pair of sterile
Fisher® disposable polygloves. The first step in lab processing was crushing the sample
and selecting inner pieces for irradiation. These samples were crushed with a Carver®
manual hydraulic press (Model #3912). To minimize sample commingling or
contamination as well as loss of material, the samples were crushed in sterile
Whirlpaks™ (small sealed plastic bags). The samples were crushed in between two
stainless steel plates. The stainless steel plates were washed with distilled water after
each sample, and were resurfaced for each quarry.
After the samples were crushed, individual internal pieces were selected using
forceps and placed in sterile glass vials. The forceps were washed with distilled water
and dried with Kimwipes® delicate task wipers prior to each sample selection. The next
step was washing the internal pieces. The pieces were washed in the glass vials using a

47
combination of acetone and distilled water baths. Initially the pieces were covered with
distilled water while in the glass vials. The pieces were agitated to dissolve the dust and
dirt into the water. After agitation the water was drained out of the vial. This process
was repeated until the distilled water remained clear after agitation. After the dust was
removed with distilled water the pieces were bathed in acetone. The acetone was
drained and the vials were immediately capped to prevent introduction of dust and dirt.
After the samples were cleaned they were placed in a drying oven to remove all
moisture. If any moisture is present during the INAA irradiation it can cause the
accumulation of pressure as the moisture vaporizes. This pressure can eventually break
the seal on the vial, and ruin the sample. Each sample was dried (in the uncapped glass
vial) for 24 consecutive hours in a Blue M® Stabil-therm™ gravity oven at 110°C.
Upon removal from the drying oven the samples were allowed to cool, and then weighed
and sealed in INAA vials. During sample cooling the glass vials containing the clean,
dry samples were placed in a closed desiccator to inhibit moisture accumulation.
The sample size needed for INAA was 50(+/- 5) mg. Pieces were chosen from
the glass vials and placed in plastic INAA vials to be weighed. The sample and vial
were weighed using a Mettler Toledo Model AX205 balance. Every seventh sample was
duplicated as a quality control standard. The balance was linked to a database program,
which logged the tare weight of the sample and vial as well as the tare weight of the
empty vial. This software automatically logged the weights for each sample and vial
into the database, reducing the probability of human data entry error. After each vial
was filled with the appropriate amount of sample, it was labeled using an Industrial

48
Sharpie® marker, and sealed using a soldering iron. The samples were then analyzed
using Instrumental Neutron Activation Analysis (INAA) at the Texas A&M Nuclear
Science Center’s 1 MW TRIGA research reactor.
Instrumental Neutron Activation Analysis (INAA)
INAA is a multi-element analysis technique that can identify trace materials in
the range of parts per billion (Neff 2000). With this procedure the sample material is
irradiated with neutrons in a nuclear reactor. Stable isotopes in the sample are converted
into radioactive (unstable) isotopes, and as they decay they emit different kinds of
electromagnetic radiation. After the target nucleus is irradiated it is referred to as a
“compound nucleus” (Neff 2000; Glasscock 1992). The compound nucleus is a
transitory stage between irradiation and emission of the prompt gamma ray. Upon
emission of the prompt gamma ray (γp), the compound nucleus is converted to a
radioactive isotope (Neff 2000; 1992). During decay the isotope emits a negatively
charged beta (β-) particle and a delayed gamma ray (γd) that produces a discrete
signature (Glasscock 1992). This signature can be measured to define elemental
composition. The delayed gamma radiation (γd) is measured using semi-conductor
gamma-ray spectrometers. Each element emits gamma radiation of a certain wavelength
or energy. Consequently, peaks in the gamma-spectrum at a given wavelength reveal
which elements are present in the sample (Neff 2000). The elemental energy levels are
counted and reported in parts per million (ppm). This definition of elemental
composition of the sample can be used to distinguish samples or group them together. In
essence each sample is provided a “signature” for comparison against all other analyzed
49
samples. These elemental “signatures” allow archaeologists to define the origin of stone
tools, through chemical composition of the stone.
INAA is not the only method for chemical characterization of material culture
available; however it is the most suitable and proven method for answering the questions
posed in this project. INAA is the one of the most sensitive and accurate tools for
chemical characterization available to archaeologists. This sensitivity has established
INAA as a preferred technique in archaeometric sourcing analyses (Bishop 1990; Neff
2000). According to Neff (2000), INAA is the established “Technique of Choice” for
sensitive geochemical analysis. Weisler and Kirch (1996) recognize that the greater
sensitivity of INAA in comparison to XRF may be necessary in sourcing of
geochemically associated Polynesian basalts. Bishop (1990: 539) also addresses the
comparison of XRF and INAA,
...in comparison to fully quantitative XRF, INAA is more sensitive and can
detect some elements having concentrations as low as a few parts per billion.
This sensitivity has contributed to its recognition as the technique of choice by
several analysts.
INAA was chosen for two key reasons. First, INAA has greater sensitivity and allows
for more accurate and precise characterization of than previously used procedures, thus it
has a greater capability to successfully characterize specific Tutuilan quarries (Neff
2000, Weisler and Kirch 1996). The definitive differentiation between quarries may
answer long held questions about the significance of particular quarries. Second, and to
this point, X-Ray Fluorescence (XRF) analysis has been successfully employed in

50
determining inter-island variation in South Pacific basalts, but XRF analysis has not
definitively characterized Tutuilan intra-island variation. Clark et al. (1997) employed
XRF (conducted by XRAL at Michigan State University) in an unsuccessful attempt to
distinguish intra-island variation in Tutuilan quarry material. It has been suggested that
in the case of defining variation within closely associated Polynesian basalt sources,
more sensitive and precise methods than XRF may need to be utilized (Weisler & Kirch
1996). INAA is such a method.
The INAA procedures administered were developed for comparison with results
generated at the Missouri University Research Reactor (MURR) Archaeometry
Laboratory. Both samples and controls were irradiated and counted. The controls used
for these analyses were National Institute for Standards and Technology (NIST) 1633a
coal fly ash, and NIST SRM 688 basalt. Due to the variability of half-life decay time
between elements, separate durations of irradiation and gamma counts are necessary to
account for the maximum chemical characterization (Table 3). Not all elements react
uniformly to the irradiation process and subsequently two separate irradiations and three
gamma counts were utilized on these samples.
Initially the samples and standards were subjected to a 30 second pneumatic tube
(p-tube) irradiation of approximately 1013 neutrons per cm2 per second (1013n cm-2 s-1).
During this process the samples were transferred into the reactor through a pneumatic
tube and irradiated individually. Twenty minutes after p-tube irradiation the samples
were counted for Al, Dy, Mg, Mn, Ti and V over a period of 500 seconds. After this
initial irradiation and gamma count the samples and controls were irradiated again for a

51
Table 3. Isotope, energy, and half-life.
Element Isotope Produced* Energy (keV) Half-Life
Short Count (P-tube) Aluminum (AL) 28Al 1779.5 2.24m Dysprosium (DY) 165Dy 94.5 2.33h Magnesium (Mg) 27Mg 1014.5 9.46m Manganese (Mn) 56Mn 1811.4 2.58h Titanium (Ti) 51Ti 319.7 5.76m Vanadium (V) 52V 1434.1 3.75m Intermediate Count Lanthanum (La) 140La 1596.2 40.27h Lutetium (Lu) 177Lu 208.4 6.71d Sodium (Na) 24Na 1368.6 14.96h Samarium (Sm) 153Sm 103.2 46.27d †Uranium (U) 239Np 106.1 2.36d Ytterbium (Yb) 175Yb 396.3 4.19d Long Count Barium (Ba) 131Ba 496.3 11.80d Cerium (Ce) 141Ce 145.4 32.50d Chromium (Cr) 51Cr 320.1 27.70d Cobalt (Co) 60Co 1332.5 5.72y Europium (Eu) 152Eu 1408.0 13.33y Hafnium (Hf) 181Hf 482.2 42.39d Iron (Fe) 59Fe 1099.2 44.50d Neodymium (Nd) 147Nd 91.1 10.98d Rubidium (Rb) 86Rb 1076.6 18.66d Scandium (Sc) 46Sc 889.3 83.31d Strontium (Sr) 85Sr 514.0 64.84d Tantalum (Ta) 182Ta 1221.4 114.50d Terbium (Tb) 160Tb 879.4 72.30d ‡Thorium (Th) 233Pa 312.0 27.00d Zinc (Zn) 65Zn 1115.6 243.90d Zirconium (Zr) 95Zr 756.7 64.02d
†(Np) Neptunium is used to detect Uranium ‡(Pa) Protactinium is used to detect Thorium *Glasscock (1991)
52
period of 14 hours. During this irradiation multiple samples were analyzed using a
rotisserie. The rotisserie held six cans, each can contained eight quarry samples
(including a duplicate), two NIST 1633a coal fly ash, one NIST SRM 688 basalt, and a
blank. After the long irradiation the samples underwent two gamma counts, called the
intermediate and long counts. The intermediate count took place one week after the 14-
hour irradiation, and the long count commenced four weeks after the 14-hour irradiation.
The intermediate count lasted 2000 seconds and was used to determine the values of La,
Lu, Na, Sm, U, and Yb. The long count lasted three hours and detected the gamma
radiation from Ba, Ce, Co, Cr, Eu, Fe, Hf, Nd, Rb, Sc, Sr, Ta, Tb, Th, Zn, and Zr. In
total 28 elements were identified and analyzed using INAA (Table 3).
Statistical Methodology
Exploratory multivariate statistical methods were applied to INAA results using
SPSS version 11 for Mac OSX. These methods are exploratory because they are used to
explore the possible affiliation of samples based on compositional variability. Initially,
canonical discriminant function analysis (CDA) was used to determine the level of
chemical variability between the characterized samples and differentiate between the
quarries. This data reduction method enables the consideration of extensive variables
that result from multi-element chemical characterization such as INAA. The application
of CDA resulted in definitive differentiation between all four-quarry sites. The
application of CDA successfully accomplished the goals of quarry differentiation and
baseline creation. However, this method cannot be applied to samples of unknown

53
origin, so would not be applicable as an initial or solitary method of differentiating
between unknown samples.
In sourcing projects of unknown sample origin, it is common to initially apply
methods of classification such as cluster analysis and principal component analysis
(PCA), which are designed to assign group membership to samples of unknown
affiliation. Cluster analysis in conjunction with a method such as PCA or CDA is a
technique commonly used in provenance studies to establish a baseline against which
future archaeological samples could be compared and sourced (Baxter 1994; Glascock
1992). For this reason after the successful initial application of CDA, two methods of
classification were applied to the data in order to test them as if they were of unknown
origin. The methods, k-means cluster analysis and principal components analysis, were
used to determine if these statistical techniques could be used successfully in
conjunction with CDA for future artifact centered provenance studies.
Prior to running the discriminant function analysis, all INAA data were log10
transformed (Glasscock 1992). This transformation of data was necessary for two key
reasons. First, transformation is necessary with INAA data due to concerns over
chemical concentrations that vary by orders of magnitude; some chemical concentrations
(major elements) are on the order of 10 times larger than others (trace elements) (Baxter
1994). A logarithmic transformation will normalize the data set and eliminate the
discrepancies in orders of magnitude, with the result that all major, minor, and trace
element concentrations are give equal weight in the analysis. This is important because
it is often the presence of trace elements that define a specific provenance.
54
Second, transformation is necessary because both discriminant function analysis
and principal component analysis assume normal distribution of the data. These
statistical techniques will produce spurious results when applied to non-normalized raw
data. Log10 transformation of the dataset approximates a normal distribution, allowing
for the use of these statistics.
Quarry Differentiation. In previous Tutuilan chemical characterization projects
the standard method for determining differentiation between quarries was direct
comparison of elements or oxides (Clark et al. 1997; Weisler 1993a). The differentiation
of samples based on compositional ratios was displayed through bivariate plots.
Although this method of differentiation has been utilized successfully in Polynesian
provenance studies, when applied to Tutuilan geochemical characterization it has failed
to clearly differentiate between quarries (Clark et al. 1997). This is most likely because
differentiating between quarries is driven by more than two or three elements.
Considering the problems encountered in previous Tutuilan provenance studies,
elemental ratios were not included as a method of differentiation for this project. Rather,
k-means cluster analysis was employed to help determine which elements would drive
the differentiation of Tutuilan quarry samples.
Classification versus Discrimination. There are two basic methods used to group
provenance data: through discrimination and through classification. Both methods are
employed in this research. Discriminant methods, such as discriminant function analysis,
test group membership of samples with an assigned, or known, origin. Classification
55
methods, such as cluster analysis, are intended to assign group membership to samples
with unknown origin.
Discrimination of different quarry sources was the primary goal of this project. It
was assumed that samples collected from each quarry site originated at that site of
collection. The intent of this project is not to determine the origin of the samples, but to
test the level of variability both within and between the sample populations representing
each quarry. This type of statistical question is discriminatory in design not
classificatory; discriminant function analysis is the statistical method most appropriate
for definition of Tutuilan quarry source differentiation. Shennan (1997:350) describes
the application of discriminant function analysis for such purposes as, “One area in
which it has found considerable archaeological use is artefact characterization studies,
where quantities of trace elements in lithic artefacts or pottery are used to try to
discriminate material from different sources.”
Canonical Discriminant Function Analysis. Canonical Discriminant function
analysis creates a series of functions (one less than the number of assigned groups) that
define the maximum variability between the predetermined groups. The first function
generated represents the greatest probable variability between the assigned groups; the
next function equals the next highest amount, and so on. A biplot of the first two CDA
scores graphically illustrates group (in this case quarry) separation much in the same
manner as a plot of elemental composition. However, plotting the discriminant function
scores defines variation in much greater depth than the bivariate plot of elements.
56
Discriminant function analysis is a commonly used method in INAA provenance
studies and can be used for establishing a baseline for artifact provenance (Glascock
1992). However, because discriminant function analysis alone is not considered a
rigorous technique for grouping samples with unknown origins, this statistical technique
is usually combined with other techniques (Baxter 1994; Glascock 1992). For the
purpose of establishing a definitive baseline for future artifact-centered sourcing studies,
k-means cluster analysis and principal component analysis were also applied to the data
to increase the rigor of the results. These techniques are commonly used in conjunction
with discriminant function analysis in provenance studies (Baxter 1994; Glascock 1992).
K-means Cluster Analysis. Cluster analysis is a method used in provenance
studies to assign group membership for samples of unknown origin. Baxter (1994:141)
refers to cluster analysis as the “multivariate workhorse in the analysis of chemical
composition of artefacts”. K-means cluster analysis differs from other methods in that it
allows for the definition of cluster amounts (k); but assigning the value of k is not always
intuitive and can prove problematic (Baxter 1994). However, for this project, the known
number of sampled Tutuilan quarries provides an obvious k value; and since I expect the
samples to be assigned by quarry, k-means presents a viable exploratory method of
classification.
Principal Component Analysis. Principal component analysis is a very powerful
method of exploratory multivariate statistical analysis, and is often used in the
interpretation of INAA artifact characterization (Glasscock 1992). PCA is extremely
useful at recognizing relationships within the complex and dense data produced by

57
powerful methods of characterization (i.e. INAA, ICP-MS) (Shennan 1998). PCA
produces principal components that maximize the variability present in the sample
population. Much like canonical discriminant function analysis, the first component
provides the maximum amount of variability; the second represents the next level, and
so on. The principal components produced by PCA are a rigorous method of
differentiation that can reduce the dimensions of voluminous datasets without substantial
loss of data. Much of the variability can be represented in the first three principal
components; making PCA a very attractive method for interpretation of INAA data
(Glascock 1992).
58
CHAPTER V
RESULTS Project
This project tested if individual Tutuilan quarries can be definitively
characterized and differentiated using instrumental neutron activation analysis. The
ultimate objective of this research is to establish intraisland source variation of Tutuilan
quarries providing a preliminary baseline for future artifact-centered endeavors. There
are three criteria inherent in the successful completion of this initiative: (1) determine
whether geochemical variation in Tutuilan basalts is detectable with INAA; (2)
determine whether or not that variation is sufficient to differentiate intraisland quarries;
(3) establish preliminary comparable baseline data of Tutuilan quarry variation. Each of
the previous criteria was achieved, providing strong support for the accomplishment of
the project goal.
Results
INAA was not the solitary method for solving the issues of Tutuilan quarry
characterization. Twenty-eight major and trace elements of the basalt samples were
analyzed. However the variation represented in the INAA results required interpretation
through statistical analysis. The application of multivariate statistical analysis allows for
the rigorous inspection and evaluation of variability present in the voluminous data
produced by chemical characterization. Several methods were applied to process the
variability between the quarries. The primary method for accomplishing differentiation
was canonical discriminant function analysis (Table 4).

59
Table 4. CDA scores for INAA data.
Function Eigenvalue Variance Cumulative Canonical Correlation
1 29.146 75.4% 75.4% .983
2 6.979 18.1% 93.5% .935
3 2.519 6.5% 100.0% .846
Canonical Discriminant Function Analysis. Canonical discriminant function
analysis was used to differentiate between the quarry samples (Table 4). As discussed in
Chapter IV, CDA tests the probability of a sample’s inclusion in an assigned group
versus other available groups. CDA was used primarily to test the first two criteria: (1)
whether geochemical variation in Tutuilan basalts is detectable with INAA, (2) whether
or not that variation is sufficient to differentiate intraisland quarries. CDA can be used
to achieve the third criteria of establishing a baseline for future provenance, but other
classificatory methods were also employed for this objective.
Unlike the previous attempts at definitive differentiation of Tutuilan quarries, the
INAA characterization reported herein produced clear separation between the samples
from each quarry. When analyzed using canonical discriminant function analysis,
variation in the 28 elements characterized clearly separate the samples between quarries.
Two methods of CDA were applied to the data. The first method analyzes independents
together. The second method called stepwise or “jack-knifing” analyzes case by case.
The regular CDA method was initially applied to determine group differentiation.

60
Table 5. CDA quarry source probability.
Sample Assigned Alega Asiapa Lau’agae Tataga-matau
PJ003 Lau'agae 90.123% .987%
PJ008 Lau'agae 99.998% .002%
PJ065 Tataga-matau .003% 99.997%
PJ074 Tataga-matau .001% 99.999%
PJ082 Tataga-matau .003% 99.997%
PJ085 Tataga-matau .007% 99.993%
PJ086 Tataga-matau .001% 99.999%
PJ148 Alega 99.997% .003%
The results display very clear separation between quarries. The first two discriminant
scores created by CDA represent the variability of over 93% of the sample population
(Table 4). A biplot of CDA score one and CDA score two clearly displays discrete
clusters of samples as assigned by quarry (Figure 6).
In the initial CDA, all thirty samples from each quarry cluster with the
appropriately assigned group. The goal for quarry membership was set at 95%
probability. Membership probability was set at a high percentage to create a rigorous
“core group” of samples for creating a baseline for future reference. The majority of
samples (112/120) were assigned with 100% probability to their quarry of origin. Of the
120 samples analyzed only 8 samples were not predicted to quarry membership with
100% probability confidence (Table 5). Although when plotted these eight samples
61
appear to be possible outliers, they were all predicted to the proper quarry of origin with
extremely high probability (99.99%).
After the initial CDA, data was then analyzed using the stepwise method to
determine if the samples were appropriately assigned or if certain samples may be
unknown (Duff 2002). Using this method only affected the inclusion of one sample. In
the initial CDA, sample PJ003 had the lowest probability of quarry membership at
97.25%. Although this was the lowest probability score, it was still very confident and
also higher than the 95% established for inclusion in the baseline. However after the
application of stepwise CDA the probability of sample PJ003 belonging to Lau’agae
quarry dropped significantly to 90.123%. This sample was deemed the only outlier due
to a probability score below 95%. Although PJ003 was given 90% of quarry
membership, that percentage is starkly contrasted against the other 29 samples which all
received scores at or near 100%.
The quarries varied in the amount of separation from each other. Although some
quarries were more differentiated than others, all displayed a very strong level of internal
cohesion and external separation. Asiapa was the most clearly differentiated quarry. On
the biplot of CDA scores one and two, the sample cluster from Asiapa displays the
highest level of dissimilarity from the other three quarries (Figure 6). Each of the 30
samples analyzed from Asiapa were successfully predicted to have membership in that
group with 100% probability.
Samples from the remaining three quarries, Alega, Lau’agae, and Tataga-matau
display less cohesion than Asiapa but maintain distinct definition and differentiation

62
(Figure 6). Of the thirty samples analyzed from the Lau’agae quarry, 28 samples were
predicted with 100% probability. The two samples not predicted at 100% probability
were sample PJ003 and PJ008 (Table 5). Both Lau’agae samples were predicted as
possible members of Tataga-matau origin. Twenty-nine of the thirty samples analyzed
from Alega were predicted as such with 100% probability. Sample PJ148 from Alega
had a .00003 probability assignment with Tataga-matau.
Tataga-matau was the least differentiated of the four quarries (Table 5). In total,
five of the thirty samples from Tataga-matau displayed levels of probability towards
other quarries (Table 5). On the CDA biplot, samples from Tataga-matau strayed from
the centroid towards both Lau’agae and Alega clusters (Figure 6). Samples PJ065,
PJ074, PJ082, and PJ085 all displayed probability in the hundred thousandths toward
Lau’agae. Sample PJ082 displayed 99.999% probability, while a duplicate from the
same sample (PJ082A) was predicted at 100% probability. Sample PJ086 displayed
00.001% probability of affiliation with the Alega cluster. Tataga-matau displayed the
highest number of samples that were not predicted with 100% probability, but no sample
from Tataga-matau had a lower probability prediction than 99.997%.
As displayed on the biplot, three of the four quarries analyzed exhibit significant
separation from the others. Asiapa, Alega, and Lau’agae are all clearly defined from
each other. These three quarries display significant differentiation between quarries
located in the Olomoana and Pago volcanics, as well as significant variation between

63
Figure 6. Biplot of CDA scores one and two for INAA data.
quarries within the Pago volcanics. The differentiation for the Tataga-matau samples is
much less defined than of the other quarries. In contrast to the variability displayed in
chemical composition, Tataga-matau is the most geographically isolated of all the
quarries sampled and analyzed. Each of the remaining three quarries (Alega, Asiapa,
Canonical Discriminant Functions
Function 1
100-10-20
Fu
nctio
n 2
6
4
2
0
-2
-4
-6
-8
QUARRY
Group Centroids
Alega
Tataga-matau
Asiapa
Lau'agae
4
3
21

64
Lau’agae) are all located on the eastern portion of the island, while Tataga-matau is
conversely located at the extreme western end of Tutuila.
Regardless of the level of variability between Alega, Lau’agae, and Tataga-
matau, all of the quarries displayed a clear differentiation when plotted, and the quarry
origin of each sample was correctly predicted with extremely high probability (almost
statistical certainty for every sample). This differentiation is extremely supportive of the
hypothesis. However CDA is not primarily a method for assigning provenance to
samples of unknown origin; therefore the baseline it creates is not as rigorous as a
baseline created by methods of classification. In addition to CDA, K-means cluster
analysis and principal component analysis were also applied to the data in order to assess
the application of classificatory methods in the establishment of a baseline.
K-means Cluster Analysis. After successful differentiation through CDA, k-
means cluster analysis was applied to the quarry data in order to test how well the
samples would differentiate when quarry origin was not assumed. Unlike CDA, cluster
analyses are utilized in provenance studies in order to assign group membership to
samples of unknown origin. Unfortunately the k-means cluster analysis was not as
successful in differentiating between quarries as CDA (Table 6).
The k-means results were indicative of very close chemical composition between
quarry sources. This is not surprising because the basalt from each quarry is derived
from the same magma chamber. Some samples clustered according to proper quarry of
origin while others did not. K-value was assigned as four. All of the samples from
Lau’agae clustered together in cluster one, and the samples from Alega and Tataga-
65
matau were assigned to clusters one, two, and four (Table 6). The mixing of Alega and
Tataga-matau is not entirely surprising because those quarries displayed a level of
overlap in the CDA results. The most anomalous clustering was from the Asiapa quarry.
Of the 30 samples from Alega, 29 clustered together in cluster three. Sample PJ059, was
the only sample from Asiapa that did not cluster with the other samples, as it was a clear
outlier and the only member of cluster two (Table 6).
Upon inspection of the cluster means and standard deviations it became rather
evident why sample PJ059 showed such differentiation. Sample PJ059 contained
significantly higher percentages of trace elements Dy, La, Ba, and Ce than the other
clusters, although Ba seems to be most influential in driving the separation.
Outliers can skew k-means clustering, so in an effort to redeem quarry differentiation
sample PJ059 was removed and the analysis was re-run. Unfortunately the removal of
the outlier did not improve the clustering of quarry samples. Conversely, the results
without Sample PJ059 were less interpretable than the original effort, as many of the
Asiapa samples were commingled with Alega and Tataga-matau.
Beyond the outlier there are two other possible explanations for the unsuccessful
application of k-means towards quarry differentiation. The first problem could be the
sample size. K-means assumes a large sample population, usually n > 200. The sample
population may not be large enough for an adequate application of k-means clustering.

66
Table 6. K-means clusters of INAA data.
Cluster Samples Distinguished Elements
PJ001-030 PJ067 Ti 9.567935%+/-540275%
Cluster 1 PJ061 PJ079 Cr .002045%+/-000544%
PJ063 PJ082 Tb .000675%+/-00071%
Cluster 2 PJ059 Ba .025757%
PJ031-058 PJ137-138
PJ060 PJ140-143 Tb .000747%+/-000083%
Cluster 3 PJ081 PJ145-146 Th .001657%+/-000134%
PJ122-127 PJ148
PJ128-132
PJ062 PJ133-136
PJ064-066 PJ139 Yb .001621%+/-000212%
Cluster 4 PJ068-078 PJ144 Th .002039%+/-00195%
PJ080 PJ147 Ce .047060%+/-03649%
PJ083-090 PJ149-150
PJ121
Although sample size may have contributed to the poor results, the most likely culprit is
the method itself. The application of k-means cluster analysis may be problematic due
to high compositional affiliation between quarries.
67
According to Baxter (1994:156), “What the algorithm actually achieves is a
dissection into internally cohesive non-overlapping clusters that need not be externally
isolated. The restriction to non-overlapping clusters is a possible limitation of the
method”. Tutuilan quarry samples do not reflect non-overlapping clusters. The chemical
characterization of Tutuilan quarries has been reticent in providing differentiation; and
has often displayed overlap in elemental composition (Clark et al. 1997). When
compared against the CDA bivariate plot this explanation seems more certain. The
quarries that displayed the most differentiation (Asiapa and Lau’agae) on the CDA
scatter plot display the greatest group cohesion in k-means, and the quarries that
displayed the most overlap (Alega and Tataga-matau) on the CDA scatter plot were the
most confused by k-means cluster analysis. Ultimately it was most likely the
compositional ambiguity between the analyzed quarries that resulted in poor clustering.
Principal Component Analysis. Principal component analysis (PCA) is another
exploratory tool used to define variation within a population, and is often used in
conjunction with cluster analysis. Principal component analysis is a very powerful
method for classifying group membership, commonly employed to differentiate INAA
results (Glascock 1992). PCA is similar to CDA in that it conflates the high volume of
data produced by INAA and represents the variability of the sample population with a
minimal number of scores. It accomplishes this task through a series of principal
component scores that are generated to represent the variance within the sample

68
Table 7. PCA scores for INAA data.
Component Eigenvalue Variance Cumulative
1 15.037 53.703% 53.703%
2 4.017 14.346% 68.048%
3 1.421 5.074% 73.122%
4 1.208 4.315% 77.438%
5 1.061 3.789% 81.227%
6 .840 3.000% 84.227%
7 .817 2.918% 87.146%
8 .612 2.186% 89.332%
9 .518 1.849% 91.181%
10 .382 1.363% 92.544%
population. Like CDA those scores can be plotted against each other to visually display
differentiation. When applied to the Tutuilan quarry data, PCA was able to represent
over 80% of the quarry variability within the first five scores. This level of variability
within the first several principal component scores is substantial. However when the
principal component scores for the Tutuilan quarries were plotted the result did not
display the same level of differentiation that CDA produced (Figure 7).
This is ambiguity is also most likely explained by a very high correlation of
chemical composition between quarries. The first two principal component scores
simply do not represent enough variation to differentiate between all quarries. When
compared to the CDA results it is evident how the first two discriminant functions
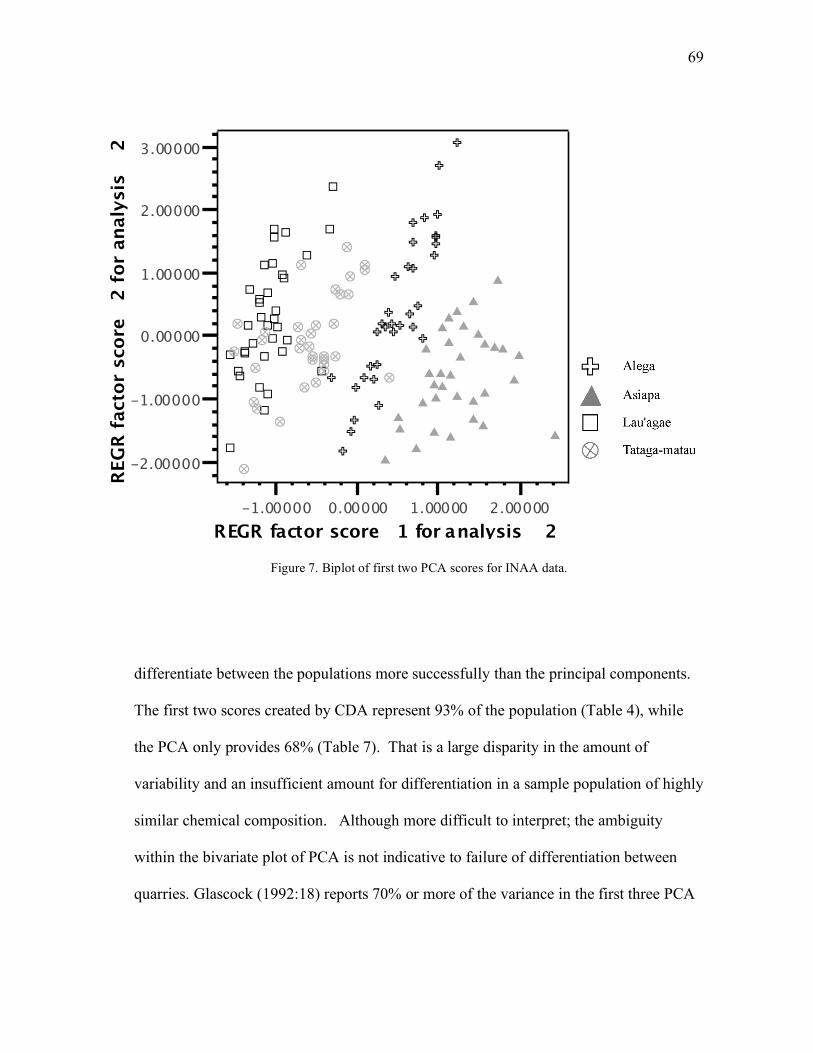
69
Figure 7. Biplot of first two PCA scores for INAA data.
differentiate between the populations more successfully than the principal components.
The first two scores created by CDA represent 93% of the population (Table 4), while
the PCA only provides 68% (Table 7). That is a large disparity in the amount of
variability and an insufficient amount for differentiation in a sample population of highly
similar chemical composition. Although more difficult to interpret; the ambiguity
within the bivariate plot of PCA is not indicative to failure of differentiation between
quarries. Glascock (1992:18) reports 70% or more of the variance in the first three PCA
A AlegaA AsiapaA Lau'agaeA Tataga-matau
-1.00000 0.00000 1.00000 2.00000
REGR factor score 1 for analysis 2
-2.00000
-1.00000
0.00000
1.00000
2.00000
3.00000
REG
R f
acto
r score
2
for
analy
sis
2
K
K
K
K KK
K
K
K
K
K
K
K K
K
K
K
K
K
K
K
KK
K
K
K
K
K
K
K
K
K
K
K
X
X
X
XX
X
XX
X
X
X
XXX
XX
X
X
XX X
X
X
X
X
X
XX
X
X
X
X
X
X
GG
G
GG
GGG
G
G
G
G
G
GG
GG
G
G
G
G
G
G
G
G
G
G
G
G
GG
G
G
GG
m
m
m
mm
m
m
m
m
m
mm
m
m
m
m
mm
m
m
m
m
m
m
m
m
m
mm
m
m
mm
m
PCA

70
scores for INAA data as substantial. When applied to the Tutuilan quarry data, PCA was
successful in representing 73% of the variation in the population within the first three
principal component scores (Table 7).
The results of INAA characterization clearly differentiate between the quarries;
and these empirical data strongly support the overarching goals that inspired this project.
However preliminary, the level of differentiation produced by this characterization is
extremely encouraging for the application of INAA towards future comprehensive
definition of Tutuilan quarry variation, and artifact sourcing. The quarry differentiation
achieved through canonical discriminant function analysis provides definitive separation
of Tutuilan quarry sources by elemental composition. In accomplishing this task CDA
has identified a “core group” of samples that create the preliminary baseline for future
artifact-centered provenance studies; and although the differentiation produced by PCA
is less perceptible than CDA, the results are encouraging; and further bolstering of the
CDA baseline can be achieved by refining the application of PCA.

71
CHAPTER VI
CONCLUSION AND DISCUSSION
Using compositional data generated with INAA we can now confidently define
Tutuilan quarries based on their chemical variability. Unlike the results of prior XRF
characterizations, INAA resulted in clear differentiation of all analyzed quarries.
Although successful in differentiating the quarries, data compiled in this project suggests
that the chemical composition of the quarries analyzed offers a minute amount of
interquarry variability. The detectable variability appears limited, but this project clearly
displays that Tutuilan intraisland quarry signatures are definable by sensitive and
comprehensive methods of analysis such as INAA.
The differentiation displayed in the INAA data illustrates the separation of
quarries based on chemical composition. The results of CDA on the data provide 100%
probability of proper quarry origin for 112 of the 120 samples. Of the eight samples
below 100%, seven received scores of 99.999%, while only sample PJ003 was rejected
due to a probability score of 90.123%. The remaining 119 samples create a very
confident “core group” of quarry samples, which define quarry differentiation. This
“core group” not only defines the individual quarries that are represented, but also
establishes a preliminary baseline of quarry variation that can be used in comparative
analysis and artifact provenance.
Each of the four quarries analyzed was clearly defined and separated. Both
Lau’agae and Asiapa were very clearly differentiated. Based on the statistical analysis of
data generated by INAA, it appears that Asiapa and Lau’agae have more cohesion within

72
their samples, than Alega and Tataga-matau. All methods of statistical analysis
employed defined Asiapa and Lau’agae quarries as coherent units. Several Alega and
Tataga-matau samples display overlap. The plot of the first two CDA scores illustrates
Tataga-matau and Alega samples straying away from their centroids and overlapping
into each other and also into Lau’agae. Although they may appear as possible outliers,
CDA correctly assigned these samples with a very high amount of probability (p>99%).
Tataga-matau displayed the least amount of cohesion of the four quarries
analyzed. The overlap displayed by Tataga-matau is most likely explained by increased
source variability that causes elevated intraquarry variation and inhibits quarry
differentiation. Best and colleagues (1992) also reported a high amount of internal
variability within Tataga-matau samples. Although more sampling is needed for all
quarries included in this study, the results of the Tataga-matau data suggest that
comprehensive sampling and characterization of all possible intrasite quarry source loci
are required to definitively characterize the variation in composition of fine-grained
basalt quarries located in the “Leone complex”.
The characterization of Tutuilan quarries by INAA has achieved the several
objectives associated with successful differentiation outlined in previous chapters. The
initial analyses displayed a distinguishable level of variance within the samples that
represented each Tutuilan quarry. The variability of quarry samples proved that each
quarry sampled displayed more interquarry variability than internal division. This
internal cohesion was the integral objective, and provided the basis of quarry
differentiation.

73
The compositional data compiled through this project has not only shown
definitive differentiation between the quarries analyzed but it has created a preliminary
baseline of data for comparable research. Although the definition of individual quarries
is clear, the sample sizes utilized represent the minimum amount for confident
differentiation. The baseline created through this project was not intended to be
definitive, rather a foundation for expanding the definition of Tutuilan quarry
composition. Although the "core group" consists of the minimum samples size
appropriate for each quarry, the INAA results display ample clarity in differentiation to
provide a proper foundation for artifact-centered provenance studies of the analyzed
quarries. The last decade has seen very little activity in Tutuilan provenance study and
the intent of this project was not only to address the challenges encountered in Tutuilan
quarry characterization but also to develop a worthy contribution for Tutuilan
archaeology. I hope the success of this project can provide the impetus for future
comprehensive characterizations of Tutuilan basalts and quarries.
Factors for Success
There were three key factors in design that allowed for successful differentiation
of Tutuilan quarries. The first factor was sampling strategy. This project was designed
first and foremost as a material-centered characterization of quarry variation. Artifact
assignment was not a major goal of this analysis; in fact no artifacts were included in the
characterization at any point. Previous attempts have included a majority of
archaeological flakes in the characterization of the quarry. For this project only raw
material was sampled. This sampling strategy was used to ensure that only material

74
derived at that source was included in the characterization of that source. The high level
of cohesion within quarry samples supports this material-centered approach.
Along with sample material, sample size played a key role in the success of this
project. In order to define variation in chemical composition between quarries, an
adequate amount of samples must be used to first properly define the amount of
variation in composition within a particular quarry. This project analyzed thirty samples
per quarry in order to define the variation of each source. Although this number was the
minimum amount of samples necessary for proper INAA characterization, it represented
a much larger population than was attempted in any previous single characterization of
geologic samples from Tutuilan quarries. The larger sample size allowed for a more
definitive characterization of quarry composition than previously attained.
The final component to the successful characterization of Tutuilan quarries was
the method of chemical characterization. Although it has long been successfully utilized
in archaeological provenance studies of ceramic vessels and obsidian tools, INAA had
not been previously utilized in the characterization of Samoan basalts. INAA is one of
the most sensitive, precise and accurate methods of chemical characterization available.
Weisler and Kirch (1996:1383) discuss the limits of XRF in characterizing “Oceanic
basalts that are highly similar in geochemical composition”, and suggest in such cases
more sensitive methods such as INAA. This sensitivity was key in differentiation
between such highly similar samples.
75
Caveats
As a preliminary attempt, this project was subject to limitations in both design
and intent. While the limited scope was designed to foster the successful completion of
the project objectives, it neglected several compelling questions of Tutuilan quarry
characterization. The project did not allow for comparison of artifact and geological
samples, comprehensive intra-province and inter-province quarry variation, or direct
comparison of methods for chemical characterization (e.g. INAA vs. XRF). The data
generated from the limited amount of the quarries and samples included in the analysis
were intended to create a confident differentiation not a definitive differentiation. The
final section includes suggestions towards the clarification of these questions and
thoughts on future Tutuilan provenance research.
Future Research
The quarries included in this study were selected to test the ability of INAA to
define intraisland variation, not to definitively establish that variation and construct a
comprehensive baseline for future reference. As stated earlier there are multiple quarry
sources on the island, and the majority were not characterized in this analysis; but the
results of the analysis were extremely encouraging for the prospect of differentiating
individual quarries on Tutuila. As is often the case of any research project, the answers
attained have left room for many other avenues of investigation and much more analysis.
The following is a discussion of the type of chemical characterization research that
should be conducted on Tutuilan basalts in the future.

76
Additional Quarries. The first necessary step for future analysis is to sample and
characterize the known quarries not included in this project, specifically the major
complexes of Fagasa, and Faga’itua. It is necessary to include as many quarries as
possible to properly define the variation between each quarry. The preliminary results
display a distinguishable amount of variation between quarries, however this trend of
differentiation may not continue with the addition of future quarries. At this point it is
especially necessary to differentiate quarries within the same volcanic province. As well
as addressing the similarity of Tataga-matau (Taputapu) samples with the Pago and
Olomoana samples. Addition of more characterized quarries will increase confidence in
the definition of variation among Tutuilan quarries. Until all of the known quarries are
sampled and analyzed the variation of Tutuilan quarry composition will not confidently
account for every possible quarry of origin. This variation must be comprehensively
described in order to confidently assign quarry of origin to artifacts. Artifact-centered
analyses cannot be considered definitive until this baseline of variation is completed.
Additional Samples. After sampling unanalyzed quarries, the addition of samples
from characterized quarries must be included to further elucidate the chemical
composition of those sources. The sample size for each quarry was a minimal amount,
and more samples must be added to comprehensively define each quarry. The larger the
sample population the more confidently we can characterize each quarry. In this project
only raw material samples were sampled and analyzed. It was assumed for the purpose
of this research that the majority of the flake scatter present at the quarry sites was
composed of local material available in naturally occurring surface boulders. Both
77
material-centered and artifact-centered sampling must be employed to completely define
the composition of each quarry. In the future, in addition to raw material, basalt artifacts
(flakes, preforms and tools) representing the assemblages present at the quarry sites
should also be characterized. This extremely important step will only increase the level
of characterization for each quarry as well as offer insight into reduction sequences and
material transfer within and between quarries.
Additional Methods. The final suggestion for future sourcing analyses on Tutuila
is the comparison of various methods for chemical characterization analyses. The
application of alternate methods of analysis towards a material centered characterization
of Tutuilan quarries will definitively address the problems encountered in previous
characterizations. INAA was the most obvious difference in this project from previous
attempts, and its increased sensitivity may have played an integral role in the
differentiation of Tutuilan quarries. However the sampling methods applied were also
different from other attempts, and the application of XRF and ICP-MS analyses towards
a material-centered characterization of Tutuilan quarries will define which method is
best suited for differentiating these fine-grained basalts. This question is as important as
any others because not all methods are widely available and the definition of each
methods ability to distinguish between quarries would allow for the optimal methods to
be applied in future provenance studies on Tutuila.
It is my intent to address each of these questions in the future. To that end, Texas
A&M offers access to several methods of characterization. The Elemental Analysis
Laboratory is extensively used to benefit a wide variety of research programs, reporting

78
some 50,000 measurements completed each operational year. In addition to INAA, the
facility offers access to state of the art Energy Dispersive X-Ray Fluorescence. This
allows comparison of the preferred methodology (ED-XRF) in current Polynesian lithic
sourcing studies with our NAA results. The laboratory has recently added inductively
coupled plasma-mass spectrometry to its stable of facilities. The ICP-MS has been fitted
with both conventional sample introduction hardware for solution work as well as a 213
nm laser ablation system for studying solids and surfaces. LA-ICP-MS is a progressive
technique that is gaining favor in provenance studies for its power, precision and
convenience.
Conclusion
This project represents the foundation for future comprehensive provenance
studies of Tutuilan basalts. The differentiation of these four quarries is a necessary step
in the comprehensive analysis of Tutuilan basalt exploitation. There are many more
quarries both recorded and most likely unrecorded that must be included with this data to
create a comprehensive baseline of Tutuilan quarries, but for the first time this data
provides a clear indication that differentiation of each quarry is possible. The fine-
grained basalt exploitation on Tutuila offers multiple avenues of potential archaeological
research, and clear differentiation of quarries is only the beginning. The continued
characterization of Tutuilan quarries stands to create a wealth of knowledge and research
into the pre-contact interaction, trade and economy of Tutuila and Polynesia.

79
REFERENCES CITED
Allen, Melinda S. and Kevin T.M. Johnson 1997 Tracking Ancient Patterns of Interaction: Recent Geochemical Studies in the
Southern Cook Islands, In Prehistoric Long-Distance Interaction in Oceania: An Interdisciplinary Approach. edited by Marshall I. Weisler, pp. 111-113. New Zealand Archaeological Association, Auckland.
Ayres, William and David Eisler
1987 Archaeological Survey in Western Tutuila: A Report on Archaeological Site Survey and Excavations. Unpublished report, American Samoa Historic Preservation Office, Pago Pago, American Samoa.
Baxter, M.J.
1994 Exploratory Multivariate Analysis in Archaeology. Edinburgh University Press, Edinburgh.
Best, Simon
1984 Lakeba: The Prehistory of a Fijiian Island. Unpublished Ph.D. dissertation, University of Auckland, Auckland.
1993 At the Halls of the Mountain Kings: Fijian and Samoan Fortifications:
Comparison and Analysis. Journal of the Polynesian Society. 102:385- 447.
Best, Simon, Helen M. Leach and Daniel C. Witter 1989 Report on the Second Phase of Fieldwork at the Tataga-matau Site, American
Samoa, July-August 1988. Department of Anthropology, University of Otago, Dunedin, New Zealand.
Best, Simon, Peter J. Sheppard, Roger C. Green and Robin Parker
1992 Necromancing the Stone: Archaeologists and Adzes in Samoa. Journal of the Polynesian Society 101:45-85.
Bishop, Ronald L.
1990 Sensitivity, Precision, and Accuracy: Their Roles in Ceramic Compositional Data Bases. American Antiquity 55:537-546.
Brophy, Kristen R.
1986 Tulauta and the Maupua Adze Quarry: The Lithic Manufacturing Center of Samoa. Unpublished M.A. Thesis, Department of Anthropology, Brown University, Providence.

80
Buck, Peter H. 1930 Samoan Material Culture. Bulletin 75. Bernice P. Bishop Museum, Honolulu.
Burley, David 1998 Tongan Archaeology and the Tongan Past, 2850-150 B.P. Journal of World
Prehistory 12:337-391. Church, Tim
1994 Lithic Resource Studies: A Source for Archaeologists. Special Publication Number 3, Lithic Technology. Dept. of Anthropology, University of Tulsa, Tulsa.
Clark, Jeffrey T.
1980 Historic Preservation in American Samoa: Program Evaluation and Archaeological Site inventory. Bernice P. Bishop Museum, Honolulu.
1989 The Eastern Tutuila Archaeological Project, 1988. Final Report. Unpublished
Report for the Government of America Samoa Office of Historic Preservation, North Dakota State University, Fargo.
1992 The Archaeology of Alega Valley -- Residence and Small Industry in
Prehistoric Samoa. Unpublished Report for the Government of America Samoa Office of Historic Preservation, North Dakota State University, Fargo.
Clark, Jeffrey T., Elizabeth Wright and David Herdrich
1997 Interactions Within and Beyond the Samoan Archipelago: Evidence from Basaltic Rock Geochemistry, In Prehistoric Long-Distance Interaction in Oceania: An Interdisciplinary Approach. edited by Marshall I. Weisler, pp.68-83. New Zealand Archaeological Association, Auckland.
Cleghorn, Paul L.
1984 An Historical Review of Polynesian Stone Adze Studies. The Journal of the Polynesian Society 93:399-420.
Cleghorn, Paul L., Thomas S. Dye, Marshall I. Weisler and John M. Sinton
1985 A Preliminary Petrographic Study of Hawaiian Stone Adze Quarries. Journal of the Polynesian Society. 94:235-51.
Davidson, Janet M.
1977 Western Polynesia and Fiji: Prehistoric Contact, Diffusion and Differentiation in Adjacent Archipelagos. World Archaeology 9:82-94
Dickinson, William and Richard Shutler Jr.
1979 Petrography and Sand Tempers in Pacific Island Potsherds. Geological Society of America Bulletin 90:1644-1701.

81
Duff, Andrew
2002 Western Pueblo Identities: Regional Interaction, Migration, and Transformation. The University of Arizona Press, Tucson.
Frost, Janet O.
1979 Archaeological Investigations on Tutuila, American Samoa. Unpublished Ph.D. Dissertation, University of Oregon, Eugene.
Glascock, Michael D.
1991 Tables for Neutron Activation Analysis. University of Missouri, Columbia.
1992 Neutron Activation Analysis. In Chemical Characterization of Ceramic Pastes in Archaeology, edited by Hector Neff, pp.11-26. Monographs in World Archaeology No. 7. Prehistory Press, Madison.
Golson, Jack
1957 Report to Tri-Institutional Pacific Program on Archaeological Fieldwork in Tonga and Samoa. Department of Anthropology, University of Auckland, Auckland.
1969 Preliminary Research: Archaeology in Western Samoa, 1957. In Archaeology
in Western Samoa, edited by R.C. Green and J.M. Davidson, Vol. I, pp.14-20. Report 2, Bulletin No. 7. Auckland Institute and Museum, Auckland.
Green, Roger C.
1974 A Review of Portable Artifacts from Western Samoa. In Archaeology in Western Samoa, edited by R.C. Green and J.M. Davidson, Vol. II, pp.245-275. Report 29, Bulletin No. 6. Auckland Institute and Museum, Auckland.
Green, Roger C. and Janet M. Davidson
1969 Archaeology in Western Samoa, Volume I, Report 2, Bulletin No. 7. Auckland Institute and Museum, Auckland.
1974 Archaeology in Western Samoa, Volume II, Report 29, Bulletin No. 6.
Auckland Institute and Museum, Auckland. Heath, T.
1840 The Navigator's or Samoan Islands. Their Manners, Customs and Superstitions. The Polynesian, Honolulu, Vol. I, pp.1.
Herdrich, David
1991 Towards an Understanding of Samoan Star Mounds. Journal of the Polynesian Society 100:381-435.

82
Jennings, Jesse D., Richard N. Holmer, Joel C. Janetski and H.L. Smith
1976 Excavations on Upolu, Western Samoa. Pacific Anthropological Records, No.25. Bernice P. Bishop Museum, Honolulu.
Jennings, Jesse D. and Richard N. Holmer
1980 Archaeological Excavations in Western Samoa. Pacific Anthropological Records, No.32. Bernice P. Bishop Museum, Honolulu.
Kaeppler, Adrienne L.
1978 Exchange Patterns in Goods and Spouses: Fiji, Tonga and Samoa. Mankind 11:246-252.
Kikuchi, William K. 1963 Archaeological Surface Ruins in American Samoa. Unpublished M.A. thesis,
University of Hawai'i, Honolulu. Kirch, Patrick V.
1984 The Evolution of Polynesian Chiefdoms. Cambridge University Press, Cambridge.
1997 The Lapita Peoples, Ancestors of the Oceanic World, Blackwell, Cambridge.
Kirch, Patrick V. and Roger C. Green
2001 Hawaiki, Ancestral Polynesia: An Essay in Historical Anthropology. Cambridge University Press, Cambridge.
Kirch, Patrick V. and Terry L. Hunt
1993 The To’aga Site: Three Millennia of Polynesian Occupation in the Manu’a Islands, American Samoa. University of California Archaeological Research Facility, Berkeley.
Leach, Helen M. and Daniel C. Witter
1985 Final Project Report on the Survey of the Tataga-Matau Fortified Quarry Complex, Near Leone, American Samoa. University of Otago, Dunedin, New Zealand.
1987 Tataga-matau "Rediscovered." New Zealand Journal of Archaeology 9:33- 54. 1990 Further Investigations at the Tataga-matau Site, American Samoa. New
Zealand Journal of Archaeology 12:51-83.

83
MacDonald, Gordon A. 1944 Petrography of the Samoan Islands. Bulletin of the Geological Society of
America 55:1333-1362 1968 Contribution to the Petrology of Tutuila, American Samoa. Geologische
Rundschau 57:821-837.
MacDougall, Ian 1985 Age and Evolution of the Volcanoes of Tutuila, American Samoa. Pacific Science 39:311-320.
Moore, James R. and Joseph Kennedy 1996 Archaeological Resources on Lau'agae Ridge: A Phase II Cultural Resource
Evaluation of Site AS-21-100 (The Lau'agae Ridge Quarry) for Phase III of the Onenoa Road Project Located in East Vaifanua County, Tutuila Island, American Samoa--March 1996. Archaeological Consultants of Hawaii, Inc., Pago Pago, American Samoa.
Natland, James H.
1980 The Progression of Volcanism in the Samoan Linear Volcanic Chain. American Journal of Science 280A: 709-735.
Neff, Hector
2000 Neutron Activation Analysis for Provenance Determination in Archaeology. In Chemical Analysis: A Series of Monographs on Analytical Chemistry and Its Applications. edited by J.D. Winefordner, pp. 81-127. Wiley-Interscience, New York.
Parker, Robin and Peter J. Sheppard
1997 Pacific Island Adze Geochemistry Studies at the University of Auckland, In Prehistoric Long-Distance Interaction in Oceania: An Interdisciplinary Approach. edited by Marshall I. Weisler, pp. 205-211. New Zealand Archaeological Association, Auckland.
Pearl, Frederic B.
2005 The Chronology of Mountain Settlements on Tutuila American Samoa. Journal of the Polynesian Society 113:331-348.
Rolett, Barry V., Emily Conte, Eric Peachtree and John Sinton
1997 Marquesan Voyaging: Archaeometric Evidence for Inter-Island Contact, In Prehistoric Long-Distance Interaction in Oceania: An Interdisciplinary Approach. edited by Marshall I. Weisler, pp. 134-148. New Zealand Archaeological Association, Auckland.
84
Shennan, Stephen 1997 Quantifying Archaeology, 2nd ed. University of Iowa Press, Iowa City.
Sheppard, Peter J., Richard Walter and Robin Parker 1997 Basalt Sourcing and the Development of Cook Island Exchange Systems, In
Prehistoric Long-Distance Interaction in Oceania: An Interdisciplinary Approach. edited by Marshall I. Weisler, pp.85-110. New Zealand Archaeological Association, Auckland.
Smith, Anita
2002 An Archaeology of West Polynesian Prehistory. Terra Australis Vol 18. Pandanus Books, Canberra.
Smith, Ian E.M., Graeme K. Ward and W.R. Ambrose
1977 Geographic Distribution and the Characterisation of Volcanic Glasses in Oceania. Archaeology and Physical Anthropology in Oceania 12:173-201.
Stearns, Harold T.
1944 Geology of the Samoan Islands. Bulletin of the Geological Society of America 55:1279-1332.
Weisler, Marshall I.
1990 A Technological, Petrographic, and Geochemical Analysis of the Kapohaku adze quarry, Lana’i, Hawaiian Islands. New Zealand Journal of Archaeology 12:29-50.
1993a Chemical Characterization and Provenance of Manu’a adz Material Using
Non-Destructive X-ray Fluorescence Technique, In The To’aga site: Three Millennia of Polynesian Occupation in the Manu’a islands, American Samoa. edited by Patrick V. Kirch and Terry L. Hunt, pp. 167-187. University of California Archaeological Research Facility, Berkeley.
1993b Provenance Studies of Polynesian Basalt Adze Material: A Review and
Suggestions for Improving Regional Databases. Asian Perspectives 32:61-83. 1997 Prehistoric Long Distance Interaction at the Margins of Polynesia, In
Prehistoric Long-Distance Interaction in Oceania: An Interdisciplinary Approach. edited by Marshall I. Weisler, pp. 149-172. New Zealand Archaeological Association, Auckland.
1998 Hard Evidence for Prehistoric Interaction in Polynesia. Current Anthropology
39: 521-532.

85
2002 Centrality and Collapse of Long-Distance Voyaging in East Polynesia. In Geochemical Evidence for Long Distance Exchange, edited by Michael Glascock, pp. 257-273. Bergin and Garvey, Westport, CT.
2003a A Stone Tool Basalt Source on ‘Ata Southern Tonga, New Zealand Journal of
Archaeology, 25:113-120. 2003b Contraction of the Southeast Polynesian Sphere and Resource Depression on
Temoe Atoll, New Zealand Journal of Archaeology, 25:57-88.
Weisler, Marshall I. and Patrick V. Kirch 1996 Interisland and Interarchipelago Transfer of Stone Tools in Prehistoric
Polynesia. Proceedings of the National Academy of Sciences U.S.A. 93: 138-85.
Weisler, Marshall I., Patrick V. Kirch and Julie M. Endicott 1994 The Mata’are Basalt Source: Implications for Prehistoric Interaction Studies in
the Cook Islands. Journal of the Polynesian Society 103:203-16.
Weisler, Marshall I. and John M. Sinton 1997 Towards Identifying Prehistoric Interaction Systems in Polynesia, In
Prehistoric Long-Distance Interaction in Oceania: An Interdisciplinary Approach. edited by Marshall I. Weisler, pp. 173-193. New Zealand Archaeological Association, Auckland.
Weisler, Marshall I. and Jon D. Woodhead
1995 Basalt Pb Isotope Analysis and the Prehistoric Settlement of Polynesia. Proceedings of the National Academy of Sciences U.S.A. 92: 1881-1885.

86
APPENDIX

87
Sample ID Quarry AL DY MG MN PJ001 Lau'agae 103593.1 8.614432 8623.572 1244.87 PJ002 Lau'agae 101127.5 8.571524 7935.981 1307.153 PJ003 Lau'agae 83967.4 11.76493 6685.548 1203.615 PJ004 Lau'agae 87839.55 8.405718 7807.041 1301.978 PJ005 Lau'agae 87286.27 8.553605 7879.173 1334.766 PJ006 Lau'agae 88789.2 7.714061 7893.647 1337.438 PJ007 Lau'agae 89048.67 8.026403 7777.754 1370.06 PJ007A Lau'agae 89248.68 9.606915 8424.444 1407.534 PJ008 Lau'agae 88266.36 8.342191 8502.146 1380.269 PJ009 Lau'agae 89496 8.320338 8910.644 1296.096 PJ010 Lau'agae 88602.09 6.926753 8704.056 1322.384 PJ011 Lau'agae 89069.15 8.985718 8522.245 1354.213 PJ012 Lau'agae 91975.98 10.0822 8600.608 1309.221 PJ013 Lau'agae 91337.77 8.816865 8622.875 1324.429 PJ014 Lau'agae 93643.8 8.487539 9385.791 1383.125 PJ015 Lau'agae 89176.24 9.30661 8557.947 1322.042 PJ015A Lau'agae 89905.52 10.31847 9104.894 1349.284 PJ016 Lau'agae 88452.88 9.028753 8962.896 1295.046 PJ017 Lau'agae 89662.04 9.219291 8697.304 1295.291 PJ017A Lau'agae 90601.94 9.551008 8543.983 1326.553 PJ018 Lau'agae 87602.97 8.752764 9068.778 1297.596 PJ019 Lau'agae 88263.09 9.043925 7857.544 1265.884 PJ020 Lau'agae 87164.73 9.343087 8186.408 1345.781 PJ021 Lau'agae 89783.13 9.025539 8779.283 1309.839 PJ022 Lau'agae 87195.02 8.774449 8522.141 1335.776 PJ022A Lau'agae 89503.32 9.262108 8385.675 1335.884 PJ023 Lau'agae 86397.04 8.496941 8348.492 1288.566 PJ024 Lau'agae 87253.32 8.724783 8054.593 1299.626 PJ025 Lau'agae 89247.35 8.80715 7863.918 1343.496 PJ026 Lau'agae 90019.2 8.527629 7984.828 1346.214 PJ027 Lau'agae 95817.85 9.457677 9405.233 1444.046 PJ027A Lau'agae 91620.38 9.298779 8605.146 1392.511 PJ028 Lau'agae 90603.09 8.727729 8285.724 1355.239 PJ029 Lau'agae 90188.97 9.577683 8004.336 1354.382 PJ030 Lau'agae 88465.72 7.686287 8332.247 1345.732 PJ031 Asiapa 87481.66 14.066 6864.208 1629.593 PJ032 Asiapa 85871.34 11.77367 7658.748 1511.064 PJ033 Asiapa 88786.56 12.16324 7228.874 1642.901 PJ034 Asiapa 89904.28 14.24419 7502.745 1711.572 PJ035 Asiapa 96743.56 12.85687 7253.532 1608.169 PJ036 Asiapa 88965.44 11.46207 6732.87 1458.041 PJ037 Asiapa 91269.27 12.21701 7315.895 1442.066 PJ037A Asiapa 89481.16 13.25916 7070.727 1421.489 PJ038 Asiapa 87198.03 10.73309 6898.252 1495.856 PJ039 Asiapa 85275.48 10.53677 7516.636 1464.288 PJ040 Asiapa 90100.58 12.14243 8115.919 1504.176

88
Sample ID TI V LA LU NA SM PJ001 21101.03 234.0031 37.42138 0.3266613 25093.64 11.54212 PJ002 21290.1 266.0918 40.01581 0.336213 26533.81 12.44988 PJ003 25673.26 240.1565 38.67419 0.4994333 26234.18 12.77441 PJ004 22935.15 243.2719 38.29097 0.3451251 26938.04 11.86471 PJ005 23405.19 250.9616 38.23219 0.3339386 26560.64 11.90737 PJ006 23516.45 264.5171 37.80219 0.3096361 25241.71 11.77291 PJ007 23149.28 263.8499 38.001 0.3337617 26181.92 11.85567 PJ007A 23937.29 258.2317 37.47691 0.3195777 25741.32 11.71795 PJ008 23110.07 262.0362 38.01052 0.3122643 27815.71 11.94266 PJ009 24435.73 258.8419 36.33991 0.2883726 25136.57 11.47394 PJ010 24250.99 261.1455 35.55714 0.3118468 23757.73 11.19983 PJ011 24499.77 275.0735 42.04695 0.3350082 30339.14 14.19572 PJ012 25323.27 265.5709 42.76751 0.3719113 30540.65 14.46565 PJ013 25186.43 264.9061 39.07755 0.3512146 27852.14 12.62527 PJ014 25661.59 276.6915 37.71521 0.3136887 27007.69 12.11294 PJ015 23781.1 264.6985 37.25769 0.3086528 24142.85 11.60774 PJ015A 25007.18 273.1953 36.92599 0.3280672 23887.55 11.64057 PJ016 22252.27 248.6911 36.10018 0.2973083 25210.94 11.40617 PJ017 21902.61 256.5324 39.93793 0.3485834 26948.52 12.96427 PJ017A 22900.39 251.8559 38.55423 0.3611591 26943.99 12.27592 PJ018 23603.84 254.0271 36.1348 0.2859197 24423.51 11.3692 PJ019 23711.46 259.3465 37.33423 0.2980029 25162.88 11.71338 PJ020 23725.13 278.3613 38.71866 0.3160082 26472.26 12.32177 PJ021 24617.52 260.2275 36.35072 0.2949735 25235.34 11.74959 PJ022 22596.31 263.2522 37.52108 0.3027848 25617.63 11.74568 PJ022A 22897.87 248.1925 38.64859 0.3170193 24372.65 12.25834 PJ023 22707.99 268.504 39.09155 0.3045028 27061.47 12.34566 PJ024 24554.57 272.5277 37.69933 0.2916592 25775.55 11.98337 PJ025 24593.11 268.9883 38.77689 0.3128722 26164.69 12.22422 PJ026 24609.57 271.6477 36.12762 0.3091265 25620.46 11.39888 PJ027 26666.7 296.4358 36.38339 0.3031536 26158.5 11.49036 PJ027A 24696.97 288.2162 37.29517 0.3287332 27007.54 11.93117 PJ028 25025.04 290.2542 37.70088 0.3329834 26872.39 11.96673 PJ029 24363.47 275.8428 36.77314 0.2980437 25868.71 11.55836 PJ030 23486.1 260.1374 37.77856 0.3110416 25442.87 12.05936 PJ031 17108.46 150.7536 49.56926 0.5684784 28842.02 16.75004 PJ032 18330.13 153.8485 46.61112 0.3811161 28413 15.19872 PJ033 16999.47 169.2509 46.72739 0.4021446 27476.57 15.10211 PJ034 16693.6 155.1707 56.48625 0.5226581 28463.93 18.72984 PJ035 19505.49 173.1599 49.6522 0.4258181 30078.82 16.2947 PJ036 18070.51 156.2887 46.82415 0.3864194 26828.66 15.25316 PJ037 18074.47 149.0038 50.63543 0.4494196 29876.93 16.18805 PJ037A 18191.98 162.5419 48.4918 0.4132255 28960.26 15.40926 PJ038 18419.03 155.6548 47.55334 0.3936365 27569.15 15.62277 PJ039 16757.97 153.7078 45.10239 0.374327 27511.64 14.45001 PJ040 18436.25 159.907 45.35202 0.4073692 26900.08 14.30517

89
Sample ID U YB BA CE CO CR PJ001 0.9168611 2.674769 303.3387 87.25641 45.52127 5.163173 PJ002 0.9548294 2.802466 310.4833 83.53108 40.20551 4.957998 PJ003 1.027083 4.148034 266.4084 81.84641 38.67504 4.605841 PJ004 1.022908 2.659499 258.9022 80.13605 37.9851 3.786732 PJ005 1.036078 2.515082 248.5914 79.18859 38.92737 4.705333 PJ006 0.9978818 2.531707 309.7206 84.55211 46.76079 4.608601 PJ007 1.001985 2.575171 281.9514 85.16546 41.36152 4.622026 PJ007A 1.059847 2.574914 275.169 86.81973 41.63538 5.142845 PJ008 0.9649352 2.741623 302.7228 89.18887 42.98196 4.690052 PJ009 0.8322642 2.398627 326.612 96.06779 44.72342 6.941181 PJ010 0.7004295 2.368748 318.481 88.1989 42.52535 4.700502 PJ011 1.080102 2.78782 262.0202 87.92689 43.10046 5.291144 PJ012 0.8815109 2.915258 337.9044 92.84997 45.32427 4.958466 PJ013 0.8926241 2.845618 315.2303 78.71289 39.80666 5.265245 PJ014 0.6119161 2.55232 293.1103 77.59731 38.9507 3.748027 PJ015 0.7817205 2.40626 323.4816 94.97022 49.25523 4.913954 PJ015A 0.8903236 2.405579 250.2252 94.34219 50.43826 5.080551 PJ016 0.7740988 2.536079 257.6814 74.05266 36.25 3.847831 PJ017 0.909517 2.87082 259.9037 83.02775 40.54148 4.614063 PJ017A 0.9305251 3.152052 228.053 76.29575 36.92278 3.687582 PJ018 0.6720139 2.457322 250.2271 90.95773 45.61134 4.357517 PJ019 0.7926558 2.428332 289.9981 80.51014 42.20856 5.495378 PJ020 0.8055561 2.459504 305.7645 84.29744 44.26971 5.098892 PJ021 0.7906749 2.457737 329.2125 79.36646 39.91704 3.7926 PJ022 0.6675224 2.397332 237.7838 85.71663 42.28753 5.339184 PJ022A 0.859938 2.533852 321.9454 102.4066 43.82769 5.088806 PJ023 0.7388205 2.589951 331.3682 87.10358 52.29102 5.209489 PJ024 0.8799091 2.232753 281.2162 81.05236 45.36397 4.352347 PJ025 0.8735511 2.566734 313.1607 88.0516 43.8783 6.557983 PJ026 0.8859842 2.359807 248.6076 83.35203 43.09509 4.940661 PJ027 0.9317114 2.471667 259.2097 81.06818 40.95609 6.616851 PJ027A 0.8735599 2.600404 226.5733 87.76919 43.04945 5.35636 PJ028 0.9786942 2.526824 287.3932 82.29569 44.82639 5.0207 PJ029 0.8872648 2.673934 269.8493 87.55397 43.65054 4.676938 PJ030 1.024361 2.562421 272.4546 85.91792 50.90499 11.26994 PJ031 1.191793 5.002786 351.0549 117.2985 24.61541 2.532516 PJ032 1.162054 3.55901 316.86 113.3609 26.78983 2.94062 PJ033 1.088436 3.529835 295.3219 111.4327 24.79387 2.230855 PJ034 1.545912 4.760939 377.9041 130.1368 28.809 2.647088 PJ035 1.100923 3.702167 330.4006 114.0071 24.82252 2.727755 PJ036 1.246982 3.42049 289.092 114.8988 24.02499 2.729334 PJ037 1.263447 3.565313 336.0645 119.5903 28.15708 2.784627 PJ037A 1.162782 3.450075 289.3027 116.9794 28.55391 3.585294 PJ038 1.2673 3.559407 285.1151 101.9104 23.68031 3.31699 PJ039 1.003937 3.386329 280.2133 100.977 26.3332 1.827121 PJ040 1.130977 3.210971 303.1606 105.2448 25.0132 2.222534
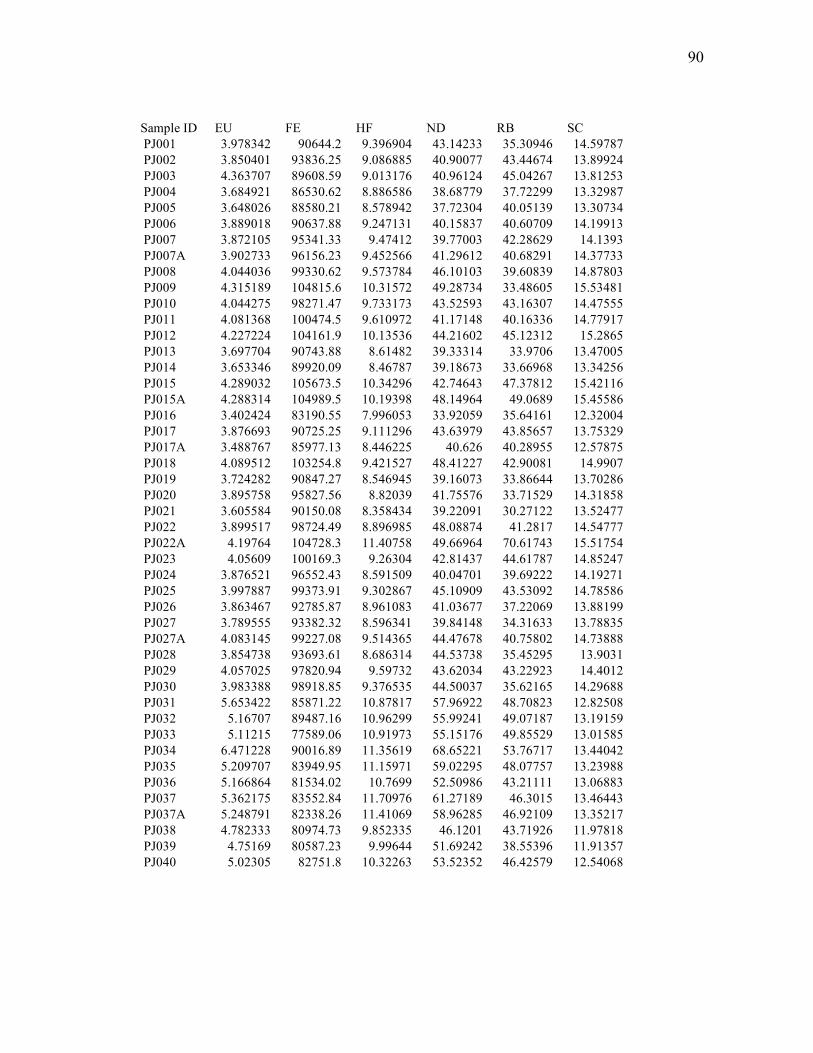
90
Sample ID EU FE HF ND RB SC PJ001 3.978342 90644.2 9.396904 43.14233 35.30946 14.59787 PJ002 3.850401 93836.25 9.086885 40.90077 43.44674 13.89924 PJ003 4.363707 89608.59 9.013176 40.96124 45.04267 13.81253 PJ004 3.684921 86530.62 8.886586 38.68779 37.72299 13.32987 PJ005 3.648026 88580.21 8.578942 37.72304 40.05139 13.30734 PJ006 3.889018 90637.88 9.247131 40.15837 40.60709 14.19913 PJ007 3.872105 95341.33 9.47412 39.77003 42.28629 14.1393 PJ007A 3.902733 96156.23 9.452566 41.29612 40.68291 14.37733 PJ008 4.044036 99330.62 9.573784 46.10103 39.60839 14.87803 PJ009 4.315189 104815.6 10.31572 49.28734 33.48605 15.53481 PJ010 4.044275 98271.47 9.733173 43.52593 43.16307 14.47555 PJ011 4.081368 100474.5 9.610972 41.17148 40.16336 14.77917 PJ012 4.227224 104161.9 10.13536 44.21602 45.12312 15.2865 PJ013 3.697704 90743.88 8.61482 39.33314 33.9706 13.47005 PJ014 3.653346 89920.09 8.46787 39.18673 33.66968 13.34256 PJ015 4.289032 105673.5 10.34296 42.74643 47.37812 15.42116 PJ015A 4.288314 104989.5 10.19398 48.14964 49.0689 15.45586 PJ016 3.402424 83190.55 7.996053 33.92059 35.64161 12.32004 PJ017 3.876693 90725.25 9.111296 43.63979 43.85657 13.75329 PJ017A 3.488767 85977.13 8.446225 40.626 40.28955 12.57875 PJ018 4.089512 103254.8 9.421527 48.41227 42.90081 14.9907 PJ019 3.724282 90847.27 8.546945 39.16073 33.86644 13.70286 PJ020 3.895758 95827.56 8.82039 41.75576 33.71529 14.31858 PJ021 3.605584 90150.08 8.358434 39.22091 30.27122 13.52477 PJ022 3.899517 98724.49 8.896985 48.08874 41.2817 14.54777 PJ022A 4.19764 104728.3 11.40758 49.66964 70.61743 15.51754 PJ023 4.05609 100169.3 9.26304 42.81437 44.61787 14.85247 PJ024 3.876521 96552.43 8.591509 40.04701 39.69222 14.19271 PJ025 3.997887 99373.91 9.302867 45.10909 43.53092 14.78586 PJ026 3.863467 92785.87 8.961083 41.03677 37.22069 13.88199 PJ027 3.789555 93382.32 8.596341 39.84148 34.31633 13.78835 PJ027A 4.083145 99227.08 9.514365 44.47678 40.75802 14.73888 PJ028 3.854738 93693.61 8.686314 44.53738 35.45295 13.9031 PJ029 4.057025 97820.94 9.59732 43.62034 43.22923 14.4012 PJ030 3.983388 98918.85 9.376535 44.50037 35.62165 14.29688 PJ031 5.653422 85871.22 10.87817 57.96922 48.70823 12.82508 PJ032 5.16707 89487.16 10.96299 55.99241 49.07187 13.19159 PJ033 5.11215 77589.06 10.91973 55.15176 49.85529 13.01585 PJ034 6.471228 90016.89 11.35619 68.65221 53.76717 13.44042 PJ035 5.209707 83949.95 11.15971 59.02295 48.07757 13.23988 PJ036 5.166864 81534.02 10.7699 52.50986 43.21111 13.06883 PJ037 5.362175 83552.84 11.70976 61.27189 46.3015 13.46443 PJ037A 5.248791 82338.26 11.41069 58.96285 46.92109 13.35217 PJ038 4.782333 80974.73 9.852335 46.1201 43.71926 11.97818 PJ039 4.75169 80587.23 9.99644 51.69242 38.55396 11.91357 PJ040 5.02305 82751.8 10.32263 53.52352 46.42579 12.54068
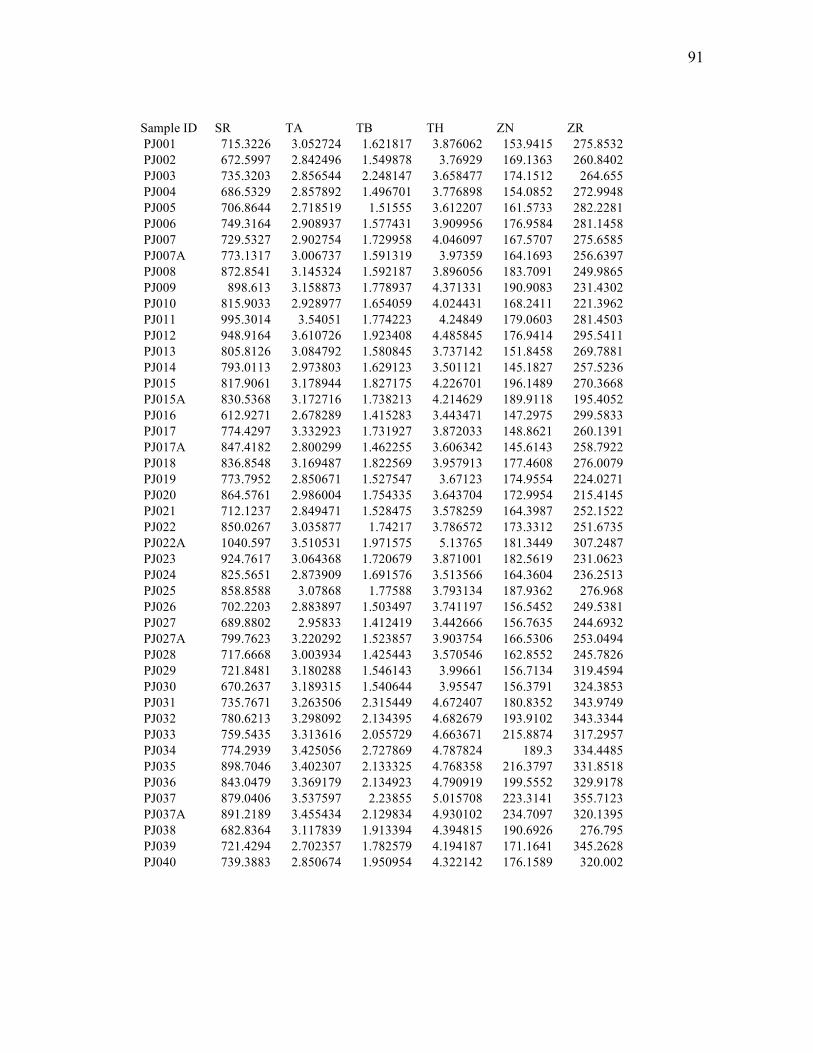
91
Sample ID SR TA TB TH ZN ZR PJ001 715.3226 3.052724 1.621817 3.876062 153.9415 275.8532 PJ002 672.5997 2.842496 1.549878 3.76929 169.1363 260.8402 PJ003 735.3203 2.856544 2.248147 3.658477 174.1512 264.655 PJ004 686.5329 2.857892 1.496701 3.776898 154.0852 272.9948 PJ005 706.8644 2.718519 1.51555 3.612207 161.5733 282.2281 PJ006 749.3164 2.908937 1.577431 3.909956 176.9584 281.1458 PJ007 729.5327 2.902754 1.729958 4.046097 167.5707 275.6585 PJ007A 773.1317 3.006737 1.591319 3.97359 164.1693 256.6397 PJ008 872.8541 3.145324 1.592187 3.896056 183.7091 249.9865 PJ009 898.613 3.158873 1.778937 4.371331 190.9083 231.4302 PJ010 815.9033 2.928977 1.654059 4.024431 168.2411 221.3962 PJ011 995.3014 3.54051 1.774223 4.24849 179.0603 281.4503 PJ012 948.9164 3.610726 1.923408 4.485845 176.9414 295.5411 PJ013 805.8126 3.084792 1.580845 3.737142 151.8458 269.7881 PJ014 793.0113 2.973803 1.629123 3.501121 145.1827 257.5236 PJ015 817.9061 3.178944 1.827175 4.226701 196.1489 270.3668 PJ015A 830.5368 3.172716 1.738213 4.214629 189.9118 195.4052 PJ016 612.9271 2.678289 1.415283 3.443471 147.2975 299.5833 PJ017 774.4297 3.332923 1.731927 3.872033 148.8621 260.1391 PJ017A 847.4182 2.800299 1.462255 3.606342 145.6143 258.7922 PJ018 836.8548 3.169487 1.822569 3.957913 177.4608 276.0079 PJ019 773.7952 2.850671 1.527547 3.67123 174.9554 224.0271 PJ020 864.5761 2.986004 1.754335 3.643704 172.9954 215.4145 PJ021 712.1237 2.849471 1.528475 3.578259 164.3987 252.1522 PJ022 850.0267 3.035877 1.74217 3.786572 173.3312 251.6735 PJ022A 1040.597 3.510531 1.971575 5.13765 181.3449 307.2487 PJ023 924.7617 3.064368 1.720679 3.871001 182.5619 231.0623 PJ024 825.5651 2.873909 1.691576 3.513566 164.3604 236.2513 PJ025 858.8588 3.07868 1.77588 3.793134 187.9362 276.968 PJ026 702.2203 2.883897 1.503497 3.741197 156.5452 249.5381 PJ027 689.8802 2.95833 1.412419 3.442666 156.7635 244.6932 PJ027A 799.7623 3.220292 1.523857 3.903754 166.5306 253.0494 PJ028 717.6668 3.003934 1.425443 3.570546 162.8552 245.7826 PJ029 721.8481 3.180288 1.546143 3.99661 156.7134 319.4594 PJ030 670.2637 3.189315 1.540644 3.95547 156.3791 324.3853 PJ031 735.7671 3.263506 2.315449 4.672407 180.8352 343.9749 PJ032 780.6213 3.298092 2.134395 4.682679 193.9102 343.3344 PJ033 759.5435 3.313616 2.055729 4.663671 215.8874 317.2957 PJ034 774.2939 3.425056 2.727869 4.787824 189.3 334.4485 PJ035 898.7046 3.402307 2.133325 4.768358 216.3797 331.8518 PJ036 843.0479 3.369179 2.134923 4.790919 199.5552 329.9178 PJ037 879.0406 3.537597 2.23855 5.015708 223.3141 355.7123 PJ037A 891.2189 3.455434 2.129834 4.930102 234.7097 320.1395 PJ038 682.8364 3.117839 1.913394 4.394815 190.6926 276.795 PJ039 721.4294 2.702357 1.782579 4.194187 171.1641 345.2628 PJ040 739.3883 2.850674 1.950954 4.322142 176.1589 320.002

92
Sample ID Quarry AL DY MG MN PJ041 Asiapa 87261.26 11.37881 6941.609 1390.779 PJ042 Asiapa 88489.64 11.73529 7775.438 1431.844 PJ043 Asiapa 91796.83 12.72809 8279.47 1509.525 PJ044 Asiapa 86388.3 13.14902 7198.587 1603.088 PJ045 Asiapa 85814.1 11.38576 6594.113 1326.464 PJ045A Asiapa 90259.59 11.28545 7810.386 1458.355 PJ046 Asiapa 87885.19 13.71387 7261.396 1407.068 PJ047 Asiapa 87467.7 12.7664 6850.474 1469.357 PJ048 Asiapa 88463.2 12.09393 6836.738 1507.791 PJ049 Asiapa 87961.15 12.81303 6592.873 1374.413 PJ050 Asiapa 87250.23 14.16738 7036.275 1771.276 PJ051 Asiapa 89489.76 13.21724 6489.946 1298.88 PJ052 Asiapa 86484.07 13.83351 6945.797 1574.06 PJ052A Asiapa 86719.52 13.24197 7376.382 1417.952 PJ053 Asiapa 90035.97 16.54643 6351.004 1308.686 PJ054 Asiapa 91961.27 14.40982 6280.796 2227.059 PJ055 Asiapa 91282.94 13.35461 6975.618 1310.732 PJ056 Asiapa 91828.71 13.12214 6907.135 1283.345 PJ057 Asiapa 92500.48 14.15919 6476.91 1270.453 PJ057A Asiapa 96680 14.573 6429.399 1258.629 PJ058 Asiapa 88909.18 15.15478 6114.432 1170.139 PJ059 Asiapa 94751.05 18.0732 7250.655 3042.124 PJ060 Asiapa 87491.69 13.55543 7851.156 1398.575 PJ061 Tataga-matau 86528.3 9.027169 7746.205 1502.803 PJ062 Tataga-matau 86829.03 10.84519 8253.447 1457.12 PJ063 Tataga-matau 85101.93 9.190701 8010.022 1471.009 PJ064 Tataga-matau 86641.19 10.13877 8244.758 1349.191 PJ065 Tataga-matau 85597.19 8.543539 8770.763 1365.048 PJ066 Tataga-matau 81878.29 9.680187 8593.893 1405.071 PJ067 Tataga-matau 85011.83 7.826943 8391.063 1315.548 PJ067A Tataga-matau 83513.38 8.939875 8493.516 1385.811 PJ068 Tataga-matau 84148.85 8.439904 8333.521 1373.772 PJ069 Tataga-matau 84489.77 9.790971 8522.649 1377.407 PJ070 Tataga-matau 89764.31 10.81263 9370.409 1496.347 PJ071 Tataga-matau 91169.1 9.75071 8755.13 1331.115 PJ072 Tataga-matau 87472.22 9.423972 8558.643 1485.36 PJ073 Tataga-matau 91841.45 10.90766 8747.006 1502.732 PJ074 Tataga-matau 90998.2 10.81327 9410.774 1512.612 PJ075 Tataga-matau 93568.08 9.211323 8602.867 1559.19 PJ075A Tataga-matau 92394.91 10.6829 9295.793 1589.491 PJ076 Tataga-matau 87237.12 9.905013 8486.93 1489.642 PJ077 Tataga-matau 84729.53 10.02771 7543.466 1392.362 PJ078 Tataga-matau 86550.8 10.06376 8044.147 1420.595 PJ079 Tataga-matau 85362.8 9.941364 7971.886 1436.756 PJ080 Tataga-matau 87750.14 9.442072 7865.55 1478.751 PJ081 Tataga-matau 85526.79 11.35499 7287.522 1361.357

93
Sample ID TI V LA LU NA SM PJ041 17744.95 144.4008 48.04755 0.383483 28131.38 15.41977 PJ042 16372.55 152.1902 48.7845 0.3866002 29387.64 16.05317 PJ043 17539.87 149.0248 50.48083 0.400939 30185.46 16.78711 PJ044 18400.77 154.4581 50.23187 0.6066685 29740.35 16.93224 PJ045 16841.54 138.1685 46.21522 0.3879274 28416.78 14.97585 PJ045A 17655.07 149.8939 50.58987 0.4271902 31226.48 16.9444 PJ046 18696.52 155.4949 55.80516 0.5876688 28279.27 18.95554 PJ047 18365.64 165.1724 49.62919 0.4248202 25690.3 16.81894 PJ048 18396.12 147.298 49.1425 0.4091694 26571.88 16.16716 PJ049 18900.24 159.1382 51.46991 0.5362141 26531.16 17.53518 PJ050 19472.53 162.2374 55.88842 0.540962 27368.22 18.74087 PJ051 18129.11 150.6097 50.69827 0.4422788 26191.77 16.46426 PJ052 20320.43 202.4636 53.11748 0.4826479 25220.82 17.24245 PJ052A 17618.83 151.8544 56.04802 0.5675814 28206.18 19.00907 PJ053 19672.48 177.7059 64.38538 0.5982842 30683.53 21.46283 PJ054 19316.65 163.794 57.79853 0.5654073 30367.22 19.52953 PJ055 18655.64 152.9448 46.9337 0.4133502 28149.91 15.47266 PJ056 19390.54 163.0943 52.88017 0.6014042 27837.2 17.43982 PJ057 19340.6 164.4574 51.9233 0.4644503 23500.46 17.8419 PJ057A 17928.45 164.3346 54.006 0.5052871 28055.93 19.02437 PJ058 18116.2 153.8798 62.63857 0.5215079 28401.84 20.68862 PJ059 18877.83 169.1779 59.18692 1.176314 28965.85 19.54028 PJ060 18167.98 161.3419 51.20687 0.5200058 29393.6 17.20767 PJ061 23166.43 267.2946 36.29986 0.3112851 22880.51 11.62005 PJ062 22751.65 264.2379 36.77631 0.3175263 23589.23 11.92244 PJ063 22352.42 261.0413 38.30545 0.3459924 24117.17 11.87162 PJ064 22953.55 266.0524 38.51053 0.3505192 24575.67 12.44252 PJ065 23784.46 242.0459 39.41015 0.4061445 26162.84 13.53149 PJ066 21953.47 247.5443 40.99283 0.3956191 26999.13 13.74713 PJ067 22337.18 253.5962 36.01793 0.3126708 23017.32 11.3479 PJ067A 23006.83 270.1158 35.7886 0.3275957 23226.02 11.35981 PJ068 23091.01 251.5413 40.60482 0.4246517 26277.42 13.56253 PJ069 20877.52 233.6206 38.28868 0.3299425 24355.42 11.95911 PJ070 23092.85 254.1223 35.63395 0.317742 22312.79 11.10501 PJ071 23766.83 268.9874 38.25803 0.3359466 24389.49 11.98976 PJ072 21076.43 231.1329 41.64248 0.3845364 26421.49 13.31039 PJ073 22307.68 239.2615 41.4028 0.3804072 26848.14 13.55403 PJ074 22106.31 233.5178 42.0406 0.3873263 26102.93 13.79539 PJ075 22327.2 242.5878 38.96064 0.3350491 24961.1 12.03685 PJ075A 22494.86 247.4171 40.556 0.3799065 26941.72 13.26259 PJ076 22249.77 232.0058 40.58298 0.3842876 28359.92 13.29829 PJ077 21370.75 231.8006 42.00425 0.4028419 29341.33 13.54807 PJ078 21056.11 227.5854 41.59093 0.387479 28744.47 13.63088 PJ079 21644.45 241.5895 39.35653 0.332739 27535.88 12.55058 PJ080 21625 235.9707 43.14853 0.4038535 28815.18 14.14577 PJ081 20843.19 230.8442 52.17887 0.4366572 27616.26 16.20883
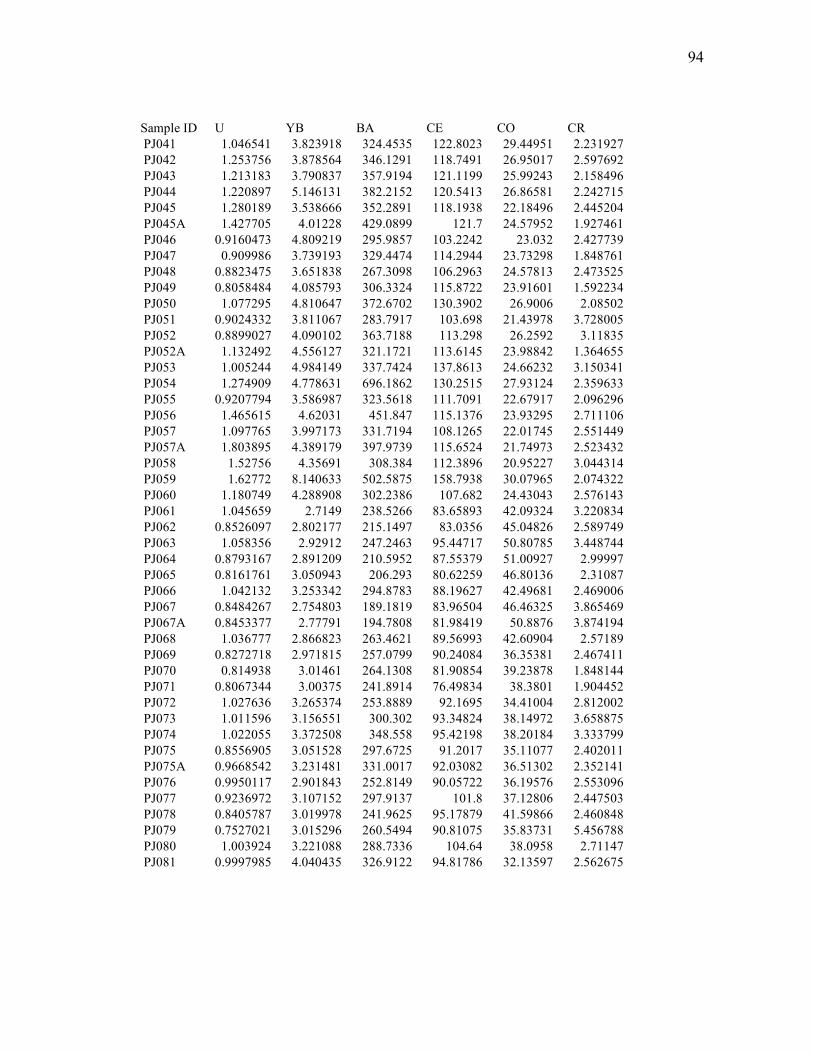
94
Sample ID U YB BA CE CO CR PJ041 1.046541 3.823918 324.4535 122.8023 29.44951 2.231927 PJ042 1.253756 3.878564 346.1291 118.7491 26.95017 2.597692 PJ043 1.213183 3.790837 357.9194 121.1199 25.99243 2.158496 PJ044 1.220897 5.146131 382.2152 120.5413 26.86581 2.242715 PJ045 1.280189 3.538666 352.2891 118.1938 22.18496 2.445204 PJ045A 1.427705 4.01228 429.0899 121.7 24.57952 1.927461 PJ046 0.9160473 4.809219 295.9857 103.2242 23.032 2.427739 PJ047 0.909986 3.739193 329.4474 114.2944 23.73298 1.848761 PJ048 0.8823475 3.651838 267.3098 106.2963 24.57813 2.473525 PJ049 0.8058484 4.085793 306.3324 115.8722 23.91601 1.592234 PJ050 1.077295 4.810647 372.6702 130.3902 26.9006 2.08502 PJ051 0.9024332 3.811067 283.7917 103.698 21.43978 3.728005 PJ052 0.8899027 4.090102 363.7188 113.298 26.2592 3.11835 PJ052A 1.132492 4.556127 321.1721 113.6145 23.98842 1.364655 PJ053 1.005244 4.984149 337.7424 137.8613 24.66232 3.150341 PJ054 1.274909 4.778631 696.1862 130.2515 27.93124 2.359633 PJ055 0.9207794 3.586987 323.5618 111.7091 22.67917 2.096296 PJ056 1.465615 4.62031 451.847 115.1376 23.93295 2.711106 PJ057 1.097765 3.997173 331.7194 108.1265 22.01745 2.551449 PJ057A 1.803895 4.389179 397.9739 115.6524 21.74973 2.523432 PJ058 1.52756 4.35691 308.384 112.3896 20.95227 3.044314 PJ059 1.62772 8.140633 502.5875 158.7938 30.07965 2.074322 PJ060 1.180749 4.288908 302.2386 107.682 24.43043 2.576143 PJ061 1.045659 2.7149 238.5266 83.65893 42.09324 3.220834 PJ062 0.8526097 2.802177 215.1497 83.0356 45.04826 2.589749 PJ063 1.058356 2.92912 247.2463 95.44717 50.80785 3.448744 PJ064 0.8793167 2.891209 210.5952 87.55379 51.00927 2.99997 PJ065 0.8161761 3.050943 206.293 80.62259 46.80136 2.31087 PJ066 1.042132 3.253342 294.8783 88.19627 42.49681 2.469006 PJ067 0.8484267 2.754803 189.1819 83.96504 46.46325 3.865469 PJ067A 0.8453377 2.77791 194.7808 81.98419 50.8876 3.874194 PJ068 1.036777 2.866823 263.4621 89.56993 42.60904 2.57189 PJ069 0.8272718 2.971815 257.0799 90.24084 36.35381 2.467411 PJ070 0.814938 3.01461 264.1308 81.90854 39.23878 1.848144 PJ071 0.8067344 3.00375 241.8914 76.49834 38.3801 1.904452 PJ072 1.027636 3.265374 253.8889 92.1695 34.41004 2.812002 PJ073 1.011596 3.156551 300.302 93.34824 38.14972 3.658875 PJ074 1.022055 3.372508 348.558 95.42198 38.20184 3.333799 PJ075 0.8556905 3.051528 297.6725 91.2017 35.11077 2.402011 PJ075A 0.9668542 3.231481 331.0017 92.03082 36.51302 2.352141 PJ076 0.9950117 2.901843 252.8149 90.05722 36.19576 2.553096 PJ077 0.9236972 3.107152 297.9137 101.8 37.12806 2.447503 PJ078 0.8405787 3.019978 241.9625 95.17879 41.59866 2.460848 PJ079 0.7527021 3.015296 260.5494 90.81075 35.83731 5.456788 PJ080 1.003924 3.221088 288.7336 104.64 38.0958 2.71147 PJ081 0.9997985 4.040435 326.9122 94.81786 32.13597 2.562675
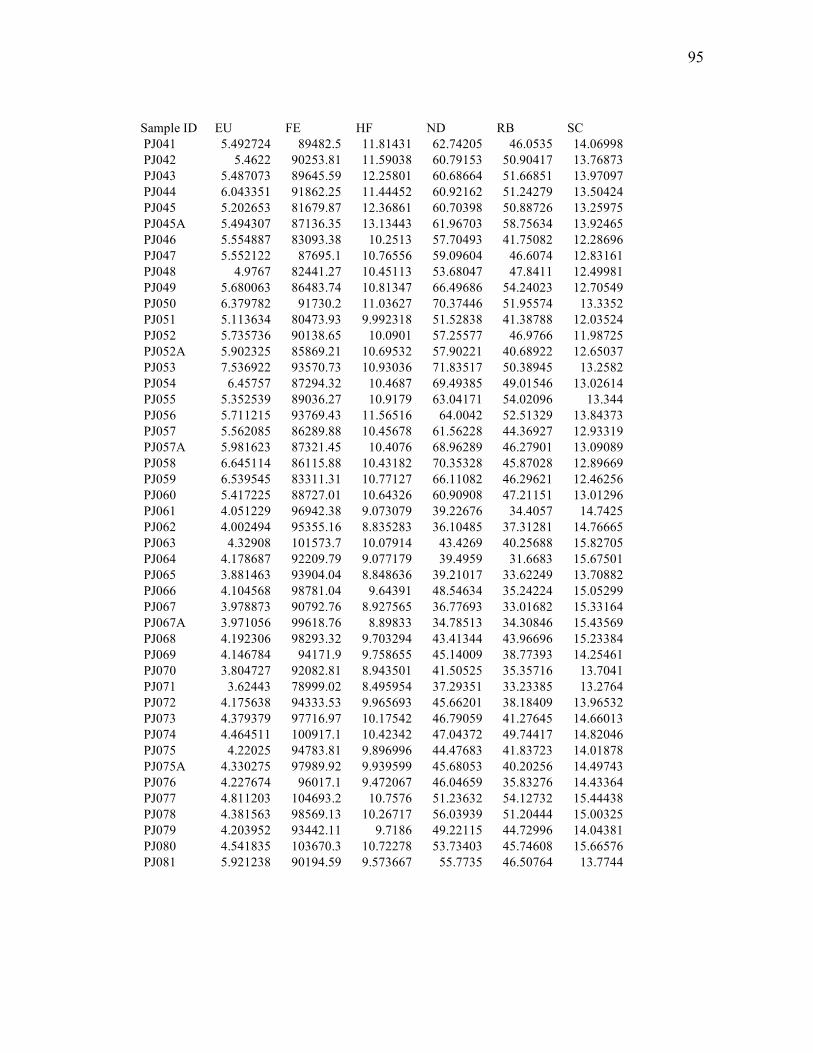
95
Sample ID EU FE HF ND RB SC PJ041 5.492724 89482.5 11.81431 62.74205 46.0535 14.06998 PJ042 5.4622 90253.81 11.59038 60.79153 50.90417 13.76873 PJ043 5.487073 89645.59 12.25801 60.68664 51.66851 13.97097 PJ044 6.043351 91862.25 11.44452 60.92162 51.24279 13.50424 PJ045 5.202653 81679.87 12.36861 60.70398 50.88726 13.25975 PJ045A 5.494307 87136.35 13.13443 61.96703 58.75634 13.92465 PJ046 5.554887 83093.38 10.2513 57.70493 41.75082 12.28696 PJ047 5.552122 87695.1 10.76556 59.09604 46.6074 12.83161 PJ048 4.9767 82441.27 10.45113 53.68047 47.8411 12.49981 PJ049 5.680063 86483.74 10.81347 66.49686 54.24023 12.70549 PJ050 6.379782 91730.2 11.03627 70.37446 51.95574 13.3352 PJ051 5.113634 80473.93 9.992318 51.52838 41.38788 12.03524 PJ052 5.735736 90138.65 10.0901 57.25577 46.9766 11.98725 PJ052A 5.902325 85869.21 10.69532 57.90221 40.68922 12.65037 PJ053 7.536922 93570.73 10.93036 71.83517 50.38945 13.2582 PJ054 6.45757 87294.32 10.4687 69.49385 49.01546 13.02614 PJ055 5.352539 89036.27 10.9179 63.04171 54.02096 13.344 PJ056 5.711215 93769.43 11.56516 64.0042 52.51329 13.84373 PJ057 5.562085 86289.88 10.45678 61.56228 44.36927 12.93319 PJ057A 5.981623 87321.45 10.4076 68.96289 46.27901 13.09089 PJ058 6.645114 86115.88 10.43182 70.35328 45.87028 12.89669 PJ059 6.539545 83311.31 10.77127 66.11082 46.29621 12.46256 PJ060 5.417225 88727.01 10.64326 60.90908 47.21151 13.01296 PJ061 4.051229 96942.38 9.073079 39.22676 34.4057 14.7425 PJ062 4.002494 95355.16 8.835283 36.10485 37.31281 14.76665 PJ063 4.32908 101573.7 10.07914 43.4269 40.25688 15.82705 PJ064 4.178687 92209.79 9.077179 39.4959 31.6683 15.67501 PJ065 3.881463 93904.04 8.848636 39.21017 33.62249 13.70882 PJ066 4.104568 98781.04 9.64391 48.54634 35.24224 15.05299 PJ067 3.978873 90792.76 8.927565 36.77693 33.01682 15.33164 PJ067A 3.971056 99618.76 8.89833 34.78513 34.30846 15.43569 PJ068 4.192306 98293.32 9.703294 43.41344 43.96696 15.23384 PJ069 4.146784 94171.9 9.758655 45.14009 38.77393 14.25461 PJ070 3.804727 92082.81 8.943501 41.50525 35.35716 13.7041 PJ071 3.62443 78999.02 8.495954 37.29351 33.23385 13.2764 PJ072 4.175638 94333.53 9.965693 45.66201 38.18409 13.96532 PJ073 4.379379 97716.97 10.17542 46.79059 41.27645 14.66013 PJ074 4.464511 100917.1 10.42342 47.04372 49.74417 14.82046 PJ075 4.22025 94783.81 9.896996 44.47683 41.83723 14.01878 PJ075A 4.330275 97989.92 9.939599 45.68053 40.20256 14.49743 PJ076 4.227674 96017.1 9.472067 46.04659 35.83276 14.43364 PJ077 4.811203 104693.2 10.7576 51.23632 54.12732 15.44438 PJ078 4.381563 98569.13 10.26717 56.03939 51.20444 15.00325 PJ079 4.203952 93442.11 9.7186 49.22115 44.72996 14.04381 PJ080 4.541835 103670.3 10.72278 53.73403 45.74608 15.66576 PJ081 5.921238 90194.59 9.573667 55.7735 46.50764 13.7744
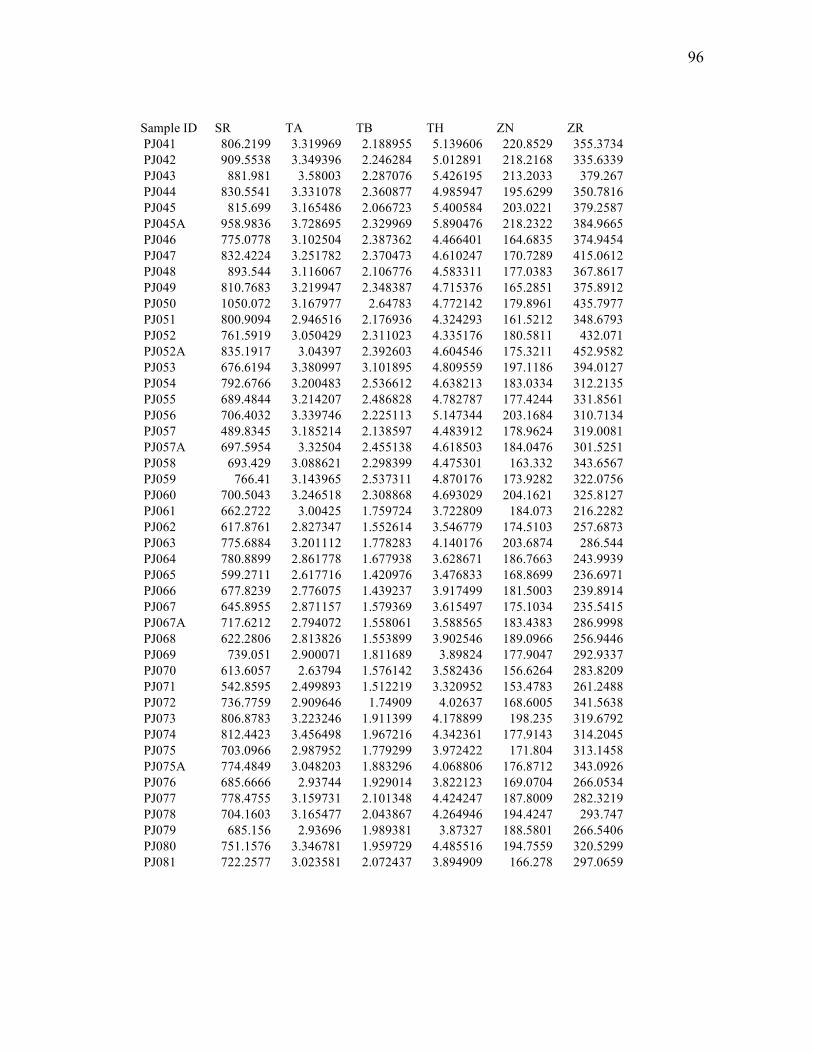
96
Sample ID SR TA TB TH ZN ZR PJ041 806.2199 3.319969 2.188955 5.139606 220.8529 355.3734 PJ042 909.5538 3.349396 2.246284 5.012891 218.2168 335.6339 PJ043 881.981 3.58003 2.287076 5.426195 213.2033 379.267 PJ044 830.5541 3.331078 2.360877 4.985947 195.6299 350.7816 PJ045 815.699 3.165486 2.066723 5.400584 203.0221 379.2587 PJ045A 958.9836 3.728695 2.329969 5.890476 218.2322 384.9665 PJ046 775.0778 3.102504 2.387362 4.466401 164.6835 374.9454 PJ047 832.4224 3.251782 2.370473 4.610247 170.7289 415.0612 PJ048 893.544 3.116067 2.106776 4.583311 177.0383 367.8617 PJ049 810.7683 3.219947 2.348387 4.715376 165.2851 375.8912 PJ050 1050.072 3.167977 2.64783 4.772142 179.8961 435.7977 PJ051 800.9094 2.946516 2.176936 4.324293 161.5212 348.6793 PJ052 761.5919 3.050429 2.311023 4.335176 180.5811 432.071 PJ052A 835.1917 3.04397 2.392603 4.604546 175.3211 452.9582 PJ053 676.6194 3.380997 3.101895 4.809559 197.1186 394.0127 PJ054 792.6766 3.200483 2.536612 4.638213 183.0334 312.2135 PJ055 689.4844 3.214207 2.486828 4.782787 177.4244 331.8561 PJ056 706.4032 3.339746 2.225113 5.147344 203.1684 310.7134 PJ057 489.8345 3.185214 2.138597 4.483912 178.9624 319.0081 PJ057A 697.5954 3.32504 2.455138 4.618503 184.0476 301.5251 PJ058 693.429 3.088621 2.298399 4.475301 163.332 343.6567 PJ059 766.41 3.143965 2.537311 4.870176 173.9282 322.0756 PJ060 700.5043 3.246518 2.308868 4.693029 204.1621 325.8127 PJ061 662.2722 3.00425 1.759724 3.722809 184.073 216.2282 PJ062 617.8761 2.827347 1.552614 3.546779 174.5103 257.6873 PJ063 775.6884 3.201112 1.778283 4.140176 203.6874 286.544 PJ064 780.8899 2.861778 1.677938 3.628671 186.7663 243.9939 PJ065 599.2711 2.617716 1.420976 3.476833 168.8699 236.6971 PJ066 677.8239 2.776075 1.439237 3.917499 181.5003 239.8914 PJ067 645.8955 2.871157 1.579369 3.615497 175.1034 235.5415 PJ067A 717.6212 2.794072 1.558061 3.588565 183.4383 286.9998 PJ068 622.2806 2.813826 1.553899 3.902546 189.0966 256.9446 PJ069 739.051 2.900071 1.811689 3.89824 177.9047 292.9337 PJ070 613.6057 2.63794 1.576142 3.582436 156.6264 283.8209 PJ071 542.8595 2.499893 1.512219 3.320952 153.4783 261.2488 PJ072 736.7759 2.909646 1.74909 4.02637 168.6005 341.5638 PJ073 806.8783 3.223246 1.911399 4.178899 198.235 319.6792 PJ074 812.4423 3.456498 1.967216 4.342361 177.9143 314.2045 PJ075 703.0966 2.987952 1.779299 3.972422 171.804 313.1458 PJ075A 774.4849 3.048203 1.883296 4.068806 176.8712 343.0926 PJ076 685.6666 2.93744 1.929014 3.822123 169.0704 266.0534 PJ077 778.4755 3.159731 2.101348 4.424247 187.8009 282.3219 PJ078 704.1603 3.165477 2.043867 4.264946 194.4247 293.747 PJ079 685.156 2.93696 1.989381 3.87327 188.5801 266.5406 PJ080 751.1576 3.346781 1.959729 4.485516 194.7559 320.5299 PJ081 722.2577 3.023581 2.072437 3.894909 166.278 297.0659

97
Sample ID Quarry AL DY MG MN PJ082 Tataga-matau 87404.2 9.217237 7705.673 1421.714 PJ082A Tataga-matau 85706.84 10.18171 8078.75 1422.832 PJ083 Tataga-matau 85415.31 10.78941 8272.821 1428.157 PJ084 Tataga-matau 86722.56 10.55731 7600.147 1446.728 PJ085 Tataga-matau 90131.59 9.843244 7667.241 1577.423 PJ086 Tataga-matau 86828.3 10.07465 8031.604 1469.787 PJ087 Tataga-matau 89948.78 11.29526 8435.183 1411.415 PJ087A Tataga-matau 85833.27 9.829774 8830.174 1451.317 PJ088 Tataga-matau 87638.84 10.76591 8205.239 1464.584 PJ089 Tataga-matau 87882.69 9.983201 8599.488 1479.028 PJ090 Tataga-matau 88016.64 11.06241 8239.821 1523.943 PJ121 Alega 88314.99 9.943774 7262.306 1298.458 PJ122 Alega 95610.73 11.80233 7787.41 1369.068 PJ123 Alega 88526.84 10.40001 7844.795 1358.158 PJ124 Alega 88808.81 11.72633 6919.092 1419.517 PJ125 Alega 85101.75 10.51945 7396.427 1342.957 PJ126 Alega 86024.13 10.21914 6904.727 1316.23 PJ127 Alega 87751.34 10.22266 7453.518 1416.268 PJ127A Alega 86529.21 11.24408 7375.039 1413.067 PJ128 Alega 87169.65 10.16363 7256.332 1339.542 PJ129 Alega 93880.3 11.03002 8161.806 1343.889 PJ130 Alega 89680.63 11.15208 8290.478 1420.599 PJ131 Alega 94981.34 11.61259 8273.968 1398.812 PJ132 Alega 92042.88 11.40056 8770.895 1470.337 PJ133 Alega 92336.49 11.67792 7627.841 1394.424 PJ134 Alega 94023.21 11.47258 8560.734 1491.504 PJ135 Alega 89320.3 13.16629 6803.526 1305.576 PJ135A Alega 89002.58 11.42764 7704.551 1323.073 PJ136 Alega 89573.07 11.66322 7620.05 1511.93 PJ137 Alega 89565.19 11.37716 6890.715 1276.459 PJ138 Alega 90698.49 11.50528 7386.517 1624.998 PJ139 Alega 88103.69 9.941649 7154.08 1272.827 PJ140 Alega 90394.93 12.80916 7399.984 1343.086 PJ141 Alega 88659.9 10.6956 7757 1415.502 PJ142 Alega 88511.73 12.14873 7358.55 1321.022 PJ142A Alega 89139.84 12.25578 7730.74 1467.461 PJ143 Alega 87076.74 12.04629 6709.498 1296.741 PJ144 Alega 87264.23 10.98996 7462.852 1406.964 PJ145 Alega 90323.38 11.11863 7312.353 1361.109 PJ146 Alega 88443.59 11.82853 7656.521 1471.542 PJ147 Alega 88814.11 11.36365 6801.233 1396.427 PJ147A Alega 90260.13 11.03108 7843.463 1492.7 PJ148 Alega 91062.29 11.46646 7504.435 1400.571 PJ149 Alega 92610.74 12.40679 7396.205 1316.908 PJ150 Alega 92407.36 11.88924 7549.769 1425.39

98
Sample ID TI V LA LU NA SM PJ082 20663.91 233.5496 40.58016 0.3705439 29741.72 13.42944 PJ082A 20785.51 235.0383 38.51662 0.3349193 28041.37 12.59373 PJ083 22271.5 235.6648 39.35376 0.3600995 26243.34 12.41156 PJ084 21070.53 235.0274 41.99007 0.4045187 28018.85 13.26362 PJ085 22499.99 231.0926 39.81864 0.3944757 27157.87 12.64572 PJ086 20964.46 223.2053 42.04315 0.3877606 26810.98 13.55968 PJ087 21861.13 240.1296 40.10366 0.3851629 25686.65 12.86787 PJ087A 21530.75 226.7193 39.96626 0.3540632 25599.71 12.51399 PJ088 21460.35 234.0149 40.14381 0.3824475 25854.18 12.90019 PJ089 20925.75 240.7761 42.07108 0.4028022 27579.44 12.9638 PJ090 21814.18 238.3129 39.69025 0.3698358 26991.47 13.11213 PJ121 21028.96 210.7318 50.7921 0.4863977 30989.34 17.26819 PJ122 23060.69 231.3521 53.81631 0.5104916 23794.18 19.00446 PJ123 18866.55 193.7261 48.46206 0.4921339 30161.39 16.99189 PJ124 20699.46 203.8573 46.27272 0.420145 26347.71 15.5141 PJ125 19285.13 198.6015 46.1413 0.4164513 28390.15 15.52899 PJ126 19338.07 194.3692 45.31361 0.4117357 27456.41 15.44755 PJ127 19875.24 211.05 45.21473 0.455856 27277.32 15.28212 PJ127A 19322.82 200.0674 47.47202 0.4724179 28759.72 17.00613 PJ128 20523.64 205.692 48.3332 0.4687716 28585.64 16.19559 PJ129 20660.61 208.7995 47.75814 0.476035 29103.72 15.80474 PJ130 20283.55 217.3921 50.42529 0.478141 31396.52 17.20703 PJ131 20452.33 219.7269 47.76506 0.4392646 27292.44 15.70952 PJ132 20748.43 211.0251 44.98391 0.4430532 27850.07 14.80551 PJ133 18859.01 206.0767 43.7933 0.4628148 25606.53 13.54367 PJ134 20599.91 221.8493 39.78457 0.383986 25617.59 12.97654 PJ135 18345.84 192.5502 49.58316 0.4500678 27929.05 16.13224 PJ135A 19232.8 200.4239 42.26876 0.4062194 26514.26 13.76732 PJ136 20612.39 213.6825 42.88699 0.4301684 27972.48 13.66194 PJ137 19855.16 220.7686 42.95404 0.3907521 26111.83 14.2394 PJ138 20274.53 219.9082 46.83146 0.4524244 25774.19 14.99084 PJ139 20397.27 221.7509 43.98143 0.4396277 27224.14 14.07958 PJ140 20051.73 213.5027 48.97282 0.4497339 25701.96 15.23248 PJ141 21196.03 209.6862 45.10997 0.4252483 27312.21 14.33818 PJ142 19709.01 207.3625 46.25856 0.4572251 28291.98 14.91046 PJ142A 20360.54 233.2148 48.43875 0.4834167 27711.68 15.59648 PJ143 19636.32 206.0507 45.92916 0.4803697 27811.62 14.98665 PJ144 19821.66 207.6918 43.35161 0.4139585 27297.04 13.71457 PJ145 18352.82 197.1125 43.88676 0.4278259 27511.09 14.03992 PJ146 19104.38 208.6429 45.23391 0.4080783 27316.61 15.01973 PJ147 19100.51 214.8916 43.27847 0.4143918 26689.85 14.02572 PJ147A 19866.73 216.4336 45.78644 0.4292707 28785.31 14.9166 PJ148 21020 226.3549 44.70272 0.420212 27972.39 14.67155 PJ149 19938.88 212.7645 44.02173 0.3850181 26138.52 13.23792 PJ150 20731.92 223.1234 44.75423 0.418811 27175.32 14.69461
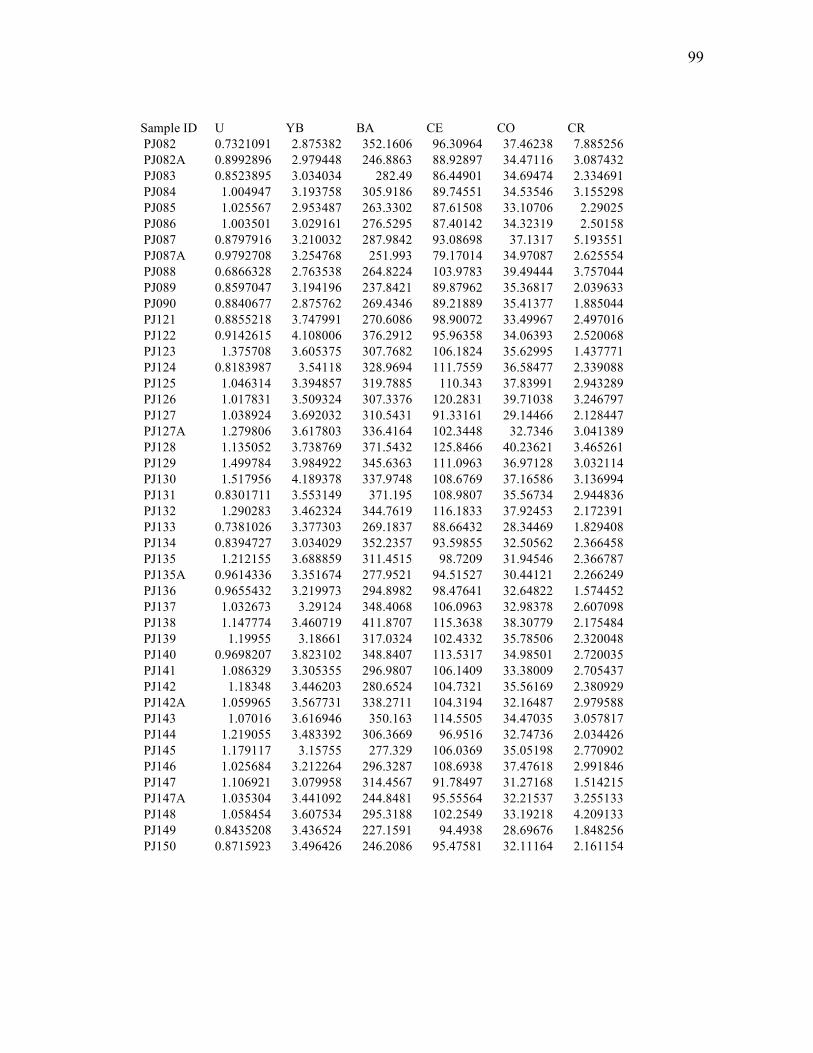
99
Sample ID U YB BA CE CO CR PJ082 0.7321091 2.875382 352.1606 96.30964 37.46238 7.885256 PJ082A 0.8992896 2.979448 246.8863 88.92897 34.47116 3.087432 PJ083 0.8523895 3.034034 282.49 86.44901 34.69474 2.334691 PJ084 1.004947 3.193758 305.9186 89.74551 34.53546 3.155298 PJ085 1.025567 2.953487 263.3302 87.61508 33.10706 2.29025 PJ086 1.003501 3.029161 276.5295 87.40142 34.32319 2.50158 PJ087 0.8797916 3.210032 287.9842 93.08698 37.1317 5.193551 PJ087A 0.9792708 3.254768 251.993 79.17014 34.97087 2.625554 PJ088 0.6866328 2.763538 264.8224 103.9783 39.49444 3.757044 PJ089 0.8597047 3.194196 237.8421 89.87962 35.36817 2.039633 PJ090 0.8840677 2.875762 269.4346 89.21889 35.41377 1.885044 PJ121 0.8855218 3.747991 270.6086 98.90072 33.49967 2.497016 PJ122 0.9142615 4.108006 376.2912 95.96358 34.06393 2.520068 PJ123 1.375708 3.605375 307.7682 106.1824 35.62995 1.437771 PJ124 0.8183987 3.54118 328.9694 111.7559 36.58477 2.339088 PJ125 1.046314 3.394857 319.7885 110.343 37.83991 2.943289 PJ126 1.017831 3.509324 307.3376 120.2831 39.71038 3.246797 PJ127 1.038924 3.692032 310.5431 91.33161 29.14466 2.128447 PJ127A 1.279806 3.617803 336.4164 102.3448 32.7346 3.041389 PJ128 1.135052 3.738769 371.5432 125.8466 40.23621 3.465261 PJ129 1.499784 3.984922 345.6363 111.0963 36.97128 3.032114 PJ130 1.517956 4.189378 337.9748 108.6769 37.16586 3.136994 PJ131 0.8301711 3.553149 371.195 108.9807 35.56734 2.944836 PJ132 1.290283 3.462324 344.7619 116.1833 37.92453 2.172391 PJ133 0.7381026 3.377303 269.1837 88.66432 28.34469 1.829408 PJ134 0.8394727 3.034029 352.2357 93.59855 32.50562 2.366458 PJ135 1.212155 3.688859 311.4515 98.7209 31.94546 2.366787 PJ135A 0.9614336 3.351674 277.9521 94.51527 30.44121 2.266249 PJ136 0.9655432 3.219973 294.8982 98.47641 32.64822 1.574452 PJ137 1.032673 3.29124 348.4068 106.0963 32.98378 2.607098 PJ138 1.147774 3.460719 411.8707 115.3638 38.30779 2.175484 PJ139 1.19955 3.18661 317.0324 102.4332 35.78506 2.320048 PJ140 0.9698207 3.823102 348.8407 113.5317 34.98501 2.720035 PJ141 1.086329 3.305355 296.9807 106.1409 33.38009 2.705437 PJ142 1.18348 3.446203 280.6524 104.7321 35.56169 2.380929 PJ142A 1.059965 3.567731 338.2711 104.3194 32.16487 2.979588 PJ143 1.07016 3.616946 350.163 114.5505 34.47035 3.057817 PJ144 1.219055 3.483392 306.3669 96.9516 32.74736 2.034426 PJ145 1.179117 3.15755 277.329 106.0369 35.05198 2.770902 PJ146 1.025684 3.212264 296.3287 108.6938 37.47618 2.991846 PJ147 1.106921 3.079958 314.4567 91.78497 31.27168 1.514215 PJ147A 1.035304 3.441092 244.8481 95.55564 32.21537 3.255133 PJ148 1.058454 3.607534 295.3188 102.2549 33.19218 4.209133 PJ149 0.8435208 3.436524 227.1591 94.4938 28.69676 1.848256 PJ150 0.8715923 3.496426 246.2086 95.47581 32.11164 2.161154

100
Sample ID EU FE HF ND RB SC PJ082 4.411187 101085 10.20284 55.67623 40.39067 15.15287 PJ082A 4.100994 93170.31 9.865206 43.1925 41.09492 14.04147 PJ083 4.068747 89417.74 9.17618 44.567 41.39154 13.66453 PJ084 4.159359 92472.6 9.675934 45.18781 39.39655 14.0577 PJ085 4.102709 91565.17 9.195019 44.41341 43.19376 13.6646 PJ086 4.205273 90999.76 9.705897 43.56393 46.16043 13.8303 PJ087 4.345838 91868.48 9.815265 46.54012 43.11627 14.80343 PJ087A 3.951962 87585.55 8.881138 40.0836 34.48122 13.35755 PJ088 4.58115 104996.3 10.65964 57.57285 46.54438 15.9031 PJ089 4.125552 94794.88 9.746565 43.23426 37.8026 14.17589 PJ090 4.242902 94565.04 9.424513 44.91197 38.37645 14.31991 PJ121 4.763742 97389.72 11.05211 50.22736 41.00497 14.37329 PJ122 5.058486 99986.03 11.67341 61.06322 26.45251 14.84263 PJ123 4.898512 94007.45 11.43723 52.91797 38.01207 14.67705 PJ124 5.553305 102712.5 12.10022 60.576 47.70156 15.09507 PJ125 5.144618 100009.2 12.21764 50.86993 51.21816 15.03175 PJ126 5.346776 106652.6 13.25968 54.27797 63.03625 16.19737 PJ127 4.276951 89232.05 10.0784 44.20967 43.64625 12.71108 PJ127A 4.905918 95595.54 11.7892 54.34954 51.24763 14.27785 PJ128 5.654476 109843 13.72745 63.19104 59.29035 16.80075 PJ129 5.129588 97674.16 12.10837 56.41333 56.53056 15.34284 PJ130 5.076052 98692.92 11.89704 54.52946 48.30863 15.09876 PJ131 5.433002 107778.7 12.29574 60.91522 35.299 16.11784 PJ132 5.170368 103533.3 12.43332 58.92274 49.10997 15.82525 PJ133 4.709099 85752.38 10.08642 47.44442 26.68159 12.91398 PJ134 4.807634 93518.02 9.609975 50.87011 30.01369 13.96797 PJ135 5.099886 94604.24 11.25895 55.06672 44.369 14.31098 PJ135A 4.72504 91919.02 10.66475 49.60152 43.40255 13.7268 PJ136 4.581142 91007.02 10.47154 49.80609 39.61334 13.63767 PJ137 5.109625 105685 11.9361 54.8045 46.25368 15.02755 PJ138 5.283592 110019.9 12.85418 60.40204 54.8296 16.12008 PJ139 4.760349 92865.13 11.10845 49.29718 42.95347 14.16765 PJ140 5.897103 105665.8 12.55457 63.69432 50.82826 15.5833 PJ141 4.838075 94463.89 11.65102 52.43936 40.25995 14.45371 PJ142 4.839565 94672.39 11.23852 53.14968 41.15136 14.51995 PJ142A 5.290573 95881.93 11.48059 55.74044 45.45015 14.24043 PJ143 5.350273 105023.6 12.56605 58.76413 41.91144 15.7895 PJ144 4.554776 91734.56 10.7092 49.01288 41.59827 13.4709 PJ145 4.788359 92933.96 12.10522 55.04622 50.68682 14.09061 PJ146 4.758414 103661.4 12.15341 59.39255 57.15079 14.81145 PJ147 4.207998 83337.26 10.27274 49.41504 43.06627 12.79657 PJ147A 4.431223 88354.78 10.48357 52.66306 38.04028 13.40668 PJ148 4.65112 92154.52 11.08349 49.92422 41.85868 14.12197 PJ149 4.386492 84569.76 10.33011 46.04824 41.98318 12.90815 PJ150 4.492709 88814.28 10.62208 46.88955 31.93903 13.42213

101
Sample ID SR TA TB TH ZN ZR PJ082 689.688 3.118952 1.94226 4.140827 171.3212 338.1967 PJ082A 687.106 2.860832 1.918756 4.065444 167.6783 289.9351 PJ083 672.9158 2.831524 1.674461 3.776485 171.8522 282.5847 PJ084 735.9168 2.995622 1.720578 4.017715 177.2799 308.1455 PJ085 749.3313 2.891352 1.671511 3.888546 161.6936 261.6291 PJ086 710.1086 2.976958 1.602547 3.860816 170.5805 270.6697 PJ087 709.6741 2.94413 1.649676 3.935031 201.452 265.12 PJ087A 604.2771 2.829702 1.52116 3.608798 162.6864 242.9931 PJ088 807.5617 3.133382 2.21309 4.508087 206.0729 343.4503 PJ089 709.5696 2.892962 1.950043 3.83858 173.1672 366.7541 PJ090 757.3859 2.919303 1.887033 3.850053 178.1158 347.1128 PJ121 711.3997 3.267442 1.847015 4.309876 192.0369 286.803 PJ122 580.9619 3.432978 2.045113 4.707655 208.4891 262.2788 PJ123 677.575 3.359388 1.857378 4.56999 208.1025 308.5157 PJ124 744.8937 3.535417 2.404144 4.85963 198.6671 288.4327 PJ125 799.1101 3.731266 2.308465 5.083469 221.3044 279.0087 PJ126 937.924 4.068764 2.572441 5.531702 247.732 318.7638 PJ127 560.6274 2.818434 1.574751 3.974339 166.2875 253.7475 PJ127A 738.2283 3.477974 1.895579 4.867022 186.3684 314.8177 PJ128 921.4312 4.182253 2.677063 5.752234 241.1321 318.9949 PJ129 817.9897 3.923063 2.089823 5.076898 208.3444 373.1909 PJ130 810.0385 3.843524 2.091368 5.045773 198.178 347.5218 PJ131 763.1985 4.078207 2.201805 5.123773 209.5492 349.9507 PJ132 833.8903 3.89687 2.045101 5.206318 216.8203 387.8296 PJ133 614.4006 2.906354 1.678466 4.000632 161.9359 314.1207 PJ134 637.7806 3.041195 1.790425 3.663849 181.4578 318.8604 PJ135 656.7077 3.507415 2.066314 4.70954 185.2022 349.1894 PJ135A 591.6719 3.075157 1.775808 4.307975 177.3844 323.3535 PJ136 694.1618 3.22007 1.846749 4.290165 185.0941 301.9459 PJ137 725.4721 3.459033 1.928034 4.797534 183.0027 372.2328 PJ138 778.189 3.685926 2.184472 5.153151 218.1607 422.0977 PJ139 699.1853 3.347195 1.89469 4.510113 169.2659 348.0428 PJ140 772.4261 3.621115 2.372698 5.088153 200.1936 388.3006 PJ141 728.8725 3.37256 1.943103 4.5969 188.8418 406.0256 PJ142 682.7491 3.339104 1.939852 4.475003 182.1768 325.943 PJ142A 747.5931 3.380032 2.01311 4.626992 181.5904 369.4409 PJ143 856.6198 3.777182 2.333928 5.10626 203.0878 427.5017 PJ144 709.3121 3.235043 1.823522 4.257861 172.3624 357.559 PJ145 656.2963 3.432589 1.912205 4.955027 169.8594 369.5132 PJ146 705.3847 3.536377 2.052712 4.892393 191.3826 393.4021 PJ147 634.8204 3.095261 1.859618 4.170311 193.8753 372.8733 PJ147A 661.8589 3.058413 2.115752 4.17891 181.4154 367.4465 PJ148 721.7163 3.263614 2.175238 4.608328 185.2543 330.7762 PJ149 671.0117 3.004881 2.067111 4.182104 159.2235 295.043 PJ150 697.329 3.160273 2.099188 4.187464 174.1013 264.0578

102
VITA
Name: Phillip Ray Johnson II
Address: Department of Anthropology Texas A&M University 234 Anthropology Building College Station TX 77843-4352
Email Address: [email protected] Education: B.A., Classics and Political Science Double Major,
University of Kentucky, 1998 M.A., Anthropology, Texas A&M University, 2005