inside the grain & oilseed markets - … · inside the grain & oilseed markets . 100 acker...
TRANSCRIPT
by Trey Morris
1.800.800.3840
INSIDE THE GRAIN & OILSEED MARKETS
100 South Wacker Drive, Suite 1225 Chicago, IL 60606+1.800.800.3840
[email protected] www.danielstrading.com
2
Turner Breakout Reversal (TBR)Inside the Grain and Oilseed Markets by Trey Morris
Table of Contents
Part 1: The Markets that Spawned an IndustryThe Beginning of Grain FuturesGrowthArrival of the SpectatorIntro of New ContractsWhere We are Today
Part 2: The Great Influence of Mother NatureWeather ReportsThe Timing of Temperature and MoistureWeather from a Global PerspectiveThe Big Picture
Part 3: The Big ThreeCornSoybeansWheat
Part 4: The Outsiders Part 5: The Foriegn AffectExports and Production
Part 6: Making Sense of Crop ReportsThe USDA and their SignificanceImportance of Public Crop Reports
Part 7: Cash Grain Market SnapshotCountry ElevatorProducer SellingBasisFrom Farm to Plate
Bio
Disclosure
44
4
5
5
5
66
6
8
9
1010
14
18
23
2424
2829
29
3131313232
33
34
GRAIN MARKET SNAPSHOTReceive the Grain Market Snapshot Newsletter Free for 30 DaysRemain sharp as Trey Morris keeps your headin the game while reducing information overload!
CLICK HERE TO RECIEVE YOUR FREE NEWSLETTER
100 South Wacker Drive, Suite 1225 Chicago, IL 60606+1.800.800.3840
[email protected] www.danielstrading.com
4
Turner Breakout Reversal (TBR)Inside the Grain and Oilseed Markets by Trey Morris
PART ONE: THE MARKETS THAT SPAWNED AN INDUSTRY
It is always important to have a solid understanding of any market’s unique specifications and its fundamentals before deciding to trade the specific market. However, what is also important, and often gets overlooked, is the specific market’s origin. One key benefit to this information is the added comfort that the trader will gain prior to participating in that market.
In this series, “Inside the Grain and Oilseed markets: a Six Part Series”, I will be discussing the ins and outs of these two major markets. To start us off, we will need to know how this particularly important sector of the commodity markets came to be. So, let’s take a brief look at how it all began.
The Beginning of Grain FuturesBefore the system of grain trading we know today, grain was traded by farmers in a less efficient, more risk exposed manner. Prior to the establishment of the Chicago Board of Trade (CBOT), farm-ers were at the mercy of the market. When harvest time rolled around for farmers in the Midwest and they wanted to sell their grain (mainly wheat and corn), prices were typically low due to the ample supply in the market. Accordingly, when farmers needed to buy grain to plant during growing season, prices were high due to the scarcity of grain that time of year. Both situations caused chaos, sometimes even prompting farmers to burn their grain for fuel instead of selling it for a low price and paying transportation costs.
It was not until April 3, 1848 when 83 individuals, consisting of merchants, businessmen, urban pioneers, industrial visionaries, and other entrepreneurs, established the Chicago Board of Trade. The Board of Trade was established for the purpose of bringing to order the tumultuous Midwestern grain markets. The board allowed farmers to purchase what were known as “futures contracts”. This allowed the farmer to manage his risk against unpredictable price fluctuations in the market. Farmers were now able to protect themselves from paying too much and selling for too little.
GrowthAt first, trading was slow due to the limited accessibility to certain markets via the CBOT. Tables turned when the Illinois and Michigan canals opened and allowed access from the Great Lakes to the Mississippi River, opening up new markets accessibility. In 1850, Chicago became the international headquarters for agricultural commodities. It was also self-regulated, meaning that all disputes and conflicts were handled in-house by “gentlemen’s rules”. By the end of the 1850’s, the CBOT intro-duced a new grain grading system that allowed the markets to run more smoothly. The old system inspected a farmer’s grain many times during the selling process. This was to ensure that cleanliness and quality was up to par. The new system allowed grain to be graded one time before storage, which

100 South Wacker Drive, Suite 1225 Chicago, IL 60606+1.800.800.3840
[email protected] www.danielstrading.com
5
Turner Breakout Reversal (TBR)Inside the Grain and Oilseed Markets by Trey Morris
was then placed in a bin with only grain of the same quality. Once sold, the farmer was issued a receipt for the amount of grain sold and its quality. This process also allowed for larger volumes of grain to be traded.
Arrival of the SpeculatorWith the increased volume brought about by the new grading system, the CBOT noticed one major issue that needed to be solved. At times, the market would find itself with more buyers than sellers, or with more demand in the market with no one to meet it. This allowed an opportunity for entrepre-neurs to take their own money and act as both the buyer and seller with the hope of making money off the movement in price. The introduction of “market speculators” corrected this imbalance and provided critical market liquidity. These individuals would often get in and get out of trades hundreds of times a day just trying to profit from small moves in the market.
Introduction of New ContractsAfter a near halt in trading at the CBOT during the World Wars, corn and wheat contracts had come under government control, denying speculative interest. The only markets that were allowed to be traded were rye and soybeans. Soybean futures trading arrived at the CBOT in 1936 and grew to be one of the CBOT’s most actively traded commodities. By 1950, soybean oil and soybean meal contracts were added. Later on down the road, the CBOT added its first non-grain commodity, iced broilers, which are no longer traded. Next in line were plywood and silver. By 1981, the CBOT had introduced all metals, currencies, bonds, energies, and even stock indices.
Where We Are TodayThe grain and oilseed markets are more heavily traded today than ever before. New interest and more uses for wheat, corn, and soybeans have increased the popularity of these markets. Even though the majority of contacts are now traded electronically, the grain markets are still traded on the same fundamental purpose: to manage risk and to provide market liquidity.
There will always be a need for futures trading. Above all, grains pioneered an important marketplace for risk management that is necessary for everyday economic efficiency.

100 South Wacker Drive, Suite 1225 Chicago, IL 60606+1.800.800.3840
[email protected] www.danielstrading.com
6
Turner Breakout Reversal (TBR)Inside the Grain and Oilseed Markets by Trey Morris
PART TWO: THE GREAT INFLUENCE OF MOTHER NATURE
Weather affects all facets of life. It influences our daily activities, what we wear, how we feel, and sometimes even where we choose to live our lives. It is true that without the elements produced by Mother Nature herself, life on Earth would be non-existent. Obviously plant life, especially row crop agriculture, is highly dependent on what the weather will deliver each growing season.
Traders, producers, and end-users rely on a variety of weather resources year around. These sources help them determine the future price of corn, wheat, and soybeans.In this segment of “Inside the Grain and Oilseed Markets”, we will explore these different resources and find out exactly how these individuals use this information to their benefit. Also, we will pick apart how certain weather events at certain times can affect the crops and their prices.
Weather ReportsAlthough sometimes questioned on their accuracy, meteorologists are the main resource in predict-ing what the weather is doing or may do in the future. If it were not for these individuals and their analysis, weather could hardly be a factor in determining the future prices of each crop.
Throughout growing season, traders and producers will hone in on daily weather forecasts. There are morning, midday, and afternoon weather updates that are released by various weather groups which focus specifically on how the weather will affect crops (this information is provided directly to Daniels Trading clients). Many local and national meteorologists report crop weather. It is wise to choose 3 to 5 different resources and compare notes. Many times their forecasts will differ in specif-ics, but together their forecasts will paint a broad picture that is similar in nature. If you focus on one resource, it does not mean that the rest of the market is doing the same thing. Remember to be diverse and produce your own conclusion after comparing notes. This will be very helpful in trying to put together a hedge strategy or trade. Keep tabs on weather year round, as “off-season” weather will have an effect on the next year’s conditions, i.e. sub-soil moisture.
The Timing of Temperature and MoistureWhen and where weather events take place has the most direct influence on what the condition of the crop will be at harvest time. Weather extremes (too hot/too cold or too wet/too dry) at certain times of the year will affect the crop condition and thus the price. How much of an effect the weather has on prices always depends on supply. A tight supply will make the market more sensitive to weather just as an ample supply will make the market less sensitive to weather. To simplify this, we will explore what may happen during growing season and how these different factors will affect crops and their prices. For the purpose of these examples, consider normal stocks and normal demand. We are only focusing on how domestic weather alone can move the market while ignoring other funda-mentals. Since corn and soybeans have a different planting and harvest time than Chicago wheat, we will look at two different examples.
100 South Wacker Drive, Suite 1225 Chicago, IL 60606+1.800.800.3840
[email protected] www.danielstrading.com
7
Turner Breakout Reversal (TBR)Inside the Grain and Oilseed Markets by Trey Morris
Example 1: Corn and Soybeans:
It is spring and farmers across the Corn Belt are ready to begin planting. The weather has been wet and has them pacing back and forth waiting for conditions to improve. Over the next three months, farmers are able to get their crop in the ground; however, this timing makes farmers a bit uncomfort-able. Meanwhile, grain traders are becoming bullish. From what they know right now, a late planted crop means that a younger plant is more likely to stress mid-summer than a more mature plant which was planted earlier. If the summer is hotter than average, this could mean trouble. This also means that harvest comes later and that frost is more of a threat to the crop later down the road. Traders begin to buy corn and soybeans due to these concerns.
It is now summer and the weather is hot and rain is limited. As if farmers were not already worried about planting late, now the extreme weather conditions are stressing their crops. Traders start to notice that the price pattern is becoming more bullish. The hot weather in the middle of growing season tells the farmers that crop pollination is being affected in a negative way and that a stressed crop could have difficultly producing top yields. This supports the market, and traders extend their bullish position on fears that harvest will show poor yields and low new crop stocks.
It is now early fall in the Midwest. So far, farmers do not like what they see. All season long they have watched their crops suffer due to extreme conditions. Although conditions have been extreme, there is still a crop in the field to be harvested but yields could be sub-par. The summer has been hot and dry, but the weather starts to change rapidly. There is now a threat of frost in the Midwest which could destroy a majority of the later planted crops. Traders have been buying corn and soybeans all growing season with expectations being confirmed by USDA crop reports. With news of frost, traders again add to their long positions. In their minds with the late-planted crop, extreme mid-summer conditions, and a less mature crop being exposed to frost, production could be poor at the end of harvest.
Conclusion
The traders’ expectations were confirmed, and ending stocks for corn and soybeans were both at all-time lows, sending the price even higher after growing season. For an example of good growing conditions that would push prices lower, basically reverse the conditions in the example above.
Example 2 (Chicago Soft Red Winter Wheat)
* Note: We are using Chicago wheat in this series because of its liquidity
It is fall, and farmers are ready to start planting wheat. Dry conditions are plaguing the region and there is little moisture in the soil to get the wheat off to a good start. Farmers plant their crop and pray for rain. Traders are talking with wheat producers that they know and are reading commentary about wheat. They are coming to a conclusion that things are a bit dry and wheat may have trouble getting off to a good start. They now begin buying wheat.

100 South Wacker Drive, Suite 1225 Chicago, IL 60606+1.800.800.3840
[email protected] www.danielstrading.com
8
Turner Breakout Reversal (TBR)Inside the Grain and Oilseed Markets by Trey Morris
The wheat crop finally gets out of the ground but it is small going into winter. All winter long the crop remains dormant until spring.
Spring finally arrives and wheat comes out of dormancy. Over the winter, wheat growing areas were abnormally dry, causing limited sub-soil moisture for wheat. Rains also remain sparse throughout spring into the beginning of summer. Traders have been paying attention to the weather and USDA reports all winter long, and due to the dry conditions have been buying the wheat market.
Conclusion
The traders’ expectations were confirmed as wheat yields hit all-time lows. The dry weather all throughout growing season produced a poor crop and prices moved steadily higher due to this factor. For an example of good growing conditions that would push prices lower, replace the above factors with adequate moisture at planting time, moderate spring time rains, and dry weather during harvest.
Weather from a Global PerspectiveWeather in other countries affects the way their crops grow just like it does in the U.S. Two things that are important to know are when these crops are grown and how weather conditions, good or bad, can affect the price of these commodities here at home.
Over the years, South America has evolved into a major corn and soybean producer. Because of this new involvement, traders must now pay attention to the weather during South America’s growing season. When it is fall and winter here at home, it is spring and summer in South America. Argentina and Brazil are the two main growing regions of the continent. Take a look at these growing season dates:
Note: The growing seasons in both Argentina and Brazil have slightly different growing stages depending on region. The dates below reflect the earliest planted region with the latest harvested region.
ARGENTINA
Crops Planting Growing/Filling Maturing Harvest
Corn Oct - Dec Dec - Jan Feb-Mar Mar-May
Soybeans Sep - Dec Dec - Jan Jan - Feb Mar - Apr
BRAZIL
Crops Planting Growing/Filling Maturing Harvest
Soybeans Sep - Dec Dec -Feb Feb Mar
Corn Sep - Oct Nov - Jan Feb Feb - Apr
100 South Wacker Drive, Suite 1225 Chicago, IL 60606+1.800.800.3840
[email protected] www.danielstrading.com
9
Turner Breakout Reversal (TBR)Inside the Grain and Oilseed Markets by Trey Morris
If weather is cooperative during growing season, one would think that world stocks may increase, thus putting pressure on prices at home. If the weather did not cooperate, one would think that South America could possibly limit exports or raise prices, thus making the U.S. a more attractive market. If this occurred, prices at home would likely find support.
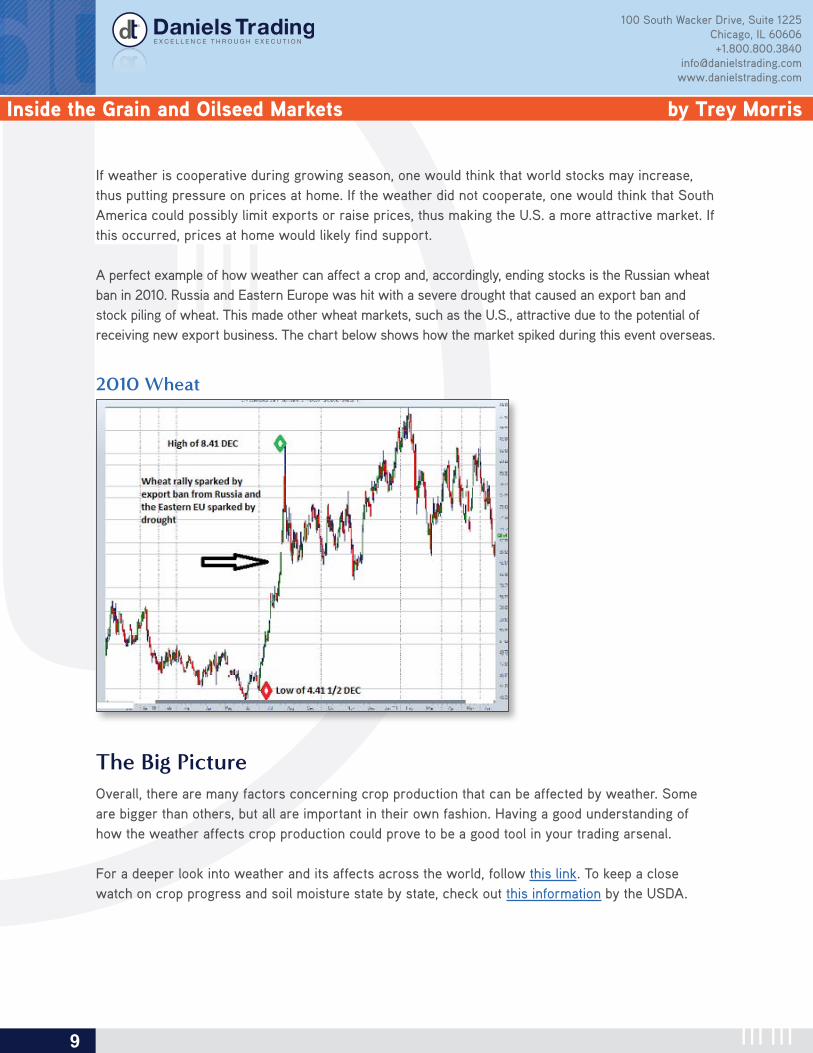
A perfect example of how weather can affect a crop and, accordingly, ending stocks is the Russian wheat ban in 2010. Russia and Eastern Europe was hit with a severe drought that caused an export ban and stock piling of wheat. This made other wheat markets, such as the U.S., attractive due to the potential of receiving new export business. The chart below shows how the market spiked during this event overseas.
2010 Wheat
The Big PictureOverall, there are many factors concerning crop production that can be affected by weather. Some are bigger than others, but all are important in their own fashion. Having a good understanding of how the weather affects crop production could prove to be a good tool in your trading arsenal.
For a deeper look into weather and its affects across the world, follow this link. To keep a close watch on crop progress and soil moisture state by state, check out this information by the USDA.
100 South Wacker Drive, Suite 1225 Chicago, IL 60606+1.800.800.3840
[email protected] www.danielstrading.com
10
Turner Breakout Reversal (TBR)Inside the Grain and Oilseed Markets by Trey Morris
PART THREE: THE BIG 3
When trading the corn, soybean, or wheat market, it is important to know the fundamental factors that determine their prices. Knowing how much is planted, when it is planted, how much is produced, the many uses of each market, and who buys the specific market are factors that have a great influence over price movement.
In this segment of “Inside the Grain and Oilseed Markets”, we will explore the definition of each factor and why they are important to everyday fundamental analysis.
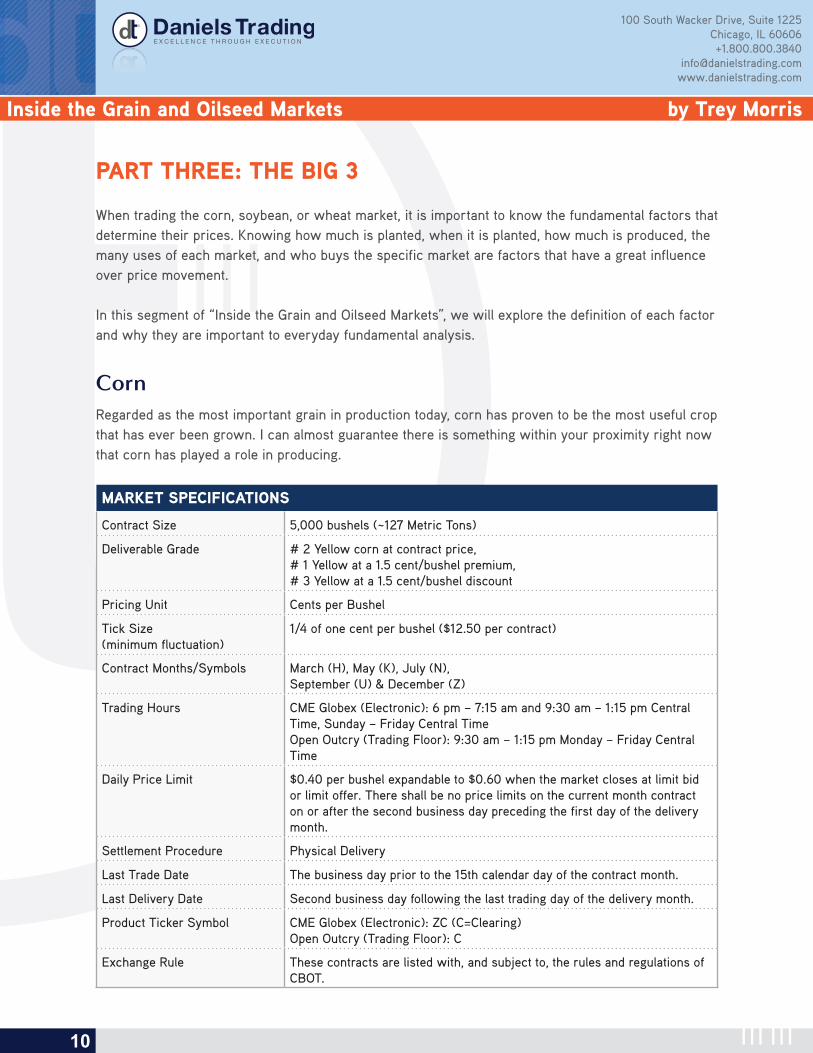
CornRegarded as the most important grain in production today, corn has proven to be the most useful crop that has ever been grown. I can almost guarantee there is something within your proximity right now that corn has played a role in producing.
MARKET SPECIFICATIONS
Contract Size 5,000 bushels (~127 Metric Tons)
Deliverable Grade # 2 Yellow corn at contract price, # 1 Yellow at a 1.5 cent/bushel premium, # 3 Yellow at a 1.5 cent/bushel discount
Pricing Unit Cents per Bushel
Tick Size(minimum fluctuation)
1/4 of one cent per bushel ($12.50 per contract)
Contract Months/Symbols March (H), May (K), July (N), September (U) & December (Z)
Trading Hours CME Globex (Electronic): 6 pm – 7:15 am and 9:30 am – 1:15 pm Central Time, Sunday – Friday Central TimeOpen Outcry (Trading Floor): 9:30 am – 1:15 pm Monday – Friday Central Time
Daily Price Limit $0.40 per bushel expandable to $0.60 when the market closes at limit bid or limit offer. There shall be no price limits on the current month contract on or after the second business day preceding the first day of the delivery month.
Settlement Procedure Physical Delivery
Last Trade Date The business day prior to the 15th calendar day of the contract month.
Last Delivery Date Second business day following the last trading day of the delivery month.
Product Ticker Symbol CME Globex (Electronic): ZC (C=Clearing)Open Outcry (Trading Floor): C
Exchange Rule These contracts are listed with, and subject to, the rules and regulations of CBOT.
100 South Wacker Drive, Suite 1225 Chicago, IL 60606+1.800.800.3840
[email protected] www.danielstrading.com
11
Turner Breakout Reversal (TBR)Inside the Grain and Oilseed Markets by Trey Morris
Acreage (Numbers based on yearly October USDA reports)
Of the three crops mentioned in this series, corn accounts for the most planted acreage on US soil. From 2000 – 2010, corn accounted for an average 82.5 million planted acres. In 2007, the highest planted acreage was recorded at 93.5 million acres. Harvested acres – what the producer actually harvested and delivered to the grain elevator – accounted for an average of 75.1 million between 2000and 2010. The highest harvested acres came again in 2007 when 86.5 million harvested acres were recorded.
The amount of final harvested acres depends on weather. Some of the factors include:
• Hail Damage
• High Winds which could knock down stalks
• Wet weather that could drown out the crop
• Persistent hot dry weather which could force a farmer to use the corn for silage. Corn silage is a popular forage for livestock (mainly feeder cattle) because it is high in energy and digest-ibility and is easily adapted to mechanization from the stand-crop to time of feeding.
Yield (Numbers based on yearly October USDA reports)
Under normal conditions, corn is the highest yielding crop per acre of the three crops mentioned in this series. From 2000 – 2010, the average US corn yield was 148.1 bushels per acre. It is important to be aware of what corn normally yields when reading reports during growing season.
Growing Season (Corn Belt growing regions)
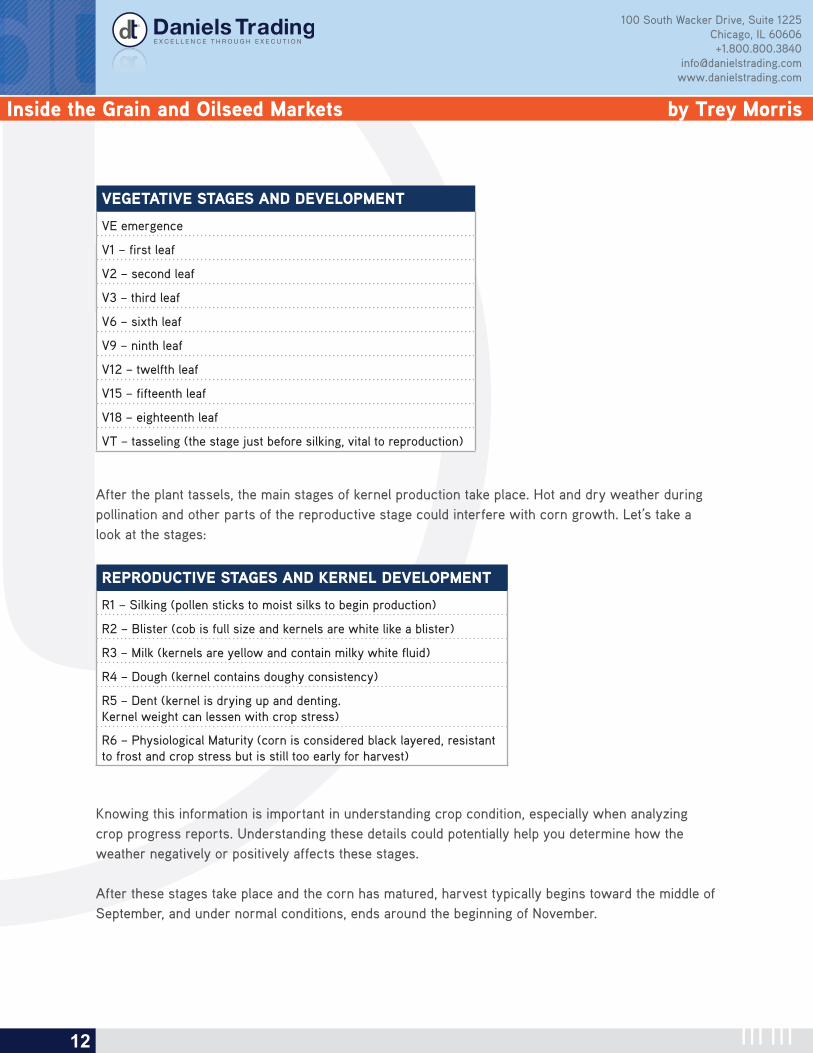
In the US, planting typically begins in April and extends through May. After May, Corn is considered vegetative. Vegetation has different stages. After vegetation, the reproductive stage takes place. This stage is most critical during the growing season. When you view the vegetative stage, picture the crop when it first breaks through the ground. Let’s take a look:
100 South Wacker Drive, Suite 1225 Chicago, IL 60606+1.800.800.3840
[email protected] www.danielstrading.com
12
Turner Breakout Reversal (TBR)Inside the Grain and Oilseed Markets by Trey Morris
VEGETATIVE STAGES AND DEVELOPMENT
VE emergence
V1 – first leaf
V2 – second leaf
V3 – third leaf
V6 – sixth leaf
V9 – ninth leaf
V12 – twelfth leaf
V15 – fifteenth leaf
V18 – eighteenth leaf
VT – tasseling (the stage just before silking, vital to reproduction)
After the plant tassels, the main stages of kernel production take place. Hot and dry weather during pollination and other parts of the reproductive stage could interfere with corn growth. Let’s take a look at the stages:
REPRODUCTIVE STAGES AND KERNEL DEVELOPMENT
R1 – Silking (pollen sticks to moist silks to begin production)
R2 – Blister (cob is full size and kernels are white like a blister)
R3 – Milk (kernels are yellow and contain milky white fluid)
R4 – Dough (kernel contains doughy consistency)
R5 – Dent (kernel is drying up and denting. Kernel weight can lessen with crop stress)
R6 – Physiological Maturity (corn is considered black layered, resistant to frost and crop stress but is still too early for harvest)
Knowing this information is important in understanding crop condition, especially when analyzing crop progress reports. Understanding these details could potentially help you determine how the weather negatively or positively affects these stages.
After these stages take place and the corn has matured, harvest typically begins toward the middle of September, and under normal conditions, ends around the beginning of November.

100 South Wacker Drive, Suite 1225 Chicago, IL 60606+1.800.800.3840
[email protected] www.danielstrading.com
13
Turner Breakout Reversal (TBR)Inside the Grain and Oilseed Markets by Trey Morris
Crops Planting Growing/Filling Maturing Harvest
Corn Apr-May Jun – Aug Sep Oct – Nov
Uses
As stated above, corn is used for various reasons. There are over 4,200 different uses for corn, more than what needs to be listed here. Because there are various uses, we will look at segmented corn usage in 2010. This source comes directly from the USDA.
Feed and Residual 39.4 %
Exports 15.2 %
Food, Seed, and Industrial Use (FSI) excluding Ethanol 10.5 %
Food, Seed, and Industrial Use (FSI) including Ethanol 34.9 %
Exports
The US is currently the world’s largest exporter of corn next to Argentina. So, if the US exports so much corn, which countries import it? The table below is a source of the USDA for 2009/2010.
Leading US Corn Export Markets USDA 2009/2010
Japan 29.6 %
Mexico 16.5 %
Korea 15.6 %
Taiwan 6.1 %
Egypt 6.1 %
China 2.4 %
Canada 2.3 %
Venezuela 2.2 %
Colombia 2.1 %
Dominican Republic 1.8 %
Other 15.3 %

100 South Wacker Drive, Suite 1225 Chicago, IL 60606+1.800.800.3840
[email protected] www.danielstrading.com
14
Turner Breakout Reversal (TBR)Inside the Grain and Oilseed Markets by Trey Morris
SoybeansAlong with corn, soybeans are one of the most active and popular markets to trade. Soybeans have many uses through the two products that they produce, Soybean Meal and Soybean Oil. Soybeans are considered an oilseed as its direct competitors are Rapeseed, Palm, and Peanut in terms of distribution. More uses will be discussed below.
MARKET SPECIFICATIONS
Contract Size 5,000 bushels (~127 Metric Tons)
Deliverable Grade # 2 Yellow at contract price, # 1 Yellow at a 6 cent/bushel premium, # 3 Yellow at a 6 cent/bushel discount
Pricing Unit Cents per Bushel
Tick Size(minimum fluctuation)
1/4 of one cent per bushel ($12.50 per contract)
Contract Months/Symbols January (F), March (H), May (K), July (N), August (Q), September (U) & November (X)
Trading Hours CME Globex (Electronic): 6 pm – 7:15 am and 9:30 am – 1:15 pm Central Time, Sunday – Friday Central TimeOpen Outcry (Trading Floor): 9:30 am – 1:15 pm Monday – Friday Central Time
Daily Price Limit $0.70 per bushel expandable to $1.05 and then 1.60 when the market closes at limit bid or limit offer. There shall be no price limits on the current month contract on or after the second business day preceding the first day of the delivery month.
Settlement Procedure Physical Delivery
Last Trade Date The business day prior to the 15th calendar day of the contract month.
Last Delivery Date Second business day following the last trading day of the delivery month.
Product Ticker Symbol CME Globex (Electronic): ZS (S=Clearing)Open Outcry (Trading Floor): S
Exchange Rule These contracts are listed with, and subject to, the rules and regulations of CBOT.

100 South Wacker Drive, Suite 1225 Chicago, IL 60606+1.800.800.3840
[email protected] www.danielstrading.com
15
Turner Breakout Reversal (TBR)Inside the Grain and Oilseed Markets by Trey Morris
Acreage (Numbers based on yearly October USDA reports)
Of the three crops mentioned in this series, soybeans come in second for amount of planted acreage on US soil. From 2000 – 2010, soybeans accounted for an average 74.0 million planted acres. In 2010, the highest planted acreage was recorded at 77.7 million acres. Harvested acres – what the producer actually harvested and delivered to the grain elevator – accounted for an average of 72.9 million between 2000 and 2010. The highest harvested acres came again in 2010 when 76.8 million harvested acres were recorded.
Yield (Numbers based on yearly October USDA reports)
Under normal conditions, soybeans are the lowest yielding crop per acre of the 3 crops mentioned in this series. From 2000 – 2010, the average US soybean yield was 40.6 bushels per acre. It is important to be aware of what soybeans normally yield when reading reports during growing season.
Growing Season (Corn Belt growing regions)
In the US, planting typically begins in late April and extends through the middle of June. After June, soybeans are considered vegetative. Vegetation has different stages. After vegetation, the reproduc-tive stage takes place which is most critical during growing season. When you view the vegetative stage, picture the crop when it first breaks through the ground. Let’s take a look:
VEGETATIVE STAGES AND DEVELOPMENT
VE (cotyledons have been pulled through the soil surface)
VC (unfolding of the unifoliolate leaves)
V1 (one set of unfolded trifoliolate leaves)
V2 (two sets of unfolded trifoliolate leaves)
V3 (four unfolded trifoliolate leaves)
V(n) (V stages continue with the unfolding of trifoliolate leaves. The final number of trifoliolate’s depends on the soybean variety and the environmental conditions)
V6 (flowering will soon start)
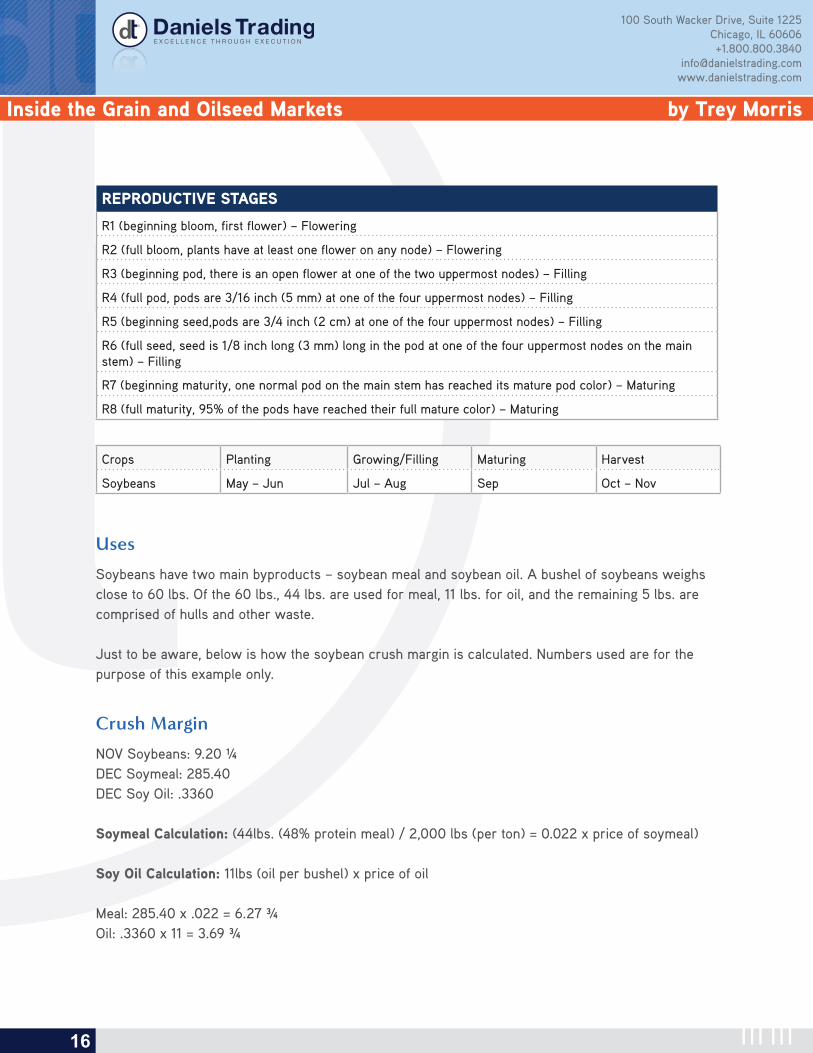
Flowering is a very critical period and typically begins mid-July. Hot and dry weather during pollina-tion and other parts of the reproductive stage could interfere with soybean growth. Let’s take a look at the stages:
100 South Wacker Drive, Suite 1225 Chicago, IL 60606+1.800.800.3840
[email protected] www.danielstrading.com
16
Turner Breakout Reversal (TBR)Inside the Grain and Oilseed Markets by Trey Morris
REPRODUCTIVE STAGES
R1 (beginning bloom, first flower) – Flowering
R2 (full bloom, plants have at least one flower on any node) – Flowering
R3 (beginning pod, there is an open flower at one of the two uppermost nodes) – Filling
R4 (full pod, pods are 3/16 inch (5 mm) at one of the four uppermost nodes) – Filling
R5 (beginning seed,pods are 3/4 inch (2 cm) at one of the four uppermost nodes) – Filling
R6 (full seed, seed is 1/8 inch long (3 mm) long in the pod at one of the four uppermost nodes on the main stem) – Filling
R7 (beginning maturity, one normal pod on the main stem has reached its mature pod color) – Maturing
R8 (full maturity, 95% of the pods have reached their full mature color) – Maturing
Crops Planting Growing/Filling Maturing Harvest
Soybeans May – Jun Jul – Aug Sep Oct – Nov
Uses
Soybeans have two main byproducts – soybean meal and soybean oil. A bushel of soybeans weighs close to 60 lbs. Of the 60 lbs., 44 lbs. are used for meal, 11 lbs. for oil, and the remaining 5 lbs. are comprised of hulls and other waste.
Just to be aware, below is how the soybean crush margin is calculated. Numbers used are for the purpose of this example only.
Crush Margin
NOV Soybeans: 9.20 ¼DEC Soymeal: 285.40DEC Soy Oil: .3360
Soymeal Calculation: (44lbs. (48% protein meal) / 2,000 lbs (per ton) = 0.022 x price of soymeal)
Soy Oil Calculation: 11lbs (oil per bushel) x price of oil
Meal: 285.40 x .022 = 6.27 ¾Oil: .3360 x 11 = 3.69 ¾
100 South Wacker Drive, Suite 1225 Chicago, IL 60606+1.800.800.3840
[email protected] www.danielstrading.com
17
Turner Breakout Reversal (TBR)Inside the Grain and Oilseed Markets by Trey Morris
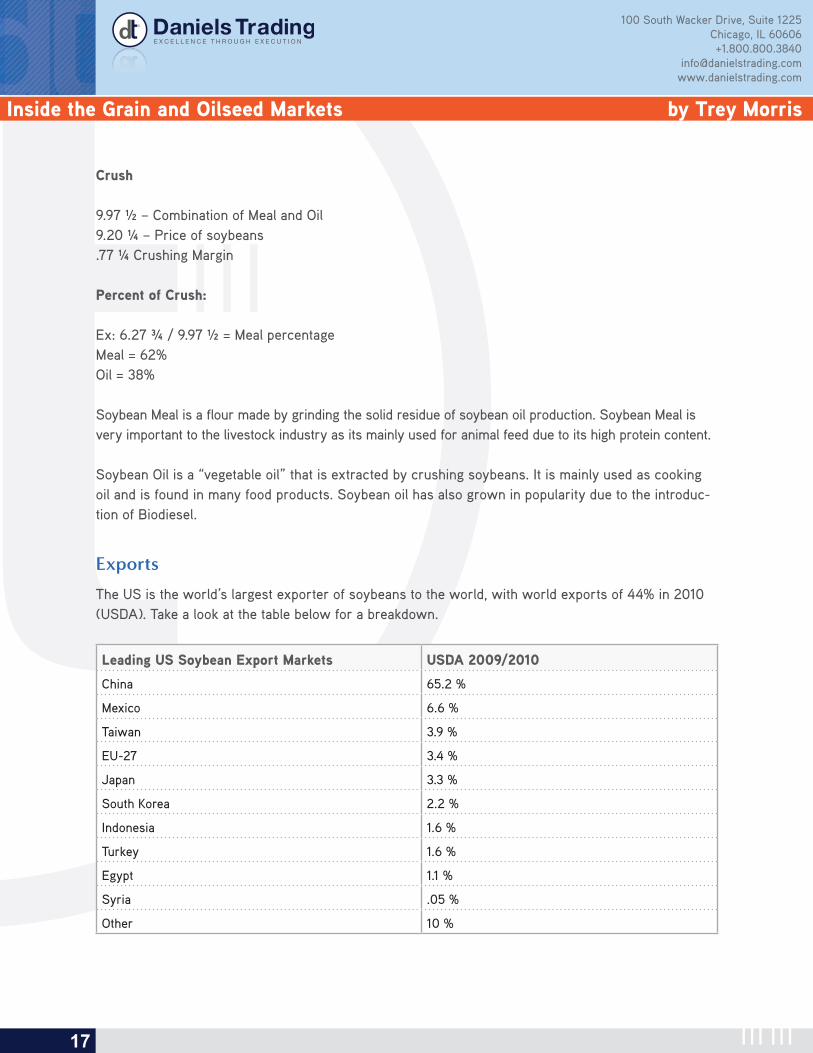
Crush
9.97 ½ – Combination of Meal and Oil9.20 ¼ – Price of soybeans.77 ¼ Crushing Margin
Percent of Crush:
Ex: 6.27 ¾ / 9.97 ½ = Meal percentageMeal = 62%Oil = 38%
Soybean Meal is a flour made by grinding the solid residue of soybean oil production. Soybean Meal is very important to the livestock industry as its mainly used for animal feed due to its high protein content.
Soybean Oil is a “vegetable oil” that is extracted by crushing soybeans. It is mainly used as cooking oil and is found in many food products. Soybean oil has also grown in popularity due to the introduc-tion of Biodiesel.
Exports
The US is the world’s largest exporter of soybeans to the world, with world exports of 44% in 2010 (USDA). Take a look at the table below for a breakdown.
Leading US Soybean Export Markets USDA 2009/2010
China 65.2 %
Mexico 6.6 %
Taiwan 3.9 %
EU-27 3.4 %
Japan 3.3 %
South Korea 2.2 %
Indonesia 1.6 %
Turkey 1.6 %
Egypt 1.1 %
Syria .05 %
Other 10 %
100 South Wacker Drive, Suite 1225 Chicago, IL 60606+1.800.800.3840
[email protected] www.danielstrading.com
18
Turner Breakout Reversal (TBR)Inside the Grain and Oilseed Markets by Trey Morris
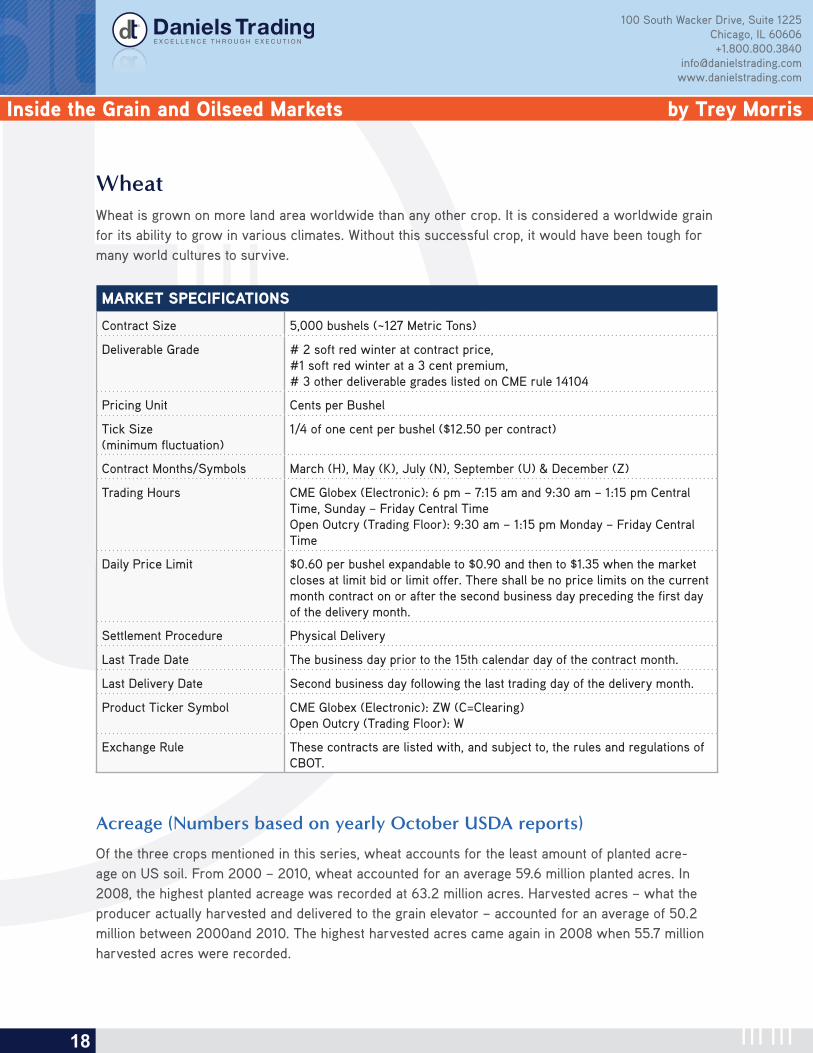
WheatWheat is grown on more land area worldwide than any other crop. It is considered a worldwide grain for its ability to grow in various climates. Without this successful crop, it would have been tough for many world cultures to survive.
MARKET SPECIFICATIONS
Contract Size 5,000 bushels (~127 Metric Tons)
Deliverable Grade # 2 soft red winter at contract price, #1 soft red winter at a 3 cent premium, # 3 other deliverable grades listed on CME rule 14104
Pricing Unit Cents per Bushel
Tick Size(minimum fluctuation)
1/4 of one cent per bushel ($12.50 per contract)
Contract Months/Symbols March (H), May (K), July (N), September (U) & December (Z)
Trading Hours CME Globex (Electronic): 6 pm – 7:15 am and 9:30 am – 1:15 pm Central Time, Sunday – Friday Central TimeOpen Outcry (Trading Floor): 9:30 am – 1:15 pm Monday – Friday Central Time
Daily Price Limit $0.60 per bushel expandable to $0.90 and then to $1.35 when the market closes at limit bid or limit offer. There shall be no price limits on the current month contract on or after the second business day preceding the first day of the delivery month.
Settlement Procedure Physical Delivery
Last Trade Date The business day prior to the 15th calendar day of the contract month.
Last Delivery Date Second business day following the last trading day of the delivery month.
Product Ticker Symbol CME Globex (Electronic): ZW (C=Clearing)Open Outcry (Trading Floor): W
Exchange Rule These contracts are listed with, and subject to, the rules and regulations of CBOT.
Acreage (Numbers based on yearly October USDA reports)
Of the three crops mentioned in this series, wheat accounts for the least amount of planted acre-age on US soil. From 2000 – 2010, wheat accounted for an average 59.6 million planted acres. In 2008, the highest planted acreage was recorded at 63.2 million acres. Harvested acres – what the producer actually harvested and delivered to the grain elevator – accounted for an average of 50.2 million between 2000and 2010. The highest harvested acres came again in 2008 when 55.7 million harvested acres were recorded.

100 South Wacker Drive, Suite 1225 Chicago, IL 60606+1.800.800.3840
[email protected] www.danielstrading.com
19
Turner Breakout Reversal (TBR)Inside the Grain and Oilseed Markets by Trey Morris
The amount of final harvested acres depends on weather. Some of the factors include:
• Wind damage which knocks the crop over making harvest difficult or impossible
• Drought which could kill the crop
• Wet weather at maturity that could significantly ruin the quality of the crop
Yield (Numbers based on yearly October USDA reports)
Under normal conditions, wheat yields are slightly higher than soybeans on a bushel per acre aver-age. From 2000 – 2010, the average US all wheat yield was 42.0 bushels per acre. It is important to be aware of what wheat normally yields when reading reports during growing season.
Growing Season (All US Wheat growing regions)
There are three different types of wheat grown in the US every year. Each crop is slightly different from the other. It is necessary to understand when and where these crops are grown. Winter wheat accounts for nearly 70 – 80 percent of US production while spring wheat accounts for close to 20 – 30 percent.
Crop Region Growth Growing Season
Chicago Soft Winter Wheat East of the Mississippi River in more humid envi-ronments
SEP-JUL
Kansas City Hard Winter Wheat S. Plains Region (KS, TX, OK, and NE) SEP-JUL
Minneapolis Hard Spring Wheat
NW Portion of the US. (ND, SD, MT) APR-SEP
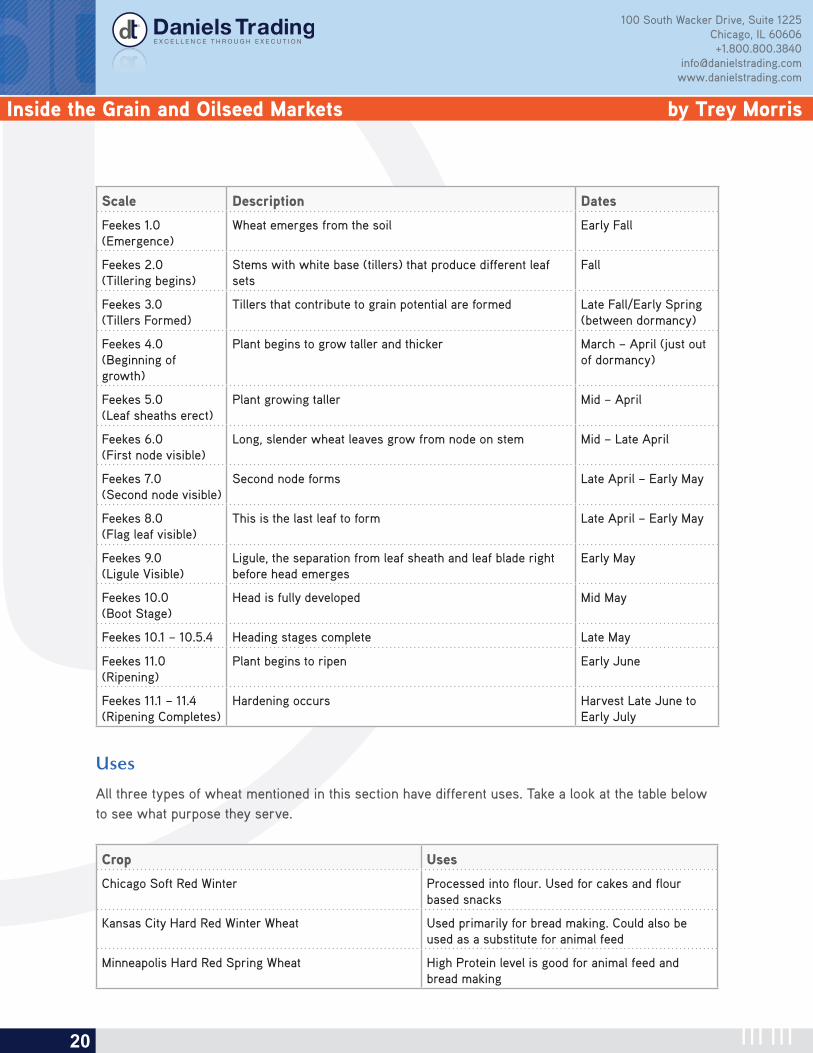
Wheat has an important vegetative stage just like corn and soybeans. All 3 types of wheat grow the same way but with the only difference being the dormancy of winter wheat during the winter time. Winter wheat, unlike spring wheat, is typically dormant December – February; otherwise, the growing stages are the same for all wheat varieties. The table below provides a surface overview of winter wheat development. Refer to the table above for spring wheat planting growing season dates. There are at least five scales used to determine wheat growth. For this example, the Feekes scale will be explored.
100 South Wacker Drive, Suite 1225 Chicago, IL 60606+1.800.800.3840
[email protected] www.danielstrading.com
20
Turner Breakout Reversal (TBR)Inside the Grain and Oilseed Markets by Trey Morris
Scale Description Dates
Feekes 1.0 (Emergence)
Wheat emerges from the soil Early Fall
Feekes 2.0 (Tillering begins)
Stems with white base (tillers) that produce different leaf sets
Fall
Feekes 3.0 (Tillers Formed)
Tillers that contribute to grain potential are formed Late Fall/Early Spring (between dormancy)
Feekes 4.0 (Beginning of growth)
Plant begins to grow taller and thicker March – April (just out of dormancy)
Feekes 5.0 (Leaf sheaths erect)
Plant growing taller Mid – April
Feekes 6.0 (First node visible)
Long, slender wheat leaves grow from node on stem Mid – Late April
Feekes 7.0 (Second node visible)
Second node forms Late April – Early May
Feekes 8.0 (Flag leaf visible)
This is the last leaf to form Late April – Early May
Feekes 9.0 (Ligule Visible)
Ligule, the separation from leaf sheath and leaf blade right before head emerges
Early May
Feekes 10.0 (Boot Stage)
Head is fully developed Mid May
Feekes 10.1 – 10.5.4 Heading stages complete Late May
Feekes 11.0 (Ripening)
Plant begins to ripen Early June
Feekes 11.1 – 11.4 (Ripening Completes)
Hardening occurs Harvest Late June to Early July
Uses
All three types of wheat mentioned in this section have different uses. Take a look at the table below to see what purpose they serve.
Crop Uses
Chicago Soft Red Winter Processed into flour. Used for cakes and flour based snacks
Kansas City Hard Red Winter Wheat Used primarily for bread making. Could also be used as a substitute for animal feed
Minneapolis Hard Red Spring Wheat High Protein level is good for animal feed and bread making
100 South Wacker Drive, Suite 1225 Chicago, IL 60606+1.800.800.3840
[email protected] www.danielstrading.com
21
Turner Breakout Reversal (TBR)Inside the Grain and Oilseed Markets by Trey Morris
Exports
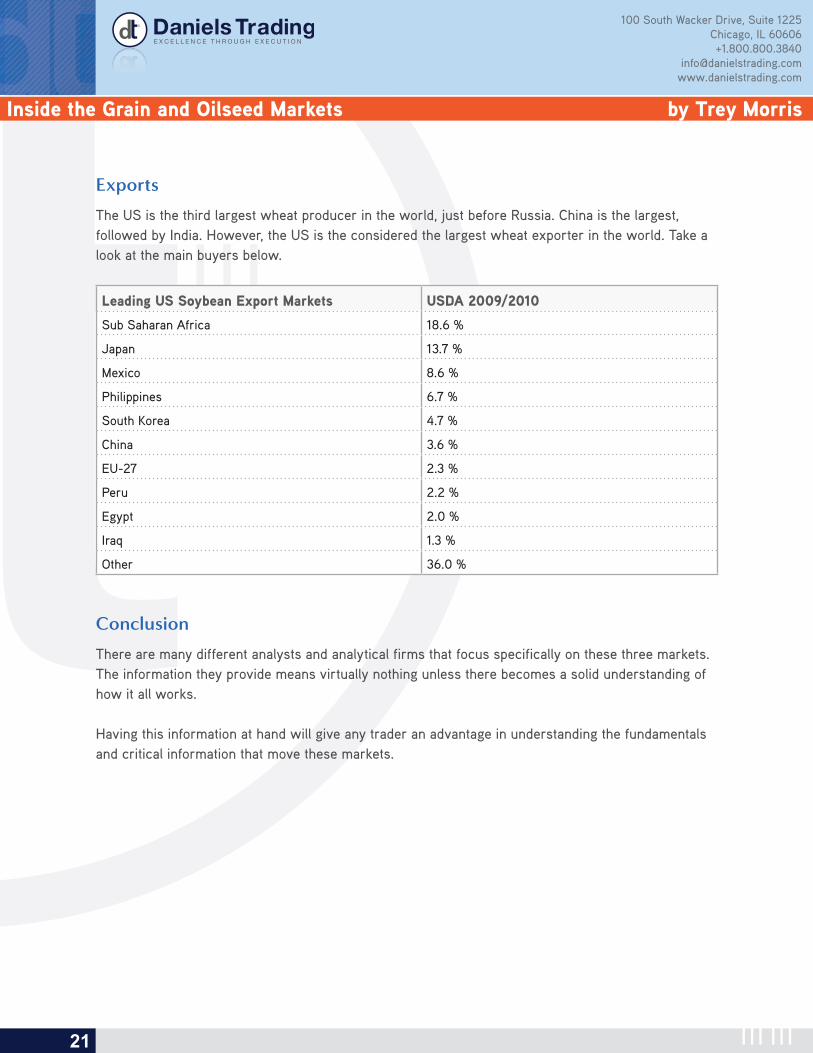
The US is the third largest wheat producer in the world, just before Russia. China is the largest, followed by India. However, the US is the considered the largest wheat exporter in the world. Take a look at the main buyers below.
Leading US Soybean Export Markets USDA 2009/2010
Sub Saharan Africa 18.6 %
Japan 13.7 %
Mexico 8.6 %
Philippines 6.7 %
South Korea 4.7 %
China 3.6 %
EU-27 2.3 %
Peru 2.2 %
Egypt 2.0 %
Iraq 1.3 %
Other 36.0 %
Conclusion
There are many different analysts and analytical firms that focus specifically on these three markets. The information they provide means virtually nothing unless there becomes a solid understanding of how it all works.
Having this information at hand will give any trader an advantage in understanding the fundamentals and critical information that move these markets.

GRAIN MARKET SNAPSHOTReceive the Grain Market Snapshot Newsletter Free for 30 DaysRemain sharp as Trey Morris keeps your headin the game while reducing information overload!
CLICK HERE TO RECIEVE YOUR FREE NEWSLETTER

100 South Wacker Drive, Suite 1225 Chicago, IL 60606+1.800.800.3840
[email protected] www.danielstrading.com
23
Turner Breakout Reversal (TBR)Inside the Grain and Oilseed Markets by Trey Morris
PART FOUR: THE OUTSIDERS
Grain and oilseed markets have their own factors that directly affect their price on a daily basis. Weather and supply and demand factors would be considered the most affective. However, a novice trader in the grain and oilseed markets may not be aware of other existing markets. These markets are called “outside markets”, and they have become a very important price mover in the past few years.
An “Outside Market” is considered to be any organized market that is not a part of the grain complex but can still influence their prices. There are many of these markets, both big and small. However, the main three markets that traders watch daily are: Crude Oil, the US Dollar, and the Dow Jones. In recent years, grain and oilseed markets have become more of a world market. Overnight price move-ment in the US is typically influenced by action in other markets during their normal trading hours.
Crude Oil
Given the popularity of bio-fuel over the past few years, crude oil and its affect over the grain and oilseed markets is more significant than it has ever been. Crude oil is affected by Ethanol and Bio-Diesel Production – if the price of crude oil is higher, it is considered supportive to the grain and oilseed markets. Simply put, if the price of crude oil increases, it supports bio-fuels because, in a sense, their demand increases to refiners and consumers. Soybeans are used for the production of bio-diesel or for a blend in regular diesel. Corn is used for Ethanol as a substitute for gasoline but is more popularly blended with regular gasoline. As the price of crude oil stays high, likely will the demand for these alternative fuels.
US Dollar
The US Dollar affects the grain and oilseed markets just as it affects commodities in general. On a day when it seems as if every market is selling off, take a look at the US Dollar – it will likely be higher during that day’s trading session. A rising dollar is non-inflationary which results in eventually lower commodity prices over time. Investors typically buy commodities to hedge against inflation. When the dollar is weak or has been weakening, it signals that there may be anticipation of inflation in the coming future. More directly, a lower dollar looks attractive to foreign grain and oilseed buyers since their cost of purchase will essentially be lower.
Dow Jones Industrial Index (DJIA)
The Dow typically has little correlation with the price movement in the grain and oilseed markets. However, it is worth mentioning due to its more direct affect as of late. Investors have been trading in more of a risk on / risk off fashion. In the past, if the stock market was rising, commodity prices would decrease due to reduced inputs costs for companies. When commodity prices were higher, it

100 South Wacker Drive, Suite 1225 Chicago, IL 60606+1.800.800.3840
[email protected] www.danielstrading.com
24
Turner Breakout Reversal (TBR)Inside the Grain and Oilseed Markets by Trey Morris
would cost more for a company to purchase those goods, thus slowing growth. Now, if the Dow is up 300 points during a trading session, it seems as if commodity prices are as well. One important thing to keep in mind is that when more confidence and certainty is established in our markets and future, the strong stock market/lower commodities will likely come back into play.
Conclusion
The outside markets mentioned above should be used as a tool in your trading and hedging arsenal. When research is conducted, never leave these out. It is important to have a solid awareness of them when formulating trading or hedging decisions.
PART FIVE: THE FOREIGN AFFECT
The US has always been known as the world’s largest exporter of soybeans and corn. Although upholding that title, two South American countries have made significant end roads in recent years, becoming a strong competitor to these two major US markets. Argentina and Brazil have become major players regarding world soybean and corn supply. This arguably rapid growth makes it difficult for the US to advance as a major export market.
In this series, we will take a quick look at the characteristics of these two countries and why they are such an integral part of world supply and demand.
Exports and ProductionAlong with other crops, both Argentina and Brazil produce soybeans and corn annually. Different locations and land mass limit how much is grown in each country making them slightly different from the other. Argentina is the world’s 3rd largest exporter of soybeans and 2nd largest exporter of corn while Brazil is the world’s 2nd largest exporter of soybeans and 3rd largest exporter of corn.See the US comparison below (In 1,000 MT):
Exports 2010 United States Brazil Argentina
Soybeans 40687 29900 8500
Corn 46357 8500 14500
Production 2010 United States Brazil Argentina
Soybeans 90610 75500 49000
Corn 316165 55000 22000

100 South Wacker Drive, Suite 1225 Chicago, IL 60606+1.800.800.3840
[email protected] www.danielstrading.com
25
Turner Breakout Reversal (TBR)Inside the Grain and Oilseed Markets by Trey Morris
Land mass in the US is nearly maxed out, thus limiting the expansion of increased farmland and capping annual production. Genetically Modified Corn (GMO) is the next step in increasing the trend of production in the US. Conversely, South America still has land that could be converted into farmland, which could continue to increase annual production.
Growing Season
South America has a completely different growing season compared to the US which brings attention to the country after the annual US soybean and corn harvest. Take a look at the planting dates below:
Note: The growing seasons in both Argentina and Brazil have slightly different stages depending on the region. The dates below reflect the earliest planted region with the latest harvested region.
Argentina
Crops Planting Growing/Filling Maturing Harvest
Soybeans Oct – Dec Dec - Jan Feb - Mar Mar - May
Corn Sep - Dec Dec - Jan Jan - Feb Mar - Apr
Brazil
Crops Planting Growing/Filling Maturing Harvest
Soybeans Sep - Dec Dec - Feb Feb Mar - Apr
Corn Sep - Oct Nov - Jan Feb Feb - Apr
The significance of knowing when the growing seasons occur in South America are just as important as knowing when they occur in the US. Traders will pay close attention to these two countries to help them determine where supply may be after harvest.
The US growing season is typically shorter than in South America due to the higher latitudes of the U.S. Corn Belt. The US Corn Belt has an average growing season of 4 ½ months while the southern US experiences a longer growing season of 7 months. However, Argentina experiences an 8 – 9 month growing season for soybeans and corn. Brazil experiences the same growing season, but the South is cooler than the Center-West region thus shortening the growing period.

100 South Wacker Drive, Suite 1225 Chicago, IL 60606+1.800.800.3840
[email protected] www.danielstrading.com
26
Turner Breakout Reversal (TBR)Inside the Grain and Oilseed Markets by Trey Morris
The US growing season is typically shorter than in South America due to the higher latitudes of the U.S. Corn Belt. The US Corn Belt has an average growing season of 4 ½ months while the southern US experiences a longer growing season of 7 months. However, South America experiences an 8 – 9 month growing season for soybeans and corn.
One of the most notable and major differences between the US and South American growing seasons is the planting season of “Safrinha” corn that is planted mainly the Center-West region of Brazil. It is typically planted in February and is harvested through June. This “winter” corn is able to grow during this time of year due to the more tropical climate that this region possesses. Recently, there have been more efforts to expand Safrinha corn into Brazil’s “South” in the Parana region.
Climate
A region’s agro-climatic setting surrounds the physical characteristics of its climate and what natural resources lie within. Characteristics of an agro-climatic setting include: growing season, temperature, day length, sunlight, elevation, etc. These factors determine not only what crops may grow there, but also determines their yield.
The US lies within a temperate zone. A temperate zone is defined as parts of the earth’s surface lying between the Arctic Circle and the Tropic of Cancer and between the Antarctic Circle and the Tropic of Capricorn. The Corn Belt is a primary example of a specific agro-climatic region. The features that lie within this area help produce the best yielding soybean and corn crops in the whole US. Other areas such as the hot and humid Southeastern US make perfect conditions for growing cotton.
The Central portion Argentina possesses a temperate climate similar to the growing regions in the US. The majority of row crops in Argentina are grown in the Central to Northeastern third of the country. Soybeans are grown in the more northern regions due to its warm humid temperatures and fertile soils and corn is grown in the more central regions. The main areas that dominate row crop production are Buenos Aires, Cordoba, Santa Fe, and western Entre Rios. Over 90 percent of soybean production and 80–90 percent of corn production takes place in these regions on the fertile Pampas.
Agricultural production in Brazil is separated into two separate regions, the South and the Center-West. Brazil’s “South” possesses nearly the same humid climate as NE Argentina. Brazil’s South has been one of the world’s most productive agricultural zones for decades. One of the greatest benefits to agricul-tural production in these regions is the close proximity to ports on the coast, which provide easy access to markets. States within this region include Rio Grande do Sul, Santa Catarina, and Parana.
The “Center-West” region of Brazil began its development into Agriculture in the 1960’s, due mostly in part to government incentives. Since then, it has grown to be a major agricultural area that rivals the South as the main region for agricultural production in Brazil. This region lies in a humid tropical
100 South Wacker Drive, Suite 1225 Chicago, IL 60606+1.800.800.3840
[email protected] www.danielstrading.com
27
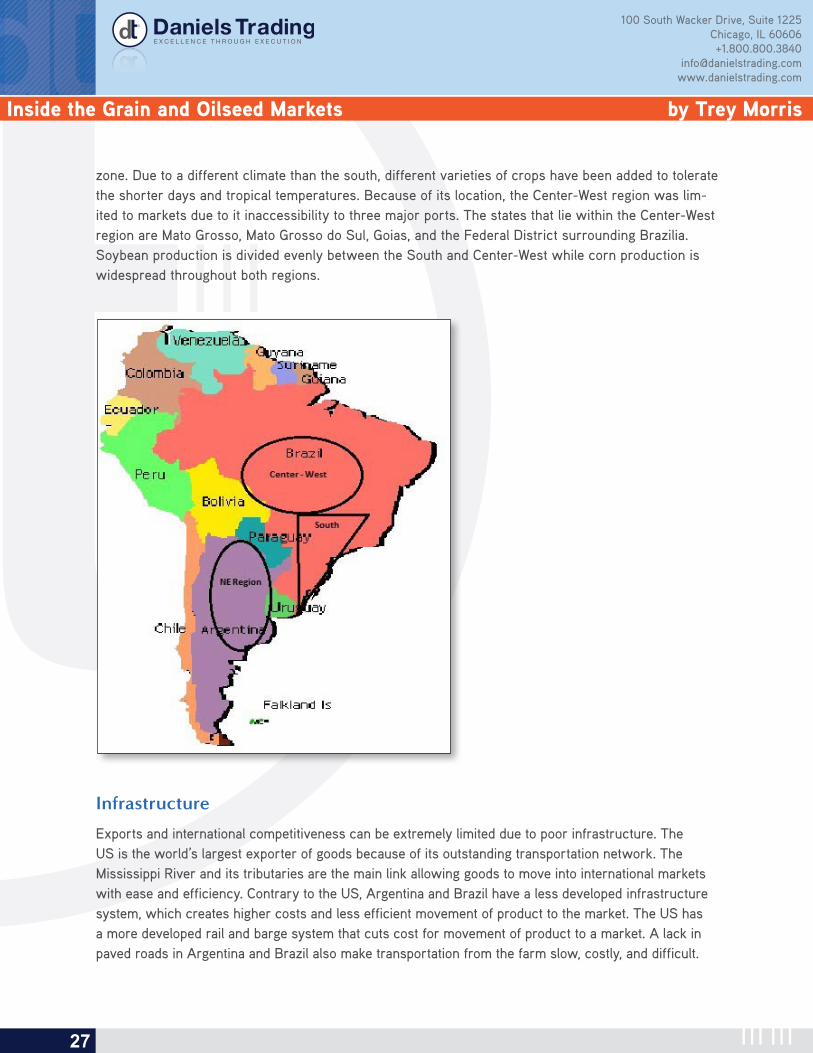
Turner Breakout Reversal (TBR)Inside the Grain and Oilseed Markets by Trey Morris
zone. Due to a different climate than the south, different varieties of crops have been added to tolerate the shorter days and tropical temperatures. Because of its location, the Center-West region was lim-ited to markets due to it inaccessibility to three major ports. The states that lie within the Center-West region are Mato Grosso, Mato Grosso do Sul, Goias, and the Federal District surrounding Brazilia. Soybean production is divided evenly between the South and Center-West while corn production is widespread throughout both regions.
Infrastructure
Exports and international competitiveness can be extremely limited due to poor infrastructure. The US is the world’s largest exporter of goods because of its outstanding transportation network. The Mississippi River and its tributaries are the main link allowing goods to move into international markets with ease and efficiency. Contrary to the US, Argentina and Brazil have a less developed infrastructure system, which creates higher costs and less efficient movement of product to the market. The US has a more developed rail and barge system that cuts cost for movement of product to a market. A lack in paved roads in Argentina and Brazil also make transportation from the farm slow, costly, and difficult.

100 South Wacker Drive, Suite 1225 Chicago, IL 60606+1.800.800.3840
[email protected] www.danielstrading.com
28
Turner Breakout Reversal (TBR)Inside the Grain and Oilseed Markets by Trey Morris
Farms in the US have ways of storing grain which allows them to sell when the price is right. Conversely, due to a lack in storage, Argentine and Brazilian farmers are forced to sell their grain at harvest when the price is typically lower. This also slows down the logistics due to crowded ports and offloading areas at harvest time. Although logistics have been an issue in the past, there is great potential in both countries for drastic improvement in transportation from farm to market. Brazil has the Amazon River, the world’s largest river system, and its tributaries, which have begun develop-ment to open up Brazil’s interior agricultural areas. Argentina also has the Parana-Paraguay River system located close to the major growing areas of the region. Policy changes and further investment in these areas will likely continue to improve what once was a logistical nightmare.
Conclusion
Food demand across the world is increasing at a rapid rate as the population continues to rise. As other areas of the world have limited land mass that could be converted into farmland, the countries of Brazil and Argentina have the potential to continue growing as an agricultural powerhouse. This growth is necessary to meet the food needs of the world in the coming years.
As these countries grow and improve their ability to move products to other importing countries, the US will have to remain competitive to maintain their title.
To stay on top of crop production in Argentina, refer to the USDA - more specifically the monthly USDA supply and demand reports.
PART SIX: MAKING SENSE OF CROP REPORTS
So far in this series, we have covered the basic fundamentals that make up the grain and oilseed markets. Everything from the establishment of the markets to the growth stages of the crop itself has been discussed. Understanding the fundamental make-up of these markets will help you formulate your own idea as to where the price may head in the future.
So after you do your homework, who do you compare notes with? The USDA and its agencies prepare reports that are crucial to governmental policy makers and individuals that are involved in making important decisions about marketing and investing in these markets. These reports are considered to be a benchmark for all other statistical reports released. In this section, we will take a look at all of the major and minor reports that the National Agricultural Statistics Service (NASS), an agency within the USDA, prepares each year. We will delve into the specifics of the reports, including what information is contained within.

100 South Wacker Drive, Suite 1225 Chicago, IL 60606+1.800.800.3840
[email protected] www.danielstrading.com
29
Turner Breakout Reversal (TBR)Inside the Grain and Oilseed Markets by Trey Morris
The USDA and their significanceThe United States Department of Agriculture (USDA), established by Abraham Lincoln in 1862, is the US federal executive department responsible for developing and executing US federal government policy on farming, agriculture, and food. The main goals of the USDA is to help farmers and ranchers promote trade and production, assure food safety, protect our natural resources and, above all, end hunger in the US and overseas. Without the establishment of the USDA, agriculture in the US would not be what it is today.
The National Agricultural Statistics Service (NASS) is responsible for conducting hundreds of surveys every year to prepare reports that cover every aspect of U.S. agriculture. These surveys include: production and supplies of food and fiber, prices paid and received by farmers, farm labor and wages, changes in farm demographics, etc. Without the thorough research done by this agency, it would be hard for agricultural companies to market and manage their products.
Most of the reports that will be discussed below are assembled by the NASS while other market reports are put together by other organizations.
Important Public Crop Reports
While there are many reports that pertain to the grain and oilseed markets. There are certain reports that any trader needs to pay attention to when it comes to staying on top of these markets.
Weekly
Crop ProgressThis report is issued by the NASS on Monday afternoon during growing season (Apr – Nov). This report lists planting, selected maturity stages, the overall condition of the crops in the report, and harvest progress in the top producing states.
Export SalesExport Sales are released on Thursday morning (day could vary due to holidays) and reports the previous week’s export sales. Although this report comes out weekly, U.S. exporters are required to report any sales over 100,000 metric tons of a single commodity to a single destination or cumulative sales of 200,000 tons or more of one commodity during the weekly reporting period to a single destination by 3:00 pm eastern time.
100 South Wacker Drive, Suite 1225 Chicago, IL 60606+1.800.800.3840
[email protected] www.danielstrading.com
30
Turner Breakout Reversal (TBR)Inside the Grain and Oilseed Markets by Trey Morris
Monthly
USDA Supply and Demand ReportEach month, the USDA publishes crop supply and demand estimates for both the Nation and the World. This report is the most anticipated report released each month. It contains the official domestic production, usage, and ending stocks estimates. It is released between the 9th and 12th of each month and reflects estimates from the first of the month. The January report provides the final US production numbers.
Crop ProductionThese reports run along with or the period just after the growing season. The report outlines crop acreage, yields, areas harvested, and other production information. The final estimate for soybeans and corn is completed in January. These estimates reflect actual field survey done across the US by the USDA.
Long-Term
Quarterly Grain StocksReleased at the end of each quarter, this report estimates the total amount of each commodity and then divides that into on-farm and off-farm. The stocks number is taken as of December 1st, March 1st, June 1st, and September 1st.
Prospective PlantingsThis report is released at the end of March and compiles planting intentions that are reported by various farmers across the US. This is also a highly anticipated report that allows for industry partici-pants to better plan for the months ahead.
Acreage ReportThis report is released at the end of June and gives the industry actual planted acreage of each commodity.
ConclusionKnowing when these reports are released and the numbers they contain will better help familiarize you with the current fundamentals of these markets. You can always refer to the USDA and NASS for any information regarding supply and demand in these important markets.

100 South Wacker Drive, Suite 1225 Chicago, IL 60606+1.800.800.3840
[email protected] www.danielstrading.com
31
Turner Breakout Reversal (TBR)Inside the Grain and Oilseed Markets by Trey Morris
PART SEVEN: CASH GRAIN MARKET SNAPSHOT
Although the futures market is a great place for a producer to manage his on-farm risk, it is ultimately the cash grain market that he is focused on. The price the producer gets for his grain is determined by the local grain elevator that he sells his product to. In the process, there are a few things that the producer looks for to help him determine when and where he does this. In this article, we will take a quick look at the different segments of the cash grain business and what they mean to a producer
The Country ElevatorThe country elevator is a local collection point that farmers in a specific area can go deliver and sell their grain. The elevator is known as a distributor of grain into the marketplace. The benefit of to the grain elevator is its ability to move and access grain as the market needs it. The elevator can be used as a local resource for local users and processors. The local elevator also serves as a storage place for grain for local producers that may not have on-farm storage. The benefit of storing this grain is having that ability to hold it until the market needs it or until the price improves. However, there is a cost for doing this known as cost-of-carry. Cost of carry is what it costs to hold the grain. These costs would include interest, shrink, and insurance. It does not include transportation. Ultimately, the local elevator is able to serve as the middle man while being able to offer prices that best serve the producer. Country elevators also play the role of grain grading. When a producer brings in a truck load of grain, the elevator grades it to see if it meets the standards of their buyers (foreign markets, local end-users, etc.). Crop diseases such as Aflatoxin that affects corn during hot dry years is almost always turned down by the grain elevator based on its severity. This disease is harmful to the livestock that feed on the infected corn.
Producer selling When a producer sees that his local elevator is offering an attractive price for his grain, he usually forward contracts that grain with the elevator. A forward contract is defined as a legally binding commitment by the farmer to sell to the elevator a set amount of bushels at a specific price and for a stated delivery period. The producer must be able to deliver the bushels obligated in the contract. This typically occurs before the next year’s crop is harvested. Producers typically contract at least 50% of their expected production. The reason only half may be contracted is because of the risk that the producer may not make a full crop. The last thing he wants is a grain debit with the elevator. After the producer contracts all of his expected grain, he unofficially no longer owns the grain and is considered “short-the-cash”. The producer is said to be long-the-cash grain he has not yet sold or owns grain.

100 South Wacker Drive, Suite 1225 Chicago, IL 60606+1.800.800.3840
[email protected] www.danielstrading.com
32
Turner Breakout Reversal (TBR)Inside the Grain and Oilseed Markets by Trey Morris
For the livestock producer, the concept remains the same but his feed needs are usually more consis-tent. If the market drops suddenly and there seems to be a buying opportunity before it heads higher, he will likely go ahead and forward contract his future needs by buying his feed from the elevator.
BasisThe most important marketing concept in the cash grain markets is called Basis. Basis is defined simply as the difference between the local cash price and futures price. Basis is always quoted as the cash price in relation to the futures price.
What ultimately determines the difference between the local cash price and futures (basis) is the economics of supply and demand. Large supplies of grain in a local region will typically trade at a discount to futures due to heavy supply in the area.
Ex. If nearby corn futures are 6.00/bu. and the cash market is 5.70/bu. , this would be quoted as corn being -.30 under the futures”If there is tight supply and strong demand in the area, the cash market will typically trade at a premium to futures.
Ex. If nearby corn futures are 6.00/bu. and the cash market is 6.30/bu. , this would be quoted as corn being “+.30 over the futures”
The local cash prices of corn, soybeans, wheat, etc. are typically seasonal. Many producers and grain merchants study the historical movement of cash prices in the region which better helps their marketing/hedging practices. Hedging is the practice of offsetting a cash transaction with an opposite futures transaction in order to limit price risk.
From Farm to PlateThe cash market process is a very crucial and complex business that is necessary to everyday life. If it were not for the efficiency of the cash markets, our dinner table may be not as fruitful and afford-able as we know it today.
To conclude, take a look at the diagram below that explains the process of this market.
Producer --> Collection/Distribution --> Transport --> Processing --> Consumer

100 South Wacker Drive, Suite 1225 Chicago, IL 60606+1.800.800.3840
[email protected] www.danielstrading.com
33
Turner Breakout Reversal (TBR)Inside the Grain and Oilseed Markets by Trey Morris
Trey MorrisTrey’s interest in the futures markets began at an early age having grown up in the Mississippi River Delta region of Arkansas. Being surrounded by a vast amount of row crop agriculture, he developed a growing curiosity of the markets that influenced the regions farming practices. “It was hard to go anywhere in town and not hear a discussion on current crop prices and where they may be headed. There seemed to always be a debate amongst local producers about the long-term direction of the grain markets.”
A few years later, Trey attended the University of Arkansas where he received a B.S. in Agricultural Business with a focus in Futures
and Options. “I knew I wanted to be involved in Futures, and I knew Chicago was the place to make that possible.” Prior to becoming a futures and options broker at Daniels Trading, he worked for another futures brokerage in Chicago.
Even though the Ag markets sparked his interest in futures, he feels that all markets offer great opportunities if properly managed. Overall, Trey believes it is the outstanding customer service he provides his clients that keeps his business growing day in and day out. “Treat your clients as you would want to be treated, it’s just that simple.”
When not in the offices of Daniels Trading, Trey enjoys to hunt, fish, and golf whenever time allows.

100 South Wacker Drive, Suite 1225 Chicago, IL 60606+1.800.800.3840
[email protected] www.danielstrading.com
34
Turner Breakout Reversal (TBR)Inside the Grain and Oilseed Markets by Trey Morris
DISCLOSURE
PAST PERFORMANCE IS NOT NECESSARILY INDICATIVE OF FUTURE PERFORMANCE. THE RISK OF LOSS IN TRADING FUTURES CONTRACTS OR COMMODITY OPTIONS CAN BE SUBSTANTIAL, AND THEREFORE INVESTORS SHOULD UNDERSTAND THE RISKS INVOLVED IN TAKING LEVER-AGED POSITIONS AND MUST ASSUME RESPONSIBILITY FOR THE RISKS ASSOCIATED WITH SUCH INVESTMENTS AND FOR THEIR RESULTS.
YOU SHOULD CAREFULLY CONSIDER WHETHER SUCH TRADING IS SUITABLE FOR YOU IN LIGHT OF YOUR CIRCUMSTANCES AND FINANCIAL RESOURCES. YOU SHOULD READ DANIELS TRAD-ING’S FULL “RISK DISCLOSURE”. DANIELS TRADING IS NOT AFFILIATED WITH NOR DOES IT ENDORSE ANY TRADING SYSTEM, NEWSLETTER OR OTHER SIMILAR SERVICE. DANIELS TRAD-ING DOES NOT GUARANTEE OR VERIFY ANY PERFORMANCE CLAIMS MADE BY SUCH SYSTEMS OR SERVICES.

GRAIN MARKET SNAPSHOTReceive the Grain Market Snapshot Newsletter Free for 30 DaysRemain sharp as Trey Morris keeps your headin the game while reducing information overload!
CLICK HERE TO RECIEVE YOUR FREE NEWSLETTER