insect resistant cotton (1) - ncfap · · 2016-12-213 because cotton is grown as an annual crop,...
TRANSCRIPT

Plant Biotechnology: Current and Potential Impact
For Improving Pest Management In U.S. Agriculture
An Analysis of 40 Case Studies June 2002
Insect Resistant Cotton (1)
Leonard P. Gianessi Cressida S. Silvers
Sujatha Sankula Janet E. Carpenter
National Center for Food and Agricultural Policy
1616 P Street, NW Washington, DC 20036 Phone: (202) 328-5048 Fax: (202) 328-5133
E-mail: [email protected] Website: www.ncfap.org
Financial support for this study was provided by the Rockefeller Foundation, Monsanto, The Biotechnology Industry Organization, The Council for Biotechnology Information, Grocery Manufacturers of America, and CropLife America.

2
32. Cotton
Insect Resistant (1)
Production
In the US, just over seventeen million bales of cotton (8.2 billion pounds) were harvested
from 13 million cotton acres in 2000. This acreage is consistent with 1999 cotton acreage
and production and represents an increase from the 14 million bales produced on 10.6
million acres in 1998 [1]. Total cotton crop value in 2000 was $4.8 billion. The vast
majority of the cotton is upland varieties with a minority of higher value, extra long
staple cotton produced in CA, AZ, NM and TX. Currently, seventeen states contribute to
US production (see Table 32.1).
The US accounts for approximately 20% of the world’s annual production of cotton and
in recent years has ranked as the number two cotton producing country in the world
behind China. However, in terms of exports, the US is the number one cotton exporter in
the world with approximately 40% of its production exported annually. Major US cotton
export markets include Mexico, Turkey, Indonesia, Taiwan, Japan and Korea.
In recent years US growers have experienced some significant declines in the price they
receive for cotton (see Figure 32.1). 1999 prices were particularly low due to the
financial crisis in Southeast Asia, which led to significant reductions in US exports.
Insect Pests of Cotton
Several hundred species of insects and mites are found in US cotton fields, but only a
small number are destructive. Many are predators or parasites and serve as important
natural enemies of the destructive pests. The most damaging pests are those that attack
squares and bolls: the bollworm, tobacco budworm, pink bollworm, boll weevil and lygus
bugs. Aphids and whiteflies seldom affect cotton yield but they can reduce the grade of
lint by contaminating it with honeydew. [20]

3
Because cotton is grown as an annual crop, most insects cannot survive all year in cotton
fields, but they move in each season from other crops or from weeds. Most major
predators, including bigeyed bugs, minute pirate bugs, and damsel bugs also come in
from nearby vegetation. [20]
Primary insect pests of cotton vary by region. Table 32.2 shows infestation estimates for
major insect pests by state for a recent year. Budworm/bollworm are estimated to infest
the most acreage of US cotton—primarily in the Southeast and Delta States. Cotton
bollworm/budworm are not a major problem in California or Arizona. Cotton acreage in
Arizona, New Mexico, the Imperial Valley of California and far west Texas are infested
with the pink bollworm which is not found in other producing regions. Lygus and aphids
are the major problem in the San Joaquin Valley in California.
The boll weevil is believed to have entered the US near Brownsville Texas in 1892. By
the 1920’s the insect pest occupied all cotton producing areas to the east and by the early
1950’s it had infested west Texas. Unlike other pests of cotton, there are no major
predators or parasites of the boll weevil in the US. Various predators and parasites were
imported from Africa and South America, but were unable to survive. Insecticides have
been widely used to control the boll weevil in the US since the 1920’s. Beginning in the
1970’s Boll Weevil Eradication programs have been implemented on a region-by-region
basis. The boll weevil has been eradicated from Virginia, North and South Carolina,
Georgia, Florida and Alabama in the southeast and Arizona and southern California as
well as adjacent cotton areas in Mexico in the west. Eradication programs are now
underway on more than 10 million acres in Mississippi, Tennessee, Arkansas, Louisiana,
Missouri, Oklahoma, New Mexico and Texas. A major part of the eradication program is
well-coordinated area wide management using a series of diapause treatments and
insecticide applications on cotton acreage triggered by pheromone trap captures.
Transgenic cotton varieties that incorporate bacillus thuringiensis (Bt) are effective
primarily against the tobacco budworm, cotton bollworm, and pink bollworm.

4
Tobacco Budworm and Cotton Bollworm
The cotton bollworm and tobacco budworm are different species, but the larvae are
identical when observed in the cotton field. These two insects are often referred to as the
bollworm/budworm complex, because field identification is nearly impossible until the
third instar stage. The life cycle of each insect is similar. Both species overwinter as
pupae in the soil and emerge early in the spring to feed on wild hosts and later to infest
cotton [31].
Female moths lay 1000-2000 eggs on the upper parts of cotton plants over a period of 3-
12 days [21]. Eggs are laid singly, usually in the terminal area and on other tender plant
parts. However, eggs may be laid all over the plant, especially on blooms. The eggs are
pearly white to a cream color and are about half the size of a pinhead. The eggs hatch
into small larvae in three to four days. The life cycle from egg to adult requires about 30
days on average, with the larvae feeding for about 14 to 16 days. The newly hatched
larvae first feed on the terminals and younger squares. Larger larvae feed primarily on
the squares and bolls. Fully grown larvae drop to the ground, burrow into the soil about
2-6 inches and pupate. When they emerge again as moths, they begin another life cycle.
There may be as many as three or four generations per season.
Cotton is less susceptible to yield loss from bollworm/budworm before the cotton plants
begin blooming than later in the season when the second and subsequent generations
occur. Feeding damages or destroys the squares, blooms and bolls. Injured squares flare
and drop from plants usually within 5 to 7 days. Large larvae feed on bolls, squares and
pollen in open flowers. They may even devour the contents of large bolls. Worm-
damaged bolls frequently are lost to boll rot even if not eaten completely. Larvae may
"top" young plants by devouring the terminal. This often delays plant growth and may
cause abnormal, nonproductive growth [32].

5
The cotton bollworm is known by several other common names, as it infests many other
crops besides cotton. It is the same insect as the corn earworm. In areas where both
cotton and corn are grown, this insect prefers corn, and only moves into cotton fields
after the corn crop begins to dry down.
Without effective control, cotton bollworm/tobacco budworm have been observed to
cause average yield losses of 67% [22].
Natural enemies contribute significantly to control of early generations of bollworms
[21], [23]. However, if insecticides need to be applied for control of other pests, such as
the boll weevil, populations of the beneficial insects are reduced which results in larger
populations of bollworms/budworms.
When populations of budworms/bollworms exceed recommended thresholds, growers are
advised to spray insecticides for their control [3]. There are 14 active ingredients
recommended for control of budworms/bollworms. They are listed in Table 32.3 with
their use rates. Their average use rate is .25 lbs AI/A.
Insecticides have been extensively used for bollworm/budworm control since the 1940’s
and have included DDT, toxaphene, methyl parathion, and chlordimeform. Synthetic
pyrethroids (permethrin and others) were introduced for budworm/bollworm control in
the 1970’s and proved highly effective until problems of resistance began to be
documented.
Table 32.4 displays estimates of the number of sprays by state since 1990 for
bollworm/budworm control. There was a significant increase in the number of sprays in
the mid 1990’s as pyrethroid resistance became more of a problem. The reduction in
bollworm/budworm sprays since 1995 is largely due to the introduction of insect resistant
cotton (described below).
6
Table 32.5 displays estimates of cotton yield losses due to budworms/bollworms by state
since 1990. Large losses were recorded in certain states such as Alabama in the mid
1990’s due to pyrethroid resistance problems. The reduction in losses due to
budworm/bollworm since 1995 is largely due to the introduction of insect resistant cotton
(described below).
Pink Bollworm
The first infestation in North America by the pink bollworm was reported in Mexico in
1916, presumably introduced through cotton seed shipments from Egypt. Pink bollworm
infestations were found the following year in Texas, imported from Mexico also on
cotton seed shipments. By 1926, the pink bollworm had spread from Texas through New
Mexico and into eastern Arizona. Although eradication was declared in Arizona in 1934,
1938 and 1946, the pink bollworm eventually spread across Arizona and into Southern
California by 1965 [33]. Pink bollworm has been unable to establish damaging levels in
the mid-south and southeastern regions of the country despite infrequent detections in
Louisiana, Arkansas, Tennessee and Missouri.
Pink bollworm is a major pest of cotton in Southern California deserts, Central and
Northwestern Arizona, New Mexico and Far West Texas. The Imperial Valley of
California had a peak in cotton acreage of approximately 143,000 acres in 1977 and
averaged near 86,000 acres from 1978-1981, but has declined rapidly since to about
19,000 acres in 1998. This decline has been due to increased costs of controlling the pink
bollworm and to declining commodity prices [33]. The cost of insecticide use was
$258/A in the 1988/89 growing season or 23 % of the total crop production cost [46].
A female pink bollworm moth usually produces about 200 eggs, which are laid on the
stems and squares and occasionally on terminal buds [34]. Eggs are about 1/50in. long
and are usually deposited singly and normally hatch within 4 to 5 days. Developing
larvae bore into and feed on the developing flower or into a boll to feed on the seed.
Larvae feed for 10 to 14 days. They usually leave the fruit and pupate in the soil, taking

7
about 8 days to transform into an adult. During the latter part of the season, when cooler
temperatures and decreased day length prevail, mature larvae enter a diapause. The larvae
may leave the boll before their inactive stage and spin a loose cocoon in leaf litter or in
the soil to overwinter, or they may remain inside the boll and overwinter there. With
increasing temperatures in the spring, diapausing larvae become active, pupate, and
emerge to become the initial population of adults infesting the young cotton [24].
Shredding and discing crop debris promptly after harvest reduces overwintering
populations to a level that can be managed economically [20]. Buildup of the
overwintering population occurs in September when long-cycle larvae are entering
diapause.
Predators such as lacewing larvae and bigeyed bugs feed on pink bollworm eggs and
small larvae, but the large numbers that would be required for reliable control are seldom
found in cotton fields.[20]
A standard management practice is terminating the growth of new green bolls by early
September by cutting off irrigation water and harvesting early. A regulatory program
mandating a cotton treatment on September 1st with a defoliant or plant growth regulator,
and plowing shredded cotton stalks on November 1st was initiated in California’s
Imperial Valley in 1989. Although this has been modified, cotton cultural practices such
as dates for planting, irrigation water cutoff, and stalk destruction are still tightly
regulated.
Pink bollworm is not established in the San Joaquin Valley although adults are apparently
carried there by winds from southern California. Release of millions of sterilized adults
each season by a cooperative program between growers and USDA is designed to prevent
immigrating adults from mating and reproducing. [20]
Cotton yield in pink bollworm infested fields may be reduced 50 to 80%. [25]

8
Damage is caused in the late season, as developing larvae tunnel through the boll wall
and then lint fiber as they move from seed to seed. Larvae feed on squares in the early
season without economic damage to the crop. But once bolls are present, they become
the preferred food supply. The burrowing activity stains lint, destroys fibers and reduces
seed weight, vitality and oil content. Pink bollworms cut holes in boll walls as they leave
bolls for pupation. These holes may become infected with boll-rotting organisms.
During severe infestation, many bolls that might otherwise have been harvested are
rendered unpickable [32] [34].
Bt Cotton
Transgenic cotton carrying the insect-resistant Bt gene was commercialized in 1996. The
Bt gene was first introduced into a soil-borne bacterium Agrobacterium tumefaciens,
which normally infects wound sites of a plant and transfers a segment of a plasmid into
the plant cell. Hormone genes located in a portion of the plasmid are integrated into the
plant chromosome. Subsequent expression of the hormone genes results in cell
proliferation. This ability of A. tumefaciens to transfer DNA into plant cells can be
exploited to transform plants with useful genes, by inserting the genes of interest into the
DNA that are then transferred to the plant cells. In laboratory experiments, whole plants
assayed under conditions of high insect pressure with cotton bollworm showed effective
square and boll protection [45].
Field tests confirmed that plants expressing these modified genes were capable of
providing effective control of tobacco budworm, pink bollworm and of moderate levels
of bollworm [35]. Bt cotton plants were shown to be highly toxic to first to fourth instars
of bollworm and tobacco budworm, but not to fifth instars [36]. Four years of field-
testing in Mississippi showed that Bt cotton prevented crop failure when tobacco
budworm populations were high [37].

9
Bt cotton represented the first true larvicide for pink bollworm. Conventional controls
historically targeted the non-damaging stage of pink bollworm, the moth [38]. In tests
that evaluate the survival of fourth instar larvae of pink bollworm, numbers of larvae in
the Bt cotton fields were extremely low or zero, even in fields adjacent to heavily infested
control fields [39].
Research indicated that Bt cotton provides: (1) 95% control of the tobacco budworm; (2)
90% control of the cotton bollworm (pre-bloom); (3) 70% control of the cotton bollworm
(bloom); and 99% control of the pink bollworm. [40]
Table 32.6 has estimates of state-by-state adoption of Bt cotton 1996-2001.
Estimated Impacts
For 13 cotton-producing states detailed economic comparisons of Bt and non-Bt cotton
have been released by university specialists and/or by Monsanto. These comparisons
have included yields (volume and value), insect control costs, number of insecticide
applications and changes in net revenue. These per-acre impact estimates are presented in
the following section on a state-by-state basis. The per-acre estimates are used to
calculate aggregate impact estimates by state.
Arkansas
Bt cotton was initially planted in Arkansas in areas with traditionally troublesome
tobacco budworm problems primarily in southwest Arkansas [5]. With the initiation of
the Boll Weevil Eradication Program in 1999 in Arkansas, the planting of Bt cotton
increased due to the negative effects on beneficial predators of the increased boll weevil
sprays. In 2000 it was estimated that Bt cotton might have required one insecticide
application to control budworm/bollworm while conventional cotton required several
applications [5]. The University of Arkansas has implemented side-by-side comparisons
of Bt cotton varieties with non-Bt varieties for six years beginning in 1996 [27]. The per-

10
acre impacts of Bt cotton based on the 40 comparisons reported for Arkansas are shown
in Table 32.7. The average change in net return for Bt cotton is a positive $12/A. The per-
acre impact estimates are used to calculate aggregate impact estimates for Arkansas
shown in Table 32.8.
Louisiana
During 1986, tobacco budworm resistance to pyrethroid insecticides was documented in
Louisiana [14]. By 2000, research demonstrated that pyrethroids no longer provided
effective control in Louisiana. Because of increasing resistance problems, insecticide
applications for bollworm/budworm control averaged approximately 5/a in the early
1990’s.
Growers who initially adopted Bt cotton in Louisiana were able to reduce their
applications to 1.5/A [5]. The Boll Weevil Eradication Program was initiated in
Louisiana in 1999 and the entire state was in an active boll weevil eradication program in
2000. Planting of Bt cotton increased due to the negative effects of the boll weevil sprays
on predators of bollworms/budworms. Table 32.9 summarizes a comparison of Bt and
non-Bt acreage in Louisiana for 2000. The non-Bt grower applied 7.8 sprays/A in
comparison to 4.4 for the Bt grower. Overall the Bt cotton acre showed a $12.20/A
advantage in net return in comparison to the non-Bt acre –largely due to savings in
insecticide costs.
Table 32.10 summarizes the aggregate impacts of the adoption of Bt cotton in Louisiana.
Growers’ net returns are estimated to be $6.9 million higher as a result of adoption.
Texas
Initially, Bt cotton was not offered in stripper varieties and as a result adoption in Texas
was relatively low in 1996/98. Some isolated areas where tobacco budworm or pink
bollworms were annual problems planted Bt cotton immediately [5]. Bt cotton performed
11
well in controlling the budworm/bollworm and the pink bollworm even under very high
pressure. Fields of Bt cotton received fewer treatments for bollworms (1 vs 2) [5]. Bt
cotton yields were generally very good compared to other varieties. Bt cotton was first
released in stripper type cotton in 1999. In 2000 an expansion in Bt cotton acreage
occurred mostly in the boll weevil eradication zones [5]. The use of Bt cotton in these
areas is credited with reducing yield loss and the number of sprays for caterpillars [5].
A comparison of Bt cotton yields with yields of other varieties (Roundup Ready without
Bt) conducted by Delta Pine and Texas Tech indicated an average yield advantage in
1999/2000 due to Bt cotton of 66 pounds per acre [9]. A comparison of Texas fields by
Monsanto indicated an average yield advantage of 129 pounds per acre in 2000 [7]. The
average of the results from the two studies suggests a Bt cotton yield advantage of 97
pounds per acre. The Monsanto data indicated an overall reduction of 1.3 sprays/a with
Bt cotton and a $.48/a increase in total insect control costs (including technology fees).
The Delta Pine/Texas Tech and Monsanto data are shown in Table 32.11. These per acre
estimates are used to calculate aggregate impact estimates for Bt cotton adoption in
Texas-shown in Table 32.12.
Arizona
In the year preceding the introduction of Bt cotton (1995), an average of 6.3 insecticide
applications were made per acre of cotton in Arizona. Insecticide use in Arizona cotton
declined each year since to 2 applications/A. These dramatic reductions in insecticide use
are not solely attributable to Bt cotton since effective new insecticides were also
introduced for use during this time period. Nevertheless, state entomologists have
concluded that Bt cotton has played a major role in this reduction [17]. In recent years
(2000), state entomologists have concluded that the widespread planting of Bt cotton has
led to a generalized area-wide suppression of the pink bollworm in Arizona even on non-
Bt cotton which , as a result, has not been sprayed as often as in past years [5].

12
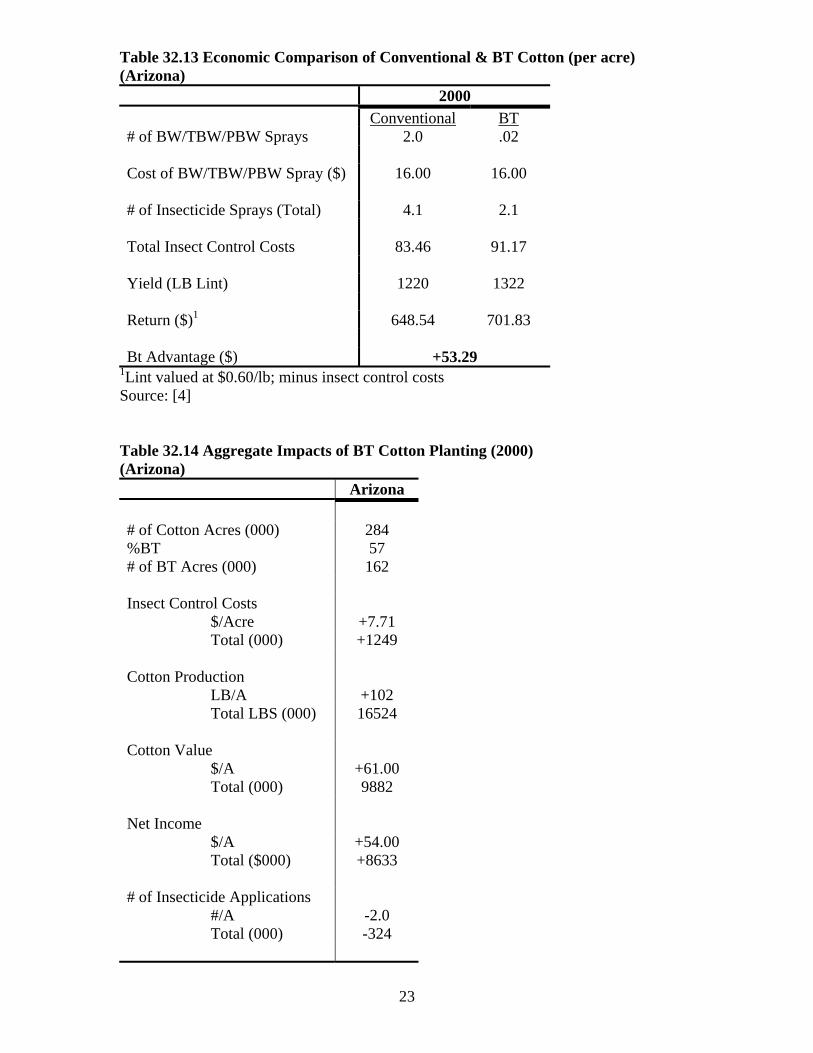
Table 32.13 shows a comparison of insecticide use, costs, yields and returns from
conventional vs Bt cotton grown in Arizona in 2000. The Bt cotton is estimated to have
been sprayed two fewer times than the conventional acre. Although insect control costs
are higher in the Bt cotton (due to the Bt cotton technology fee), yields were also higher
which resulted in a net income advantage for Bt cotton of $54/A. Table32.14 summarizes
the aggregate impacts of Bt cotton in Arizona: a net return increase of $8.6 million/yr.
Oklahoma
Adoption of Bt cotton was slow in Oklahoma until resistant bollworm/budworm
problems surfaced during the 1998 growing season [18]. 1999 also marked the first year
of the Boll Weevil Eradication Program, which increased grower adoption of the Bt
cotton varieties [18]. A four-year analysis of Bt acreage compared to non-Bt acreage
indicated that the conventional acre was sprayed .8 times for bollworm while the Bt acre
was sprayed .4 times [18]. Because of the technology fee for Bt cotton, overall insect
control costs were higher on the Bt acre. However, higher yields on the Bt acre meant
that average net return was greater on the Bt acre in Oklahoma 1996-1999 [18].
Table 32.15 displays an economic comparison of Bt vs. non-Bt acreage in Oklahoma for
2000 [19]. The per-acre advantage of $63 is used to estimate aggregate impact estimates
shown in Table 32.16.
Tennessee
Tennessee has not consistently had a bollworm/tobacco budworm problem [12]. As a
result, adoption of Bt cotton 1996-1998 was relatively low. However, with the initiation
of the boll weevil eradication program in Tennessee in 1999, growers were advised to
plant as much Bt cotton as possible because of the deleterious effects of the multiple boll
weevil sprays on predators of the bollworm/budworm. [13]. As a result, the acreage of Bt
cotton expanded significantly. Resistance to pyrethroid insecticides also contributed to
the significant Bt planting in 1999-2000 [5]. A University of Tennessee comparison of Bt

13
and non-Bt fields in 1998 and 1999 indicated higher yields of lint (17-85lbs/a). The
average net return to the Bt cotton was $22/A greater than for the non-Bt acre [12].
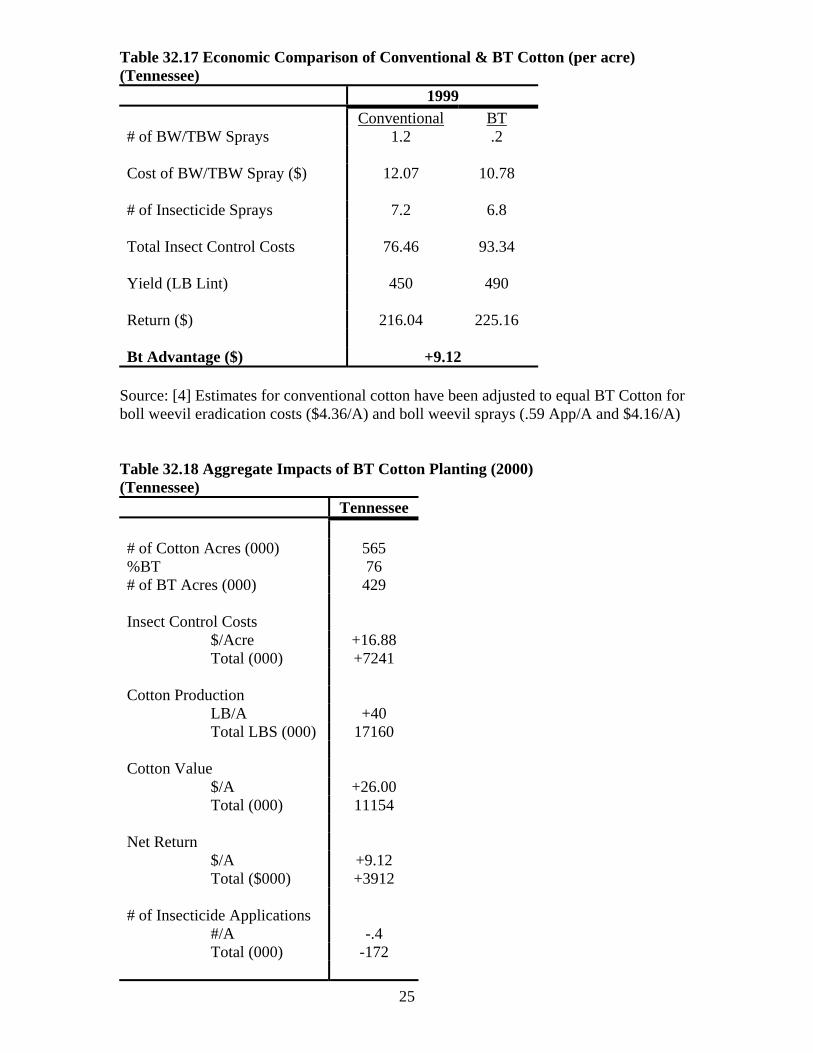
An economic comparison of conventional and Bt cotton acreage in Tennessee is
presented in Table 32.17 based on a University of Tennessee’s entomologist’s
comparison of Bt vs non-Bt acreage in 1999 [4]. Cotton yield on the Bt acreage is
estimated to be 40 lbs/a greater than the conventional yield while insecticide sprays are
estimated to be lower. Bt growers show a higher cost per acre due to a Bt technology cost
of $17/A. The Bt advantage overall is estimated at $9/A. Table 32.18 summarizes the
aggregate effects of planting Bt cotton in Tennessee. Growers are estimated to produce
17 million pounds more of cotton per year with an improved net return of $3.9 million
per year.
North Carolina/South Carolina/Virginia
In North Carolina, South Carolina and Virginia, caterpillar pest pressure has traditionally
been low with the primary target being bollworms which are not completely controlled
by Bt cotton [15]. Research in North Carolina demonstrated that Bt cotton consistently
suffered less boll damage than did conventional cotton with less insecticide sprays per
acre (.52 vs 2.51 in 1996/97) [15]. An economic evaluation of Bt technology in South
Carolina in 1996 indicated that yield was not statistically different between Bt and non-Bt
plots but savings in insecticide costs more than outweighed the technology fee [16]. Bt
cotton earned $68 and $17/acre more than the conventional cotton production.
Table 32.19 summarizes Monsanto Bt cotton impact estimate is for 2000 for North
Carolina/South Carolina/Virginia and estimates made by entomologists from North
Carolina State University. Both datasets show that insect control costs are relatively close
between Bt and non-Bt acreage with reduced insecticide costs being offset by the
technology fee for Bt cotton. Both comparisons show an increased yield from Bt cotton
which improves the net return to Bt cotton by $7- $11/A.

14
Table 32.20 shows aggregate impact estimates for the three states which have been
calculated using the average of the Monsanto and NCSU data. Net return to cotton
growers in the three states is estimated to be $5.8 million/yr higher as a result of Bt
cotton.
Mississippi
In 1995 in the Hill region of Mississippi, bollworm/budworm populations were extremely
heavy and high levels of insecticide resistance made it impossible for growers to achieve
effective control. By the first week in August, the most heavily infested fields incurred 50
to 90 % damaged bolls [5]. In 1996, 37 % of Mississippi’s cotton acreage was planted to
Bt transgenic varieties with a higher portion planted in the Hill region of the state (60 %)
[5]. In 1997, the Hill portion of the state initiated a Boll Weevil Eradication Program.
Approximately 10.5 treatments were made per acre in 1997 and 13.4 applications were
made in 1998 [5]. Acreage in the Hill region planted to Bt increased to 85%. The
Southern Delta region initiated a Boll Weevil Eradication Program in 1998 while the
North Delta region initiated the program in 1999. In anticipation of the destructive effects
of the boll weevil sprays on predators, growers in all regions of the state increased
planting of Bt cotton. Much higher populations of bollworms were seen in 1998 as a
result of increased planting of corn with the resulting move of the worms from corn to
cotton in July [5]. Non-Bt fields in the Hill region reported severe bollworm infestations
that were difficult to control and suffered severe yield losses despite high control costs.
Statewide surveys indicated that Bt acreage received significantly fewer sprays for
bollworm/budworm than did non-Bt fields: -2.7(1996), -2.3(1997),-4.0 (1998),
-2.0(1999), and –2.2 (2000). Overall the Bt acreage received fewer sprays than the
non-Bt fields: -3 (1998), and –1.95(2000) [41], [42].
Multiyear economic assessments comparing Bt and non-Bt cotton fields have been
conducted for two regions in Mississippi: the Hills/Delta and the Delta [43] [44]. The
comparative results are shown in Table 32.21. The yield advantage in the Hill/Delta
region was much greater than in the Delta region (90 lbs vs. 1 lb). The averages of the

15
data from the two regions have been used to calculate aggregate impact estimates for
Mississippi as shown in Table 32.22.
Alabama/Georgia/Florida
By 1995 the boll weevil eradication program resulted in the elimination of any yield loss
in cotton due to boll weevil damage in these three states [10]. Losses to the bollworm and
tobacco budworm were consistently low from 1980 to 1992 during a period when
pyrethroid insecticides were most effective. From 1993-1995 cotton losses due to
bollworms/budworms increased to 20-50% of total yield in Alabama reflecting the
development of resistance in the budworm species to all classes of available insecticides
[10]. At the end of 1995 it was concluded that without some new method of insect
control that it would not be possible to grow cotton economically in Alabama [5].
Bt cotton became available in 1996 and Alabama growers planted 65% of the state’s
acres with Bt varieties. Statewide yield loss due to bollworm/budworm declined from
29% to 3%. Acreage planted with Bt cultivars reached 80% in Alabama in 1997 and 79-
80% in Florida in 1997 and 1998 respectively. Georgia reached 51% in 1999. Bt cotton is
credited with saving the cotton industry in Alabama [47].
A 1996 University study of Georgia producers indicated a yield advantage for Bt cotton
of 104 pounds per acre in comparison to non-Bt fields [11]. Bt fields received 1.1 sprays
per acre in comparison to 3.6 applications on the non-Bt acres. The total increase in
income and reduction in insecticide costs was estimated at $100/A, which was partially
offset by a $32/A technology fee [11]. A Monsanto comparison of Bt and non-Bt sites in
Georgia and Alabama indicated an increase in net income of $38/A in 1998 as Bt cotton
growers incurred lower insect control costs and higher yields [8].
Since 1998/99, Bt cotton acreage has declined in all three states. Tobacco
budworm/bollworm pressure has been extremely light and some growers concluded that
the savings would not exceed the cost of the technology [5]. A Monsanto comparison for

16
Georgia/Alabama for 2000 showed only an increase of $2.64/A in net income on the Bt
acreage (see Table 32.23) [7]. The Monsanto data for 2000 are used to calculate
aggregate impact estimates for Georgia/Alabama/Florida (shown in Table 32.24).
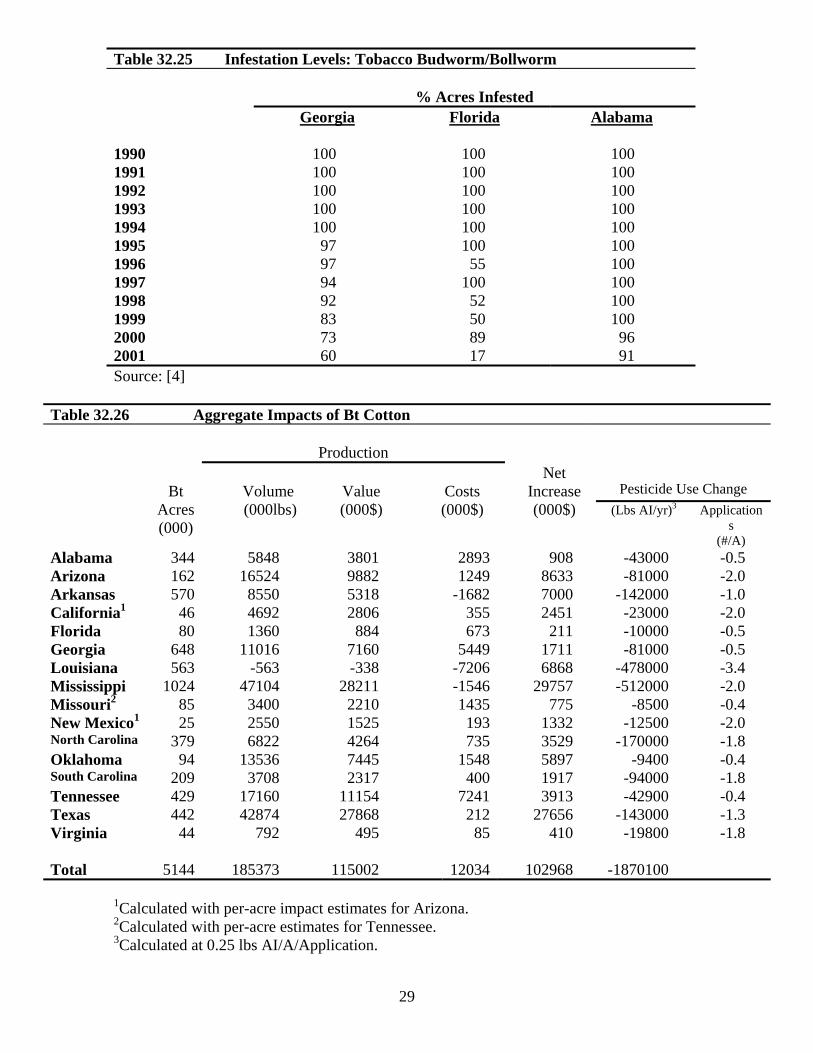
As noted above, recently there has been a reduction from traditional infestation levels of
budworm/bollworm in AL, FL and GA. Table 32.25 charts the infestation levels 1990-
2001.
California/New Mexico/Missouri
For California, New Mexico and Missouri, for which state-specific data could not be
located, aggregate estimates are made based on a neighboring state (Arizona, Tennessee).
Since 1996 nearly 80% of the cotton in Imperial County California has been planted with
Bt cotton [28].
In 1995 it was recognized that the boll weevil had become an established pest in New
Mexico and Boll Weevil Eradication Programs commenced in 1998, which led to
increased planting of Bt cotton [5].
Summary
Table 32.26 summarizes the aggregate impact estimates by state. Bt cotton is estimated to have been planted on 5.1 million acres in 2000 and resulted in
increased cotton production of 185 million pounds of lint valued at $115 million. The
planting of Bt cotton increased growers insect control costs by $12 million, which
produced a net gain in income of $103 million ($20/A). It is estimated that insecticide use
was lowered by 1.9 million pounds in 2000 as a result of planting Bt cotton.

17
Table 32.1 Cotton Production By State: 2000 Harvested
Acres (000) Yield (lbs/A) Production
(000 bales/yr.)Value (million $)
Alabama 530 489 540 141 Arizona 284 1302 770 222 Arkansas 950 733 1450 395 California 914 1339 2550 897 Florida 106 453 100 27 Georgia 1350 583 1640 453 Kansas 37 298 23 6 Louisiana 695 628 910 236 Mississippi 1280 649 1730 416 Missouri 388 668 540 152 New Mexico 90 736 137 37 North Carolina 925 747 1440 422 Oklahoma 170 438 155 42 South Carolina 290 629 380 115 Tennessee 565 607 715 187 Texas 4416 433 3980 987 Virginia 108 707 159 47 Total 13098 631 17219 4782 480 pound bales Source [1] [2] Table 32.2 Insect Infestations in Cotton: 2001 (% of Acres Infested) Bollworms/
Budworms
Boll Weevils
Lygus Pink Bollworms
Aphids
Alabama 91 0 88 0 100Arizona 28 0 99 99 1Arkansas 100 100 100 0 100California1 0 0 50 0 90Florida 17 0 35 0 100Georgia 60 0 20 0 7Louisiana 88 0 87 0 55Mississippi 100 0 100 0 28Missouri 39 12 84 0 32New Mexico 36 68 19 23 13North Carolina 100 0 100 0 100Oklahoma 100 53 8 0 53South Carolina 97 0 9 0 52Tennessee 77 77 88 0 80Texas 47 18 25 <1 66Virginia 98 0 48 0 50 US 64 18 55 2 58Source: [4] 1San Joaquin Valley only

18
Table 32.3 Insecticides Recommended for Budworm/Bollworm Control (lb/AI A) Acephate 1.00 Bifenthrin 0.06 Cyfluthrin 0.04 Cypermethrin 0.05 Deltamethrin 0.02 Esfenvalerate 0.04 Indoxacarb 0.11 Lambdacyhalothrin 0.03 Methomyl 0.45 Profenofos 1.00 Spinosad 0.08 Thiodicarb 0.60 Tralomethrin 0.02 Zetamethrin 0.04 Average 0.25
Source: [3] Table 32.4 Insecticide Treatments for Tobacco Budworm, Cotton Bollworm and Pink Bollworm (number of applications/ yr/ acre)
1990 1991 1992 1993 1994 1995 1996 1997 1998 1999 2000 Alabama 2.5 2.9 2.9 4.8 4.4 6.7 0.1 0.5 1.4 0.4 0.3 Arizona 7.4 3.2 1.1 0.1 2.9 2.9 2.0 1.1 0.4 0.4 0.7 Arkansas 2.4 3.3 3.7 3.6 3.0 4.6 2.3 1.6 3.1 0.5 2.2 California 0.1 0.3 0.0 0.0 0.0 0.0 0.0 0.0 0.0 0.0 0.0 Florida 7.2 5.0 5.0 5.3 5.3 5.7 1.1 1.0 2.0 0.5 0.3 Georgia 5.0 4.9 3.4 2.7 4.3 3.4 1.7 2.5 1.5 0.6 1.1 Louisiana 5.0 3.5 5.8 4.7 4.8 4.7 3.9 3.2 3.5 1.2 1.3 Mississippi 3.4 1.5 5.1 4.3 4.1 5.7 2.2 2.5 2.5 1.3 0.9 Missouri 0.1 0.3 0.3 0.9 0.8 1.3 0.1 0.7 1.6 0.9 0.9 New Mexico 1.1 0.8 0.3 0.3 0.7 0.8 1.1 0.7 2.0 1.2 1.1 North Carolina 2.8 3.1 3.0 2.5 3.6 2.6 3.1 2.0 3.0 1.9 1.7 Oklahoma 0.9 1.3 1.1 2.3 0.7 1.8 1.7 1.9 1.5 0.7 0.5 South Carolina 3.8 3.8 3.7 4.9 4.4 4.7 4.2 3.3 3.4 1.1 1.0 Tennessee 0.3 0.6 0.1 2.0 0.3 2.9 0.2 0.3 2.7 0.6 0.8 Texas 0.7 1.1 0.7 0.4 0.7 0.5 0.7 0.6 0.6 0.1 0.2 Virginia 1.5 2.5 0.2 1.0 1.7 1.5 1.0 1.2 2.2 1.8 2.0 Source: [4]

19
Table 32.5 Cotton Yield Loss Due to Tobacco Budworm, Cotton Bollworm and Pink Bollworm
1990 1991 1992 1993 1994 1995 1996 1997 1998 1999 2000 % Alabama 1.4 1.7 2.5 6.8 6.1 29.1 3.1 3.2 4.7 2.0 0.6 Arizona 4.6 1.1 0.7 0.1 3.9 1.2 2.8 2.7 0.8 1.0 1.4 Arkansas 1.3 1.5 2.6 1.5 1.8 3.6 3.1 2.7 4.7 1.3 3.3 California 0.4 0.0 0.0 0.0 0.0 0.0 0.0 0.0 0.0 0.0 0.0 Florida 9.1 4.0 3.0 3.0 3.7 3.9 3.3 4.3 2.1 0.7 0.5 Georgia 5.0 1.0 1.8 1.9 1.9 2.8 1.9 2.5 2.8 0.8 1.5 Louisiana 4.0 3.5 7.5 3.6 2.9 3.2 2.3 1.9 1.5 0.8 1.0 Mississippi 4.5 0.6 3.9 3.9 4.1 8.0 1.9 2.4 4.2 2.5 2.2 Missouri 1.1 1.6 1.7 0.9 0.5 1.4 1.3 1.3 6.1 0.7 1.5 New Mexico 5.0 3.4 1.6 3.0 1.6 3.3 10.6 8.6 6.1 3.9 3.4 North Carolina 3.6 12.6 4.3 2.3 6.4 3.7 5.2 5.3 4.4 4.1 3.2 Oklahoma 1.2 1.6 3.3 3.1 1.7 2.5 3.3 3.0 4.0 5.0 3.0 South Carolina 2.4 1.9 2.8 3.4 3.4 4.7 5.0 4.7 3.5 1.9 3.9 Tennessee 0.3 1.0 1.0 6.7 0.5 10.8 0.8 1.0 5.9 1.6 1.5 Texas 1.1 1.8 1.4 0.5 0.8 1.0 3.0 1.7 1.3 0.4 1.0 Virginia 12.5 4.0 0.2 0.0 0.5 1.0 2.0 0.3 0.0 0.3 0.9 Source: [4] Table 32.6 USDA AMS Bt Cotton Adoption Estimates
1996 1997 1998 1999 2000 2001 percent of planted acres Alabama 65 80 61 75 65 64 Arizona 11 64 57 56 57 60 Arkansas 15 14 14 22 60 60 California 0 2 5 8 6 5 Florida 42 79 80 66 75 72 Georgia 23 34 47 51 48 44 Louisiana 21 32 71 67 81 87 Mississippi 37 45 60 66 75 80 Missouri 0 0 0 1 5 22 New Mexico 9 13 38 28 36 28 North Carolina 3 2 4 37 41 55 Oklahoma 2 7 2 47 55 58 South Carolina 16 27 17 84 71 79 Tennessee 0 6 7 59 76 85 Texas 1 4 7 9 10 13 Virginia 0 3 1 16 41 33 US 12 18 23 32 39 42 Source: [6]
20
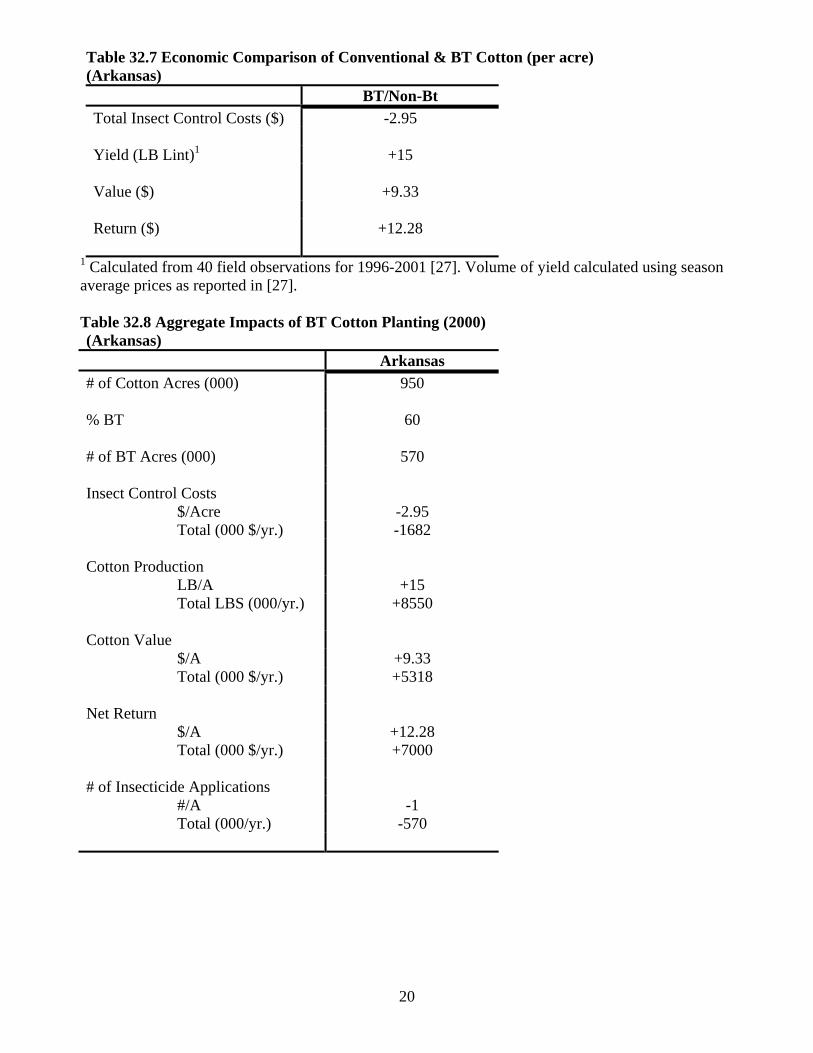
Table 32.7 Economic Comparison of Conventional & BT Cotton (per acre) (Arkansas) BT/Non-Bt Total Insect Control Costs ($) -2.95 Yield (LB Lint)1 +15 Value ($) +9.33 Return ($) +12.28
1 Calculated from 40 field observations for 1996-2001 [27]. Volume of yield calculated using season average prices as reported in [27]. Table 32.8 Aggregate Impacts of BT Cotton Planting (2000) (Arkansas) Arkansas # of Cotton Acres (000) 950 % BT 60 # of BT Acres (000) 570 Insect Control Costs $/Acre -2.95 Total (000 $/yr.) -1682 Cotton Production LB/A +15 Total LBS (000/yr.) +8550 Cotton Value $/A +9.33 Total (000 $/yr.) +5318 Net Return $/A +12.28 Total (000 $/yr.) +7000 # of Insecticide Applications #/A -1 Total (000/yr.) -570

21
Table 32.9 Economic Comparison of Conventional & BT Cotton (per acre) (Louisiana) 2000 Conventional BT # of BW/TBW Sprays 4.5 .9 Cost of BW/TBW Spray ($) 10.87 7.04 # of Insecticide Sprays 7.8 4.4 Total Insect Control Costs 94.00 81.20 Yield (LB Lint) 640 639 Return ($)1 290.00 302.20 Bt Advantage ($) +12.20
1Lint valued at $0.60/lb; minus insect control costs Source: [4] Table 32.10 Aggregate Impacts of BT Cotton Planting (2000) (Louisiana) Louisiana # of Cotton Acres (000) 695 %BT 81 # of BT Acres (000) 563 Insect Control Costs $/Acre -12.80 Total (000) -7206 Cotton Production LB/A -1 Total LBS (000) -563 Cotton Value $/A -.60 Total (000) -338 Net Return $/A +12.20 Total ($000) +6868 # of Insecticide Applications #/A -3.40 Total (000) -1914

22
Table 32.11 Economic Comparison of Conventional & BT Cotton (per acre) (Texas) (Delta Pine/ Texas Tech) Monsanto 1999/2000 2000 Conventional BT Conventional BT # of BW/TBW Sprays 3.0 .3 Cost of BW/TBW Spray ($) 9.75 17.35 # of Insecticide Sprays 6.3 5.0 Total Insect Control Costs 62.81 63.29 Yield (LB Lint) 910 976 667 796 Return ($) 370.53 454.11
Source: [9] [7] Table 32.12 Aggregate Impacts of BT Cotton Planting (2000) (Texas) Texas # of Cotton Acres (000) 4416 %BT 10 # of BT Acres (000) 442 Insect Control Costs $/Acre +.48 Total (000) +212 Cotton Production LB/A1 +97 Total LBS (000) 42874 Cotton Value $/A (at $0.65/lb) +63.05 Total (000) 27868 Net Return $/A +62.57 Total ($000) 27655 # of Insecticide Applications #/A -1.3 Total (000) -575
1 Average of Delta Pine/Texas Tech and Monsanto data
23
Table 32.13 Economic Comparison of Conventional & BT Cotton (per acre) (Arizona) 2000 Conventional BT # of BW/TBW/PBW Sprays 2.0 .02 Cost of BW/TBW/PBW Spray ($) 16.00 16.00 # of Insecticide Sprays (Total) 4.1 2.1 Total Insect Control Costs 83.46 91.17 Yield (LB Lint) 1220 1322 Return ($)1 648.54 701.83 Bt Advantage ($) +53.29
1Lint valued at $0.60/lb; minus insect control costs Source: [4] Table 32.14 Aggregate Impacts of BT Cotton Planting (2000) (Arizona) Arizona # of Cotton Acres (000) 284 %BT 57 # of BT Acres (000) 162 Insect Control Costs $/Acre +7.71 Total (000) +1249 Cotton Production LB/A +102 Total LBS (000) 16524 Cotton Value $/A +61.00 Total (000) 9882 Net Income $/A +54.00 Total ($000) +8633 # of Insecticide Applications #/A -2.0 Total (000) -324

24
Table 32.15 Economic Comparison of Conventional & BT Cotton (per acre) (Oklahoma) 2000 Conventional BT # of BW/TBW Sprays .8 .4 Cost of BW/TBW Spray ($) 12.50 12.50 # of Insecticide Sprays 3.4 3.0 Total Insect Control Costs 32.50 48.97 Yield (LB Lint) 614 758 Cotton Value ($) 337.70 416.90 Return ($) 304.50 367.93 Bt Advantage ($) +63.00
Source: [18] [19] Table 32.16 Aggregate Impacts of BT Cotton Planting (2000) (Oklahoma) Oklahoma # of Cotton Acres (000) 170 %BT 55 # of BT Acres (000) 94 Insect Control Costs $/Acre +16.47 Total (000) +1548 Cotton Production LB/A +144 Total LBS (000) 13536 Cotton Value $/A (at $0.55/lb) +79.20 Total (000) 7445 Net Return $/A +63.00 Total ($000) +5897 # of Insecticide Applications #/A -.4 Total (000) -38
25
Table 32.17 Economic Comparison of Conventional & BT Cotton (per acre) (Tennessee) 1999 Conventional BT # of BW/TBW Sprays 1.2 .2 Cost of BW/TBW Spray ($) 12.07 10.78 # of Insecticide Sprays 7.2 6.8 Total Insect Control Costs 76.46 93.34 Yield (LB Lint) 450 490 Return ($) 216.04 225.16 Bt Advantage ($) +9.12
Source: [4] Estimates for conventional cotton have been adjusted to equal BT Cotton for boll weevil eradication costs ($4.36/A) and boll weevil sprays (.59 App/A and $4.16/A) Table 32.18 Aggregate Impacts of BT Cotton Planting (2000) (Tennessee) Tennessee # of Cotton Acres (000) 565 %BT 76 # of BT Acres (000) 429 Insect Control Costs $/Acre +16.88 Total (000) +7241 Cotton Production LB/A +40 Total LBS (000) 17160 Cotton Value $/A +26.00 Total (000) 11154 Net Return $/A +9.12 Total ($000) +3912 # of Insecticide Applications #/A -.4 Total (000) -172

26
Table 32.19 Economic Comparison of Conventional & BT Cotton (per acre) (N. Carolina, S. Carolina, Virginia ) Monsanto Data1 NCSU Data2
2000 2000 BT Conventional BT # of BW/TBW Sprays 1.6 2.7 .9 Cost of BW/TBW Spray ($) 7.83 8.25 8.25 # of Insecticide Sprays 1.6 3.8 2.2 Total Insect Control Costs $) 38.28 46.99 51.02 Yield (LB Lint) 929 760 779 Return ($)
Conventional 3.7
7.97 3.7
38.42 912
554.20 565.34 409.00 416.38 Bt Advantage ($) +11.13 +7.38
1Source [7] includes 11 sites in NC/SC&VA 2Source [4] includes North Carolina only Table 32.20 Aggregate Impacts of BT Cotton Planting (2000) (N. Carolina, S. Carolina, & Virginia) N. Carolina S. Carolina Virginia Total # of Cotton Acres (000) 925 290 108 1323 %BT 41 71 41 48 # of BT Acres (000) 379 206 44 629 Insect Control Costs $/Acre +1.94 +1.94 +1.94 +1.94 Total (000) +735 +400 +85 +1220 Cotton Production LB/A +18 +18 +18 +18 Total LBS
(000) +6822 +3708 +792 +11322
Cotton Value $/A 11.25 11.25 11.25 11.25 Total (000) +4264 +2317 +495 +7076 Net Return $/A +9.30 +9.30 +9.30 +9.30 Total ($000) +3525 +1916 +409 +5850 # of Insecticide Applications #/A -1.8 -1.8 -1.8 -1.8 Total (000) -682 -371 -79 -1132 Lbs of Insecticide Use Lbs/A Total
Source: Average of Monsanto field data and NCSU data for 2000 (see Table 32.19)

27
Table 32.21 Economic Comparison of Conventional & BT Cotton (per acre) (Mississippi) Hills/Delta Delta Bt (-) Non-Bt Bt (-) Non-Bt Total Insect Control Costs ($) +0.98 -4.00 Yield (LB Lint) +90.00 +1.00 Return ($) +54.23 +0.88 Bt Advantage ($) +53.26 +4.88
Source: [43] [44] [7] Average of multiyear data. Table 32.22 Aggregate Impacts of BT Cotton Planting (2000) (Mississippi) Mississippi # of Cotton Acres (000) 1280 %BT 80 # of BT Acres (000) 1024 Insect Control Costs $/Acre -1.51 Total (000) -1546 Cotton Production LB/A +46 Total LBS (000) +47104 Cotton Value $/A +27.55 Total (000) 28211 Net Return $/A +29.06 Total ($000) 29757 # of Insecticide Applications #/A -2 Total (000) -2048

28
Table 32.23 Economic Comparison of Conventional & BT Cotton (per acre) (Georgia & Alabama) 1998 2000 Conventional BT Conventional BT # of BW/TBW Sprays 4.5 .6 2.5 .5 Cost of BW/TBW Spray ($) 40.13 5.57 24.20 4.93 # of Insecticide Sprays 5.8 2.8 3.0 2.5 Total Insect Control Costs $74.04 $60.05 $50.56 $58.97 Yield (LB Lint) 898 936 932 949 Return ($) 509.66 548.40 554.92 557.56 Bt Advantage ($) +38.74 +2.64
Source: Monsanto Field Comparisons [7] [8] Table 32.24 Aggregate Impacts of BT Cotton Planting (2000) (Georgia, Alabama, & Florida) Alabama Florida Georgia Total # of Cotton Acres (000) 530 106 1350 1986 %BT 65 75 48 54 # of BT Acres (000) 344 80 648 1072 Insect Control Costs $/Acre +8.41 +8.41 +8.41 +8.41 Total (000) +2893 +673 +5449 +9015 Cotton Production LB/A +17 +17 +17 +17 Total LBS
(000) +5848 +1360 +11016 +12964
Cotton Value $/A +11.05 +11.05 +11.05 +11.05 Total (000) +3801 +884 +7160 +11845 Net Return $/A +2.64 +2.64 +2.64 +2.64 Total ($000) +908 +211 +1711 +2830 # of Insecticide Applications #/A -.5 -.5 -.5 -.5 Total (000) -172 -40 -324 -536
29
Table 32.25 Infestation Levels: Tobacco Budworm/Bollworm
% Acres Infested Georgia Florida Alabama 1990 100 100 100 1991 100 100 100 1992 100 100 100 1993 100 100 100 1994 100 100 100 1995 97 100 100 1996 97 55 100 1997 94 100 100 1998 92 52 100 1999 83 50 100 2000 73 89 96 2001 60 17 91 Source: [4]
Table 32.26 Aggregate Impacts of Bt Cotton
Production
Pesticide Use Change
Bt
Acres (000)
Volume (000lbs)
Value (000$)
Costs (000$)
Net Increase (000$) (Lbs AI/yr)3 Application
s (#/A)
Alabama 344 5848 3801 2893 908 -43000 -0.5 Arizona 162 16524 9882 1249 8633 -81000 -2.0 Arkansas 570 8550 5318 -1682 7000 -142000 -1.0 California1 46 4692 2806 355 2451 -23000 -2.0 Florida 80 1360 884 673 211 -10000 -0.5 Georgia 648 11016 7160 5449 1711 -81000 -0.5 Louisiana 563 -563 -338 -7206 6868 -478000 -3.4 Mississippi 1024 47104 28211 -1546 29757 -512000 -2.0 Missouri2 85 3400 2210 1435 775 -8500 -0.4 New Mexico1 25 2550 1525 193 1332 -12500 -2.0 North Carolina 379 6822 4264 735 3529 -170000 -1.8 Oklahoma 94 13536 7445 1548 5897 -9400 -0.4 South Carolina 209 3708 2317 400 1917 -94000 -1.8 Tennessee 429 17160 11154 7241 3913 -42900 -0.4 Texas 442 42874 27868 212 27656 -143000 -1.3 Virginia 44 792 495 85 410 -19800 -1.8 Total 5144 185373 115002 12034 102968 -1870100
1Calculated with per-acre impact estimates for Arizona. 2Calculated with per-acre estimates for Tennessee. 3Calculated at 0.25 lbs AI/A/Application.

30
Figure 32.1 Cotton Prices Received by Farmers
00.10.20.30.40.50.60.70.80.9
1
1991 1993 1995 1997 1999 2001
Source: [2] [29] [30]
$/Lb

31
References:
1. USDA, Crop Production 2000 Summary, National Agricultural Statistics Service,
January 2001. 2. USDA, Crop Values 2000 Summary, National Agricultural Statistics Service,
February 2001.
3. 2001 Alabama Pest Management Handbook, Extension Service, Clemson University.
4. Williams, Michael R., “Cotton Insect Losses”, Proceedings Beltwide Cotton
Conferences, 1990-2001.
5. Hardee, D. D., et al, “Annual Conference Report on Cotton Insect Research and Control”, Proceedings Beltwide Cotton Conferences, 1995-2001.
6. USDA, Cotton Varieties Planted (Annual 1995-2000), Agricultural Marketing
Service-Cotton Program, Memphis Tennessee.
7. Oppenhuizen, Mark, et al, “Six Years of Economic Comparisons of Bollgard Cotton”, 2001 Proceedings Beltwide Cotton Conferences.
8. Mullins, J. W. and J. M. Mills, “Economics of Bollgard Versus Non-Bollgard
Cotton in 1998”, 1999 Proceedings Beltwide Cotton Conferences.
9. Miller, Jeff, et al., “Agronomic and Economic Evaluation of Bollgard Cottons on the Southern High Plains of Texas”, 2001 Proceedings Beltwide Cotton Conferences.
10. Meyer, Bradford A., et al., “Effect of Boll Weevil Eradication and Planting
Bollgard Varieties on Changes in the Insect Spectrum and Chemistry Needed for Cotton IPM in Alabama,” 1999 Proceedings Beltwide Cotton Conferences.
11. Stark, Robert C. Jr., et al., “Economics of Transgenic Cotton: Some Indications
Based on Georgia Producers”, 1997 Proceedings Beltwide Cotton Conferences.
12. Seward, R. W. and P. P. Shelby, “Performance and Insect Control Cost of Bollgard vs. Conventional Varieties in Tennessee”, 2000 Proceedings Beltwide Cotton Conferences.
13. Lentz, G. L., et al., “Bt Cotton Performance in West Tennessee”, 2001
Proceedings Beltwide Cotton Conferences.
14. Bagwell, R. D., et al., “Status of Insecticide Resistance in Tobacco Budworm and Bollworm in Louisiana During 1999”, 2000 Proceedings Beltwide Cotton Conferences.

32
15. Bacheler, J. S., et al., “Large Scale Evaluation of Bollgard Resistance to Multiple Pests in North Carolina Under Grower Conditions,” 1998 Proceedings Beltwide Cotton Conferences.
16. ReJesus, Roderick M., et al., “Economic Analysis of Insect Management
Strategies for Transgenic Bt Cotton Production in South Carolina”, 1997 Proceedings Beltwide Cotton Conferences.
17. Sims, Maria A., et al., “Arizona’s Multi-Agency Resistance Management
Program for Bt Cotton: Sustaining the Suspectibility of Pink Bollworm”, 2001 Proceedings Beltwide Cotton Conferences.
18. Karner, Miles, et al., “Bollgard-Impact and Value to Oklahom’s Cotton Industry
1996-1999”, 2000 Proceedings Beltwide Cotton Conferences.
19. Karner, Miles, Oklahoma State University, personal communication.
20. Integrated Pest Management for Cotton in the Western Region of the United States, University of California, Division of Agriculture and Natural Resources, Publication 3305, 1984.
21. Lambert, William R., “Bollworm Complex”, Entomology Fact Sheet, University
of Georgia, Cooperative Extension Service, July 1981.
22. Schwartz, P. H., “Losses in Yield of Cotton Due to Insects”, in R. L. Ridgeway, et al. eds, Cotton Insect Management with Special Reference to the Boll Weevil, Agricultural Handbook 589, USDA, 1983.
23. Smith, Ronald H., et al., Cotton Pest Management in the Southern United States,
Alabama Cooperative Extension Service, Auburn University, Circular ANR 194, 1981.
24. Burrows, Thomas M., et al., “History and Cost of the Pink Bollworm in the
Imperial Valley”, Bulletin of the Entomological Society of America, September 1982.
25. Henneberry, T. J., et al., “Pink Bollworm: Chemical Control in Arizona and
Relationship to Infestations, Lint Yield, Seed Damage, and Aflotoxin in Cottonseed”, Journal of Economic Entomology, 71:440-443, 1978.
26. Chu, Chang-Chi, et al., “Reduction of Pink Bollworm Populations in the Imperial
Valley, California, Following Mandatory Short Season Cotton Management Systems”, Journal of Economic Entomology, February 1996.
27. Bryant, Kelly J., et al., “Six Years of Transgenic Cotton in Arkansas”, 2001
Proceedings Beltwide Cotton Conferences.
28. “Transgenic Cotton”, University of California Pest Management Guidelines, University of California, available on the web at www.ipm.ucdavis.edu/pmg

33
29. USDA, Crop Values – Final Estimates, 1992-1997, National Agricultural Statistics Service, Statistical Bulletin No. 963, October 1999.
30. USDA, Crop Values – Final Estimates, 1987-1992, National Agricultural
Statistics Service, Statistical Bulletin No. 903, September 1995.
31. White, C.A., et al., “Biocontrol Strategies for Cotton Insect Pest Management in Northeast Louisiana,” 1993 Proceedings Beltwide Cotton Conferences.
32. Bohmfalk, G.T., et al., Identification, Biology and Sampling of Cotton Insects,
Texas Agricultural Extension Service, B-933, 1982.
33. Natwick, Eric T., et al., “Pink Bollworm Control Using a High Rate Gossyplure Formulation,” 1987 Proceedings Beltwide Cotton Conferences.
34. University of California, UC IPM Pest Management Guidelines, Publication
3339.
35. John, Maliyakal E., “Cotton Crop Improvement Through Genetic Engineering,” Critical Reviews in Biotechnology, vol. 17, no. 3, 1997.
36. Halcomb, J.L., et al., “Survival and Growth of Bollworm and Tobacco Budworm
on Nontransgenic and Transgenic Cotton Expressing a CryIA Insecticidal Protein (Lepidoptera: Noctuidae),” Environmental Entomology, vol. 25, no. 2, 1996.
37. Stewart, Scott, et al., “Cotton Insect Control Strategy Project: Comparing Bt and
Conventional Cotton Management and Plant Bug Control Strategies at Five Locations in Mississippi, 1995-1997,” 1998 Proceedings Beltwide Cotton Conferences.
38. Ellsworth, Peter, et al., “Bt Cotton in Arizona: What Will Change?” Yuma
County Farm Notes, Arizona Cooperative Extenstion, April 1998.
39. Flint, H.M., et al., “Seasonal Infestation by Pink Bollworm, Pectinophora gossypiella (Sauders) of the Transgenic Cotton, Containing the Bollgard Gene, Planted in Commercial Fields in Central Arizona,” Southwestern Entomologist, vol. 21, no. 3, 1996.
40. Moore, Glen C., et al., Bt Cotton Technology in Texas: A Practical View, Texas
Agricultural Extension Service, L-5169, 1999.
41. M.B., Layton, et al., “Performance of Bt Cotton in Mississippi, 1998”, 1999 Proceedings Beltwide Cotton Conferences.
42. M.B., Layton, et al., “Performance of Bt Cotton in Mississippi, 2000”, 2001
Proceedings Beltwide Cotton Conferences.
43. Reed, Jack T., et al, “Bt and Conventional Cotton in the Hills and Delta of Mississippi: 5 Years of Comparison”, 2000 Proceedings Beltwide Cotton Conferences.

34
44. Cooke, Fred T. Jr., et al., “The Economics of Bt Cotton in the Mississippi Delta – A Progress Report”, 2000 Proceedings Beltwide Cotton Conferences.
45. Perlak, Frederick J., et al., “Insect Resistant Cotton Plants”, Biotechnology,
October 1990.
46. Chu, Chang-Chi, et al., “Pink Bollworm: Populations Two Years Following Initiation of a Short-Season Cotton System in the Imperial Valley, California”, 1992 Proceedings Beltwide Cotton Conferences.
47. “Bt Cotton: Refuge It Or Lose It”, Farm Chemicals, March 1999.