inputs from the mangrove sub-component to the …
TRANSCRIPT

United Nations UNEP/GEF South China Sea Global Environment Environment Programme Project Facility
UNEP/GEF/SCS/RWG-M.7/6 Date: 08th August 2006
Original: English Seventh Meeting of the Regional Working Group for the Mangrove Sub-component of the UNEP/GEF Project: “Reversing Environmental Degradation Trends in the South China Sea and Gulf of Thailand” Pontianak, West Kalimantan Province, Indonesia, 4th – 8th September 2006
INPUTS FROM THE MANGROVE SUB-COMPONENT TO THE REVISED REGIONAL STRATEGIC ACTION PROGRAMME
UNEP/GEF/SCS/RWG-M.7/6 Page 1
BACKGROUND
One of the planned outputs of the project is a Regional Strategic Action Programme (SAP) for the South China Sea. A draft SAP was developed during the period 1997-1999, based on the preliminary findings of the regional Transboundary Diagnostic Analysis. It is therefore somewhat out of date and a number of the activities contained in the draft SAP were completed during the preparatory phase of the UNEP/GEF project. These activities were designed to assemble the data required to update the scientific and technical background to the SAP.
It was envisaged that the SAP would be updated during the UNEP/GEF South China Sea Project, based on the data and information collected, and initial drafts of the national action plans prepared, during the preparatory phase. The process takes an iterative approach; involving the discussion of actions at both regional and national levels, that feed into one another; takes into consideration regional and national needs; and reconciles wider global, regional and national goals and objectives in achieving sound environmental management in the South China Sea and Gulf of Thailand.
The discussion at the regional level started during the fifth round of meetings of the regional working groups (2004), in which the goals and targets of the SAP for each of the project components and sub-components were reviewed and revised. During the sixth round of regional working group meetings, a comparative analysis of national action plans was undertaken to identify common threats and actions needed at the regional level. The Regional Working Group on Mangroves developed the targets during the fifth meeting and revised these targets in the sixth meeting. Regional actions were only discussed in a preliminary manner.
CURRENT STATUS OF THE MANGROVE INPUTS TO THE SAP
Annex 1 of this document contains a first draft of the inputs from the Regional Working Group on Mangroves to the revised SAP. This draft has been compiled by the Project Coordinating Unit (PCU), based on: the data and information collected during the first phase of the project; a comparative analysis of the contents of the national action plans; and the outcome of regional discussions during the previous two meetings of the Regional Working Group on Mangroves (RWG-M).
The draft contains data and information extracted from the record of deliberations of the regional working group and arranged in the following sections:
• Regional threats to Mangroves of the South China Sea • Challenges for mangrove management in the South China Sea • The management status of Mangroves in the South China Sea • Goal • Targets • Objectives and actions
The draft remains largely incomplete, specifically:
• There is a lack of a sound analysis of current threats to Mangroves; • Data are inadequate to accurately analyse the management status of Mangroves of the South
China Sea; • There are no agreed figures regarding the current areas and rates of decline of mangroves in
each country; • Proposed actions were, as noted above, only discussed in a preliminary manner during the last
meeting; and, • No cost estimates for the proposed actions are provided.
RECOMMENDATIONS The Regional Working Group on Mangroves needs to consider, discuss and agree their draft inputs to the revised SAP in light of the previous discussions during the fifth and sixth meetings, and the recommendations by the Regional Scientific and Technical Committee (RSTC) (Annex 2). It is recommended that the RWG-M:
• Review the draft text section by section, and draft text as appropriate, during the course of the meeting;
• Agree upon the procedures, timelines, and individual responsibilities in finalising the draft following the meeting.
UNEP/GEF/SCS/RWG-M.7/6 Page 2
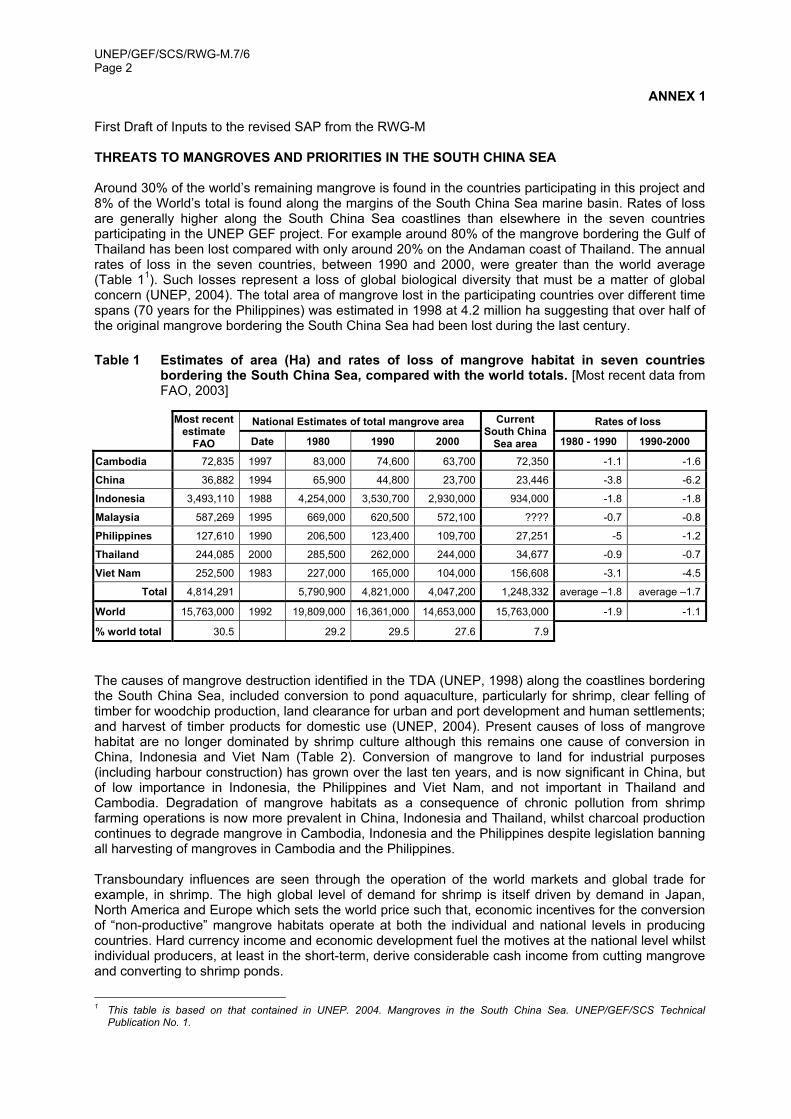
ANNEX 1 First Draft of Inputs to the revised SAP from the RWG-M THREATS TO MANGROVES AND PRIORITIES IN THE SOUTH CHINA SEA Around 30% of the world’s remaining mangrove is found in the countries participating in this project and 8% of the World’s total is found along the margins of the South China Sea marine basin. Rates of loss are generally higher along the South China Sea coastlines than elsewhere in the seven countries participating in the UNEP GEF project. For example around 80% of the mangrove bordering the Gulf of Thailand has been lost compared with only around 20% on the Andaman coast of Thailand. The annual rates of loss in the seven countries, between 1990 and 2000, were greater than the world average (Table 11). Such losses represent a loss of global biological diversity that must be a matter of global concern (UNEP, 2004). The total area of mangrove lost in the participating countries over different time spans (70 years for the Philippines) was estimated in 1998 at 4.2 million ha suggesting that over half of the original mangrove bordering the South China Sea had been lost during the last century.
Table 1 Estimates of area (Ha) and rates of loss of mangrove habitat in seven countries bordering the South China Sea, compared with the world totals. [Most recent data from FAO, 2003]
National Estimates of total mangrove area Rates of loss
Most recent estimate
FAO Date 1980 1990 2000
Current South China
Sea area 1980 - 1990 1990-2000
Cambodia 72,835 1997 83,000 74,600 63,700 72,350 -1.1 -1.6
China 36,882 1994 65,900 44,800 23,700 23,446 -3.8 -6.2
Indonesia 3,493,110 1988 4,254,000 3,530,700 2,930,000 934,000 -1.8 -1.8
Malaysia 587,269 1995 669,000 620,500 572,100 ???? -0.7 -0.8
Philippines 127,610 1990 206,500 123,400 109,700 27,251 -5 -1.2
Thailand 244,085 2000 285,500 262,000 244,000 34,677 -0.9 -0.7
Viet Nam 252,500 1983 227,000 165,000 104,000 156,608 -3.1 -4.5
Total 4,814,291 5,790,900 4,821,000 4,047,200 1,248,332 average –1.8 average –1.7
World 15,763,000 1992 19,809,000 16,361,000 14,653,000 15,763,000 -1.9 -1.1
% world total 30.5 29.2 29.5 27.6 7.9
The causes of mangrove destruction identified in the TDA (UNEP, 1998) along the coastlines bordering the South China Sea, included conversion to pond aquaculture, particularly for shrimp, clear felling of timber for woodchip production, land clearance for urban and port development and human settlements; and harvest of timber products for domestic use (UNEP, 2004). Present causes of loss of mangrove habitat are no longer dominated by shrimp culture although this remains one cause of conversion in China, Indonesia and Viet Nam (Table 2). Conversion of mangrove to land for industrial purposes (including harbour construction) has grown over the last ten years, and is now significant in China, but of low importance in Indonesia, the Philippines and Viet Nam, and not important in Thailand and Cambodia. Degradation of mangrove habitats as a consequence of chronic pollution from shrimp farming operations is now more prevalent in China, Indonesia and Thailand, whilst charcoal production continues to degrade mangrove in Cambodia, Indonesia and the Philippines despite legislation banning all harvesting of mangroves in Cambodia and the Philippines. Transboundary influences are seen through the operation of the world markets and global trade for example, in shrimp. The high global level of demand for shrimp is itself driven by demand in Japan, North America and Europe which sets the world price such that, economic incentives for the conversion of “non-productive” mangrove habitats operate at both the individual and national levels in producing countries. Hard currency income and economic development fuel the motives at the national level whilst individual producers, at least in the short-term, derive considerable cash income from cutting mangrove and converting to shrimp ponds.
1 This table is based on that contained in UNEP. 2004. Mangroves in the South China Sea. UNEP/GEF/SCS Technical
Publication No. 1.
UNEP/GEF/SCS/RWG-M.7/6 Page 3
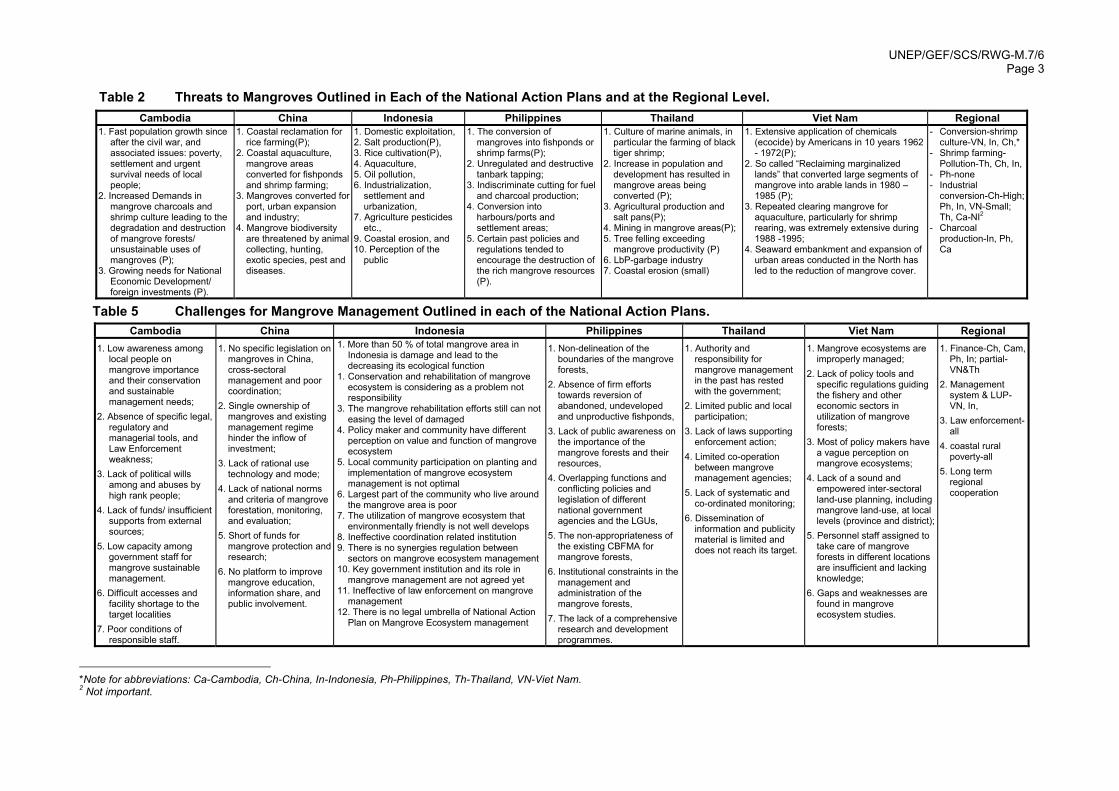
Table 2 Threats to Mangroves Outlined in Each of the National Action Plans and at the Regional Level.
Cambodia China Indonesia Philippines Thailand Viet Nam Regional 1. Fast population growth since
after the civil war, and associated issues: poverty, settlement and urgent survival needs of local people;
2. Increased Demands in mangrove charcoals and shrimp culture leading to the degradation and destruction of mangrove forests/ unsustainable uses of mangroves (P);
3. Growing needs for National Economic Development/ foreign investments (P).
1. Coastal reclamation for rice farming(P);
2. Coastal aquaculture, mangrove areas converted for fishponds and shrimp farming;
3. Mangroves converted for port, urban expansion and industry;
4. Mangrove biodiversity are threatened by animal collecting, hunting, exotic species, pest and diseases.
1. Domestic exploitation, 2. Salt production(P), 3. Rice cultivation(P), 4. Aquaculture, 5. Oil pollution, 6. Industrialization,
settlement and urbanization,
7. Agriculture pesticides etc.,
9. Coastal erosion, and 10. Perception of the
public
1. The conversion of mangroves into fishponds or shrimp farms(P);
2. Unregulated and destructive tanbark tapping;
3. Indiscriminate cutting for fuel and charcoal production;
4. Conversion into harbours/ports and settlement areas;
5. Certain past policies and regulations tended to encourage the destruction of the rich mangrove resources (P).
1. Culture of marine animals, in particular the farming of black tiger shrimp;
2. Increase in population and development has resulted in mangrove areas being converted (P);
3. Agricultural production and salt pans(P);
4. Mining in mangrove areas(P); 5. Tree felling exceeding
mangrove productivity (P) 6. LbP-garbage industry 7. Coastal erosion (small)
1. Extensive application of chemicals (ecocide) by Americans in 10 years 1962 - 1972(P);
2. So called “Reclaiming marginalized lands” that converted large segments of mangrove into arable lands in 1980 – 1985 (P);
3. Repeated clearing mangrove for aquaculture, particularly for shrimp rearing, was extremely extensive during 1988 -1995;
4. Seaward embankment and expansion of urban areas conducted in the North has led to the reduction of mangrove cover.
- Conversion-shrimp culture-VN, In, Ch,*
- Shrimp farming-Pollution-Th, Ch, In,
- Ph-none - Industrial
conversion-Ch-High; Ph, In, VN-Small; Th, Ca-NI2
- Charcoal production-In, Ph, Ca
Table 5 Challenges for Mangrove Management Outlined in each of the National Action Plans. Cambodia China Indonesia Philippines Thailand Viet Nam Regional
1. Low awareness among local people on mangrove importance and their conservation and sustainable management needs;
2. Absence of specific legal, regulatory and managerial tools, and Law Enforcement weakness;
3. Lack of political wills among and abuses by high rank people;
4. Lack of funds/ insufficient supports from external sources;
5. Low capacity among government staff for mangrove sustainable management.
6. Difficult accesses and facility shortage to the target localities
7. Poor conditions of responsible staff.
1. No specific legislation on mangroves in China, cross-sectoral management and poor coordination;
2. Single ownership of mangroves and existing management regime hinder the inflow of investment;
3. Lack of rational use technology and mode;
4. Lack of national norms and criteria of mangrove forestation, monitoring, and evaluation;
5. Short of funds for mangrove protection and research;
6. No platform to improve mangrove education, information share, and public involvement.
1. More than 50 % of total mangrove area in Indonesia is damage and lead to the decreasing its ecological function
1. Conservation and rehabilitation of mangrove ecosystem is considering as a problem not responsibility
3. The mangrove rehabilitation efforts still can not easing the level of damaged
4. Policy maker and community have different perception on value and function of mangrove ecosystem
5. Local community participation on planting and implementation of mangrove ecosystem management is not optimal
6. Largest part of the community who live around the mangrove area is poor
7. The utilization of mangrove ecosystem that environmentally friendly is not well develops
8. Ineffective coordination related institution 9. There is no synergies regulation between
sectors on mangrove ecosystem management 10. Key government institution and its role in
mangrove management are not agreed yet 11. Ineffective of law enforcement on mangrove
management 12. There is no legal umbrella of National Action
Plan on Mangrove Ecosystem management
1. Non-delineation of the boundaries of the mangrove forests,
2. Absence of firm efforts towards reversion of abandoned, undeveloped and unproductive fishponds,
3. Lack of public awareness on the importance of the mangrove forests and their resources,
4. Overlapping functions and conflicting policies and legislation of different national government agencies and the LGUs,
5. The non-appropriateness of the existing CBFMA for mangrove forests,
6. Institutional constraints in the management and administration of the mangrove forests,
7. The lack of a comprehensive research and development programmes.
1. Authority and responsibility for mangrove management in the past has rested with the government;
2. Limited public and local participation;
3. Lack of laws supporting enforcement action;
4. Limited co-operation between mangrove management agencies;
5. Lack of systematic and co-ordinated monitoring;
6. Dissemination of information and publicity material is limited and does not reach its target.
1. Mangrove ecosystems are improperly managed;
2. Lack of policy tools and specific regulations guiding the fishery and other economic sectors in utilization of mangrove forests;
3. Most of policy makers have a vague perception on mangrove ecosystems;
4. Lack of a sound and empowered inter-sectoral land-use planning, including mangrove land-use, at local levels (province and district);
5. Personnel staff assigned to take care of mangrove forests in different locations are insufficient and lacking knowledge;
6. Gaps and weaknesses are found in mangrove ecosystem studies.
1. Finance-Ch, Cam, Ph, In; partial-VN&Th
2. Management system & LUP- VN, In,
3. Law enforcement-all
4. coastal rural poverty-all
5. Long term regional cooperation
*Note for abbreviations: Ca-Cambodia, Ch-China, In-Indonesia, Ph-Philippines, Th-Thailand, VN-Viet Nam. 2 Not important.
UNEP/GEF/SCS/RWG-M.7/6 Page 4 On a smaller scale, trade in charcoal derived from mangrove in Cambodia to Thailand was a major cause of mangrove loss in the areas of Cambodia close to the Thai border, in the recent past. This market appears to have declined somewhat over the last five years under the influence of more widespread use of cheap and convenient, liquid gas in Thailand. When mangrove forests are destroyed and replaced by alternative forms of land use, not only are the species of plants and animals lost but also many services provided by mangrove systems are lost as well. This is well known in Viet Nam where the function of coastal vegetation, particularly mangroves is considered a vital service with measurable economic benefits as a protection against hurricane damage and marine based flooding. Mangrove degradation causes losses in direct and indirect economic values that support socio-economic development at both local and national scales.
• Members of the RWG-M are invited to review and analyse the current threats to Mangroves at the regional and national levels included in Table 2, and consider whether the draft text is adequate for inclusion in the SAP.
GOAL3 During the fifth meeting of the Regional Working Group on Coral Reefs (RWG-CR), there was a discussion regarding the wording of the overall goal of the SAP, and the group recommended amendment to the original wording as follows:
“The goal of the Strategic Action Programme is to foster regional cooperation and collaboration in order to halt or slow the current rate of environmental degradation and assist participating states in taking actions within their respective policies, priorities and resources, thereby contributing to human well-being; promotion of the sustainable use of marine living resources; and contributing to the maintenance of globally significant biological diversity, for the benefit of present and future generations.” UNEP/GEF/SCS/RWG-CR.5/3 para 7.2.10
PROPOSED TARGETS4
A proposed target for the mangrove component of the SAP was initially discussed and agreed during the fifth meeting of the RWG-M as follows
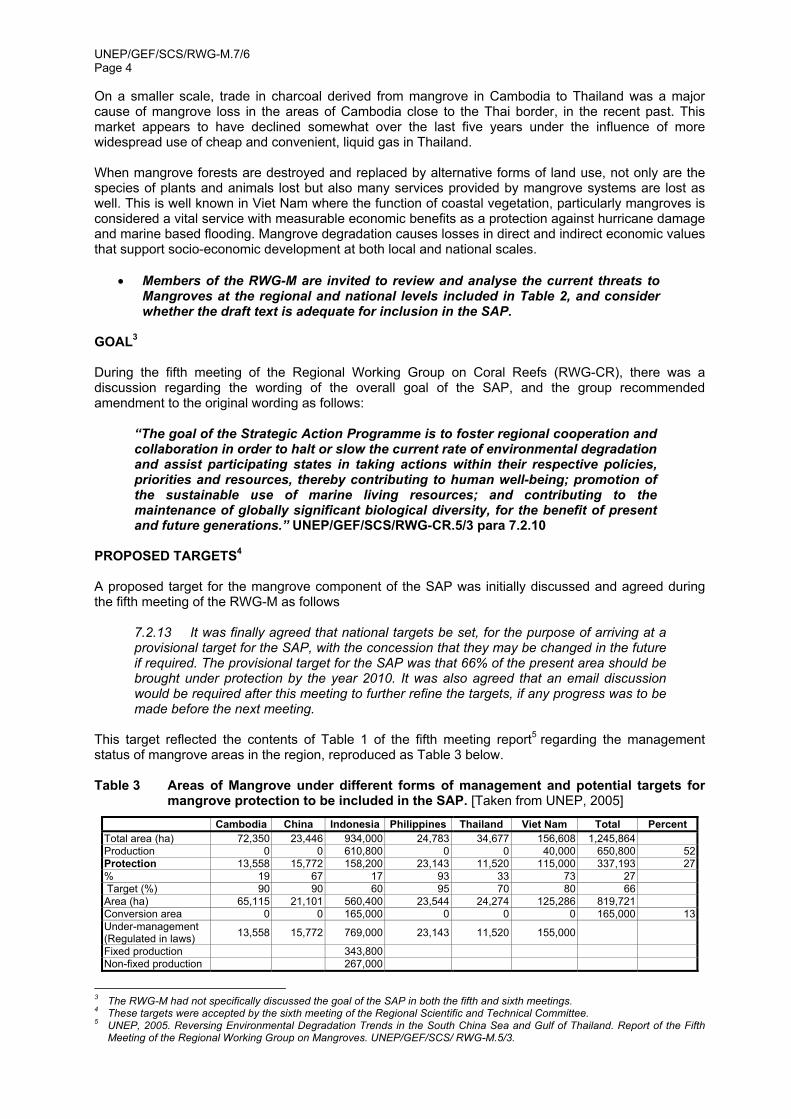
7.2.13 It was finally agreed that national targets be set, for the purpose of arriving at a provisional target for the SAP, with the concession that they may be changed in the future if required. The provisional target for the SAP was that 66% of the present area should be brought under protection by the year 2010. It was also agreed that an email discussion would be required after this meeting to further refine the targets, if any progress was to be made before the next meeting.
This target reflected the contents of Table 1 of the fifth meeting report5 regarding the management status of mangrove areas in the region, reproduced as Table 3 below. Table 3 Areas of Mangrove under different forms of management and potential targets for
mangrove protection to be included in the SAP. [Taken from UNEP, 2005] Cambodia China Indonesia Philippines Thailand Viet Nam Total Percent
Total area (ha) 72,350 23,446 934,000 24,783 34,677 156,608 1,245,864 Production 0 0 610,800 0 0 40,000 650,800 52Protection 13,558 15,772 158,200 23,143 11,520 115,000 337,193 27% 19 67 17 93 33 73 27 Target (%) 90 90 60 95 70 80 66 Area (ha) 65,115 21,101 560,400 23,544 24,274 125,286 819,721 Conversion area 0 0 165,000 0 0 0 165,000 13Under-management (Regulated in laws) 13,558 15,772 769,000 23,143 11,520 155,000
Fixed production 343,800 Non-fixed production 267,000
3 The RWG-M had not specifically discussed the goal of the SAP in both the fifth and sixth meetings. 4 These targets were accepted by the sixth meeting of the Regional Scientific and Technical Committee. 5 UNEP, 2005. Reversing Environmental Degradation Trends in the South China Sea and Gulf of Thailand. Report of the Fifth
Meeting of the Regional Working Group on Mangroves. UNEP/GEF/SCS/ RWG-M.5/3.
UNEP/GEF/SCS/RWG-M.7/6 Page 5
This outcome was subsequently reviewed by the RSTC, which recommended that:
The RWG-M should consider the definition of “protection” and ensure common understanding of “protection” in the region. It was pointed out in Indonesia and Philippines “protection” means “non-use” of timber and other forest products.
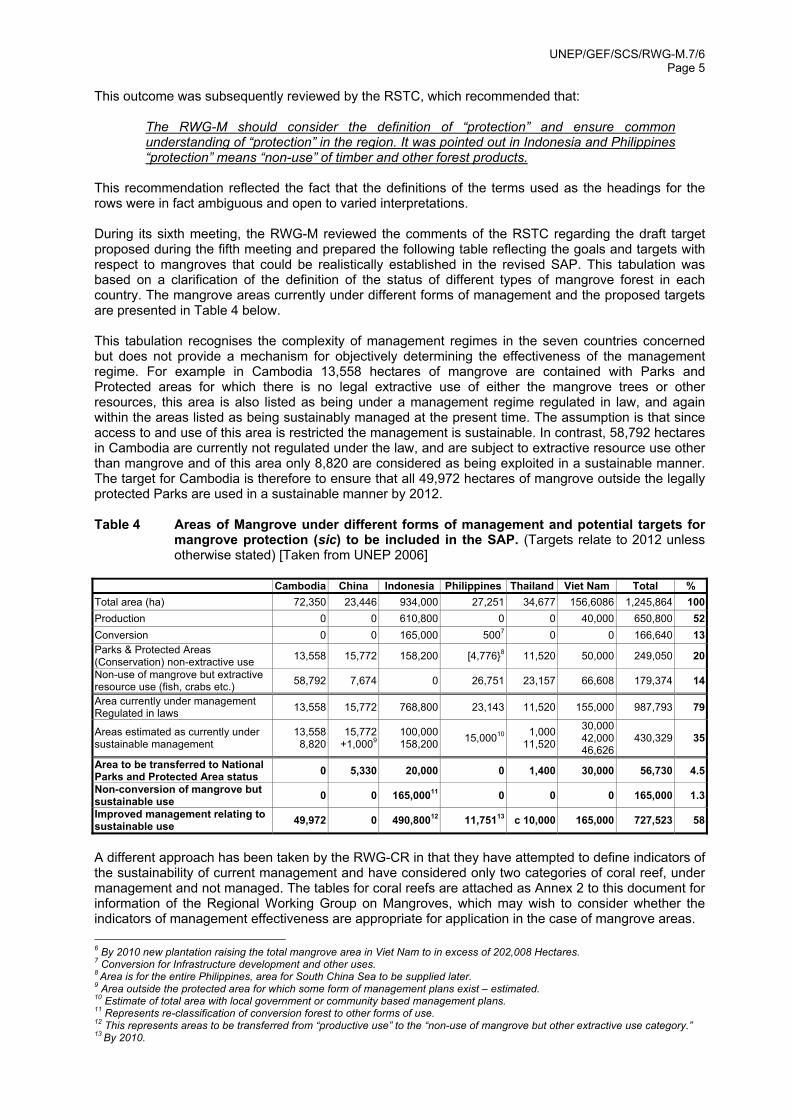
This recommendation reflected the fact that the definitions of the terms used as the headings for the rows were in fact ambiguous and open to varied interpretations. During its sixth meeting, the RWG-M reviewed the comments of the RSTC regarding the draft target proposed during the fifth meeting and prepared the following table reflecting the goals and targets with respect to mangroves that could be realistically established in the revised SAP. This tabulation was based on a clarification of the definition of the status of different types of mangrove forest in each country. The mangrove areas currently under different forms of management and the proposed targets are presented in Table 4 below. This tabulation recognises the complexity of management regimes in the seven countries concerned but does not provide a mechanism for objectively determining the effectiveness of the management regime. For example in Cambodia 13,558 hectares of mangrove are contained with Parks and Protected areas for which there is no legal extractive use of either the mangrove trees or other resources, this area is also listed as being under a management regime regulated in law, and again within the areas listed as being sustainably managed at the present time. The assumption is that since access to and use of this area is restricted the management is sustainable. In contrast, 58,792 hectares in Cambodia are currently not regulated under the law, and are subject to extractive resource use other than mangrove and of this area only 8,820 are considered as being exploited in a sustainable manner. The target for Cambodia is therefore to ensure that all 49,972 hectares of mangrove outside the legally protected Parks are used in a sustainable manner by 2012. Table 4 Areas of Mangrove under different forms of management and potential targets for
mangrove protection (sic) to be included in the SAP. (Targets relate to 2012 unless otherwise stated) [Taken from UNEP 2006]
Cambodia China Indonesia Philippines Thailand Viet Nam Total %
Total area (ha) 72,350 23,446 934,000 27,251 34,677 156,6086 1,245,864 100Production 0 0 610,800 0 0 40,000 650,800 52Conversion 0 0 165,000 5007 0 0 166,640 13Parks & Protected Areas (Conservation) non-extractive use 13,558 15,772 158,200 [4,776}8 11,520 50,000 249,050 20
Non-use of mangrove but extractive resource use (fish, crabs etc.) 58,792 7,674 0 26,751 23,157 66,608 179,374 14
Area currently under management Regulated in laws 13,558 15,772 768,800 23,143 11,520 155,000 987,793 79
Areas estimated as currently under sustainable management
13,558 8,820
15,772+1,0009
100,000158,200 15,00010 1,000
11,520
30,000 42,000 46,626
430,329 35
Area to be transferred to National Parks and Protected Area status 0 5,330 20,000 0 1,400 30,000 56,730 4.5
Non-conversion of mangrove but sustainable use 0 0 165,00011 0 0 0 165,000 1.3
Improved management relating to sustainable use 49,972 0 490,80012 11,75113 c 10,000 165,000 727,523 58
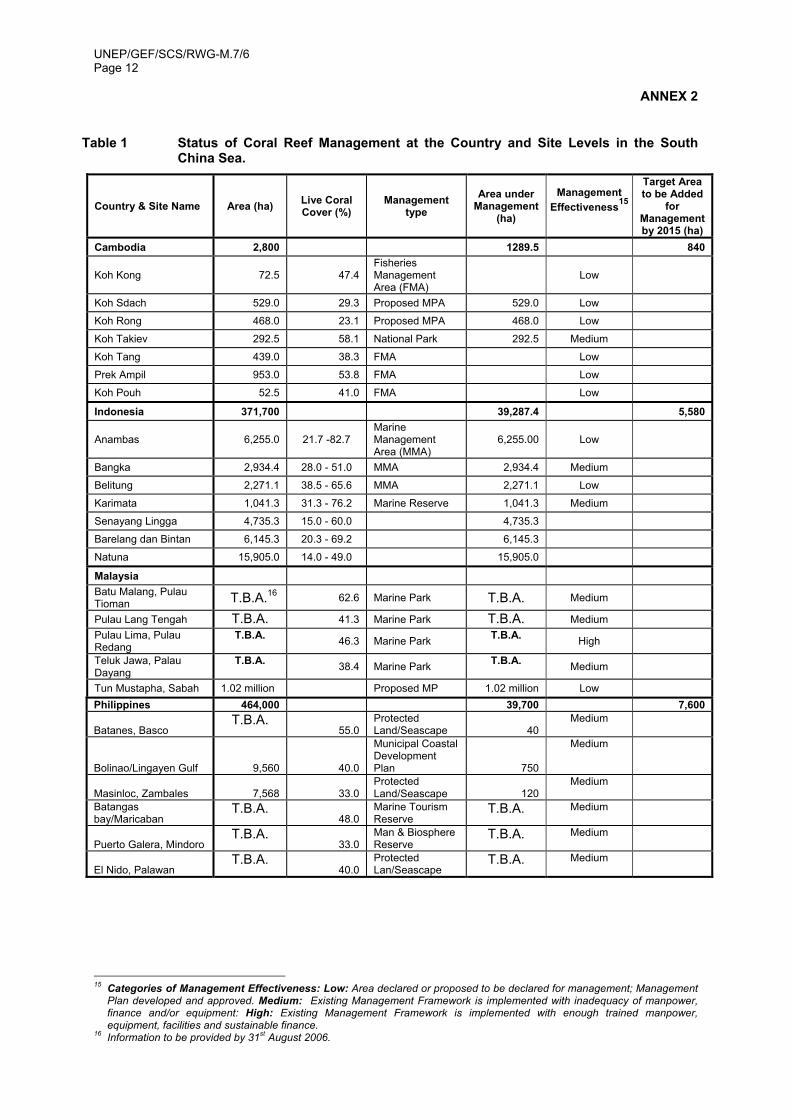
A different approach has been taken by the RWG-CR in that they have attempted to define indicators of the sustainability of current management and have considered only two categories of coral reef, under management and not managed. The tables for coral reefs are attached as Annex 2 to this document for information of the Regional Working Group on Mangroves, which may wish to consider whether the indicators of management effectiveness are appropriate for application in the case of mangrove areas. 6 By 2010 new plantation raising the total mangrove area in Viet Nam to in excess of 202,008 Hectares. 7 Conversion for Infrastructure development and other uses. 8 Area is for the entire Philippines, area for South China Sea to be supplied later. 9 Area outside the protected area for which some form of management plans exist – estimated. 10 Estimate of total area with local government or community based management plans. 11 Represents re-classification of conversion forest to other forms of use. 12 This represents areas to be transferred from “productive use” to the “non-use of mangrove but other extractive use category.” 13 By 2010.

UNEP/GEF/SCS/RWG-M.7/6 Page 6
• Members of the RWG-M are invited to review the goal and targets and to consider carefully the content of tables 1, 3 and 4 above since the relationship between the various figures for areas should be internally consistent.
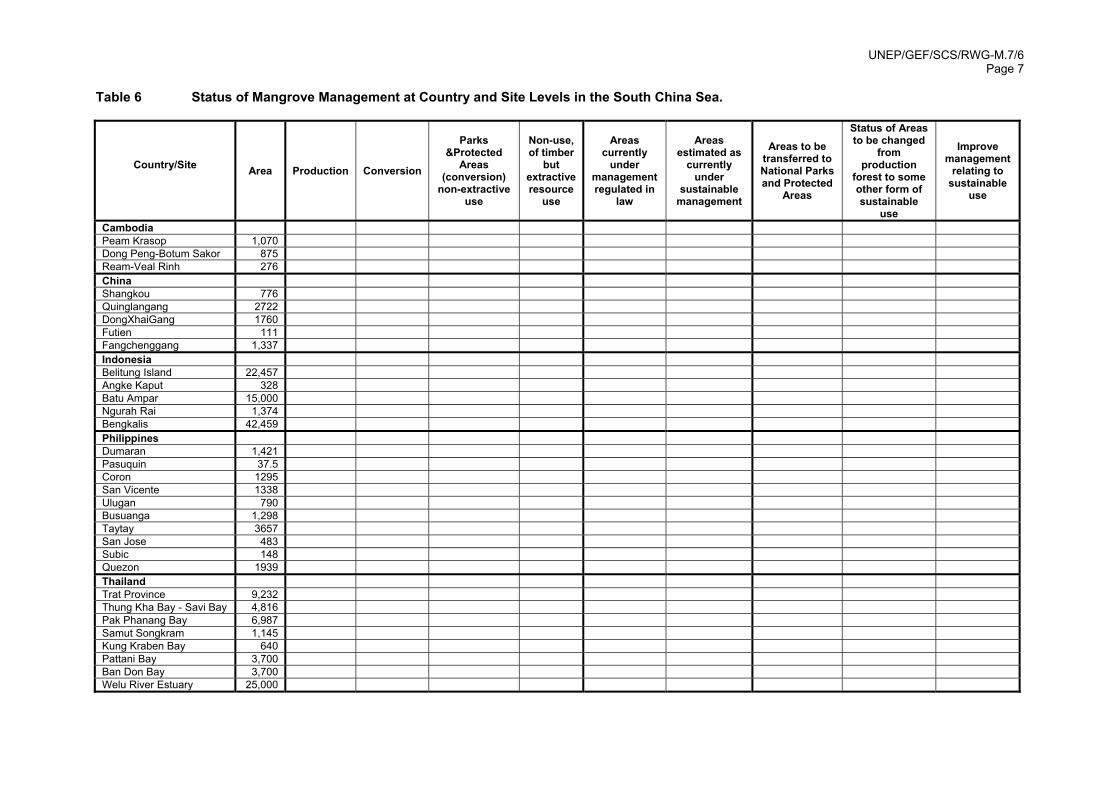
THE MANAGEMENT STATUS OF MANGROVES IN THE SOUTH CHINA SEA Challenges for Mangrove Management Table 5 (above) provides information derived from the revised National Action Plans, regarding the challenges for Mangrove management at the national level which centre on: lack of sustainable financing, China, Cambodia, Philippines, and Indonesia less so in Thailand and Viet Nam; weak or non-existent law enforcement, and coastal poverty in all seven countries; and, inadequacies and weaknesses in the management systems in Viet Nam and Indonesia. The Management Status of Mangroves in the South China Sea Table 6 lists the 45 mangrove sites bordering the South China Sea that were used in the initial cluster analysis for selection of demonstration sites. It is suggested that one way of improving the clarity of the targets would be to complete the columns in this table and ensure that there were in fact congruent with the targets established in the previous meeting.
• Members of the RWG-M are invited to provide the information regarding management status for the mangrove sites in Table 6.
UNEP/GEF/SCS/RWG-M.7/6 Page 7
Table 6 Status of Mangrove Management at Country and Site Levels in the South China Sea.
Country/Site Area Production Conversion
Parks &Protected
Areas (conversion)
non-extractive use
Non-use, of timber
but extractive resource
use
Areas currently
under management regulated in
law
Areas estimated as
currently under
sustainable management
Areas to be transferred to National Parks and Protected
Areas
Status of Areas to be changed
from production
forest to some other form of sustainable
use
Improve management
relating to sustainable
use
Cambodia Peam Krasop 1,070 Dong Peng-Botum Sakor 875 Ream-Veal Rinh 276 China Shangkou 776 Quinglangang 2722 DongXhaiGang 1760 Futien 111 Fangchenggang 1,337 Indonesia Belitung Island 22,457 Angke Kaput 328 Batu Ampar 15,000 Ngurah Rai 1,374 Bengkalis 42,459 Philippines Dumaran 1,421 Pasuquin 37.5 Coron 1295 San Vicente 1338 Ulugan 790 Busuanga 1,298 Taytay 3657 San Jose 483 Subic 148 Quezon 1939 Thailand Trat Province 9,232 Thung Kha Bay - Savi Bay 4,816 Pak Phanang Bay 6,987 Samut Songkram 1,145 Kung Kraben Bay 640 Pattani Bay 3,700 Ban Don Bay 3,700 Welu River Estuary 25,000

UNEP/GEF/SCS/RWG-M.7/6 Page 8 Table 6 cont. Status of at Country and Site Levels in the South China Sea.
Country/Site Area Production Conversion
Parks &Protected
Areas (conversion)
non-extractive use
Non-use, but
extractive resource
use
Areas currently
under management regulated in
law
Areas estimated as
currently under
sustainable management
Areas to be transferred to National Parks and Protected
Areas
Non-conversion of mangrove by sustainable
use
Improve management
relating to sustainable
use
Viet Nam Hai Ninh 1,260 Tien Yen 2,537 Yen Hung 5,736 Cat Ba 396 Van Uc 0 Xuan Thuy 1,775 Can Gio 8,958 Thanh Phu 28 Soc Trang 598 Ca Mau 5,239 Sao Luoi 305 FE184 211 Kien Giang 2,775 Con Dao 52
UNEP/GEF/SCS/RWG-M.7/6 Page 9
OBJECTIVES AND ACTIONS14
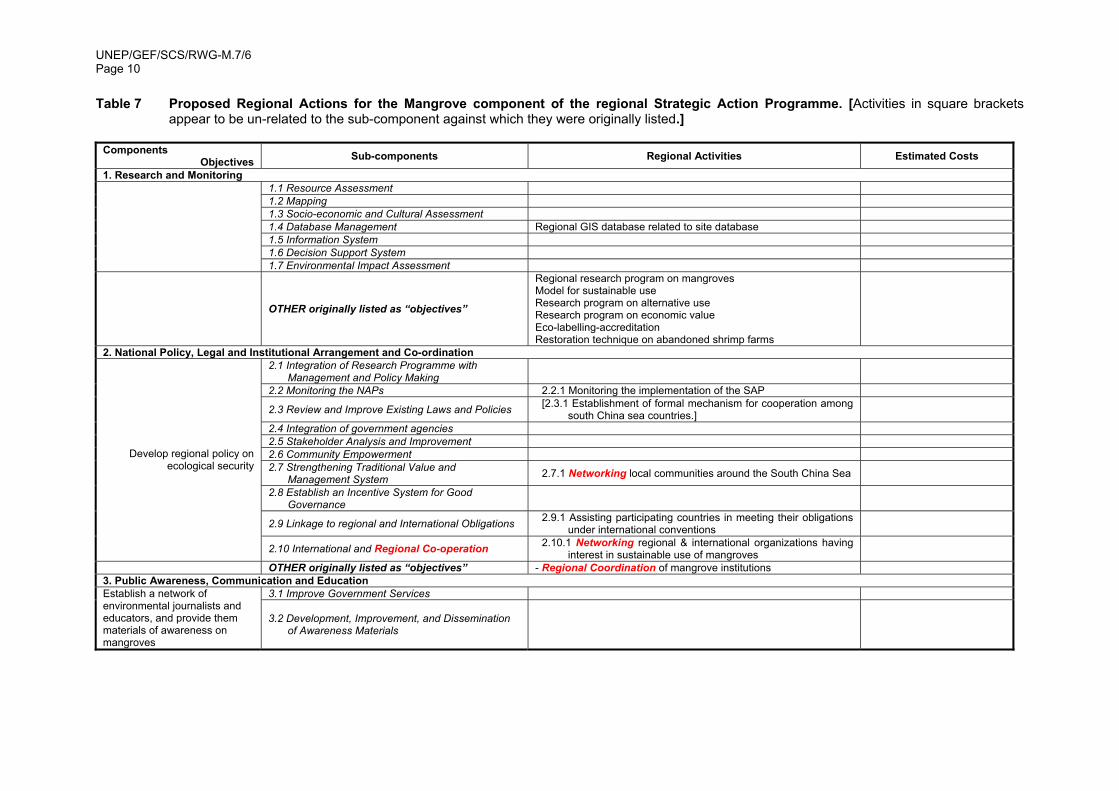
The proposed regional activities to promote sustainable management of Mangroves were categorised during the sixth meeting into five main components; namely: Component 1 – Research and Monitoring Component 2 – National Policy, Legislation, Legal and Institutional Arrangements and Co-ordination Component 3 – Public awareness, Communication and Education Component 4 – Capacity Building and Sustainability Component 5 – Resource and Habitat Management. Each component contains specific objectives and activities that were identified during the fifth meeting and are listed in Tables 4.1 to 4.5 of Annex 4 of the meeting report. These have been extracted and are presented in Table 7. It can be seen that:
• What were originally defined as objectives were in many instances activities; • Some “components” have no activities associated with them; • Some “activities” do not relate to either a defined component or sub-component; • Some “sub-components” read more like activities to achieve the goal of another sub-
component (e.g. sub-component 2.8 reads like an activity designed to execute sub-component 3.1);
• There is considerable overlap between sub-components in different components (e.g. networking appears in (2.71; 2.10.1; Other, under component 2; Other under component 4; and, 5.1.1).
In order to produce a coherent and logical package of actions it is necessary that the current contents of Table 7 are reviewed in extensio and re-written during the course of this meeting. Members are invited to:
• Review the components, sub-components, objectives and activities as currently defined and presented in Table 7 and to re-write these during the course of this meeting;
• Elaborate the text of the activities such that they provide a clear, comprehensive and logical course of actions that will achieve the goal and targets of the SAP;
• Estimate the costs for the actions in each component and specific actions based on national needs and considerations.
14 During the sixth meeting of the RWG-M, regional actions were extensively discussed and developed as seen in Table 5.
UNEP/GEF/SCS/RWG-M.7/6 Page 10
Table 7 Proposed Regional Actions for the Mangrove component of the regional Strategic Action Programme. [Activities in square brackets appear to be un-related to the sub-component against which they were originally listed.]
Components
Objectives Sub-components Regional Activities Estimated Costs
1. Research and Monitoring 1.1 Resource Assessment 1.2 Mapping 1.3 Socio-economic and Cultural Assessment 1.4 Database Management Regional GIS database related to site database 1.5 Information System 1.6 Decision Support System
1.7 Environmental Impact Assessment
OTHER originally listed as “objectives”
Regional research program on mangroves Model for sustainable use Research program on alternative use Research program on economic value Eco-labelling-accreditation Restoration technique on abandoned shrimp farms
2. National Policy, Legal and Institutional Arrangement and Co-ordination 2.1 Integration of Research Programme with
Management and Policy Making
2.2 Monitoring the NAPs 2.2.1 Monitoring the implementation of the SAP
2.3 Review and Improve Existing Laws and Policies [2.3.1 Establishment of formal mechanism for cooperation among south China sea countries.]
2.4 Integration of government agencies 2.5 Stakeholder Analysis and Improvement 2.6 Community Empowerment 2.7 Strengthening Traditional Value and
Management System 2.7.1 Networking local communities around the South China Sea
2.8 Establish an Incentive System for Good Governance
2.9 Linkage to regional and International Obligations 2.9.1 Assisting participating countries in meeting their obligations under international conventions
Develop regional policy on ecological security
2.10 International and Regional Co-operation 2.10.1 Networking regional & international organizations having interest in sustainable use of mangroves
OTHER originally listed as “objectives” - Regional Coordination of mangrove institutions 3. Public Awareness, Communication and Education
3.1 Improve Government Services Establish a network of environmental journalists and educators, and provide them materials of awareness on mangroves
3.2 Development, Improvement, and Dissemination of Awareness Materials
UNEP/GEF/SCS/RWG-M.7/6 Page 11
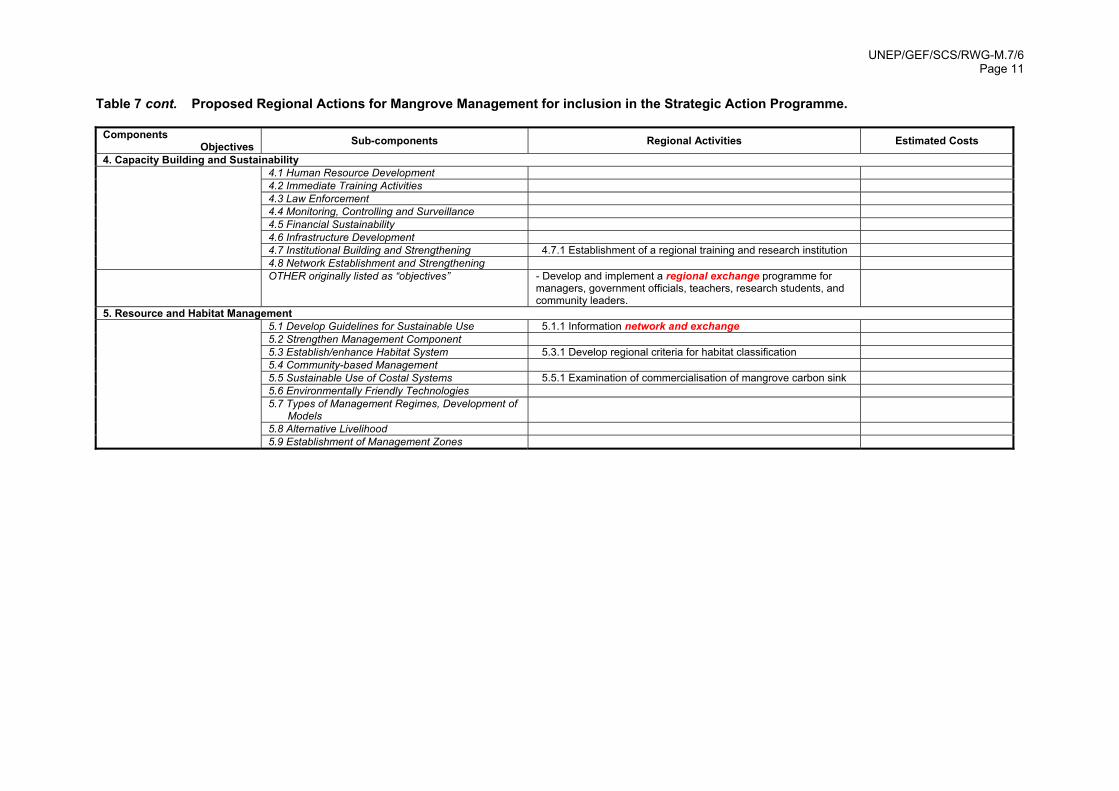
Table 7 cont. Proposed Regional Actions for Mangrove Management for inclusion in the Strategic Action Programme.
Components Objectives Sub-components Regional Activities Estimated Costs
4. Capacity Building and Sustainability 4.1 Human Resource Development 4.2 Immediate Training Activities 4.3 Law Enforcement 4.4 Monitoring, Controlling and Surveillance 4.5 Financial Sustainability 4.6 Infrastructure Development 4.7 Institutional Building and Strengthening 4.7.1 Establishment of a regional training and research institution
4.8 Network Establishment and Strengthening OTHER originally listed as “objectives” - Develop and implement a regional exchange programme for
managers, government officials, teachers, research students, and community leaders.
5. Resource and Habitat Management 5.1 Develop Guidelines for Sustainable Use 5.1.1 Information network and exchange 5.2 Strengthen Management Component 5.3 Establish/enhance Habitat System 5.3.1 Develop regional criteria for habitat classification 5.4 Community-based Management 5.5 Sustainable Use of Costal Systems 5.5.1 Examination of commercialisation of mangrove carbon sink 5.6 Environmentally Friendly Technologies 5.7 Types of Management Regimes, Development of
Models
5.8 Alternative Livelihood
5.9 Establishment of Management Zones
UNEP/GEF/SCS/RWG-M.7/6 Page 12
ANNEX 2
Table 1 Status of Coral Reef Management at the Country and Site Levels in the South China Sea.
Country & Site Name Area (ha) Live Coral Cover (%)
Management type
Area under Management
(ha)
Management Effectiveness15
Target Area to be Added
for Management by 2015 (ha)
Cambodia 2,800 1289.5 840
Koh Kong 72.5 47.4 Fisheries Management Area (FMA)
Low
Koh Sdach 529.0 29.3 Proposed MPA 529.0 Low
Koh Rong 468.0 23.1 Proposed MPA 468.0 Low
Koh Takiev 292.5 58.1 National Park 292.5 Medium
Koh Tang 439.0 38.3 FMA Low
Prek Ampil 953.0 53.8 FMA Low
Koh Pouh 52.5 41.0 FMA Low
Indonesia 371,700 39,287.4 5,580
Anambas 6,255.0 21.7 -82.7 Marine Management Area (MMA)
6,255.00 Low
Bangka 2,934.4 28.0 - 51.0 MMA 2,934.4 Medium
Belitung 2,271.1 38.5 - 65.6 MMA 2,271.1 Low
Karimata 1,041.3 31.3 - 76.2 Marine Reserve 1,041.3 Medium
Senayang Lingga 4,735.3 15.0 - 60.0 4,735.3
Barelang dan Bintan 6,145.3 20.3 - 69.2 6,145.3
Natuna 15,905.0 14.0 - 49.0 15,905.0
Malaysia Batu Malang, Pulau Tioman T.B.A.16 62.6 Marine Park T.B.A. Medium
Pulau Lang Tengah T.B.A. 41.3 Marine Park T.B.A. Medium Pulau Lima, Pulau Redang
T.B.A. 46.3 Marine Park T.B.A. High
Teluk Jawa, Palau Dayang
T.B.A. 38.4 Marine Park T.B.A. Medium
Tun Mustapha, Sabah 1.02 million Proposed MP 1.02 million Low Philippines 464,000 39,700 7,600
Batanes, Basco T.B.A.
55.0 Protected Land/Seascape 40
Medium
Bolinao/Lingayen Gulf 9,560 40.0
Municipal Coastal Development Plan 750
Medium
Masinloc, Zambales 7,568 33.0 Protected Land/Seascape 120
Medium
Batangas bay/Maricaban
T.B.A. 48.0
Marine Tourism Reserve
T.B.A. Medium
Puerto Galera, Mindoro T.B.A.
33.0 Man & Biosphere Reserve
T.B.A. Medium
El Nido, Palawan T.B.A.
40.0 Protected Lan/Seascape
T.B.A. Medium
15 Categories of Management Effectiveness: Low: Area declared or proposed to be declared for management; Management
Plan developed and approved. Medium: Existing Management Framework is implemented with inadequacy of manpower, finance and/or equipment: High: Existing Management Framework is implemented with enough trained manpower, equipment, facilities and sustainable finance.
16 Information to be provided by 31st August 2006.

UNEP/GEF/SCS/RWG-M.7/6 Page 13
Table 1 cont. Status of Coral Reef Management at the Country and Site Levels in the South
China Sea.
Country & Site Name Area (ha) Live Coral
Cover (%) Management
type Area under
Management (ha)
Management effectiveness
Target Area to be Added
for Management by 2015 (ha)
Thailand 90,000 54,000 18,000 Mu Koh Chumporn 649.0 55.0 National Park 480 Medium
Mu Koh Chang 1,556.0 40.0 Marine National Park 800
Medium
Mu Koh Ang Thong 426 55.0 Marine National Park 426
Medium
Mu Koh Samui 3249 40.0 Marine National Park 600
Low
Mu Koh Samet 350.0 35.0 Marine National Park 300
Medium
Sichang Group 63.0 20.0 None
Sattaheep Group 139.0 33.0 Navy Control Area 110
Low
Lan and Phai Group 326.0 18.0 Navy Control Area 100
Low
Chao Lao 72.0 30.0 None
Prachuab 204 40.0 Marine National Park 40
Low
Koh Tao Group 192.0 45.0 None Song Khla 100 20.0 None Koh Kra 56 40.0 None
Losin 79.0 40.0 Navy Control Area 79
Low
Viet Nam 110,000 2,200 3,300 Cu Lao Cham 200.0 33.9 MPA 100 Medium Nha Trang bay 570.0 26.4 MPA 100 Medium Con Dao 1,000.0 23.3 National Park 1,000 Medium Phu Quoc 600.0 42.2 Proposed MPA Not Available Low
Ninh Hai 1,070.0 36.9
Proposed MPA & Community -based Management 1,070
Medium
Ca Na bay 2,270.0 40.5 Proposed MPA None Low
Ha Long - Cat Ba T.B.A.
43.0 World Heritage & National Park No Available
Medium
Hai Van - Son Tra T.B.A. 50.5 Proposed MPA None Low
Bach Long Vi T.B.A. 21.7 Proposed MPA None Low
Grand Total 1,084,544 320,760 168,516
Table 2 Sustainable Management Indicator Matrix.
Management Indicators Ecological/Environmental Indicators Socio-Economic Indicators
MANAGEMENT CAPACITY • Formal Management framework • Trained Man-power (No./levels) • Facilities and equipment • Sustainable Financing
FISHERIES • Catch per unit effort • Total landing • Income
MANAGEMENT APPROACH • Sectoral • Integrated • Community-based • Multiple-use
TOURISM • Number of visitors • Number of tourism operators • Income
MANAGEMENT TOOLS • Licensing and permits • Seasonal closure • Zoning
• LIVE CORAL COVER • ORGANISM ABUNDANCE • BIODIVERSITY • INDICATOR SPECIES • TARGET SPECIES • WATER QUALITY OTHER ALTERNATIVE LIVELIHOOD
OVERALL LIVING STANDARD
• Level of education • Health of the community

UNEP/GEF/SCS/RWG-M.7/6 Page 14
ANNEX 3
PREVIOUS DISCUSSIONS OF THE REGIONAL WORKING GROUP
ON MANGROVES REGARDING THE ELEMENTS OF THE SAP
EXTRACT FROM THE REPORT OF THE FIFTH MEETING OF THE RWG-M 7.2 Discussion on the Inputs from the Mangrove Sub-component to the Regional Strategic
Action Programme (SAP), Review of the SAP Targets and Goals and Discussion of the Process of Integrating NAP and SAP Development.
7.2.1 The Chairperson invited Dr. Pernetta to introduce this agenda item and Dr. Pernetta referred participants to the Strategic Action Programme for the South China Sea (Draft Version 3, 24 February 1999) included in the meeting documents. He stated that the document was originally produced in 1998 and it provided justification for taking action to reverse the environmental degradation in the region, resulting in this project being approved by the GEF.
7.2.2 He further stated that the targets and goals established in this document, based on information available in 1999, are now out-dated. It will be necessary to review the contents of the SAP in the light of more current and up-to-date information including that contained in the National Reports. In particular a review of the target for mangroves set in that draft SAP, i.e. To maintain the area of mangroves in the region at not less than 90% of the 1998 level, needed to be undertaken, and modified if it was now deemed unrealistic, indeterminable, or unachievable.
7.2.3 The Chairperson stated that at the present time in Indonesia 67% of mangroves are contained in state forests. He invited input from the other members in reviewing the target of the SAP. Professor Gong asked whether the information that had been included in the booklet “Mangroves in the South China Sea” produced by the RWG mangroves earlier this year might be of use. Dr. Pernetta provided the figures on mangroves for each country from that booklet, which he said were from the FAO based on information supplied by the Governments of each country. These figures indicate that the total area of mangroves in the countries participating in the Project had declined from 30% to 27% of the worldwide total over the last decade.
7.2.4 Dr. Gong stated that the target of maintaining the percentage of mangroves at 90% of the 1998 level was probably not realistic. She thought that setting a target area to be under sustainable use may be more appropriate. Dr. Pernetta presented the relevant section from the draft RWG-CR meeting report to show how the revised targets for the coral reef group were developed. The coral reef targets included a quality as well as a quantity related target. The meeting agreed that this was a useful approach and Dr. Tri proceeded to prepare the table for input of the relevant information. Members provided the most recent information on the total mangrove area in their country, and the percentage of this currently under management for sustainable use.
7.2.5 Dr. Gong noted that, if officially a number of countries had 100% of their mangroves under management for sustainable use, and yet mangroves were still decreasing, it was apparent that the management was not always effective. Dr. Pernetta stated it was obvious that there could not be 100% of mangroves under management for sustainable use, as the coverage was still decreasing. While it may be that there was a ban on cutting, he asked whether there was a management body that managed each of the mangrove areas. Mr. Barangan said that although there was a management body for all areas in the Philippines, the management was not always effective, and bans on cutting were not always enforced.
7.2.6 There followed extensive discussion about management for sustainable use, management for multiple uses, and the obvious lack of enforcement of current management regulations. Based on this discussion, it was agreed to add another row to the table, for the percentage of mangroves effectively managed at the present time. The National targets were then revised to be 90% of the total mangroves for all countries to be placed under effective management, except for Indonesia, which proposed 60%. When these National targets were totalled and compared to the regional total area of mangroves, it was determined that the regional target would be that 64% of mangroves in the participating countries would be placed under effective management regimes by the year 2010.
7.2.7 Mr. Vong stated that in line with the coral reef group, a target concerning the quality of the mangroves should also be set. Professor Gong agreed with the suggestion, though the group had difficulties in determining measurable quality criteria for mangroves.
UNEP/GEF/SCS/RWG-M.7/6 Page 15
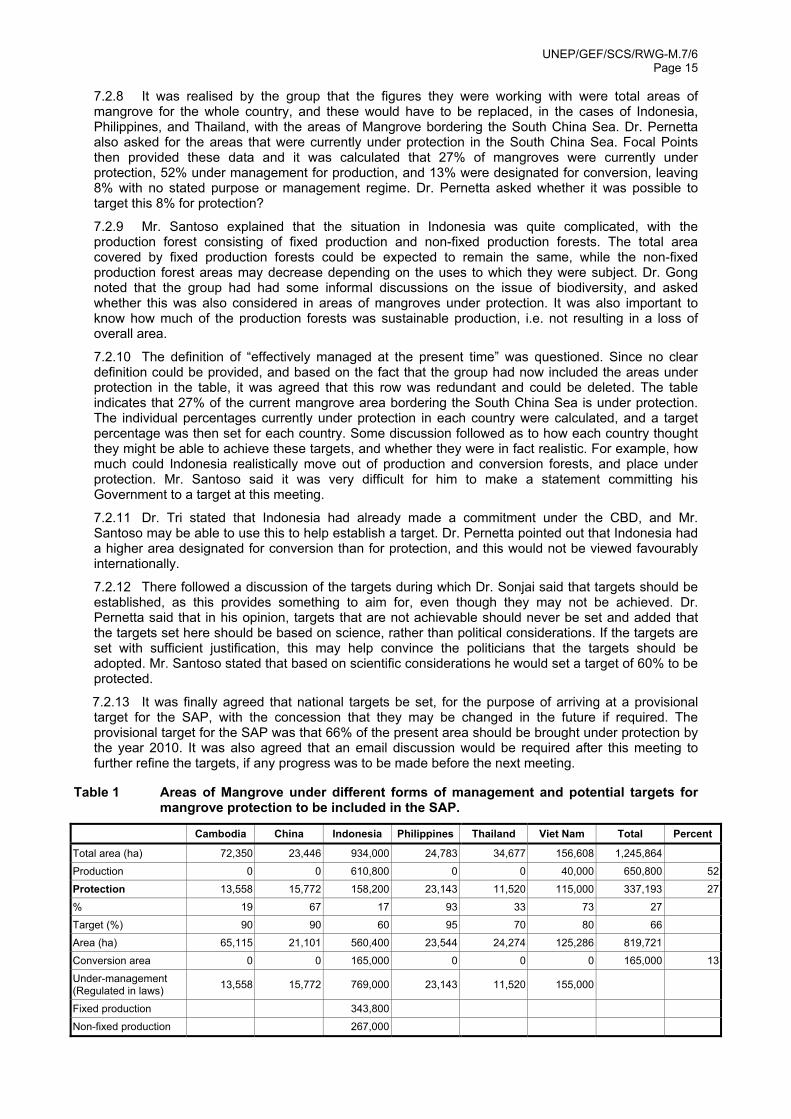
7.2.8 It was realised by the group that the figures they were working with were total areas of mangrove for the whole country, and these would have to be replaced, in the cases of Indonesia, Philippines, and Thailand, with the areas of Mangrove bordering the South China Sea. Dr. Pernetta also asked for the areas that were currently under protection in the South China Sea. Focal Points then provided these data and it was calculated that 27% of mangroves were currently under protection, 52% under management for production, and 13% were designated for conversion, leaving 8% with no stated purpose or management regime. Dr. Pernetta asked whether it was possible to target this 8% for protection?
7.2.9 Mr. Santoso explained that the situation in Indonesia was quite complicated, with the production forest consisting of fixed production and non-fixed production forests. The total area covered by fixed production forests could be expected to remain the same, while the non-fixed production forest areas may decrease depending on the uses to which they were subject. Dr. Gong noted that the group had had some informal discussions on the issue of biodiversity, and asked whether this was also considered in areas of mangroves under protection. It was also important to know how much of the production forests was sustainable production, i.e. not resulting in a loss of overall area.
7.2.10 The definition of “effectively managed at the present time” was questioned. Since no clear definition could be provided, and based on the fact that the group had now included the areas under protection in the table, it was agreed that this row was redundant and could be deleted. The table indicates that 27% of the current mangrove area bordering the South China Sea is under protection. The individual percentages currently under protection in each country were calculated, and a target percentage was then set for each country. Some discussion followed as to how each country thought they might be able to achieve these targets, and whether they were in fact realistic. For example, how much could Indonesia realistically move out of production and conversion forests, and place under protection. Mr. Santoso said it was very difficult for him to make a statement committing his Government to a target at this meeting.
7.2.11 Dr. Tri stated that Indonesia had already made a commitment under the CBD, and Mr. Santoso may be able to use this to help establish a target. Dr. Pernetta pointed out that Indonesia had a higher area designated for conversion than for protection, and this would not be viewed favourably internationally.
7.2.12 There followed a discussion of the targets during which Dr. Sonjai said that targets should be established, as this provides something to aim for, even though they may not be achieved. Dr. Pernetta said that in his opinion, targets that are not achievable should never be set and added that the targets set here should be based on science, rather than political considerations. If the targets are set with sufficient justification, this may help convince the politicians that the targets should be adopted. Mr. Santoso stated that based on scientific considerations he would set a target of 60% to be protected.
7.2.13 It was finally agreed that national targets be set, for the purpose of arriving at a provisional target for the SAP, with the concession that they may be changed in the future if required. The provisional target for the SAP was that 66% of the present area should be brought under protection by the year 2010. It was also agreed that an email discussion would be required after this meeting to further refine the targets, if any progress was to be made before the next meeting.
Table 1 Areas of Mangrove under different forms of management and potential targets for mangrove protection to be included in the SAP.
Cambodia China Indonesia Philippines Thailand Viet Nam Total Percent
Total area (ha) 72,350 23,446 934,000 24,783 34,677 156,608 1,245,864
Production 0 0 610,800 0 0 40,000 650,800 52
Protection 13,558 15,772 158,200 23,143 11,520 115,000 337,193 27
% 19 67 17 93 33 73 27
Target (%) 90 90 60 95 70 80 66
Area (ha) 65,115 21,101 560,400 23,544 24,274 125,286 819,721
Conversion area 0 0 165,000 0 0 0 165,000 13
Under-management (Regulated in laws) 13,558 15,772 769,000 23,143 11,520 155,000
Fixed production 343,800
Non-fixed production 267,000

UNEP/GEF/SCS/RWG-M.7/6 Page 16 EXTRACT FROM THE REPORT OF THE SIXTH RWG-M MEETING 6.2 Discussion of the Regional Scientific and Technical Committee Advice Regarding the
Goals and Targets of the Regional Strategic Action Programme
6.2.1 Members were invited by the Chairperson to note the outcome of discussions during the fifth meeting of the RWG-M during which it had been agreed to revise the regional target contained in the draft SAP as follows:
7.2.13 It was finally agreed that national targets be set, for the purpose of arriving at a provisional target for the SAP, with the concession that they may be changed in the future if required. The provisional target for the SAP was that 66% of the present area should be brought under protection by the year 2010. It was also agreed that an email discussion would be required after this meeting to further refine the targets, if any progress was to be made before the next meeting.
6.2.2 The Project Director noted that the fifth meeting of the Regional Scientific and Technical Committee in Fangchenggang, December 2004 had considered the goals and targets proposed by the Regional Working Groups and noted that:
10.2.5 The Committee considered the possible target year(s) for the revised SAP. It was agreed that, assuming the SAP would be adopted and implemented by 2007, then five and ten-year milestones would be 2012 and 2017, and these should be used by the Regional Working Groups.
10.2.6 The meeting proceeded to review each goal and target proposed by the Regional Working Groups, and provided comments for the Regional Working Groups to consider during the next meeting. The revised goals and targets for each component and sub-component, along with RSTC comments, are presented as Annex 8 to this report.
6.2.3 Dr. Pernetta noted that Annex 8 of document UNEP/GEF/SCS/RSTC.5/3 contained the following comment relating to the agreed revised targets for mangroves:
The RWG-M should consider the definition of “protection” and ensure common understanding of “protection” in the region. It was pointed out in Indonesia and Philippines “protection” means “non-use” of timber and other forest products.
6.2.4 Members were invited to discuss this comment from the RSTC and to consider what actions if any should be taken during the present meeting with respect to the SAP targets for Mangroves.
6.2.5 Dr. Pernetta noted that in general the word “protection” is taken to mean “non-use” of timber and other forest products. Dr. Sonjai noted that "protected" areas in Thailand could be used for non-extractive use such as eco-tourism or education. There followed an extensive discussion of how to re-formulate the targets in such as way as to indicate clearly the status of the different forms of management of mangrove forest areas, found in the region.
6.2.6 Dr. Pernetta sought clarification from Mr. Vongwattana regarding the Cambodian target of having all mangrove areas in Cambodia accorded "protected" status and asked whether it was really the intention of the Cambodian Government to transfer 90% of the mangrove area to marine protected areas. Mr. Vongwattana responded that it was indeed the intention of the Government that 90% of the total mangrove area be accorded protected status.
6.2.7 Dr. Sam noted that in Viet Nam the word “protection forest” was applied to areas that can be used and "special use forest" encompassed parks and national reserves which cannot be cut, while Mr. Santoso noted that, based on Indonesia’s policy, “conservation areas" except for natural reserves, could be used for eco-tourism. Mr. Barangan noted that mangroves were protected in the Philippines since no cutting was permitted but that the areas were not necessarily within marine parks or protected areas and that problems arose with privately owned mangrove lands. Within protected areas conservation meant wise use of the mangrove area, and it was divided into core and buffer zones.
6.2.8 Following a lengthy discussion on the different meanings of the word “protection”, the Project Director proposed, and the meeting agreed, to rearrange the table of present areas and targets for the SAP by including two additional types of management regime: non-use of mangrove timber but extractive use of other mangrove resources; and “sustainable management area” in which the uses were considered to be conducted in a sustainable manner.
UNEP/GEF/SCS/RWG-M.7/6 Page 17
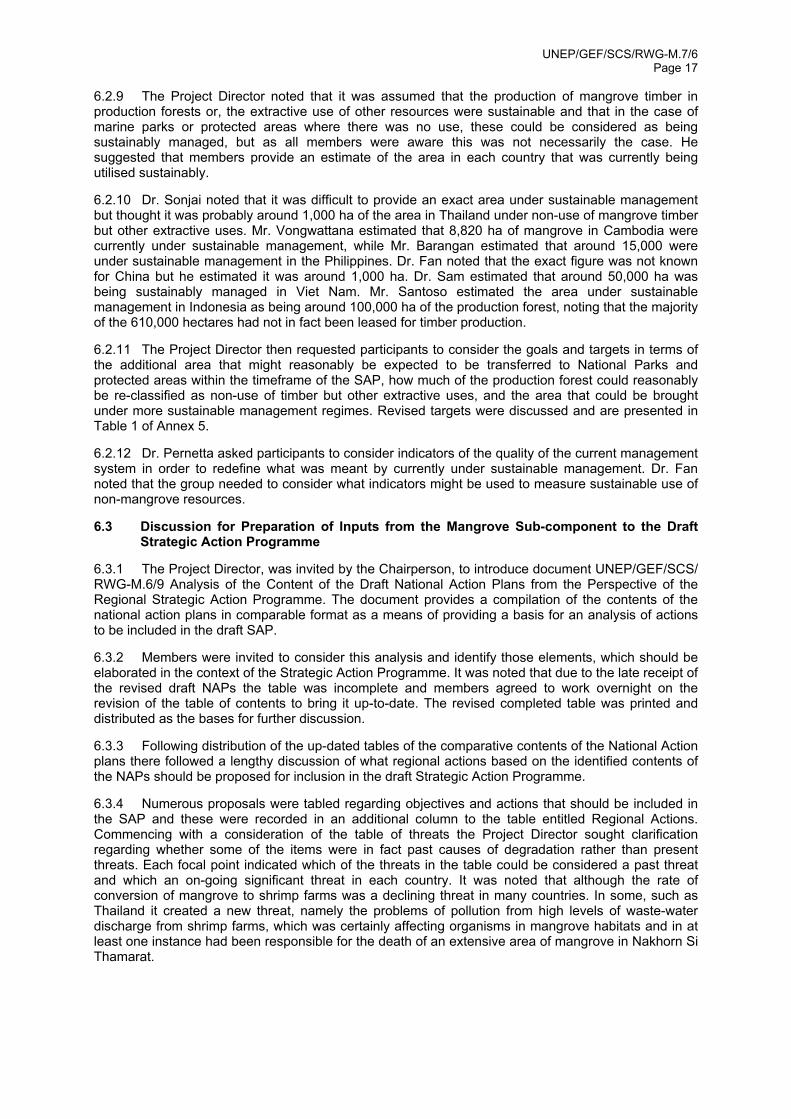
6.2.9 The Project Director noted that it was assumed that the production of mangrove timber in production forests or, the extractive use of other resources were sustainable and that in the case of marine parks or protected areas where there was no use, these could be considered as being sustainably managed, but as all members were aware this was not necessarily the case. He suggested that members provide an estimate of the area in each country that was currently being utilised sustainably.
6.2.10 Dr. Sonjai noted that it was difficult to provide an exact area under sustainable management but thought it was probably around 1,000 ha of the area in Thailand under non-use of mangrove timber but other extractive uses. Mr. Vongwattana estimated that 8,820 ha of mangrove in Cambodia were currently under sustainable management, while Mr. Barangan estimated that around 15,000 were under sustainable management in the Philippines. Dr. Fan noted that the exact figure was not known for China but he estimated it was around 1,000 ha. Dr. Sam estimated that around 50,000 ha was being sustainably managed in Viet Nam. Mr. Santoso estimated the area under sustainable management in Indonesia as being around 100,000 ha of the production forest, noting that the majority of the 610,000 hectares had not in fact been leased for timber production.
6.2.11 The Project Director then requested participants to consider the goals and targets in terms of the additional area that might reasonably be expected to be transferred to National Parks and protected areas within the timeframe of the SAP, how much of the production forest could reasonably be re-classified as non-use of timber but other extractive uses, and the area that could be brought under more sustainable management regimes. Revised targets were discussed and are presented in Table 1 of Annex 5.
6.2.12 Dr. Pernetta asked participants to consider indicators of the quality of the current management system in order to redefine what was meant by currently under sustainable management. Dr. Fan noted that the group needed to consider what indicators might be used to measure sustainable use of non-mangrove resources.
6.3 Discussion for Preparation of Inputs from the Mangrove Sub-component to the Draft Strategic Action Programme
6.3.1 The Project Director, was invited by the Chairperson, to introduce document UNEP/GEF/SCS/ RWG-M.6/9 Analysis of the Content of the Draft National Action Plans from the Perspective of the Regional Strategic Action Programme. The document provides a compilation of the contents of the national action plans in comparable format as a means of providing a basis for an analysis of actions to be included in the draft SAP.
6.3.2 Members were invited to consider this analysis and identify those elements, which should be elaborated in the context of the Strategic Action Programme. It was noted that due to the late receipt of the revised draft NAPs the table was incomplete and members agreed to work overnight on the revision of the table of contents to bring it up-to-date. The revised completed table was printed and distributed as the bases for further discussion.
6.3.3 Following distribution of the up-dated tables of the comparative contents of the National Action plans there followed a lengthy discussion of what regional actions based on the identified contents of the NAPs should be proposed for inclusion in the draft Strategic Action Programme.
6.3.4 Numerous proposals were tabled regarding objectives and actions that should be included in the SAP and these were recorded in an additional column to the table entitled Regional Actions. Commencing with a consideration of the table of threats the Project Director sought clarification regarding whether some of the items were in fact past causes of degradation rather than present threats. Each focal point indicated which of the threats in the table could be considered a past threat and which an on-going significant threat in each country. It was noted that although the rate of conversion of mangrove to shrimp farms was a declining threat in many countries. In some, such as Thailand it created a new threat, namely the problems of pollution from high levels of waste-water discharge from shrimp farms, which was certainly affecting organisms in mangrove habitats and in at least one instance had been responsible for the death of an extensive area of mangrove in Nakhorn Si Thamarat.
UNEP/GEF/SCS/RWG-M.7/6 Page 18
6.3.5 It was noted that the goals and targets generally referred to management and sustainable development and hence the overall goal of the SAP should be framed in these terms. Regarding the challenges facing management of mangroves in the region the over-riding priority was seen as being financial constraints to action; with issues such as the lack of easily available information regarding sustainable management models and problems of enforcement of existing laws and regulations being seen as the key challenges that would be addressed through some form of regional action. The case of China was cited where Dr Fan indicated it will become easier to obtain internal financing in China if the proposed activities had a wider geographic perspective. He cited as an example the provision of funds to the Fangchenggang demonstration site by the Guangxi Provincial Government, to run a training course involving personnel from the neighbouring provinces of Guangdong and Hainan.
6.3.6 A major driver of mangrove degradation was seen by all members as being the poverty of coastal communities and it was recognised that without a programme to address this issue specifically, actions focussing purely on mangrove management models and techniques would not be successful.
6.3.7 In discussing regional level needs with respect to data and information the value of the Regional GIS database from the perspective of overall decision-making was recognised. It was noted however that, at the level of individual sites, databases with quite different scales were needed. Various targeted research related topics were identified as being needed at the regional level including programmes on development of models for sustainable use, restoration techniques, particularly with respect to abandoned shrimp farms, alternative uses of mangroves, and research relating to the economic valuation of mangrove goods and services.
6.3.8 One topic, which received detailed consideration, was the issue of potentially introducing a scheme for eco-labelling and accreditation of mangrove products. It was recognised that such a scheme would require detailed planning and analysis and could only be operated by a regional or international organisation if the scheme was to be creditable both within and outside the region.
6.3.9 Further matters discussed included the potential development of a regional policy on ecological security; the need for a programme providing co-ordination amongst mangrove institutions in the participating countries; the need to network mangrove communities from around the region; networking institutions with interests in sustainable use of mangroves and assisting participating countries in meeting their obligations under Multi-lateral Environmental Agreements.
6.3.10 Annex 4 of this meeting report contains the amended table of NAP contents together with the items identified by the regional working group as being elements that should be included in the revised Strategic Action Programme.

UNEP/GEF/SCS/RWG-M.7/6 Page 19
ANNEX 5 TO THE REPORT OF THE SIXTH MEETING OF THE RWG-M
REVISED TARGETS FOR THE MANGROVE SUB-COMPONENT OF THE REGIONAL STRATEGIC ACTION PROGRAMME
BACKGROUND The fifth meeting of the Regional Scientific and Technical Committee reviewed the revised targets proposed by the Regional Working Groups for the various components of the Strategic Action Programme and commented as follows on the proposals from the Regional Working Group on Mangroves: Mangroves
• 66% of the present area of mangroves should be brought under protection by the year 2012.
RSTC Comment: The RWG-M should consider the definition of “protection” and ensure common understanding of “protection” in the region. It was pointed out in Indonesia and Philippines “protection” means “non-use” of timber and other forest products.
The sixth meeting of the Regional Working Group reviewed the revised draft targets proposed during the fifth meeting and prepared the following table reflecting the goals and targets with respect to mangroves that could be realistically established in the revised Strategic Action programme. Table 1 Areas of Mangrove under different forms of management and potential targets for
mangrove protection to be included in the SAP. [Targets relate to 2012 unless otherwise stated]
Cambodia China Indonesia Philippines Thailand Viet Nam Total % Total area (ha) 72,350 23,446 934,000 27,251 34,677 156,60817 1,245,864 100Production 0 0 610,800 0 0 40,000 650,800 52Conversion 0 0 165,000 50018 0 0 166,640 13Parks & Protected Areas (Conservation) non-extractive use 13,558 15,772 158,200 [4,776}19 11,520 50,000 249,050 20
Non-use of mangrove but extractive resource use (fish, crabs etc.) 58,792 7,674 0 26,751 23,157 66,608 179,374 14
Area currently under management Regulated in laws 13,558 15,772 768,800 23,143 11,520 155,000 987,793 79
Areas estimated as currently under sustainable management
13,558 8,820
15,772+1,00020
100,000158,200 15,00021 1,000
11,520
30,000 42,000 46,626
430,329 35
Area to be transferred to National Parks and Protected Area status 0 5,330 20,000 0 1,400 30,000 56,730 4.5
Non-conversion of mangrove but sustainable use 0 0 165,00022 0 0 0 165,000 1.3
Improved management relating to sustainable use 49,972 0 490,80023 11,75124 c 10,000 165,000 727,523 58
17 By 2010 new plantation raising the total mangrove area in Viet Nam to in excess of 202,008 Hectares. 18 Conversion for Infrastructure development and other uses. 19 Area is for the entire Philippines, area for South China Sea to be supplied later. 20 Area outside the protected area for which some form of management plans exist – estimated. 21 Estimate of total area with local government or community based management plans. 22 Represents re-classification of conversion forest to other forms of use. 23 This represents areas to be transferred from “productive use” to the “non-use of mangrove but other extractive use category.” 24 By 2010.

UNEP/GEF/SCS/RWG-M.7/6 Page 20
EXTRACT FROM THE REPORT OF THE SIXTH MEETING
OF THE REGIONAL SCIENTIFIC AND TECHNICAL COMMITTEE
10.2 Consideration of the second draft Strategic Action Programme and recommendations
to the Project Steering Committee regarding its further elaboration and approval 10.2.1 The Project Director was invited by the Chairperson to introduce document UNEP/GEF/SCS/ RSTC.6/13 “Initial draft revision of the regional Strategic Action Programme” which provides a summary of discussions concluded at the level of the Regional Working Groups to date. Dr. Pernetta stated that the contents of the document included elements for inclusion in the draft Strategic Action Programme following the review of goals and targets by the Regional Working Groups in their fifth meetings; consideration by the RSTC and further revision by the RWGs during their sixth meetings. 10.2.2 The Project Director then introduced the revised goals and targets for discussion by the Committee. These were reviewed individually by the Committee which accepted all the current drafts with the following suggestions, that:
• The Coral Reef Working Group re-consider the wording of the second target to ensure that it actually reflects the measure of rates of degradation adopted by the committee and that the time scale be included;
• The Regional Working Group on Land-based Pollution reconsider the draft goals and targets since the wording of the first suggested that it might be possible to achieve the target and at the same time have an increased loading of pollutant reaching the South China Sea.
10.2.3 It was noted that during the sixth round of meetings, the Regional Working Groups had discussed and prepared elements for inclusion in the regional Strategic Action Programme including challenges and proposed activities based on common elements from among the National Action Plans. Dr. Pernetta noted that the Regional Task Force on Economic Valuation had developed Guidelines on economic valuation that would be used in the cost benefit analysis of the SAP and that the RTF-L would provide elements for inclusion in the regional co-ordination component of the SAP. These outputs would be important elements for inclusion in the draft SAP in 2006. 10.2.4 The Chair of the RWG-M outlined the proposals for activities following which Dr. Nawarat raised a comment regarding Eco-labelling-accreditation. In clarification it was noted that this proposal had been made in respect of shrimps in particular, and the idea was to accredit producers who produced their shrimp with no impacts on mangrove habitat. 10.2.5 It was noted that the concept of ecological security related not only to mangroves but also other coastal habitats in term of aspects such as food security and protection of coastal populations. Dr. Thang raised comparison between cost for dyke construction and mangrove reforestation in Vietnam, and reminded members of the unfortunate lessons learned from the Tsunami event of last year. This issue could be used to enhance public awareness of the significance of coastal ecosystems.