inputs from the globcolour team special thanks to yaswant pradhan, julien demaria,
DESCRIPTION
In Situ Database and Sensor Characterisation Results Sam Lavender, UoP. Inputs from the GlobCOLOUR team Special thanks to Yaswant Pradhan, Julien Demaria, Gilbert Barrot & David Antoine. Characterisation review. In Situ Data / Database Level-2 Characterisation: In situ - PowerPoint PPT PresentationTRANSCRIPT

Page 1 GlobCOLOUR 1st User Consultation Meeting – December 4-6, 2006, Villefranche sur mer
Inputs from the GlobCOLOUR team
Special thanks to Yaswant Pradhan,
Julien Demaria, Gilbert Barrot &
David Antoine.
In Situ Databaseand Sensor
Characterisation Results
Sam Lavender, UoP

Page 2 GlobCOLOUR 1st User Consultation Meeting – December 4-6, 2006, Villefranche sur mer
Characterisation review
• In Situ Data / Database
• Level-2 Characterisation:– In situ– Cross Characterisation
• Level-3 Characterisation
• Overall Conclusions

Page 3 GlobCOLOUR 1st User Consultation Meeting – December 4-6, 2006, Villefranche sur mer
Types of In Situ Data
• Chlorophyll (HPLC and fluorometric)• Diffuse attenuation coefficient at ~490nm
(not shown in this presentation)• Fully normalised water-leaving radiance
primarily at 412, 443, 490, 510, 531, 555, 620, 670 nm– Computed when Lw, Ed, Es, Chl, and solar and
viewing geometry available.

Page 4 GlobCOLOUR 1st User Consultation Meeting – December 4-6, 2006, Villefranche sur mer

Page 5 GlobCOLOUR 1st User Consultation Meeting – December 4-6, 2006, Villefranche sur mer
NOMAD
SeaBASS 2002 onwards
Level-2 characterisation data sets
BOUSSOLE
Page 6 GlobCOLOUR 1st User Consultation Meeting – December 4-6, 2006, Villefranche sur mer
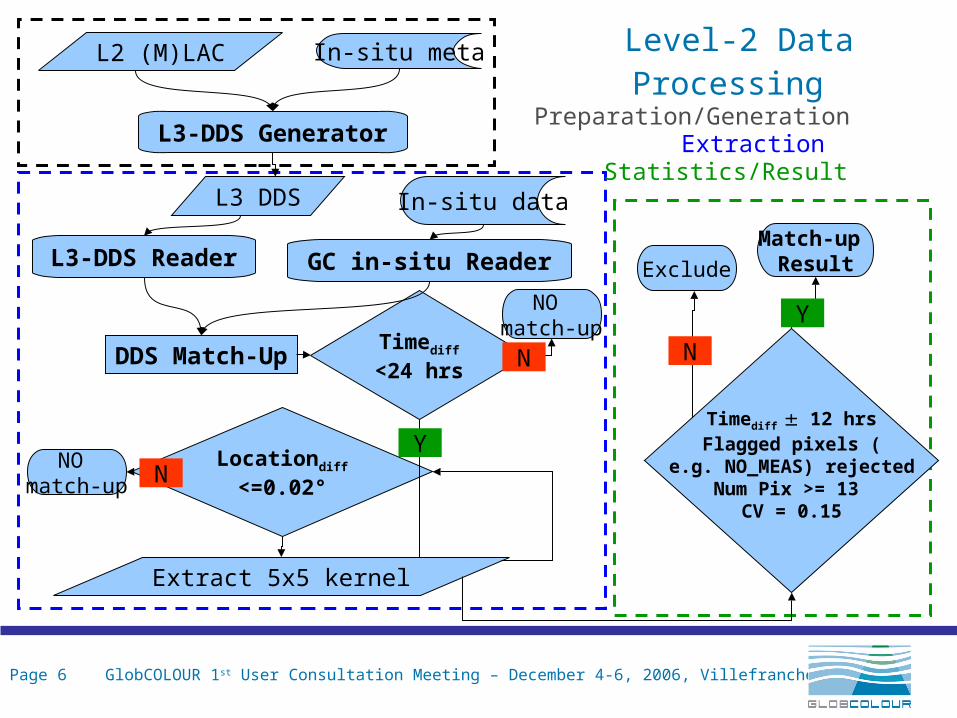
Level-2 Data Processing
L2 (M)LAC
L3-DDS Generator
In-situ meta
L3 DDS In-situ data
DDS Match-UpTimediff
<24 hrs
Locationdiff
<=0.02°NO
match-up
NO match-up
Extract 5x5 kernel
L3-DDS Reader GC in-situ Reader
Y N
N
Preparation/GenerationExtraction
Statistics/Result
Match-up Result
Y
Exclude
N
Timediff 12 hrsFlagged pixels (
e.g. NO_MEAS) rejectedNum Pix >= 13
CV = 0.15

Page 7 GlobCOLOUR 1st User Consultation Meeting – December 4-6, 2006, Villefranche sur mer
Level-2 Characterisation Chl-a Results
SeaWIFS MODIS/A MERIS
Mean Med Mean Med Mean In-situ Satellite
Product Slope Intcpt r2 Ratio Ratio %Diff %Diff bias RMS Range Range
MER-All Chl 0.90 -0.13 0.90 1.05 0.98 26.50 17.58 -0.01 (*) 0.34 (*) 0.07 3.14 0.07 2.84
MOD-All Chl 0.81 0.05 0.74 1.21 1.14 43.46 46.68 0.09 (*) 0.47 (*) 0.06 3.14 0.07 2.64
SWF-All Chl 0.93 0.07 0.88 1.22 1.08 46.76 37.01 0.07 (*) 0.51 (*) 0.04 13.87 0.03 11.04
Page 8 GlobCOLOUR 1st User Consultation Meeting – December 4-6, 2006, Villefranche sur mer
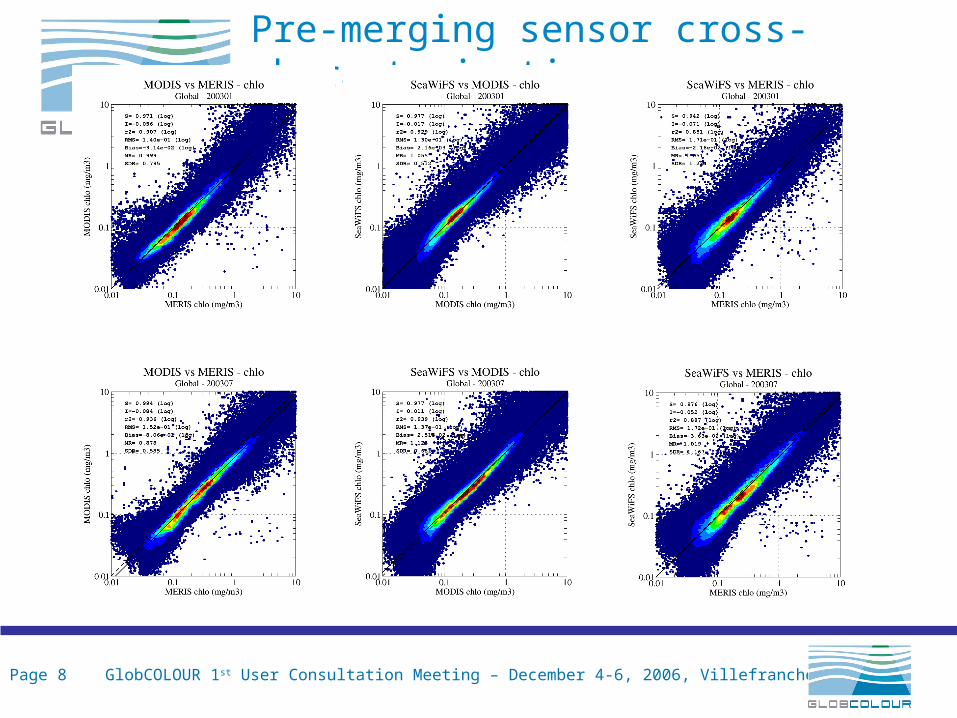
Pre-merging sensor cross-characterization

Page 9 GlobCOLOUR 1st User Consultation Meeting – December 4-6, 2006, Villefranche sur mer
Pre-merging sensor cross-characterization
ME:MO ME:SE MO:SE
Slope (log10) 0.93/0.98/1.02 0.88/0.95/0.99 0.93/0.97/1.00
r2 (log10) 0.90/0.92/0.94 0.84/0.86/0.88 0.91/0.93/0.94
Bias (log10) -0.08/-0.06/-0.03 -0.05/-0.03/0.00 -0.00/0.02/0.04
RMS (log10) 0.12/0.15/0.17 0.15/0.17/0.20 0.13/0.14/0.17
MR 0.88/0.93/1.00 0.99/1.05/1.10 1.04/1.10/1.20
Statistics table for the global comparison for year 2003 (annual min/avg/max):
ME:MO ME:SE MO:SE
Bias (log10) -0.09/-0.05/-0.01 -0.02/0.00/0.04 0.03/0.05/0.09
RMS (log10) 0.14/0.15/0.17 0.14/0.16/0.18 0.11/0.13/0.15
To be compared to the one issued by the JRC team based on monthly data over 36 months (July 2002 – June 2005):

Page 10 GlobCOLOUR 1st User Consultation Meeting – December 4-6, 2006, Villefranche sur mer
Level-3 characterisation data
For GlobCOLOUR PPS months (July and October 2002, January and April 2003) a total of 124 in situ data points were available from the OBPG validation database:
Parameters
Chl = 69 L443 = 54 L531 = 01
KD = 25 L490 = 41 L555 = 54
L412 = 47 L510 = 26 L670 = 49

Page 11 GlobCOLOUR 1st User Consultation Meeting – December 4-6, 2006, Villefranche sur mer
Level-3 Characterisation Chl-a Results
Mean Med Mean Med Mean In-situ Satellite
Product N Slope Intcpt r2 Ratio Ratio %Diff %Diff bias RMS Range Range
CHL1_AV 41 1.093 0.123 0.854 1.390 1.425 52.7 49.0 0.109 0.215(*) 0.113 6.490 0.129 12.531
CHL1_AVW 39 1.094 0.117 0.861 1.369 1.422 51.2 44.6 0.102 0.211(*) 0.113 6.490 0.129 12.841
CHL1_GSM 37 0.915 -0.034 0.874 1.019 0.924 31.1 28.2 -0.025 0.172(*) 0.113 11.734 0.115 6.290

Page 12 GlobCOLOUR 1st User Consultation Meeting – December 4-6, 2006, Villefranche sur mer
Level-3 Characterisation nLw Results
Mean Med Mean Med Mean In-situ Satellite
Product N Slope Intcpt r2 Ratio Ratio %Diff %Diff bias RMS Range Range
L412_AV 34 1.138 -0.142 0.917 0.964 1.014 21.6 20.5 -0.013 0.200 0.246 2.789 0.246 2.983
L412_AVW 33 1.130 -0.135 0.912 0.973 0.985 20.7 18.9 -0.012 0.204 0.246 2.789 0.298 2.988
L443_AV 41 1.013 -0.013 0.865 1.007 0.953 17.7 16.1 0.000 0.202 0.246 2.345 0.251 2.502
L443_AVW 41 1.012 -0.015 0.862 1.004 0.953 17.9 16.2 -0.003 0.204 0.246 2.345 0.252 2.504
L490_AV 34 0.798 0.159 0.821 1.009 0.977 17.9 12.3 -0.030 0.189 0.310 2.153 0.242 1.751
L490_AVW 34 0.801 0.155 0.820 1.007 0.975 18.1 12.3 -0.031 0.190 0.310 2.153 0.239 1.755
L510_AV 20 0.808 0.132 0.944 1.026 1.020 11.5 08.4 -0.012 0.098 0.314 1.577 0.342 1.492
L510_AVW 20 0.808 0.132 0.944 1.026 1.020 11.5 08.4 -0.012 0.098 0.314 1.577 0.342 1.492
L555_AV 43 0.748 0.122 0.919 0.990 0.951 15.3 14.7 -0.047 0.136 0.215 1.577 0.235 1.492
L555_AVW 40 0.727 0.128 0.914 0.992 0.948 16.2 15.5 -0.046 0.140 0.215 1.577 0.228 1.492
L670_AV 24 1.036 -0.010 0.731 1.223 0.947 58.5 38.6 -0.006 0.055 0.008 0.388 0.007 0.571
L670_AVW 23 1.038 -0.010 0.731 1.233 0.963 58.7 37.3 -0.006 0.056 0.008 0.388 0.007 0.571

Page 13 GlobCOLOUR 1st User Consultation Meeting – December 4-6, 2006, Villefranche sur mer
Level-3 characterisation data
As the validation using OBPG dataset for the PPS months was strongly influenced by coastal waters, it was decided that a validation would also be performed using the BOUSSOLE data; chlorophyll data from 2002-2003 and radiances from 2003-2006.

Page 14 GlobCOLOUR 1st User Consultation Meeting – December 4-6, 2006, Villefranche sur mer
BOUSSOLE Level-3 CharacterisationMean Med Mean Med Mean In-situ Satellite
Product
N Slope Intcpt r2 Ratio Ratio %Diff %Diff bias RMS Range Range
CHL1_MER 9 0.391 -0.272 0.734 1.379 1.325 64.8 44.4 0.053 0.307 0.095 3.166 0.178 0.811
CHL1_MOD 27 0.379 -0.415 0.587 1.382 1.25 56.1 45.3 0.086 0.238 0.054 1.193 0.100 0.508
CHL1_SWF 28 0.65 -0.171 0.773 1.349 1.355 52.4 40.3 0.085 0.224 0.057 3.166 0.078 2.585
L412_MER 25 0.427 0.815 0.033 1.603 1.405 66.3 40.5 0.399 0.553 0.35 1.128 0.451 2.135
L412_MOD 97 0.83 0.109 0.587 0.976 0.938 21.3 16.0 -0.037 0.201 0.357 1.411 0.094 1.635
L412_SWF 101 0.904 0.094 0.444 1.023 1.013 24.6 19.6 0.01 0.268 0.35 1.411 0.054 2.046
L443_MER 73 0.499 0.651 0.216 1.325 1.245 37.9 25.8 0.216 0.334 0.286 1.322 0.474 1.669
L443_MOD 219 0.722 0.271 0.559 1.053 1.009 17.0 10.6 0.016 0.18 0.305 1.37 0.218 1.586
L443_SWF 250 0.735 0.286 0.427 1.08 1.027 20.8 13.1 0.038 0.226 0.263 1.37 0.336 1.967
L490_MER 74 0.518 0.5 0.256 1.162 1.123 21.5 14.5 0.108 0.189 0.321 1.039 0.394 1.155
L490_MOD 220 0.731 0.247 0.578 1.039 1.021 11.2 08.2 0.02 0.117 0.358 1.096 0.427 1.248
L490_SWF 261 0.721 0.257 0.419 1.042 1.001 14.5 10.8 0.02 0.153 0.298 1.096 0.329 1.597
L510_MER 74 0.463 0.426 0.115 1.219 1.203 26.0 20.8 0.116 0.164 0.28 0.786 0.291 0.929
L510_SWF 256 0.447 0.329 0.16 0.995 0.972 15.1 11.9 -0.013 0.118 0.26 0.893 0.313 1.081
L555_MER 72 0.819 0.112 0.413 1.205 1.167 24.5 21.1 0.057 0.085 0.174 0.539 0.156 0.609
L555_MOD 215 0.864 0.07 0.551 1.09 1.078 15.2 11.7 0.026 0.058 0.16 0.573 0.162 0.586
L555_SWF 249 0.659 0.121 0.23 1.047 1.017 19.4 15.7 0.01 0.082 0.16 0.573 0.156 0.846
L670_MER 67 0.911 0.038 0.086 3.788 2.12 278.8 212.0 0.037 0.042 0.007 0.043 0.013 0.091
L670_MOD 180 0.632 0.016 0.132 1.811 0.651 85.6 65.1 0.01 0.014 0.006 0.043 0.008 0.064
L670_SWF 67 0.292 0.03 0.018 2.376 0.863 145.0 86.3 0.018 0.026 0.007 0.043 0.006 0.085
Higher median % differences than the OBPG results.

Page 15 GlobCOLOUR 1st User Consultation Meeting – December 4-6, 2006, Villefranche sur mer
Chl-a Comparisons
Level-2 data Level-3 data (OBPG)
Level-3 data (BOUSSOLE)
Literature (OBPG)
MERIS 17.58 44.4 MODIS 46.68 55.7 45.3 40.4 SeaWiFS 37.01 34.2 40.3 33.1 Average Model
49.0
60.5
Weighted Average Model
44.6
57.9
GSM Model 28.2 52.3
Target of less than 35%

Page 16 GlobCOLOUR 1st User Consultation Meeting – December 4-6, 2006, Villefranche sur mer
Overall Conclusions
• In Situ Database: data was converted to a consistent format that was easily distributed within the consortium.
• Level-2 Characterisation: rather than correcting for the bias in the level-2 data, the results were reflected in the error bar estimates.
• In situ: ideally more in situ data is needed, but the limited amount gave sufficient information for the merging process.• Cross Characterisation: The global analysis showed small biases between sensors, especially MERIS and MODIS, while the regional analysis showed that the differences between sensors fluctuates and is seasonally dependant.
Page 17 GlobCOLOUR 1st User Consultation Meeting – December 4-6, 2006, Villefranche sur mer
Overall Conclusions
• Level-3 Characterisation: are highly dependant on the in situ data.
• Chlorophyll a: 35% met for OBPG results• OBPG results: smaller errors for the OBPG level-2 characterisation (PPS months only) than GlobCOLOUR unmerged level-3 data. For the merged data, the errors appeared to reduce; especially for the GSM model.• BOUSSOLE results: larger errors than the OBPG data despite it being a predominately Case 1 site, but it is influenced by Saharan dust and seasonal CDOM values.
• nLw: The 5% error level is not yet met for either the level-2 or level-3 data (8.5-20.5% excluding 670nm for merged data).

Page 18 GlobCOLOUR 1st User Consultation Meeting – December 4-6, 2006, Villefranche sur mer
Thank youfor yourattention