inpendent evaluation group world bank · ifc · miga
TRANSCRIPT

IEG WORLD BANK · IFC · MIGA
Results and Performance of the World Bank Group 2012
Volume II: appenDIxes
InpenDent eValuatIon GRoup

Results and Performance of the World Bank Group 2012
Volume II: Appendixes


© 2013 Independent Evaluation Group 1818 H Street NW, Washington DC 20433 Telephone: 202-473-1000; Internet: http://ieg.worldbankgroup.org Some rights reserved 1 2 3 4 5 15 14 13 This work is a product of the staff of the Independent Evaluation Group (IEG) of the World Bank Group. Note that IEG and the World Bank Group do not necessarily own each component of the content included in the work. IEG and the World Bank therefore do not warrant that the use of the content contained in the work will not infringe on the rights of third parties. The risk of claims resulting from such infringement rests solely with you. The findings, interpretations, and conclusions expressed in this work do not necessarily reflect the views of IEG, the World Bank Group, its Boards of Executive Directors, or the governments they represent. IEG and the World Bank Group do not guarantee the accuracy of the data included in this work. The boundaries, colors, denominations, and other information shown on any map in this work do not imply any judgment on the part of IEG or the World Bank Group concerning the legal status of any territory or the endorsement or acceptance of such boundaries. Nothing herein shall constitute or be considered to be a limitation on or waiver of the privileges and immunities of IEG and the World Bank Group, all of which are specifically reserved. Rights and Permissions
This work is available under the Creative Commons Attribution 3.0 Unported license (CC BY 3.0) http://creativecommons.org/licenses/by/3.0. Under the Creative Commons Attribution license, you are free to copy, distribute, transmit, and adapt this work, including for commercial purposes, under the following conditions: Attribution—Please cite the work as follows: IEG (Independent Evaluation Group). 2013. Results and Performance of the World Bank Group 2012—Volume II: Appendixes. Washington, DC: World Bank. License: doi.10.1596/978-0-8213-9853-1. Creative Commons Attribution CC BY 3.0 Translations—If you create a translation of this work, please add the following disclaimer along with the attribution: This translation was not created by the Independent Evaluation Group or the World Bank Group and should not be considered an official IEG/World Bank Group translation. IEG and the World Bank Group shall not be liable for any content or error in this translation. All queries on rights and licenses should be addressed to the Office of the Publisher, The World Bank, 1818 H Street NW, Washington, DC 20433, USA; fax: 202-522-2625; e-mail: [email protected].

Contents
ACKNOWLEDGMENTS ......................................................................................................................... III
APPENDIX A IEG EVALUATION FRAMEWORKS ................................................................................ 1
APPENDIX B COUNTRY PROGRAM EFFECTIVENESS .................................................................... 10
APPENDIX C CLASSIFICATION OF IEG FINDINGS BY BANK GROUP OPERATIONAL CATEGORY .......................................................................................................................................... 19
APPENDIX D EVALUATION FINDINGS RELATED TO BANK GROUP EFFECTIVENESS IN FOUR OPERATIONAL CATEGORIES ............................................................................................................ 21
APPENDIX E PROJECT PERFORMANCE RATINGS OF WORLD BANK OPERATIONS ................. 46
APPENDIX F PROJECTION OF DEVELOPMENT OUTCOME RATINGS........................................... 59
APPENDIX G ASSESSMENTS OF POSSIBLE FACTORS UNDERLYING THE DECLINE IN OUTCOME RATINGS FOR WORLD BANK INVESTMENT PROJECTS ............................................. 60
APPENDIX H IFC OPERATIONS ......................................................................................................... 66
APPENDIX I MIGA OPERATIONS ....................................................................................................... 83
APPENDIX J IEG DEVELOPMENT OUTCOME RATINGS AND RISK FLAGS .................................. 88
APPENDIX K GOVERNANCE AND ANTICORRUPTION .................................................................... 90
APPENDIX L REFORMING THE MANAGEMENT ACTION RECORD .............................................. 103
BIBLIOGRAPHY ................................................................................................................................. 105
ENDNOTES ......................................................................................................................................... 111
VOLUME I, Main Text, and VOLUME III, Management Action Record, are available on line at http://ieg.worldbankgroup.org/publications

Acknowledgments
This report was prepared by a team led by Jiro Tominaga. The analyses were carried
out under the guidance of Ali Khadr (Senior Manager), and the direction of Caroline
Heider (Director-General, Evaluation). Stephan Wegner coordinated the analyses
related to the International Finance Corporation and Multilateral Investment
Guarantee Agency. Stephen Pirozzi co-task managed the report through late March
2012.
The team consisted of Geeta Batra, Nicholas Burke, Unurjargal Demberel, Monica
Dorhoi, Juan Jose Fernandez-Ansola, Olivier Fraisse, Hiroyuki Hatashima, Harry
Hatry (Urban Institute), Victor Malca, Katie Mark (Urban Institute), Bidjan Nashat,
Nestor Ntungwanayo, Carla Pazce, Melissa Rekas, Aurora Medina Siy, Anthony
Tyrrell, Yoshine Uchimura, Melvin Vaz, and Clay Wescott.
Peer reviewers were Shahrokh Fardoust (former Director for Operations and
Strategy, Development Economics Vice Presidency), Bert Hofman (Chief Economist,
East Asia and Pacific Region), Fredrik Korfker (former Chief Evaluator, European
Bank for Reconstruction and Development), and Amédée Prouvost (Senior Advisor
to the World Bank Group Chief Financial Officer).
Management and colleagues of the Independent Evaluation Group provided helpful
guidance and comments, including Ana Belen Barbeito, Susan Caceres, Soniya
Carvalho, Anis Dani, Adesimi Freeman, Gita Gopal, Patrick Grasso, Daniela
Gressani, R. Pablo Guerrero O., John Heath, Emmanuel Jimenez, Kelly Andrews
Johnson, Anjali Kumar, Beata Lenard, Midori Makino, Kavita Mathur, Ketevan
Nozadze, Cherian Samuel, Pia Schneider, Mark Sundberg, and Marvin Taylor-
Dormond.
William Hurlbut and Heather Dittbrenner edited the report. Vikki Taaka provided
administrative support to the team and assisted with report production.


Abbreviations
AMC Asset Management Company CAS Country Assistance Strategy/Country Partnership Strategy CASCR CAS Completion Report CODE Committee on Development Effectiveness DPO Development policy operation E&S Environmental and social (IFC, MIGA) GAC Governance and anticorruption IBRD International Bank for Reconstruction and Development ICA Investment climate assessment ICR Implementation Completion and Results Report ICT Information and communication technology IDA International Development Association IEG Independent Evaluation Group IFC International Finance Corporation ISR Implementation Status and Results Report IT Information technology M&E Monitoring and evaluation MAR Management Action Record MAS Manufacturing, agribusiness, and services MDG Millennium Development Goal MIGA Multilateral Investment Guarantee Agency PCR Project Completion Report (IFC) PEA Political economy analysis PEFA Public Expenditure and Financial Accountability PFM Public financial management PPAR Project Performance Assessment Report XPSR Expanded Project Supervision Report (IFC)


1
Appendix A IEG Evaluation Frameworks
This appendix describes select elements of the evaluation systems in the World
Bank, the International Finance Corporation (IFC), and the Multilateral Investment
Guarantee Agency (MIGA) that are the basis for this report. They illustrate
commonalities as well as differences in evaluation practices across the institutions.
The World Bank, IFC, and MIGA differ in the instruments and approaches they use
to achieve development results. Each institution has an evaluation system tailored to
its needs. In each organization, the evaluation system comprises different
components—self-evaluation, independent evaluation, and validation of self-
evaluation (Table A.1).
Table A.1. Bank Group: Self-Evaluation and Independent Evaluation
World Bank IFC MIGA
Management systems
a) Self-Evaluation
Results-based monitoring system and Supervision Status reports for Bank Group operations
Yes (ISR) Yes, DOTS Limited (DEIS, E&S monitoring)
Self-evaluation of projects Yes, ICRs Yes, XPSRs (managed by IEG)
Yes, (PERs), currently being mainstreamed
Results-based monitoring system for advisory services/AAA
Under development Yes NA
Requirement for supervision reports for advisory services/AAA
Yes Yes NA
b) Quality Assurance of Bank Group’s Portfolio
Quality Assessment of lending portfolio Yes, OPCS Yes, credit review Yes, Project Review Committee
Independent evaluation
System for reviewing self-evaluations of Bank Group operations
Yes, ICR Reviews Yes, IEG Evaluative Notes Yes, IEG Validation Notes
System for reviewing self-evaluations of country evaluations
Yes, CASCR Reviews Yes, CASCR Reviews Yes, CASCR Reviews
System for reviewing self-evaluations of advisory services/AAA
Under development Yes, PCR EvNotes NA
Independent Projects Evaluations Yes, PPARs Yes, PES Yes, PERs
Independent Country Evaluations Yes, CPEs Yes, CPEs Yes, CPEs
Source: IEG review. Note: AAA = analytic and advisory activities; CASCR = Country Assistance Strategy Completion Report; CPE = Country Program Evaluation; DEIS = Development Effectiveness Indicator System; DOTS = Development Outcome Tracking System; E&S = environmental and social effects monitoring; ISR = Implementation Status and Results Report; ICR = Implementation Completion and Results Report; NA = not applicable; PCR = Project Completion Report; PER = Project Evaluation Report; PES = Project Evaluation Summary; PPAR = Project Performance Assessment Review; OPCS = Operations Policy and Country Services; XPSR = Expanded Project Supervision Report; EvNote = Evaluative Note.

APPENDIX A IEG EVALUATION FRAMEWORKS
2
The independent evaluation function for each institution was established at different
times—1973 for the Bank, 1996 for IFC, and 2002 for MIGA—and each has evolved
over time to respond to changes in the respective institution. Independent
evaluation work is broadly scaled to each institution. For MIGA, the Independent
Evaluation Group (IEG) focuses equally on the direct evaluation of guarantee
projects as well as validations of self-evaluations, as MIGA began to implement self-
evaluation of its guarantees in 2010. For the Bank and IFC, IEG conducts validation
of self-evaluations, given the mature self-evaluation systems in those institutions.
The project evaluation methodologies and frameworks in the Bank, IFC, and MIGA
are consistent with the Good Practice Standards established by the Evaluation
Cooperation Group Working Groups for Public Sector Evaluation and Private Sector
Evaluation, which aim to harmonize evaluation standards of multilateral
development institutions’ public and private sector operations.1 The independent
evaluation systems for IFC and MIGA operations are regularly benchmarked against
the private sector evaluation standards. The most recent benchmarking exercise of
the evaluation of private sector investment operations was concluded in 2011. IFC
and MIGA were benchmarked at 93 percent and 73 percent compliance with the
standards, respectively. The standards comprise issues related to the independent
evaluation function and to institutional self-evaluation systems (ECG 2011).
Project Evaluation Frameworks across IEG
Projects are a main Bank Group vehicle for helping achieve development results.
Accordingly, IEG focuses in large part on performance at the project level. Project
evaluations serve as the building blocks for higher-level sector, thematic, country,
global and corporate evaluations.
The Bank self-evaluates 100 percent of completed investment and development
policy operations (DPOs). The findings of self-evaluations are reported in
Implementation Completion and Results Reports (ICRs). IEG conducts desk reviews
of all ICRs and prepares an ICR Review for each (see Box A.1).

APPENDIX A IEG EVALUATION FRAMEWORKS
3
Box A.1. IEG’s Review of Implementation Completion and Results Reports
The Implementation Completion and Results Report (ICR) is the main instrument of self-evaluation used by the World Bank for projects it finances. An ICR is prepared at the close of every operation or, in the case of a series of programmatic policy operations, at the end of the series of operations. Once completed, all ICRs are subject to a desk review by IEG. IEG’s desk review is largely based on evidence from the ICR itself, but also involves interviewing the last project task team leader. IEG uses the Harmonized Evaluation Criteria adopted by the Bank and IEG for the evaluation of closed projects.
As part of the review process, IEG validates the four project ratings contained in the ICR and adds two further ratings (Quality of Monitoring and Evaluation, Quality of the ICR). These six ratings are defined as follows:
Outcome: The extent to which the operation’s major relevant objectives were achieved, or are expected to be achieved, efficiently.
Risk to Development Outcome: the risk, at the time of evaluation, that development outcomes (or expected outcomes) will not be maintained (or realized).
Bank Performance: the extent to which services provided by the Bank ensured quality-at-entry of the operation and supported effective implementation through appropriate supervision, toward the achievement of development outcomes.
Borrower Performance: the extent to which the borrower (including the government and implementing agency or agencies) ensured quality of preparation and implementation, and complied with covenants and agreements, toward the achievement of development outcomes.
Quality of monitoring and evaluation: the quality of its design, implementation, and utilization.
Quality of the ICR: the quality of the evidence and analysis provided in the ICR, the extent to which lessons are based on evidence and analysis, the results-orientation of the ICR, internal consistency, consistency with Bank ICR guidelines, and conciseness.
Source: IEG.
IFC self-evaluates a random representative sample of around 50 percent of its
projects that reach early operating maturity, 80 a year on average. IEG
independently desk reviews all self-evaluations (Expanded Project Supervision
Reports [XPSRs]), producing an Evaluative Note on each. In 2005, IFC introduced
the Development Outcome Tracking System, a monitoring system for all IFC
investment operations.
For MIGA, since inception of the evaluation function, IEG has evaluated a random
sample of 50 percent of guarantee projects reaching early operating maturity. IEG
and MIGA have jointly developed a validation methodology for self-evaluations
similar to IFC’s (see Box A.2).
APPENDIX A IEG EVALUATION FRAMEWORKS
4
The evaluation systems of all three Bank Group organizations include projects that
fail to be fully implemented or are cancelled to avoid systemic bias in the groups of
reviewed projects. In the Bank, shorter self-reviews (Notes on Cancelled Operations)
are prepared for such projects instead of ICRs.
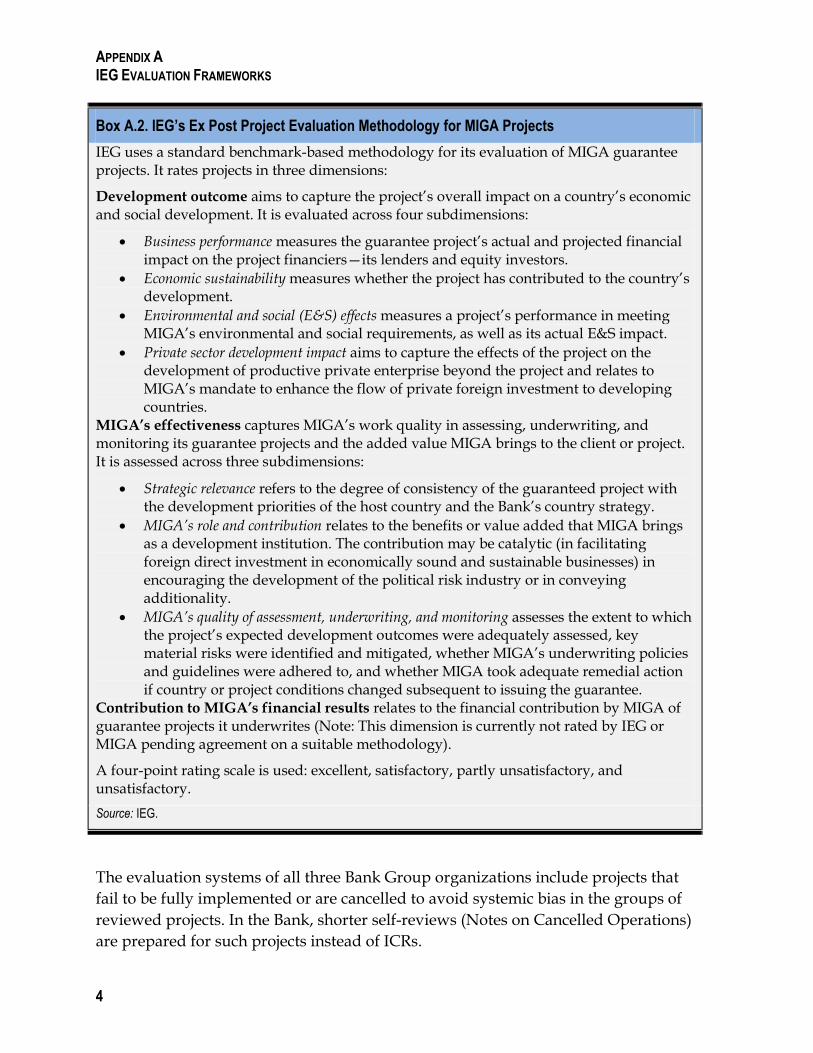
Box A.2. IEG’s Ex Post Project Evaluation Methodology for MIGA Projects
IEG uses a standard benchmark-based methodology for its evaluation of MIGA guarantee projects. It rates projects in three dimensions:
Development outcome aims to capture the project’s overall impact on a country’s economic and social development. It is evaluated across four subdimensions:
Business performance measures the guarantee project’s actual and projected financial impact on the project financiers—its lenders and equity investors.
Economic sustainability measures whether the project has contributed to the country’s development.
Environmental and social (E&S) effects measures a project’s performance in meeting MIGA’s environmental and social requirements, as well as its actual E&S impact.
Private sector development impact aims to capture the effects of the project on the development of productive private enterprise beyond the project and relates to MIGA’s mandate to enhance the flow of private foreign investment to developing countries.
MIGA’s effectiveness captures MIGA’s work quality in assessing, underwriting, and monitoring its guarantee projects and the added value MIGA brings to the client or project. It is assessed across three subdimensions:
Strategic relevance refers to the degree of consistency of the guaranteed project with the development priorities of the host country and the Bank’s country strategy.
MIGA’s role and contribution relates to the benefits or value added that MIGA brings as a development institution. The contribution may be catalytic (in facilitating foreign direct investment in economically sound and sustainable businesses) in encouraging the development of the political risk industry or in conveying additionality.
MIGA’s quality of assessment, underwriting, and monitoring assesses the extent to which the project’s expected development outcomes were adequately assessed, key material risks were identified and mitigated, whether MIGA’s underwriting policies and guidelines were adhered to, and whether MIGA took adequate remedial action if country or project conditions changed subsequent to issuing the guarantee.
Contribution to MIGA’s financial results relates to the financial contribution by MIGA of guarantee projects it underwrites (Note: This dimension is currently not rated by IEG or MIGA pending agreement on a suitable methodology).
A four-point rating scale is used: excellent, satisfactory, partly unsatisfactory, and unsatisfactory.
Source: IEG.

APPENDIX A IEG EVALUATION FRAMEWORKS
5
IFC and MIGA evaluate projects at early operating maturity, defined as generating
18 months of revenues for the company and having at least one set of audited
financial statements. Financial sector projects are selected from those that are at
least 30 months from final IFC disbursement. These comprise the sampling frame.
The average age of evaluated projects is not very different from Bank projects at
evaluation, which are evaluated after closure—on average at five years.
COMPARISONS OF THE BANK GROUP’S PROJECT RATING SYSTEMS AT IEG
IEG has an evaluation system tailored to the specific foci, clients, and services of
each Bank Group institution. The evaluation of Bank operations uses an objectives-
based system. The project-rating systems for IFC and MIGA operations are based on
quantitative and qualitative benchmarks rather than on achievement of specific
objectives. Given that IEG’s methods to evaluate IFC and MIGA operations are both
consistent with the harmonized Good Practice Standards of the Evaluation Capacity
Group, these two systems are very comparable. A key difference between them is
that while the evaluation of IFC operations is based on self-evaluations, the
evaluation of MIGA operations relies on both IEG’s direct evaluation and self-
evaluation.
In each case, the overall project development outcome is a synthesis rather than a
numerical average of ratings. Bank and IFC operations are rated based on a six-point
scale; MIGA operations on a four-point scale. Elements of the aggregate rating
systems differ across the three institutions. IFC summary development outcome
ratings exclude project investment returns to IFC as well as IFC performance. IFC
views the relevance of project objectives as the responsibility of its staff; relevance is
thus a measure of IFC’s own performance or effectiveness (see Box A.3) rather than
that of the project, per se. In the evaluation system for Bank operations, however,
project relevance is rated separately from Bank performance. The outcome rating
considers the extent to which the operation’s major relevant objectives were
achieved, or are expected to be achieved, efficiently. In each case, IEG looks at
available measures of efficiency, including analysis of cost-effectiveness and other
indicators of value for money.
In the IFC and MIGA rating frameworks, IEG gives prominence to the
environmental and social (E&S) effects of projects as a separate rating dimension.
For IFC and MIGA, an unsatisfactory rating on this dimension would generally
result in a less-than-satisfactory synthesis rating for the development outcome.
However, for Bank projects, E&S performance is not a separate dimension within
the project outcome ratings.
APPENDIX A IEG EVALUATION FRAMEWORKS
6
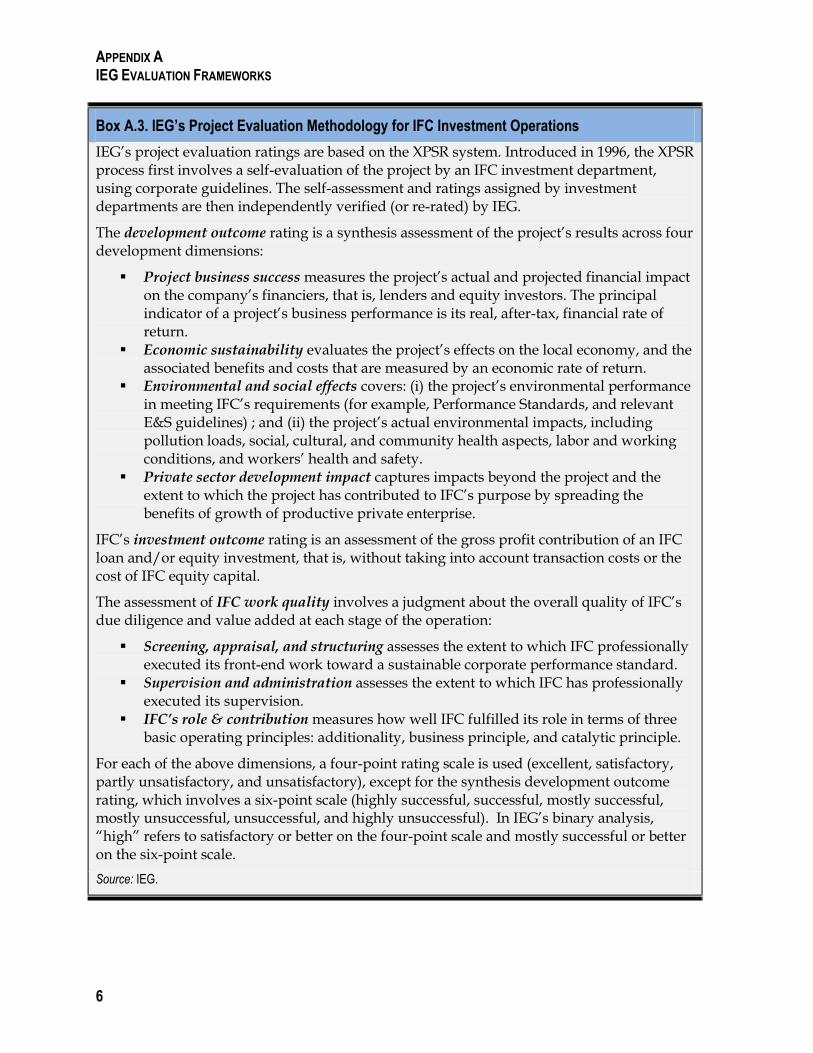
Box A.3. IEG’s Project Evaluation Methodology for IFC Investment Operations
IEG’s project evaluation ratings are based on the XPSR system. Introduced in 1996, the XPSR process first involves a self-evaluation of the project by an IFC investment department, using corporate guidelines. The self-assessment and ratings assigned by investment departments are then independently verified (or re-rated) by IEG.
The development outcome rating is a synthesis assessment of the project’s results across four development dimensions:
Project business success measures the project’s actual and projected financial impact on the company’s financiers, that is, lenders and equity investors. The principal indicator of a project’s business performance is its real, after-tax, financial rate of return.
Economic sustainability evaluates the project’s effects on the local economy, and the associated benefits and costs that are measured by an economic rate of return.
Environmental and social effects covers: (i) the project’s environmental performance in meeting IFC’s requirements (for example, Performance Standards, and relevant E&S guidelines) ; and (ii) the project’s actual environmental impacts, including pollution loads, social, cultural, and community health aspects, labor and working conditions, and workers’ health and safety.
Private sector development impact captures impacts beyond the project and the extent to which the project has contributed to IFC’s purpose by spreading the benefits of growth of productive private enterprise.
IFC’s investment outcome rating is an assessment of the gross profit contribution of an IFC loan and/or equity investment, that is, without taking into account transaction costs or the cost of IFC equity capital.
The assessment of IFC work quality involves a judgment about the overall quality of IFC’s due diligence and value added at each stage of the operation:
Screening, appraisal, and structuring assesses the extent to which IFC professionally executed its front-end work toward a sustainable corporate performance standard.
Supervision and administration assesses the extent to which IFC has professionally executed its supervision.
IFC’s role & contribution measures how well IFC fulfilled its role in terms of three basic operating principles: additionality, business principle, and catalytic principle.
For each of the above dimensions, a four-point rating scale is used (excellent, satisfactory, partly unsatisfactory, and unsatisfactory), except for the synthesis development outcome rating, which involves a six-point scale (highly successful, successful, mostly successful, mostly unsuccessful, unsuccessful, and highly unsuccessful). In IEG’s binary analysis, ―high‖ refers to satisfactory or better on the four-point scale and mostly successful or better on the six-point scale.
Source: IEG.

APPENDIX A IEG EVALUATION FRAMEWORKS
7
Since 2006 IEG has rated the Bank on the quality of project monitoring and
evaluation (M&E) based on such factors as design, utilization, and dissemination.
As for IFC and MIGA operations, IEG does not assess the M&E of individual
projects. IEG conducts periodic reviews of the M&E systems of the two institutions.
The most recent IEG evaluation of the IFC system was conducted in 2008 (see IEG
2009b). A review of the IFC and MIGA M&E systems by IEG is ongoing and will be
completed in the fall of 2012.
For Bank-financed projects, borrower performance is rated separately. The borrower
is asked to contribute to the completion reports. The performance of cofinanciers
and other partners is also assessed. Comments on the draft completion report are
sought from the borrower, cofinanciers, and other partners, and the completion
report is publicly disclosed. Consistent with the proprietary information on which
they are based (client data are subject to confidentiality restrictions), IFC and MIGA
do not disclose XPSRs, MIGA Project Evaluation Reports, or Evaluative/Validation
Notes, nor do they share the self-evaluations outside IFC or MIGA. However, the
perspectives of investors and other financial stakeholders are routinely gathered as
input to the evaluation.
Lessons learned are a common feature of the ICR Reviews, XPSRs, and MIGA
Project Evaluation Reports. Formats for the lessons are the same in IFC and MIGA, 2
whereas the Bank reports on different aspects. IEG also provides ratings of the
quality of Bank ICRs. The ratings are based on factors such as quality of the analysis
and strength of the evidence.
NONLENDING SERVICES
Only IFC has a self-evaluation system for all Advisory Services operations that are
then independently reviewed by IEG. IEG’s validations of IFC Advisory Services
self-evaluations focus on the evaluative substance of Project Completion Reports,
the sufficiency of the evidence produced, and the adequacy of ratings assigned,
largely via desk review. Selective field-based validations have also been conducted.
Established in 2008, this remains a young evaluation system for IFC and it uses a
results-based approach (see Box A.4). IFC also conducts supplementary external
reviews and evaluations of specific projects and programs.
The Bank requires a Completion Summary to be prepared for all analytic and
advisory activities normally within six months after management endorsement of
the deliverable. IEG does not routinely review this summary. It is currently piloting
the review of technical assistance components of projects as part of Project
Performance Assessment Reports (PPARs).
APPENDIX A IEG EVALUATION FRAMEWORKS
8
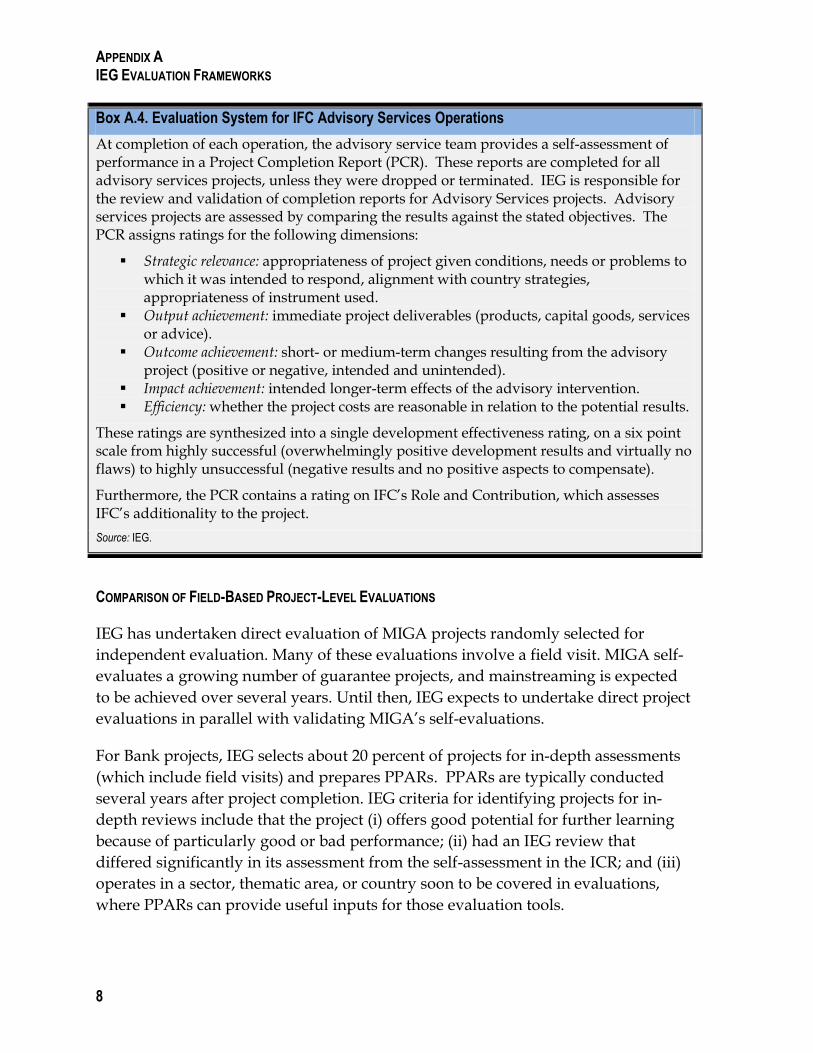
COMPARISON OF FIELD-BASED PROJECT-LEVEL EVALUATIONS
IEG has undertaken direct evaluation of MIGA projects randomly selected for
independent evaluation. Many of these evaluations involve a field visit. MIGA self-
evaluates a growing number of guarantee projects, and mainstreaming is expected
to be achieved over several years. Until then, IEG expects to undertake direct project
evaluations in parallel with validating MIGA’s self-evaluations.
For Bank projects, IEG selects about 20 percent of projects for in-depth assessments
(which include field visits) and prepares PPARs. PPARs are typically conducted
several years after project completion. IEG criteria for identifying projects for in-
depth reviews include that the project (i) offers good potential for further learning
because of particularly good or bad performance; (ii) had an IEG review that
differed significantly in its assessment from the self-assessment in the ICR; and (iii)
operates in a sector, thematic area, or country soon to be covered in evaluations,
where PPARs can provide useful inputs for those evaluation tools.
Box A.4. Evaluation System for IFC Advisory Services Operations
At completion of each operation, the advisory service team provides a self-assessment of performance in a Project Completion Report (PCR). These reports are completed for all advisory services projects, unless they were dropped or terminated. IEG is responsible for the review and validation of completion reports for Advisory Services projects. Advisory services projects are assessed by comparing the results against the stated objectives. The PCR assigns ratings for the following dimensions:
Strategic relevance: appropriateness of project given conditions, needs or problems to which it was intended to respond, alignment with country strategies, appropriateness of instrument used.
Output achievement: immediate project deliverables (products, capital goods, services or advice).
Outcome achievement: short- or medium-term changes resulting from the advisory project (positive or negative, intended and unintended).
Impact achievement: intended longer-term effects of the advisory intervention. Efficiency: whether the project costs are reasonable in relation to the potential results.
These ratings are synthesized into a single development effectiveness rating, on a six point scale from highly successful (overwhelmingly positive development results and virtually no flaws) to highly unsuccessful (negative results and no positive aspects to compensate).
Furthermore, the PCR contains a rating on IFC’s Role and Contribution, which assesses IFC’s additionality to the project.
Source: IEG.
APPENDIX A IEG EVALUATION FRAMEWORKS
9
PPARs are sometimes clustered by issue or topic to reduce their cost and increase
their learning impact. These reports rate projects in terms of their outcome (taking
into account relevance, efficacy, and efficiency) and risk to development outcome.
IEG field reviews of IFC projects do not have clearly defined criteria, but in practice
they are frequently undertaken to validate the E&S performance of projects selected
for IEG studies and/or where there are major disagreements on these or other
ratings between IFC investment staff and IEG.
Program, Country, and Thematic Evaluations
Project evaluations serve as the building blocks for higher-level evaluations—sector,
thematic, country, global, and corporate. Increasingly, such IEG reports reflect
findings and lessons across the Bank Group.
COUNTRY-LEVEL EVALUATIONS
All Country Assistance Strategies (CASs) need to include a self-evaluation of the
Bank’s previous program in the country, called a CAS Completion Report (CASCR).
IEG conducts a desk review of the CASCR to validate the self-evaluation and makes
its assessment available to the Board for its discussion of the next CAS. If the CAS is
a joint Bank Group document, the CASCR, and IEG’s CASCR Review, also cover
IFC’s and MIGA’s contributions to CAS objectives and performance. Recently,
―enhanced‖ CASCR Reviews have been undertaken that include an IEG visit to the
country. Country performance is not the focus of strategy and accountability for IFC,
as the clients are private companies, not the country. IEG reflected on this issue in its
2008 Biennial Report on Operations Evaluation (IEG 2009b).
OTHER AREAS OF EVALUATION
Sector and thematic reviews examine developments, trends, performance and
experience in a sector, such as agriculture or transport, or a thematic area, such as
climate change or gender. Global partnership programs, which typically represent
collective action to achieve common development objectives, are also covered in
IEG’s evaluation work. The evaluations address global or regional issues that cross
national boundaries. IEG also conducts corporate evaluations relating to the Bank,
IFC, and MIGA, which can cover corporate instruments and programs, as well as
procedures.

10
Appendix B Country Program Effectiveness
Country Programs and the Growth Agenda
Uncertainty remains concerning the extent and pace of the global economic growth,
and progress in development varies across and within countries. Much of the fast
growth during 2001–10 occurred among upper-middle-income countries (Figure
B.1), although the per capita growth rate for most developing countries in that
period was higher than in the preceding decade. Progress in low-income countries is
steady, but much slower than in upper- and lower-middle-income countries,
resulting in a widening wealth gap between middle-income countries on the one
hand and low-income countries on the other.
Growth alone cannot address all
development challenges, although it
remains vital for continued
progress. Fast growth was
accompanied by an increase in
income inequality in some
instances. In some of the fast-
growing emerging countries,
disparities in income among the
population have widened relative
to the levels in the early 1990s,
which could pose risks to the long-
term sustainability of economic
growth.
In this environment, the rationale
for the World Bank Group to tailor
its support for country-specific
challenges remains robust, and a
country program is the main vehicle to deliver such support under an integrated
framework. The primacy of country programs as a means for the World Bank to
articulate its development priorities, determined in consultation with the country
stakeholders, and to influence development results has been pointed out repeatedly
in past evaluations. IFC and, to a lesser degree, MIGA are beginning to establish
alignment through participation in the process of preparing country strategies.
Figure B.1. Average Per Capita Growth Rates 2001–10
Source: World Bank data. Note: High growth means average per capita gross domestic product growth rate higher than or equal to 5 percent; medium growth is higher than or equal to 2 percent and less than 5 percent; low growth is less than 2 percent; and no or negative growth is below 0 percent.
0
5
10
15
20
25
30
35
40
No or negative growth
Low growth Medium growth
High growth
No
. of
Co
un
trie
s
Low income High Income
Lower middle income Upper middle income

APPENDIX B COUNTRY PROGRAM EFFECTIVENESS
11
Successful country programs tend to be supported by locally owned strategies with
clear priorities and strong links between intended outcomes and interventions.
Responsiveness to changing country priorities is also critical amid continuing
uncertainty. In that regard, the Bank Group was flexible and timely in adapting its
strategies in responding to the global crisis in a number of countries, as discussed
further below.
Summary of Findings from a Review of CASCR Reviews (July 2007–March 2012)
IEG reviewed and rated 83 CASCRs3 prepared from FY08 to the end of March 2012.
CAS overall outcomes were rated moderately satisfactory or better for 58 percent of
the evaluations,4 and Bank performance was rated moderately satisfactory or better
for 73 percent of the evaluations. Box B.1 illustrates two cases where CAS overall
outcome ratings and Bank performance ratings differ.
Box B.1. Unsatisfactory Outcome Ratings Do Not Imply Poor Bank Performance
Outcomes of partnership strategies are determined by the joint impact of the country, the Bank, partners, and exogenous forces. This helps explain why CAS overall outcomes were rated satisfactory or better for 58 percent of the evaluations and Bank performance was rated moderately satisfactory or better for 73 percent. Two examples follow.
West Bank and Gaza (2001–09): After almost two decades of active engagement, little progress was made toward achieving the objectives of the Bank Group program: institutional development was uneven; most infrastructure sectors continued to face technical and political issues; recent economic growth was driven mainly by donor subsidies; and the private sector was weak. The Bank Group, however, made important contributions in identifying obstacles to development, estimating their costs, and promoting the search for reasonable compromises. The moderately unsatisfactory outcome rating was due mostly to issues beyond the Bank Group’s control.
Serbia (FY08–11): The business climate improved marginally and results were modest on regional development and negligible in reducing pollution coming from targeted agricultural activities, strengthening environmental management, enhancing efficiency in the use of natural resources, and managing environmental and disaster risk. The Bank Group responded creatively to changing local circumstances that resulted from the global financial crisis by extending a policy based guarantee to leverage additional resources for Serbia. In part, the poor results had to do with an overly optimistic strategy, but IEG noted poor institutional coordination within the government and other political economy factors beyond the Bank’s control as the main factors behind the poor results.
Source: IEG.
Ratings of outcomes have been unevenly distributed over the period FY08–12 with
poor results concentrated in FY10 evaluations, possibly reflecting a bunching of poor

APPENDIX B COUNTRY PROGRAM EFFECTIVENESS
12
performers and the adverse effects of the global financial crisis (Figure B.2). IEG also
completed ten country program evaluations during the period, which are more in-
depth evaluations that include country visits by the evaluating team. A review of
such evaluations undertaken for this report corroborates the picture that emerges
from the CASCR Reviews.
Figure B.2. CASCR Review Ratings of Overall Country Outcomes
A. Share of Moderately Successful or Better (CASCR-Reviews July 2007–March 2012)
B. Share of Moderately Successful or Better (CASCR-Reviews July 2007–March 2012)
Source: IEG data.
A RETROSPECTIVE VIEW OF COUNTRY PROGRAM RATINGS—THE MATRIX EVALUATION
IEG’s evaluation of the matrix system in the World Bank (IEG 2012c) reviewed 96
CASCR-Rs covering the period FY1998 through December 2010. The quality of
country programs was assessed against the two goals of the reform agenda (to create
a new Bank culture through increased ―client responsiveness‖ and delivery of
―quality services‖) using eight variables, four reflecting responsiveness and four
representing effectiveness. Each variable was assessed separately on a four-point
scale using evidence from IEG’s CASCR Reviews. Insights from the matrix
evaluation suggest that CASs frequently lacked proper country ownership, were not
realistic when assessing country capacity and commitment, and had weak results
frameworks.
A review was undertaken for this report following the methodology and the rating
criteria used for the matrix evaluation, but focused only on issues related to
ownership, realism, and the results framework. The following sections summarize
the findings of the review.
58% 42%
Moderately Satisfactory or better
Moderately Unsatisfactory
0
5
10
15
20
2008 2009 2010 2011 2012 N
um
be
r o
f C
ASC
R-R
Fiscal Year of CASCR-R
MS+ MU-
APPENDIX B COUNTRY PROGRAM EFFECTIVENESS
13
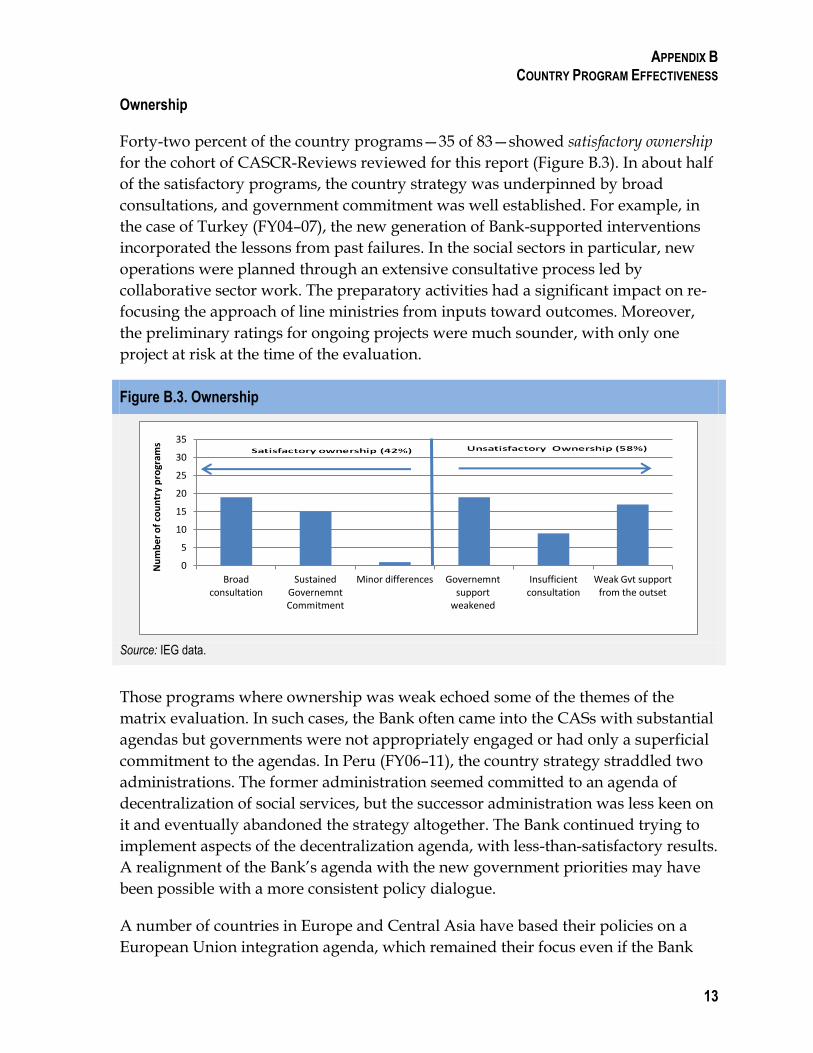
Ownership
Forty-two percent of the country programs—35 of 83—showed satisfactory ownership
for the cohort of CASCR-Reviews reviewed for this report (Figure B.3). In about half
of the satisfactory programs, the country strategy was underpinned by broad
consultations, and government commitment was well established. For example, in
the case of Turkey (FY04–07), the new generation of Bank-supported interventions
incorporated the lessons from past failures. In the social sectors in particular, new
operations were planned through an extensive consultative process led by
collaborative sector work. The preparatory activities had a significant impact on re-
focusing the approach of line ministries from inputs toward outcomes. Moreover,
the preliminary ratings for ongoing projects were much sounder, with only one
project at risk at the time of the evaluation.
Figure B.3. Ownership
Source: IEG data.
Those programs where ownership was weak echoed some of the themes of the
matrix evaluation. In such cases, the Bank often came into the CASs with substantial
agendas but governments were not appropriately engaged or had only a superficial
commitment to the agendas. In Peru (FY06–11), the country strategy straddled two
administrations. The former administration seemed committed to an agenda of
decentralization of social services, but the successor administration was less keen on
it and eventually abandoned the strategy altogether. The Bank continued trying to
implement aspects of the decentralization agenda, with less-than-satisfactory results.
A realignment of the Bank’s agenda with the new government priorities may have
been possible with a more consistent policy dialogue.
A number of countries in Europe and Central Asia have based their policies on a
European Union integration agenda, which remained their focus even if the Bank
0
5
10
15
20
25
30
35
Broad consultation
Sustained Governemnt Commitment
Minor differences Governemnt support
weakened
Insufficient consultation
Weak Gvt support from the outset
Nu
mb
er
of
cou
ntr
y p
rogr
ams

APPENDIX B COUNTRY PROGRAM EFFECTIVENESS
14
partnership strategy had a slightly different slant. Ownership of the European
Union–oriented policies took precedence over interventions agreed under the
partnership with the Bank.
Realism
One-third of country programs showed moderately satisfactory or better levels of
realism, in line with the matrix evaluation (Figure B.4).
Figure B.4. Realism
Source: IEG data.
Realistic programs showed an understanding of the political economy of the country
(political riskiness) and local implementation constraints. In the case of Turkey
(FY04–07), the lending program and analytic work conformed closely to the original
CAS program. On the Turkish side, there was a high degree of political stability with
no serious natural disasters during the CAS period; and on the Bank side, the core of
the Bank program (development policy loans) had the flexibility to respond to
changing realities and push on doors that seemed likely to open.
Another characteristic of a realistic program is selectivity—focusing on areas of
reform where the Bank can complement the authorities’ interventions, taking into
account government capacities. In Guatemala (FY05–08), the Bank was selective and
took into account political conditions; it used single-tranche programmatic loans
that would allow it to adjust the program as needed.
By contrast, programs that did not show an assessment of absorptive capacity or the
local political economy were less successful. In Costa Rica (FY04–08), the Bank
underestimated the time it would take to obtain political consensus and pass key
reforms through parliament. As a result, program implementation suffered
significant delays compared to the proposed strategy.
0
10
20
30
40
50
60
70
80
De facto realistic Minor shortcomings Unrealistic
Nu
mb
er
of
cou
ntr
y p
rogr
ams

APPENDIX B COUNTRY PROGRAM EFFECTIVENESS
15
Results Frameworks
Fifteen of 83 country programs—18 percent—had satisfactory results frameworks,
compared with about one-quarter in the matrix evaluation (Figure B.5).
Figure B.5. Results Framework Quality
Source: IEG data.
Weak results frameworks typically had three main characteristics: (i) a poor (or
irrelevant) link between instruments and activities and intended outcomes; (ii) poor
M&E systems, including indicators that were far removed from the outcomes they
intended to support; and (iii) a focus on inputs and outputs rather than outcomes
(Figure B.6).
Figure B.6. Results Framework—Common Reasons for Shortcomings
Source: IEG data.
For example, counterparts in Chile opined to IEG evaluators that Bank readiness to
lend could get in the way of better projects and results, among other things, because
the Bank tends to go along with what the authorities propose. They also noted that
0
10
20
30
40
50
60
70
80
90
Good results frameworks Minor Shortcomings Poor Results Frameworks
Nu
mb
er
of
Co
un
try
Pro
gram
s Satisfactory Results Frameworks (18%)
0 10 20 30 40 50 60 70 80 90
Focus on inputs rather than outcomes
Poor link between instruments and outcomes
Poor Monitoring and Evaluation systems
At least two of these
Nu
mb
er
of
cou
ntr
y P
rogr
ams
APPENDIX B COUNTRY PROGRAM EFFECTIVENESS
16
the urge to disburse creates incentives to cut corners and load projects with process
indicators rather than with more demanding outcome indicators. In Chile (FY07–
10), which had a mostly knowledge-based program, objectives were not well
defined, and outcome indicators were mostly absent from the results framework
underpinning the country strategy (IEG 2011c). In Ukraine (FY04–07) the CAS
undertook to decrease the number of depressed territories, although it had no
instrument to support this objective. In contrast, a select group of strategies showed
good results frameworks. For example, IEG’s review of Poland (FY05–08) notes that
the instruments and operations were appropriate and well linked to intended
outcomes of Bank assistance.
LESSONS LEARNED FROM EVALUATIONS OF COUNTRY PROGRAMS
The review of recent CASCR-Reviews shows that successful programs result from
locally owned partnership strategies that have clear priorities and that effectively
monitor and evaluate outcomes that are clearly linked to interventions. In this
context, the following lessons in four areas emerged from the CASCR Reviews and
country program evaluations undertaken during FY08–12.
Dialogue with Country Counterparts
A more engaged dialogue with country counterparts ensures buy-in and
understanding of the local political economy and provides selectivity and focus. The
Bank Group has greater development effectiveness when it aligns its strategy with
the government’s own program. In Peru (FY07–11), the initial reform platform was
short on detail and lacked authorities’ agreement on the specific interventions
expected from the Bank Group, following the transition in administration. Peru
went its own way on reform, and the dialogue with the authorities was not as fluid
as was needed for the Bank Group to incorporate the country’s changing policy
intentions in its own projects and programs. As a result, projects on decentralization
of social sectors and rural education performed poorly. By contrast, reflecting a close
dialogue with the authorities, the Bank Group had highly effective interventions
supporting Peru’s actions to deal with the effects of the global financial crisis.
Moreover, the current Country Partnership Strategy reflects a more thorough
discussion with the authorities and corresponding buy-in.
In Costa Rica (FY09–11), implementation of ongoing projects proceeded slowly,
primarily because of delays in project effectiveness caused by the process of
consensus-building and the ex ante controls by the supreme audit institution, to
which the Bank did not devise an adequate response. A more fluid dialogue with

APPENDIX B COUNTRY PROGRAM EFFECTIVENESS
17
the relevant authorities could have made the Bank more aware of Costa Rica’s
political economy when preparing projects.
In Sri Lanka (FY09–12) the Bank committed to deliver results in areas where the
government had not articulated a precise agenda. Eventually the Bank and the
authorities could not agree on a common vision on how to promote agricultural
competitiveness. In addition, the Bank Group had to significantly reassess the pace
at which the development agenda could be implemented in the water sector. The
result was an unfocused program as well as frustration among the relevant
authorities with the Bank. The authorities believed the Bank did not tailor proposed
solutions to the country’s problems and that it emphasized an agenda that was
misaligned with the reality of a country progressing from International
Development Association (IDA) to middle-income status.
These observed tensions underscore that a close dialogue at all stages of
development and implementation of the country program is essential to bolster the
Bank Group’s development effectiveness. Such close dialogue would also have
brought focus to an analytical and advisory activity agenda that, in the case of Sri
Lanka, was perceived to be too thinly spread and unfocused.
Congruence between Outcomes and Interventions
The most common individual weakness of results frameworks is that objectives and
subobjectives are too broadly defined and that, in effect, they may be realized only
under a very optimistic set of assumptions. Bank Group strategies in many instances
are based on microlevel interventions that are expected to deliver higher-order
macro outcomes. A number of programs were found to have objectives whose
ambition and scope were not supported by adequate Bank Group interventions. For
example, the Russian economy did not diversify as expected under the program
because the country’s key competitive and innovation challenges spanned a very
broad set of issues that went well beyond the reach of the Bank Group program.
According to the assessment of the recent CASCR-Review, in Brazil, Bank Group
interventions could not, realistically, be expected to increase the per capita gross
domestic product of the poorer regions to the country’s average (IEG 2011i); and,
further, the program had little to offer toward achieving the stated financial sector
objectives.
Monitoring and Evaluation Systems
Strategies need good M&E systems for effective supervision of relevant programs
and associated interventions and to allow for the adjustment of strategy in light of
progress or unexpected developments. Yet poor M&E systems were a significant

APPENDIX B COUNTRY PROGRAM EFFECTIVENESS
18
barrier to effective results frameworks in many of the cases reviewed. For example,
in Mozambique, a poor M&E framework provided a weak guide to IDA’s activities
and contributed to a failure to modify the course, even though results suggested the
need to redesign several interventions midway through their implementation. In
Bolivia, there was no up-to-date information on several outcome indicators during
implementation. This weakness preempted the needed adjustment of a transitory
strategy to reflect progress being made and constrained the Bank Group’s thinking
about the changes that would have been desirable.
Responsiveness to Changing Country Priorities and Developments
The noted deficiencies in M&E systems can be compounded by institutional
deficiencies that limit the Bank’s responsiveness through the course of strategy
implementation. The CAS progress report is typically the instrument that the Bank
Group uses to take stock of implementation and to make appropriate adjustments
toward the attainment of development results. Yet, in practice, fewer than one-third
of CAS progress reports adjusted strategies through modifying expected outcomes
or changing indicators for those outcomes. In some cases, where the strategy was
going well and there were no unexpected external developments, this practice was
appropriate. But in many other instances, CAS progress reports missed the
opportunity to introduce necessary changes.
In Mozambique’s case, the Bank Group did not prepare a CAS progress report
because of turnover in the team. The result was a strategy that floundered and a
moderately unsatisfactory outcome rating. The CAS strategy framework designed
for Uruguay in 2005 was relatively unfocused and left the door open for a refocusing
at the CAS progress report stage, following dialogue with the new government.
Ultimately, however, the country team did not bring focus to the results framework
at the time of the CAS progress report.
By contrast, a number of countries—including Peru and Ukraine—made good use of
the CAS progress report to adapt the Bank Group strategy to the 2008–09 financial
crisis. The response of these and other country strategies to the global crisis showed
flexibility and timeliness—underscoring how essential CAS progress reports are to
updating the objectives of the country strategy and adapting the objectives to
changing circumstances and developments.

APPENDIX E PROJECT PERFORMANCE RATINGS OF WORLD BANK OPERATIONS
19
Appendix C Classification of IEG Findings by Bank Group Operational Category
In analyzing the evaluative information on sectoral and thematic results, this report
organizes IEG findings under four categories of Bank Group operations. These
categories were developed building on the core development goals introduced in
the 2011 report. The goals are in line with the underlying development goals and
priorities that the Bank Group has pursued in its strategies and operations.
This report retains the basic approach of analyzing sectoral/thematic results
concerning broadly defined areas that encompass operations of the Bank, IFC, and
MIGA. However, modifications have been made to reflect last year’s experience.
Last year’s report introduced four core goals as an evaluative framework. In
contrast, this year, Bank Group operations and associated evaluation findings are
classified under four operational areas to allow for more systematic organization of
the findings from diverse Bank Group operations.
The goals in last year’s report and the operational categories in this year’s report are
as indicated in Table C.1. Table C.2 shows the project, cluster, and business line
codes used to classify Bank Group operations under the four operational areas.

APPENDIX C CLASSIFICATION OF IEG FINDINGS BY BANK GROUP OPERATIONAL CATEGORY
20
Table C.1. Comparison of Classifications Used in Results and Performance Reports 2011 and 2012
2011
Four development goals
2012
Bank Group operational categories
Expanding economic opportunities
Improving public sector effectiveness
Enhancing human development
Increasing resilience to socioeconomic and environmental risks
Expanding economic opportunities
Developing infrastructure
Enhancing human development
Ensuring environmentally and socially sustainable development
Source: IEG.
Table C.2. Classification of IEG Findings by Bank Group Operational Category
Areas of Bank Group operations
World Bank project codinga IFC industry clusters and Advisory Services
business linea
Expanding economic opportunities
Economic Policy Poverty Reduction Finance and Private Sector Development Public Sector Governance Legal Department (Law and Justice)
Agriculture and Rural Development
Manufacturing, Agribusiness, and Services Cluster (without healthcare and education services) Financial Markets Cluster Access to Finance Advisory Services Sustainable Business Advisory Services (Corporate Governance; Linkages; SME Management Solutions)
Investment Climate Advisory Services
Building infrastructure for growth
Transport Global Information and Communication Technology Energy and Mining Water Urban Development
Infrastructure and Natural Resources Cluster Public-Private Partnerships Advisory Services
Enhancing human development
Education Health, Nutrition, and Population Social Protection
Health Care and Education Services investment projects
Ensuring environmentally and socially sustainable development
Social Development Environment Gender Development
Sustainable Business Advisory Business Line (Eco-standards & Sustainable Supply Chain; and Sustainable Energy Market Development)
Source: IEG. Note: The classification presented in this table is introduced as a way to organize IEG findings into areas of Bank Group operations.
SME = small- and medium-sized enterprise.
a. Sector board coding was used for World Bank–supported projects. IFC industry cluster classifications and Advisory Service business
lines were used for IFC-supported activities. MIGA projects were classified according to their respective institutional sector designations.

APPENDIX E PROJECT PERFORMANCE RATINGS OF WORLD BANK OPERATIONS
21
Appendix D Evaluation Findings Related to Bank Group Effectiveness in Four Operational Categories
The Bank Group contributes to development results through lending, knowledge
work, advisory services, and partnership activities in various sectoral and thematic
areas. As summarized in Appendix C, this report uses four broad categories of Bank
Group operations to discuss its wide-ranging operations in both a systematic and
comprehensive way. This appendix shows the salient points regarding the
effectiveness of Bank Group operations in these operational categories based on
findings of IEG evaluations.
Expanding Economic Opportunities
Support to expand economic opportunities is a centerpiece of the Bank Group’s
operations. Most, if not all, of the CASs have a pillar that aims to foster growth and
improve institutions. The achievements in these pillars are generally rated on a par
with or better than the overall outcome ratings. Since the global economic crisis, Bank
Group support for reforms intended to expand economic opportunities has been
particularly relevant.
Overall, the findings in Bank operations to expand economic opportunities highlight
the value of continued dialogue and high-quality analytical work. For example,
when there is a knowledge gap, the Bank encountered difficulty in helping
governments map out actionable programs at the time of the global economic crisis.
Dialogue is also shown to help increase specificity of recommendations in the Bank’s
knowledge work, while maintaining analytical independence from government
counterparts. Well-implemented projects with desired outputs could end up with
little meaningful impact, if the right issues are not identified in the first instance.
But good design does not always guarantee success. External conditions can change
rapidly, particularly in today’s environment, with direct consequences for project
outcomes. The findings on the Bank operations to enhance the business environment
demonstrate the challenges in expanding the success at the output level (such as
shortening of the time required for registration and reductions in processes) to
results at the outcome level (such as enhanced competitiveness and improved
business environment). Relevant evaluations also suggest that successful
interventions tend to set an appropriate timeframe for reforms to take effect.
APPENDIX D EVALUATION FINDINGS RELATED TO BANK GROUP EFFECTIVENESS IN FOUR OPERATIONAL CATEGORIES
22
Lessons drawn by both Bank task teams and IEG at completion of interventions in
this operational category frequently refer to a long time horizon needed for the
reform impact to emerge. Similarly, the lessons, most notably in public sector and
governance projects, point to the importance of keeping the design simple and
setting realistic targets based on a solid understanding of the political context for
reform. Factors exogenous to Bank operations, such as the prospect of European
Union accession and government transition, also affect the ownership of reform. A
combination of financial, technical and knowledge services provides diverse alleys
for continued dialogue with clients beyond transitional phases.
The choice of channels and instruments to influence the outcomes in this operational
category varies across countries to address specific needs. The following sections
provide salient findings on four major types of activities often found in relevant
CAS pillars: enhancing the business environment, investment climate, and
competiveness; supporting appropriate fiscal management; strengthening the
financial sector; and improving agricultural productivity. This section also discusses
the IFC and MIGA operations in manufacturing, agribusiness, and services (MAS).
BUSINESS ENVIRONMENT
Improvement in the business environment is often pursued through reduction in
regulatory and administrative processes in conducting business. Achievements have
been reported, for example, in reducing the number of procedures that businesses
need to follow and in setting up a one-stop electronic platform to handle procedures
related to business activities. Simplifications of export procedures and improvement
in customs’ clearing systems have helped reduce the time needed for imports and
exports clearance. Reduction in the minimum capital requirement for business start-
ups has been implemented as a means to support small and medium enterprises.
Changes in the law on inspection have also resulted in fewer numbers of enterprises
undergoing government inspection in a number of client countries.
However, evaluations also show that the impact of these achievements is not always
apparent. In certain instances, the effect on overall competitiveness may be visible
only after a lag and, in other cases, causality may be difficult to establish. In one
case, legislative changes were made to simplify business regulation. However, the
changes did not lead to changes on the ground, particularly regarding the time that
managers have to spend complying with regulations, which cast doubts about the
relevance of the reform program.
The Bank Group is actively engaged in the provision of knowledge services in this
area. For example, investment climate assessment (ICA) is one of the key

APPENDIX D EVALUATION FINDINGS RELATED TO BANK GROUP EFFECTIVENESS IN FOUR OPERATIONAL CATEGORIES
23
instruments designed to help improve the investment climate. It identifies the key
constraints to private sector investment and operations and provides
recommendations on steps to improve the investment climate. IEG reviewed nine
ICAs in five countries and found wide variation in the results achieved (IEG 2011g).
In one instance, ICA findings were used by the government counterpart as an
agenda for reform and as a baseline to measure the progress of measures taken on
taxation and deregulation. In another case, the government virtually ignored
findings or considered them out of date.
The review also found that much of the credibility of the ICA stems from the fact
that it is not a government-sponsored product. What is important is not that
government undertakes the assessment but that there is official acknowledgement of
the constraints identified in the analyses and ownership of the agenda addressing
these constraints. High standards of technical quality are critical for better results.
The quality of recommendations is particularly pertinent; yet providing specific
recommendations is a challenge, as ICAs typically provide diagnostic information
without deeper sectoral analyses on the likely impact of alternative remedial
measures. Dialogue with stakeholders is also vital in driving the demand for change.
Approximately 80 percent of evaluated IFC and MIGA projects had satisfactory or
higher ratings for their private sector development impact (that is, effects beyond
the project enterprise). Typical effects include enhanced competition and efficiency
in the sector through the entry of a new project, introduction of new products,
support for privatization projects, or demonstration effects of investments in
difficult markets that may lead to additional private investment. In certain instances,
projects have also contributed to an improved regulatory environment through the
introduction of international governance standards in their host countries.
Knowledge products offered by investment climate advisory services, a joint IFC,
Bank, and MIGA entity, focus on improving aspects of the business-enabling
environment such as business regulation, international trade and investment, and
industry-related investment climate. Investment climate advisory projects had a
development effectiveness success rate of 58 percent (FY08–10), on a par with IFC
Advisory Services overall. Projects performed better where interventions were
properly phased and where client commitment remained strong throughout the
intervention, based on a thorough understanding of political issues and priorities.
FISCAL MANAGEMENT
Fiscal positions in developing countries have deteriorated since 2008, although the
conditions are generally better than those in developed countries. Given the
APPENDIX D EVALUATION FINDINGS RELATED TO BANK GROUP EFFECTIVENESS IN FOUR OPERATIONAL CATEGORIES
24
lingering uncertainty, sound fiscal management will likely be a high priority item
for Bank Group client countries.
IEG’s review of the Bank Group’s response to the 2008–09 crisis (IEG 2012e) found
that analytical underpinnings of fiscal management-related DPOs were generally
sound. However, it also notes that overall, measures to restore sound fiscal
positions in fiscally distressed countries in response to the crisis—such as measures
to reduce or reprioritize spending on a sustainable basis—were often found to be
insufficient. The Bank’s knowledge base in public finance enabled a program to be
built in many countries. Where pre-crisis engagement had waned, including
through a fall in lending volumes, knowledge gaps were notable. In these countries
specifically, the Bank was unprepared to help map out actionable, forward-looking
programs in public finance to address the crisis.
As part of the crisis response, the Bank sought to help vulnerable countries meet
their gross financing needs while adjusting revenue and expenditure policies to
address the fiscal conditions created by the crisis. Fiscal objectives that featured
prominently in the fiscal management-related DPOs provided after the economic
crisis included strengthening macroeconomic management and fiscal sustainability,
raising the efficiency and effectiveness of public expenditure, and improving public
financial management. Although many of the fiscal management-related DPOs
embodied measures to improve the cost-effectiveness of public expenditures,
politically sensitive measures were much less frequent. Examples include the
reduction of subsidies in fiscally stressed countries. Actions requiring that specific
fiscal targets be met were also infrequent, including in countries experiencing high
fiscal stress.
FINANCIAL SECTOR
Financial sector support was a significant component of the Bank’s response to the
global crisis, but 70 percent of commitments went to the countries with relatively
moderate stress levels (IEG 2012e). The Bank’s policy loans in support of financial
reform in the most deeply affected countries contained relevant conditionality
focused on crisis-related themes and contributed to stabilization. The Bank’s role in
these cases must be viewed in light of its partnership in a consortium in which its
financial contribution was relatively small (5–10 percent at most) and the usefulness
of the signal that its presence sends to the markets.
Sustainability of the interventions has been mixed—some reforms were successful,
but deeper structural issues have persisted. The actions supported in less-affected
countries were often general, incremental, and medium-term in orientation rather

APPENDIX D EVALUATION FINDINGS RELATED TO BANK GROUP EFFECTIVENESS IN FOUR OPERATIONAL CATEGORIES
25
than crisis related; occasionally, significant financial sector issues were neglected.
The Financial Sector Assessment Programs conducted before the crisis helped the
Bank assess the level of country stress and design follow-up operations. The Bank’s
overall engagement in the financial sector with the countries that received loans was
adequate, though there had been some decline in Bank-wide volumes of financial
analytic and advisory activity in the preceding years.
As for IFC, in response to the 2008–09 economic crisis, it first conducted an extensive
portfolio review to identify clients that were most at risk from the shocks of the
financial crisis. Measures such as deal restructuring or follow-on investments were
taken to help stabilize client businesses. The Global Trade Finance Program and
Global Trade Liquidity Program initiatives leveraged and built on IFC’s strengths—
global and local knowledge of financial markets and its AAA credit rating—to help
alleviate potential trade finance shortages.
IFC financial sector projects pursue the goal of creating opportunities for people to
escape poverty and improve their lives in four ways: promoting open and
competitive financial markets in developing countries; filling gaps in access to
finance, especially among the underserved; addressing capacity gaps in financial
institutions and generating productive jobs in these countries; and encouraging
productive investments in developing financial markets. IFC’s financial sector
investments have grown rapidly over the past years, driven by an increase in short-
term trade finance. Development outcome ratings for IFC financial markets
operations have declined from 75 percent to 64 percent (results refer to three-year
rolling averages for 2006–08 versus 2009–11; change not statistically significant), and
are now performing below the average for other IFC industry clusters. IFC’s Access
to Finance advisory projects performed above other advisory business lines
Projects in the financial sector demonstrate financial and nonfinancial additionality.
Among the frequently observed examples are the provision of local currency
financing, long-term financing, and expertise in financial structuring. Partner
selection, financial structuring, and the addition of IFC Advisory Services are among
the drivers of project success. Projects with excellent private sector development
impact tended to demonstrate successful risk taking in the face of well-understood
uncertainties.
Results of IFC financial markets projects are sensitive to the quality of sponsors and
changes in countries’ business climate. Based on IEG’s analysis, good IFC work
quality can mitigate shortcomings in the business environment. In that regard,
overall work quality of evaluated financial markets projects has declined from 77
percent satisfactory or higher in 2006–08 to 68 percent in 2009–11. Among the

APPENDIX D EVALUATION FINDINGS RELATED TO BANK GROUP EFFECTIVENESS IN FOUR OPERATIONAL CATEGORIES
26
aspects comprising work quality, appraisal quality was lowest (66 percent
satisfactory and higher), but the difference in the work quality between financial
markets and all projects was largest for the quality of supervision (74 percent for
financial markets projects and 81 percent for IFC projects overall).
Financial sector project outcome ratings in Europe and Central Asia declined
considerably, from 82 percent in 2006–08 to 51 percent in 2009–11 (21 of 41 projects),
in large part because of the effects of the crisis and structural issues in financial
institutions that the crisis amplified. A review of projects in Europe and Central
Asia, the region with the largest number of financial markets projects evaluated as
well as the steepest decline in performance, showed that all but one of the 20
financial markets projects with low outcome ratings were affected by the crisis. This
was also reflected in less than satisfactory business success ratings in all projects but
one. Low-performing projects were associated with rapid growth that was not
commensurate with capacity (six projects), an increase in related party lending
(three projects), excessive portfolio concentration (four projects), or weak corporate
governance (seven projects).
Based on a purposive sample of financial markets evaluations completed in 2008–10,
IEG extracted a number of issues and lessons to generate insights for IFC’s financial
sector interventions. Evaluative evidence pointed to the importance of a good
understanding of project risk for achieving successful development outcomes,
especially where risk taking and mitigation occurred with well-understood
uncertainties. IFC’s value added to its clients is enhanced when its participation in
projects goes beyond financing to include broader types of support to help financial
intermediaries grow and make financial sectors more competitive. In this respect,
Advisory Services are a key instrument for addressing nonfinancial additionality
and synergies between knowledge products and investments. Moreover,
evaluations point to the need for clarity about key assumptions on the links to
achieve results and the conditions and context that are critical for project success.5
MIGA’s outstanding guarantees portfolio is concentrated in the financial sector (42
percent of outstanding guarantee exposure). 6 In addition, its financial sector
portfolio is also concentrated regionally in Europe and Central Asia (94 percent of
new guarantee issuance during FY09–11) and among a few client banks. The sector
concentration reflected in part MIGA’s strong response to the financial crisis in 2008-
09; during that period capital flows for investments in other sectors were also
constrained—notably in infrastructure. MIGA’s Financial Sector Initiative, part of a
wider Joint International Financial Institution Action Plan, played a modest but
important role in helping improve banking sector conditions in countries in Europe

APPENDIX D EVALUATION FINDINGS RELATED TO BANK GROUP EFFECTIVENESS IN FOUR OPERATIONAL CATEGORIES
27
and Central Asia in the wake of the global crisis. The broader International Financial
Institution Action Plan (and therefore MIGA, as one player) successfully contributed
to stabilizing and restoring confidence in the financial markets, although it is
difficult to attribute results solely to MIGA’s contribution.
MIGA-supported banks performed well in crisis conditions, whether during 2008–09
or earlier crisis episodes in Brazil, the Russian Federation, and Turkey. Projects were
strategically relevant to their host countries, especially in the Europe and Central
Asia Region, which underwent financial liberalization in the last decade but where
state-owned banks remain dominant. Successful projects in the region helped
introduce competition and new banking products and services, which local banks
subsequently adapted, and provided financing and banking services to clients not
served by the host countries’ dominant state-owned banks. Although these projects
are profitable and efficient, the financial crisis has highlighted the need for foreign
subsidiaries to mobilize local currency funding to avoid devaluation risks.
Evaluations have identified several factors contributing to the strong development
outcomes of relevant projects in that such projects had established and experienced
sponsors, quickly introduced new products ahead of local competitors, and
specialized in specific business segments (corporate or retail markets) that large local
and state-owned banks were unable to serve.
AGRICULTURE
The relevance of the agricultural sector has grown considerably in light of volatility
in food prices in recent years. There are demand factors behind the food price rise:
growing population, rapid urbanization, and increasing incomes around the world
are adding to demand. Proximate causes also include the lack of buffer stocks and
market speculation. However, a fundamental factor has been stagnation in the
growth in agricultural productivity in recent years. Intensification of production and
improvement in efficiency of inputs are also relevant in the context of efforts to
mitigate global warming, as agriculture contributes about 15 percent of annual
greenhouse gas emissions (forestry contributes an additional 19 percent), compared
with 13 percent from transportation (World Bank 2007c).
The Bank Group uses a wide range of channels to enhance agricultural productivity,
and, as a result, there is considerable opportunity for synergies in this sector through
leveraging the expertise in the World Bank and IFC. IEG’s evaluation on agriculture
and agribusiness (IEG 2011d) notes that the requirements for successful agriculture
projects are multifaceted, and all relevant facets must function effectively together
for success and growth. Farming is essentially a private sector activity in which

APPENDIX D EVALUATION FINDINGS RELATED TO BANK GROUP EFFECTIVENESS IN FOUR OPERATIONAL CATEGORIES
28
farmers apply their labor and capital to land to produce crops. The role of the
private sector in linking farmers with the market (including international markets) is
critical.
Informal links exist between Bank and IFC staff in the preparation of specific
projects, programs, and strategies, such as the IFC Agribusiness Strategic Action
Plan FY12–14 and the forthcoming World Bank Group Agriculture Action Plan:
2013–15, among others. To take better advantage of potential complementarities,
efforts to establish a Bank Group-wide mechanism to enhance communication and
collaboration in a systematic rather than ad hoc manner need to continue.
MANUFACTURING, AGRIBUSINESS, AND SERVICES
The performance of IFC’s MAS investments has improved considerably over the
past decade. For the 2009–11 cohort of evaluated projects, 74 percent of projects
achieved mostly successful or better development outcome ratings, an increase over
the 68 percent of those evaluated during 2006–08 (not statistically significant).
Ratings for this cluster have long been among the lowest for IFC (with a success rate
of 49 percent in 2003–05).
The increase in performance appears to have been based on a number of factors,
including IFC’s changing strategy with respect to traditionally challenging sectors
such as agribusiness and tourism. This included focusing on different types of
clients, for example, on secondary processing companies in agribusiness (rather than
primary agriculture) or on integrated tourism companies (rather than individual
hotels). The performance levels achieved may also reflect improvements in IFC’s
work quality, which is now above that of other industry clusters.
A review of a purposive sample of evaluated IFC MAS projects (2009–11) revealed
some common lessons and factors of success.7 Given the sample size and
heterogeneity of projects, these should be regarded as examples rather than generic
lessons with wider application (Box D.1). The review found that a large share of
projects had encountered crisis episodes. The companies that weathered them best
were found to share one or more common characteristics. They tended to be low-
cost producers with export potential and diversified concerns, both in terms of
products or markets or were supported by strong sponsors that could provide
financial backup. Other successful strategies include retrenching (postponing or
downsizing the project) or, to a lesser extent, trying to renegotiate the IFC loan
covenants that were deemed too restrictive. The sample featured a high ratio of
prepayments or cancellations, affecting 50 percent of loans.

APPENDIX D EVALUATION FINDINGS RELATED TO BANK GROUP EFFECTIVENESS IN FOUR OPERATIONAL CATEGORIES
29
Box D.1. Summary of Lessons from a Sample of IFC MAS Projects
Deal structuring: Deals should be structured to ensure that the returns to the various stakeholders are commensurate with their contributions and risks. In this context, IFC should be adequately compensated for its appraisal and other up-front costs when a loan is prepaid or when some components of a deal structured and priced as a ―package‖ are dropped. In a project in Africa, IFC financing consisted of a senior (A) loan at the London Interbank Offered Rate (LIBOR) plus a small spread and a subordinated (C) loan with an income-participation feature to boost the IFC total return. The subordinated loan was cancelled at the sponsors’ request, leaving the IFC only with the less-rewarding senior loan.
Covenants: Loan covenants protect the lender by ensuring that the borrowing company maintains conservative financial policies and a sound balance sheet. In some cases, sponsors perceived IFC covenants as too restrictive, leading them to prepay the IFC loan. Reassessing and, if necessary, readjusting covenants is typically not too onerous a task for IFC should the sponsors request it.
Securities have proven difficult to perfect in highly regulated economies, when a sharing agreement with previous lenders was required, or when too many different assets were involved. In addition, the timing of security releases has been contentious. As with the covenants, IFC may reassess the securities and release them if appropriate at the sponsor’s request.
Environment and Social Effects: Few clients consider the E&S investments a priority. E&S effects were rated satisfactory in 56 percent of MAS projects evaluated in 2009–11. Successful and timely implementation of E&S requirements depended on the sponsors’ commitment to improving E&S performance, which in turn depends on IFC establishing mutual trust and goodwill with the sponsors. In addition, managing E&S issues involves close interdepartmental cooperation within IFC. Though time consuming, effort should be made to convince the sponsors of the critical importance of E&S requirements and of the need for timely and accurate reporting on such matters.
Committed sponsors: Several projects received sponsor support as cash infusions for working capital or to compensate for losses. These included subordinated loans from the sponsors, periodic infusions of capital to support growth, deep-pocketed sponsors that financed the project on their own and kept the company afloat, technical know-how, cash for working capital and debt service, sponsors assuming losses resulting from low-price strategy, and providing liquidity and subloans. In addition, the sponsors’ interests need to be aligned with IFC’s, and this should never be taken for granted. In one case a sponsor’s low-price strategy conflicted with IFC’s and other shareholders’ financial interests. In multiple instances, the sponsors did not implement the project that had been appraised. It is up to the appraisal and supervision teams to maintain this alignment. The key lesson is for IFC to track project implementation such that it is aware of changes in project scope and the reasons behind such changes.
Source: IEG.

APPENDIX D EVALUATION FINDINGS RELATED TO BANK GROUP EFFECTIVENESS IN FOUR OPERATIONAL CATEGORIES
30
Seven of nine evaluated MIGA projects in the agribusiness, manufacturing, and
services sector were rated satisfactory or better in development outcomes. Projects
with good performance include a large-scale integrated paper mill; a thick-gauged
galvanized roofing factory; custom inspection services companies; and two projects
involving sales, maintenance, and repair of heavy equipment used by companies of
national economic importance.
Successful projects tended to produce goods or services targeted to the needs of the
domestic market. These projects fill the gap that local companies are unable to, as in
the case of two projects involving customs inspection services. The projects
introduced new technology and systems that are unavailable in the host country and
upgraded the skills and capacity of national customs and project staff. Two
manufacturing projects successfully competed with local manufacturers by meeting
homeowner demand for quality home construction products. The unsuccessful
projects involved a public-private partnership housing project that was not
implemented when the joint venture collapsed and the privatization of a large-scale
agribusiness project that was renationalized after the project failed.
Building Infrastructure
Infrastructure operations cover a large proportion of World Bank investment
projects; accordingly, the performance of infrastructure operations has significant
bearing on the overall effectiveness of the World Bank. Infrastructure lending
represents about 40 percent of the total World Bank commitments approved during
the period FY09–11.
There are elements of commonality in the types of objectives pursued by
infrastructure projects including, for example, improving the quality and
accessibility of infrastructure services. There is a growing level of support for
activities that address climate change as well as operations that seek to prevent
environmental degradation and to mitigate damages associated with natural
disasters. More generally, however, a wide and diverse range of activity is
supported across the infrastructure sectors that include transport, water, energy,
urban development, and information and communication technologies.
The World Bank has significantly expanded its operations in infrastructure since
2003. The pace of expansion accelerated during the crisis response. Many World
Bank client countries maintained their infrastructure spending for its critical role in
retaining short-term employment during the crisis. Lending to infrastructure
projects almost doubled, from $30 billion in FY06–08 to $59 billion in FY09–11
(Figure D.1).

APPENDIX D EVALUATION FINDINGS RELATED TO BANK GROUP EFFECTIVENESS IN FOUR OPERATIONAL CATEGORIES
31
The average commitment amount per
project in FY09–11 was $147 million, an
increase of more than 60 percent as
compared with $89 million in FY06–08.
Transport and energy and mining are the
largest sector boards, each representing
37 percent of total infrastructure lending.
Water and urban development sector
boards represent about 12 percent and 13
percent respectively, followed by the
global information and communications
sector board, representing 1 percent of
the total infrastructure lending.
In contrast, IFC investments in infrastructure have declined since the financial crisis.
IFC’s infrastructure investments amounted to $5.6 billion in FY09–11, a decline of 12
percent from $6.3 billion of investments made in FY06–08. In FY11, infrastructure
investments were below pre-crisis levels. South Asia infrastructure investments
declined to only 2 percent of the total in FY09–11, from 20 percent in FY06–08.
Infrastructure investments in IDA countries have declined since their peak of $0.98
billion (FY08). This reflected the challenges of projects during the financial crisis,
and in the case of Africa, the limited amount of transactions, as development finance
institutions provided much of the financing to a public sector–dominated
infrastructure sector.8 With a share of 31 percent of infrastructure investments,
electric power remained the largest area during FY09–11, followed by transportation
(27 percent), telecom/information technology (IT) (20 percent), and utilities (9
percent).
After a decline in MIGA insurance for infrastructure projects during the crisis,
linked to a decrease in global capital flows, the guarantee issuance in this sector
increased, buoyed in part by a new type of coverage. Infrastructure investments
accounted for $1.2 billion in guarantees during FY09–11, compared with $1.7 billion
during the previous three years, as the availability of project finance for such
projects was negatively affected by the crisis. Post crisis, and following the
expansion of MIGA’s mandate, MIGA has seen a strong rebound in guarantees in
this sector (54 percent of guarantee coverage issued in FY11).
CHALLENGES AND LESSONS: INFRASTRUCTURE OPERATIONS
The challenges in infrastructure are diverse and complex. Considerable variations
exist in the availability, coverage, quality, and efficiency of infrastructure services
Figure D.1. Trends in Infrastructure Lending
Source: World Bank data.
5 7 11
17 23
26 30 28 26
22 15
22
30
59
0
10
20
30
40
50
60
70
19
70
-19
72
19
73
-19
75
19
76
-19
78
19
79
-19
81
19
82
-19
84
19
85
-19
87
19
88
-19
90
19
91
-19
93
19
94
-19
96
19
97
-19
99
20
00
-20
02
20
03
-20
05
20
06
-20
08
20
09
-20
11
Co
mm
itm
en
ts ($
bill
ion
)

APPENDIX D EVALUATION FINDINGS RELATED TO BANK GROUP EFFECTIVENESS IN FOUR OPERATIONAL CATEGORIES
32
among developing countries; associated difficulties are more explicitly manifest in
certain sectors. Overall, there is significant consistency in the lessons associated with
the evaluation of infrastructure projects supported by the Bank. Most lessons
emphasize the need to take the time to get things right at entry and the early stage of
project implementation by identifying all potential stakeholders and consulting
widely; making a realistic assessment of what is possible taking into account
commitment, context, and capacity; and making project design as simple as possible.
It is also critical to develop simple, implementable M&E systems associated with
clearly defined and relevant indicators for which there are readily available
supporting data sources.
Particularly in relation to large-scale, multicomponent projects, the evaluations
emphasize the need to ensure strong commitment from government. They also
warn against underestimation of the risk of delays from social, environmental and
political factors, particularly in relation to setting realistic project durations. Project
evaluations also stress the need to fully assess the impact that vested interests may
have on project delivery during implementation. Project implementation lessons
highlight the need to ensure early availability of qualified staff and for as much
continuity in personnel as possible. The need for fully thought-through sequencing
of actions to allow for smooth implementation geared toward effective delivery is
also highlighted, as is the need to formally absorb lessons learned as the project
progresses.
One area that usefully illustrates the evolving opportunities and challenges in
infrastructure is information and communication technologies (ICT). The IEG
evaluation on ICT (IEG 2011b) found that countries with Bank Group support for
policy reform or to catalyze private investment for mobile telephony in difficult
environments and in the poorest countries have increased competition in and access
to ICT faster than countries without such support.
However, the Bank Group’s contributions have been limited in other priority areas,
including ICT components in projects in other sectors (such as health, education,
public sector management), an area where ICT is expected to deliver the largest
development impacts. Moreover, efforts to increase access to ICT infrastructure to
the underserved beyond what was commercially viable (for example, through
universal service funds) have been largely unsuccessful. Support to such programs
was largely superseded by the rollout of phone services by the private sector, in
some cases supported by World Bank sector reforms. Access for the poor has been
more effectively supported through general, nontargeted interventions and reforms
focused on the enabling environment and direct support to private investments (IEG

APPENDIX D EVALUATION FINDINGS RELATED TO BANK GROUP EFFECTIVENESS IN FOUR OPERATIONAL CATEGORIES
33
2011b). The Bank Group has launched a new ICT sector strategy, which provides the
strategic directions in this area.
Although the majority of Bank financed projects in infrastructure sectors continue to
perform well relative to other sectors, the share of investment projects rated
moderately satisfactory or better by IEG has declined in recent years. Because of the
significance of infrastructure within the overall portfolio, this fall has consequently
brought down the overall share of Bank financed investment projects rated
moderately satisfactory or better. More detail and discussion on ratings can be
found in Appendix E.
With the growing significance of private sector players in this area, IFC projects
show that alignment of private and public interests is critical for the success of
infrastructure. IFC infrastructure projects were more successful when they aligned
public and private interests well, for instance, through the existence of a government
program to reform the sector. The existence of a World Bank program to support
sector reforms helped mitigate the project’s regulatory and government performance
risk. Where such World Bank programs did not exist, IFC’s assessment of regulatory
risk was critical to project success. In contrast, IFC’s record of addressing regulatory
weaknesses was limited. IFC’s impact was highest when its projects could
demonstrate the viability of private sector investments in infrastructure, supporting
first movers in newly liberalized or restructured infrastructure sectors.
The regulatory environment is important for the success of IFC infrastructure
projects. In telecom projects, a level playing field and pro-competition regulatory
environment are important for projects to achieve their development objectives of
improved coverage and reduced prices. For regulated industries such as electricity
distribution, strong government ownership of a sector reform is necessary, because
IFC’s leverage is often limited. Small local sponsors require strong lender support
and proper finance structuring to enter into capital-intensive infrastructure
investments. IFC can also play a significant role as an honest broker in the event of
disputes between operators and government entities, as in the case of a telecom
operator facing issues with interconnection fees. Similarly, several international
finance institutions can collaborate to share risks and provide development impacts
in untested markets.
Performance of IFC infrastructure projects has remained on par with IFC’s overall
performance. Sixty-eight percent of projects had mostly successful or higher ratings
(2009–11)—similar to the percentage achieved three years prior (72 percent).
Infrastructure cluster projects in IDA-eligible countries performed well below those
in International Bank for Reconstruction and Development (IBRD) countries (38

APPENDIX D EVALUATION FINDINGS RELATED TO BANK GROUP EFFECTIVENESS IN FOUR OPERATIONAL CATEGORIES
34
percent [5 of 13 projects] versus 77 percent [27 of 35 projects]). IFC Advisory Services
provided by the Public-Private Partnerships business line performed lowest among
IFC Advisory Services (46 percent for FY08–10). Low-performing projects reflected
low government commitment to reform and shortcomings in regulatory
frameworks.
The ICT sector has been challenging for IFC for two main reasons: (i) most telecom
sector projects in the portfolio performed strongly in achieving development results,
but project level results for IT projects were modest; and (ii) increasing competition
and declining revenues per user in the mobile telephony sector that affected the
profitability of some IFC-supported operators. IEG’s evaluation found a 25 percent
success rate for IT projects, reflecting the venture capital, high-risk nature of these
projects, but also shortcomings in IFC’s work quality and lack of additionality.
When looked at from a portfolio perspective, IFC’s returns on its IT sector portfolio
were consistent with those of industry benchmarks (IEG 2011b).
A review of a sample of evaluated IFC-supported infrastructure projects suggests
that such investments had higher ratings for economic sustainability than projects in
other sectors.9 More than half of them had economic rates of return above 50
percent. Telecom projects were highly successful in enhancing access to phone
services, but the record of electricity projects was mixed with regard to access—all
but one of the five projects were in countries where access was already high.
With regard to enhancing efficiency, telecom projects were generally associated with
increased competition and—driven by economies of scale—contributed to reduced
prices and improved penetration rates. They also introduced innovative products in
their markets. Projects in the transportation sector also contributed to reduced
logistics costs, and some power projects improved reliability of service and
transmission losses. Some IFC-supported infrastructure projects were designed with
specific pro-poor components (for example, Village Phone Program and a water
project in the East Asia and Pacific Region).
MIGA-supported projects in infrastructure faced greater challenges in achieving
development outcomes than projects in other sectors. Five of nine evaluated projects
had low development outcomes, even though all projects were strategically relevant
to the host countries. Most projects had concession agreements with the national or
subnational government and many were public-private partnerships and therefore
faced regulatory and payment risks. Contrary to IFC’s experience with
infrastructure projects, the host country’s regulatory environment had mixed
influence on the outcomes of MIGA infrastructure projects: three of the four projects

APPENDIX D EVALUATION FINDINGS RELATED TO BANK GROUP EFFECTIVENESS IN FOUR OPERATIONAL CATEGORIES
35
had satisfactory and better development outcomes despite adverse regulatory
environments.
Common patterns of successful MIGA infrastructure projects include the level of
clarity, ―fair‖ risk-reward allocation, and mitigants being embedded in the
concession agreement or project design to preclude regulatory weaknesses. A toll
road concession succeeded without a government guarantee because of defenses in
the financial covenants and the stringent monitoring system put in place by the
lenders’ consortium to remedy an adverse regulatory environment and a financially
strapped local partner. Forming a joint venture with a local government entity
enabled a sponsor’s first water supply and wastewater treatment project in the host
country to surmount regulatory uncertainty and expand its business area. In a
telecom project in a conflict-affected country, the telecom license prepared by a
bilateral donor agency and an international telecom body ensured that the license
terms and conditions were transparent and fair, with clear indicators that could be
monitored while the country’s telecom regulations were still being drafted.
Another common pattern among successful MIGA infrastructure projects is the
quality of the sponsors—they are not only experienced but they also have strong
financial capacity. Finally, regardless of the regulatory environment, successful
infrastructure projects were able to charge tariffs to end users without government
subsidies.
Financial losses and sustainability problems characterized less successful MIGA-
supported infrastructure projects. In one example, a solid waste management project
failed because of the combined effects of availability of a more efficient or cheaper
alternative, ability of consumers in the concession area to pay fees, lack of clarity on
payment parameters in the concession agreement, and inability of the subnational
government counterpart to honor its commitment. In another case, a less successful
electricity generation project was highly leveraged, operating in a country that is
increasingly hostile to foreign investments and undergoing rapid changes in the
operating environment, using old albeit refurbished equipment that is costly to
maintain, and with heavy government subsidy to end users.
Enhancing Human Development
The Bank Group’s efforts to enhance human development are multifaceted and
increasingly complex. IEG’s Results and Performance of the World Bank Group for
2011 (IEG 2011h) highlighted some of the challenges. It suggested that whereas the
World Bank seeks to continue to increase access to basic services, it also aims to
address broad systemic improvements, such as building demand for improved and

APPENDIX D EVALUATION FINDINGS RELATED TO BANK GROUP EFFECTIVENESS IN FOUR OPERATIONAL CATEGORIES
36
more advanced services in education, health, and social protection. The Bank Group
also faces ongoing challenges, particularly in the area of human development, in
terms of its interaction with global programs and other significant donors—IEG’s
Global Program Review of the Global Fund (IEG 2012b) references the practical
challenges for the World Bank in ensuring effective collaboration. Harmonization
and alignment of donor operations has emerged as an important agenda,
particularly in human development and in that regard, the Bank Group is expected
to play a key role in advancing the principles set out in the Paris Declaration (IEG
2011n).
Global-level indicators point to real progress in some areas under human
development. For example, there has been an overall improvement in the primary
completion rate among males and females between 2002 and 2009 (from 85.8 percent
to 89.5 percent for males and from 80.9 percent to 87.3 percent for females).
However, the overall rate of improvement in health outcomes remains sluggish, and
there is significant variability in performance across the regions.10 The World Bank’s
2011 Global Monitoring Report notes that poor countries tend to lag in progress
toward attaining the Millennium Development Goals (MDGs) and that, despite
improvement, most regions are lagging in relation to certain targeted health
outcomes, such as child and maternal mortality and access to sanitation, so that is
unlikely that these MDGs will be reached by 2015. There has been general
improvement in health outcomes, but it has not occurred at a rate commensurate
with projections and expectations.
The achievement of the MDGs and the Bank Group’s higher-level goals continue to
be affected by a variety of powerful, dynamic factors. For example, increased
volatility in the markets has resulted in higher food prices that not only affect
income poverty but can have a knock-on effect for health outcomes, education
results, and gender equality. The 2012 Global Monitoring Report concludes that high
food prices complicate policy making and make progress toward achieving the
MDGs more difficult (World Bank 2012b).
BANK GROUP’S ENGAGEMENT IN HUMAN DEVELOPMENT
The Bank Group has supported projects that have contributed, in part, to the
substantial gains that have been made in improving access and equality of access to
education over the last decade in particular. The number of out-of-school children of
primary school age fell from 106 million in 1999 to 68 million in 2008. Between 1991
and 2007, the ratio of girls to boys in primary and secondary education in the
developing world improved from 84 to 96 percent. Successes achieved to date have
turned attention to other challenges that are now being tackled by projects

APPENDIX D EVALUATION FINDINGS RELATED TO BANK GROUP EFFECTIVENESS IN FOUR OPERATIONAL CATEGORIES
37
supported by the Bank Group. These include improving the quality of education
and accelerating learning; developing the link between education and the labor
market; and integrating information and communication technologies into
education.
In health, notwithstanding increased levels of support, there is need, as recognized
in the World Bank’s 2007 Strategy for health, nutrition, and population, to continue
to improve health results, particularly for the poorest and most vulnerable. In that
regard, significant obstacles remain—from poor infrastructure and weak logistics to
inadequate policies and lack of sustainable financing or health insurance coverage—
that prevent life-saving resources and other inputs from reaching those who need
them most.
Social safety nets programs are a dynamic and growing part of the World Bank
portfolio. An IEG evaluation of social safety nets (IEG 2011j) found that Bank
support evolved over the decade as it moved from a project-focused approach that
emphasized delivery of social assistance benefits toward an approach that focuses
on helping countries build systems and institutions to respond better to poverty,
risk, and vulnerability. The Bank’s support has relied heavily on both lending and
knowledge sharing to engage clients.
The evaluation concludes that, whereas the Bank made significant progress in
developing safety nets and addressing crises, key areas of the Bank’s support need
to improve, including: ongoing engagement during stable times to help countries
develop the capacity to respond to future shocks; continued emphasis on building
social safety net systems and institutional capacity; stronger engagement with low-
income countries; improved short- and long-term results frameworks to underpin
social safety net efforts; and continued efforts to ensure cross-network coordination.
CHALLENGES AND LESSONS: HUMAN DEVELOPMENT
Recent evaluations of Bank support in human development tend to emphasize
several challenges. They point to a need to further increase focus on human
development challenges in low-income countries and the most vulnerable groups;
build projects that have conceptually stronger results frameworks backed up by
sound analysis and reliable baseline data; and improve overall design and ongoing
project management. The latter two issues are frequently echoed in the CASCR-
Reviews and PPARs that were reviewed and analyzed for this report. For example,
IEG found that (i) initial risk analysis and contingency planning were often less than
satisfactory, taking into account the readiness of existing systems and personnel and

APPENDIX D EVALUATION FINDINGS RELATED TO BANK GROUP EFFECTIVENESS IN FOUR OPERATIONAL CATEGORIES
38
(ii) broadly speaking, project objectives were overly ambitious within the planned
timeframes and project implementation period.
IEG’s portfolio note on education (IEG 2011o) and its 2009 evaluation of World Bank
support for health, nutrition and population (IEG 2009c, pp. 27–31) touch upon the
challenges in engaging in complex, higher-end activities and pursuing the benefits
for the most vulnerable groups. For example, in education, if the Bank increases its
focus on higher levels of education, there will be a diminishing level of direct
interaction with the poor, as the poor tend to benefit proportionately less from
senior cycle, secondary education and even less from tertiary education. Where
investment in higher education is in question, linking that investment into benefits
for the very poor becomes challenging.
Findings from CASCR-Reviews, ICRs, and PPARs point to several challenges in
attaining intended outcomes where projects seek to achieve system reform. A range
of issues and challenges may contribute to this: the complexity of the challenges in
question in terms of stakeholder buy-in and capacity (such as national and local
government and representative organizations such as trades unions); management
of cultural nuance; and the fact that achievement of desired reform may over-reach
project duration (an issue that applies more generally to Bank Group projects as
referenced elsewhere in this report).
The shift in emphasis towards systems change will place even more pressure on
results frameworks and M&E systems, as the indicators of success are likely to be
more elusive. To manage the variables encountered, to better identify and control
for risk, and to maximize project potential, evaluations suggest a number of actions
that can be taken. In particular, they emphasize the need for high-quality analytical
and advisory activities in which national or local authorities and stakeholders have
an interest and about which they are consistently consulted and updated and more
selectivity in setting objectives, noting that what appears to be a defining factor is
not the magnitude of the risk involved but how the intersection between risk and
realism is managed and how it is reflected in project design and implementation.
In certain instances, poor ratings are associated, at least in part, with the absence of
indicators of change and/or poor M&E systems,11 which suggests that poor M&E
systems should not be considered mere technical faults in project/program design
and implementation; instead, the absence of a robust M&E system can sometimes
represent a strategically important gap that may result in a significant
understatement of the results of Bank support.

APPENDIX D EVALUATION FINDINGS RELATED TO BANK GROUP EFFECTIVENESS IN FOUR OPERATIONAL CATEGORIES
39
Where project performance is rated through the PPAR process to fall below expected
standards, the rating typically has to do with failure to identify and effectively
manage risk. Risk management is closely related to the issue of realism and
selectivity, particularly with regard to gauging the strength of political will
necessary to implement reforms.
The need for risk management is also echoed in IFC’s experience in the health and
education sectors. IFC has supported investments in private health care providers
that own and operate hospitals, clinics, and laboratories. Evaluated health projects
had largely positive outcomes. IFC has successfully helped client companies expand
and take advantage of the opportunity to become ―first movers‖ in their markets,
playing a unique role through its ability to provide long-term financing. In some
cases, demonstration of success has helped encourage other private providers to
enter the market or improve their facilities and quality of service. The experience has
shown that a sound project screening process to identify sponsors with sound
management practice and favorable regulatory environments for the investments
are key to success.
In education, IFC has invested in diverse private educational institutions ranging
from K–12 schools, to universities, to a financial institution to serve private schools.
The experience shows high complexity in the sector because of the strong influence
of government policy and regulations, increasing competition, and high sensitivity
of demand for private education to developments in the broader economy—
associated with mixed development outcomes of IFC investments. IFC’s experience
also shows that the improved physical infrastructure for schools or new financial
institutions to serve them cannot substitute for sound management practices within
the educational institutions themselves.
The CASCR-Reviews suggest that the long-standing relationships with countries,
and a significant amount of mutual respect and understanding between the
authorities and the Bank, matter. Reference is also made in evaluations to the need
for Bank staff to better understand the cultural and political context of their work,
and to calibrate project aspiration and design accordingly. This emphasizes the
degree to which system, technical and other solutions have to be understood and
implemented paying due regard to context and culture. The social safety nets
evaluation (IEG 2011j) references the Bank’s successful support to Brazil’s Bolsa
Familia, which involved ―timely, technically advanced, and politically savvy
interventions at the critical early stages of the reform‖ (p. 69). The evaluation finds
that strategic rather than project-by-project engagement strengthens the
effectiveness of the Bank’s efforts overall.

APPENDIX D EVALUATION FINDINGS RELATED TO BANK GROUP EFFECTIVENESS IN FOUR OPERATIONAL CATEGORIES
40
Ensuring Environmentally and Socially Sustainable Development (Environment, Social Development, and Gender)
Addressing environmental issues in a sustainable manner within an overarching
anti-poverty agenda is demanding. IEG’s environment evaluation (IEG 2008d) notes
that the World Bank’s approach to environmental sustainability has evolved from an
initially preventive ―do no harm‖ or safeguards approach to a proactive ―do good‖
approach in recognition of the multifaceted approach to environmental
sustainability that the Bank is engaged in. Tackling environmental degradation often
involves some form of negative impact on the poor through, for example, physical
displacement or disruption of traditional economic activity.
Promoting social development by empowering poor and marginalized people and
addressing gender disparities and inequalities are at the core of the development
challenge. The World Bank’s approach to social development aims to ―put people
first‖ through a bottom-up approach that seeks to empower the poor and least
privileged and to bring their voices into the development equation.
IFC and MIGA apply their E&S standards to all investment and guarantee projects
they support. IFC also plays an important role in setting E&S standards. IFC’s
performance standards have been emulated by other development finance
institutions, including the European Bank for Reconstruction and Development, and
are also reflected in the Equator Principles applied by 72 financial institutions. The
E&S performance of IFC-supported projects has remained stable (67 percent of
projects rated in 2009–11 with satisfactory or higher ratings). Sustainable Business
Advisory projects performed on a par with IFC Advisory Services (57 percent for
FY08-10). Successful advisory projects were associated with good pre-
implementation work (including an assessment of the sector, market, supply chain,
identification of key stakeholders and needs) and customized replication.
Evaluated MIGA projects performed well with respect to E&S effects, although the
findings are limited because of low evaluability, especially of financial sector
projects. Only 11 of the 26 evaluated projects were rated for E&S effects;12 of these,
73 percent were rated satisfactory or better. A common feature among projects with
high E&S effects ratings is sponsor and project management commitment to meet
MIGA’s standards and reporting requirements stipulated in the contract of
guarantee. Projects with less than satisfactory performance have had compliance
problems with MIGA’s environmental and/or social requirements. In nearly all of
the less than satisfactory projects, MIGA monitoring or follow up with the guarantee
holder on the submission of E&S reporting requirements in the contract of guarantee
was lacking.
APPENDIX D EVALUATION FINDINGS RELATED TO BANK GROUP EFFECTIVENESS IN FOUR OPERATIONAL CATEGORIES
41
Challenges and Lessons: Environment, Social Development, and Gender
The environment, social development, and gender evaluations highlight a number
of lessons. First, IEG’s evaluations on the environment, social development, and
gender emphasize the centrality of integrating relevant issues into the Bank Group’s
strategic directions and its country assistance programs. IEG recognizes that
individual projects may contribute to desired impact if they are set in the context of
appropriate policies and are complemented by other projects and interventions.
Second, there is a need to improve quality at entry, particularly given the increasing
complexity of the issues. IEG’s evaluations suggest this can be achieved through a
combination of quality supporting analysis, ongoing dialogue with government and
partners, and enhanced risk management. Failure to get things right from the outset
and failure to identify, anticipate, and manage risk almost inevitably leads to delays
to projects; possible underutilization of available resources; and rushed investment
and decision making. Ultimately it can contribute to failure to achieve outcomes
notwithstanding the delivery of outputs.
Finally, the evaluations suggest a need for improvement in results frameworks and
M&E systems with a view to better capture and articulate achievement. This is
increasingly important in a complex environment where it can be difficult to isolate
achievement beyond the production of outputs or the utilization of inputs because
of the high level of interdependencies.
The following sections provide findings pertaining specifically to environment,
social development and gender based on recent IEG reports.
Environment
IEG’s environment evaluation (IEG 2008d) recommended increasing the amount of
attention paid to environmental sustainability by ensuring that environmental issues
are fully included in any discussion of the Bank’s overall strategic direction as well
as regional and country assistance programs. To achieve this, a joint effort across the
Bank Group to reformulate and update the 2001 Environment Strategy was
recommended (a new strategy, Toward a Green, Clean, and Resilient World for All: A
World Bank Group Environment Strategy 2012–2022 was published in May 2012). The
environment evaluation also found that the results of Bank nonlending activities
have often been as significant as those of lending operations in terms of
environmental improvement. However, the relative effectiveness of such input (for
example, quality analytical work) depends on a range of factors, including the level

APPENDIX D EVALUATION FINDINGS RELATED TO BANK GROUP EFFECTIVENESS IN FOUR OPERATIONAL CATEGORIES
42
of resources available for country programs, the level of client demand, and the
capabilities of national and local institutions.
The cross-boundary nature of many of the issues that the Bank tackles adds to the
challenge. The environment evaluation emphasized the need to move to more cross-
sectoral and spatially oriented approaches to environmental support. A similar point
was made in the first phase of IEG’s climate change evaluation. That report
promoted a system approach by providing incentives to address climate change
issues on a cross-sectoral basis (IEG 2008c). In addition, the evaluation notes that,
given the World Bank’s country strategies typically take into account national
environmental priorities, it is sometimes the case that insufficient attention has been
given to longer-term sustainability concerns and, in particular, to transregional and
transnational environmental issues. In that regard, the evaluation suggests the
country-based planning model within the Bank Group may act as an impediment.
The interlinked relationship among environmental sustainability, climate change,
economic growth, and poverty reduction points to the importance of breaking down
the silos between Bank Group institutions and sectoral experts. Better coordination
among Bank Group institutions would go a long way toward improving overall
corporate effectiveness. Whereas cross-sectoral and spatial approaches are
increasingly used in analytic work, working across boundaries remains a challenge,
as indicated in the IEG’s evaluation of the Bank’s matrix system (IEG 2012c).
The PPAR, CASCR, and ICR evaluations reviewed for this report echo these
findings and emphasize, for environmental projects, that government ownership is
of particular importance because the durability of successes associated with many
environment projects is inherently dependent on sustained government support (for
example, regulatory and enforcement regimes) over the medium to longer term.13
The evaluation of safeguards and sustainability recognizes the wide range of
analytical and advisory services offered by the Bank Group that are designed to help
build client institutions and capacities. Where local capacities are weak, results are
weak. Results can also be weak where project success or progress is dependent on
decision making or action required by an authority external to the project itself. This
is true with respect to projects where on-the-ground development is/was under way
as well as for projects where there is an attempt to influence policy through new
research (Box D.2).

APPENDIX D EVALUATION FINDINGS RELATED TO BANK GROUP EFFECTIVENESS IN FOUR OPERATIONAL CATEGORIES
43
Box D.2. Examples of How Buy-In Affects Project Outcomes
Tanzania: The failure to secure the establishment of the Tanzanian Forest Service undermined progress achieved by forest conservation projects. Also the lack of government buy-in reduced the impact of the Bank’s analytical work on the charcoal sector, even though the quality of the work was considered high by the donor community and experts in the field (World Bank 2010a).
South Africa: The PPAR for the Cape Peninsula Biodiversity Conservation Project (IEG 2010d) notes that the government fully owned the project and supported its implementation through the passage of timely and effective conservation-related legislation, thereby enabling its success.a
Source: IEG PPARs. a. More generally, the Cape project provides a good example of contextual and project characteristics that appear to have contributed to success, as follows: evidence-based rationale; political buy-in and involvement; strong relationship between the Bank and relevant authorities; flexible design and robust monitoring and evaluation; strong, consistent and flexible supervision.
The environment evaluation recommends that the Bank Group improve its ability to
monitor and evaluate the results of its environment-related interventions. The need
for enhanced measurement and results frameworks was also echoed in the second
phase of IEG’s climate change evaluation (IEG 2010b). That evaluation notes the
Bank Group should measure projects’ economic and environmental impact during
execution and after closure and aggregate this information for analysis. It should
also link these measures to a results framework of the Strategic Framework on
Development and Climate Change. Work is under way with a view to improving
the monitoring, evaluation, and reporting of environment sector performance and
the results of lending operations. This includes the development of core biodiversity
indicators and the introduction of indicators of environmental sustainability at
project and country levels. The evaluations suggest a need to press on with these
and other improvements.
Gender
The Bank’s focus on gender has evolved since 1977, when it made consideration of
women’s issues an explicit item of attention as part of the social analysis conducted
for supported projects. Since then, the Bank’s approach has kept pace with
international development and practice, shifting from a focus on women to a
broader focus on gender equality. The Bank’s focus also shifted from a generalized
integration of gender at the project level to a more selective, country-level approach
that, since 2003, requires integration of gender considerations at the project level
only in the sectors identified in the CAS.

APPENDIX D EVALUATION FINDINGS RELATED TO BANK GROUP EFFECTIVENESS IN FOUR OPERATIONAL CATEGORIES
44
IEG’s gender evaluation (IEG 2010c), however, found that although gender
mainstreaming needs to be selective, given limited resources, it also needs to (i)
address both institutional and policy reform and (ii) ensure Bank-supported
operations are gender responsive, to encourage the participation of both men and
women in project activities and access to benefits.14 It noted that World Bank
management commitment—especially at the country director and more senior
levels—is critical to implementing the Bank’s gender policy. It also suggested that
such commitment needs to be reflected in clear steps to institutionalize gender
policy consistently in the CAS, within the framework envisaged in the 2001 World
Bank Gender Strategy.
Various steps have been taken to strengthen gender consideration in World Bank
operations. As part of the IDA16 replenishment, the World Bank committed to new
gender-related targets. Linked with the launch of the 2012 World Development
Report (World Bank 2012g), which focused on gender equality and development, a
series of new steps forward was presented to and endorsed by the Development
Committee. In addition, a set of expanded and operationally focused CAS guidelines
are being developed.
IEG’s gender evaluation also highlights the need to strengthen the collection,
analysis, and dissemination of gender-disaggregated, gender-relevant data and
statistics. IEG urges the World Bank to establish clear management accountability
for the development and implementation of a system to monitor the extent to which
Bank work adequately addresses gender-related concerns. Establishment of a results
framework to facilitate consistent adoption of an outcome approach to gender
integration in the World Bank’s work was also found to be crucial.
Safeguards and Social Sustainability
IEG’s evaluation of safeguards and sustainability policies (IEG 2010g) found that,
overall, these policies have helped prevent or mitigate the adverse impacts of
development projects on people and the environment.15 In this evaluation, IEG
recommended that IFC, MIGA, and the World Bank jointly adopt and use a shared
set of objective criteria to assess social and environmental risks to ensure adequacy
and consistency in project categorization across the Bank Group. The attempt to
achieve harmonization of classification for Category A across the Bank Group has
been initiated, and similar actions on Categories B and C are pending. The Bank has
developed and has been offering an operational course on safeguards for task team
leaders, and environment and social accreditation processes are being implemented.
The evaluation also notes that the World Bank does not have a clear framework to
assess the performance and impacts of its safeguards policies and that supervision

APPENDIX D EVALUATION FINDINGS RELATED TO BANK GROUP EFFECTIVENESS IN FOUR OPERATIONAL CATEGORIES
45
and monitoring deficiencies constrain the Bank’s ability to evaluate safeguards
results. It makes strong recommendations for the World Bank, IFC, and MIGA with
a view to strengthen safeguards monitoring, evaluation, and completion reporting.
An evaluation of the Poverty and Social Impact Analysis promoted its further
integration into the CASs (IEG 2010a) to increase effectiveness through, for example,
greater clarity in objectives and enhanced ownership by staff and managers. The
revised Good Practice Note on this analysis (World Bank 2008) strengthens the need
for poverty, social, and distributional impact analysis to be anchored in the CAS. In
addition, with support from the Multi-Donor Trust Fund, a number of learning
events and an e-learning tool have been organized.
A review of 10 extractive industries projects supported by IFC suggests that there is
insufficient emphasis on the sustainability of social programs beyond the life of the
project, especially in cases where the local community has become dependent on a
given company for the delivery of certain services. The review also found that broad
community support cannot be taken for granted. Without proactive anticipation and
appropriate stakeholder engagement, community support for this type of project
may wane. This echoes recent ICR assessments on the sustainability of activities
initiated under social development projects, particularly where local capacity is
weak and/or where follow-on funding is not available. Associated with this, in
certain instances, is the capacity of community-based organizations to contribute to
project cofinancing; this also needs to be taken into account in project design and
planning.

APPENDIX E PROJECT PERFORMANCE RATINGS OF WORLD BANK OPERATIONS
46
Appendix E Project Performance Ratings of World Bank Operations
The share of World Bank–financed investment projects rated moderately satisfactory
or better went from 78 percent for projects that were completed in FY06–08 to 70
percent for projects that were completed in FY09–11. The change is statistically
significant (in this report, ―statistically significant‖ means significant at least at the
95 percent confidence level, unless otherwise noted). The following paragraphs
present the main points from the review of the development outcome ratings for
Bank operations. In conducting the analyses, the IEG used project evaluation data as
of July 2, 2012.
Development Outcome Ratings of Investment Projects
The composition of projects rated moderately unsatisfactory or worse shows
weakening in the areas that had performed above the Bank average in the past.
These areas include infrastructure-related sectors and the agriculture and rural
development sector.
INFRASTRUCTURE SECTORS
The overall performance of infrastructure-related sectors in the past has typically
been high. For example, IEG’s evaluation of water-related projects at the World
Bank (IEG 2010h) reports that they had higher-than-average project outcome ratings
and performance has improved during the review period (1997–2007), especially in
Africa. The transport sector has usually been among the highest performing sectors,
based on IEG’s outcome ratings. The majority of sectors within the infrastructure
area continue to perform well relative to other sectors. However, relative to past
performance, the share of projects rated moderately satisfactory or better by IEG has
declined. The share of the number of infrastructure investment projects rated
moderately satisfactory or better remains at around the Bank average, but there was
a significant drop from 87 percent for projects completed in FY06–08 to 72 percent
for those concluding in FY09–11 (Table E.1).
Among the infrastructure sectors, 65 percent of projects mapped to the urban
development sector and the water sector were rated moderately satisfactory or
better, a decline of close to 25 percentage points. There was also a 15 percentage

APPENDIX E PROJECT PERFORMANCE RATINGS OF WORLD BANK OPERATIONS
47
point decline in the share of projects rated moderately satisfactory or better among
the transport sector projects. However, it should be noted the number of transport
projects that concluded in FY09–11 and were rated by IEG is significantly lower
compared to the number of rated projects that closed in FY06–08.
Table E.1. Development Outcome Ratings by Major Operation Areas
FY06-08 FY09-11
Operation Areas # Rated % MS+ # Rated % MS+
Economic opportunities*
Agriculture and Rural Dev** 88 85 65 71 Economic Policy 5 100 8 63 Financial Management 0 NA 1 100 Finance and Private Sector Dev 33 67 38 71 Public Sector Governance 35 69 33 64
161 78 145 69
Infrastructure**
Energy and Mining 50 74 23 74 Global ICT 4 100 5 100 Transport** 78 94 32 78 Urban Development** 28 89 23 65 Water** 38 89 31 65
198 87 114 72
Human Development
Education 68 66 45 71 Health, Nutrition, and Population 67 60 59 68 Social Protection 34 79 21 76
169 66 125 70
Environmentally and Socially Sustainable Development
Environment 46 80 28 64 Gender Development 1 100 0 NA Social Development 13 77 12 75
60 80 40 68
Bank-wide** 588 78 424 70
Source: IEG data. Note: MS+ = moderately satisfactory or better. The difference in the share of projects rated MS+ between FY06–08 and FY09–11 is statistically significant at 95 percent confidence level (**) and 90 percent confidence level (*).
Among the Regions, all Bank infrastructure projects concluded in FY09–11 in South
Asia that IEG reviewed were rated moderately satisfactory or better. Projects in the
Middle East and North Africa were rated the lowest, at 46 percent rated moderately
satisfactory or better. Without the projects in Middle East and North Africa, the
overall share of infrastructure investment projects rated moderately satisfactory or
better improves to 75 percent—still far from the level achieved for projects closing in
FY06–08. The decline is most significant among projects in upper-middle-income
countries, 67 percent of which were rated moderately satisfactory or better (closed in
FY09–11)—another group that was high performing in the past. The share was 97
percent for projects closed in FY06–08 (Table E.2).

APPENDIX E PROJECT PERFORMANCE RATINGS OF WORLD BANK OPERATIONS
48
Table E.2. Development Outcome Ratings for Infrastructure
FY06-08 FY09-11
Region # Rated % MS+ # Rated % MS+
Africa 36 69 21 71 East Asia and Pacific** 52 100 17 82 Europe and Central Asia** 43 91 29 69 Latin America and the Caribbean** 35 94 21 67 Middle East and North Africa 14 71 13 46 South Asia* 18 78 13 100
Country’s Income Level # Rated % MS+ # Rated % MS+
High Income 8 75 8 75 Lower middle income 66 82 28 71 Upper middle income** 90 97 49 67 Middle Income** 156 90 77 69 Low income 34 76 24 79
Total Infrastructure** 198 87 114 72
Source: IEG data. Note: MS+ = moderately satisfactory or better. The difference in the share of projects rated MS+ between FY06-08 and FY09-11 is statistically significant at 95 percent confidence level (**) and 90 percent confidence level (*).
The declining outcome rating of Bank infrastructure projects requires close
monitoring. Given the surge in volume since FY03, its impact on the overall ratings
for Bank operations will continue to be substantial. The reasons for less-than-
satisfactory ratings in the efficacy of development outcomes are diverse. They
include partial completion of project activities; outcome targets not being met at the
time of project closing; lack of evidence on achievement of objectives; inability to
solely attribute outcomes to the project; no baselines or quantifiable indicators; lack
of borrower commitment; and frequent changes in senior management within the
implementing agency.
A review of the ICR-Reviews of water sector projects closed in FY09–11 conducted
for this report shows that difficulties in this sector tend to be associated with projects
in the urban settings. It appears that projects implemented in urban areas have
particular challenges involved in planning and implementation with reference to the
need to engage with multiple stakeholders and to be aware of a potentially wide
range of vested interests. More generally the ICR-Reviews in this sector urge broad
consultation and the need to pay close attention to the political economy and to
ensure greater realism in targets set.
These urban-related challenges are also relevant to projects in the urban
development sector, which performed less well than those in other infrastructure
sectors. Twenty-three ICR-Reviews for urban development projects completed in
FY09–11 were analyzed for this report, twelve of which focused on natural disaster

APPENDIX E PROJECT PERFORMANCE RATINGS OF WORLD BANK OPERATIONS
49
relief. The analysis shows that most of the non-disaster relief urban projects rated
moderately unsatisfactory or worse by IEG in project development outcomes are in
middle income countries. This may suggest the Bank's programs in middle income
countries are more ambitious, going beyond direct provision of access to basic urban
infrastructure and services to more sector policy and capacity issues (including local
government finance).
Disaster response projects have performed strongly with 10 of 12 projects reviewed
were rated moderately satisfactory or better. Most projects involved the provision
of finance for reconstruction of housing and basic infrastructure for disaster affected
communities (or post-conflict communities). Overall, the analysis suggests the Bank
tends to do better in helping government agencies construct basic infrastructure and
deliver services but has more challenges with policy and institutional development
where it appears there is a tendency to ask too much too soon.
An analysis of the ICR-Reviews of transport sector projects that closed in FY09–11
indicate that transport sector projects tend to benefit from well-established
methodologies that allow for economically viable designs and more straightforward
implementation. Some projects are focused on much more complex and difficult
institutional issues that often cannot be addressed within a single operation. The
ICR-Reviews confirm that this is a high-performance sector that is achieving most of
the objectives set out at appraisal and resulting in good prospects of sustainability.
As for energy sector operations, lessons tend to emphasize the need for government
ownership, simplicity in design, realism in objective setting, and independence in
project actions.
AGRICULTURE AND RURAL DEVELOPMENT
IEG’s outcome ratings for investment projects managed by the agriculture and rural
development sector board declined in recent years, although the sector’s ratings are
still slightly higher than for the Bank as a whole. The share of projects rated
moderately satisfactory or better in terms of their development outcome rating fell
from 85 percent for projects completed in FY06–08 to 71 percent for those completed
in FY09–11.
The ICR Reviews for 64 agriculture projects that closed in FY09–11 were analyzed
for this report. The analysis shows that in 31 cases, the development outcome
ratings differed between the ICR and IEG’s review. In four of the 31 cases, IEG
upgraded the rating provided in the ICRs and, in seven of the remaining 27 cases,
IEG’s ratings resulted in a change from moderately satisfactory or better to
moderately unsatisfactory or worse. These projects operated across various regions

APPENDIX E PROJECT PERFORMANCE RATINGS OF WORLD BANK OPERATIONS
50
(Africa, Europe and Central Asia, the Middle East and North Africa, and Asia) and
pursued diverse objectives including, for example, objectives focused on capacity
development, food production and sustainable resource management.
Lessons learned are also diverse, although there is an emphasis on the need to take
more time to ensure effective design of large-scale, complex projects and to ensure
that indicators and M&E systems allow for proper reporting of project outcomes.
The most significant point of disagreement between the ICR and IEG review relates
to Bank performance as discussed later in this appendix. Differences in the
assessment of Borrower performance exist but are not as acute.
HUMAN DEVELOPMENT
Human development was the only operational area that showed an improvement in
IEG’s overall outcome ratings for investment projects between FY06–08 and FY09–11
(4 percentage points), although the increase was not statistically significant.16 In
particular, development outcome ratings for projects mapped to the health, nutrition
and population sector board show improving trends, from 60 percent in those
projects closing in FY06–08 to 68 percent for those closing in FY09–11.
DEVELOPMENT OUTCOME RATINGS BY REGIONS
The share of investment projects rated moderately satisfactory or better showed a
declining trend across Regions (Table E.3). Development outcome ratings for
investment projects in the East Asia and Pacific Region (at 77 percent) declined by 13
percentage points—from a very high level of 90 percent. This decline was the most
significant of all Bank regions. The Africa Region and the Middle East and North
Africa Region had the lowest share of investment projects rated moderately
satisfactory or better at 59 percent. As for the Middle East and North Africa Region,
five of six projects in Iran were rated moderately unsatisfactory or worse on
development outcomes. The share of that rating in the rest of the region without Iran
would increase to 68 percent.
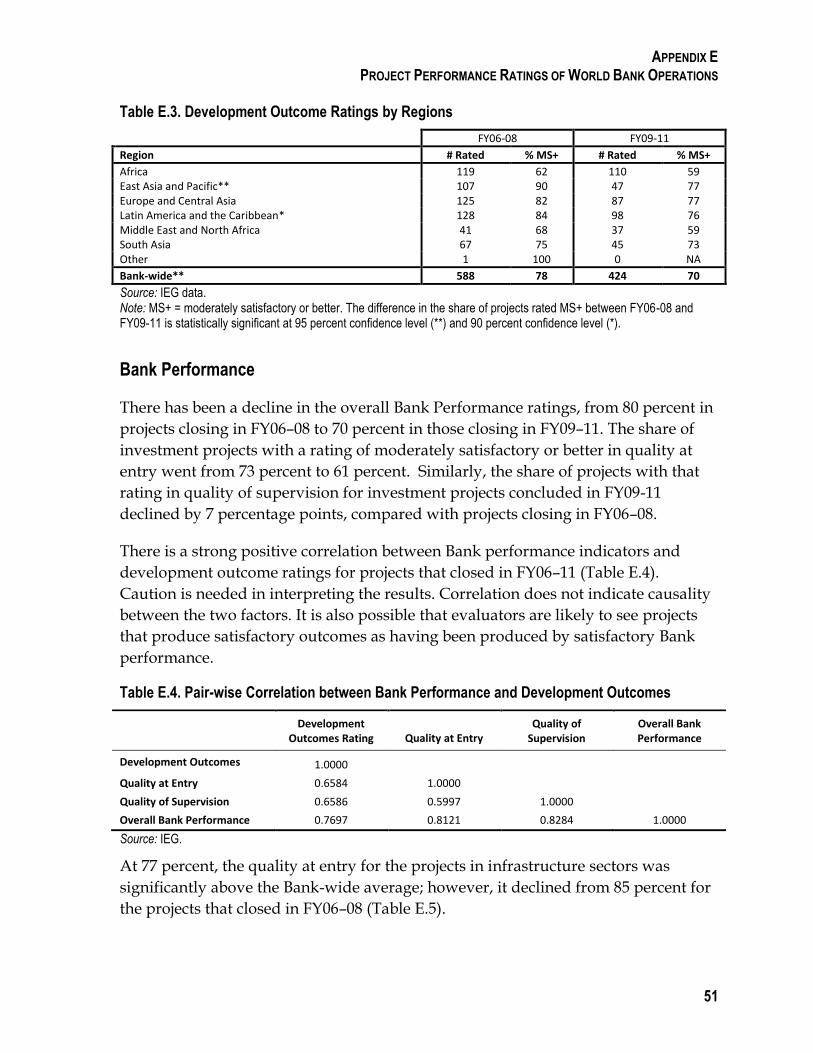
APPENDIX E PROJECT PERFORMANCE RATINGS OF WORLD BANK OPERATIONS
51
Table E.3. Development Outcome Ratings by Regions
FY06-08 FY09-11
Region # Rated % MS+ # Rated % MS+
Africa 119 62 110 59 East Asia and Pacific** 107 90 47 77 Europe and Central Asia 125 82 87 77 Latin America and the Caribbean* 128 84 98 76 Middle East and North Africa 41 68 37 59 South Asia 67 75 45 73 Other 1 100 0 NA
Bank-wide** 588 78 424 70
Source: IEG data. Note: MS+ = moderately satisfactory or better. The difference in the share of projects rated MS+ between FY06-08 and FY09-11 is statistically significant at 95 percent confidence level (**) and 90 percent confidence level (*).
Bank Performance
There has been a decline in the overall Bank Performance ratings, from 80 percent in
projects closing in FY06–08 to 70 percent in those closing in FY09–11. The share of
investment projects with a rating of moderately satisfactory or better in quality at
entry went from 73 percent to 61 percent. Similarly, the share of projects with that
rating in quality of supervision for investment projects concluded in FY09-11
declined by 7 percentage points, compared with projects closing in FY06–08.
There is a strong positive correlation between Bank performance indicators and
development outcome ratings for projects that closed in FY06–11 (Table E.4).
Caution is needed in interpreting the results. Correlation does not indicate causality
between the two factors. It is also possible that evaluators are likely to see projects
that produce satisfactory outcomes as having been produced by satisfactory Bank
performance.
Table E.4. Pair-wise Correlation between Bank Performance and Development Outcomes
Development
Outcomes Rating Quality at Entry Quality of
Supervision Overall Bank Performance
Development Outcomes 1.0000
Quality at Entry 0.6584 1.0000
Quality of Supervision 0.6586 0.5997 1.0000
Overall Bank Performance 0.7697 0.8121 0.8284 1.0000
Source: IEG.
At 77 percent, the quality at entry for the projects in infrastructure sectors was
significantly above the Bank-wide average; however, it declined from 85 percent for
the projects that closed in FY06–08 (Table E.5).
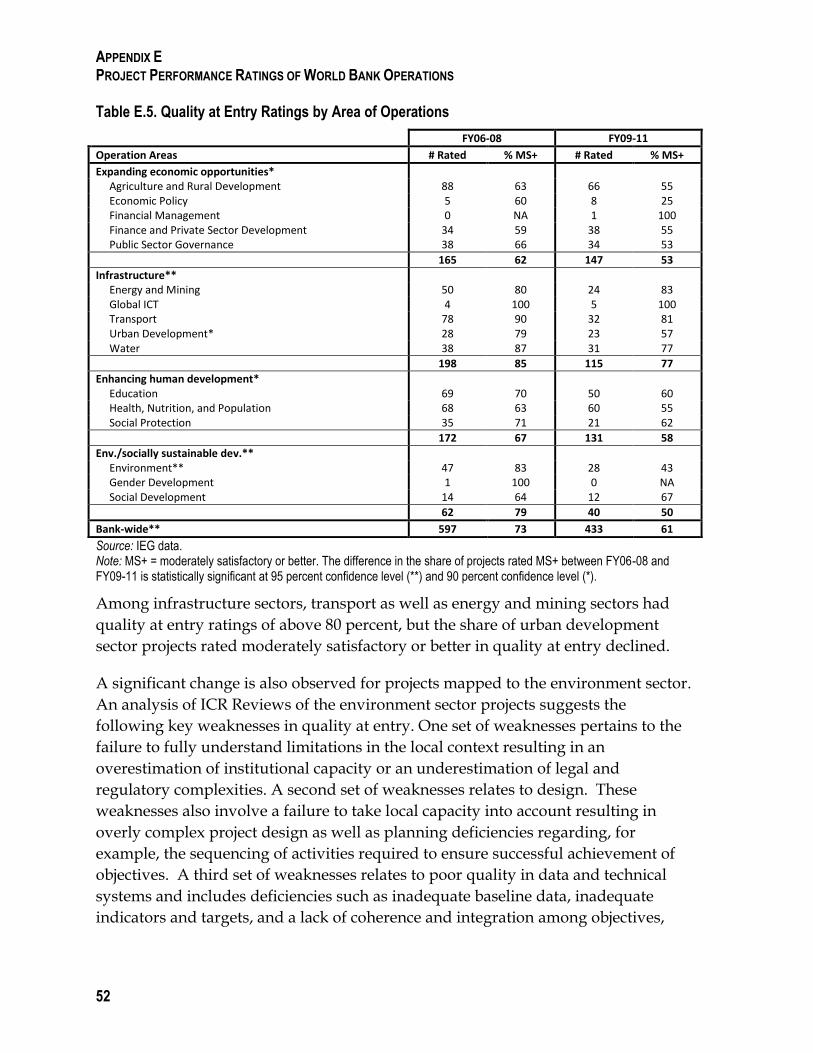
APPENDIX E PROJECT PERFORMANCE RATINGS OF WORLD BANK OPERATIONS
52
Table E.5. Quality at Entry Ratings by Area of Operations
FY06-08 FY09-11
Operation Areas # Rated % MS+ # Rated % MS+
Expanding economic opportunities*
Agriculture and Rural Development 88 63 66 55 Economic Policy 5 60 8 25 Financial Management 0 NA 1 100 Finance and Private Sector Development 34 59 38 55 Public Sector Governance 38 66 34 53
165 62 147 53
Infrastructure**
Energy and Mining 50 80 24 83 Global ICT 4 100 5 100 Transport 78 90 32 81 Urban Development* 28 79 23 57 Water 38 87 31 77
198 85 115 77
Enhancing human development*
Education 69 70 50 60 Health, Nutrition, and Population 68 63 60 55 Social Protection 35 71 21 62
172 67 131 58
Env./socially sustainable dev.**
Environment** 47 83 28 43 Gender Development 1 100 0 NA Social Development 14 64 12 67
62 79 40 50
Bank-wide** 597 73 433 61
Source: IEG data. Note: MS+ = moderately satisfactory or better. The difference in the share of projects rated MS+ between FY06-08 and FY09-11 is statistically significant at 95 percent confidence level (**) and 90 percent confidence level (*).
Among infrastructure sectors, transport as well as energy and mining sectors had
quality at entry ratings of above 80 percent, but the share of urban development
sector projects rated moderately satisfactory or better in quality at entry declined.
A significant change is also observed for projects mapped to the environment sector.
An analysis of ICR Reviews of the environment sector projects suggests the
following key weaknesses in quality at entry. One set of weaknesses pertains to the
failure to fully understand limitations in the local context resulting in an
overestimation of institutional capacity or an underestimation of legal and
regulatory complexities. A second set of weaknesses relates to design. These
weaknesses also involve a failure to take local capacity into account resulting in
overly complex project design as well as planning deficiencies regarding, for
example, the sequencing of activities required to ensure successful achievement of
objectives. A third set of weaknesses relates to poor quality in data and technical
systems and includes deficiencies such as inadequate baseline data, inadequate
indicators and targets, and a lack of coherence and integration among objectives,

APPENDIX E PROJECT PERFORMANCE RATINGS OF WORLD BANK OPERATIONS
53
results frameworks, and M&E systems. Other weaknesses identified are related to
poor financial management and procurement arrangements.
A smaller share of investment projects closed in FY09–11 were rated moderately
satisfactory or better in the quality of supervision ratings compared to those closed
in FY06-08 (Table E.6). The ratings for expanding economic opportunities projects
(73 percent) declined the most, by close to 12 percentage points, mainly because of
weak ratings for projects mapped to agriculture and rural development (68 percent).
In the ICR-Reviews for agriculture projects closed in FY09–11, supervision is often
noted as a key challenge to address. Frequently mentioned items include: long gaps
in supervision missions; absence of candor in the Implementation Status and Results
Report (ISR) ratings; failure to follow up on problems identified during supervision
missions; persistence in focusing on disbursement progress rather than development
impact and other problems; delay in baseline study; lack of updated indicators in the
supervision reports; and failure to carry out a formal midterm review.
Table E.6. Quality of Supervision Ratings by Area of Operations
FY06-08 FY09-11
Operation Areas # Rated % MS+ # Rated % MS+
Expanding economic opportunities **
Agriculture and Rural Development** 87 87 66 68 Economic Policy 5 80 8 63 Financial Management 0 NA 1 100 Finance and Private Sector Development 34 82 38 84 Public Sector Governance 37 84 34 74
163 85 147 73
Infrastructure**
Energy and Mining 50 86 24 92 Global Information and Communication Technology 4 100 5 100 Transport 78 97 32 91 Urban Development 27 89 23 74 Water* 38 95 31 81
197 93 115 85
Enhancing human development
Education 68 85 46 76 Health, Nutrition, and Population* 67 63 59 78 Social Protection 34 79 21 76
169 75 126 77
Env./socially sustainable dev.
Environment 47 83 28 71 Gender Development 1 100 0 NA Social Development 14 86 12 83
62 84 40 75
Bank-wide** 591 85 428 78
Source: IEG data. Note: MS+ = moderately satisfactory or better. The difference in the share of projects rated MS+ between FY06-08 and FY09-11 is statistically significant at 95 percent confidence level (**) and 90 percent confidence level (*).

APPENDIX E PROJECT PERFORMANCE RATINGS OF WORLD BANK OPERATIONS
54
The share also dropped for infrastructure projects, but the overall share remains the
highest among the major operation areas. By contrast, the ratings for the quality of
supervision improved by 15 percentage points for projects managed by the Health,
Nutrition, and Population Sector. The quality of supervision for infrastructure (85
percent) was significantly above the Bank-wide average.
Among the regions, East Asia and Pacific (81 percent) had the highest quality at
entry ratings, whereas, the Middle East and North Africa Region (43 percent) had
the lowest, with a decline of close to 20 percentage points compared to FY06–08. The
Latin America and the Caribbean Region had the largest fall in quality at entry
ratings from 81 percent to 56 percent. The Europe and Central Asia Region (66
percent) also showed a significant decline—11 percentage points, compared with
projects closing in FY06–08. The quality of supervision ratings for the Latin America
and the Caribbean Region (88 percent) was the highest, whereas the Middle East and
North Africa Region (59 percent) was the lowest and declined by 17 percent (Table
E.7).
Table E.7. Quality at Entry and Quality of Supervision by Region
FY06-08 FY09-11
Quality at Entry # Rated % MS+ # Rated % MS+
Africa 120 56 111 55 East Asia and Pacific 105 86 47 81 Europe and Central Asia* 127 77 89 66 Latin America and the Caribbean** 136 81 101 56 Middle East and North Africa* 41 61 40 43 South Asia 67 70 45 67 Other 1 0 0 NA
Bank-wide** 597 73 433 61
Quality of Supervision FY06-08 FY09-11
Africa 118 72 110 66 East Asia and Pacific 105 90 47 85 Europe and Central Asia 127 87 88 82 Latin America and the Caribbean* 132 95 99 88 Middle East and North Africa 41 76 39 59 South Asia 67 82 45 84 Other 1 0 0 NA
Bank-wide** 591 85 428 78
Source: IEG data. Note: MS+ = moderately satisfactory or better. The difference in the share of projects rated MS+ between FY06-08 and FY09-11 is statistically significant at 95 percent confidence level (**) and 90 percent confidence level (*).
Monitoring and Evaluation
About a quarter of the World Bank investment projects exiting the portfolio in FY09-
11 have been rated substantial or high in quality of M&E. Among the sectors, the
projects mapped to the energy and mining sector board had the highest share of

APPENDIX E PROJECT PERFORMANCE RATINGS OF WORLD BANK OPERATIONS
55
projects rated substantial or high in quality of M&E ratings. On the other hand, the
share fell for projects mapped to the environment and transport sector boards that
closed in FY09–11 compared to those closed in FY06–08. Among the regions, the
share for projects in the Latin America and Caribbean Region declined from 44
percent to 29 percent (Table E.8).
Table E.8. Quality of M&E by Operation Area and Region
FY06-08 FY09-11
Operation Areas # Rated % Sub+ # Rated % Sub+
Expanding economic opportunities
Agriculture and Rural Development 65 34 62 39 Economic Policy 4 25 8 13 Financial Management
1 0
Finance and Private Sector Dev 23 22 38 26 Public Sector Governance 26 42 33 21
118 33 142 30
Infrastructure*
Energy and Mining 39 49 21 57 Global ICT 3 67 5 40 Transport** 50 40 31 13 Urban Development 14 21 23 22 Water 27 26 31 26
133 38 111 28
Enhancing human development
Education 52 27 46 26 Health, Nutrition, and Population 55 22 58 17 Social Protection 27 19 20 25
134 23 110 22
Env./socially sustainable dev
Environment** 32 47 28 21 Gender Development 0 NA 0 NA Social Development 11 27 11 36
43 42 39 26
Regions Africa 87 25 109 20
East Asia and Pacific 77 38 47 26 Europe and Central Asia 88 35 84 37 Latin America and the Caribbean** 94 44 95 29 Middle East and North Africa* 32 6 37 22 South Asia 49 29 44 20 Other 1 0
Bank-wide* 428 32 416 26
Source: IEG data. Note: Sub+ = substantial or high. The difference in the share of projects rated Sub+ between FY06-08 and FY09-11 is statistically significant at 95 percent confidence level (**) and 90 percent confidence level (*).
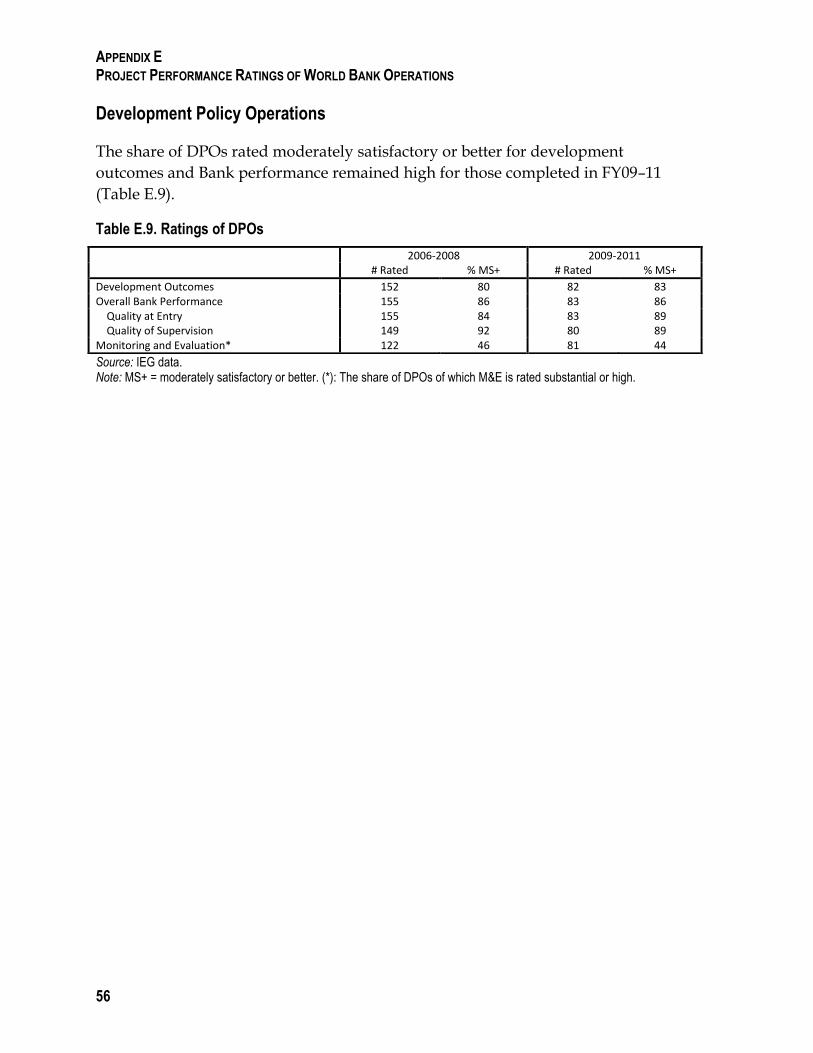
APPENDIX E PROJECT PERFORMANCE RATINGS OF WORLD BANK OPERATIONS
56
Development Policy Operations
The share of DPOs rated moderately satisfactory or better for development
outcomes and Bank performance remained high for those completed in FY09–11
(Table E.9).
Table E.9. Ratings of DPOs
Source: IEG data. Note: MS+ = moderately satisfactory or better. (*): The share of DPOs of which M&E is rated substantial or high.
2006-2008 2009-2011 # Rated % MS+ # Rated % MS+
Development Outcomes 152 80 82 83 Overall Bank Performance 155 86 83 86 Quality at Entry 155 84 83 89 Quality of Supervision 149 92 80 89 Monitoring and Evaluation* 122 46 81 44
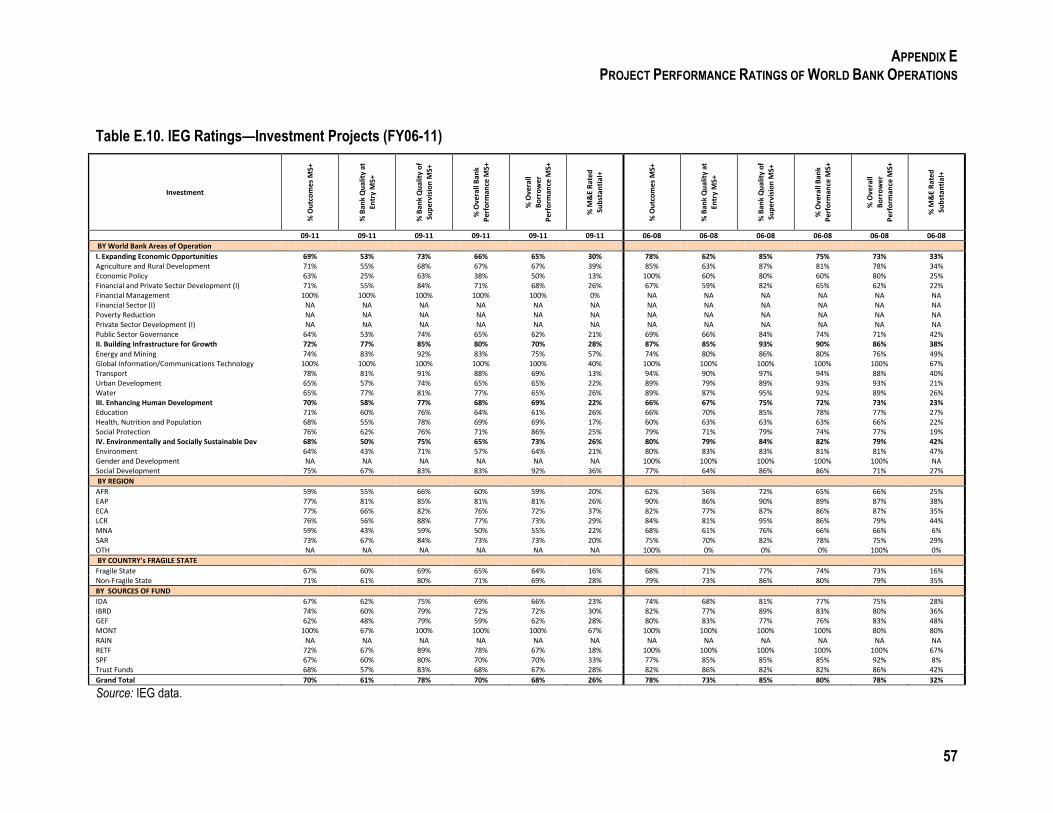
APPENDIX E PROJECT PERFORMANCE RATINGS OF WORLD BANK OPERATIONS
57
Table E.10. IEG Ratings—Investment Projects (FY06-11)
Investment
% O
utc
om
es M
S+
% B
ank
Qu
alit
y at
Entr
y M
S+
% B
ank
Qu
alit
y o
f
Sup
ervi
sio
n M
S+
% O
vera
ll B
ank
Per
form
ance
MS+
% O
vera
ll
Bo
rro
wer
P
erfo
rman
ce M
S+
% M
&E
Rat
ed
Sub
stan
tial
+
% O
utc
om
es M
S+
% B
ank
Qu
alit
y at
Entr
y M
S+
% B
ank
Qu
alit
y o
f
Sup
ervi
sio
n M
S+
% O
vera
ll B
ank
Per
form
ance
MS+
% O
vera
ll
Bo
rro
wer
P
erfo
rman
ce M
S+
% M
&E
Rat
ed
Sub
stan
tial
+
09-11 09-11 09-11 09-11 09-11 09-11 06-08 06-08 06-08 06-08 06-08 06-08
BY World Bank Areas of Operation
I. Expanding Economic Opportunities 69% 53% 73% 66% 65% 30% 78% 62% 85% 75% 73% 33% Agriculture and Rural Development 71% 55% 68% 67% 67% 39% 85% 63% 87% 81% 78% 34% Economic Policy 63% 25% 63% 38% 50% 13% 100% 60% 80% 60% 80% 25% Financial and Private Sector Development (I) 71% 55% 84% 71% 68% 26% 67% 59% 82% 65% 62% 22% Financial Management 100% 100% 100% 100% 100% 0% NA NA NA NA NA NA Financial Sector (I) NA NA NA NA NA NA NA NA NA NA NA NA Poverty Reduction NA NA NA NA NA NA NA NA NA NA NA NA Private Sector Development (I) NA NA NA NA NA NA NA NA NA NA NA NA Public Sector Governance 64% 53% 74% 65% 62% 21% 69% 66% 84% 74% 71% 42% II. Building Infrastructure for Growth 72% 77% 85% 80% 70% 28% 87% 85% 93% 90% 86% 38% Energy and Mining 74% 83% 92% 83% 75% 57% 74% 80% 86% 80% 76% 49% Global Information/Communications Technology 100% 100% 100% 100% 100% 40% 100% 100% 100% 100% 100% 67% Transport 78% 81% 91% 88% 69% 13% 94% 90% 97% 94% 88% 40% Urban Development 65% 57% 74% 65% 65% 22% 89% 79% 89% 93% 93% 21% Water 65% 77% 81% 77% 65% 26% 89% 87% 95% 92% 89% 26% III. Enhancing Human Development 70% 58% 77% 68% 69% 22% 66% 67% 75% 72% 73% 23% Education 71% 60% 76% 64% 61% 26% 66% 70% 85% 78% 77% 27% Health, Nutrition and Population 68% 55% 78% 69% 69% 17% 60% 63% 63% 63% 66% 22% Social Protection 76% 62% 76% 71% 86% 25% 79% 71% 79% 74% 77% 19% IV. Environmentally and Socially Sustainable Dev 68% 50% 75% 65% 73% 26% 80% 79% 84% 82% 79% 42% Environment 64% 43% 71% 57% 64% 21% 80% 83% 83% 81% 81% 47% Gender and Development NA NA NA NA NA NA 100% 100% 100% 100% 100% NA Social Development 75% 67% 83% 83% 92% 36% 77% 64% 86% 86% 71% 27%
BY REGION
AFR 59% 55% 66% 60% 59% 20% 62% 56% 72% 65% 66% 25% EAP 77% 81% 85% 81% 81% 26% 90% 86% 90% 89% 87% 38% ECA 77% 66% 82% 76% 72% 37% 82% 77% 87% 86% 87% 35% LCR 76% 56% 88% 77% 73% 29% 84% 81% 95% 86% 79% 44% MNA 59% 43% 59% 50% 55% 22% 68% 61% 76% 66% 66% 6% SAR 73% 67% 84% 73% 73% 20% 75% 70% 82% 78% 75% 29% OTH NA NA NA NA NA NA 100% 0% 0% 0% 100% 0%
BY COUNTRY's FRAGILE STATE
Fragile State 67% 60% 69% 65% 64% 16% 68% 71% 77% 74% 73% 16% Non-Fragile State 71% 61% 80% 71% 69% 28% 79% 73% 86% 80% 79% 35%
BY SOURCES OF FUND
IDA 67% 62% 75% 69% 66% 23% 74% 68% 81% 77% 75% 28% IBRD 74% 60% 79% 72% 72% 30% 82% 77% 89% 83% 80% 36% GEF 62% 48% 79% 59% 62% 28% 80% 83% 77% 76% 83% 48% MONT 100% 67% 100% 100% 100% 67% 100% 100% 100% 100% 80% 80% RAIN NA NA NA NA NA NA NA NA NA NA NA NA RETF 72% 67% 89% 78% 67% 18% 100% 100% 100% 100% 100% 67% SPF 67% 60% 80% 70% 70% 33% 77% 85% 85% 85% 92% 8% Trust Funds 68% 57% 83% 68% 67% 28% 82% 86% 82% 82% 86% 42%
Grand Total 70% 61% 78% 70% 68% 26% 78% 73% 85% 80% 78% 32%
Source: IEG data.
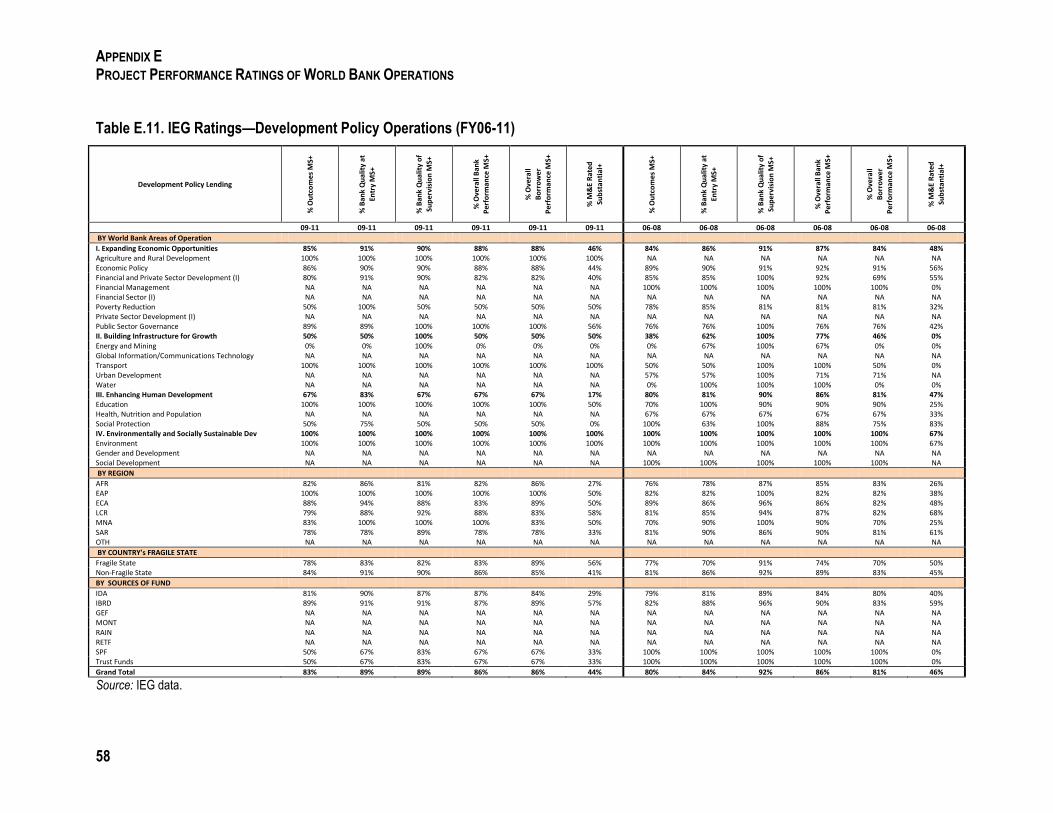
APPENDIX E PROJECT PERFORMANCE RATINGS OF WORLD BANK OPERATIONS
58
Table E.11. IEG Ratings—Development Policy Operations (FY06-11)
Development Policy Lending
% O
utc
om
es M
S+
% B
ank
Qu
alit
y at
Entr
y M
S+
% B
ank
Qu
alit
y o
f
Sup
ervi
sio
n M
S+
% O
vera
ll B
ank
Per
form
ance
MS+
% O
vera
ll
Bo
rro
wer
P
erfo
rman
ce M
S+
% M
&E
Rat
ed
Sub
stan
tial
+
% O
utc
om
es M
S+
% B
ank
Qu
alit
y at
Entr
y M
S+
% B
ank
Qu
alit
y o
f
Sup
ervi
sio
n M
S+
% O
vera
ll B
ank
Per
form
ance
MS+
% O
vera
ll
Bo
rro
wer
P
erfo
rman
ce M
S+
% M
&E
Rat
ed
Sub
stan
tial
+
09-11 09-11 09-11 09-11 09-11 09-11 06-08 06-08 06-08 06-08 06-08 06-08
BY World Bank Areas of Operation
I. Expanding Economic Opportunities 85% 91% 90% 88% 88% 46% 84% 86% 91% 87% 84% 48% Agriculture and Rural Development 100% 100% 100% 100% 100% 100% NA NA NA NA NA NA Economic Policy 86% 90% 90% 88% 88% 44% 89% 90% 91% 92% 91% 56% Financial and Private Sector Development (I) 80% 91% 90% 82% 82% 40% 85% 85% 100% 92% 69% 55% Financial Management NA NA NA NA NA NA 100% 100% 100% 100% 100% 0% Financial Sector (I) NA NA NA NA NA NA NA NA NA NA NA NA Poverty Reduction 50% 100% 50% 50% 50% 50% 78% 85% 81% 81% 81% 32% Private Sector Development (I) NA NA NA NA NA NA NA NA NA NA NA NA Public Sector Governance 89% 89% 100% 100% 100% 56% 76% 76% 100% 76% 76% 42% II. Building Infrastructure for Growth 50% 50% 100% 50% 50% 50% 38% 62% 100% 77% 46% 0% Energy and Mining 0% 0% 100% 0% 0% 0% 0% 67% 100% 67% 0% 0% Global Information/Communications Technology NA NA NA NA NA NA NA NA NA NA NA NA Transport 100% 100% 100% 100% 100% 100% 50% 50% 100% 100% 50% 0% Urban Development NA NA NA NA NA NA 57% 57% 100% 71% 71% NA Water NA NA NA NA NA NA 0% 100% 100% 100% 0% 0% III. Enhancing Human Development 67% 83% 67% 67% 67% 17% 80% 81% 90% 86% 81% 47% Education 100% 100% 100% 100% 100% 50% 70% 100% 90% 90% 90% 25% Health, Nutrition and Population NA NA NA NA NA NA 67% 67% 67% 67% 67% 33% Social Protection 50% 75% 50% 50% 50% 0% 100% 63% 100% 88% 75% 83% IV. Environmentally and Socially Sustainable Dev 100% 100% 100% 100% 100% 100% 100% 100% 100% 100% 100% 67% Environment 100% 100% 100% 100% 100% 100% 100% 100% 100% 100% 100% 67% Gender and Development NA NA NA NA NA NA NA NA NA NA NA NA Social Development NA NA NA NA NA NA 100% 100% 100% 100% 100% NA
BY REGION
AFR 82% 86% 81% 82% 86% 27% 76% 78% 87% 85% 83% 26% EAP 100% 100% 100% 100% 100% 50% 82% 82% 100% 82% 82% 38% ECA 88% 94% 88% 83% 89% 50% 89% 86% 96% 86% 82% 48% LCR 79% 88% 92% 88% 83% 58% 81% 85% 94% 87% 82% 68% MNA 83% 100% 100% 100% 83% 50% 70% 90% 100% 90% 70% 25% SAR 78% 78% 89% 78% 78% 33% 81% 90% 86% 90% 81% 61% OTH NA NA NA NA NA NA NA NA NA NA NA NA
BY COUNTRY's FRAGILE STATE
Fragile State 78% 83% 82% 83% 89% 56% 77% 70% 91% 74% 70% 50% Non-Fragile State 84% 91% 90% 86% 85% 41% 81% 86% 92% 89% 83% 45%
BY SOURCES OF FUND
IDA 81% 90% 87% 87% 84% 29% 79% 81% 89% 84% 80% 40% IBRD 89% 91% 91% 87% 89% 57% 82% 88% 96% 90% 83% 59% GEF NA NA NA NA NA NA NA NA NA NA NA NA MONT NA NA NA NA NA NA NA NA NA NA NA NA RAIN NA NA NA NA NA NA NA NA NA NA NA NA RETF NA NA NA NA NA NA NA NA NA NA NA NA SPF 50% 67% 83% 67% 67% 33% 100% 100% 100% 100% 100% 0% Trust Funds 50% 67% 83% 67% 67% 33% 100% 100% 100% 100% 100% 0%
Grand Total 83% 89% 89% 86% 86% 44% 80% 84% 92% 86% 81% 46%
Source: IEG data.

59
Appendix F Projection of Development Outcome Ratings
The data set for projecting development outcome ratings for FY09–11 and FY12–14
exits is based on the method described in Table F.1. Table F.2 shows the disconnect
rates used in projecting development outcomes ratings.
Table F.1. Projection of Development Outcome Ratings
Project Status Ratings Used
Project already reviewed by IEG The development outcome ratings in IEG’s Implementation Completion Report Review (ICR-R)
Project with ICR The development outcome ratings in the ICR after discounting for historical disconnect between development outcome ratings in ICR and in ICR-R
Closed projects that do not have ICRs
The development outcome ratings in the last ISR after discounting for historical disconnect between development outcome ratings in the last ISR before closing and ICR-R
Projects in active portfolio The development outcome ratings in the most recent ISR after discounting for:
Projects scheduled to close during FY12
Historical disconnect between development outcome ratings in last ISR -1 before closing and development outcome ratings in the ICR-R
Projects scheduled to close during FY13
Historical disconnect between development outcome ratings in the last ISR -2 before closing and development outcome ratings in the ICR-R.
Projects scheduled to close during FY14
Historical disconnect between development outcome ratings in the Last ISR -3 before closing and development outcome ratings in the ICR-R.
Source: IEG. Note: The data set for computing the various discounting rates is based on the latest 1,000 IEG evaluations sorted by descending order of two sort keys: Closing Date; and Evaluation Date. ICR-R = Implementation Completion Report Review; ISR = Implementation Status and Results Report.
Table F.2. Disconnect Rates
Disconnect type Data points # disconnect % disconnect rate
Last ISR DO to ICR Outcome
995 63 6.3
ICR Outcome to IEG Outcome
995 88 8.8
Last ISR DO to IEG Outcome
1,000 152 15.2
(ISR-1) DO to IEG 972 184 18.9
(ISR-2) DO to IEG 969 202 20.8
(ISR-3) DO to IEG 957 173 18.1
Source: IEG data. Note: DO = development outcome; ISR = Implementation Status and Results Report.

60
Appendix G Assessments of Possible Factors Underlying the Decline in Outcome Ratings for World Bank Investment Projects
As part of the effort to identify the underlying factors of the decline in the
development outcome ratings of World Bank–financed investment projects, five
possibilities were examined:
Is the decline caused by lower ratings for projects in fragile states?
Did changes in regional or sector composition have an impact on the
performance of infrastructure projects that closed in FY09–11?
Did expansion of additional financing affect the overall development
outcome ratings?
Is the decline in project performance of the infrastructure segment caused by
safeguard problems?
Is the decline in the quality of entry ratings for infrastructure projects caused
by smaller preparation costs?
Is the decline caused by lower ratings for projects in fragile states?
The decline in the development
outcome ratings for non-fragile
states is from 79 percent in projects
closing in FY06–08 to 71 percent for
those closing in FY09–11. This
decline is significantly larger than
the decline for fragile states, which
moved from 68 percent to 67
percent, which is not statistically
significant (Figure G.1). Given this,
the decline in the outcome ratings
for the projects closing in FY09–11 is
not because of a decline among
projects in fragile states.
Figure G.1. Development Outcome Ratings for Fragile and Non-Fragile Countries
Source: IEG.
68% 67%
79%
71%
0%
10%
20%
30%
40%
50%
60%
70%
80%
90%
100%
FY06-08 FY09-11
Fragile
Non-Fragile

APPENDIX G POSSIBLE FACTORS UNDERLYING THE DECLINE IN RATINGS
61
Did changes in regional/sector composition have an impact on the performance of infrastructure projects that closed in FY09–11?
A regression analysis was conducted to (i) measure the performance decline in
infrastructure projects after controlling for the influence of sector or region; and to
(ii) estimate sector- or region-specific performance differences, using projects
completed between FY06 and FY11 and rated by IEG. The analysis followed the
approach used in Annual Review of Development Effectiveness 2009 (IEG 2009a, pp.
13–15). The performance is indicated using the six-point scale: 6 points are assigned
to highly satisfactory, 5 to satisfactory, 4 to moderately satisfactory, 3 to moderately
unsatisfactory, 2 to unsatisfactory, and 1 to highly unsatisfactory projects.
The analysis shows that the changes in regional and sectoral composition
contributed negatively to overall performance to the extent that operations shift
away from high-performing categories toward low-performing categories.
However, the impact of both the regional shifts and sector board changes were
modest. Adding everything together, the full performance deterioration in
infrastructure projects from all the composition changes comes to –0.063 of a point
on the six-point scale (Tables G.1 and G.2).
Table G.1. Effect of Changes in Project Composition on the Overall Outcome Ratings
Segments
A. Share of projects in FY06–08d
B. Share of projects in FY09–11e
C. Change(FY06–08)-(FY09–11)
(B-A) D. Estimated
effect/impactc
E. Overall effect of change
(C x D)
Region East Asia and Pacific 0.263 0.149 -0.114 (reference)a (reference)a Africa 0.182 0.184 0.002 -0.605 -0.001 Europe and Central Asia 0.217 0.254 0.037 b b Latin America and the Caribbean 0.177 0.184 0.007 -0.406 -0.003 Middle East and North Africa 0.071 0.114 0.043 -1.030 -0.045 South Asia 0.091 0.114 0.023 -0.369 -0.009 Total -0.058
Sector Board Transport 0.394 0.281 -0.113 (reference)a (reference)a Energy and Mining 0.253 0.202 -0.051 -0.270 0.014 Global ICT 0.020 0.044 0.024 b b Urban Development 0.141 0.202 0.060 b b Water 0.192 0.272 0.080 -0.239 -0.019 Total -0.005
Total Region/Sector Board -0.063
Source: IEG and World Bank data. a. Average performance among sectors is estimated relative to transport, and among regions, relative to East Asia and the Pacific. b. Only regions and sector boards with significant estimated performance effects of at least 90 percent confidence level (Table G.2) are included in column D. c. This column (Column D) reports the estimated effects from the regression (Table G.2). For the Sector Board and Region variables, what is reported is the average increase (on the six- point rating scale) in project performance associated with each Sector Board or Region. For example, projects in Energy and Mining performed, on average, 0.27 points worse than those in transport (the reference sector). d. Share of number of FY06–08 exits evaluated by IEG. e. Share of number of FY09–11 exits evaluated by IEG.
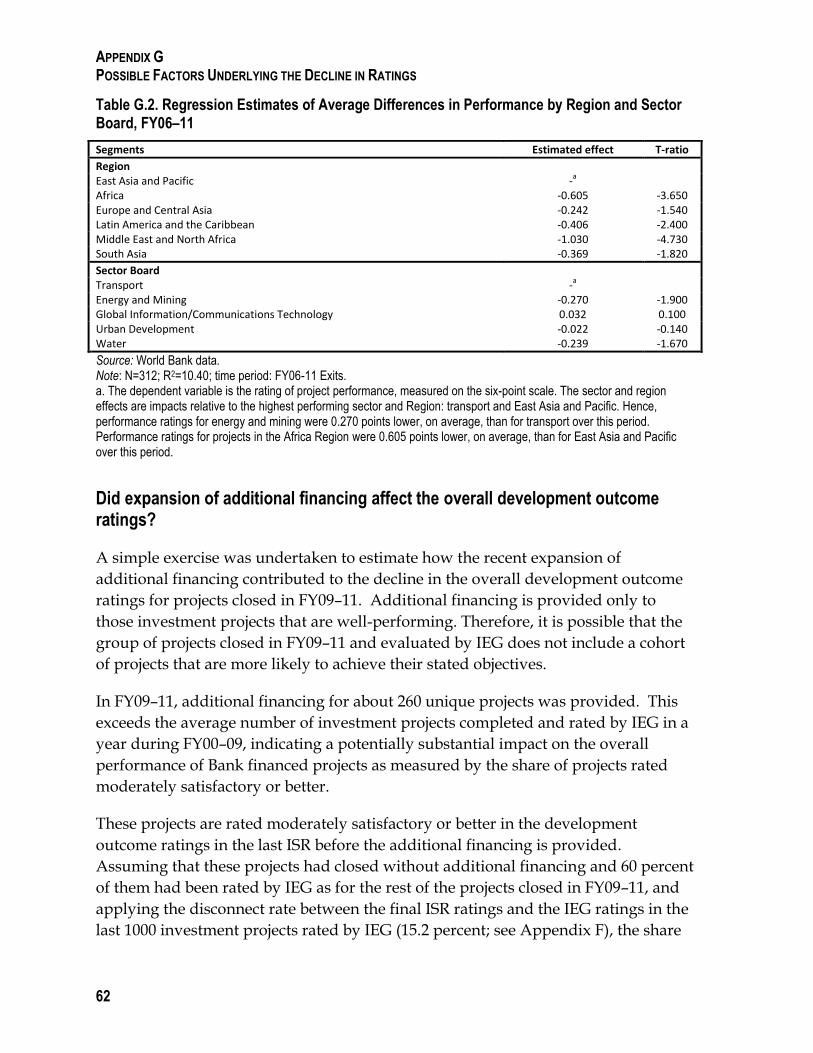
APPENDIX G POSSIBLE FACTORS UNDERLYING THE DECLINE IN RATINGS
62
Table G.2. Regression Estimates of Average Differences in Performance by Region and Sector Board, FY06–11
Segments Estimated effect T-ratio
Region East Asia and Pacific -
a
Africa -0.605 -3.650 Europe and Central Asia -0.242 -1.540 Latin America and the Caribbean -0.406 -2.400 Middle East and North Africa -1.030 -4.730 South Asia -0.369 -1.820
Sector Board Transport -
a
Energy and Mining -0.270 -1.900 Global Information/Communications Technology 0.032 0.100 Urban Development -0.022 -0.140 Water -0.239 -1.670
Source: World Bank data. Note: N=312; R2=10.40; time period: FY06-11 Exits.
a. The dependent variable is the rating of project performance, measured on the six-point scale. The sector and region effects are impacts relative to the highest performing sector and Region: transport and East Asia and Pacific. Hence, performance ratings for energy and mining were 0.270 points lower, on average, than for transport over this period. Performance ratings for projects in the Africa Region were 0.605 points lower, on average, than for East Asia and Pacific over this period.
Did expansion of additional financing affect the overall development outcome ratings?
A simple exercise was undertaken to estimate how the recent expansion of
additional financing contributed to the decline in the overall development outcome
ratings for projects closed in FY09–11. Additional financing is provided only to
those investment projects that are well-performing. Therefore, it is possible that the
group of projects closed in FY09–11 and evaluated by IEG does not include a cohort
of projects that are more likely to achieve their stated objectives.
In FY09–11, additional financing for about 260 unique projects was provided. This
exceeds the average number of investment projects completed and rated by IEG in a
year during FY00–09, indicating a potentially substantial impact on the overall
performance of Bank financed projects as measured by the share of projects rated
moderately satisfactory or better.
These projects are rated moderately satisfactory or better in the development
outcome ratings in the last ISR before the additional financing is provided.
Assuming that these projects had closed without additional financing and 60 percent
of them had been rated by IEG as for the rest of the projects closed in FY09–11, and
applying the disconnect rate between the final ISR ratings and the IEG ratings in the
last 1000 investment projects rated by IEG (15.2 percent; see Appendix F), the share

APPENDIX G POSSIBLE FACTORS UNDERLYING THE DECLINE IN RATINGS
63
of moderately satisfactory or above projects would be 74 percent. The decline
compared to the share for investment projects closed in FY06–08 is not significant at
the 95 percent confidence level, but significant at the 90 percent confidence level.
Table G.3. Additional Financing
Number of Projects with Additional Financing Approved in FY09-11 257
Percent of investment projects closed in FY09-11 and rated by IEG 60
Number of projects which would have been rated by IEG 154
Of which, projects expected to be rated moderately satisfactory or better with 15.2 % disconnect rate
131
Expected total number of investment projects rated moderately satisfactory or better
428
Expected total number of investment projects rated by IEG 578
Share of moderately satisfactory or better 74%
Source: IEG.
Is the decline in infrastructure project performance caused by safeguards requirements?
An assessment was undertaken to identify the relationship between the outcome
ratings and environmental safeguards requirement for projects mapped to the
infrastructure sectors (Table G.4) and the World Bank’s Sustainable Development
Network (Table G.5). For projects mapped to the infrastructure segment, the analysis
found that the decline in performance from 83 percent in projects closing in FY06–08
to 67 percent in FY09–11 for projects that required partial environment assessment to
be significant at 95 percent confidence level. However, there was also a statistically
significant decline in performance for projects that did not require any
environmental assessment to be significant at 95 percent confidence level. Projects
that require full environmental assessment did not experience a significant decline.
As for the projects mapped to the Sustainable Development Network, the decline in
performance from 84 percent (projects closing in FY06–08) to 67 percent (FY09–11)
for projects that required partial environment assessment was found to be
significant at 95 percent confidence level. However, the declines in ratings for
projects requiring full environment assessment and those that do not require any
assessments were significant at the 90 percent confidence level.
These analyses suggest that the fall in the share of projects rated moderately
satisfactory or better in infrastructure projects occurred most significantly among
those which require partial assessment. They do not provide evidence to support
that the decline was caused by the severity of safeguard requirements.

APPENDIX G POSSIBLE FACTORS UNDERLYING THE DECLINE IN RATINGS
64
Table G.4. Relationship between Environment Category and Development Outcomes for Infrastructure Development Goal
2006–2008 2009–2011
# R
ated
% M
S+
Ou
tco
mes
Sign
ific
ance
w.r
.t T
ota
l at
95
Sign
ific
ance
w.r
.t T
ota
l at
90
# R
ated
% M
S+
Ou
tco
mes
Sign
ific
ance
w.r
.t T
ota
l at
95
Sign
ific
ance
w.r
.t T
ota
l at
90
Sign
ific
ance
o
f 0
9-1
1 w
.r.t
06
-08
at
95
Sign
ific
ance
of
09
-11
w.r
.t
06
-08
at
95
Full environmental assessment 51 92 No No 23 83 No No No No Partial assessment 109 83 No No 60 67 No No Yes Yes Financial intermediary assessment 4 100 No No 14 86 No No No No Not rated (for all adj. op. except SECA) 1 100 No No
Not required 33 91 No No 17 65 No No Yes Yes
Total 198 87 114 72
Source: IEG and World Bank data. Note: w.r.t = with respect to. SECA = Sector Adjustment Loan.
Table G.5. Relationship between Environment Category and Development Outcomes for Projects Mapped to the Sustainable Development Network
2006–2008 2009–2011
# R
ated
% M
S+
Ou
tco
mes
Sign
ific
ance
w.r
.t T
ota
l at
95
Sign
ific
ance
w.r
.t T
ota
l at
95
# R
ated
% M
S+
Ou
tco
mes
Sign
ific
ance
w
.r.t
To
tal a
t
95
Sign
ific
ance
w.r
.t T
ota
l at
95
Sign
ific
ance
o
f 0
9-1
1 w
.r.t
06
-08
at
95
Sign
ific
ance
of
09
-11
w.r
.t
06
-08
at
95
Full environmental assessment 57 91 No No 32 81 No No No No Partial assessment 209 84 No No 140 67 No No Yes Yes Financial intermediary assessment 14 93 No No 17 82 No No No No Not rated (for all adj. op. except SECA) 1 100 No No 1 100 No No
Not required 64 84 No No 29 69 No No No No
Total 345 86 219 71
Source: IEG and World Bank data. Note: w.r.t. = with respect to. SECA = Sector Adjustment Loan.
Is the decline in the quality at entry ratings for infrastructure projects caused by lower preparation costs?
An assessment was undertaken to identify the relationship between the preparation
costs and the quality at entry ratings for projects mapped to the infrastructure
sectors (Figure G.2.A) and the sustainable development network (Figure G.2.B).
The average preparation costs increased significantly from $263,000 in FY94–96 to
$341,000 in FY97–99, and the quality at entry ratings also improved from 59 percent
to 73 percent. Similarly, the average preparation costs increased from $532,000 in
FY03–05 to $543,000 in FY06–08; the quality at entry ratings improved from 76
percent to 85 percent. In contrast, the average preparation cost decreased from
$543,000 in FY06–08 to $486,000 in FY09–11—the periods of attention for this
report—and the quality at entry ratings declined from 85 percent to 77 percent.
Similar trends are observed for sustainable development network mapped projects.

APPENDIX G POSSIBLE FACTORS UNDERLYING THE DECLINE IN RATINGS
65
The preparation costs and quality at entry ratings shifted in the same directions with
statistically significant changes in quality at entry ratings in those three periods.
However, the relationship is not significant17 throughout the period.
Figure G.2. Preparation Costs and Quality at Entry Ratings (FY1991–2011 Exits)
A. Infrastructure Sectors B. SDN Network
Source: IEG and World Bank data. Note: MS+ = moderately satisfactory or better. ** Changes in quality at entry ratings between the previous and current period statistically significant at 95 percent confidence level. * Changes in quality at entry ratings between the previous and current period statistically significant at 90 percent confidence level.
40%
45%
50%
55%
60%
65%
70%
75%
80%
85%
90%
0
100
200
300
400
500
600
Qu
alit
y at
En
try
Pe
rce
nt
MS+
Ave
rage
Pre
par
atio
n C
ost
($
'00
0)
Average of Preparation Cost
Average of IEG Bank Qual @ Entry 1-Point Scale (MS+)
40%
45%
50%
55%
60%
65%
70%
75%
80%
85%
0
100
200
300
400
500
600
Qu
alit
y at
En
try
Pe
rce
nt
MS+
Ave
rage
Pre
par
atio
n C
ost
($
'00
0)
Average of Preparation Cost
Average of IEG Bank Qual @ Entry 1-Point Scale (MS+)

66
Appendix H IFC Operations
Recent Trends in IFC’s Operations
Under its mandate to support private sector development, IFC offers three main
lines of business: investment services, advisory services, and, since 2009, the Asset
Management Company (AMC). Within its investment services, the main
instruments are loans, equity, and guarantees. Whereas loans and equity are
considered long-term finance instruments, most guarantees (and some types of
loans) make up the bulk of short-term finance.
Since the financial crisis, the instrument mix for IFC investments has shifted
significantly, with short-term trade finance guarantees now the most frequently
used product. IFC’s overall investment commitment recovered from a decline
during the global financial crisis and reached a peak in FY10. In FY11, the total
original commitment for IFC’s own account amounted to $12.2 billion ($10.7 billion
in total net commitment). The growth in commitments is caused by an increase in
short-term finance products, which expanded rapidly in response to demand during
the crisis.
Short-term finance products increased rapidly while long-term finance remains
below the pre-crisis level. Short-term products grew from nil in FY05—the year they
were established—to $4.9 billion in FY11, increasing their share in total IFC
investments to 45 percent in FY11. By contrast, IFC’s traditional long-term finance
has shown less dynamism and remains below the level reached in FY08 (Figure 2.3
in the main text). This shift was driven by several factors, including increasing
demand for trade finance during the crisis. Global uncertainty related to the crisis
also adversely affected long-term capital projects in developing countries.
This decline in long-term financing largely affected loans, which have decreased
steadily. By contrast, equity investments have increased in line with IFC’s strategic
intentions, although their share of IFC commitments has remained relatively stable,
averaging around 20 percent of net commitments (FY06–11).18 Weighted by the
riskiness of different instruments, short-term finance instruments account only for a
small fraction of economic capital requirements, whereas equity investments take
the largest share. This risk dynamic, together with an increasingly constrained
capital situation for IFC, may also explain the focus on short-term products. The
trend characterized by the growth in short-term finance products and the uncertain

APPENDIX H IFC OPERATIONS
67
environment for private capital flows to developing countries present challenges for
IFC. These include challenges for the sustainable growth of its long-term portfolio,
its revenues, and the measurement of its contribution to development results.19
Two characteristics should be noted when interpreting numbers for IFC’s short-term
finance products. First, the total of $4.3 billion recorded for the Global Trade Finance
Program (GTFP) alone during FY11 captures each trade transaction for which a
guarantee is issued (the ―flow‖), but it does not reflect the balance of outstanding
contingent liabilities (the ―stock‖). The latter amount is smaller, and the Global
Trade Finance Program continues to operate within the Board-approved product
ceiling of $3 billion—reflecting an average guarantee tenor of five months (The
outstanding balance under the Program was $2.9 billion as of June 2012). Second, the
Program operates as a guarantee program to cover the payment risk related to a
trade transaction. As such, it does not provide ―financing‖ but assumes a contingent
liability, which would result in a payment in the event a guarantee is called.
Financial sector projects, which include short-term trade finance products, dominate
IFC’s investment volume; commitments for infrastructure and real sectors declined.
The share of financial markets projects increased from 47 percent of net
commitments in FY05 to 73 percent in FY11. The other two industry clusters had
much smaller—and shrinking—shares: infrastructure accounted for 15 percent, and
manufacturing, agribusiness, and services sectors for 12 percent in FY11 (each
averaged 23 percent of IFC commitments during FY06–11).
The absolute and relative decline of IFC’s nonfinancial sector portfolio was not
uniform across regions and subsectors. Infrastructure investments in the South Asia
Region decreased fully 92 percent during FY09–11, compared with the preceding
three years, driven by a decline of volume in India. In contrast, investments
increased in Latin America and Sub-Saharan Africa, the latter driven by a 3.5-fold
increase of investment in telecom/IT even as commitments in the power sector in
the region declined by three-quarters. Overall, among infrastructure sectors,
investments grew in the utilities (water and sanitation), telecom/IT, and
transportation. Commitments for oil, gas, and mining projects declined substantially
(by 70 percent)—mainly in Latin America and the Caribbean, Africa, South Asia,
and Europe and Central Asia— as did the electric power sector.
The overall decline in real sectors was reflected throughout most regions, but
commitments in Sub-Saharan Africa increased by 78 percent between the FY06–08
and FY09–11 periods—driven by a near doubling of agribusiness investments.
Overall, however, commitments in all subsectors of the manufacturing, agribusiness,
and services cluster declined. This includes IFC’s targeted sectors (in addition to
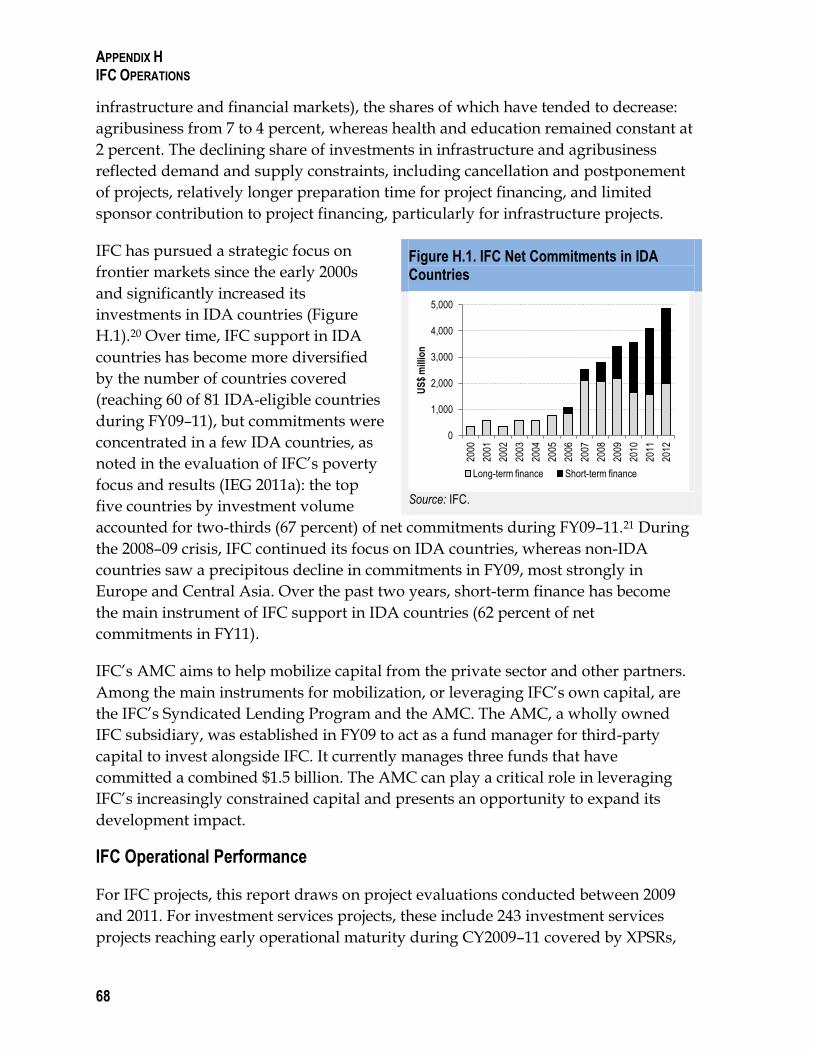
APPENDIX H IFC OPERATIONS
68
infrastructure and financial markets), the shares of which have tended to decrease:
agribusiness from 7 to 4 percent, whereas health and education remained constant at
2 percent. The declining share of investments in infrastructure and agribusiness
reflected demand and supply constraints, including cancellation and postponement
of projects, relatively longer preparation time for project financing, and limited
sponsor contribution to project financing, particularly for infrastructure projects.
IFC has pursued a strategic focus on
frontier markets since the early 2000s
and significantly increased its
investments in IDA countries (Figure
H.1).20 Over time, IFC support in IDA
countries has become more diversified
by the number of countries covered
(reaching 60 of 81 IDA-eligible countries
during FY09–11), but commitments were
concentrated in a few IDA countries, as
noted in the evaluation of IFC’s poverty
focus and results (IEG 2011a): the top
five countries by investment volume
accounted for two-thirds (67 percent) of net commitments during FY09–11.21 During
the 2008–09 crisis, IFC continued its focus on IDA countries, whereas non-IDA
countries saw a precipitous decline in commitments in FY09, most strongly in
Europe and Central Asia. Over the past two years, short-term finance has become
the main instrument of IFC support in IDA countries (62 percent of net
commitments in FY11).
IFC’s AMC aims to help mobilize capital from the private sector and other partners.
Among the main instruments for mobilization, or leveraging IFC’s own capital, are
the IFC’s Syndicated Lending Program and the AMC. The AMC, a wholly owned
IFC subsidiary, was established in FY09 to act as a fund manager for third-party
capital to invest alongside IFC. It currently manages three funds that have
committed a combined $1.5 billion. The AMC can play a critical role in leveraging
IFC’s increasingly constrained capital and presents an opportunity to expand its
development impact.
IFC Operational Performance
For IFC projects, this report draws on project evaluations conducted between 2009
and 2011. For investment services projects, these include 243 investment services
projects reaching early operational maturity during CY2009–11 covered by XPSRs,
Figure H.1. IFC Net Commitments in IDA Countries
Source: IFC.
0
1,000
2,000
3,000
4,000
5,000
2000
2001
2002
2003
2004
2005
2006
2007
2008
2009
2010
2011
2012
US
$ m
illio
n
Long-term finance Short-term finance

APPENDIX H IFC OPERATIONS
69
randomly selected from 522 projects approved between CY2004 and 2006,
representing a 47 percent coverage rate. For advisory services projects, findings are
based on 275 project completion reports (PCRs) validated by IEG for projects that
closed in FY08–10. Non-client-facing advisory services projects (that is, those
addressing IFC’s internal strategy formulation or capacity building) are not included
in IEG validations. IEG validated all 160 PCRs for client-facing projects closed in
2008 and 2009 (100 percent coverage). For projects closed in FY10, IEG validated 115
PCRs randomly selected out of a population of 144 (80 percent coverage rate). These
projects were approved between 2005 and 2010. IEG excludes from the population
PCRs prepared for non-client facing and/or knowledge management Advisory
Services projects.
The tables at the end of this appendix provide more details about the scope and
ratings given to various aspects of IFC operations. Table H.1 provides information
on the sample of investments covered in the project evaluations conducted between
CY2009 and CY2011. Table H.2 presents information on trends for new
commitments. Tables H.3 and H.4 provide information on ratings for evaluated IFC
investment operations by various categories. Tables H.5 and H.6 present the
summary of results of the regression analysis of determinants of development
outcomes conducted for IFC projects evaluated between 2000 and 2010. The
remaining part of this section presents the main features of the performance of IFC-
supported projects, based on project evaluations. The review covers IFC’s long-term
finance products, as the short-term finance operations have not been evaluated by
IEG.22
DEVELOPMENT OUTCOME RATINGS
The development outcome ratings of IFC-supported projects did not change
significantly in recent years. Sixty-eight percent of the 243 mature investment
operations evaluated in 2009–11 had development outcome ratings of mostly
successful or higher, compared with 72 percent of the 176 operations in the 2006–08
cohort, based on three-year rolling averages (results for 2011 include preliminary
ratings). Projects rated mostly successful or higher on balance meet or exceed
financial, economic, environmental, and social performance benchmarks and
contribute more broadly to the development of the private sector in the local
economies.
On an annual basis, development outcome ratings of rated projects peaked in 2008
(75 percent mostly successful or higher) and have since declined to 61 percent for the
most recent 2011 cohort. The investment outcomes for IFC projects, measuring the
profitability of IFC’s investments, have remained strong, with 82 percent rated

APPENDIX H IFC OPERATIONS
70
satisfactory or better for the 2009–11 cohort of evaluations. Investment results for
equity operations have remained below those for loans (56 percent satisfactory or
higher versus 92 percent, respectively, for 2009–11).23 This reflects the high-
risk/high-reward nature of equity investments, coupled with an expectation that in
the aggregate, IFC’s portfolio of equity investments would contribute positively to
profitability.
The underlying reasons for the decline in performance present a complex picture.
They include direct and indirect effects of the 2008–09 global financial crisis on IFC’s
portfolio, specific regional or industry factors, and internal factors related to IFC’s
work quality. Previous IEG studies have observed that development results were
significantly better for projects approved post-crisis than pre-crisis. Projects begun
shortly before the crisis did not have sufficient time to build institutions and
capacity before experiencing an adverse external operating environment.
Investments in IBRD countries have performed strongly, but evaluated operations in
IDA-eligible countries, an area of growth for IFC, have seen a statistically significant
decline in performance. The ratings for projects in non-IDA countries remained at a
very high level despite the more challenging global economic environment: 75
percent of evaluated projects were rated mostly successful or higher during 2009–11,
versus 73 percent for 2006–08. In contrast, just over half (52 percent; 36 of 69
projects) of projects in IDA countries that were evaluated in 2009–11 were rated
mostly successful or higher for development outcomes, compared with 73 percent
(30 of 41) for the 2006–08 cohort, which had the strongest performance of IDA
projects in IFC’s portfolio to date. The long term average for projects in IDA
countries evaluated over the period 2000–11 is 57 percent. The results of the more
recent cohort (2009–11) reflect projects approved in 2004–06 as part of the increased
focus on IDA countries following the adoption of IFC’s frontier market strategy in
about 2000. The decline in performance in IDA countries reflects weak results in
financial markets projects (53 percent mostly successful or higher outcome ratings,
18 of 34 projects), which comprise the largest cluster in the cohort of evaluated
projects. The financial sector accounted for half of IDA projects (34 of 69 projects).
Regionally, the weakest results were recorded for IDA projects in the Middle East
and North Africa (30 percent; 3 of 10 projects) and Europe and Central Asia (45
percent, 5 of 11), whereas Sub-Saharan Africa projects performed close to the
average (50 percent, 8 of 16). Results in the Middle East and North Africa largely
reflected the performance of projects in Pakistan and the challenging political and
business environment in the country. Projects in IDA countries in Sub-Saharan
Africa showed low performance in infrastructure and financial markets. The Europe
and Central Asia Region’s performance was driven by the effects of the 2008–09

APPENDIX H IFC OPERATIONS
71
crisis on financial markets projects, which achieved a success rate of only 33 percent
(3 of 9).
The increasing gap between project performance in IDA and IBRD countries
observed over the past three years is caused by a number of factors including: the
higher risk of operations in those countries; issues related to IFC’s work quality;
effects of the global financial crisis of 2008–09; and specific regional and industry
factors.24 Regarding the riskiness and complexity of the business environment, IFC
projects in IDA countries typically face higher risks (market risks and sponsor risks
are higher than for non-IDA countries). Improvements in the country’s business
climate, which are associated with better development outcomes for IFC projects,
have been more limited in IDA countries than in non-IDA countries.
Aspects of IFC’s project execution and role suffered significant declines for projects
in IDA countries. The assessment of IFC’s work quality considers three indicators: (i)
quality of screening, appraisal, and structuring, (ii) quality of supervision, and (iii)
IFC’s role and contribution. Between 2006–08 and 2009–11, positive ratings for IFC’s
work quality fell from 78 percent to 59 percent. This was driven by low ratings for
IFC’s screening, appraisal, and structuring (59 percent) and for IFC’s role and
contribution where positive ratings fell from 83 percent to 60 percent. In contrast,
supervision quality remained high (83 percent for 2009–11). The declines for both
overall work quality ratings and IFC’s role and contribution are statistically
significant. Ratings for IFC’s appraisal quality and at-entry role and contribution
largely reflect practices and quality standards at the time the evaluated projects were
approved (2004–06). IFC has put in place changes affecting its organization, business
processes and systems, and staffing, including increased local presence, deployment
of more senior staff in the field, and enhanced integrity due diligence on project
sponsors.25 It is too early to assess the impact, if any, of these initiatives on IFC’s work
quality and, ultimately, on its development impact.
IEG analysis indicates that IFC’s work quality is the most important determinant of
the likelihood of achieving positive development outcome ratings in IDA countries.
Building on a model presented in Results and Performance of the World Bank Group
2011 (IEG 2011h), IEG conducted a regression analysis including variables thought
to affect development outcomes for XPSRs completed in 2000–10.26 For this cohort of
projects, IFC work quality was the main determinant of development outcomes.27
Excluding IFC-internal work quality factors from the analysis indicates that sponsor
risk is the main factor influencing development outcomes.
The evaluation findings of projects evaluated in 2009–11 corroborate the importance
of IFC’s work quality for achieving success. For the cohort of projects evaluated in

APPENDIX H IFC OPERATIONS
72
2009–11, positive development outcomes in IDA countries were associated with
satisfactory work quality: projects with high work quality had a 73 percent success
rate. Similarly, projects with low work quality ratings were far more likely to fail
from a development point of view (24 percent development outcome success rate).
IEG reviewed the issues that led to low work quality ratings for IDA projects (22
projects that had both low development outcome and work quality ratings). Among
financial sector projects, shortcomings were related to appraising the ownership
structure or political exposure of the bank’s shareholders, failure to fully appraise
the status of environmental and social management systems or to include E&S
requirements in legal documents, failure to address corporate governance issues,
and passive supervision that did not provide assistance to clients regarding their
risk management and portfolio supervision. The main work quality issues for non-
financial sector projects were incorrect E&S categorization at appraisal and thus a
lost opportunity to achieve impact in a material area; overestimating management
capacity, financial viability, or growth prospects of the company; support to projects
with unsuitable sponsors and being too accommodating to sponsors; and lack of
leverage over the client.
IEG also reviewed IDA projects with low IFC role and contribution (28 projects) and
found several of issues such as weak justification for IFC financing or limited
financing role (for instance, due to early prepayments) (39 percent); a passive or
nonspecific role for IFC in the project (36 percent); and weak commitment of clients
in raising standards/limited leverage of IFC in influencing client’s decisions (21
percent). Twelve of 28 projects rated low for IFC’s role and contribution in IDA
countries were in India. Focused efforts to enhance the work quality of projects in
IDA countries would be advisable to address shortcomings in IFC’s work quality
and enhance the chance of projects success.
Development Outcome Ratings by Industry Cluster and Region
Among the industry clusters, the performance of financial markets projects—IFC’s
largest and fastest growing cluster—declined and was lower than for other clusters,
as the financial crisis revealed underlying structural and institutional problems
associated with financial intermediaries. Overall, 64 percent of financial markets
projects had mostly successful or higher outcomes, compared with 75 percent for
2006–08 (not statistically significant) (Figure H.2.A). Results were low for financial
markets projects in Europe and Central Asia (51 percent mostly successful and
higher, 21 of 41 projects) and East Asia and Pacific (58 percent, seven of 12 projects),
but financial markets projects performed largely successfully in South Asia (100
percent, 4 projects), the Middle East and North Africa (77 percent, 10 of 13), and

APPENDIX H IFC OPERATIONS
73
Latin America and the Caribbean (76 percent, 16 of 21). The decline in development
outcome ratings was mirrored by a statistically significant decrease in the
proportion of projects with positive business success ratings, from 70 percent to 53
percent (for 2006–08 and 2009–11, respectively).
In contrast, the performance of investments in the MAS industry cluster has
improved. Ratings for this cluster have long been among the lowest for IFC (they
had a success rate of 49 percent in 2003–05). However, for the 2009–11 cohort of
evaluated projects, 74 percent of manufacturing, agribusiness, and services projects
achieved mostly successful or higher development outcome ratings, compared to 68
percent of those evaluated during 2006–08. The improvement in performance is
based on a number of factors, including a change in IFC’s strategy of engaging in
traditionally challenging sectors, such as agribusiness and tourism, and
improvements in IFC’s work quality in this area. The changes in the performance of
IFC industry clusters, however, were not statistically significant.
Figure H.2. Development Outcome and Work Quality Ratings (2000–11)—Financial Markets, Infrastructure, and MAS
A. Development Outcome Ratings B. IFC Work Quality Ratings
Source: IEG data. Note: DO = development outcome; FM = financial markets; INFRA = infrastructure and natural resources; MAS = manufacturing, agribusiness, and services; WQ = work quality.
IEG’s analysis of the drivers of results for each industry cluster confirms the
significance of IFC’s work quality. For the 2000–10 cohort of evaluated projects,
industry clusters had different sensitivities to risks: for financial markets projects,
sponsor quality and changes in business environment matter; for infrastructure and
natural resources projects only sponsor quality was significant. MAS projects were
sensitive to sponsor quality, market risk, changes in the business climate, and the
0%
10%
20%
30%
40%
50%
60%
70%
80%
90%
100%
Per
cent
of p
roje
cts
with
mos
tly s
ucce
ssfu
l or
high
er D
O
0%
10%
20%
30%
40%
50%
60%
70%
80%
90%
100%
Per
cent
of p
roje
ct w
ith s
atis
fact
ory
or b
ette
r W
Q
FM
INFRA
MAS

APPENDIX H IFC OPERATIONS
74
type of project (greenfield versus expansion). When adding IFC’s work quality to
the analysis, sensitivity to risks is reduced.
For financial markets projects, business climate is mitigated by IFC’s work quality
(all of which matter: appraisal, supervision, and role and contribution). By contrast,
appraisal quality and role and contribution can mitigate risks in infrastructure
projects, pointing to the importance of high-quality appraisal and structuring of
such projects, as supervision is less likely to influence project outcomes. For MAS
projects, the project type risk remains even though work quality mitigates other
risks: greenfield MAS projects pose a higher risk that needs to be carefully managed.
Among the regions, Latin America and the Caribbean remains the strongest in terms
of development outcome ratings (78 percent), whereas the ratings in Europe and
Central Asia (68 percent) and South Asia (60 percent) have declined. Results in
Europe and Central Asia—by far the largest region in terms of evaluated projects in
2009–11—were affected by the impact of the global financial crisis especially on the
financial markets portfolio (as discussed above), and poor results for evaluated
projects in Russia (45 percent mostly successful or higher; 10 of 22 projects) that
were due to weak sponsors, corporate governance issues, and the difficult business
environment. These risks are magnified as IFC moves into frontier regions in Russia
and supports second-tier clients. Results in the Middle East and North Africa
improved (67 percent) but remained challenging, given the volatile situation
following the political changes in 2011 (Figure H.3).
Figure H.3. IFC Development Outcome Ratings by Region
Source: IEG. Note: Global projects are not shown. None of the changes is statistically significant at 95 percent and 90 percent of confidence level. Regions: EAP = East Asia and Pacific; ECA = Europe and Central Asia; LAC = Latin America and the Caribbean; MENA = Middle East and North Africa; SAR = South Asia.
83 81
50 50
81
53
72 78
68 68 67 60 58
68
0
20
40
60
80
100
LAC (n=48; n=54)
ECA (n=54; n=78)
EAP (n=28; n=40)
MENA (n=12; n=21)
SAR (n=16; n=20)
AFRICA (n=15; n=24)
IFC (n=176; n=242)
Per
cen
tag
e o
f p
roje
cts
wit
h
hig
h d
evel
op
men
t o
utc
om
e
2006-08 2009-11
APPENDIX H IFC OPERATIONS
75
Advisory Services
IFC advisory services continued to be an important means of engagement with
clients, particularly in the poorest countries and in countries with more difficult
business environments. IFC has sought to enhance the focus and selectivity of its
advisory services. Its strategy has also evolved considerably, reflecting the goal of
enhanced focus and better alignment with IFC’s strategic priority areas. In
implementing its strategy, IFC has identified targets for its work in IDA countries,
fragile and conflict-affected states, and climate change–related work, among others.
After a period of rapid growth in the 2000s, IFC’s Advisory Service operations have
gone through a phase of consolidation. IFC’s advisory services grew more than
tenfold in expenditures and sixfold in staffing between FY01 and FY10.28 However,
the number of new client-facing projects approved has declined since FY08, from 212
to 118 in FY11, although project expenditures for client-facing advisory projects
increased from $132 million in FY08 to $182 million in FY11. The total number of
different Advisory Service products offered decreased from 50 to 32, organized in
four business lines.29 This reflected a strategic decision to reform and better focus
IFC’s Advisory Service line; enhance results focus and measurement; strengthen
alignment between advisory and investment services; refine organization and
accountabilities; and strengthen staffing, knowledge, and funding models.
Access to Finance and Sustainable Business Advisory continue to be the two largest
business lines in terms of the number of new projects, representing 39 percent and
28 percent, respectively, of new approved advisory projects during FY10–11. By
project expenditure, the Sustainable Business Advisory, Access to Finance, and
Investment Climate business lines each accounted for just below 30 percent of the
total. The share of the Sustainable Business line has declined in both the number of
projects and the level of project expenditures during the past two years, although
the Access to Finance business line is growing.
IFC has enhanced the focus of its Advisory Services in IDA countries. Projects in
IDA countries accounted for 60 percent of total Advisory Service projects (51 percent
of client-facing project expenditure) in FY10–11.30 This compares with an average of
40 percent of client-facing project expenditures during FY08–09, indicating good
progress in achieving its objective of having a 67 percent share of advisory service
project spend in IDA countries by FY14. By region, new projects were concentrated
in South Asia (23 percent) and Sub-Saharan Africa (21 percent) during FY10–11; Sub-
Saharan Africa (28 percent) had by far the largest total expenditures among regions.

APPENDIX H IFC OPERATIONS
76
Of projects that closed in FY08–10,31 58 percent of advisory service projects achieved
mostly successful or higher development effectiveness, meaning that they delivered
relevant and measurable development benefits to clients. A downward trend has
been observed for development effectiveness ratings since systematic evaluation of
advisory service began in FY08, with projects that closed in FY10 achieving a 51
percent success rate versus 65 percent (FY08).
Based on results for FY08–10 closed projects, Access to Finance projects performed
strongest (69 percent success rate), and the public-private partnership business line
(46 percent) had the lowest development effectiveness ratings. Access to Finance
advisory services is currently the largest business line and one that IFC expects to
grow. Contrary to investment operations, advisory service projects in IDA countries
performed on a par with projects in non-IDA countries.
Overall, almost four-fifths (79 percent) of advisory services projects rated high for
achieving their immediate outputs. A majority of projects (59 percent) were rated
satisfactory or higher for their achievement of outcomes. However, projects rated
low (39 percent success rate) for the achievement of longer-term impacts (such as
higher financial intermediation in a target group, the implementation of a public-
private partnership project). A modest proportion of projects could be evaluated for
their impact achievement: fully 61 percent could not be rated in this dimension. This
was mainly because of projects that had yet to achieve their expected impacts at the
time of completion, which highlights the need to conduct post-completion follow-up
when intended impacts are expected to be achieved.32
About three-quarters of evaluated projects were strategically well aligned with
country strategies, fit political and economic conditions in the country, and had
selected the right client. Projects that failed to be strategically relevant showed low
client commitment during implementation (because of political economy issues and
effects of the financial crisis), lacked relevance for the client or the market, or
showed a lack of IFC understanding of the market gap it intended to fill. Separately
from development effectiveness, IEG rates IFC’s role and contribution, which looks
at whether IFC played a catalytic or innovative role, or a unique role that could not
be easily filled by others. Eighty percent of projects had positive ratings in this
respect. Negative ratings indicated flaws in project design or implementation that
prevented IFC from fulfilling its expected role.
The quality of project design is key to the success of advisory service projects, as 72
percent of unsuccessful projects had poor design. Thirty-eight percent of evaluated
projects had poor project design. These included the lack of identification of proper
indicators and baseline data, the lack of a proper needs or market assessment, and

APPENDIX H IFC OPERATIONS
77
lack of clear objectives with realistic outputs and impacts and adequate mix of
activities to achieve intended objectives.
For Access to Finance, projects providing advice to IFC investment clients
performed well and were relevant to the client. For Investment Climate advisory
services, projects with programmatic or phased interventions and those that
retained client commitments throughout implementation were more successful.
Successful projects had a link to another advisory service, as part of a program in the
region; half of these projects have led to a follow-up advisory services intervention.
Identifying the right counterpart in the country and understanding the political
priorities was a key success driver. Sustainable business advisory projects benefited
from good pre-implementation work (such as market and needs assessments)
during the project design phase and customized replication of successful models.
For public-private partnership projects, the main determinant of poor project
performance was lack of client commitment. Challenging political environments and
obstacles and IFC work quality shortcomings drove low development effectiveness
ratings. Although in many instances, teams identified the main risks facing the
projects correctly, IFC’s project preparation and design fell short, and it lacked a
more proactive approach to mitigate and manage the identified risks. Earlier and
more active client and broader stakeholder engagement during design and
implementation, and sequencing of projects in high-risk environments could
enhance the chances of project success.
IEG found that results for IFC advisory services that are linked to investment
projects33 are similar to those of projects without such links (IEG 2009d). IFC has
sought to strengthen the link between advisory and investment services, to increase
synergies and development impact through a more programmatic approach.
Overall, more than one-third of Advisory Services projects (closed in FY08–10) in
IEG’s database of evaluated projects were linked to existing investment projects (37
percent). The majority of access to finance projects evaluated (63 percent) and a
significant share of sustainable business advisory projects (43 percent) were linked
to an investment services project. Conversely, there was limited scope for linkages
for investment climate and public-private partnerships projects.34 Sixty-two percent
(49 of 79) of linked advisory service projects had high success ratings, compared
with 56 percent (76 of 135) for projects without a link to investments; this is not a
significant difference. The nature of linked projects and transmission mechanisms
that are expected to lead to better outcomes has to be better understood.

APPENDIX H IFC OPERATIONS
78
Table H.1. Representativeness of the CY2009–11 Net Approvals Population
Number of investments Value of investments ($ millions)
CY2009–11
XPSRs
CY2004–06
NAP (c) =
CY2009–11
XPSRs CY2004–06 NAP (c) =
(a) (b) (a)/(b) (a) (b) (a)/(b)
No. % No. % % Amt. % Amt. % %
255 100 522 100 49 6,553 100 13,393 100 49
Net IFC:
Mean - 24.4 - 25.6 -
Median - 15.0 - 17.0 -
Investment Size:
X=<7.27 49 19 103 20 48 171 3 346 3 49
7.27<X=<57.21 166 65 337 65 49 3,289 50 6,882 51 48
X>32.91 40 16 82 16 49 3,092 47 6,165 46 50
255 100 522 100 49 6,553 100 13,393 100 49
Instruments:
Equity only 64 25 124 24 52 1,450 22 2,874 21 50
Other 191 75 398 76 48 5,102 78 10,519 79 49
255 100 522 100 49 6,553 100 13,393 100 49
Sectors:
Financial markets 118 46 244 47 48 2,961 45 6,075 45 49
Non-financial markets 137 54 278 53 49 3,592 55 7,318 55 49
255 100 522 100 49 6,553 100 13,393 100 49
Departments:
Agribusiness 20 8 41 8 49 503 8 955 7 53
Global Financial Markets Group 95 37 196 38 48 2,643 40 5375 40 49
Global Inform. & Comm. Tech. 14 5 26 5 54 203 3 429 3 47
Global Manufacturing & Services 43 17 89 17 48 1,356 21 2501 19 54
Health and Education 10 4 19 4 53 114 2 208 2 55
Infrastructure 29 11 59 11 49 667 10 1607 12 42
Oil, Gas, Mining And Chemicals 22 9 46 9 48 765 12 1649 12 46
Private Equity & Investment Funds 22 9 46 9 48 302 5 669 5 45
255 100 522 100 49 6,553 100 13,393 100 49
Regions:
Sub-Saharan Africa 26 10 56 11 46 639 10 1267 9 50
East Asia and Pacific 41 16 86 16 48 979 15 1992 15 49
South Asia 20 8 40 8 50 541 8 919 7 59
Central and Eastern Europe 44 17 94 18 47 770 12 2152 16 36
Southern Europe and Central Asia 38 15 73 14 52 1313 20 2274 17 58
Latin America & Caribbean 59 23 118 23 50 1612 25 3697 28 44
Middle East and North Africa 22 9 47 9 47 655 10 1010 8 65
World 5 2 8 2 63 45 1 82 1 55
255 100 522 100 49 6,553 100 13,393 100 49
Indicative Performance:
(as of 12/30/2011)
(i) all investments:a
With loss reserves 7 3 14 3 50 144 2 621 5 23
Without loss reserves 248 97 508 97 49 6,409 98 12,772 95 50
255 100 522 100 49 6,553 100 13,393 100 49
(ii) equity only:a
With loss reserves 1 2 3 2 - 75 5 151 5 -
Without loss reserves 63 98 136 98 46 1,375 95 2,723 95 51
64 100 139 100 46 1,450 100 2,874 100 50
(iii) all investments:b
With write-offs 39 15 82 16 48 1,124 17 2,079 16 54
Without write-offs 216 85 440 84 49 5,429 83 11,314 84 48
255 100 522 100 49 6,553 100 13,393 100 49
Status:
Active 200 78 407 78 49 5,292 81 10,843 81 49
Closed 55 22 115 22 48 1,261 19 2,550 19 49
255 100 522 100 49 6,553 100 13,393 100 49
Countries (incl. regional): 68 78
Source: IEG data. a. Amounts with loss reserves are the IFC approved investments that are affected by loss reserves (and not the actual amount reserved). b. Amounts with write-offs are the IFC approved investments that are affected by write-offs (and not the actual amount written-off).

APPENDIX H IFC OPERATIONS
79
Table H.2. IFC Investments: Commitments FY06–11
IFC INVESTMENTS No of
investments FY06–08
Total net commitment
(US$M) FY06–08
No of investments
FY09–11
Total net commitment
(US$M) FY09–11
Share of total (by$)
FY06–08
Share of total (by$)
FY09–11
Growth in $ commitment
between FY06–08 and FY09–11
By development goal
I. Expanding Economic Opportunities and Strengthening Institutions 806 16,436 875 24,015 70% 79% 46%
II. Building Infrastructure for Growth 209 6,335 283 5,589 27% 18% -12%
III. Enhancing Human Development 54 634 44 745 3% 2% 18%
Global Product Group 0 0 5 67 0% 0.2%
Total 1,069 23,405 1,207 30,416 100% 100% 30%
By Region
East Asia and the Pacific 164 2,716 164 3,709 12% 12% 37%
Europe and Central Asia 278 6,087 271 6,704 26% 22% 10%
Latin America and the Caribbean 234 5,526 293 7,500 24% 25% 36%
Middle East and North Africa 128 3,081 93 3,389 13% 11% 10%
South Asia 96 2,515 121 2,189 11% 7% -13%
Sub-Saharan Africa 154 3,118 232 5,768 13% 19% 85%
WORLD 15 361 33 1,157 2% 4% 220%
Total 1,069 23,405 1,207 30,416 100% 100% 30%
By cluster
FM 533 10,582 603 19,254 45% 63% 82%
MAS 327 6,488 316 5,506 28% 18% -15%
INFRA 209 6,335 283 5,589 27% 18% -12%
GPD 0 0 5 67 0% 0.2%
By industry group
Financial Markets 377 7,107 392 6,755 30% 22% -5%
Funds 68 1,004 74 2,003 4% 7% 100%
Trade Finance (TF) 88 2,471 137 10,496 11% 35% 325%
Agribusiness & Forestry 103 1,889 104 1,491 8% 5% -21%
Manufacturing 111 2,875 99 2,422 12% 8% -16%
Consumer & Social Services 111 1,722 104 1,443 7% 5% -16%
Other MAS Sectors 2 2 9 149 0% 0% 6796%
Infrastructure 103 3,632 149 3,732 16% 12% 3%
Telecom & IT 47 863 59 1,126 4% 4% 30%
Other Infra Sectors 5 52 6 188 0% 1% 260%
Oil, Gas & Mining 54 1,788 69 543 8% 2% -70%
Global Product Group (CBG/CSG) 0 0 5 67 0% 0.2%
By IDA/non-IDA
IDA 350 6,389 471 11,016 27% 36% 72%
non-IDA 636 15,662 617 15,750 67% 52% 1%
Region and World 83 1,354 119 3,650 6% 12% 170%
By instrument
Equity 317 3,767 405 5,593 16% 18% 48%
Loan 686 16,799 747 23,198 72% 76% 38%
Equity and Loan 66 2,839 55 1,625 12% 5% -43%
By Country's Income level
Low income 100 1,023 153 1,752 4% 6% 71%
Middle income 846 20,517 920 24,731 88% 81% 21%
High income 40 512 15 283 2% 1% -45%
Not applicable 83 1,354 119 3,650 6% 12% 170%
Total 1,069 23,405 1,207 30,416 100% 100% 30%
Source: IEG data. Note: Investments with recurring commitments were counted only once in the year of their first commitment.

APPENDIX H IFC OPERATIONS
80
Table H.3. IFC Investments: Development Outcomes CY06–11
IFC EVALUATED INVESTMENT PROJECT RATINGS
Development Outcome Percent
HIGH (3-year rolling averages)
Project Business Success Percent
SAT (3-year rolling averages)
Economic Sustainability
Percent SAT (3-year rolling averages)
Environmental & Social
Sustainability Percent SAT (3-year
rolling averages)
Private Sector Development
Percent SAT (3-year rolling averages)
2006–
08 2009–
11 2006–
08 2009–
11 2006–
08 2009–
11 2006–
08 2009–
11 2006–
08 2009–
11
PROJECT RATINGS BY DEVELOPMENT GOAL
I. Expanding Economic Opportunities 70% 68% 67% 60% 77% 68% 56% 63% 79% 81% II. Building Infrastructure for Growth 72% 68% 64% 66% 79% 68% 85% 80% 77% 72% III. Enhancing Human Development 100% 78% 67% 67% 100% 78% 100% 78% 100% 89%
Grand Total 72% 68% 66% 61% 78% 68% 63% 67% 79% 79%
PROJECT RATINGS BY IBRD/IDA
IDA & Blend 73% 52% 63% 53% 85% 60% 54% 65% 73% 64% Non-IDA 73% 75% 70% 66% 78% 72% 66% 66% 82% 86% Not applicable 61% 70% 50% 56% 67% 72% 70% 76% 72% 78%
Grand Total 72% 68% 66% 61% 78% 68% 63% 67% 79% 79%
PROJECT RATINGS BY LIC/MIC
Low Income 73% 54% 80% 50% 80% 50% 50% 80% 70% 79% Lower middle income 66% 62% 57% 58% 81% 69% 59% 64% 74% 72% Upper middle income 78% 74% 72% 67% 81% 70% 69% 65% 85% 85% High income 50% 88% 67% 75% 67% 75% 25% 80% 67% 75% Not applicable 56% 65% 44% 48% 63% 67% 67% 79% 69% 78%
Grand Total 72% 68% 66% 61% 78% 68% 63% 67% 79% 79%
PROJECT RATINGS BY INSTRUMENT TYPE
Equity 69% 62% 54% 47% 73% 63% 62% 79% 77% 80% Loan 77% 70% 72% 64% 84% 71% 64% 68% 82% 77% Equity and loan 56% 68% 65% 68% 65% 65% 67% 48% 70% 86%
Grand Total 72% 68% 66% 61% 78% 68% 63% 67% 79% 79%
PROJECT RATINGS BY CLUSTER
FM 75% 64% 70% 53% 83% 68% 55% 70% 81% 77% INFRA 72% 68% 64% 66% 79% 68% 85% 80% 77% 72% MAS 68% 74% 63% 70% 73% 69% 61% 56% 78% 87%
Grand Total 72% 68% 66% 61% 78% 68% 63% 67% 79% 79%
PROJECT RATINGS BY REGION-7
Sub-Saharan Africa 53% 58% 50% 48% 57% 60% 58% 67% 64% 80% East Asia and Pacific 50% 68% 50% 60% 58% 67% 72% 53% 65% 83% Europe and Central Asia 81% 68% 76% 56% 87% 64% 70% 76% 83% 77% Latin America & Caribbean 83% 78% 77% 76% 91% 80% 64% 64% 91% 85% Middle East and North Africa 50% 67% 42% 62% 50% 76% 50% 53% 75% 71% South Asia 81% 60% 69% 65% 94% 65% 46% 75% 69% 75% WORLD 33% 60% 33% 40% 33% 50% 0% 100% 67% 60%
Grand Total 72% 68% 66% 61% 78% 68% 63% 67% 79% 79%
PROJECT RATINGS BY INDUSTRY GROUP CLASSIFICATION
Agribusiness & Forestry 71% 71% 72% 68% 78% 68% 36% 53% 83% 87% Consumer & Social Services 82% 68% 59% 53% 82% 58% 71% 71% 82% 74% Financial Markets 74% 65% 70% 58% 82% 70% 49% 68% 80% 75% Funds 80% 53% 70% 20% 90% 47% 88% 85% 90% 87% Infrastructure 94% 73% 76% 69% 100% 73% 94% 88% 94% 65% Manufacturing 60% 86% 61% 83% 61% 79% 74% 56% 70% 97% Oil, Gas & Mining 60% 71% 80% 79% 80% 71% 60% 64% 60% 100% Other FM Sectors N/A N/A N/A N/A N/A N/A N/A N/A N/A N/A Other Infra Sectors 100% N/A 100% N/A 100% N/A 100% N/A 100% N/A Other MAS sectors 0% 33% N/A 67% N/A 33% 0% 0% N/A 67% Telecom & IT 47% 54% 40% 46% 53% 54% 75% 100% 60% 54%
Grand Total 72% 68% 66% 61% 78% 68% 63% 67% 79% 79%
Source: IEG data.

81
Table H.4. IFC Investments: IFC Investment Outcomes and Work Quality CY06–11
IFC EVALUATED INVESTMENT PROJECT RATINGS Investment Outcome Percent SAT (3-year
rolling averages)
Loan Investment Outcome Percent SAT
(3-year rolling averages)
Equity Investment Outcome Percent SAT
(3-year rolling averages)
IFC Work Quality Percent SAT (3-year
rolling averages)
IFC Appraisal Work Quality Percent SAT
(3-year rolling averages)
IFC Supervision Work Quality Percent SAT
(3-year rolling averages)
Work Quality—IFC Role & Contribution Percent SAT (3-year
rolling averages)
2006–08 2009–11 2006–08 2009–11 2006–08 2009–11 2006–08 2009–11 2006–08 2009–11 2006–08 2009–11 2006–08 2009–11
PROJECT RATINGS BY CORE DEVELOPMENT GOAL
I. Expanding Economic Opportunities 77% 81% 91% 93% 60% 52% 77% 72% 72% 70% 85% 80% 81% 77% II. Building Infrastructure 74% 83% 93% 88% 44% 71% 77% 75% 77% 70% 87% 85% 79% 72% III. Enhancing Human Development 100% 89% 100% 90% N/A 100% 100% 89% 100% 78% 100% 89% 100% 89%
PROJECT RATINGS BY IBRD/IDA
IDA & Blend 76% 70% 92% 82% 59% 46% 78% 59% 75% 59% 88% 83% 83% 60% Non-IDA 84% 89% 92% 95% 68% 68% 77% 79% 73% 75% 85% 81% 80% 84% Not applicable 39% 74% 88% 100% 21% 53% 83% 81% 78% 74% 89% 81% 89% 78%
PROJECT RATINGS BY LIC/MIC
Low Income 82% 71% 100% 75% 75% 50% 80% 71% 80% 71% 90% 86% 80% 71% Lower middle income 73% 79% 93% 91% 61% 50% 71% 63% 64% 63% 81% 78% 81% 67% Upper middle income 86% 86% 92% 93% 66% 67% 82% 79% 80% 74% 90% 84% 82% 83% High income 83% 100% 83% 100% 100% N/A 50% 88% 33% 75% 50% 75% 67% 88% Not applicable 31% 70% 83% 100% 15% 53% 81% 78% 75% 74% 88% 83% 88% 74%
PROJECT RATINGS BY INSTRUMENT TYPE
Equity 50% 56% N/A N/A 50% 56% 73% 80% 69% 71% 85% 91% 77% 69% Loan 94% 92% 94% 92% N/A N/A 82% 71% 78% 70% 86% 78% 84% 79% Equity and loan 60% 70% 80% 91% 70% 60% 70% 73% 65% 73% 90% 84% 80% 73%
PROJECT RATINGS BY CLUSTER
FM 76% 76% 95% 94% 59% 44% 77% 68% 73% 66% 86% 74% 79% 78% INFRA 74% 83% 93% 88% 44% 71% 77% 75% 77% 70% 87% 85% 79% 72% MAS 81% 89% 89% 92% 64% 73% 79% 79% 73% 77% 86% 89% 86% 77%
PROJECT RATINGS BY REGION-7
Sub-Saharan Africa 67% 64% 89% 88% 56% 42% 64% 76% 57% 72% 79% 80% 71% 80% East Asia and Pacific 55% 85% 83% 97% 47% 67% 50% 75% 54% 70% 77% 88% 62% 75% Europe and Central Asia 91% 86% 96% 93% 69% 65% 89% 76% 83% 72% 94% 77% 87% 83% Latin America & Caribbean 88% 93% 97% 96% 69% 70% 83% 80% 81% 80% 85% 80% 85% 83% Middle East and North Africa 58% 67% 67% 81% 33% 14% 75% 71% 67% 71% 75% 81% 92% 71% South Asia 81% 75% 100% 79% 63% 67% 88% 45% 81% 45% 94% 90% 81% 35% WORLD 0% 60% 0% 100% 0% 50% 67% 60% 33% 40% 67% 100% 100% 60%
PROJECT RATINGS BY NEW SECTOR CLASSIFICATION
Agribusiness & Forestry 89% 87% 88% 93% 100% 73% 78% 81% 67% 77% 83% 97% 94% 74% Consumer & Social Services 86% 89% 95% 89% 33% 100% 86% 79% 77% 79% 91% 84% 82% 79% Financial Markets 84% 85% 95% 94% 68% 58% 75% 63% 70% 62% 87% 71% 77% 76% Funds 30% 20% N/A N/A 30% 20% 90% 93% 90% 87% 80% 93% 90% 87% Infrastructure 100% 88% 100% 86% 100% 100% 94% 81% 94% 73% 94% 85% 88% 73% Manufacturing 76% 90% 86% 93% 67% 71% 74% 79% 74% 79% 83% 83% 83% 79% Oil, Gas & Mining 80% 86% 100% 100% 50% 71% 100% 93% 100% 86% 100% 86% 80% 100% Other FM Sectors N/A N/A N/A N/A N/A N/A N/A N/A N/A N/A N/A N/A N/A N/A Other Infra Sectors 100% N/A 100% N/A 100% N/A 50% N/A 50% N/A 100% N/A 100% N/A Other MAS sectors 0% 100% N/A 100% N/A 0% N/A 67% N/A 33% N/A 100% N/A 67% Telecom & IT 40% 69% 75% 78% 20% 50% 53% 46% 53% 46% 73% 85% 67% 38%
Grand Total 77% 82% 92% 92% 56% 58% 78% 73% 74% 70% 86% 81% 81% 76%
Source: IEG data.

APPENDIX H IFC OPERATIONS
82
Table H.5. Regression Results for External Variables
All XPSR
IDA and Non-IDA Industry Clusters
IDA Non-IDA FM INFRA MAS
Change in Business Climate 0.01** 0.00 0.01** 0.01** -0.00 0.01**
Sponsor -0.20** -0.16** -0.22** -0.15** -0.23** -0.22**
Market -0.15** -0.15* -0.13** -0.08 -0.11* -0.15**
Proj type -0.03 -0.01 0.03 -0.03 0.08 -0.14**
Adj A2 0.08 0.03 0.10 0.06 0.14 0.12
N 665 204 459 249 135 281
Source: IEG data. * = Significant at 90 percent confidence level. ** = Significant at 95 percent confidence level.
Table H.6. Regression Results for External and IFC Internal Variables
All XPSR
IDA versus non-IDA Industry Clusters
IDA Non-IDA FM INFRA MAS
Change in Business Climate 0.00** -0.00 0.01** 0.01 -0.00 0.01*
Sponsor -0.11** -0.07 -0.12** -0.15* -0.12 -0.08
Market -0.14** -0.04 -0.13** -0.16* -0.34 -0.14*
Proj type -0.07 -0.12 -0.05 -0.08 0.05 -0.15**
Appraisal 0.33** 0.22** 0.36** 0.21** 0.32** 0.37**
Supervision 0.29** 0.45** 0.22** 0.35** 0.07 0.26**
Roles 0.44** 0.55** 0.38** 0.48** 0.51** 0.37**
Adj A2 0.36 0.39 0.37 0.35 0.49 0.338
N 657 202 453 248 134 275
Source: IEG data. * = Significant at 90 percent confidence level. ** = Significant at 95 percent confidence level.

83
Appendix I MIGA Operations
Recent Trends in MIGA Operations
MIGA’s guarantee volume has rebounded from a decrease during the crisis. The
annual volume of guarantee issuance declined to about $1.4 billion during the
economic crisis (FY09–10), reflecting a decrease in capital flows to developing
countries. Similarly, until FY10 the number of new projects that MIGA supported
declined each year, indicating MIGA’s business has been lumpy and concentrated in
relatively few guarantee projects each year. In FY11, MIGA activities rebounded,
with guarantees totaling $2.1 billion (Figure I.1), the highest in MIGA’s history, and
it also reversed the declining trend in the number of projects supported each year.
Driven by the recent increase in the
volume of guarantees and below-average
cancellations of existing guarantees,
MIGA’s outstanding guarantee portfolio
has reached a record high. Its gross
outstanding portfolio rose to $9.6 billion as
of March 2012, up 81 percent from the
level prior to the crisis (FY07). MIGA’s net
exposure, that is, after reinsurance,
increased by a similar proportion. This
was driven by a significant drop in
MIGA’s annual portfolio runoff, especially
early cancellations, in the years since FY08, affected by above average perceptions of
risk by MIGA clients.
MIGA has made progress in diversifying its guarantee issuance. This was
overwhelmingly concentrated in the financial sector in the Europe and Central Asia
Region during FY09 and FY10, reflecting in part the strong demand for political risk
insurance from financial institutions for their subsidiaries in Europe and Central
Asia—the region most affected by the crisis. In addition, MIGA’s guarantee issuance
was also highly concentrated among a few clients.
Since FY11, its new guarantees issuance has been more balanced by sector and
region. The share of guarantees in the financial sector declined from 89 percent in
FY09 to 24 percent in FY11. Infrastructure accounted for 43 percent of guarantee
Figure I.1. MIGA Guarantee Issuance
Source: IEG and MIGA.
0
500
1,000
1,500
2,000
2,500
3,000
2000
2001
2002
2003
2004
2005
2006
2007
2008
2009
2010
2011
2012
US
$ m
illio
n

APPENDIX I MIGA OPERATIONS
84
volume (five projects) in FY11 because of strong demand in the telecom and
transport subsectors. MIGA’s new coverage against the risk of nonhonoring of
sovereign financial obligations, which is used mainly in the context of infrastructure
projects, also contributed to the increase in activities in that sector.
The recent amendments to MIGA’s Convention and Operational Regulations
addressed the most severe external constraints the agency faced and allowed MIGA
to offer new products, insure certain types of existing investments, and offer stand-
alone debt coverage—the first such changes to the Convention since MIGA’s
inception (1988). The ability to offer new product types was also a factor behind the
increase in business volume in FY11. MIGA issued guarantees for $950 million
(FY11) involving new products (approximately 45 percent of the total guarantee
amount for the year). About half of this amount was for two projects covered for
nonhonoring of sovereign financial obligations ($429 million).
Performance of MIGA Operations
For MIGA, performance issues were drawn from (i) 26 ex post guarantee project
evaluations completed in FY10–12 and underwritten by MIGA in FY01–09 (Table I.1)
and (ii) assessments of MIGA institutional effectiveness in IEG-MIGA annual reports
and thematic evaluations produced by IEG in FY09–11.
Given the limited sample size, findings for MIGA projects are not representative of
the performance of its operations as a whole. The sample of 26 projects comprises 24
selected randomly from eligible guarantee projects underwritten during FY01–08
and two projects from a purposive sample selected for a 2011 IEG report on MIGA’s
financial sector guarantees (these two projects were underwritten by MIGA in FY07
and FY09). The sample includes 19 projects directly evaluated by IEG and 7 self-
evaluations validated by IEG.
Sixty-nine percent of a sample of 26 MIGA guarantees projects evaluated in FY06–11
were rated satisfactory or higher for development outcomes. MIGA-supported
projects in the financial sector and in manufacturing, agribusiness and services
performed well (86 percent and 78 percent, respectively), meeting the established
performance benchmarks, although less than half of infrastructure projects had a
positive performance (44 percent). Some regional patterns emerge from this limited
sample: projects in Europe and Central Asia performed well, but results in Sub-
Saharan Africa and Latin America and the Caribbean were more modest. Although
projects in IDA countries demonstrated lower performance overall, those in conflict-
affected countries performed well, signaling that good development results are
possible in riskier environments.

APPENDIX I MIGA OPERATIONS
85
During the financial crisis, MIGA support to financial sector projects in Europe and
Central Asia countries ($2.1 billion in guarantees during FY09–10), as part of the
Joint IFI Action Plan, was strategically relevant in responding to demands for
political risk insurance in the region most severely affected by the crisis. It primarily
supported capital injections to subsidiaries of European banks in countries in
Europe and Central Asia. Successful financial sector projects in the region helped
countries upgrade their banking systems and introduce modern banking products
and services.
Table I.1. Evaluated MIGA Projects Reviewed
FY issued Project FY of evaluation completion
2001 JSBC Raiffeisen Bank Ukraine 2010
2002 HVB Bank Romania 2010
Hydelec BPA 2010
Lima Airport Partners S.R.L. 2006
Manila North Tollways Corporation 2010
2003 Cotecna Destination Inspection Ltd 2010
2005 MINL Ltd 2010
Anvil Mining Company 2011
SOCOMA 2012
Raiffeisen Leasing Croatia* 2012
Priorbank Minsk JSC 2012
Enser SA 2012
2006 Barclays Bank of Ghana Limited 2010
Meridian Development Limited 2010
SGS Scanning Nigeria Limited 2010
Shenzhen Water Company Ltda 2011
2007 Commercial DeltaCredit Bankb 2011
PT MTU Detroit Diesel Indonesia 2011
Areeba/MTN Afghanistana 2012
Aarti Steela 2012
Termoguayas Generationa 2012
Vila do Conde Transmissoraa 2012
Botnia SAa 2012
2008 Congo Equipment SPRL 2012
Orange Bissaua 2012
2009 ZAO Unicredit Bankb 2011
Source: IEG. a. Project self-evaluated by MIGA and validated by IEG (seven MIGA projects). b. Projects sampled purposively (two MIGA projects in the financial sector).
Positive development outcomes for MIGA-supported projects were associated with
experienced and financially strong sponsors, mostly MIGA repeat clients. Financial,
manufacturing, and service sector projects and projects in IBRD countries had better

APPENDIX I MIGA OPERATIONS
86
outcomes than projects in other sectors and those located in IDA countries. Projects
with better development outcomes tended to be profitable, met their operational
milestones, were efficient, and achieved high productivity. Projects with these
attributes continued to expand their operations despite the global financial crisis.
Projects with better development outcomes also benefitted host countries in terms of
additional fiscal revenues, increased employment, skills upgrading, and technology
transfer. Consumers gained from developmentally impactful projects through the
availability of better quality products, improved access to financing, telecom, and
other services. Projects with better development outcomes also benefitted local
companies, introduced innovative products or services, and, in some cases, set
industry standards in the host country.
Projects with less than satisfactory outcomes have suffered from continuous
financial losses and proved unsustainable due, for example, to the availability of a
more efficient, convenient, and cheaper alternative; a flawed business model; or
external factors. In the case of one agribusiness project, the collapse of international
commodity prices and a prolonged dry season compounded the effects of the project
design shortcomings and management problems, which led to government take-
over of the project. Another project was not implemented because the risk-reward
allocation between the investor and the government was economically and
politically unsustainable. Of the eight projects that had low development outcome
ratings, six had concession agreements with the national or subnational government
and one had an infrastructure license from government.
The quality of MIGA’s underwriting and monitoring has shown some improvement,
but recent cohorts of evaluated projects reveal persistent shortcomings. Although
MIGA has little direct influence over the design of the projects it supports or on their
financial success (it has limited leverage as an insurer, compared to a project
financier or lender), its mandate calls for it to underwrite projects that are financially
sound and generate positive development impact. The rating of MIGA’s work
quality is derived from good underwriting practices, as stipulated in MIGA’s own
policies and guidelines as well as industry practice relating to sound underwriting
of political risks, and requirements derived from MIGA’s mandate as a development
institution that is part of the Bank Group. Sound underwriting and monitoring also
help mitigate risk, inasmuch as they relate to the holistic assessment of risks for
which MIGA provides coverage and ensure the alignment of projects with Bank
Group strategies and policy advice.
Thirty-eight percent of evaluated MIGA projects had satisfactory or higher ratings
for underwriting, assessment, and monitoring. Improvements among the cohort of
FY06–11 evaluated projects have been in the following areas: more comprehensive
APPENDIX I MIGA OPERATIONS
87
assessment of project risks, including political, commercial, and reputational risks;
more attention paid to the assessment of the project’s financial viability and
economic sustainability, including economic distortions; systematic assessment of
environmental and social aspects of projects, now including financial sector projects;
more detailed analysis of sector issues in projects; and more examples of following
up on E&S requirements specified in the contract of guarantee.
Conversely, common shortcomings identified in MIGA self-evaluations and direct
evaluations by IEG include inadequate analysis of development risks including
business viability and project sustainability risks (six projects); insufficient follow-up
on requirements in the contract of guarantee relating to environmental, social
documentation, and monitoring reports (seven projects) and in general to keep
MIGA abreast of relevant project-specific issues throughout the duration of the
guarantee (four projects); and missing files of key project documents and
requirements directly relating to the risks MIGA is covering (seven projects).
Evaluations also showed lack of consideration of sustainability risks in public-
private partnerships primarily related to imperfect risk allocation (five instances—
three of which related to projects where the government took most of the risks or
provided high subsidies to make the project viable; in two cases structures were not
advantageous for concessionaires due to allocation of contracts based on the
expected revenue for the government, that is, the ―winner’s curse‖) and the ability of
government entities to comply with obligations (two projects); and instances of
disconnect between project features and arrangements presented to the Board and
what is negotiated in the contract of guarantee (two projects).
MIGA’s new product range will have implications for its assessment work and for
measuring results. As noted above, the share of new coverage types, such as for
nonhonoring of sovereign financial obligations and coverage for existing
investments, has been substantial since FY11. However, experience to date with new
products also shows that these may require changes in MIGA’s approach to
assessing the financial and economic impacts of such projects. For one thing, it is
inherently challenging to conduct due diligence to assess the financial viability or
development impact of guarantees supporting existing investments, or portfolios of
investments, or for capital market transactions. Second, the relationship between
MIGA’s guarantee holder to the underlying project becomes potentially more
tenuous for new types of coverage, when it guarantees the risk of nonpayment of
loans for construction. These have a finite duration, limiting MIGA’s leverage to
obtain project information. Third, assessing payment risk for financial guarantees
issued by governments and subsovereign entities requires different kinds of
analyses than MIGA has traditionally done for private sector investments, for
example, assessing the creditworthiness of public sector entities.

88
Appendix J IEG Development Outcome Ratings and Risk Flags
An analysis of the impact of portfolio riskiness on development outcomes rating
based on a cohort of 959 World Bank investment projects that were completed
during FY06–11 and that IEG evaluated was conducted. The analysis is based on the
following questions, and the findings are shown in Table J.1.
Extent to which identification of ―problem‖ projects before or at the time of
midterm review have impact on development outcome ratings
Extent to which identification of ―potential problem projects‖ before or at the
time of midterm review have impact on development outcome ratings
Extent to which proactive actions taken by task teams on ―problem projects‖
before or at the time of midterm review have impact on development
outcome ratings
Extent to which the risk flags could impact development outcome ratings.

APPENDIX J IEG DEVELOPMENT OUTCOME RATINGS AND RISK FLAGS
89
Table J.1. Portfolio Riskiness and Development Outcomes Ratings (FY06–11 exits)—Investment Projects
No. of IEG evaluations
Yes No
Difference
Significant at 99
percent confidence
level?
Significant at 95
percent confidence
level?
Significant at 90
percent confidence
level? # Proj
% MS+ IEG
outcomes # Proj
% MS+ IEG
outcomes
(I) Was the project identified as "problem project" at any time during its life? 959 427 57% 532 90% 33% Yes Yes Yes
(a) Was the project identified as "problem project" before or at MTR? 371 291 65% 80 38% -28% Yes Yes Yes
(II) Was the project identified as a "potential problem project" any time during its life (but not a problem projects)? 959 77 83% 882 74% -9% No No Yes (a) Was the project identified as a "potential problem project" before or at MTR? 66 46 91% 20 60% -31% Yes Yes Yes
(III) Did the tasks team take any Proactive actions on that were identified as "Problem Projects" during the life of the Project? 427 395 60% 32 19% -42% Yes Yes Yes
(a) Were proactive actions taken on a problem project before or at MTR? 344 201 67% 143 57% -10% No No Yes
(IV) Risk Flags
(a)Did the Project Have Country Record Flag any time during the life of the Project? 959 527 69% 432 83% 14% Yes Yes Yes (b) Did the Project Have Country Environment Flag any time during the life of the Project? 959 289 70% 670 78% 8% Yes Yes Yes (c) Did the Project Have Counterpart Funds Flag any time during the life of the Project? 959 234 63% 725 79% 16% Yes Yes Yes (d) Did the Project Have Disbursement Delay Flag any time during the life of the Project? 959 462 73% 497 78% 5% No No Yes (e) Did the Project Have Effectiveness Delay Flag any time during the life of the Project? 959 249 71% 710 76% 5% No No No (f) Did the Project Have Financial Management Flag any time during the life of the Project? 959 240 60% 719 80% 20% Yes Yes Yes (g) Did the Project Have Legal Covenants Flag any time during the life of the Project? 959 188 64% 771 78% 13% Yes Yes Yes
(h) Did the Project Have Long-term Flag any time during the life of the Project? 959 230 58% 729 81% 23% Yes Yes Yes
(i) Did the Project Have M&E Flag any time during the life of the Project? 959 253 55% 706 82% 27% Yes Yes Yes (j) Did the Project Have Project Management Flag any time during the life of the Project? 959 302 56% 657 84% 28% Yes Yes Yes
(k) Did the Project Have Procurement Flag any time during the life of the Project? 959 352 62% 607 83% 20% Yes Yes Yes
(l) Did the Project Have Safeguards Flag any time during the life of the Project? 959 113 64% 846 77% 13% Yes Yes Yes
Source: IEG data.

90
Appendix K Governance and Anticorruption
The World Bank Group supports countries in building accountable governments
that can work effectively to reduce poverty and promote growth. Events such as the
Arab Spring and mass anticorruption movements in India and Brazil are part of a
much broader global desire by citizens for more effective governance and greater
success in combating corruption. Bank Group support in these areas includes a wide
range of analytical and advisory activities and lending operations to improve, for
example, public financial management, tax and revenue administration, and
procurement. Support is also provided to promote civil service reform and
improved management of ministries and agencies; support oversight and judicial
institutions; strengthen the regulatory framework and investment climate for
businesses; improve transparency; and enhance independent accountability by
institutions and the demand for good governance from civil society (IEG 2008h,
2011h, pp. 67–78).
The Bank Group also addresses these issues in the way it does business across all
areas of its work. For example, it uses political economy analysis to help select the
right instruments and makes design and implementation of operations more
suitable to country context. It uses enhanced measures to manage fiduciary and
governance-related risks; makes use of country systems when they support the Bank
Group’s fiduciary, social, and environmental standards; improves transparency of
the World Bank’s own data and reports; and enhances results orientation across
product lines.35
In 2007, the Bank Group sought to increase significantly the scope of its work in
these areas through its strategy Strengthening World Bank Group Engagement on
Governance and Anticorruption (GAC; World Bank 2007a). The strategy was recently
evaluated by IEG (2011l), and a second phase was approved by the Board in 2012
(World Bank 2012d). Analyses have shown that GAC work poses several challenges,
which include the difficulty in working in politically sensitive areas while staying
within the limits of the Bank Group’s mandate and avoiding partisanship; gauging
how long desired reforms will take to gain traction; managing GAC risk; moving
beyond an initial focus on the Bank’s capacities to address GAC and reputational
risks, to placing more emphasis on country capacities; and linking GAC
responsiveness and outcomes.

APPENDIX K GOVERNANCE AND ANTICORRUPTION
91
Bank Group Support for GAC—IEG’s Evaluation
IBRD/IDA commitments for governance-related themes are embedded as
components of policy and investment operations. IEG’s evaluation (IEG 2011l)
shows that taking into account not only the value of the amounts coded to
governance-related themes, but also other amounts supported by this work, these
operations increased from about 12 percent of all commitments in FY91 to nearly 35
percent FY02. Since then, the proportion has declined to about 15 percent in FY10.
Although commitments were at their highest levels ever in FY09–10, the overall
increase in World Bank crisis-response commitments led to the percentage decline.36
With the adoption of the GAC strategy in FY08, enhanced administrative resources
were allocated for GAC implementation, including Bank budget increments, and the
Governance Partnership Facility trust fund. However, these parallel arrangements
did not achieve their incentive objectives. Vice presidential units operating in a
difficult zero-budget increase environment shifted a portion of incremental GAC
resources to other priorities. The Partnership Facility allocations were outside the
Bank’s budget process and were not systematically linked to the quality and
intensity of operations and country governance performance (Chatterjee 2011).
At the country level, IEG found that CASs approved prior to the adoption of the
GAC strategy (FY04–07) were broadly similar in their GAC responsiveness as those
approved afterward (FY08–10). In both cases, the Bank Group was selective in
identifying entry points for a GAC dialogue with the relevant government, with
nearly all CASs in both periods having GAC pillars. CASs were weak in signaling
fiduciary risks, with fewer than a third using standard portfolio processes to
identify, signal, and mitigate GAC risks. One notable area of improvement is that
the post-GAC CASs are more likely to support country institutional strengthening
through GAC components in projects and other mechanisms.
Looking at GAC features in project design, there was improved quality of political
economy analysis, and greater use of country systems in project management in
post-GAC projects, but little change in quality of fiduciary aspects, use of demand
side of governance, quality of institutional strengthening, and results orientation
(IEG 2011l, pp.63–73). Some examples of World Bank’s engagement in GAC issues
are shown in Box K.1.

APPENDIX K GOVERNANCE AND ANTICORRUPTION
92
Box K.1. Examples of World Bank Country Partnership Strategies addressing GAC challenges
The GAC pillar in the Country Partnership Strategy for Panama aimed to establish modern public financial management institutions. Together with the International Monetary Fund, the World Bank supported the enactment of a Social and Fiscal Responsibility Law in 2008 that strengthened the framework for fiscal management by setting a 1 percent ceiling on fiscal deficit—to be temporarily waived if growth is exceptionally weak—and a low target for the public debt ratio. There was also support to strengthen fiscal transparency and public procurement.
In Sierra Leone, despite an obvious lack of measurable progress in improving transparency and accountability in public financial management, the World Bank effectively utilized both investment and development policy credits to advance the decentralization agenda and build capacity for an improved budget process and better public financial management overall.
In Bhutan, some progress was achieved in budget predictability, preparation, and reporting, and preliminary steps were completed toward putting in place an M&E system to track and assess development outcomes. However, progress was limited or not well documented regarding public finance accounting and budget execution oversight, control and reporting, and reforms to improve procurement practices lagged.
Source: IEG.
Addressing Key GAC Challenges
The following highlights some recent developments in the Bank Group’s GAC
support, and how it is addressing key challenges. For a more complete picture, see
IEG’s evaluation (IEG 2011l, pp. 67–78), along with the many other evaluations and
other sources cited below.
POLITICAL SENSITIVITY
The World Bank works to maintain a difficult balance between respecting the
sovereign right of client countries to make their own political choices and seeking
favorable governance conditions for achieving development outcomes. This is
particularly difficult in the anticorruption area where it can be difficult to judge
whether the right conditions are present for successful reform, both in the relevant
sector and in the broader governance setting. Four examples of the Bank’s work in
this area (political economy analysis, investment climate, demand for good
governance, and global GAC initiatives) are discussed further below.
Governance and Political Economy Analytics
The Bank Group is committed to increasing the use of governance and political
economy analysis in its work. Although the Articles of Agreement of all Bank Group

APPENDIX K GOVERNANCE AND ANTICORRUPTION
93
entities prohibit partisan political activity,37 the Bank has incorporated political
analysis into its work since its first report on a developing country (Colombia) in
1949. There has been a greater use by the Bank of such analytics in project design
since 2007, particularly in fragile and middle-income countries. The intensity of
upstream political economy analysis (PEA) work is positively associated with the
―goodness of fit‖ of project design to country context, across all Bank regions.
However, the benefits of PEA work could be enhanced by improvements in the
scope and targeting of the work. Evaluations suggest that benefits may be limited
because of an overly academic orientation and uneven treatment of key topics, such
as political incentives to implement governance reforms, stakeholder preferences,
degree of mobilization, access to rents, and ability to veto reforms. Even when good-
quality analysis leads to sensible recommendations, there may be lack of support
from the project team or senior management (Beuran, Raballand, and Kapoor 2011;
Desai 2011). The Bank is more likely to identify stakeholders than assess the
incentives for stakeholders to commit credibly to reforms. Further, the Bank’s
recommendations tend to focus on standard solutions such as increasing pro-poor
spending and decentralization, without adequately recognizing the political
constraints to adopting them.
To address these challenges, there should be more focus on providing evidence to
support sector-level recommendations, which are more likely to be actionable than
countrywide ones. In addition, better integration of this work into standard World
Bank economic and sector work is more likely to deliver results than confidential,
freestanding PEA. In addition, more investment in PEA work alone will likely not
improve portfolio performance; to achieve this, the Bank needs to improve its
instruments and sector know-how, as well as results frameworks.
Investment Climate
Bank support to improve the regulatory framework and remove bottlenecks was a
key component of engagement on private sector development. Areas of work
included customs modernization, licensing and certification procedures,
consultative mechanisms, and information disclosure. This work was less effective
when politically driven, noncompetitive practices were the rule. In an assessment of
project objectives by GAC entry points, only 28 percent of sample projects achieved
their investment climate objective.
Demand Side
Sector investment and technical assistance is more likely to include demand-side
approaches to good governance than policy operations. An analysis of a sample of
APPENDIX K GOVERNANCE AND ANTICORRUPTION
94
projects approved since 2007 found that although 25 percent of investment
operations incorporated smart design in the demand side of governance, only 6
percent of policy operations did so.
The Bank could do more to make better use of civil society capabilities to hold
government and business accountable for quality services (Wescott and Desai 2011).
In Guatemala, the Bank’s public financial management (PFM) support to the
government was enhanced through a parallel effort to offer citizens’ user-friendly
access and interpretation of financial reports (Migliorisi and Prabhu 2011). However,
a Cambodian partnership between government and civil society could have allowed
for testing of pilot concepts, scaling up of successful ones, and closing down of
others (Girishanker and others 2011).
Nongovernmental organizations typically interact with the World Bank on a
contract basis, providing services such as capacity building and third-party
monitoring. There are risks of taking on conflicting roles when transferring grant
resources to nongovernmental organizations; thus in Azerbaijan the Bank
encouraged other partners to take the lead in financing (Wescott, Desai, and Talvitie
2011); and in Honduras, the Bank supported participatory approaches to water and
sanitation planning (World Bank Institute 2010).
Although these and other interventions are delivering broadly promising results,
there has been a reduction in Bank support for such interventions since 2007, both in
numbers of operations and the amounts involved (Migliorisi and Wescott 2011). An
explanation could be the increasing use of policy operations, as mentioned above
(IEG 2011l). A possible change in this pattern could come from the recently
approved Global Partnership for Social Accountability; when governments opt in,
the Bank can make direct grants to nongovernmental organizations. Overall, in
moving forward, more learning is needed on what works and under what
conditions.
Global GAC Initiatives
In addition to country-level initiatives for addressing politically sensitive issues, the
World Bank has helped catalyze action at the global level. For example, the Bank
provides a global secretariat for the Extractive Industry Transparency Initiative,
which works to promote greater transparency in revenues linked to resource
extraction in 13 countries (as of April 2012, 20 more countries are candidates).
Although there are many positive aspects to this initiative, there are concerns that
the Initiative reports are unreadable by nonexperts and do not affect the distribution
of contracts or management of revenues to the benefit key constituencies (Benner, de

APPENDIX K GOVERNANCE AND ANTICORRUPTION
95
Oliveira, and Kalinke 2010). Nor do the reports provide data on payments by
individual companies, although this may change as a result of U.S. legislation
adopted in 2010. In moving forward, there should be closer integration with
participating countries’ broader governance and sector strategies, and rigorous
application of the principle that the Extractive Industry Transparency Initiative only
supports countries where there is a high likelihood that its goals can be achieved
(IEG 2011e).
In the Stolen Asset Recovery Initiative, the Bank Group works in partnership with
the United Nations Office on Drugs and Crime to end safe havens, prevent money
laundering, and return assets obtained through fraud and corruption. The Bank is
also expanding its own investigations and sanctions activity and scaling up
preventative work concerning corruption in Bank projects. It has reached
agreements with other multilateral development banks to cross-debar firms and
individuals when there is evidence of wrongdoing. The Bank Group is also
becoming more transparent in its own work, with a new Access to Information
Policy, an Open Data initiative, and publication of key documents.
LONG TIME HORIZON
A second broad challenge is that the time span required to effect desired reforms is
generally uncertain and may well be beyond the duration of a single project or CAS
cycle. Cautious estimates may signal the need for more time than the normal time
span of a project; overambitious estimates may set the operation up for failure. Bank
staff may be torn between the imperative to deliver the lending program and the
need to allow crucial GAC measures to take hold. The situation may be worsened by
factors such as under-resourcing of operational work and high turnover of task team
leaders, which works against the deep country knowledge and strong teamwork
needed for successful GAC results. The Bank Group is attempting to respond to
these challenges through, for example, its support for PFM and procurement.
Public Financial Management and Procurement
Recent evaluations have highlighted that some instruments are better for promoting
certain GAC objectives than others. For example, policy operations are better for
promoting PFM and procurement than other GAC objectives, particularly when the
measures being supported are within the control of the Ministry of Finance to
implement. In Afghanistan, for example, a series of three policy operations, followed
by a development policy grant, and complementary investment operations helped
contribute to a relatively strong PFM and procurement framework, revenue growth,
and fiduciary assurance for on-budget funding. Although the Bank’s support also
contributed to some improvements in pay and grading, pensions, and other civil

APPENDIX K GOVERNANCE AND ANTICORRUPTION
96
service reforms, the quality of these reforms is uneven and relies on a highly paid
―second civil service‖ outside the normal civil service.
In Morocco, a policy operation helped achieve flexible budgeting, sectoral medium-
term expenditure frameworks, more reliable and transparent accounting, as well as
improving audits. Although staffing and personnel management tools were also
adopted, there is no evidence that the tools have led to improved performance;
further, initial gains achieved in reducing the wage bill as a percentage of gross
domestic product were lost with the subsequent approval of increases in all salaries
and the creation of new jobs following national protests.
Despite the relatively good results associated with support to PFM, there remain
serious challenges in many countries before reforms translate into overall improved
performance of service delivery and other tasks. An analysis of 38 countries with
repeat Public Expenditure and Financial Accountability (PEFA) assessments found
that
formal PFM features where progress can be achieved through
adopting a new law, regulation, or technical tool, or focusing on no
more than a few agencies, or at an early stage in the budget cycle are
more likely to improve a score or maintain a highest score than
functional PFM features where progress requires actually
implementing a new law or regulation, or coordinating the work of
many agencies, or working downstream in the budget cycle. The
difference is most pronounced for PFM features where progress can be
achieved working with one or a few agencies, in comparison with PFM
features where many agencies are involved. Likewise, functional
features are more likely to worsen a score or maintain a lowest score
than formal features (PEFA Secretariat 2011).
These findings help to explain why in 2010, the average Country Policy and
Institutional Assessment PFM score was only 3.5 out of 6, and less than one-third of
all countries had ratings of 4.0 or better, which is the point where good practices in
PFM may have a meaningful effect on improving government performance. An
encouraging result is that more PEFA scores are improving than declining, even in
the more difficult areas (PEFA Secretariat 2011).
MANAGING RISK
Another key challenge is managing the risks of politically sensitive, long-term GAC
reforms. The high risks of working in the Bank Group’s client countries are well
known. The Bank Group’s approach is to manage GAC risk rather than avoid it; yet

APPENDIX K GOVERNANCE AND ANTICORRUPTION
97
it is unclear what planned measures should be taken when the risks are found to be
too high. Actions by the World Bank’s Integrity Vice Presidency may lead to soured
relations with clients and separation of Bank-financed activities from the country
systems. Although this may reduce improper use of Bank funds, it can also hamper
efforts at building capacities to manage much larger government resources in order
to achieve development outcomes. The following paragraphs highlight two of many
possible examples of the Bank’s work to manage such risk, that is, provision of
support to combating corruption and to independent oversight bodies.
Combating Corruption
Corruption is acknowledged to be a significant problem for many of the Bank
Group’s borrowers; however, to date, the Bank Group has been unable to work with
countries to effectively reduce systemic corruption. The Bank Group is perceived as
having strict fiduciary standards to protect its funds, but it is unable to reduce
systemic corruption. Aside from the deep challenges of changing behaviors
supported by powerful, vested interests, the Bank Group has little leverage in
countries with large natural resource revenues, other significant sources of funding,
and geopolitical factors, leading to softer approaches from partners motivated by
security concerns and trade and investment prospects. In cases where the Bank has
scaled back its program in response to evidence of fraud and corruption in projects,
this may limit its ability to have an impact on systemic corruption, as illustrated in
the cases in Box K.2.
Likewise, the use of external fiduciary and procurement measures (for example,
independent procurement and monitoring agents in Afghanistan and Cambodia)
has had less impact on building local capacity in managing downstream, contract
management processes, although it may help in achieving procedural compliance to
mitigate the reputational risk of fraud and corruption in Bank projects. The practice
shifts the task of managing reputational risk away from the government, and it may
not have much impact on improving the procurement practices of government
funded goods and services. Finally, it delays the inevitable transition to developing
country systems that can be used for Bank projects.

APPENDIX K GOVERNANCE AND ANTICORRUPTION
98
Box K.2. Challenges of Balancing Risk and Reward in Bangladesh and Cambodia
Under its GAC strategy, the Bank is committed to staying engaged, even in poorly governed countries, so that the ―poor do not pay twice.‖ Yet at the same time, the strategy places considerable emphasis on safeguarding Bank funds from fiduciary risks. The result can be a difficult juggling act.
In Cambodia in 2006, an unprecedented, simultaneous release of findings on Integrity Department investigations across six ministries led to a temporary suspension of three projects. A sharper focus on procurement risks was warranted at the time, but the Bank has subsequently been preoccupied with the reputational risks of fraud and corruption on Bank projects, with less emphasis on a more developmental focus on using and strengthening country procurement systems.
In Bangladesh over the last decade, the Bank supported improvements in public financial management, procurement, local government, investment climate, rural roads, and primary education; it was less successful in attaining GAC improvements in national highways and independent accountability institutions. The strict approach to fiduciary risk increased the confidence of the Bank’s shareholders, helping to enable a tenfold increase in Bank lending since 2001 and the creation of new trust funds under the Bank’s management. Yet the same strict fiduciary standards led to the Bank’s withdrawal from support to national highways because of fraud and corruption, meaning that the Bank now has little influence over a binding constraint for economic development and poverty reduction.
Sources: Girishankar and others 2011; Wescott and Breeding 2011.
Aside from these challenges, the World Bank did not adopt consistent approach for
setting risk tolerances across regions. Thus, World Bank operations in Latin America
and the Caribbean are less likely to use country systems because of perceived risks
than in Sub-Saharan Africa, despite a higher quality of PFM in the former, as
measured by Country Policy and Institutional Assessment (average score 3.7 versus
3.2).38
To address these challenges, the Bank Group needs to clarify its ―zero tolerance‖
stance on corruption and improve operational controls. It should adopt greater
consistency in managing systems-level fiduciary and GAC risks across instruments,
not simply transaction-level risks in investment projects. The Operational Risk
Assessment Framework can be useful in calibrating the design and management of
operations by risk, but other approaches such as lending scenarios may also needed.
The Bank Group presently has a target of 70 percent or better moderately
satisfactory or better IEG ratings for operations in fragile states, 75 percent for
operations in other IDA countries, and 80 percent in IBRD countries, recognizing
that the former have higher risks, but where rewards to successful operations are
particularly high (IEG 2011l, pp. xxxii–xxxiii). However, this does not invalidate the
need for consistent definitions of risk tolerances, taking into account unusual

APPENDIX K GOVERNANCE AND ANTICORRUPTION
99
features of country context: for example, a certain level of performance as measured
by key PEFA indicators as a standard for channeling of Bank funds through country
systems, with capacity building and exit strategies when ring-fenced practices are
adopted.
Independent Oversight
The Bank has also supported independent oversight institutions through policy and
investment operations. Building on the Bank’s extensive support to PFM, supreme
audit institutions are receiving Bank support in all regions, including, for example,
in Mozambique, Azerbaijan, Cambodia, Haiti, West Bank and Gaza, and
Afghanistan. The use of policy operations is positively associated with
improvements in formal accountability/oversight arrangements. However, many
challenges remain in this area. The independence of Indonesia’s and Cambodia’s
supreme audit institution has been questioned (Migliorisi and Wescott 2011) as
those institutions rely on the executive for their budgets and procedures. In
Afghanistan, approval by Parliament of a new audit law providing for an
independent SAI has been delayed. The Bank’s overall approach across regions has
been criticized as ―sporadic and uncoordinated‖; a more holistic approach
supporting the audit institutions, public accounts committees, and civil society
organizations, in partnership with other donors, could produce better results
(Migliorisi and Wescott 2011).
The Bank has also worked with other oversight bodies, among them ombudsmen in
Timor-Leste, Thailand, Gujarat State (India), Rwanda, Lesotho, and Columbia;
access to information in Bangladesh and Thailand; ethics promotion in Thailand;
and anticorruption bodies in Liberia and Bangladesh. Support to independent
oversight bodies has been one way of building capacity to better manage country-
level risk, not just the risk to the Bank’s funds.
UNDERSTANDING LINKS BETWEEN GAC AND DEVELOPMENT OUTCOMES
There is broad agreement that institutions matter to development. Yet the evidence
on how and why institutions change in different settings is inconclusive. There is
ample evidence that the quality of institutions matters for economic growth and
poverty reduction. However, the evidence also shows that poor quality institutions
are the way they are because political elites who benefit want to keep them that way
(Acemoglu, Johnson, and Robinson 2005; North, Wallis, and Weingast 2009). Much
more work is needed to understand the best way out of this conundrum in different
types of country contexts. Among the ways the Bank is addressing this is through
work on sector governance, and developing actionable governance indicators.

APPENDIX K GOVERNANCE AND ANTICORRUPTION
100
Service Delivery Sectors
Countries face many GAC constraints on service delivery, including predictability
and adequacy of budgets; recruitment and payment of field staff; provision of
reliable operations and maintenance to support assets with minimal corruption; and
ensuring that subsidies are targeted to benefit those most in need. The evidence on
the efficacy of public sector governance components on operations supporting
service delivery agencies is mixed. Looking at such operations that concluded in
2006–11 with public sector governance components, there is no statistically
significant difference in ratings from those that do not have these components.
However, for projects designed starting in 2005, according to regression analysis,
projects that included crosscutting public sector management components were 22
percent more likely to achieve sector capacity-building objectives. Similarly, projects
with public disclosure mechanisms were 29 percent more likely to achieve these
sector objectives (IEG 2011l, Appendix F, Table F.9). Other evaluations on health
sector reform and social safety nets signal the importance of taking political
economy analysis into account in sequencing, reducing complexity, ensuring
adequate capacity, and reducing political risks (IEG 2009c, 2011j).
Actionable Governance Indicators
Because of the risks and long time that it takes governance reforms to gain traction
and lead to desired development outcomes, it is crucial to define and monitor
progress indicators such as those used by PEFA. Such indicators should be linked
with desired outcomes, attributable to government actions and independently
verifiable. As discussed above in connection with PEFA, some indicators measure
formal features, whereas others measure the actual functioning of institutions and
practices.
In addition to public financial management and procurement, the Bank is in the
early stages of developing robust indicators for measuring the quality of public
administration and public provision of information (World Bank, no date). An
analysis of 471 indicators in a sample of 44 public sector operations found that about
a half measured functions, values, outputs, and outcomes linked to behavioral
changes (Figure K.1); the rest measured intervention processes and formal
institutional arrangements. Under its most recent GAC strategy, the Bank is
committed to increase the use of the former type of more ambitious, behavioral
indicators in GAC operations.

APPENDIX K GOVERNANCE AND ANTICORRUPTION
101
Figure K.1. Types of Project Component Indicators Used in Sample of Public Sector Operations
Source: Manning 2010.
The Way Forward—Governance and Anticorruption
Starting in 1990, the Bank Group increased its support for GAC themes, reaching a
high point in 2002, when nearly 35 percent of all operations had GAC components.
The proportion has gone down since then, although the volume continues to go up
with the overall increase in Bank financing. Although CASs are more likely to
support country institutional strengthening since 2007, there are weaknesses in
using standard portfolio processes to identify, signal, and mitigate GAC risks.
Although the overall treatment of governance and political economy increased for
over two decades, it started to decline after 2003. However, there is evidence that the
quality of political analysis in project design has improved since 2007. Future work
should focus on sector-level recommendations and be better integrated into
standard economic and sector work.
Demand-side approaches are also being used to address politically sensitive issues,
particularly within investment operations. There were some successes in working
with civil society organizations both as partners and as contractors, the Bank could
do more in this area. Global programs provide a different tool for addressing
political sensitivities. To succeed, they need to be based on credible results chains,
and to be used in countries where there is a plausible prospect for achieving
intended outcomes.
To address the long time horizon needed for key reforms to take hold, the Bank
works to achieve and monitor medium-term results. For example, in supporting
public financial management and procurement, formal features that can be achieved
by working with one or a few agencies can take hold more quickly than functional
features, where progress requires actually implementing a new law or regulation, or
120
90
182
1 13
33
4 0
20 40 60 80
100 120 140 160 180 200
Intervention Upstream Institutional
arrangements
Upstream Functions and
Values
Downstream Institutional
arrangements
Downstream Functions and
Values
Outputs Outcomes

APPENDIX K GOVERNANCE AND ANTICORRUPTION
102
coordinating the work of many agencies, or working downstream in the budget
cycle. An encouraging result is that even PEFA scores measuring functional
dimensions are improving, albeit at a slower rate.
To better address the risks of working in difficult country settings, the Bank Group
needs to adopt greater consistency in approaching systems-level fiduciary and GAC
risks across instruments, with capacity building and exit strategies when ring-fenced
practices to separate out the Bank finance activities from the country system are
adopted. Support to independent oversight bodies has been one way of building
capacity to better manage country-level risk, not just the risk to the World Bank’s
funds.
Finally, the Bank Group is working to better understand links between GAC and
development outcomes. There is evidence that sector operations with GAC
components are more likely to achieve intended results. There has also been
progress in results orientation through the use of indicators measuring functional
and behavioral changes, and a commitment under the new GAC strategy to do
more. The Bank needs to heighten its commitment to institution building over the
long term and to ensuring accountability for results (for example, progress on PFM,
service delivery) in the short term. This commitment should be backed up with
greater consistency in risk management and a more strategic approach to
resourcing, with particular focus on countries with country-owned, time-bound
strategies to improve governance.
103
Appendix L Reforming the Management Action Record
IEG and Bank Group management have implemented reforms to improve the
Management Action Record (MAR). In response to the Board’s request for an
improved MAR process, Bank Group managements and IEG submitted a joint
proposal for reform of the MAR process to the Committee on Development
Effectiveness (CODE) in November 2010. The proposal sought to strengthen the
quality of IEG recommendations as well as their implementation by Bank Group
management. In 2011, IEG and management piloted the approach in three
evaluations to roll out MAR reform. The main elements of the reform included the
following:
IEG will prioritize recommendations, consider their feasibility and cost-
effectiveness, and reduce their number and complexity. The links between the
evaluation findings and the recommendations will be made clear.
Management will define specific actions and timelines to respond to IEG’s
recommendations that will provide clearer benchmarks against which to assess
progress in implementing IEG’s recommendations.
More upstream discussion will take place between IEG and management during the
drafting of the recommendations.
The MAR tracking form will be revised to indicate progress by including
monitorable actions and timelines and allowing for adjustments/drop outs,
retirement after four years, and include a time dimension in the scale reflecting
adoption (for example, too early to assess).
A user-friendly system for tracking and analysis is currently under development
and will be completed by the end of FY12.
In December 2011, IEG and management reported to CODE that the MAR pilots had
demonstrated positive results: increased engagement between IEG and
management, without compromising IEG’s independence. There has been clearer
demonstration of the link between the main findings and recommendations in the
evaluations; increased clarity in the recommendations that are more actionable; and
increased ownership of recommendations by management.

APPENDIX L REFORMING THE MANAGEMENT ACTION RECORD
104
During these pilots, IEG strengthened its quality control review procedures, with an
increased focus on findings and recommendations, and had more interactions with
management while drafting the recommendations. Management has also played a
positive role and made significant contributions to the interactions and the process.
Action plans with timelines have been submitted in the poverty and social safety
nets evaluations. The engagement on recommendations prior to CODE discussion is
being rolled out in all IEG evaluations that include recommendations, which may
require additional time for IEG and management engagement throughout the
evaluation cycle.
In addition, the stock of recommendations for IFC and MIGA has been reviewed,
and outstanding recommendations that are no longer relevant have been retired. A
similar process was carried out for the World Bank. A new standardized reporting
system is also being developed for tracking recommendations for consistency across
institutions and will be operational by FY13.

105
Bibliography
Abebe Adugna, Rocio Castro, Boris Gamarra, Stefano Migliorisi. 2011. Finance for Development: Trends and Opportunities in a Changing Landscape. Concessional Finance and Global Partnerships Working Paper No. 8, World Bank, Washington, DC.
Acemoglu, D., Johnson, S. and Robinson, J.A. 2005. Institutions as a Fundamental Cause of Long-Run Growth In P. Aghion and S. Durlauf (eds.) Handbook of Economic Growth, 384–473, Amsterdam: North Holland.
Barriopedro, D., Fischer, E. M., Luterbacher, J., Trigo, R. M., & Garcia-Herrera, R. (2011). ―The Hot Summer of 2010: Redrawing the Temperature Record Map of Europe.‖ Science 332 (6026), 220–24.
Benner, T., R. de Oliveira, and F. Kalinke. 2010. ―The Good/Bad Nexus in Global Energy Governance.‖ In Andreas Goldthau and Jan Martin Witte (eds.). Global Energy Governance: The New Rules of the Game, Berlin and Washington, DC: Global Public Policy Institute and Brookings Institution Press.
Beuran, Monica, Gael Raballand, and Kapil Kapoor. 2011. ―Political Economy Studies: Are they Actionable? Some Lessons from Zambia.‖ World Bank Policy Research Working Paper 5656, Washington, DC.
Chatterjee, Barun. 2011. ―Resourcing Implementation of the World Bank’s 2007 Governance and Anticorruption Strategy.‖ IEG Working Paper 2011/12, Washington, DC.
DeGroot, David, Antti Talvitie, and Uktirdjan Umarov. 2011. ―Liberia: World Bank Country-Level Engagement on Governance and Anticorruption.‖ IEG Working Paper, Washington, DC.
Desai, Raj M. 2011. ―An Evaluation of Political-Economic Analysis in Support of the World Bank’s Governance and Anticorruption Strategy.‖ IEG Working Paper, Washington, DC.
ECG (Evaluation Cooperation Group). 2012. ―Good Practice Standards for Evaluation of Public Sector Operations,‖ rev. ed. http://www.ecgnet.org/gps/public_sector2.
———. 2011. Third Benchmarking Review of ECG [Evaluation Cooperation Group] Members Evaluation Practices for their Private Sector Investment Operations against Their Agreed Good Practice Standards.
Fardoust, Shahrokh, and A. Elizabeth Flanagan. 2011. ―Quality of Knowledge and Quality of Financial Assistance: A Quantitative Assessment in the Case of the World Bank.‖ Mimeo, World Bank, Washington, DC.
Foster, Vivien, and Cecilia Briceño-Garamendia, eds. 2010. Africa’s Infrastructure: A Time for Transformation. Washington, DC: World Bank and Agence Française de Développement.
Girishankar, Navin, David DeGroot, Raj Desai, Susan Stout and Clay Wescott. 2011. ―Cambodia: World Bank Country-Level Engagement on Governance and Anticorruption.‖ IEG Working Paper, Washington, DC.
IEG (Independent Evaluation Group). 1997. 1997 Annual Review of Development Effectiveness. Washington, DC: World Bank.
———. 2003. ―Community-Driven Development: Lessons from the Sahel—An Analytical Review.‖ World Bank, Washington, DC.
———. 2006a. From Schooling Access to Learning Outcomes—An Unfinished Agenda. An

BIBLIOGRAPHY
106
evaluation of World Bank Support to Primary Education. Washington, DC: World Bank.
———. 2006b. Hazards of Nature, Risks to Development: Evaluation of World Bank Assistance for Natural Disasters. Washington, DC: World Bank.
———. 2007a. Independent Evaluation of IFC’s Development Results: Lessons and Implications from 10 Years of Experience. Washington, DC: World Bank.
———. 2007b. ―Malawi Emergency Drought Recovery Project.‖ Project Performance Assessment Report No. 39849, World Bank, Washington, DC.
———. 2007c. ―Zambia Emergency Drought Recovery Project.‖ Project Performance Assessment Report No. 39847, World Bank, Washington, DC.
———. 2008a. Annual Review of Development Effectiveness—Shared Global Challenges. World Bank: Washington, DC.
———. 2008b. Biennial Report on Operations Evaluation: IFC’s Results Measurement for Better Results. Washington, DC: World Bank.
———. 2008c. Climate Change and the World Bank Group Phase I—An Evaluation of World Bank Win-Win Energy Policy Reforms. World Bank: Washington, DC.
———.2008d. Environmental Sustainability: An Evaluation of World Bank Group Support. World Bank: Washington, DC.
———. 2008e. Financing Micro, Small and Medium Enterprises: An Independent Evaluation of IFC’s Experience in Frontier Countries. Washington, DC: World Bank.
———. 2008f. Independent Evaluation of IFC’s Development Results: IFC’s Additionality in Supporting Private Sector Development. Washington, DC: World Bank.
———. 2008g. Lessons from World Bank Group Responses to Past Financial Crises. IEG Evaluation Brief 6, Washington, DC.
———. 2008h. Public Sector Reform: What Works and Why? Washington, DC: World Bank.
———. 2008i. Using Knowledge to Improve Development Effectiveness: An Evaluation of World Bank Economic and Sector Work and Technical Assistance, 2000–2006 Washington, DC: World Bank.
———. 2009a. Annual Review of Development Effectiveness: Achieving Sustainable Development, 2009. Washington, DC: World Bank.
———. 2009b. Biennial Report on Operation Evaluation in IFC 2008: Enhancing Monitoring and Evaluation for Better Results. Washington, DC: World Bank.
———. 2009c. Improving Effectiveness and Outcomes for the Poor in Health, Nutrition, and Population: An Evaluation of World Bank Group Support Since 1997. Washington, DC: World Bank.
———. 2009d. Independent Evaluation of IFC’s Development Results: Knowledge for Private Sector Development—Enhancing the Performance of IFC’s Advisory Services. Washington, DC: World Bank.
———. 2010a. Analyzing the Effects of Policy Reforms on the Poor: An Evaluation of the Effectiveness of World Bank Support to Poverty and Social Impact Analyses. World Bank: Washington, DC.
———.2010b. The Challenges of Low-Carbon Development. Climate Change and the World Bank Group. Phase II. World Bank: Washington, DC.
———. 2010c. Gender and Development: An Evaluation of World Bank Support, 2002–08. Washington, DC: World Bank.
———. 2010d. ―Project Performance Assessment Report for the Cape Peninsula Biodiversity Conservation Project.‖ Report No. 52793, World Bank, Washington, DC.
———. 2010e. ―Responding to Floods in West Africa: Lessons from Evaluation.‖ IEG Note, World Bank, Washington, DC.
———. 2010f. ―Response to Pakistan’s Floods: Evaluative Lessons and Opportunity.‖ IEG Note, World Bank, Washington, DC.

BIBLIOGRAPHY
107
———. 2010g. Safeguards and Sustainability Policies in a Changing World. Washington, DC: World Bank.
———. 2010h. Water and Development: An Evaluation of World Bank Support, 1997–2007. Washington, DC: World Bank.
———. 2010i. The World Bank’s Country Policy and Institutional Assessment: An IEG Evaluation. Washington, DC: World Bank.
———. 2010j. World Bank Group Cooperation: Evidence and Lessons from IEG Evaluations. IEG Evaluation Brief 11.
———. 2010k. The World Bank Group’s Response to the Global Economic Crisis. Phase I. Washington, DC: World Bank.
———. 2010l. World Bank Group Response to the Haiti Earthquake: Evaluative Lessons. IEG Evaluation Brief 10.
———. 2011a. Assessing IFC’s Poverty Focus and Results. Washington, DC: World Bank.
———. 2011b. Capturing Technology for Development: An Evaluation of Bank Group Activities in Information and Communication Technologies. Washington, DC: World Bank.
———. 2011c. ―Chile—Country Partnership Strategy Completion Report—IEG Review.‖ Report No. R2011-0016/1, World Bank, Washington, DC.
———. 2011d. Evaluative Lessons from World Bank Group Experience: Growth and Productivity in Agriculture and Agribusiness. Washington, DC: World Bank.
———. 2011e. Multi-donor Trust Fund for the Extractive Industries Transparency Initiative. Global Program Review Vol. 5, Issue 1, Washington, DC.
———. 2011f. Natural Disaster Response Lessons from Evaluations of the World Bank and Others. IEG Evaluation Brief 16.
———. 2011g. ―Performance Assessment Review of Investment Climate Assessments in Five Transforming Economies: Bangladesh, Egypt,
Guatemala, Kenya and Vietnam.‖ World Bank, Washington, DC.
———. 2011h. Results and Performance of the World Bank Group: IEG Annual Report 2011. Washington, DC: World Bank.
———. 2011i. ―Review of the 2008–2011 Country Partnership Strategy and Progress Report—Brazil.‖ World Bank, Washington, DC.
———.2011j. Social Safety Nets: An Evaluation of World Bank Support, 2000–2010. Washington, DC: World Bank.
———. 2011k: Trust Fund Support for Development—An Evaluation of the World Bank’s Trust Fund Portfolio. Washington, DC: World Bank.
———. 2011l. World Bank Country-Level Engagement on Governance and Anticorruption: An Evaluation of the 2007 Strategy and Implementation Plan. Washington, DC: World Bank.
———. 2011m: The World Bank’s Involvement in Global and Regional Partnership Programs. Washington, DC: World Bank.
———. 2011n. World Bank Progress in Harmonization and Alignment in Low-Income Countries. Washington, DC: World Bank.
———.2011o. World Bank Support to Education Since 2001: A Portfolio Note. Washington DC: World Bank.
———. 2012a. ―Global Economic Prospects.‖ World Bank, Washington, DC.
———. 2012b. ―The Global Fund to Fight AIDS, Tuberculosis and Malaria, and the World Bank’s Engagement with the Global Fund.‖ Global Program Review, Vol. 6, Issue 1, Washington, DC.
———. 2012c. The Matrix System at Work: An Evaluation of the World Bank’s Organizational Effectiveness. Washington, DC: World Bank.
———. 2012d. World Bank Group Impact Evaluations: Relevance and Effectiveness. Washington, DC: World Bank.

BIBLIOGRAPHY
108
———. 2012e. World Bank Group’s Response to the Global Economic Crisis: Phase II. Washington, DC: World Bank.
IEO (Independent Evaluation Office, International Monetary Fund). 2011. ―IMF Performance in the Run-Up to the Financial and Economic Crisis: IMF Surveillance in 2004–07.‖ Washington DC, International Monetary Fund.
IFC (International Finance Corporation). 2011. IFC Road Map FY12–14: Impact, Innovation, and Partnership. Washington, DC: World Bank.
IMF (International Monetary Fund). 2012. World Economic Outlook April 2012: Growth Resuming, Dangers Remain. Washington, DC: IMF.
Kanbur, Ravi. 2004. ―Growth, Inequality and Poverty: Some Hard Questions.‖ Working paper, Cornell University.
Manning, Nick, 2010. Measuring Public Sector Management Progress in World Bank Projects. Work in progress for the World Bank’s new PSM approach—prepared for OECD Informal Seminar on Evaluating and Demonstrating Results in the Governance Field, December 8, World Bank, Washington, DC.
Migliorisi, Stefano, and Anwesha Prabhu. 2011. ―Guatemala: World Bank Country-Level Engagement on Governance and Anticorruption.‖ IEG Working paper, Washington, DC.
Migliorisi, Stefano, and Clay Wescott. 2011. A ―Review of World Bank Support for Accountability Institutions in the Context of Governance and Anticorruption.‖ IEG Working paper, Washington, DC.
North, Douglass C., John Joseph Wallis, and Barry R. Weingast. 2009.Violence and Social Orders: A Conceptual Framework for Interpreting Recorded Human History. New York: Cambridge University Press.
OECD (Organisation for Economic Co-operation and Development). 2011a. ―Busan Partnership for Effective Development
Co-operation.‖ http://www.oecd.org/dataoecd/54/15/49650173.pdf.
———.2011b. Divided We Stand: Why Inequality Keeps Rising. OECD Publishing. Paris.
PEFA Secretariat. 2011. PFM Performance Measurement Framework Monitoring Report 2010. Washington, DC: World Bank.
Robine, J.M., S.L. Cheung, S. Le Roy, H. Van Oyen, and F.R. Herrmann. 2007. ―Report on Excess Mortality in Europe During Summer 2003.‖ EU Community Action Programme for Public Health Grant Agreement 2005114.
Rosegrant, Mark, and Peter Hazell. 2000. ―Transforming the Rural Asian Economy: The Unfinished Revolution.‖ In Asian Development Bank (ed.), Study of Rural Asia (Vol. 1). New York: Oxford University Press.
Wescott, Clay, and Mary Breeding. 2011. ―Bangladesh: World Bank Engagement on Governance and Anticorruption.‖ IEG Working Paper 2011/7, Washington, DC.
Wescott, Clay, and Raj Desai, 2011. ―Moldova: World Bank Country-Level Engagement on Governance and Anticorruption.‖ IEG Working Paper 2011/11, Washington, DC.
Wescott, Clay, Raj Desai, and Antti Talvitie, 2011. ―Azerbaijan: World Bank Country-Level Engagement on Governance and Anticorruption.‖ IEG Working paper 2011/9, Washington, DC.
World Bank. 1989. IBRD Articles of Agreement (As amended effective February 16, 1989). World Bank, Washington, DC. http://siteresources.worldbank.org/EXTABOUTUS/Resources/ibrd-articlesofagreement.pdf
———. 2003. Infrastructure Action Plan. Washington, DC: World Bank. http://siteresources.worldbank.org/INTTRM/Resources/InfrastructureActionPlan.pdf.

BIBLIOGRAPHY
109
———.2005. Expanding the Use of Country Systems in Bank-Supported Operations: Issues and Proposals. Washington, DC: World Bank.
———.2007a. Strengthening World Bank Group Engagement on Governance and Anticorruption. Washington, DC: World Bank.
———. 2007b. ―Turkey Marmara Earthquake Emergency Reconstruction Project.‖ Implementation Completion and Results Report No. ICR0000131, World Bank, Washington, DC.
———. 2007c. World Development Report 2008: Agriculture for Development. Washington, DC: World Bank.
———. 2008. ―Good Practice Note: Using Poverty and Social Impact Analysis to Support Development Policy Operations.‖ Washington, DC.
———. 2009a. ―India Gujarat Emergency Earthquake Reconstruction Project.‖ Implementation Completion and Results Report No. ICR0000638, World Bank, Washington, DC.
———. 2009b. ―Samoa Cyclone Emergency Recovery Project.‖ Implementation Completion and Results Report No. ICR00001071, World Bank, Washington, DC.
———. 2010a. Enabling Reforms: A Stakeholder-Based Analysis of the Political Economy of Tanzania’s Charcoal Sector and the Poverty and Social Impacts of Poverty Reforms. Washington, DC: World Bank.
———. 2010b. New World, New World Bank Group: (I) Post-Crisis Directions. Washington, DC: World Bank.
———. 2011a. Global Monitoring Report 2011: Improving the Odds of Achieving the MDGs. Washington, DC: World Bank.
———. 2011b. The State of World Bank Knowledge Services: Knowledge for Development 2011. Washington, DC: World Bank.
———. 2011c. World Bank Corporate Scorecard 2011. Washington, DC: World Bank.
———. 2011d. World Bank for Results 2011. Washington, DC: World Bank.
———. 2011e. World Development Report 2012: Gender Equality and Development. Washington, DC: World Bank.
———. 2012a. Global Development Finance 2012: External Debt of Developing Countries. Washington, DC: World Bank.
———. 2012b. Global Economic Prospects: Managing Growth in a Volatile World. Washington, DC: World Bank.
———. 2012c. Global Monitoring Report 2012: Food Prices, Nutrition and the Millennium Development Goals. Washington, DC: World Bank.
———. 2012d. Strengthening World Bank Group Engagement on Governance and Anticorruption. Washington, DC: World Bank.
———.2012e. ―Update on the Bank’s Business Modernization: Results, Openness, and Accountability Spring 2012.‖ Washington, DC: World Bank.
———.2012f. World Bank Corporate Scorecard April 2012. Washington, DC: World Bank.
———. No date. ―Actionable Governance Indicators (AGI) Initiative.‖ http://go.worldbank.org/BN5GB74IV0.
World Bank and IMF. 2010. ―Implementation of the Joint Management Action Plan on Bank-Fund Collaboration.‖ Washington, DC: World Bank and IMF.
World Bank Institute. 2010. Introducing Accountability and Transparency to Water and Sanitation Services in Honduras through Enhanced User Participation. Washington, DC: World Bank.

111
Endnotes 1 Revised Good Practice Standards were adopted by the members of the Evaluation Cooperation Group in 2011 (ECG 2012).
2 In May 2012, IEG introduced an updated lessons retrieval system for IFC– E-LRN that makes available electronically to IFC staff all lessons from XPSRs completed since 1996.
Appendix B
3 The number includes a CASCR for the Organization of Eastern Caribbean States.
4 The World Bank Corporate Scorecard (April 2012) reports the share of CASCR-Reviews rated moderately satisfactory or better by IEG in the most recent four-year period up to February 2012 to be 59 percent.
Appendix D
5 IEG reviewed 30 financial markets projects with XPSRs done in 2008–10 selected purposively to represent diverse types of interventions and issues to extract lessons.
6 MIGA gross exposure in the financial sector as of June 30, 2012.
7 The IEG review covered 34 XPSRs prepared for MAS projects between 2009 and 2011.
8 See, for example, Foster and Briceño-Garamendia (2010). The authors estimate an annual funding gap for infrastructure investments in Sub-Saharan Africa of $31 billion, mostly in the power and water and sanitation sectors.
9 IEG reviewed 47 XPSRs for infrastructure projects completed in 2008–10.
10 http://data.worldbank.org
11 M&E systems can be less than satisfactory for a number of reasons. For example, the system may be technically deficient or it may be technically sound but overly complex in the context of project capacity.
12 None of the financial sector projects in the sample (9) was rated for their environmental and social effects; this was in part because projects supported prior to MIGA’s introduction of its Sustainability Policy and Performance Standards (October 2007) were classified as Category C projects that did not require any additional follow up beyond screening during project appraisal. The appropriate rating for this category therefore was ―not rated.‖ However, going forward, the performance standards would compel MIGA to rate and report on the E&S performance of its financial sector projects.
13 For the purpose of this section, the PPARs for several forestry projects that were managed by the Agriculture and Rural Development Sector Board were reviewed together with environment projects given their direct relevance to environmental issues.
14 Four policies (OP 4.10 on Involuntary Resettlement, OP 4.12 on Indigenous Peoples, BP 4.36 on Forests, and OP 2.30 on Development Cooperation and Conflict) also require consideration of issues related to women as part of vulnerable groups. These policies continue to maintain a project-level entry point.

ENDNOTES
112
15 IEG estimates that, at any given time, involuntary resettlement affects more than 1 million people, two-fifths of which are likely to be physically displaced and three-fifths of which are likely to be economically affected by World Bank-supported projects (IEG 2010g).
Appendix E
16 The 2011 Results and Performance report (IEG 2011H) states that, since 2005, results in the health and education sectors have become more difficult to achieve as interventions have moved beyond addressing basic access issues to address more complex quality objectives and systemic reforms.
Appendix G
17 Statistical significance is based on the difference between the quality at entry ratings for two periods.
Appendix H
18 In FY11, IFC formulated an equity strategy based on its perceived strong additionality to provide risk capital to help start up companies and support the growth of other companies for development impact, with the objective to increase the share of equity investments to 25 percent of commitments (see IFC 2011).
19 IFC net commitment volumes for both short-term and long-term finance products grew in FY12 compared with the previous year. Short term finance products continued to increase rapidly and accounted for 47 percent of total net commitments.
20 Includes both IDA-only and blend countries as of July 1, 2011.
21 These are Nigeria, Pakistan, India, Vietnam, and Ghana (FY09–11). India’s share has continuously declined over this period, mainly because of a decrease in infrastructure investments, and as of FY11 it no longer is among the top five IDA countries by IFC investment volume.
22 IEG and IFC management are currently developing an evaluative framework for the trade finance product. IEG has also initiated an evaluation of IFC’s short-term finance programs (2006–11), which will be completed in FY13.
23 These findings are also supported by the moderate increases in IFC’s ratio of non-accruing loans and principal in arrears. However, equity write-downs increased significantly during the crisis.
24 Based on analysis undertaken for XPSRs completed between 2000 and 2010 (see IEG 2011g, Appendix E).
25 This includes, for instance, initiatives undertaken as part of the IFC 2013 change process; and strengthening of IFC’s integrity risk function and procedures.
26 For more details about IEG’s analysis on the contribution of risk factors and IFC work quality to project development outcomes, see IEG evaluations (IEG 2007a, 2008f, and 2011h Appendix E).
27 The analysis covered 657 XPSRs completed during 2000–10, of which 202 were in IDA countries. The results are presented in Tables H.5 and H.6 (Appendix H).

ENDNOTES
113
28 See the independent evaluation of IFC’s development results 2009 (IEG 2009d). The report highlighted implications from the largely unchecked growth of IFC’s advisory services and recommended, inter alia, that Management set out an overall strategy for Advisory Services, addressing the need for a clear vision and business framework that is more closely linked with IFC’s global corporate strategy.
29 These are Access to Finance, Investment Climate, Sustainable Business, and Public-Private Partnerships.
30 IEG’s method to calculate the share of project expenditures in IDA-eligible countries differs from IFC management’s reporting. For example, IFC's analysis excludes World projects from the denominator and allocates shares of regional projects to IDA. By contrast, IEG includes World projects in its total but it does not consider regional projects for IDA project expenditures, given the difficulties in allocating these amounts. Using its own method, IFC management reports a project spend in IDA of 62 percent and 64 percent for FY11 and FY12.
31 IEG validated 100 percent of PCRs prepared for IFC Advisory Services during FY08–09. Beginning in FY10, IEG moved to a sampling approach, selecting a stratified (by business line) random sample from the population of PCRs (70 percent sampling rate). The sampling rate is set at a level sufficient to make inferences about success rates in the population at the 95 percent confidence interval with a sampling error of +/–5 percent or less. Among the sampling criteria used is the indicative development effectiveness self-rating from the PCRs. IEG excludes from the population PCRs prepared for non-client facing and knowledge management Advisory Services projects.
32 For projects closed in FY08–10, IEG rated impact achievement in 31percent of cases as ―too early to judge,‖ indicating that the impact has not yet been achieved, and another 12 percent as ―cannot verify,‖ that is, the project did not provide sufficient information to rate the project. In 18 percent of cases, impact achievement was rated as not applicable. As IFC’s ultimate objective is to achieve impact—focusing its advisory service on poverty—the IFC should assess the implications of this issue in the context of its efforts in strengthen its monitoring and evaluation systems.
33 IEG classified as ―linked‖ those Advisory Services projects in its evaluation database that were linked to an existing investment client (a client with an active investment).
34 Investment climate projects offer mainly advice on general business environment issues, and the PPP business line needs to carefully manage potential conflict of interests.
Appendix K
35 Although the World Bank defines country systems broadly, ―the country’s legal and institutional framework, consisting of its national, subnational, or sectoral implementing institutions and applicable laws, regulations, rules, and procedures‖ (World Bank 2005, p. 1), in practice the Bank’s focus to date has been on public financial management, procurement and social and environmental safeguards.
36 This is the methodology used in IEG (2011l) taking into account all operations with components coded with themes 25–34, 36, 40, 57, 73 and 90. The rationale for counting the full value of the operations is that the World Bank’s current policy is that GAC is being

ENDNOTES
114
mainstreamed, and that GAC components should improve the performance of entire operations. An alternative methodology was used in IEG (2008h), taking into account a smaller number of themes and counting only the value of the governance-related components. Although the amounts are different, the trend is the same.
37 For example, Articles of Agreement for IBRD state: ―The Bank and its officers shall not interfere in the political affairs of any member; nor shall they be influenced in their decisions by the political character of the member or members concerned. Only economic considerations shall be relevant to their decisions, and these considerations shall be weighed impartially…‖ (World Bank 1989, Article IV, Section 10).
38 CPIA data based on 2010 scores for Question 13: Quality of Budget and Financial Management (IEG 2011l).