innovative testing of ontario’s asphalt materials · 2017-06-16 · bitumen bond strength test...
TRANSCRIPT

Asphalt Mixture and Construction Expert Task Group Ames, Iowa May 2017
Innovative Testing of Ontario’s Asphalt Materials
Pamela Marks, P.Eng. Head, Bituminous Section
Ontario Ministry of Transportation

May 2017
Presentation Outline
Background Moisture Sensitivity Tests Hamburg Wheel Tracking Test Performance Tests using AMPT Future Work
• Performance Tests using DTS-30 • Bitumen Bond Strength Test (BBS)
Binder Test Highlights Conclusions
2

May 2017
Background
MTO was 100% Superpave mix design by 2005 • Superpave has mitigated rutting
• Cracking is still a concern
Establishing mix performance testing for design and acceptance of placed mix remains a goal
Work in this area is expected to be ramping up
3

May 2017
Stripping by Static Immersion Test
Determines the stripping susceptibility of the different components of an asphalt mix (MTO LS-285)
Aggregates are blended with asphalt cement and the blended material is submerged in distilled water at 49°C for 24 hours
Stripping susceptibility of the asphalt mix is assessed visually based on the percentage of the retained coating on the aggregate
4
~15% retained coating
~85% retained coating

May 2017
The percent coating of various samples can be compared to determine what aggregate, AC, and anti-stripping treatment combination, provides better moisture resistance
Minimum satisfactory value for this test is 65% retained coating
5
Aggregate Type No Treatment Hydrated Lime Alternative AST-AGG
Granite 15% 85% 90%
Stripping by Static Immersion Test

May 2017
Tensile Strength Ratio (TSR)
Determines the change in tensile strength resulting from moisture conditioning followed by a freeze-thaw cycle of compacted asphalt mixtures (AASHTO T283)
6
Test is used during mix design to determine susceptibility of an asphalt mix to moisture damage
In some cases we find this to be insufficient and specify anti-strip to minimize risk of stripping

May 2017
Moisture Induced Stress Tester (MIST)
An alternative moisture conditioning process to the TSR’s freeze/thaw conditioning
In addition to a conditioning process, MIST can be used to evaluate specimens based on sample swelling
Air voids are measured and the percent swelling is calculated using
𝑺𝑺𝑺𝑺𝑺𝑺𝑺𝑺 =𝑩𝑩𝑩𝒃𝑺𝒃𝒃𝒃𝑺 − 𝑩𝑩𝑩𝒂𝒃𝒂𝑺𝒃
𝑩𝑩𝑩𝒃𝑺𝒃𝒃𝒃𝑺
Where:
BRDbefore = Bulk Relative Density prior to MIST conditioning
BRDafter = Bulk Relative Density after MIST conditioning
7

May 2017
Moisture Sensitivity Test Results
The results of liquid anti-stripping treatments (AST-AC) for the moisture sensitivity are: * Not tested
The sample with the lowest retained coating, also has the lowest TSR, MIST-TSR and highest swelling value
Alternately, the diabase had greatest retained coating without AST, the highest TSR, MIST-TSR and lowest swelling
Testing has resumed using Dolomitic Sandstone aggregate
8
No No No No AST AST AST AST
Granite 15% 90% 67% 98% 62.0% 74.0% 4.2% 3.1%Diabase 98% * 84% 98% 69.0% 85.0% 2.0% 1.1%
Aggregate Type
Static Immersion
TSR MIST-Swelling
AST-AC AST-AC AST-AC
MIST -TSR
AST-AC

May 2017
Hamburg Wheel Tracking Test (HWT)
MTO uses our Hamburg Wheel Tracking Machine to:
9
• Evaluate mixes made with various antistripping additives
• Evaluate specialty mixes (e.g., fiber reinforced HMA)
• Investigate premature pavement failure
Have not used the HWT test to evaluate mixes before they are used in production or to evaluate mix during production

May 2017
AMPT MTO owns an AMPT (IPC Global) that can run the
following tests: • Dynamic Modulus • Flow Number • S-VECD • Texas Overlay
10

May 2017
Performance Testing using DTS-30 MTO is purchasing a Dynamic Testing System (DTS-30) that
will allow us to run the following: Dynamic Modulus Flow Number Simplified Visco Elastic Continuum Damage (S-VECD) Texas Overlay Four Point Bending Semicircular Bend (SCB) Disk-Shaped Compact Tension (DCT) Indirect Tensile (IDT) Creep Compliance and Strength Resilient Modulus TSRST (Thermal Stress Restrained Specimen Test)
11

May 2017
Bitumen Bond Strength Test (BBS)
The BBS test is a simple procedure to measure moisture resistance of the asphalt-aggregate interface for different combinations of materials
12
“Pull-Off Strength of Coatings Using Portable Adhesion Testers”. (ASTM D4541)
Just acquired the device

May 2017
Future Work More testing is planned with MIST and Bitumen Bond
Strength Test (BBS) MTO is embarking on a large mix testing program (mainly
involving SCB, DCT, IDT, HWT) Also looking at enhancing our recovery process when
evaluating production mix: • Currently run RTFO after recovery • Solvents used
MTO will explore testing production mix Considering proposals to establish a digital image
process that measures the risk of Stripping by Static Immersion
13

May 2017
Asphalt Cement Test Innovations
Ash Content Test
Extended Bending Beam Rheometer (ExBBR) Test
X-Ray Fluorescence (XRF)
Fourier Transform Infrared (FTIR) Spectroscopy
14

May 2017
Ash Content Test
Ash Content test was implemented to prevent over-modification with Re-Refined Engine Oil Bottoms (REOB)
15
R² = 0.74
0
500
1000
1500
2000
0 0.5 1 1.5 2Cra
ckin
g (m
/km
)
Ash Content (%)
• Limited analysis to date shows excellent correlation between 5 year pavement cracking and ash content
• Analysis of over 80 samples showed an excellent correlation between ash content and estimated REOB content
R² = 0.81
0.00
0.20
0.40
0.60
0.80
1.00
0.00 5.00 10.00
Ash
Con
tent
(%)
Estimated REOB Content (%)

May 2017
Extended Bending Beam Rheometer (ExBBR) Test
Determines if AC meets the low temperature performance grade after a physical hardening process that occurs with extended conditioning at cool temperatures
Test is published as AASHTO TP122-16
Found best able to predict cracking
ExBBR determines low temperature grade over 72 hours vs. 1 hour for standard grading
16

May 2017
Estimation of 72 Hour Stiffness and Creep MTO developed multivariable regression formulae to
predict the 72 hour ExBBR test based on 1 and 24 hour properties:
m-value at 72 hrs (Tht) = 0.03239*(m-value @ 1 hr) + 0.88952*(m-value @ 24 hr) + 0.01129
m-value at 72 hrs (Tlt) = 0.17770*(m-value @ 1 hr) + 0.795125*(m-value @ 24 hr) -0.00869
S at 72 hrs (Tht) = 0.13495*(S @ 1 hr) + 0.94721*( S @ 24 hr) + 3.34123
S at 72 hrs (Tlt) = 0.16874*(S @ 1 hr) + 0.93364*( S @ 24 hr) + 0.14202
Where:
Tht = high test temperature Tlt = low test temperature
Regression analysis was conducted on over 330 ExBBR tests
17
May 2017
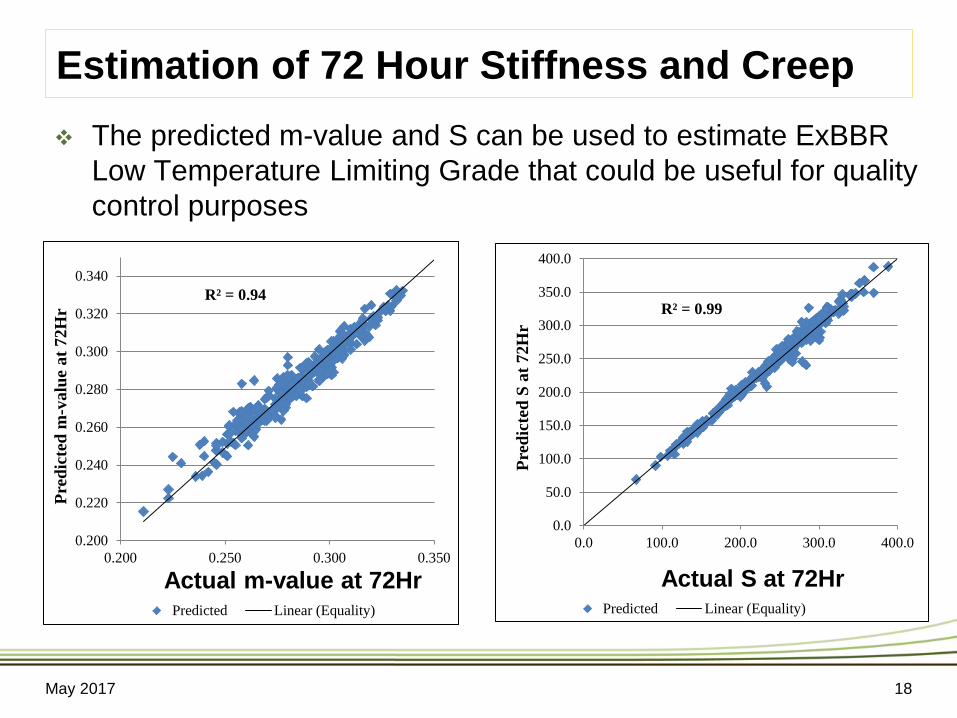
Estimation of 72 Hour Stiffness and Creep The predicted m-value and S can be used to estimate ExBBR
Low Temperature Limiting Grade that could be useful for quality control purposes
18
R² = 0.94
0.200
0.220
0.240
0.260
0.280
0.300
0.320
0.340
0.200 0.250 0.300 0.350
Pred
icte
d m
-val
ue a
t 72H
r
Actual m-value at 72Hr Predicted Linear (Equality)
R² = 0.99
0.0
50.0
100.0
150.0
200.0
250.0
300.0
350.0
400.0
0.0 100.0 200.0 300.0 400.0Pr
edic
ted
S at
72H
r
Actual S at 72Hr Predicted Linear (Equality)

May 2017
∆𝑻𝒄 From BBR / ExBBR Test Another useful outcome from the BBR test is the ΔTc:
∆𝑻𝒄= 𝑻𝒔𝒂𝑺𝒃𝒃𝑺𝑺𝒔𝒔− 𝑻𝒄𝒃𝑺𝑺𝒑
Where: Tstiffness = critical temperature for stiffness (S) Tcreep = critical temperature for creep (m-value)
Of the 62 samples tested, no BBR ΔTc’s where <-5, only ExBBR ΔTc’s dropped below -5, while REOB estimates for these samples ranged from 0 to just over 12%
Recent results: • For a PG64-28 was -7.9 • For recovered AC with and without RAP and RAS,
ΔTc ranged from -4.2 to -8.3
19

May 2017
Estimated REOB Content vs. ∆𝑻𝒄
20
R² = 0.29
R² = 0.31
-8-7-6-5-4-3-2-101
0.00 5.00 10.00 15.00
ΔTc
Estimated REOB Content (%)
ΔTc 1Hr ΔTc 72Hr
∆𝑻𝒄 <-5
May 2017
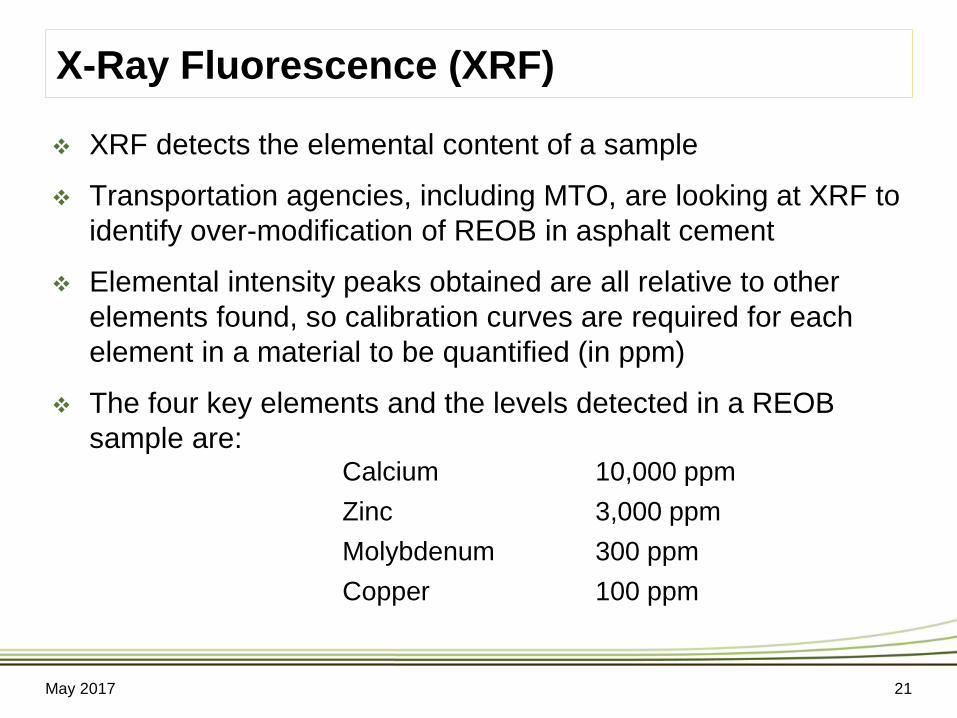
X-Ray Fluorescence (XRF)
XRF detects the elemental content of a sample
Transportation agencies, including MTO, are looking at XRF to identify over-modification of REOB in asphalt cement
Elemental intensity peaks obtained are all relative to other elements found, so calibration curves are required for each element in a material to be quantified (in ppm)
The four key elements and the levels detected in a REOB sample are:
Calcium 10,000 ppm Zinc 3,000 ppm Molybdenum 300 ppm Copper 100 ppm
21

May 2017
X-Ray Fluorescence (XRF)
MTO created calibration curves from base asphalt cement samples with varying percentages of REOB
A linear regression curve was created for each element
Equations currently used by MTO for estimating REOB content based on each element follow:
22
Element Equation for Estimating REOB Content
Calcium 𝑅𝑅𝑅𝑅𝑅 𝐶𝐶 =𝑋𝑅𝑋 𝐶𝐶 − 16
109
Zinc 𝑅𝑅𝑅𝑅𝑅 𝑍𝑍 =𝑋𝑅𝑋 𝑍𝑍 − 14
48
Molybdenum 𝑅𝑅𝑅𝑅𝑅 𝑀𝑀 =𝑋𝑅𝑋(𝑀𝑀) − 18
4
Copper 𝑅𝑅𝑅𝑅𝑅 𝐶𝐶 =𝑋𝑅𝑋 𝐶𝐶
1.5

May 2017
Fourier Transform Infrared (FTIR) Spectroscopy
FTIR detects the infrared energy absorbed in a sample
Comparing FTIR spectra of an unknown sample to a “standard” sample can be used to spot modifications made to an “unknown” sample
FTIR also provides information on the molecular bond and functional groups of modifications that are made to a material
We found a unique FTIR absorbance peak corresponding to REOB
The peak was observed near wavenumber 1229 cm-1 - believed to correspond to polyisobutylene, an additive used in engine oil
23

May 2017
FTIR Spectra
24

May 2017
REOB Estimation using FTIR and XRF FTIR can identify whether REOB is present in the AC MTO is estimating % REOB in AC with XRF Results are provided below for:
• comparison between FTIR peak and XRF estimated REOB content; and • five year pavement cracking performance
25
Sample FTIR Absorption XRF Count (ppm) Average
REOB Estimate
(%) at
1229 cm-1 Peak
Present? Ca Cu Zn Mo
1 172 Yes 937 24 668 79 13
2 181 Yes 1378 9 331 36 10
3 135 No 23 0 27 10 0.1
4 46 No 0 0 11 0 0
5 282 Yes 945 0 509 29 5.5
R² = 0.87
0
500
1000
1500
2000
0 5 10 15
Cra
ckin
g (m
/km
) XRF Estimated REOB Content
(%)
May 2017
Conclusions Our main focus has been on testing AC, however:
• MTO has a long history using HWT for investigations and new mixes
• The use of swelling after MIST conditioning is promising and warrants further investigation
• Expect to start evaluating various crack predicting mix tests this year
• Establishing a mix test for cracking, will be Ontario’s first step toward testing production mix for acceptance and will provide Contractors with a tool to use a balanced mix design
26

May 2017
Questions?
27
Pamela Marks, P.Eng. Head, Bituminous Section Ontario Ministry of Transportation 145 Sir William Hearst Avenue, Room 238 Downsview, Ontario M3M 0B6 (416) 235-3725 [email protected]