innovative product design for sustainability enhancement in
TRANSCRIPT

University of KentuckyUKnowledge
University of Kentucky Master's Theses Graduate School
2005
INNOVATIVE PRODUCT DESIGN FORSUSTAINABILITY ENHANCEMENT INALUMINUM BEVERAGE CANS BASED ONDESIGN FOR SUSTAINABILITY CONCEPTSJason Chun Tchen LiewUniversity of Kentucky
Click here to let us know how access to this document benefits you.
This Thesis is brought to you for free and open access by the Graduate School at UKnowledge. It has been accepted for inclusion in University ofKentucky Master's Theses by an authorized administrator of UKnowledge. For more information, please contact [email protected].
Recommended CitationLiew, Jason Chun Tchen, "INNOVATIVE PRODUCT DESIGN FOR SUSTAINABILITY ENHANCEMENT IN ALUMINUMBEVERAGE CANS BASED ON DESIGN FOR SUSTAINABILITY CONCEPTS" (2005). University of Kentucky Master's Theses.371.https://uknowledge.uky.edu/gradschool_theses/371

ABSTRACT OF THESIS
INNOVATIVE PRODUCT DESIGN FOR SUSTAINABILITY ENHANCEMENT IN ALUMINUM BEVERAGE CANS BASED ON
DESIGN FOR SUSTAINABILITY CONCEPTS
A new methodology for innovative product development based on the application of sustainability principles for the entire life-cycle of a product and beyond is developed. This involves an analysis of multi-life cycle material flow leading towards “perpetual life products”, making it truly sustainable. In order to achieve the function of such a sustainable product, it has to fulfill the concept of 6R (Recover, Reuse, Recycle, Redesign, Reduce and Remanufacture), which are composed of 6 stages of material flow in a product’s life, as opposed to the traditional 3R (Reduce, Reuse, Recover) concept. We apply the 6R concept in designing a new aluminum beverage can with much enhanced sustainability factors, especially in recycling processes. KEYWORDS: Design for Sustainability, Multiple and Perpetual Product
Life-cycle, 6R concept, Sustainable Product, Aluminum Beverage Can
Jason Chun Tchen Liew
6 May 2005

INNOVATIVE PRODUCT DESIGN FOR SUSTAINABILITY ENHANCEMENT IN ALUMINUM BEVERAGE CANS BASED ON
DESIGN FOR SUSTAINABILITY CONCEPTS
By
Jason Chun Tchen Liew
Dr. I.S. Jawahir Director of Thesis
Dr. I.S. Jawahir
Director of Graduate Studies
6 May 2005

RULES FOR THE USE OF THESES
Unpublished theses submitted for the Master’s degree and deposited in the University of Kentucky Library are as a rule open for inspection, but are to be used only with due regard to the rights of the authors. Bibliographical references may be noted, but quotations or summaries of parts may be published only with the permission of the author, and with the usual scholarly acknowledgements. Extensive copying of publication of the thesis in whole or in part also requires the consent of the Dean of the Graduate School of the University of Kentucky. A library that borrows this thesis for use by its patrons is expected to secure the signature of each user. Name Date

THESIS
Jason Chun Tchen Liew
The Graduate School
University of Kentucky
2005

INNOVATIVE PRODUCT DESIGN FOR SUSTAINABILITY ENHANCEMENT IN ALUMINUM BEVERAGE CANS BASED ON
DESIGN FOR SUSTAINABILITY CONCEPTS
_________________________________________
THESIS _________________________________________
A thesis submitted in partial fulfillment of the requirements for
the degree of Master of Science in Manufacturing Systems Engineering in the College of Engineering at the University of Kentucky
By
Jason Chun Tchen Liew
Lexington, Kentucky
Director: Dr. I. S. Jawahir, Professor of Mechanical Engineering
Lexington, Kentucky
2005
Copyright © Jason C. Liew 2005

This work is dedicated to my parents for their unceasing support during my undergraduate and graduate studies at the University of Kentucky. Their word of
encouragements is the reason that kept me dedicated to this work. I would also like to remember a special person in my life, Chin Hui Hui for standing solidly behind me all this time. Her care and love are the reasons
where I am today. Thank you.

iii
ACKNOWLEDGMENTS
This thesis, while an individual work, benefited from the insights and direction of
several people. The author wishes to express his gratitude and appreciation to Dr
I. S. Jawahir for his patience, constant encouragement, invaluable guidance and
advice throughout this research work. He is thankful to Dr. Subodh Das for the
opportunity to collaborate with him on this thesis. Special thanks and gratitude
are also expressed to Dr. Oscar Dillon and Dr. Keith Rouch for not only serving
as committee members but also for their help and the pleasure of working with
them.
Special appreciation is extended to the UK Center for Manufacturing and the
University of Kentucky, for providing facilities to carry out this work and a
fabulous graduate study experience. In addition, the work would not have been
possible without the collaboration of Secat Inc., who supported this thesis all the
way.
Equally important are the people around me. I am very grateful to my parents for
their unwavering support throughout my years at the University of Kentucky.
Special thanks also go out to all my colleagues and friends from the Machining
and Sustainability groups. Working together with all of you guys is an once-in-a-
lifetime experience which I will always treasure and cherish.

iv
TABLE OF CONTENTS
Acknowledgements .......................................................................................... iii
List of Tables .................................................................................................... vi
List of Figure .................................................................................................... vii
Chapter One: Introduction
1.1 Thesis Focus and Objective ............................................................. 1
1.2 Previous Research on Sustainability ................................................ 2
Chapter Two: Introduction to Packaging and Aluminum Beverage Cans
2.1 Aluminum in Packaging ................................................................... 9
2.2 Development of Aluminum Beverage Can ..................................... 14
2.3 Modern Aluminum Beverage Can Design ...................................... 19
2.4 Aluminum Beverage Can Manufacture .......................................... 22
2.5 Aluminum Beverage Can Recycling ............................................... 25
Chapter Three: Sustainability Challenges Facing Aluminum Beverage Can
3.1 Sustainability Development in the Aluminum Industry ................... 28
3.2 The Sustainability of Aluminum Beverage Cans ............................ 39
Chapter Four: Design for Sustainability
4.1 Design for Sustainability Methodology ........................................... 48
4.2 6R Concept: Multiple and Perpetual Material Flow ........................ 50
4.3 Certified Sustainable Product ........................................................ 55
Chapter Five: Innovative Aluminum Beverage Cans Design for Increased
Recylability
5.1 6R Concept applied to New Innovative Aluminum Can Design ...... 57
5.2 Finite Element Analysis of New Unialloy Can Design .................... 59
5.3 Impact of New Unialloy Aluminum Beverage Can Design ............. 67
Chapter Six: Unialloy Aluminum Beverage Can Recycling
6.1 Unialloy Aluminum Beverage Can Recycling Process Modeling ... 68
6.2 Aluminum Beverage Can Recycling Process Interactive Program .. 75

v
Chapter Seven: Discussion and Conclusion ................................................... 79
Appendix A. Visual Basic Programming for Aluminum Beverage Can Recycling
Process Interactive Program ........................................................................... 82
References ..................................................................................................... 84
Vita ................................................................................................................. 90

vi
LIST OF TABLES
Table 2.1: Various Can and Lid Types ......................................................... 21

vii
LIST OF FIGURES
Figure 1.1: Methodologies for Sustainable Manufacturing at Stages of Product Life-Cycles .................................................................................... 6 Figure 2.1: Aluminum in Packaging ................................................................ 12 Figure 2.2: Uses of Aluminum in Packaging .................................................. 13 Figure 2.3: Material Properties of Aluminum which makers it a Superior Packaging Material ...................................................................... 13 Figure 2.4a: The birth of the steel beer cans ................................................... 15 Figure 2.4b: The birth of the bottle cans .......................................................... 15 Figure 2.5: Aluminum Beverage Cans used to Package Pepsi-Cola and Coca-Cola Products in the 1960s ................................................ 16 Figure 2.6: Shaped Aluminum Cans from Crown Cork & Seal ...................... 16 Figure 2.7: Major Developments in Aluminum Beverage Cans ...................... 18 Figure 2.8: Anatomy of the Modern Aluminum Beverage Can ...................... 20 Figure 2.9: Construction of the Modern Aluminum Beverage Cans .............. 21 Figure 2.10: Aluminum Beverage Can Drawing and Wall Ironing Processes .. 23 Figure 2.11: Transformation of Aluminum Beverage Cans During
Manufacture ................................................................................ 24 Figure 2.12: Aluminum Beverage Can Recycling Process .............................. 26 Figure 3.1: Sustainable Development ........................................................... 28 Figure 3.2: World Aluminum Consumption in 2000 ....................................... 30 Figure 3.3: US Aluminum Shipment by Product Form in 2000 ...................... 30 Figure 3.4: US Aluminum Shipments by Major Markets in 2000 ................... 31 Figure 3.5: Aluminum Production and Life-Cycle .......................................... 31 Figure 3.6: Global Aluminum Production Data .............................................. 33 Figure 3.7: Accident Rates Worldwide in Aluminum Production .................... 35 Figure 3.8: Worldwide Collection (Recycle) Rates by Market ........................ 38 Figure 3.9: Innovation and Sustainability Relationship .................................. 40 Figure 3.10: Factors Affecting Product Sustainability ...................................... 40 Figure 3.11: The Aluminum Beverage Can’s Market Share in 2002 in
Europe ........................................................................................ 41 Figure 3.12: Aluminum Beverage Cans Discarded in the United States ......... 42 Figure 3.13: Number of Aluminum Beverage Cans Collected in the US for
Recycling .................................................................................... 43 Figure 3.14: Aluminum Beverage Can Recycling Rate in the US .................... 44 Figure 3.15: Number of Aluminum Beverage Cans Shipped in the US ........... 45 Figure 3.16: Aluminum Bottle Can .................................................................. 47 Figure 4.1: Major Elements Contributing to Design for Sustainability ............ 50 Figure 4.2: Automobile Life-Cycle ................................................................. 52 Figure 4.3: Stages of Material Flow in Perpetual Product Life-Cycle involving 6R Elements ................................................................................ 53 Figure 4.4: The Proposed Sustainability Enhancement in Aluminum Beverage Can ............................................................................................ 56

viii
Figure 5.1: Aluminum Beverage Can Design ................................................ 60 Figure 5.2: Shell93 8-Node Structural Shell .................................................. 62 Figure 5.3: Current Can Displacement Subjected to Loads .......................... 63 Figure 5.4: Current Can Stress Distribution Subjected to Loads (Bottom View) ................................................................... 63 Figure 5.5: Current Can Stress Distribution Subjected to Loads (Front View) ...................................................................... 64 Figure 5.6: Current Can Stress Distribution Subjected to Loads (ISO View) ........................................................................ 64 Figure 5.7: Unialloy Can Displacement Subjected to Loads ......................... 65 Figure 5.8: Unialloy Can Stress Distribution Subjected to Loads (Bottom View) ................................................................... 65 Figure 5.9: Unialloy Can Stress Distribution Subjected to
Loads (Bottom View) ................................................................... 66 Figure 5.10: Unialloy Can Stress Distribution Subjected to
Loads (ISO View) ........................................................................ 66 Figure 6.1: Unialloy Aluminum Beverage Can Recycling Process ................ 69 Figure 6.2: Dual Alloy Aluminum Beverage Can Recycling Process
Flow Chart ................................................................................... 70 Figure 6.3: Unialloy Aluminum Beverage Can Recycling Process
Flow Chart ................................................................................... 71 Figure 6.4: Product Life-Cycle ....................................................................... 72 Figure 6.5: Material Cycle ............................................................................. 73 Figure 6.6: Program Interface ....................................................................... 77 Figure 6.7: Sample Calculations ................................................................... 78

1
Chapter One
Introduction
1.1 Thesis Focus and Objective
Sustainable development is critical in today’s world with dwindling land
reserves, natural resources and growing populations which lead to increased
natural resources requirements and energy consumption rates as well as,
byproducts from economic developments such as environment pollutions and
societal changes. Historically, the manufacturing sectors have always played an
important part in any economic or societal growth. Therefore, it is imperative to
have sustainable manufacture. Sustainable manufacture is composed of three
sub-elements; sustainable product, sustainable manufacturing systems and
sustainable manufacturing process [1].
In this thesis, efforts will be put forth to identify a new sustainable product
design methodology. A new methodology for innovative product development
based on the application of sustainability principles for the entire life-cycle of a
product and beyond is developed. This involves an analysis of multi-life cycle
material flow leading towards “perpetual life products”, making it truly sustainable.
In order to achieve the function of such a sustainable product, it has to fulfill the
concept of 6R (Recover, Reuse, Recycle, Redesign, Reduce and
Remanufacture), which are composed of 6 stages of material flow in a product’s
life, as opposed to the traditional 3R (Reduce, Reuse, Recycle) concept. This
new product design methodology has wide ranging applications, from
automobiles to consumer electronics product designs. We will apply the 6R

2
concept to design a new aluminum beverage can with enhanced sustainability
factors, especially the recyclability.
One of the major advantages of aluminum beverage can is its capability to
be recycled over and over again without any quality loss, contributing to the
environment by reducing the need for fresh bauxites to make primary aluminum.
As with most mature and well developed products, the innovation curves tend to
reach a flat line, in addition to dwindling recycling rate over the years. Therefore,
it is critical to take a look at the design of the aluminum beverage can from a
fresh perspective in order to come up with possible solutions to increase its
sustainability, through its recyclability.
1.2 Previous Research on Sustainability
Before embarking on finding ways to enhance the sustainability of any
product, we need a proper definition of sustainability, sustainable product and
sustainable product design methodology. The most recognized definition of
sustainability come from the Bruntland Commission as “meeting the needs of the
present without compromising the ability of future generations to meet their own
needs” [2]. The term sustainability contains the idea that humans on this planet
should live in such a way, that the needs of the present are satisfied without
risking that future generations will not be able to meet their needs, with balance
between ecological, economic and social dimensions [3]. Sustainability is also
defined as the tendency of ecosystems to dynamically balance their consumption
patterns of matter and energy, and evolve to a point where life itself can continue

3
[4]. Achieving a comprehensive, global sustainability heavily depends on
collective and unified efforts of the global community involving multi-disciplinary
approach in three core areas of research: environment, economy and society [1].
Most research work on sustainability has so far primarily focused on
environmental effects. However, to achieve comprehensive sustainable
developments, it is important to look at all major influencing elements of
sustainability.
Sustainable products are products that are fully compatible with nature
throughout their entire life-cycle [5]. According to Sustainable Products
Corporation, sustainable products provide the greatest global environment,
economic and social benefits while protecting public health, welfare and
environment and are measured over their entire life-cycle, from raw materials
extraction to final reuse or disposal [6]. A sustainable product should make a
large economic impact while making a major contribution to environment and
societal needs [7].
There are several existing design methodologies to design and produce
sustainable products. The first is called BioDesign using the cyclic, solar and
safe elements [5], [8]. According to this approach, when activity equals damage,
do not try to reduce the environmental impact by trying to reduce the amount of
activity, but change the activities so that they are biocompatible and cause no
damage [8]. A sustainable product should be designed with these 5 elements in
mind: cyclic, solar, safe, efficient and social. Cyclic means that the product has
to be made from organic materials which is recyclable or compostable, or is

4
made from minerals that are continuously cycled in a closed loop. Solar means
the product must use solar energy or other forms of renewable energy, while safe
means that the product should not be toxic in manufacture, use or disposal. The
element efficient simply means that the product should use 90% less material,
energy and water during manufacture compared to similar products in 1990. The
last element, social, means that the product’s manufacture and use must support
basic human rights and natural justice.
Design for Environment (DFE) methodology considers product
development as an integrated system where every decision influences the whole
process and results in different impacts on the environment [4]. DFE utilizes
technological innovations and methodological proceedings to help designers and
decision makers to produce goods and services that are economically viable and
ecologically friendly [4]. First, the detailing of product needs and characteristics
is done to identify the environmental aspects that can make the product greener.
Next, an environmental impact analysis is done on the data collected from the
first stage. Lastly, low cost, design innovation and eco-friendly improvements are
made to the product from the results of the environmental impact analysis.
Products, processes and practices can be designed with a specific
sustainable growth rate for the control of pollution and for the reduction of
material and energy use by adopting the Paradigm E concept. Any corporation
that adopts the Paradigm E must emphasize Ecology, Environment, Energy,
Economy, Empowering, Education and Excellence in all product life-cycle
decisions [9]. The true goals of design for sustainability under the Paradigm E

5
are material and energy resource consumption, waste reduction, and prevention
of pollution because by pursuing these goals, green and robust products and
processes are produced [9].
The Sustainable Product Design (SPD) concept shows that it is fruitless to
try to define what sustainable product design is, because SPD encompasses a
great diversity of approaches which will vary with place, time, environment,
culture and knowledge [10]. Designing a sustainable product usually needs to
incorporate several factors, first being that necessity will dictate inventiveness.
Sustainability demands resourcefulness and new solutions have to be found
which require less energy and costs [10]. Secondly, designers need to improvise
and be spontaneous with working with the constraints of resources and realize
that most products are actually a physical manifestation of unsustainable
practices [10]. This may include using too many moving parts in a product, which
lowers its reliability or not utilizing the latest technology such as CAD and FEM
analysis in the design stage. A sustainable product also needs to have aesthetic
longevity and efficient energy use. In addition, it has to be able to be
manufactured locally to contribute to the economy and if it is to be mass
produced, integration of locally made components is necessary. All of these
factors can be broadly categorized into four core elements; Economics,
Environment, Ethics and Social [10].
Another approach to sustainable product design with emphasis on
sustainable manufacture and environmental requirements is shown in Figure 1.1
[11]. According to this, there are four examples of methodologies that have

6
recently been developed and represent the most significant stages of a product’s
life-cycle, which have an influence on its environmental performance. They are
introducing environmental awareness to customer requirements (CR), assessing
environmental performance as a design objective, performing life-cycle
assessment (LCA) during the design process and evaluating the product’s
potential for reuse and recycling. Factoring in the environmental requirements, a
new sustainable approach to product development and usage in four stages of
the product’s life-cycle is derived. They are environmentally conscious quality
function deployment (ECQFD), sustainable trade-off model for design, life-cycle
assessment and end-of-life options (EOL).
Figure 1.1: Methodologies for Sustainable Manufacturing at Stages of Product
Life-Cycles [11].
7
One of the roles of a sustainable product is to reduce or moderate
unintended pollutions. Therefore, a sustainable product design methodology
should take into account how to reduce pollutions through sustainable product
design [12]. There is three ascending sustainable product design scenarios, with
the first being Eco-redesigns (E-), which is a short-term, low-functional-change,
low-risk approaches that involve modifying present product designs,
manufacturing systems, materials and distribution systems and resulting in low
degree of environmental improvements [12]. The second scenario is Eco-
innovations (E+), which are long term, high-functional-change group of
approaches that focus on reinventing the ways and means used to provide
benefits to customers through products [12]. Lastly, emerging/unproven and
radical technology may be built into the product through Sustainable Technology
innovations (E++), with the objective of introducing the highest degree of
potential environment improvements.
Most methodology for designing a sustainable product assumes the
product as having only a single life-cycle. This is a severe limitation, because a
sustainable product needs to have a “closed-loop” material cycle. This idea can
even be taken further by saying that a truly sustainable product design
methodology is a fusion of all traditional product design methodologies with
emphasis on all three pillars of sustainability, environment, economy and society,
that produces a sustainable product with multiple and perpetual life-cycle. In
addition, most sustainable product methodologies emphasize the systems
perspectives. This is a top down approach as opposed to the bottom up

8
approach when working on sustainability from the product level. There are many
advantages to enhancing sustainability of a product from the product point of
view which will be discussed in later chapters.

9
Chapter Two
Introduction to Packaging and Aluminum Beverage Cans
Throughout the history of mankind, we have always been known as
explorers and inventors. Along with the discovery of fire and invention of the
wheel, the knowledge of packing food to extend its life is ranked as one of the
most important milestones in the human history that has often been overlooked.
The technology of food packaging has been the catalyst that propels man to
explore the new world and discover new things. It also helped to maintain the
civilization by supplying people with indispensable fresh food.
Over the years, the technology of food packaging keeps developing, with
new materials being used to construct the containers to keep food in, chemicals
to preserve food, and new manufacturing technology to package food.
Nowadays, aluminum is one of the most important materials in the food
packaging industry; it is being used widely to make foils, containers, bottles and
cans. In this section, we will look closely at the role aluminum plays in
revolutionizing food packaging, and the development of aluminum beverage cans.
2.1 Aluminum in Packaging
In 1795, the government of Napoleon offered a 12,000 francs reward to
anyone who came up with a method of preserving food. Fourteen years later, in
1809, Nicolas Appert, known as the father of canning, managed to preserve food
by sterilizing it, and he was awarded the 12,000 francs. The first food container
was patented by Peter Durand of England in 1810. It was made out of tin-plated
10
iron. In 1818 he introduced his container to America. One year later, in 1819,
Thomas Kensett Sr. and Ezra Daggett started to can oysters, fruits, meats and
vegetables in New York. Kensett eventually patented the tin-plated can in 1825.
Over the years, steel, plastics, glass and aluminum have been used to make
food containers, which evolved into many different shapes and sizes to cater to
the changing needs of consumers. Fast-forward to the twenty-first century;
aluminum has emerged as an important player in the food packaging industry
due to its superiority. Aluminum is known as a long life packaging material for
perishable food.
Early food packaging needed only to satisfy the most basic requirement of
the time, keeping food fresh and portable. However nowadays, besides its
protective properties, packaging has to fulfill economical, technical, social and
ecological demands [13]. The use of aluminum in the food packaging industry
started in 1910, when the first aluminum foil was produced. Aluminum was rolled
into sheets with thickness of just a hundredth of a millimeter. These sheets were
then laminated with paper to produce aluminum foil. The following year, in 1911,
chocolate manufacturers started to use aluminum foil to wrap their chocolates.
Eventually, aluminum foil displaced the use of tin foil. From then on, aluminum
use in the packaging industry has continued to expand, as shown in Figure 2.1.
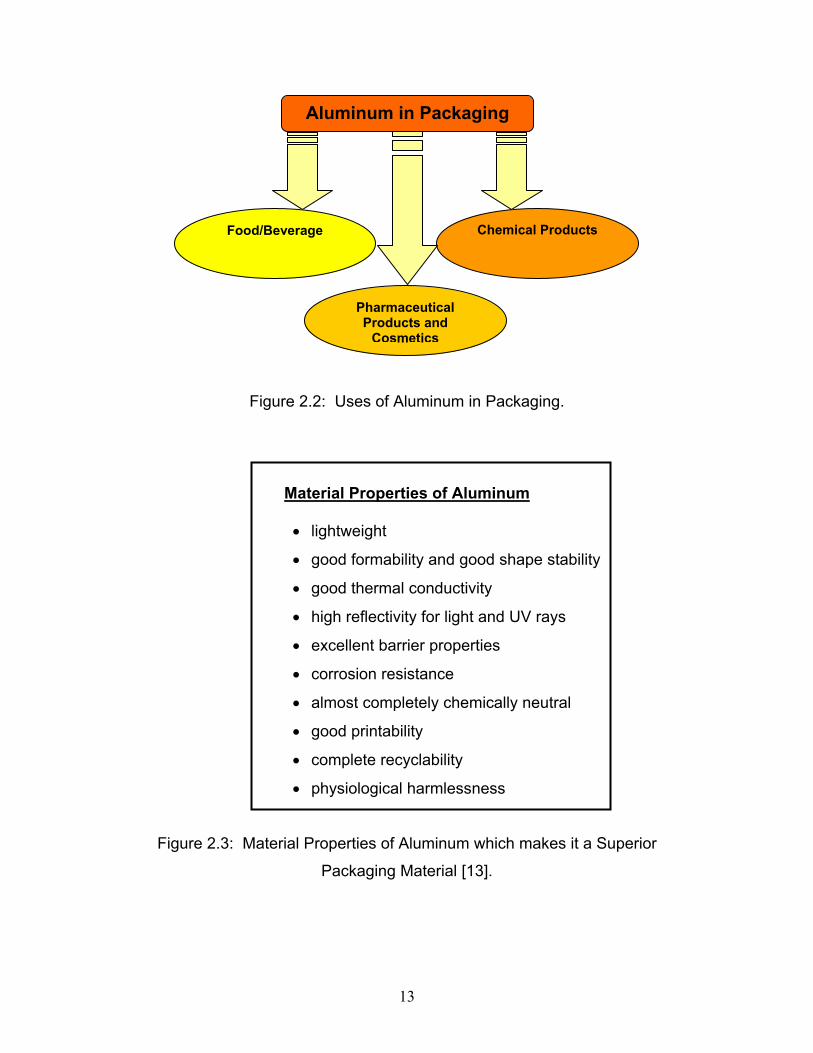
Today, aluminum is widely used and is dominant in the packaging industry
(Figure 2.2). Aluminum packaging offers a range of properties that contribute to
a high degree of acceptance with traders and consumers alike [13]. Aluminum
packaging is lightweight; the metal itself is easily formed, and provides good

11
shape stability. It also has good thermal conductivity, and reflects light and UV
rays. Its excellent barrier properties protect contents in the aluminum package,
and its corrosion resistance makes it invincible for many types of food and
beverage. Aluminum is also chemically neutral, and packaging made out of it
can be printed on easily. Most important from the viewpoint of sustainability is its
ability to be recycled over and over again, as we shall discuss in later chapters.
Physiologically, aluminum is harmless. All the attributes are listed in Figure 2.3.

12
Figu
re 2
.1:
Alu
min
um in
pac
kagi
ng.
13
Figure 2.2: Uses of Aluminum in Packaging.
Material Properties of Aluminum
• lightweight
• good formability and good shape stability
• good thermal conductivity
• high reflectivity for light and UV rays
• excellent barrier properties
• corrosion resistance
• almost completely chemically neutral
• good printability
• complete recyclability
• physiological harmlessness
Figure 2.3: Material Properties of Aluminum which makes it a Superior
Packaging Material [13].
Food/Beverage
Pharmaceutical Products and
Cosmetics
Chemical Products
Aluminum in Packaging

14
2.2 Development of Aluminum Beverage Cans
Aluminum beverage cans are part and parcel of today’s life for most
Americans. We take these cans for granted most of the time, and do not think
twice about it when using or discarding them. We do not realize that these cans
have undergone nearly 70 years of amazing design and manufacturing
innovation and evolution, starting with the birth of the steel can. Today’s
aluminum beverage cans are the result of years of hard work, and the fruit of new
manufacturing technology. The can is not only lightweight; it is also structurally
very advanced. The commercial can nowadays weigh only 0.48 ounce,
compared to 0.66 ounce in the 1960s [14]. This is a reduction of almost 27%.
Aluminum beverage cans have a thickness less than two pieces of paper, yet
could withstand pressure of more than 90 pounds per square inch, about three
times the pressure in an automobile tire [14].
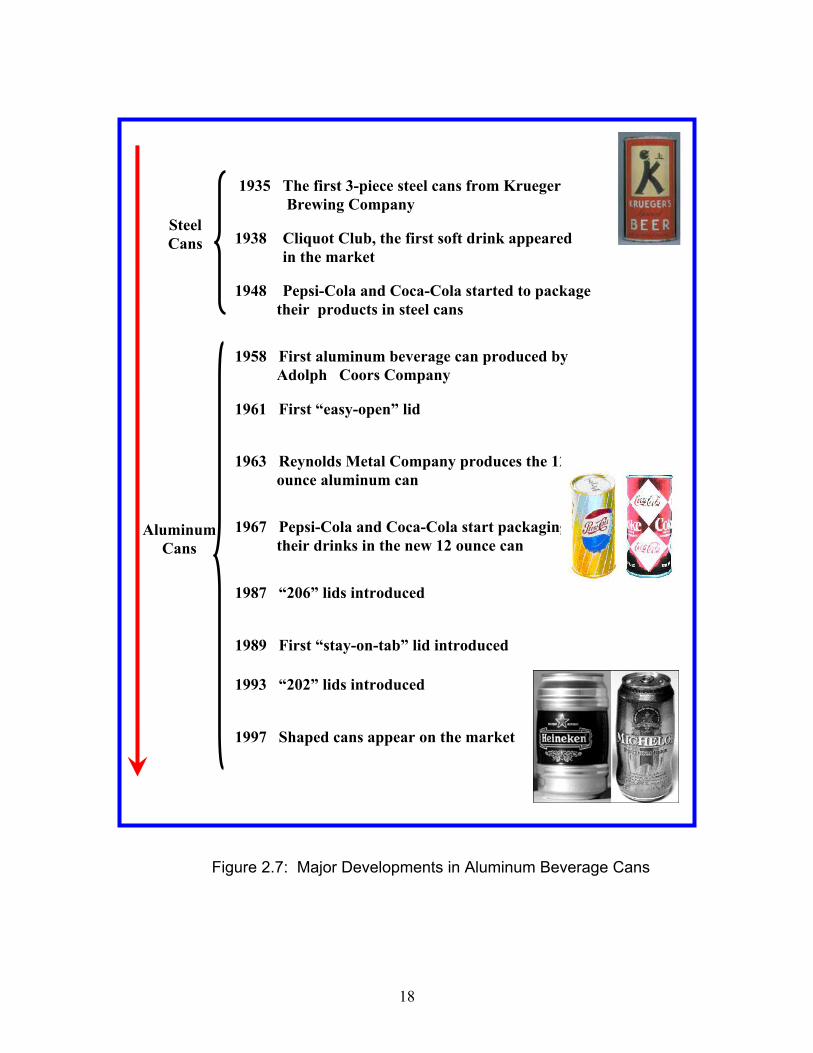
All this started almost 70 years ago in 1935, when the first 3-piece steel
beer can was produced by the Krueger Brewing Company (Figure 2.4a). This 3-
piece can consisted of a rolled and seamed cylinder and two end pieces [14].
The design required that consumers use a pointed instrument to open it [15].
Some earlier designs also incorporated conical tops sealed by bottle caps
(Figure 2.4b) [14]. The first canned soft drink was Cliquot Club ginger ale, which
appeared in 1938. However, it was beset by leakage and flavor absorption
problems from the can liner [16]. The problems were only solved in 1948, when
the first major soft drinks packaged in a steel can were launched by Pepsi-Cola
(Figure 2.5) and the Continental Can Company.

15
(a) (b)
Figure 2.4: The birth of the steel beer cans (a) and the bottle cans (b) (Source:
Beer Can Collection of America [16]).
The first aluminum beverage can was marketed in 1958 by the Adolph
Coors Company in Golden, Colorado, and introduced to the public by the
Hawaiian brewery Primo [14]. This first two-piece aluminum beverage can was
produced using the impact-extrusion process. The Coor’s can was structurally
weak, and had a capacity of only 7 ounces. However, consumer demands
pushed the can to evolve further, with the introduction of the first easy-open lid in
1961. In 1963, Reynolds Metal Company introduced a new manufacturing
process for producing 12-ounce aluminum cans, from which all modern can
manufacturing processes are derived. It was used to package a diet cola called
“Slenderella” [16]. Hamms Brewery in St. Paul, Minnesota begin to package
beer in the 12 ounce aluminum can in 1964, and Pepsi-Cola and Coca-Cola soon
followed in 1967 [14]. The first “206” (diameter of 2.5”) lid was introduced in

16
1987, followed by the current “202” (diameter of 2.25”) lid in 1993. The current
“stay-on-tab” lid has been around since 1989. To increase customer appeal and
create a distinctive look for the product, the first shaped can from Crown Cork &
Seal appeared in 1997 (Figure 2.6). A comprehensive time line of major
developments in aluminum beverage can is shown in Figure 2.7.
Figure 2.5: Aluminum Beverage Cans used to Package Pepsi-Cola and
Coca-Cola products in the 1960s [16].
Figure 2.6: Shaped Aluminum Cans from Crown Cork & Seal [17].

17
Today, the aluminum beverage can is the primary packaging container
used in the soft drink and beer industries in the United States and the world.
Steel cans have been virtually displaced by aluminum cans [14], except in some
parts of Europe and Asia. Aluminum beverage cans have undergone many
changes throughout the years, but cannot stay stagnant if they want to be ahead
of the competition, especially against PET plastics in the soft drink segment, and
glass in the microbreweries segment [18]. Customer demands and sustainability
concerns will be the main factors dictating changes in the future.
18
Figure 2.7: Major Developments in Aluminum Beverage Cans
Aluminum Cans
1935 The first 3-piece steel cans from Krueger Brewing Company
1938 Cliquot Club, the first soft drink appeared in the market
1948 Pepsi-Cola and Coca-Cola started to package their products in steel cans
Steel Cans
1958 First aluminum beverage can produced by Adolph Coors Company
1963 Reynolds Metal Company produces the 12- ounce aluminum can
1987 “206” lids introduced
1993 “202” lids introduced
1961 First “easy-open” lid
1989 First “stay-on-tab” lid introduced
1997 Shaped cans appear on the market
1967 Pepsi-Cola and Coca-Cola start packaging their drinks in the new 12 ounce can

19
2.3 Modern Aluminum Beverage Can Design
Modern aluminum beverage cans are designed using the latest tools, such
as finite element analysis [19] and the most advanced manufacturing processes
[14], [20]. Aluminum cans today are not only lightweight and strong, but also
provide customer appeal, and are effective at keeping food and beverages fresh.
Figure 2.8 shows the anatomy of the modern aluminum beverage can.
Modern aluminum beverage cans consist of 2 major pieces, the body and
the lid (including the stay-on tab), as opposed to the earlier 3 piece design
(bottom, body and lid) for steel cans. The body is manufactured using an impact
extrusion process known as two-piece drawing and wall ironing, first introduced by
the Reynolds Metal Company in 1963. The body is made out of an aluminum
alloy AL3004, with composition by weight of 1% manganese, 0.4% iron, 0.2%
silicon and 0.15% copper. Its thickness is about 0.003 inches, thicker at the
bottom for added strength [14]. The structural strength of the aluminum can is
enhanced by the shape of the bottom, which curves inward to assume a dome
shape. The top of the body is usually necked to accommodate the lid, which has
grown smaller in diameter over the years.
The lid or can end is an integral part of the can, made out of aluminum
alloy AL5182. It contains less manganese and more magnesium, thus making it
stronger than the body [14]. The center of the lid is usually drawn up to make a
rivet for the tab. The tab is used to open the can, and is usually scored to make it
easier to open. Over the years, the diameter of the lid has progressively become
smaller and smaller; the “202” lid is the standard today.

20
Figure 2.8: Anatomy of the Modern Aluminum Beverage Can [14].

21
12
8
The aluminum beverage can the lid made out of a stronger alloy than the
body because the top needs to be able to withstand top loadings during stacking.
It must also be strong enough to be double-seamed. Current aluminum beverage
cans come in different sizes, from 4 oz up to 32 oz of liquids. In addition, the lid
also comes in various sizes and colors, with the “202” type the most popular today.
Table 1 shows the various can sizes and lids manufactured today.
Table 2.1 Various Can and Lid Types
Aluminum Beverage Can Sizes (oz) Aluminum Beverage Can End Types and Sizes
Figure 2.9: Construction of Modern Aluminum Beverage Cans
32
11.3
6.8
16
8.4
4
202 (2.25” diameter)
204 (2.38” diameter)
206 (2.5” diameter)
Body Lid -Al 3004 alloy Al 95-98.4% Mg 0.8-1.5% Mn 0.8-1.5% Fe Max 0.7% Cu Max 0.25% -0.003 inch wall thickness -Thicker at the bottom for added integrity -Dome-shaped base to resist internal pressure -Able to withstand internal pressure of 90 psi, and support 250 lbs
-Al 5182 alloy Al 93.2-95.8% Mg 4-5% Mn 0.2-0.5% Fe Max 0.35% Cu Max 0.15% -25% of the total can weight -Stronger than the body -Diameter is smaller to save on mass (206, 204, 202) -Center of the lid is stretched upwards, and then drawn to form a rivet to hold the tab
22--ppiieeccee ccoonnssttrruuccttiioonn
25
10
5.5

22
2.4 Aluminum Beverage Can Manufacture
Aluminum beverage can manufacture starts with uncoiling rolls of
aluminum sheet. Each coil can weigh up to 25,000 lbs. AL3004 alloy is used to
manufacture the body and AL5182 alloy for the lid or can end. To manufacture
the body of the can, after uncoiling, the sheets are passed through a lubricator.
Here, a thin film of lubricant is applied to the surface of the sheets, which pass on
to the cupper, where circular blanks are cut from the sheet and formed into cups.
This process, called backward extrusion, can produce 2500 to 3750 cups per
minute. A series of tooling dies is then used to redraw and iron the cups until the
specific shape and specifications of the can body are obtained. After that, the
open end of the can is trimmed to a uniform height. The redrawing and ironing
processes is shown in Figure 2.10.
The can is next washed and dried to prepare for application of internal
coatings and outside labels. A base coat of lacquer is next applied to the outside
surface of the can, before it goes into an oven to be cured. Graphics are then
printed onto the outside surface, using up to 6 different combinations of color
before a thin film of lacquer is applied. Lacquers are also applied to the bottom
of the can. Next, the whole thing goes into another oven to be cured. Another
film of lacquer is applied to the internal surface of the can, which goes into
another oven to be cured.
The can next goes though a machine called the waxer, where another film
of lubricant is applied to the edges of the can in preparation for necking. A

23
Figu
re 2
.10:
Alu
min
um B
ever
age
Can
Dra
win
g an
d W
all I
roni
ng P
roce
sses

24
machine called the die necker then gradually rolls the top opening down to
specific diameters, depending on which size of lid will be used. The flanger then
rolls back the top of the can, in order to form a lip to which to attach the can end
after filling. The outer dome is next reprofiled for stackability, or inner dome
reformed for strength. Quality inspection is performed next to check for pinholes
or other damage. Cameras are used to check for inside contamination before
the cans are palletized to be shipped to customers. Customers such as soft
drink companies then fill the cans with their product, and finally the lid or can end
is attached and seamed. Figure 2.11 shows the physical transformation of the
can through each process.
Figure 2.11: Transformation of Aluminum Beverage Cans During Manufacture
[14]
25
The lid or can end also starts off with coiled aluminum sheets. In this case,
the sheet is AL5182. After being lubricated, the sheets go into a shell press. A
circular disc is blanked and then formed into a shell. This process can produce
up to 5,500 shells per minute in a modern plant. The shell is then discharged
through a curler, which forms the precise shape required for the double seaming
operation to attach the lid to the body. A liquid sealing compound is then applied
to the end, and the shells moved to a conversion press where the score is
formed and tab attached. After quality control checks, the lids are shipped to the
customers.
2.5 Aluminum Beverage Can Recycling
Aluminum beverage can recycling was started as a result of the “Ban the
Can” campaign in the seventies. Used aluminum beverage cans were
considered an eyesore, and manufacturers had to set up recycling centers to
deal with this issue. In addition, the 1973 OPEC oil crisis forced manufacturers
to find a more energy-efficient way to manufacture aluminum beverage cans.
They found that recycling only consumes 5% of the energy needed to produce
the same can from virgin metals. At a 25% recycling rate, the aluminum can is
more energy efficient than the bi-metal can, and with 60% recycling it becomes
competitive with the returnable bottle [21].
The aluminum beverage can recycling process in a modern recycling plant
is illustrated in Figure 2.12. Used beverage cans (UBCs) come in bales weighing

26
Figu
re 2
.12:
Alu
min
um B
ever
age
Can
Rec
yclin
g P
roce
ss [2
2], [
23]

27
approximately 400 kg, or as briquettes with maximum density of 500kg/m3 [22].
The first step in recycling UBCs is to shred them to ensure that no trapped liquid
or extraneous material reaches the melters, which might cause serious damage
or injuries [22] & [23]. After being shredded, the UBCs pass through a magnetic
separator to remove any ferrous contaminants. Nonmagnetic and nonferrous
materials such as lead, zinc and stainless steel are separated using an air knife.
The next step is delacquering, usually carried out in two ways. The first
method is to expose the UBCs to a “safe” temperature over a long period of time;
the second method is to heat the UBCs to a temperature just below the melting
temperature of the alloys for a short time. The UBCs then move to the next
stage, the thermal-mechanical separation process. In this stage the temperature
is held constant at a specific level in a neutral atmosphere; by gentle mechanical
action the AL 5182 alloys are broken into small fragments, along the grain
boundaries weakened by the onset of incipient melting [22], [23]. The
fragmented AL 5182 particles then pass through an integrated screen and are
transported to lid stock melters, and the AL 3004 particles are sent to body stock
melters.

28
Chapter 3
Sustainability Issues of Aluminum Beverage Cans
One of the most well known definitions of sustainability is from the 1987
Brundtland Commission Report. It defined sustainability simply as “meeting the
needs of the present without compromising the ability of future generations to
meet their own needs” [2]. Economic viability, social responsibility and
environment protection are the three pillars of sustainable development [24].
Figure 3.1 illustrates all major components of sustainable development,
encompassing the three pillars of sustainability.
Figure 3.1: Sustainable Development [25]
Sustainable Development
Sustained Growth
Environmental Sustainability
Economic Sustainability SocietalSustainability
Plants, Forestry & Vegetation
Water, Soil & Air Pollution
Industry Emissions &
Toxicity
Sustainable Natural
Resources (Oil, Gas,
Minerals, etc)
Sustainable Agriculture
Sustainable Living (Health,
Safety, etc.)
SustainableProducts
Sustainable Cities, Villages & Communities
Sustainable Manufacturing
Systems
Sustainable Manufacturing
Processes
Sustainable Manufacture
29
The application of sustainability ranges from sustainable city and urban
development to sustainable consumer products. Current concepts regarding
sustainability are more concerned with determining the economic and social
dimensions of sustainability and linking these with the ecological dimension [24].
This approach is referred to as “corporate social responsibility” [24].
Comprehensive, global sustainability heavily depends on collective and unified
effort of the global community involving multi-disciplinary approach [1].
3.1 Sustainability Development in the Aluminum Industry
Aluminum is probably one of the most important and essential metals in
the industrialized world today. Its strength, conductivity, recyclability, and light
weight make it ideally suited to the needs of a highly mobile and technologically
sophisticated world [26]. Aluminum also fits well in the concept of sustainability
because it is the most environmentally sustainable material available to our
increasingly resource-conscious planet [26]. Aluminum applications began in
1886 when Hall and Héroult discovered how to mass produce aluminum through
electrolysis. In 1900, the annual output of aluminum was only 1000 tonnes, but
this figure rose to 20 million tonnes by the end of the 20th century. In 2000, the
United States shipped $6.1 billion worth of aluminum [26]. This makes aluminum
the world’s second most used metal [27]. Figure 3.2 shows the world’s uses of
aluminum, with the transportation sectors consuming the most aluminum
compared to other sectors. The packaging sector consumes 20% of worldwide
aluminum usage, tied with the construction sectors.

30
Construction20%
Packaging20%
Others25%
Electrical9%
Transportation26%
Figure 3.2: World Aluminum Consumption in 2000 (Data from [27])
Sheet, Plate & Foil49%
Ingot28%
Extrusions & Tube16%
Others*7%
Figure 3.3: US Aluminum Shipments by Product Form in 2000 (Data from [26])
*OtherElectrical Conductor 2.8% Rod, Bar, Wire 2.8% Forgings & Impacts 1.0% Powder & Paste 0.6%

31
Building & Construction
13%
Exports11%
Other9%
Electrical7%
Consumer Durables
7%
Container & Packaging
20%
Transportation33%
Figure 3.4: US Aluminum Shipments by Major Markets in 2000 (Data from [26])
Figure 3.5: Aluminum Production and Life-cycle [27]
Figure 3.3 shows US aluminum shipments by product form and by market in
Figure 3.4. Aluminum in the form of sheet, plate and foil constitutes the largest

32
shipment in the US in 2000, while the transportation sector consumes 33% of US
aluminum shipments, closely followed by the packaging industry at 20%. Most of
the uses of aluminum sheets, plate and foil are in the packaging industry, for
making aluminum beverage cans, food containers etc. Figure 3.5 shows the life-
cycle of a typical aluminum product, starting with bauxite mining and extraction,
ending with recycling by collecting scraps and secondary smelting.
Two important sectors for aluminum consumptions are the transportation
sector, specifically the automobile industry, and the food packaging industry.
Due to the superior weight to strength ratio, aluminum is widely used to make
light and fuel-efficient cars. During an automobile’s production, one kilogram of
aluminum can replace two kilograms of conventional heavier materials, thus
helping in reducing the automobile’s weight and cutting down fuel consumption
and emissions while retaining or improving the vehicle’s safety [27]. This
translates into a reduction of 20 kilograms of CO2 [27] for every kilogram of
aluminum used to replace conventional materials used in automobile
manufacture. It has been forecasted that by 2020, there will be a 35% increase
in CO2 emissions from all vehicles, while an increased use of aluminum in
vehicles would reduce these statistics to 28% [27]. Therefore, the use of
aluminum is one important option in sustaining the automotive industry.
Aluminum used in the food packaging industry helps to preserve food
quality, reduces wastes and provides convenience for consumers [13], [27]. Its
excellent properties described in Chapter 2 and shown in Figure 2.3 help it to
saves about 30% of the world’s food from wastage [27]. Only about 10% of the
33
energy consumed in the production of foodstuff is attributed to packaging, with
50% of energy consumed during primary production of the foodstuff itself and
35% for the food preparation and handling [27]. The public used to have the
misconception that packaging, be it aluminum beverage cans or aluminum foil,
creates environmental pollution. However, the fact is that packaging saves ten
times more waste than it creates [27].
0
2
4
6
8
10
12
14
1990
1991
1992
1993
1994
1995
1996
1997
1998
1999
2000
Global Mettallurgical AluminaProduction (X 10 million of tonnes)
Global Primary Production (X 10millions of tonnes)
Global Energy Used in MettalurgicalAlumina Production (Mj/tonnesalumina)Global Electric Energy for Electrolysis(X10 kWh/kg)
Global Electrolisis Greenhouse GasEmissions (kg CO2/kg AL)
Global PFC Emissions Reduction(CF4 emissions/tonnes AL)
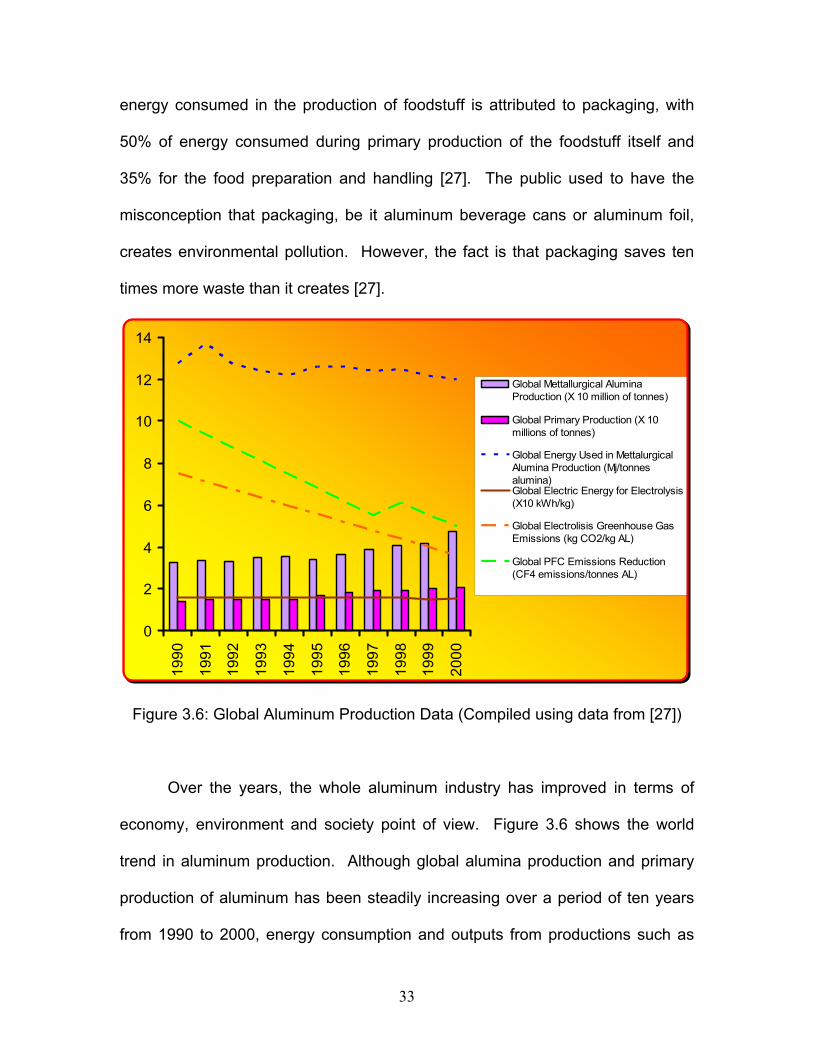
Figure 3.6: Global Aluminum Production Data (Compiled using data from [27])
Over the years, the whole aluminum industry has improved in terms of
economy, environment and society point of view. Figure 3.6 shows the world
trend in aluminum production. Although global alumina production and primary
production of aluminum has been steadily increasing over a period of ten years
from 1990 to 2000, energy consumption and outputs from productions such as

34
green house gases and PFC have been on the decline. This shows that it is
possible to have a sustainable growth and development without sacrificing
economic profits or ecological side effects. Both, the economy and the
environmental sustainability can go hand in hand. Improvements in green house
gas emissions and energy consumption reductions in production mainly have to
do with technological advancements over the years in production and
manufacturing processes. Aluminum is derived from bauxite ores, which has to
be mined. About 120 million tonnes are extracted annually, and the global
commercially available bauxite reserves will last for more than 200 years [28].
Although only a small percentage of bauxite, about 6%, is mined in the rain forest
region (2.4 square kilometers is used annually, about 0.00002% of the world’s
rain forest), extensive rehabilitation of the land is still carried out by the aluminum
industry after extraction of the ore [28]. In 1990, a bauxite mine in Western
Australia was awarded the “Global 500 Roll of Honor for Environmental
Achievement” prize by the United Nations for their role in rehabilitation and
environment protection.
Most companies involved in the aluminum industry have adopted the
concept of “corporate citizenship”, where consideration has been given to a
company’s social responsibility and to concepts of socially correct business
dealings, while at the same time bearing the aspects of sustainability in mind [29].
The first step in protecting society in the sustainable aluminum industry starts at
the refinery plant level. Figure 3.7 shows statistics for global accident rates at
smelters, refineries, mines and all aluminum plants. A downward trend is

35
0
5
10
15
20
25
30
35
40
45
Accident Rate (Accidents per million hours
worked)
1999
2000
1999
2000
1999
2000
1997
1998
1999
2000
Smelters Refineries Mines All Plants
Lost time accidentrate
Restricted work/medical treatmentaccident rate
Figure 3.7: Global Accident Rates in Aluminum Production (Data from [27], [29])
observed in all categories, and therefore showing that sustainability at the
societal level, in terms workers’ safety and welfare, in the aluminum industry is
on the rise. If we look at the product level, aluminum products have really
revolutionized the human society. From transportation to food packaging,
aluminum is indispensable at the societal level. We have seen how aluminum is
used in automobiles not only to increase fuel efficiency and reduce CO2
emissions, but also enhance to an automobile’s safety. Crash tests of
automobiles show that aluminum absorbs at least as much energy as steel
structures [29]. In addition, aluminum is also used in airplanes to reduce weight.
Today’s Boeing 747 aircraft is comprised of 80% aluminum. This helps the
airline industry to transport about a third of the world’s trade goods in value, and

36
it carried 1.5 billion passengers in 1999. Both use of aluminum in automobiles
and airplanes have greatly increased human and goods mobility. Use of
aluminum in the packaging industry has helped protect society against food
contamination as well as preserving food and beverages for a longer period of
time. Its properties shown in Figure 2.3 make aluminum one of the most
effective and long life packaging materials. Even an extremely thin layer of foil
help maintains the freshness of foods that quickly deteriorate, such as milk and
enables medicine to be transported and stored in tropical regions with high
humidity [29].
From the systems perspective, the aluminum industry provides jobs to
countless people and is vital economy drivers for many countries. Kentucky has
a huge aluminum industry and if it were a country, it would have the most
concentration of aluminum plants in the world, with an average annual worker’s
wage of $46000. The United States is one of the largest producers of primary
aluminum metal in the world with shipments worth $6.1 billion in 2000 [26].
Aluminum contributes 50% of Jamaica’s exports and provides employment to
over 4000 people there, with the least qualified workers earning up to four times
the legally required minimum wage in that country [29]. In Brazil, aluminum
companies provided elementary education for the children of their employees
and donated education materials to over 25000 school children [27]. The
German aluminum industry employs about 75000 people with a total wage and
salary bill of four billion euros [30], making it one of the largest industries in that
country. In Ghana, the Volta Aluminum Company contributes $200 million

37
annually to the economy, making it the fifth largest contributor of foreign
exchange to the country [27].
Another critical aspect that contributes to the sustainable development of
the aluminum industry is recycling. Aluminum is an “energy bank” that can be
recycled over and over again without quality loss. Its amazing recyclability
ensures that a deposit made into this bank will preserve its value [26]. The
suitable phrase for consumption of aluminum is that it is used and not consumed
[31]. A large number of secondary aluminum metals from the “aluminum pool”
can be recycled and reused. A widely known fact is that aluminum products can
be recycled and remanufactured endlessly with only 5% of the energy and
emissions originally required to produce the virgin product [26]. It takes about
95000 Btus of energy to make one pound of primary aluminum from bauxite ore,
but only 4300 Btus from scrap, or secondary aluminum metal [32]. Figure 3.8
shows the worldwide recycling rate of various aluminum products with respect to
markets in 1990 and 2000. Generally, the trend is pretty encouraging with
increased recycling rates in all markets, with the exception of one; the aluminum
beverage can market, which decreased from 61% in 1990 to 59% in 2000. As
stated earlier, aluminum recycling is a critical factor in ensuring the sustainable
development of the aluminum industry, due to the fact that recycling contributes
to the three pillars of sustainability. Recycling is beneficial to the environment,
reducing wastes and scrap. It also reduces the need for clearing land for fresh
supply of bauxites. Recycling is economically viable, since aluminum is an
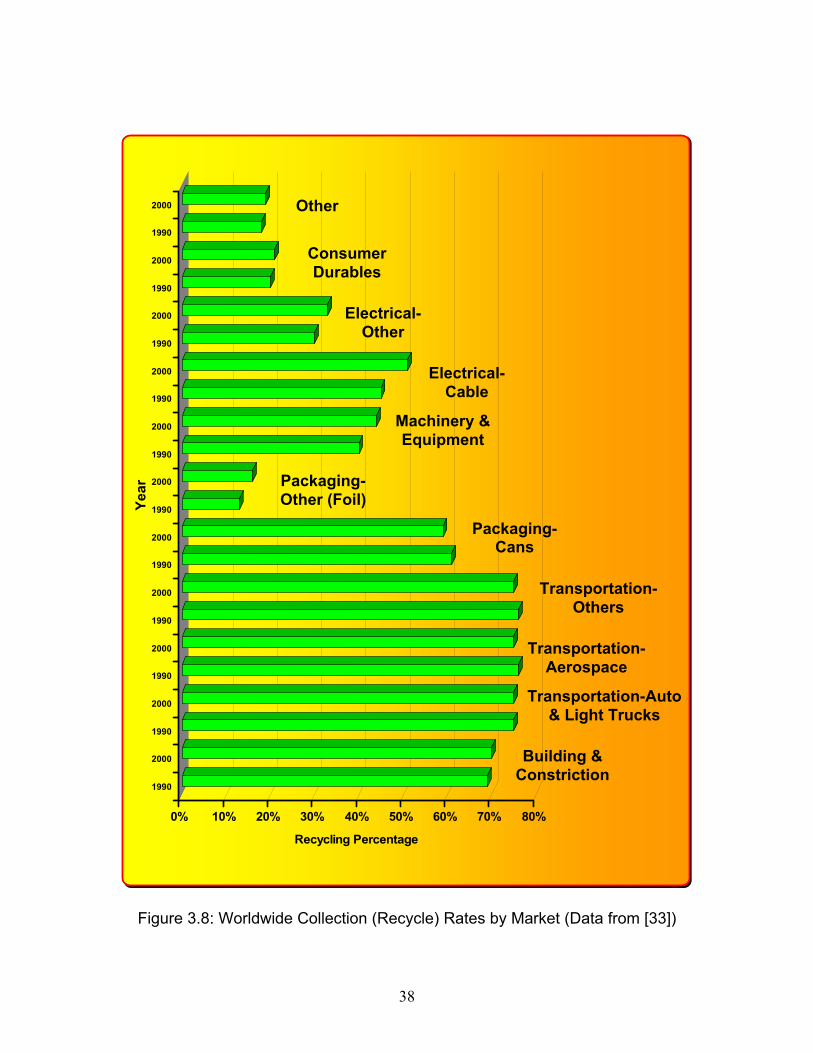
38
0% 10% 20% 30% 40% 50% 60% 70% 80%
Recycling Percentage
1990
2000
1990
2000
1990
2000
1990
2000
1990
2000
1990
2000
1990
2000
1990
2000
1990
2000
1990
2000
1990
2000
Year
Figure 3.8: Worldwide Collection (Recycle) Rates by Market (Data from [33])
Other
Consumer Durables
Electrical-Other
Electrical-Cable
Machinery & Equipment
Packaging-Other (Foil)
Packaging-Cans
Transportation-Others
Transportation-Aerospace
Transportation-Auto & Light Trucks
Building & Constriction

39
“energy bank”, and producing aluminum from scrap only consumes 5% of the
energy used to extract aluminum from bauxites. The recycling industry creates
jobs for society, and helps them to live in a cleaner and better environment.
The aluminum industry as a whole is moving in the right direction in
achieving a sustained growth and development. However, one particular area of
concern in the aluminum industry is the aluminum beverage can market. One
obvious factor that may threaten the sustainability of the aluminum beverage can
is its declining recycling rates. We will further analyze the sustainability of the
aluminum beverage cans in the next section.
3.2 The Sustainability of Aluminum Beverage Cans
If we look at the historical development of the aluminum beverage can,
including its “ancestor”; the 3-piece steel can, the aluminum beverage can has
been around for almost 70 years. It is a well-developed and mature product in
terms of product design and development. As with other mature products in the
market, the innovation curve is not as steep as with a newly introduced product.
Without product innovation and improvement, the sustainability of the aluminum
beverage can may be in jeopardy. Figure 3.9 shows the relationship between
innovation and sustainability. From the product point of view, innovation equals
increased sustainability. The major factors affecting a product’s sustainability are
shown in Figure 3.10. Six factors have been identified, and they are a product’s
functionality, environmental impact, societal impact, recyclability/
remanufacturability, manufacturability, and resource utilization and economy [35].

40
In order to enhance the sustainability of the aluminum beverage can, we need to
analyze the market to see which of the six factors are most important for the can.
Figure 3.9: Innovation and Sustainability Relationship [34]
Figure 3.10: Factors Affecting Product Sustainability [35]
41
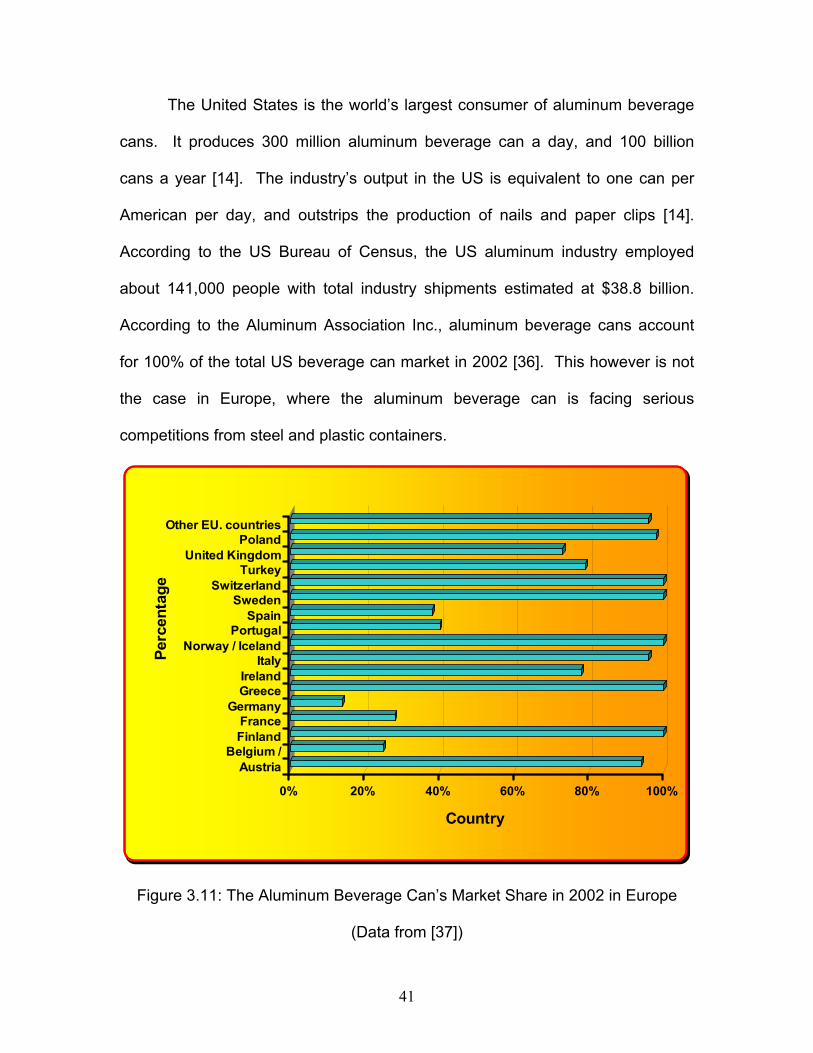
The United States is the world’s largest consumer of aluminum beverage
cans. It produces 300 million aluminum beverage can a day, and 100 billion
cans a year [14]. The industry’s output in the US is equivalent to one can per
American per day, and outstrips the production of nails and paper clips [14].
According to the US Bureau of Census, the US aluminum industry employed
about 141,000 people with total industry shipments estimated at $38.8 billion.
According to the Aluminum Association Inc., aluminum beverage cans account
for 100% of the total US beverage can market in 2002 [36]. This however is not
the case in Europe, where the aluminum beverage can is facing serious
competitions from steel and plastic containers.
0% 20% 40% 60% 80% 100%
Country
AustriaBelgium /
FinlandFrance
GermanyGreeceIreland
ItalyNorway / Iceland
PortugalSpain
SwedenSwitzerland
TurkeyUnited Kingdom
PolandOther EU. countries
Perc
enta
ge
Figure 3.11: The Aluminum Beverage Can’s Market Share in 2002 in Europe
(Data from [37])

42
Figure 3.11 shows the aluminum beverage can’s market share in Europe in 2002.
In several developed countries in Europe such as France, Germany, Portugal,
and Spain, the market share of aluminum beverage can is less than 50%. As a
result of competition, the annual growth rate for the overall aluminum container
market slowed dramatically between 1990 and 2000 [26].
0
5
10
15
20
25
30
35
40
45
50
Bill
ions
of C
ans
1972 1976 1980 1984 1988 1992 1996 2000Year
Figure 3.12: Aluminum Beverage Cans Discarded in the United States
(Prepared using data from U.S Department of Commerce & Bureau of Census)
Domestically, although the aluminum beverage can is dominant in the
beverage can market, the aluminum beverage can recycling rate has been on the
decline for the past few years. Figure 3.12 shows an increasing trend of the
number of aluminum beverage cans discarded in the US from 1972 to 2000. An
increasing trend is also observed in Figure 3.13 for the number of aluminum

43
beverage cans being recovered for recycling from 1972 to 2002. However, the
collection rate has not been able to keep up with the number of cans being
discarded, and as a result, the recycling rate of aluminum beverage can has
been on the decline since 1992. This trend is shown if Figure 3.14. The
declining rate of aluminum beverage can recycling in the US is worrisome
because recycling is one of the strong points of the aluminum beverage can
which makes it a sustainable product.
0 10 20 30 40 50 60 70
Number of Aluminum Beverage Cans Collected (Billions)
1972
1975
1978
1981
1984
1987
1990
1993
1996
1999
2002
Year
Figure 3.13: Number of Aluminum Beverage Cans Collected in the US for
Recycling (Data The Aluminum Association Inc., Can Manufacturers Institute,
Institute of Scrap Recycling Industries, Inc.)

44
Figure 3.14: Aluminum Beverage Can Recycling Rate in the US (Data from The
Aluminum Association Inc. and US Department of Commerce)
Arguments can be made that the recycling rate has been on the decline
primarily because of the lower demand for aluminum beverage cans. However,
Figure 3.15 proves otherwise. From 1972 to 2002, it has been shown that
market demand for aluminum beverage cans has always been on the uptrend,
hovering about 100 billion cans shipped per year today. Therefore, there is a
fundamental problem in the declining rate of aluminum beverage can recycling in
the US. It may be consumer’s lack of awareness, lack of effort on government’s
part to educate the society of the benefits of recycling or even the lack of
regulations enforcing recycling to a certain degree. Whatever the reasons are,
the fact is aluminum beverage can recycling is declining in the US and although
45
50
55
60
65
70
1992
1993
1994
1995
1996
1997
1998
1999
2000
2001
2002
Year
Rec
yclin
g R
ate
(%)
The AluminumAssociation(includes UBCimports)
ContainerRecyclingInstitute/U.S EPA(excludes UBCimports)

45
the market demand is still going strong, this is not sustainable as wastes is
increasing.
0 20 40 60 80 100 120
Number of Aluminum Beverage Cans Shipped (Billions)
1972
1975
1978
1981
1984
1987
1990
1993
1996
1999
2002
Year
Figure 3.15: Number of Aluminum Beverage Cans Shipped in the US (Data The
Aluminum Association Inc., Can Manufacturers Institute, Institute of Scrap
Recycling Industries, Inc.)
United States used to be the world’s largest primary aluminum producers.
However, due to the higher energy costs in the US, primary production of
aluminum has shifted to countries such as China and Australia [38]. Therefore,
in order to satisfy domestic industrial needs of aluminum, the US had to import
aluminum from those countries that are the primary producers. Not only that,
some used beverage cans (UBCs) are also exported from the US to be recycled
abroad. This means that the US has to rely on importing of aluminum from
46
abroad to sustain its economy. This scenario does not make sense at all, since
the US has the largest consumption of aluminum products, especially aluminum
beverage cans. These aluminum products have the potential to be recycled but
instead they go into the waste stream, and for the aluminum beverage can, only
about 50% of the can is recovered to be recycled.
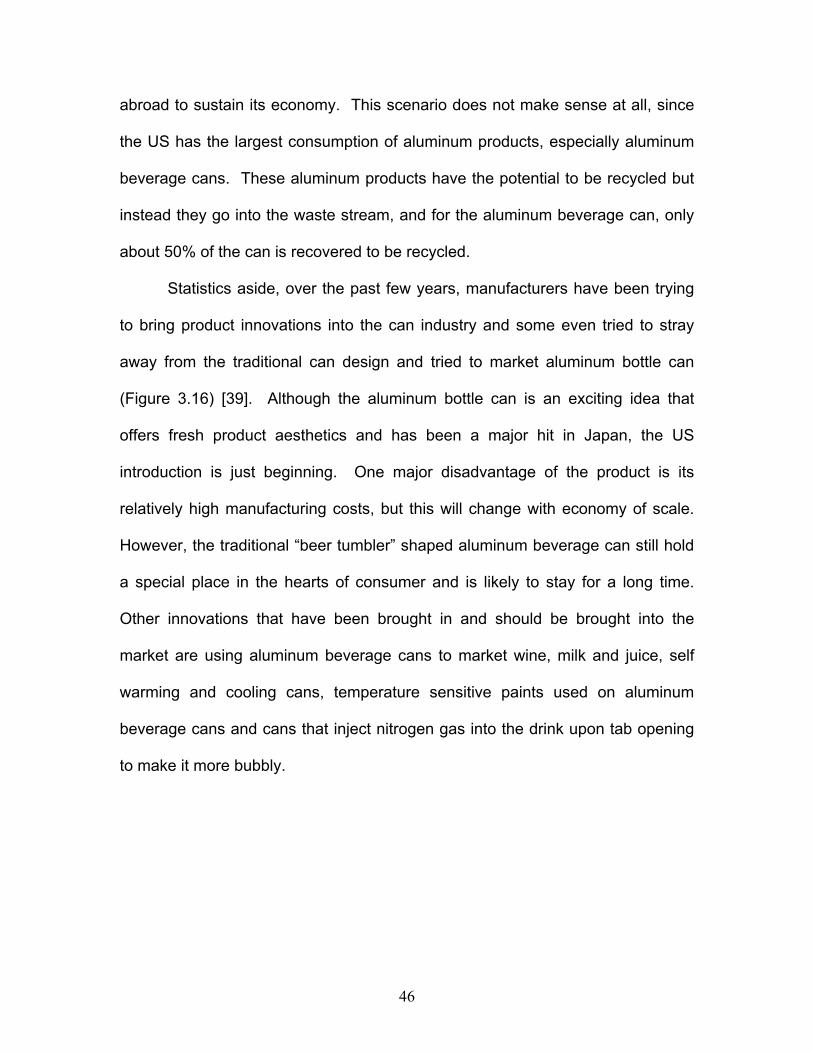
Statistics aside, over the past few years, manufacturers have been trying
to bring product innovations into the can industry and some even tried to stray
away from the traditional can design and tried to market aluminum bottle can
(Figure 3.16) [39]. Although the aluminum bottle can is an exciting idea that
offers fresh product aesthetics and has been a major hit in Japan, the US
introduction is just beginning. One major disadvantage of the product is its
relatively high manufacturing costs, but this will change with economy of scale.
However, the traditional “beer tumbler” shaped aluminum beverage can still hold
a special place in the hearts of consumer and is likely to stay for a long time.
Other innovations that have been brought in and should be brought into the
market are using aluminum beverage cans to market wine, milk and juice, self
warming and cooling cans, temperature sensitive paints used on aluminum
beverage cans and cans that inject nitrogen gas into the drink upon tab opening
to make it more bubbly.

47
Figure 3.16: Aluminum Bottle Can [39]
However, from the discussion, it seems that in the US today, recyclability
is still the main factor affecting aluminum beverage can’s sustainability.
Therefore innovations have to be made to the product design to enhance its
sustainability, especially in recyclability. There are many ways to enhance a
product’s sustainability, and it can be done through the system’s or process
perspectives. However, in the next chapters, we will discuss why the product’s
point of view is chosen and a new methodology for sustainable product design is
developed and implemented towards creating a new aluminum beverage can
design.

48
Chapter 4
Design for Sustainability
As pointed out in earlier chapters, one inadequacy with the current
sustainable product design methodology is that only one product life-cycle is
considered. Traditional notion holds that a product’s life-cycle ends when it is
thrown away and after recycling, the product starts a brand new life-cycle. The
idea of a product having multiple and even perpetual life-cycles is alien to many
and new. However, a truly sustainable product needs to have multiple and
perpetual life-cycles with a closed loop material flow. This research also focuses
on developing a sustainable product from the product’s point of view. In looking
from the perspectives of the product level, product designers are working within
the constraints of the current infrastructure, be it manufacturing, distribution or
recycling. Therefore, the introduction of a new sustainable product does not
require huge upfront costs to change the current manufacturing, distribution or
recycling infrastructure to accommodate the product. A new sustainable product
should be a product of pure engineering innovations that improves its economical,
environmental and societal value without requiring a systems change.
4.1 Design for Sustainability Methodology
Most design methodologies are created either to overcome deficiencies in
the current design and manufacturing processes, or to improve the recovery and
recyclability of the products during and at the end of its service life. Overcoming
the deficiencies in the design and manufacturing processes may include reducing

49
energy, material and labor costs, as well as, reducing wastes in machine
utilization and material flow. Some of the traditional design methodologies are
also utilized to produce products that are easier to be serviced, repaired,
disassembled, recovered and recycled, while a comprehensive methodology to
represent various major sustainability elements is yet to emerge.
However, if we look at the big picture, the desired outcomes of all those
traditional design methodology points to one or more aspects of sustainability. In
other words, most traditional design methodologies are created and utilized to
enhance the products from either one of these three focal points; economy,
environment and society. The final objective and outcomes of utilizing any of
these traditional design methodologies would be trying to come up with some
kind of a sustainable product. Therefore, if there was an “ideal sustainable
product design methodology”, it would be the fusion of all the traditional design
methodologies and its desired outcome will be a sustainable product;
encompassing sustainable manufacture, recovery, recycle as well as being
environmentally friendly and benefiting to society, fulfilling all three pillars of
sustainability; environment, economy and society. This “ideal sustainable
product design methodology” should be called Design for Sustainability (DFS).
Figure 4.1 shows the major elements of DFS which consists of all the other
traditional design methodologies. All outcomes and objectives of those design
methodologies point towards the requirements of DFS. The ideal design for
sustainability methodology should fulfill all three important elements in
sustainable development without compromising any of them. In addition, DFS

50
should have the notion that the life-cycle of a sustainable product should be
considered as multiple and perpetual, where the base material keeps flowing
after the recycle stage.
Figure 4.1: Major Elements Contributing to Design for Sustainability.
4.2 6R Concept: Multiple and Perpetual Material Flow
From the marketing and business perspectives, a product’s life-cycle is
usually defined as the progress of the product through introduction, growth,
maturity and decline stages. Engineers define product life-cycle assessment

51
(LCA) as an objective process to evaluate the environmental burden associated
with a product by identifying and quantifying energy, material uses and releases
on the environment, and to evaluate and implement opportunities to affect
environmental improvements [40]. This assessment usually includes the entire
life-cycle of the product, encompassing extracting and processing of raw
materials; manufacturing, transportation, and distribution; use/re-
use/maintenance; recycling; and final disposal of the product [40]. However, this
definition and assessment methodology only consider the product as having a
single life-cycle, and no consideration of perpetual material flow for sustainability
is prevalent.
The first step in developing an ideal design for sustainability methodology
for producing a truly sustainable product is ensuring that both the design
methodology and the life-cycle evaluation of the finished product include an
element of multiple life products with perpetual material flow. Traditionally, the
life-cycle of a finished product with a single life-cycle starts from manufacture and
ends with disassembly and/or recycling. The recently introduced 3R approach to
manufacturing (Reduce, Reuse, Recycle) appears to be in line with this, while
multiple and even perpetual life-cycle approach would seem essential for a fully
sustainable product. An effort to model a product’s life-cycle by considering the
perpetuality of material flow is shown in Figure 4.2, typically for automobiles.

52
Figure 4.2: Automobile life-cycle (Adapted from [41])
In designing for sustainability to maintain perpetuality of material flow, the
raw material used to manufacture the initial product is expected to be recovered
and recycled at the end of the first life-cycle before “flowing” into the next life-
cycle as part of another product. This multiple and perpetual life-cycle concept is
defined by the 6R concept as shown in Figure 4.3. There are 6 integral elements
in the 6R concept; Recover, Reuse, Recycle, Redesign, Reduce and
Remanufacture. Each integral element by itself forms the basis for sustainability.
The first stage in manufacturing a product begins with designing. In this initial
step, companies look at the market and competitor’s product in order to design a
product that fits the consumers’ needs, able to compete with the competitors
offering and environmentally friendly. This is done by evaluating the product’s
sustainable elements, such as functionality, manufacturing costs, serviceability,
recycleability, etc. After this impact analysis has been done, the product will go
into production and be sold to consumer for use. According to the 6R concept,
when the product has no more value or use to the first owner, instead of going

53
directly to be recycled, it needs to be recovered. In this Recover stage, the
product is stripped down and useful parts are salvaged as spare parts for
identical products while the remaining presumably defective materials are sent to
be recycled. An example of this process can be found in the automotive industry.
Daily, hundreds of used and “totaled” vehicles are stripped apart to salvage
spare parts and the rest of the automobile is sent to be scraped and recycled. In
addition, many ink cartridges for printers are recovered by manufacturers, refilled
and sold as brand new ink cartridges.
Figure 4.3: Stages of material flow in perpetual product life-cycle involving 6R
elements.
These salvaged parts from the Recover stage are then used in other
products. This next stage is the Reuse stage. After the usefulness of the parts is

54
exhausted completely, it goes to the Recycle stage. Usually, this is the end of
life for a single life-cycle product. However, in order for a product to have
multiple and even perpetual life, we have to consider the “flow” of materials from
the previous product into the new product, and take this as the continuation of
the product’s life. In the next stage, instead of making the same product again, a
sustainability-minded designer will redesign the product again to make it more
economical, environmentally friendly and fulfill the needs of society, all three
aspects of sustainability.
This is what we call the Redesign stage. During the redesigning process,
reducing the materials used in the product, the manufacturing processes, and so
on, is critical in order to bring the product to the next level of sustainability and to
make it competitive in the market. This stage is the Reduce stage. After all of
this is completed, the product is remanufactured again as a similar product but
with enhanced sustainability elements. The cycle is repeated again as shown in
Figure 4.3. The 6R concept is unique in the sense that it promotes the idea of
Kaizen, or continuous improvements in product design, that benefits the
environment, economy and society. In addition, the concept can be tailored to
suit any specific product. The priority for each stage in the concept is different
with different product, for example the recovering of aluminum beverage cans for
reuse as “spare parts”, analogous to the spare parts recovery in the automotive
industry, is not a priority, although it can be recovered and used in crafts.
Therefore, the Reuse stage can be skipped and move to the next stage, Recycle.

55
This flexibility in the concept makes it applicable to a wide range of products,
although a truly sustainable product should ideally “flow” through each stage.
4.3 Certified Sustainable Product
As discussed earlier, a truly sustainable product should “flow” through
each of the stages in the 6R concept. As seen in Chapter 1, most existing
sustainable product design methodologies only have the stereotypical notion that
a sustainable product should be “green”. This stereotype is not at all beneficial,
as businesses are not much interested in a “green” product that can not generate
sales or profit. Neither does the idea that a sustainable product should put the
environment first and consider the societal impact as second hand
considerations makes any sense. We should not assess sustainability from
“pure ecology’ point of view [42], rather look at sustainability from three equal
perspectives; environment, economy and society. A sustainable product should
not be assessed as having only a single life-cycle, but should be treated as
having multiple and perpetual life-cycle.
The mindset of sustainable product being a “green” product is not wrong,
just inadequate and incomplete. The idea of sustainability and sustainable
products would be fully accomplished only if the three pillars of the idea;
environment, economy and society are placed on the same level, with multiple
and perpetual life-cycle considerations built into the product. The 6R concept is a
useful tool in sustainable product design, and we will apply this tool to the
aluminum beverage can to enhance its sustainability, especially its recyclability.

56
As shown in Chapter 3, the recycling of aluminum is not only the strongest point
of the aluminum industry, but the recycling of aluminum beverage cans has been
on the decline over the past few years compared to the other aluminum products
(see Figure 3.8 in Chapter 3). Therefore, the recyclability of aluminum beverage
cans is the “silver bullet” in sustaining the aluminum beverage can in the US
market. Increasing the recyclability of the can not only benefits the environment
by reducing waste, but also improves economic profits for the industry (recycled
metal costs less than the primary metal) and provides jobs to the community
(societal benefits). For this reason alone, the aluminum beverage can should not
be considered “recyclable” but “certified sustainable product” (Figure 4.4),
satisfying six integral elements of product sustainability discussed previously.
Figure 4.4: The Proposed Sustainability Enhancement in Aluminum Beverage
Can (From recyclable product to certified sustainable product)
Certified Sustainable
Product

57
Chapter 5
Innovative Aluminum Beverage Cans Design for Increased
Recylability
After detailed analysis on the overall status of the product sustainability in
the aluminum industry, especially in the aluminum beverage can market; we
have arrived at a conclusion that the recyclability of the aluminum beverage can
is the strongest sustainability point of the product. Not only recycling of the
aluminum beverage can profitable to the environment, but also it is beneficial to
the economy and the society dimension. In addition, we established that in order
to enhance the sustainability of the aluminum beverage can, we need to work
from the product’s perspectives with the current manufacturing and recycling
constraints. The systems impact down the line will also be assessed. The 6R
concept will be applied to this task.
5.1 6R Concept applied to New Innovative Aluminum Can Design
The redesign of the aluminum beverage can will not be done from the
ground up by looking at the existing design and bring subtle innovations with
huge impacts into the product. We will apply the 6R concept to the 12 oz can,
which is the workhorse size of the aluminum beverage can industry and accounts
for over 90% of all aluminum beverage cans manufactured in the United States.
The aluminum beverage can is a well developed and mature product, and from
the product design point of view, it has some good features. First is the stay-on-
lid, second is the cylindrical shape of the body for optimal load distributions, as
58
well as the dome-shaped surface at the bottom for better stackability and internal
pressure distribution. The only sustainability disadvantage of the can is the dual
alloy construction. The lid is currently made out of a stronger alloy because it
needs to withstand top loads during stacking and also be able to be double-
seamed. This requires that the two alloys be separated during recycling and
melted in two separate lines of furnaces. Therefore it seems obvious that the
new innovative aluminum beverage can should be engineered to be
manufactured out of only one alloy while retaining rest of the efficient current
design features.
There are six stages of material flow in the 6R concept; Recover, Reuse,
Recycle, Redesign, Reduce and Recycle. Of these 6 stages of material flow, we
have identified that 3 stages, Redesign, Reduce and Recycle, are crucial to the
aluminum beverage cans and should be used for the product redesign. The
process of enhancing the sustainability of aluminum beverage cans begins with a
new design concept from the Redesign stage in the 6R concept. Significant
changes in the current can designs are not desirable according to the principles
of sustainability; because a completely different can design would require major
revamping of the manufacturing processes involving large monetary costs, thus
not economically sustainable. Therefore, subtle innovations to the current design
that produce major impacts to the recyclability of the aluminum beverage can are
desired. In addition, this innovative can redesign should also take into account
what is needed in the next Reduce stage. In other words, the redesigning of the
can not only means coming out with a design that is different in terms of looks

59
and functionality, but also trying to reduce the recycling steps or materials used
to manufacture the cans. Finally, the new aluminum beverage can should have a
better performance in the Recycle stage compared to the current design.
The concept for the proposed new and innovative design is based on a
can made of out a single alloy AL3004. This means that instead of
manufacturing the lid out of AL5182, it can be made out of AL3004, the same
alloy as for the body. In order to compensate for the weaker AL3004, the lid will
have a concave shape to withstand and distribute loadings better. This also
actually improves its stackability as the concaved lid complements the dome-
shaped bottom of the body. The design and performance evaluations of the new
unialloy can will be described in the next section.
5.2 Finite Element Analysis of New Unialloy Can Design
The design inspiration for the new unialloy aluminum beverage can comes
from the idea that a curved surface would be stronger than a flat surface, in
terms of the ability to distribute stresses better. The left can in Figure 5.1 shows
a radical can design with an extremely concave lid. However, overly curvaceous
lid would make opening the tab harder, as well as not aesthetically appealing.
However, if we refined down this idea further, we arrive at the can design shown
on the right in Figure 5.1. At fist glance, this new design would seem similar to
the current existing design which is shown the center of Figure 5.1. However,
upon further inspection, we notice a slightly curved lid in the new design on the
right. The curvature of this lid is only 6 cm with the center point of the curve

60
about 3 cm from the bottom, thus is barely noticeable. This slight curvature is
more pleasing to the eyes than the can on the left in Figure 5.1, and would be no
different than the current design to open with a tab as the curvature is slight.
Also, this curved lid would complements the dome-shaped bottom of the can,
thus further enhancing its stackability.
Figure 5.1: Aluminum Beverage Can Design (From left: Initial new inspiration,
Current aluminum beverage can, Final New Unialloy Aluminum Beverage Can)
The structural performance of the unialloy aluminum beverage cans still
needs to be assessed, with the current aluminum beverage can used as a
benchmark. Attempts have been made previously to predict and model the
structural performance of aluminum beverage cans [19] and simulate the
manufacturing process of the can [43], using advanced CAD and FEM software.
The cans are modeled in Pro/Engineer Wildfire with the exact dimension shown

61
in Figure 2.8 in Chapter 2. The body shell thickness varies from 0.003 in (0.075
mm) to 0.012 in (0.3 mm), depending on the location, with the thickest portion
near the bottom and the thinnest at the middle. The lid was measured using a
micrometer caliper and the average thickness was found to be 0.027 in (0.687
mm). The current design and new unialloy design would share the exact same
dimensions, with the exception of the 6 cm curvature on top of the lid.
The normal criteria to assess the structural performance of any beverage
can design is that is has to be able to withstand internal gas pressure of 90 psi
(620528.1561 Pa) and top load of 250 lbs (113.3981 kg). The cans were drawn
as thin surfaces in Pro/Engineer Wildfire and using the built in Pro/Mechanical
extension, the surfaces were modeled as shell elements with the appropriate
alloy properties and thickness. Next, loadings of 90 psi uniform pressure
internally and 250 lbs axial top load on the lid were applied to the cans. The lid
and body seaming points are assumed as rigid. Next, the model was meshed,
and imported into ANSYS 7.1 to be stress analyzed. The element used to
represent the thin walled structure of the can is Shell 93. According to the
ANSYS help files, SHELL93 is particularly well suited to model curved shells.
The element has six degrees of freedom at each node: translations in the nodal x,
y, and z directions and rotations about the nodal x, y, and z-axes. The
deformation shapes are quadratic in both in-plane directions. The element has
plasticity, stress stiffening, large deflection, and large strain capabilities. Figure
5.2 shows the 8-node Shell93 elements.

62
Figure 5.2: Shell93 8-Nodel Structural Shell (From ANSYS 7.1 Help Files)
ANSYS results for both cans are shown in Figure 5.3 to 5.10. The
maximum stress for both can designs is 336 MPa, with maximum axial
displacements of 0.677 mm for the current can design, and 0.350 mm for the
new unialloy design. This analysis shows that both designs hold up pretty well
and are quite similar in performance. Maximum stress does not occur on the lid
for both cases. If we look at Figure 5.6 and 5.10, the analysis shows a better
load distribution for the unialloy can with curved surface than for the present can.
The function of Pro/Engineer, Pro/Mechanica and ANSYS is to show a relative
structural comparison between the two can designs. The results obtained are as
close as possible to real world performance with minimal margins or error. The
main significance of this analysis is to show that comparable performance can be
obtained by using a unialloy can construction made out of AL3004.

63
Figure 5.3: Current Can Displacement Subjected to Loads
Figure 5.4: Current Can Stress Distribution Subjected to Loads (Bottom view)

64
Figure 5.5: Current Can Stress Distribution Subjected to Loads (Front view)
Figure 5.6: Current Can Stress Distribution Subjected to Loads (ISO view)

65
Figure 5.7: Unialloy Can Displacement Subjected to Loads
Figure 5.8: Unialloy Can Stress Distribution Subjected to Loads (Bottom view)

66
Figure 5.9: Unialloy Can Stress Distribution Subjected to Loads (Front view)
Figure 5.10: Unialloy Can Stress Distribution Subjected to Loads (ISO view)
67
5.3 Impact of New Unialloy Aluminum Beverage Can Design
Our main objectives in enhancing the sustainability of the aluminum
beverage can, through the product’s point of view, is based upon the
consideration that redesigning the product under the constraints of the existing
manufacturing, distribution and recycling infrastructure would be more
sustainable redesigning from the systems perspectives as it would not incur huge
changes in the current infrastructure, thus making economical sense as well.
However, changes at the product level would lead to huge impact at the systems
level.
One obvious impact of the unialloy can at the systems level is on recycling.
The unialloy can would revolutionize the recycling process, and further increasing
the economical viability of the process. By eliminating the need for separation
and melting in two separate lines of furnaces, energy consumption is reduced
and emissions from recycling such as green house gases are also minimized. A
cheaper way to recycle would encourage the industry to expand thus employing
more workers. The impact of the unialloy can would therefore be threefold, in
terms of environment, economy and society.

68
Chapter Six
Unialloy Aluminum Beverage Can Recycling
In this chapter we will quantify the recyclability of both the current can and
the new unialloy can. Flowcharts of the recycling processes will be analyzed and
based on published works, we will try to model the effectiveness of the recycling
process for both aluminum beverage cans.
6.1 Unialloy Aluminum Beverage Can Recycling Process Modeling
The aluminum beverage can recycling process was discussed in Chapter
2 and Figure 2.12 shows a very good illustration of the process. It is obvious that
if we have unialloy aluminum beverage can, the process would be much simpler.
The proposed recycling process for the unialloy can is shown in Figure 6.1.
From [22-23], it is known that melting aluminum alloys in the furnace typically
would produce significant amount of “skim”, the mixture of metal, oxides, other
contaminants and trapped gas that floats on top of the melt [22]. This mixture is
typically about 15% of the original melt from both AL3004 and AL5182. The
recovery of metal from this melt is only about 6-8% of the original melt. This
means about 7-9% of the original melt will be lost forever. The recovered metal
can only be used in body stock manufacturing because of its high manganese
and contaminant level [22-23]. In order to balance the recycling closed-loop
process, some metal from the potroom may need to be injected into the recycling
flow. The process percentage typically depends on the melt loss. During the
casting and rolling of the recycled alloys into either body or lid sheet, about 42%

69
of the weight of the original melt would be shaved, cropped or slit off in various
stages [22-23]. Typically, the recovering of this scrap on the production line
would not be 100%, thus, some percentage of this, about 42% would be loss. If
the ratio of lid to body is approximated to be 0.2, then 20% of the various losses
and scraps are generated by the lid. Figure 6.2 and 6.3 shows the flow chart of
the dual alloy and unialloy aluminum beverage can recycling process
respectively.
Figure 6.1: Unialloy Aluminum Beverage Can Recycling Process.

70
Figure 6.2: Dual alloy Aluminum Beverage Can Recycling Process Flow Chart.

71
Figure 6.3 Unialloy Aluminum Beverage Can Recycling Process Flow Chart.

72
We will now compare the recycling efficiency of both the current can the
unialloy can. If we use the lid to body ratio of 0.2, from [22-23], we can imply that
melting process of the AL3004 would produce 12% skim and melting of AL5182
would result in 3% skim. If the skim recovery process recovers 7% of the original
melt, then the remaining 8% skim would be melt loss. Because of the fact that
metal from the potroom would need to be injected into the closed-loop process to
balance the material flow and also the recovered skim can only be used for body
manufacturing in dual alloy can, then 5% and 3% of the original melt’s metal
would need to be injected in the AL3004 and AL5182 line respectively. For the
unialloy beverage can, since it is made out of AL3004 only, then skim formation
would only be 12% of the original melt. Skim recovery stays the same at 7%, the
melt loss would be 5%, meaning 5% metal from the potroom would be needed to
compensate the cycle.
The following equations and methodology are derived from [44] and will
lead eventually to a simplified equation for recycling effectiveness. For the
simple product life-cycle illustrated in Figure 6.4, the aggregated environmental
impact at each stage can be expressed as EI. This is the sum of the normalized
impact levels, I for all associated impact types.
Figure 6.4: Product Life-Cycle [44].
Supply Line Product
Manufacturing Customer
Use
Disposal
EI2 EI3
EI4
mc P
D
EI1 Production Rate

73
The total life-cycle environmental impact is then:
4321 EIEIEIEIEIT +++= (1)
The Resource Productivity, RP for each stage is:
11 / EIPRP = ; 22 / EIPRP = (2a, b)
33 /EIPRP = ; 44 /EIPRP = (2c, d)
where P is the production rate (product units/year). The largest RP indicates the
stage that causes the least environmental impact (higher productivity is better).
Environmental implications of the product design are usually affected by product
reusability and recyclability. A simple recovery operation consisting solely of
material recycling is shown in Figure 6.5.
Figure 6.5: Material Cycle [44].
The corresponding RP is:
RR EIRRP /= (3)
Supply Line Product
Manufacturing Customer
Use Disposal
Recycle
EI2 EI3
EI1’ EI4’
EIR
ms mc
m
P
R
D
Material Recycle Product Recovery
X1 Z

74
This is defined in terms of recovery rate R (product units/year) rather than P,
since the purpose of the operation is to manage recovered product. The impact
EIR includes product collection, transport and processing. Recycling will reduce
the rate of which materials are obtained from the supply line, ms (kg/year), and
product disposal rate, D. The ratios are:
cmmX /1 = ; PRZ /= (4a, b)
Assuming no loss of material during manufacturing and customer use (mc = P),
then the efficiency of recycling is:
ZXRm // 1==ε (5)
In Figure 6.5, those quantities affected by recycling are indicated with (‘).
The modified environmental impacts are then:
)1(' 111 XEIEI −= ; )1(' 44 ZEIEI −= (6a, b)
It is assumed that the recycled component and material mix, m is assumed to be
the same as mc for simplicity, so EI1 is reduced in direct proportion to X1. Then
the total life-cycle impact is:
RT EIEIEIEIEIEI ++++= ''' 4321 (7)
Recycling is assumed to be beneficial, thus,
TT EIEI <' (8)
Substituting Eqn. 1, 6 and 7 into 8, we get,
411 ZEIEIXEIR +< (9)
Equation 9 shows that the environmental impact of recycling is less than those
from the supply line and final disposal. If EI is substituted in terms of RP from

75
Eqn. 2 and 3 and using Eqn. 4 and 5 into 9, we will get the minimum acceptable
recycling performance, RPR:
)/1/(1/ 144 RPRPRPRPR ε+> (10)
When the unialloy aluminum beverage can is put into production and recycled,
based on Eqn. 10, we can qualitatively compare the recycling efficiencies of both
cans.
6.2 Aluminum Beverage Can Recycling Process Interactive Program
Based on all the implied data from [22-23] and flowcharts from Figure 6.2
and 6.3, an interactive program is created using Microsoft Visual Basic 6.0. This
is a flexible program that allows the user to input any arbitrary values. The
interface is shown in Figure 6.6. For example, it can be 400 lbs of used
aluminum beverage cans or $400 million worth to be recycled. The program will
then calculate the melt loss, metal from the potroom needed to replenish the lost
metal and also scraps from the process. The result output unit is dependant
upon the input unit, for example in Figure 6.2, if the user designated the input as
400 lbs of used aluminum beverage cans, then the result will be in lbs. The
results from the program shows the comparison between the recycling of the
current dual alloy can and unialloy can. For any program, the result is as good
as the governing variables.
We have four governing variables that are preset and loaded into the
program each time it is executed or reset. The values for each of these
governing variables are; lid to body ratio, skim formation, skim recovery and

76
scrap generation. These are preset from data gathered and compiled in [22-23].
The flexibility aspect of this program lies in the fact that the user would have the
ability to change any of these governing variables. For example, if the skim
recovery process have been improved because of new technology or because of
lightweighting of the can the lid to body ratio is different, the user have the option
to change those governing variables. This means that the program has a
flexibility built into it to keep up with technology change in the recycling process.
The programming is shown in the Appendix A.

77
Figure 6.6: Program Interface.

78
Figure 6.7: Sample Calculations.

79
Chapter Seven
Discussion and Conclusion
Most sustainable product design methodologies overly emphasize
environmental impacts. This is not desirable as in today’s business-oriented
world, a sustainable product should be economically viable without adverse
effect to the environment and society. In addition, life-cycle assessment of
sustainable product is done by considering a product as having only one life-
cycle, usually from manufacturing and ends with recycling. However, for a truly
sustainable product, this is not adequate. A sustainable product should be
considered as having multiple and perpetual life-cycles. Its material flow should
form a close loop and defined by the 6R concept. The 6R concept is a good tool
in Design for Sustainability (DFS) as it maximizes the life of a product and builds
improvements into the product after every life-cycle.
The 6R concept was applied to the aluminum beverage can in this case.
The sustainable growth and development of the whole aluminum industry is
thoroughly discussed and we found that the aluminum beverage can’s recycling
rate in the United States has been on the decline for the past few years. Since
we have also identified recycling as the aluminum beverage can’s strongest point,
it therefore makes good sense to enhance the recyclability of the aluminum
beverage cans in order to increase the sustainability. Recyclability of the
aluminum beverage can is tied to all three major elements in sustainability;
economy, environment and society. Although we started analyzing and
identifying the problem from the system’s perspectives, we ultimately solved the

80
problem at the product level. By enhancing the recyclability of the aluminum
beverage can from the product design point of view, we are working within the
constraints of the current manufacturing, distribution and recycling infrastructure,
thus ensuring the new redesigned product would fit perfectly into the current
infrastructure. This also means that no huge economic investments are needed
to invest in the production of this new aluminum beverage can.
The new aluminum beverage can is designed out of a single alloy; thereby
the name unialloy can, as opposed to the current dual alloy construction. The
unialloy can eliminates the need for separation of alloy for melting, thus
minimizing energy, time and labor use in the recycling process. This ultimately
translates into monetary savings. The unialloy can was designed using
Pro/Engineer and Pro/Mechanica and structural analysis was done using ANSYS
7.0. Results shows similar performance to the current dual alloy can. An
equation for quantifying the recycling performance was adapted from published
work and can be used to compare the recycling performance of the unialloy and
dual alloy aluminum beverage cans. In addition, an interactive aluminum
beverage can recycling program was created based on aluminum can recycling
data from published work.
This research starts with the need to enhance the sustainability of the
aluminum beverage can. The problem was analyzed from the systems
perspectives and solved at the product’s design level. A rethinking of sustainable
product life-cycle was carried out and the result is the 6R concept. This concept
was applied to the new unialloy aluminum beverage can design. The design and

81
analysis of the cans were done using the latest CAD and FEM tools. The cans
were shown to be structurally equivalent or even somewhat better. This work
serves as an example of taking a product which has been around for a long time
with diminishing sustainability, and applying a fresh approach to the problem
from a product’s perspectives which ultimately leads to improvements at the
systems level.

82
Appendix A: Visual Basic Programming for Aluminum Beverage
Can Recycling Process Interactive Program
Private Sub Calculate_Click()
SA = Val(SA.Text)
BLR = Val(BLR.Text)
SF = Val(SF.Text)
SR = Val(SR.Text)
SG = Val(SG.Text)
DML = SA * ((SF - SR) * 0.01)
DPR = DML
DSL = (SG * 0.01) * BLR * SA
DSB = SA * ((SG * 0.01) * (1 - BLR))
TS = ((SG * 0.01) * BLR * SA) + (SA * ((SG * 0.01) * (1 - BLR)))
UML = SA * (((SF * 0.01) * (1 - BLR)) - (SR * 0.01))
UPR = UML
US = SA * ((SG * 0.01) * (1 - BLR))
DML.Text = Str$(DML)
DPR.Text = Str$(DPR)
DSL.Text = Str$(DSL)
DSB.Text = Str$(DSB)
TS.Text = Str$(TS)
UML.Text = Str$(UML)
UPR.Text = Str$(UPR)
US.Text = Str$(US)
End Sub
Private Sub Print_Click()
PrintForm
End Sub

83
Private Sub Reset_Click()
Dim c As Control
For Each c In Controls
If TypeOf c Is TextBox Then
c.Text = ""
End If
Next
BLR = 0.2
SF = 15
SR = 7
SG = 42
BLR.Text = Str$(BLR)
SF.Text = Str$(SF)
SR.Text = Str$(SR)
SG.Text = Str$(SG)
End Sub

84
References
1. Wanigarathne, P.C., Liew, J., Wang, X., Dillon, O.W., Jawahir, I.S.,
Assessment of Process Sustainability for Product Manufacture in Machining
Operations, Proc. Global Conference on Sustainable Product Development
and Life Cycle Engineering, Berlin, September 2004, pp. 305-312.
2. “Our Common Future: From One Earth to One World”, 1987, Commission on
Environment and Development, Brundtland Commission Report, Oxford
University Press, pp. 22-23 IV.
3. Grieβhammer, R., Bunke, D., Gensch, C.O., Produktlinienanalyse Waschen
und Waschmittel. Umweltbundesamt, 1997, Ch. 1, p. 10.
4. de Barros Pereira, H.B., de Almeida Souza, P.F., “Design for Sustainability:
Methods in Search for a Better Harmony Between Industry and Nature”, 5th
European Academy of Design Conference, Barcelona, April 2003.
5. Datschefski, E., “Using Nature’s Cyclic/Solar/Safe Protocol for Design,
Manufacturing and Procurement”, Sustainable Products, June 1999, pp. 1-
93.
6. Sustainable Products Corporation, www.sustainableproducts.com.
7. Jawahir, I.S., “Sustainable Products: An Introduction to Product
Sustainability Rating”, Product Sustainability Seminar Series: Seminar 1,
University of Kentucky, July 20 2004.
8. Datschefski, E., “Cyclic, solar, safe-BioDesign’s Solution Requirements for
Sustainability”, The Journal of Sustainable Product Design, January 1999,
pp. 42- 51.

85
9. Tipnis, V.A., “Evolving Issues in Product Life Cycle Design”, Annals of the
CIRP Annals, Vol. 42/1, 1993, pp.169-171.
10. Walker, S., “Experiments in Sustainable Product Design”, Journal of
Sustainable Product Design, October 1998, pp. 41-50.
11. Kaebernick, H., Kara, S., Sun, M., “Sustainable Product Development and
Manufacturing by Considering Environmental Requirements”, Robotics and
Computer Integrated Manufacturing, Vol. 19, 2003, pp. 461-468.
12. Fuller, D.A., Ottman, J.A., “Moderating Unintended Pollution: The Role of
Sustainable Product Design”, Journal of Business Research, 2002, pp. 1-8.
13. “Aluminum in Packaging: Maximum, minimum use of material”, Aluminum for
Future Generations, Gesamtverband der Aluminiumindustrie e.V.,
Düsseldorf, February 2002.
14. Hosford W.F., Duncan John L., “The Aluminum Beverage Can”, Scientific
American, September 1994, pp. 48-53.
15. Aluminum Beverage Can History, Gesamtverband der Aluminiumindustrie
e.V., Düsseldorf, July 2002.
16. “Cans – A Visual History”, www.cancentral.com/brochure.
17. “Crown Expands Shaped-Can Manufacturing. CSD Companies said ‘Taking
another Look’ ”, Beverage Digest, January 2001, www.beverage-
digest.com/ editorial/010126.php.
18. Pinkham M., “Aluminum Cans-History, Development and Market”, Aluminum
International Today, April/May 2002,
http://www.azom.com/details.asp?ArticleID=1483.
86
19. Reid J.D., Bielenberg R.W., Coon B.A., “Indenting, buckling and piercing of
Aluminum Beverage Cans”, Finite Elements in Analysis and Design 37,
2001, pp. 131-144.
20. Johnson D., “Necking two-piece Beverage Cans in the 90’s”, Aluminum
Alloys for Packaging 2, 1996, pp. 161-177.
21. van Linden J.H.L., “A Mathematical Model of the Aluminum Beverage Can
Recycling System”, Light Metals, Proceedings of Sessions, AIME Annual
Meeting, 1980, pp. 813-825.
22. van Linden J.H.L., “Aluminum Recycling - Everybody’s Business,
Technological Challenges and Opportunities”, Light Metals 1990, pp. 675-
682.
23. van Linden J.H.L., “Holistic Aluminum Recycling – Why and How?, 5th
Australasian Asian Pacific Conference on Aluminum Cast House
Technology, 1997, pp. 111-125.
24 “Aluminium-A Sustainable Material”, Gesamtverband Der
Aluminiunmindustrie e.V, Düsseldorf, Second Edition 2002, pp 1-22.
25. Jawahir, I.S., Wanigarathne, P.C., “New Challenges in Developing Science-
based Sustainability Principles for Next Generation Product Design and
Manufacture”, International Research/ Expert Conference “Trends in the
Development of Machining and Associated Technology” TMT 2004, Neum,
Bosnia and Herzegovina, September 2004, pp. 1-10.
26. “Aluminum Industry Vision, Sustainable Solutions for a Dynamic World”,
November 2001, pp. 1-34.

87
27. “Industry as a Partner for Sustainable Development: Aluminium”,
International Aluminium Institute and United Nations Environment
Programme, 2002, pp. 1-37.
28. “Bauxite Mining and Rehabilitation”, Gesamtverband Der
Aluminiunmindustrie e.V, Düsseldorf, 2003, pp. 2.1-2.3.
29. “Aluminium-Social Aspects, Aluminum for Future Generations”,
Gesamtverband Der Aluminiunmindustrie e.V, Düsseldorf, 2002, pp. 1-18.
30. “Aluminium-Social Aspects”, Gesamtverband Der Aluminiunmindustrie e.V,
Düsseldorf, 2003, pp. 12.1-12.2.
31. “Aluminium is Used and Not Consumed”, Gesamtverband Der
Aluminiunmindustrie e.V, Düsseldorf, 2003, pp 7.1.
32. Testin, R. F., “Aluminum Recycling-Potential and Problems”, Journal of
Metals, September 1981, pp. 21-24.
33. Bruggink, P.R., Martchek, K.J., “Worldwide Recycled Aluminum Supply and
Environment Impact Model”, TMS Light Metals 2004, pp. 907-911.
34. Jawahir. I.S., Dillon Jr., O.W., Rouch, K.E., “Product and Process
Sustainability: New Challenges for Design and Manufacture”, Seminar
Presentations at GM R & D Center, Warren, MI, August 16, 2004.
35. Liew, J., Rouch, K., Das, S., Jawahir, I.S., “A Methodology for Evaluating
Sustainable Aluminum Beverage Can Designs”, Aluminum Alloy for
Packaging, 2005 TMS Annual Meeting Presentation, San Francisco CA,
February 14, 2005.

88
36. “Aluminum Facts at a Glance”, The Aluminum Association Inc., September
2003.
37. Aluminum Beverage Can - Facts and Figures, Gesamtverband Der
Aluminiunmindustrie e.V, Düsseldorf, 2003, pp. 15.1-15.2.
38. Das, S.K., Long III, W.J., Hayden, H.W., Green, A.S., Hunt Jr., W.H.,
“Energy Implications of the Changing World Supply of Aluminum Metal
Supply”, Journal of Metals, August 2004, pp. 14-17.
39. “The Next Big Thing”, Aluminum Now, Vol. 6, No. 6, November/December
2004, http://www.aluminum.org/ANTemplate.cfm?IssueDate=11/01/2004.
40. Graedel, T.E., “Chapter 2: The Concept of Life-Cycle Assessment”,
Streamlined Life-Cycle Assessment, 1998, pp. 18.
41. Sutherland, J., Gunther K., Allen, D., Bauer, D., Bras, B., Gutowski, T.,
Murphy, C., Piwonka, T., Sheng, P., Thurston, D., Wolff, E., “A Global
Perspective on the Environment Challenges Facing the Automotive Industry:
State-of-the-Art and Directions for the Future”, International Journal of
Vehicle Design, Vol. 35, Nos. 1/2, 2004, pp. 86-110.
42. “Avoid being forced to discuss “environmental impact”- consider
sustainability and not “pure ecology”” Gesamtverband Der
Aluminiunmindustrie e.V, Düsseldorf, 2003..
43. Romanko, A., Berry, D., Fox, D., “Simulation of Double-Seaming in a Two-
piece Aluminum Can”, Materials Processing and Design: Modeling,
Simulation and Applications, NUMIFORM 2004, pp. 1526-1532.
89
44. Dickinson, D.A., Caudill, R.J., “Sustainable Product and Material End-of-Life
Management: An Approach for Evaluating Alternatives”, IEEE International
Symposium of Electronics and the Environment 2003, pp. 153-158.
90
Vita
Date of Birth: 18 November 1980 Place of Birth: Miri, Sarawak, Malaysia Educational Institutions: Inti College Sarawak, Malaysia Attended and Degree Diploma in American University Program Already Awarded (August1999) University of Kentucky, Lexington, USA
Bachelors of Science in Mechanical Engineering (December 2001)
Scholastic Honor: Dean’ List Fall 2001 Professional Publications: P.C Wanigarathne, J. Liew, X. Wang, O.W.
Dillon, I.S. Jawahir, “Assessment of Process Sustainability for Product Manufacture in Machining Operations”, Proceedings Global Conference on Sustainable Product Development and Life Cycle Engineering, Berlin, Germany, September 29 2004.
J. Liew, K. Rouch, S. Das, I.S Jawahir, “A Methodology for Evaluating Sustainable Aluminum Beverage Can Designs”, Aluminum Alloy for Packaging, 2005 TMS Annual Meeting, San Francisco, California, February 14 2005.
J. Liew, O.W.Dillon, K.E. Rouch, S. Das, I.S. Jawahir, “Innovative Product Design Concepts and A Methodology for Sustainability Enhancements in Aluminum Beverage Cans”, Fourth International Conference for Design and Manufacture for Sustainable Development, Newcastle, England, July 12-13 2005. (Accepted) I.S. Jawahir, N. de Silva, J. Liew, “A New, Comprehensive Method for Measurement and Quantification of Product Sustainability”, Special Issue of the Int. Journal of Product Development on Sustainable Product and Services Design (Accepted)