innovation responses to import competition - princeton.eduies/spring11/kellerpaper.pdf ·...
TRANSCRIPT

Innovation Responses to Import Competition∗
Leonardo Iacovone†
The World BankWolfgang Keller‡
Princeton and Colorado
Ferdinand Rauch §
London School of Economics
February 11, 2011
Abstract
How does trade liberalization that raises a country’s import competition affect theinnovative activity of its firms? We exploit the strong growth of Chinese exports resultingfrom China’s entry into the World Trade Organization in 2001 as a competitive shock to,specifically, Mexican manufacturing firms. Innovation is captured through information onthe adoption of detailed firm level production techniques such as just in time inventorymethods, quality control measures, and job rotation among the Mexican firms. Ourresults indicate that China’s rise in global trade did not affect Mexico’s rate of innovationby much, which contrasts with the substantial gains that others have found in the caseof bilateral liberalizations. At the same time, there is a striking heterogeneity in theresponses across firms for different productivities, with productive firms innovating moreand less productive firms innovating less, which leads to positive selection in that initialdifferences in firm performance are sharpened by the advent of new competition. Wediscuss the implications of these findings for theories of trade and innovation.
∗The authors thank Swati Dhingra, Amit Khandelwal, Mark Roberts, Andres Rodriguez-Clare, Jon Vogel,Stephen Yeaple, and participants at the LACEA September 2010 (San Jose) conference as well as at Columbia,Georgetown, and Penn State seminars for comments. The financial support of the World Bank’s ResearchSupport Budget is gratefully acknowledged.†Development Research Group, World Bank, 1818 H Street, NW; Washington, DC, 20433, USA. Email:

1 Introduction
Trade liberalization in form of foreign market access improvements rarely encounters domes-tic political opposition because it means higher exports and employment for domestic firms.Economists have long supported the dismantling of trade barriers on efficiency grounds, not-ing additional gains recently through the reallocation of firms’ market shares and increasedincentives to innovate, among others (Pavcnik 2002, Melitz 2003, Bernard et al. 2003, Aw,Roberts, and Winston 2007, Costantini and Melitz 2008, Verhoogen 2008, Lileeva and Trefler2010, Bustos 2010). Given these benefits from improved foreign market access, it is natural toask how they compare with the benefits from improving domestic access to foreign firms.
This paper addresses this question by examining innovation of Mexican firms in response toincreased competition from China between the years 1998 to 2004. China’s entry into worldtrade was the largest trade shock during the last 30 years.1 By becoming a member of theWorld Trade Organization (WTO) in 2001, China gained new market access, and her already-high rates of export growth accelerated. Figure 1 shows the increasing presence of China onthe world markets, with a particular steep slope in the years after 1998. Mexico was among thecountries most strongly affected, because Mexico had substantial overlap with China in termsof product range, and the location of Mexico next to the United States has made it particularlyvulnerable to competition from China. In comparison to its imports from China, Mexico’sexports to China over this period were trivial.
This setting yields an unparalleled opportunity to examine the innovative behavior of firmsunder the threat of competition. Innovation has many dimensions, and relatively little is knownon which ones are most important. Some emphasize inventory management while others thecontrol of the production process, some observers see workers as the crucial element while afourth group focuses on computers and equipment. This paper provides evidence on this andother specific forms of innovation by Mexican firms as they faced new import competition fromChina. This affords us a new look into the black box of firm-level innovation in response tocompetitive shocks.2
Our main findings are as follows. First, the aggregate level of innovation of Mexican manufac-turing firms did not change much with the new import competition from China. In contrast,earlier studies have often found substantial overall effects (Pavcnik 2002, Bloom, Draca, andVan Reenen 2009, Lileeva and Trefler 2010). Our second, and related finding is that the aggre-gate effect masks a striking heterogeneous response across firms of different productivity. Wefind that relatively productive firms innovate more in response to the China trade shock whileless productive firms innovate less. Import competition sharpens the difference between strong-and weak performing firms because it leads to innovation that amplifies the initial difference.This is a positive dynamic selection finding.
Third, there is little evidence that the innovation strategies of Mexican firms can be explainedby market size reallocations. The sales growth of the firms that innovate during the periodof China’s entry into the WTO is similar to the sales growth of firms that do not innovate.
1See Krugman (2008), Bloom, Draca, and Van Reenen (2009), and Winters and Yusuf (2007).2The terms firm and plant are used interchangeably in this paper; the evidence below is on plants.
2

While a market-size explanation of firm-level innovation is not supported by our results, theyare consistent with productive firms having relatively more to gain from innovation than lessproductive firms, as, for example, in the model of Aghion, Harris, Howitt, and Vickers (2001).3
We also find that a high degree of intermediate good imports from Asia, foreign ownership, anda skilled labor force is conducive to innovation in the face of import competition.
The gains from trade liberalization is a central question in international economics, and thispaper sheds new light on innovation gains in this context. It has long been argued that tradeliberalization can affect a country’s rate of innovation, and analysis of the detrimental impact ofimport substituting trade strategies adopted by many less developed countries after World WarII was early evidence of this (Krueger 1978, Bhagwati 1978). Our work builds on and extendsthis research by emphasizing heterogeneity as a determinant of firms’ innovation choices (seesurveys by Tybout 2003 and Redding 2011).
Our approach is distinct in two ways. First, we examine innovation in the sense of particularorganizational forms and production techniques. The specific ways in which a firm controlsproduct quality, optimizes its inventory, and manages its operations more generally explainmuch of the variation in economic performance across firms, a finding emphasized in the businessliterature and more recently also by economists (Womack, Jones, and Roos 1991, Bloom andVan Reenen 2007 and Syverson 2010). In the context of trade liberalization, studies on theadoption of specific firm techniques are extremely rare; an exception is Schmitz (2005) whopresents a case study on the abolition of restrictive work practices among North Americaniron ore producers. Information on the introduction of computer systems needed for Just-in-Time techniques is presented in Lileeva and Trefler (2010), while Dhingra (2011) employsdirect evidence on production process innovations in analyzing trade-offs faced by multi-productfirms.
Comparatively little is known on how firms change their organizational structure and theiroperations management in reponse to new sources of competition. The main advantage ofanalyzing specific innovations is its potential for better understanding the factors determiningoverall firm performance. When firm innovation is broken down into its constituent parts, thiswill provide more information on which are the truly crucial elements, and it also sheds new lighton how individual choices fit together to form the overall firm strategy. This information shouldprove valuable in understanding the import and export behavior of firms. In addition, particularinnovations may have quite different implications of trade liberalization on labor markets andthe economy as a whole. If innovation comes mainly as improved inventory management wewould expect labor demand to become less skill biased than if innovation is mostly in form ofmachinery replacing unskilled labor, for example. In contrast, a focus on productivity changesdoes not give as much information, also because the productivity changes that can be measuredin practice pick up changes in market power (Foster, Haltiwanger, and Syverson 2008), productmix (Bernard, Redding, and Schott 2010, Mayer, Melitz, and Ottaviano 2010), and factormarket distortions (Hsieh and Klenow 2010).
3In Aghion, Harris, Howitt, and Vickers (2001), competition will provide greater incentives to innovate forhigh- compared to low-productivity firms because conditional on innovation, a high-productivity firm can winout against the foreign competitor in a limit pricing contest whereas the low-productivity firm cannot.
3

Second, we examine innovation responses to trade liberalization when the size of the market isshrinking. There is a large literature on how an expanding market size might increase innovationbecause innovation is complementary to the firm’s decision to export (Yeaple 2005, Verhoogen2008, Costantini and Melitz 2008, Atkeson and Burstein 2008, Lileeva and Trefler 2010, andBustos 2010),4 but this argument does not apply in the case of new import competition becausemarket size is shrinking. Innovation in the face of new import competition must be driven bysomething other than increases in firm scale, and in this respect our research relates to researchon the impact of changes in domestic competition and FDI entry (see Holmes and Schmitz2010 and Aghion, Blundell, Griffith, Howitt, and Prantl 2009, respectively). Arguably, from apolicy perspective the innovation response to unilateral trade liberalization at home is just asimportant as the response to bi- or multilateral liberalizations.
A recent contribution on the impact of import competition from China is Bloom, Draca, andVan Reenen (2009).5 These authors emphasize that the contribution of trade in generating wageinequality in rich countries is larger than generally presumed by showing that this competitioninduced European firms to increase spending on computers, which had a positive effect on theskill premium. Our work differs because instead of technology investments we analyze specificorganizational changes of the firms, and moreover, in contrast to Bloom, Draca, and Van Reenen(2009) we find strong heterogeneity in firms’ innovation responses to competition, increasingfor some and decreasing for other firms.
The remainder of the paper is as follows. We start out by introducing the empirical approachin section 2. The various forms of innovation analyzed in this paper are introduced in section3. This section also covers their basic features in our sample of Mexican firms, which guidesthe empirical analysis. A description of our other data is also in section 3. All empirical resultsare discussed in section 4, while section 5 provides some concluding discussion.
2 Estimating the relationship between innovation and
competition
The empirical approach is this paper is straightforward. We relate firm-level innovation to avariable that captures the change in import competition faced by Mexican plants after China’sentry into the World Trade Organization:
yi(j)t = β0 + β1∆compjt + γX + ui(j)t. (1)
Here, yi(j)t denotes a specific type of innovation of firm i, for example the adoption of Just-in-Time (JIT). Firm i is observed in year t, and each firm belongs to a particular six-digit
4Similar market size effects are seen in the case of FDI; in particular, technology spending of firms thatdecide to supply Wal-Mart in Mexico (which increases the market size of the supplier) goes up relatively thatof non-Wal-Mart suppliers (Iacovone, Javorcik, Keller, and Tybout 2010).
5Other research on the impact of China’s recent entry into global trade includes Utar and Torres Ruiz (2010)and Iacovone, Rauch, and Winters (2010). The latter examine the impact of China’s trade on the market sharesof firms and products in Mexico, which is complementary to our emphasis on innovation. Utar and TorresRuiz (2010) study productivity changes among Mexican export processing firms (maquiladoras) using familiarmethods. Maquiladoras are also included in our sample below.
4
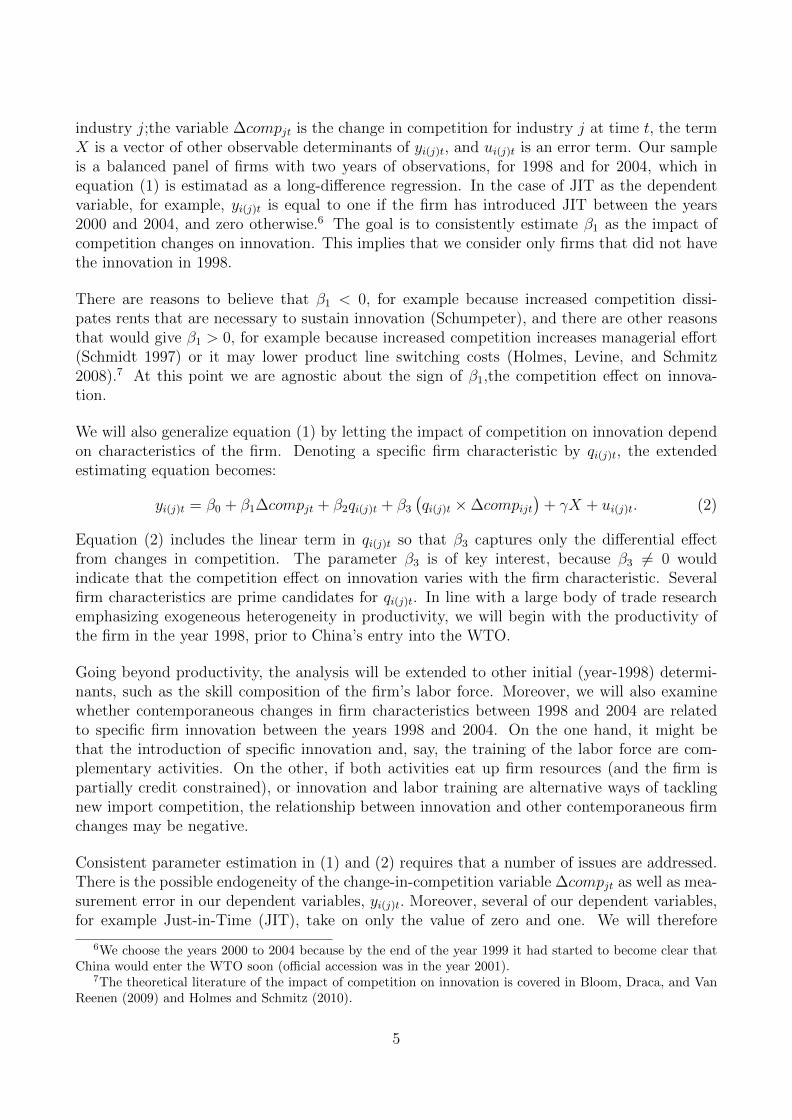
industry j;the variable ∆compjt is the change in competition for industry j at time t, the termX is a vector of other observable determinants of yi(j)t, and ui(j)t is an error term. Our sampleis a balanced panel of firms with two years of observations, for 1998 and for 2004, which inequation (1) is estimatad as a long-difference regression. In the case of JIT as the dependentvariable, for example, yi(j)t is equal to one if the firm has introduced JIT between the years2000 and 2004, and zero otherwise.6 The goal is to consistently estimate β1 as the impact ofcompetition changes on innovation. This implies that we consider only firms that did not havethe innovation in 1998.
There are reasons to believe that β1 < 0, for example because increased competition dissi-pates rents that are necessary to sustain innovation (Schumpeter), and there are other reasonsthat would give β1 > 0, for example because increased competition increases managerial effort(Schmidt 1997) or it may lower product line switching costs (Holmes, Levine, and Schmitz2008).7 At this point we are agnostic about the sign of β1,the competition effect on innova-tion.
We will also generalize equation (1) by letting the impact of competition on innovation dependon characteristics of the firm. Denoting a specific firm characteristic by qi(j)t, the extendedestimating equation becomes:
yi(j)t = β0 + β1∆compjt + β2qi(j)t + β3(qi(j)t ×∆compijt
)+ γX + ui(j)t. (2)
Equation (2) includes the linear term in qi(j)t so that β3 captures only the differential effectfrom changes in competition. The parameter β3 is of key interest, because β3 6= 0 wouldindicate that the competition effect on innovation varies with the firm characteristic. Severalfirm characteristics are prime candidates for qi(j)t. In line with a large body of trade researchemphasizing exogeneous heterogeneity in productivity, we will begin with the productivity ofthe firm in the year 1998, prior to China’s entry into the WTO.
Going beyond productivity, the analysis will be extended to other initial (year-1998) determi-nants, such as the skill composition of the firm’s labor force. Moreover, we will also examinewhether contemporaneous changes in firm characteristics between 1998 and 2004 are relatedto specific firm innovation between the years 1998 and 2004. On the one hand, it might bethat the introduction of specific innovation and, say, the training of the labor force are com-plementary activities. On the other, if both activities eat up firm resources (and the firm ispartially credit constrained), or innovation and labor training are alternative ways of tacklingnew import competition, the relationship between innovation and other contemporaneous firmchanges may be negative.
Consistent parameter estimation in (1) and (2) requires that a number of issues are addressed.There is the possible endogeneity of the change-in-competition variable ∆compjt as well as mea-surement error in our dependent variables, yi(j)t. Moreover, several of our dependent variables,for example Just-in-Time (JIT), take on only the value of zero and one. We will therefore
6We choose the years 2000 to 2004 because by the end of the year 1999 it had started to become clear thatChina would enter the WTO soon (official accession was in the year 2001).
7The theoretical literature of the impact of competition on innovation is covered in Bloom, Draca, and VanReenen (2009) and Holmes and Schmitz (2010).
5

estimate the equations not only with linear probability models using least squares but also withprobit models using maximum likelihood. These issues will be discussed below.
The following section discusses the data sources and the definition of the innovation vari-ables.
3 Data
This paper employs data provided by Instituto Nacional de Estadıstica y Geografıa (INEGI),a Mexican statistical agency. We use surveys of manufacturing firms from the years 2005 and1999, which cover information for the years 2004 and 1998. These surveys of the EncuestaNacional de Empleo, Salarios, Tecnologıa y Capacitacion (ENESTyC), provide informationon a large range of characteristics in the area of technology, employment, and labor trainingsalaries, in addition to basic information on sales, investment, and age of the firm. The surveyincludes all Mexican firms with more than 100 employees, and uses a sampling procedure thatensures representativeness to include smaller firms. The data attaches a unique indicator toeach firm that remains the same over time, which allows us to match firms over time.
In the section on firm organization, the ENESTyC questionnaires ask about the existence (andin 2005 also the year of introduction) of a number of firm techniques. These techniques de-fine key elements of the operations management of the firm, which is the business functionresponsible for planning, coordinating, and controlling the resources needed to produce a firm’sproduct (Reid and Sanders 2005). Most of the specific techniques that we will study are partof operations management concepts that became known in the 1980s and are sometimes collec-tively referred to as lean manufacturing. These ideas originated mostly in Japan, specificallywith the car maker Toyota. They gained rapidly influence in business circles, and it is reason-able to expect that these concepts were well-known in Mexican firms towards the end of the1990s.
While the concepts are related, each of them defines a particular aspect of the techniquesfirms are employing. The following gives a list of techniques, followed by a brief description ofthe key elements of each technique: (1) Total Quality Management; (2) Quality Control; (3)Just-in-Time System; (4) Re-organization; and (5) Job Rotation.8
(1) Total Quality Control: Total Quality Control, or Total Quality Management (TQM), isan integrated effort designed to improve quality performance at every level of the organization.TQM focuses on proactively identifying root causes of reoccurring problems, correcting them atthe source, where customers ultimately determine what is important (customer-driven quality).Key methods include continuous improvement, employee empowerment, understanding qualitycontrol tools, and the formation of work groups acting as problem-solving teams (so-calledquality circles).
8The following descriptions draw on a number of sources on operations management, in particular Reid andSanders (2005).
6
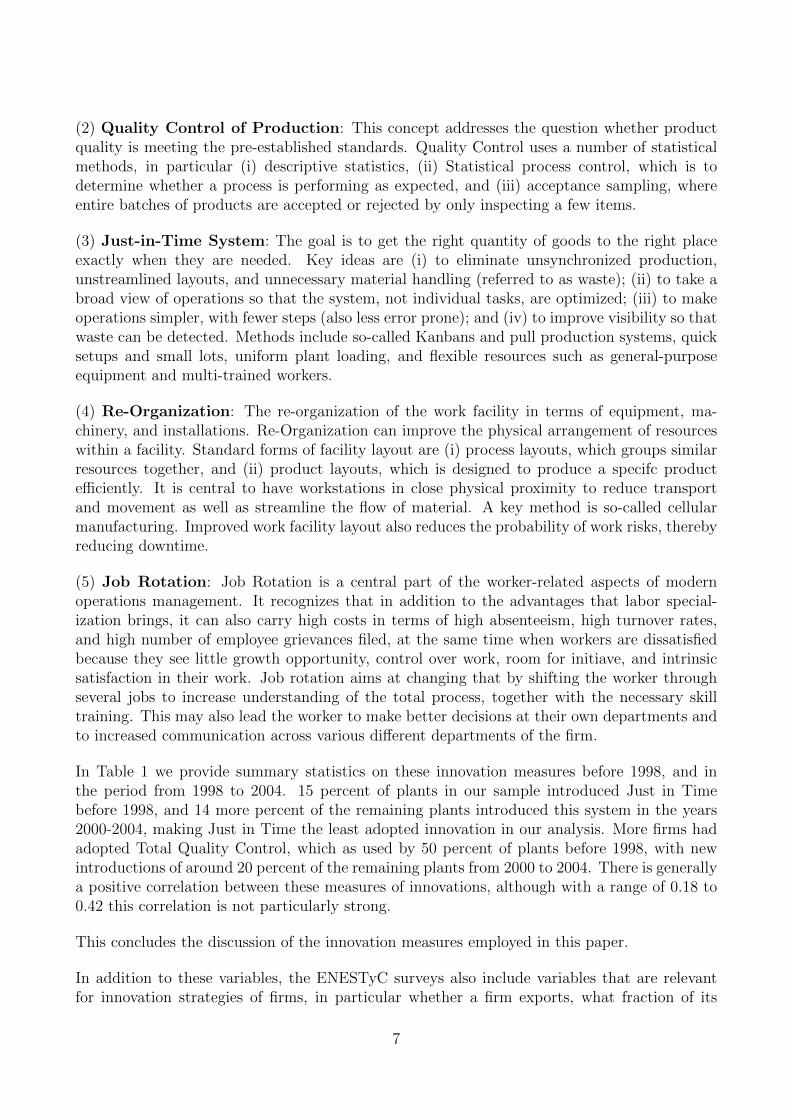
(2) Quality Control of Production: This concept addresses the question whether productquality is meeting the pre-established standards. Quality Control uses a number of statisticalmethods, in particular (i) descriptive statistics, (ii) Statistical process control, which is todetermine whether a process is performing as expected, and (iii) acceptance sampling, whereentire batches of products are accepted or rejected by only inspecting a few items.
(3) Just-in-Time System: The goal is to get the right quantity of goods to the right placeexactly when they are needed. Key ideas are (i) to eliminate unsynchronized production,unstreamlined layouts, and unnecessary material handling (referred to as waste); (ii) to take abroad view of operations so that the system, not individual tasks, are optimized; (iii) to makeoperations simpler, with fewer steps (also less error prone); and (iv) to improve visibility so thatwaste can be detected. Methods include so-called Kanbans and pull production systems, quicksetups and small lots, uniform plant loading, and flexible resources such as general-purposeequipment and multi-trained workers.
(4) Re-Organization: The re-organization of the work facility in terms of equipment, ma-chinery, and installations. Re-Organization can improve the physical arrangement of resourceswithin a facility. Standard forms of facility layout are (i) process layouts, which groups similarresources together, and (ii) product layouts, which is designed to produce a specifc productefficiently. It is central to have workstations in close physical proximity to reduce transportand movement as well as streamline the flow of material. A key method is so-called cellularmanufacturing. Improved work facility layout also reduces the probability of work risks, therebyreducing downtime.
(5) Job Rotation: Job Rotation is a central part of the worker-related aspects of modernoperations management. It recognizes that in addition to the advantages that labor special-ization brings, it can also carry high costs in terms of high absenteeism, high turnover rates,and high number of employee grievances filed, at the same time when workers are dissatisfiedbecause they see little growth opportunity, control over work, room for initiave, and intrinsicsatisfaction in their work. Job rotation aims at changing that by shifting the worker throughseveral jobs to increase understanding of the total process, together with the necessary skilltraining. This may also lead the worker to make better decisions at their own departments andto increased communication across various different departments of the firm.
In Table 1 we provide summary statistics on these innovation measures before 1998, and inthe period from 1998 to 2004. 15 percent of plants in our sample introduced Just in Timebefore 1998, and 14 more percent of the remaining plants introduced this system in the years2000-2004, making Just in Time the least adopted innovation in our analysis. More firms hadadopted Total Quality Control, which as used by 50 percent of plants before 1998, with newintroductions of around 20 percent of the remaining plants from 2000 to 2004. There is generallya positive correlation between these measures of innovations, although with a range of 0.18 to0.42 this correlation is not particularly strong.
This concludes the discussion of the innovation measures employed in this paper.
In addition to these variables, the ENESTyC surveys also include variables that are relevantfor innovation strategies of firms, in particular whether a firm exports, what fraction of its
7

sales it exports, whether a firm imports part of its materials and intermediates, and if sofrom where; whether a firm is foreign owned, and at what percentage; the skill compositionof the firm’s labor force, as well as the extent of worker training that was performed. Inaddition, the surveys cover variables that measure technology investment inputs, such as R&Dexpenditures and other activities affecting the technological capabilities of the firm (such astechnology purchases, equipment purchases, and indicators of process and product innovation).Our analysis will focus mainly on the adoption of specific firm techniques such as Just-in-Time,for reasons laid out above.
Table 2 gives summary statistics of these variables. Sales of plants in our sample increasedconsiderably in the six years studied, from 311 to 540 thousand pesos, while total employmentfor the plants in our sample decreased in mean and median. The share of expenditures spenton R&D was relatively low in both years, with the median plant not spending on research inboth years, which is typical for large samples of firm level data.
Our measure of import competition is based on the actual market share gains of Chineseexporters between the years 1998 and 2004.9 While we are interested in the response of Mexicanfirms to Chinese competition, we recognize that Chinese market share gains in Mexico arepotentially endogenous to the performance of the Mexican firms themselves. To address thisissue, we employ information on Chinese market share gains in the United States instead ofChinese gains in Mexico over this period. By exploiting evidence on the competitive strength ofChina in a different, much larger though closely related market, we are more plausibly examiningan exogenous shock to the Mexican manufacturing sector.
The import competition variable is the change in the imports from China in the United Statesbetween 1998 to 2004, relative to all US imports, for narrowly defined industries. We merge thesurvey information with the well known international trade data from COMTRADE employingthe concordance of Iacovone, Rauch, and Winters (2010). This links the Mexican plant dataat the six-digit level (CMAP 6) to the COMTRADE trade data according to the HarmonizedSystem (HS) classification.
The following section presents our empirical findings.
4 Empirical Results
4.1 Innovation and Competition
We now turn to estimating the effect of competition from China on the innovative behaviorof Mexican plants. A simple estimation strategy is adopted in which measures of innovationafter China’s entry into the WTO in 2001 are related to competition from China and a numberof control variables. Dropping the time subscript, the equation we estimate for the results inTable 3 is:
9We are in the process of adding policy measures–the change in tariffs–for a subset of industries as additionalmeasures of changes in import competition.
8

yi(j) = β0 + β1∆compj + γX + εi(j), (3)
where yi(j) is an innovation outcome variable of plant i in the six-digit industry j in the year2004, β0 a constant, ∆compj a measure of competition from China at the six-digit level, X amatrix of control variables such as the age of a plant, the distance to the U.S. border, a dummyfor plants in Mexico City, and a matrix of two digit industry fixed effects. Throughout thereported results we apply robust standard errors, which we cluster at six digit industry level(the level at which competition varies).
As noted above, we are concerned that the observed degree of import penetration of Chinain Mexico is endogenous. One possibility is that Chinese firms make greater inroads intothe Mexican market whenever the Mexican competitors are particularly weak. Therefore, thechange in the Chinese import share in the United States is employed as our main measure ofcompetition. China’s export success in the US market Chinese exports to the US are positivelycorrelated with Chinese exports to Mexico, but the US imports are less likely to be subject toreverse causality.
Table 3 shows results for estimating equation (3) with five different innovation measures asdependent variables. To begin with, in column (1) yi(j) is equal to one if the plant adoptedJust-in-Time (JIT) techniques between the years 1998 and 2004, and zero otherwise. Thecompetition variable is the change in the import share from China in the United States between1998 and 2004 (6-digit level). The other included variables are, first, the geographical distanceof the plant to the United States border which is a determinant of the US orientation (especiallythe export-processing maquiladoras). We also control for whether a plant is located in MexicoCity or not, and a set of age indicators (age greater than 10 years is the excluded category). Wealso include two-digit industry fixed effects which capture broader industry trends. Estimationmethod is OLS, with p-values based on robust and clustered (6-digit industry) standard errorsreported in parentheses.
The key finding of Table 3 is that there is no simple relationship between innovation andcompetition among this sample of Mexican plants. While the competition coefficient β1 tendsto be negative–more competition associated with lower innovation–, estimates are small andimprecisely estimated (not significant at standard levels). There is no evidence from this foran impact of competition on innovation that holds across the board for all plants. Moreover,it turns out that the control variables matter little. In the following section, we consider thepossibility that the innovation response of plants is shaped by specific plant characteristics.
4.2 Heterogeneous Innovation Responses To Competition
4.2.1 Productivity Heterogeneity
We begin our analysis by examining the role of exogenous productivity differences across firms,which has been highlighted as an important determinant of firm behaviour in a trade context inrecent work (see the overview in Redding 2010). Our measure of productivity is a dichotomous
9

variable that equals one if a firm has a labor productivity, defined as sales over employment,in the year 1998 that is higher than the median of the three-digit industry to which the firmbelongs, and zero otherwise.10 The estimation equation follows (2) from above, which is repro-duced here for convenience:
yi(j) = β0 + β1∆compj + β2qi(j) + β3(qi(j) ×∆compj
)+ γX + ui(j). (4)
Equation (4) represents a cross-sectional relationship for the years 1998 to 2004, and conse-quently we have dropped time subscripts. The variable qi(j) is the indicator of high productivityin the year 1998 (qi(j) = 1), while qi(j) is equal to zero if firm i (in six-digit industry j) hada relatively low productivity in 1998. According to equation (4), β1 gives the relationship ofcompetition and innovation for firms with low initial (1998) productivity, while (β1 + β3) givesthe effect for firms with high initial productivity. Results are shown in Table 4.11
Column (1) shows the results of estimating (4) with Just-in-Time (JIT) as the dependentvariable. First, note that the coefficient on initial productivity, β2, is close to zero. Becausethere is no evidence that high productivity raises the probability of JIT adoption, strong pastperformance –which led to high productivity by 1998– does not appear to necessarily translateinto higher rates of innovation.
There is, however, a key distinction between high and low productivity firms in terms of theirinnovative response in the face of import competition. JIT adoption rates of low productivityfirms fall when they are hit by competition, whereas JIT adoption rates of high productivityfirms do not. In fact, since β1 + β3 in column (1) is positive, about 0.13, the typical firm withhigh productivity in the year 1998 speeds up JIT adoption whereas low productivity firms slowdown the adoption of JIT. In column (2), our measure of innovation is the adoption of productquality control. It shows a similar pattern, with competition increasing the rate of adoption forhigh productivity firms while low productivity firms adopt less (not significant).
Next we turn to the adoption of Total Quality Control (or TQM, for Total Quality Management)techniques, see column (3) of Table 4. As such, initial productivity has not a large impact oninnovation. However, when faced with strong import competition high productivity firms raisetheir adoption rates of TQM while low productivity firms adopt TQM less. Column (4) reportsresults for innovations in terms of re-organization of equipment, machinery, and installations–generally speaking, changes in the work facility layout. Low productivity firms faced withnew competition from China sharply reduce these activities, whereas high productivity firmsincrease these activities by a small amount (β1 + β3 = 0.05). Finally, high productivity firmsalso innovate more in the face of strong import competition in terms of Job Rotation, whereaslow productivity firms under pressure from import competition do less Job Rotation (column(5)).
10We define productivity relative to the three-digit industry to ensure that both the high- and the low-productivity firm groups have firms from all industries; Lileeva and Trefler (2010) have recently adopted asimilar approach.
11We also henceforth focus on the set of firms that by 1998 had not yet adopted a certain technique (potentialswitchers). This is useful as it reduces the noise in the analysis.
10

While these results point to a striking difference as to how strong versus weak performing firmsreact to import competition in terms of innovation, before drawing any conclusions we haveto address a number of issues. First, the innovation measures are limited dependent variables,taking on the value of 0 or 1, so that applying OLS might yield misleading results. We thereforeconsider probit regressions as an alternative. The probit results are given in Table 5 along withthe OLS results from Table 4 (marginal effects are reported for the probit). We see that forall five innovation measures, the magnitude and significance of how the innovation response tocompetition differs between high and low productivity firms is remarkably similar in the probitand OLS regressions.
Second, it may be that the parametric form of the interaction variable qi(j)×∆compj affects ourresults in a particular way. To address this issue, we have estimated the relationship betweeninnovation and changes in import competition separately for low and for high productivity firms.The results are given in Table 6. For a given innovation measure, the first column reports theresults for high productivity firms (as of 1998), and the second column shows results for thesame regression for the low productivity firms. Comparing the estimates on the competitionvariable, the results from this less parametric approach are quite similar to the interactionvariable-regressions.
Specifically, all point estimates for high productivity firms are positive while all point estimatesfor low productivity firms are negative, and even though the coefficients are not all preciselyestimated, the difference in the coefficients is in some cases statistically significant. This is shownin Figure 2 which graphs the point estimate and 90% confidence intervals for the techniques ofTable 6 separately for high and low productivity firms.
Third, we have examined the role that our competition measure plays for these results. Recallthat ∆compj is computed as the change in the share of US imports from China in total USimports between the years 1998 and 2004. In the upper panel of Figure 3, we show the differencefor the low and high productivity firms for four different measures of competition. On top isthe change in Chinese imports in the US, the measure we have employed so far, followed bythe 1998 level of the Chinese import share in the US. Along the lines of Pavcnik (2002) andothers, the initial level of imports may be a good predictor of which industries are particularlythreatened by future increases in import competition. The lower two graphs are for the changeof China’s import share in Mexico, while the fourth set of results is for the level of China’simport share in Mexico in the year 1998.
Figure 3 shows that the difference in the innovative response of low and high productivityfirms to import competition exists independent of which particular measure of competition isemployed. The figure indicates that the difference between low and high productivity firms isstrongest for the 1998 US level variable. For the 1998 Mexican level variable the difference isless clear, presumably because Chinese import shares in Mexican six-digit industries in 1998were still quite low across the board. Moreover, we confirm the strong difference between lowand high productivity firms if we base the competition measure on Mexican absorption (importsplus production minus exports) instead of Mexican imports.
We conclude that the finding that productive firms innovate more in response to the Chinatrade shock while less productive firms innovate less is robust in a number of ways. It means
11
that import competition sharpens the difference between strong- and weak performing firmsbecause it leads to innovation that amplifies the initial difference. We emphasize that we findlittle evidence that strong firms generally innovate more, but rather that import competitiontriggers this response leading to positive dynamic selection.
Moreover, the response difference of strong versus weak performing firms can only be explainedin a framework that allows for a non-monotonic relationship between innovation and compe-tition. One possibility is the escape-competition effect modeled by Aghion et al. (2001). Incontrast, while a Schumpeterian argument may explain why low productivity firms innovateless it is inconsistent with high productivity firms innovating at the same time more. Alterna-tively, if increased competition increases innovation by reducing agency problems, there mustbe another explanation for why low productivity firms reduce innovation in the face of importcompetition from China.
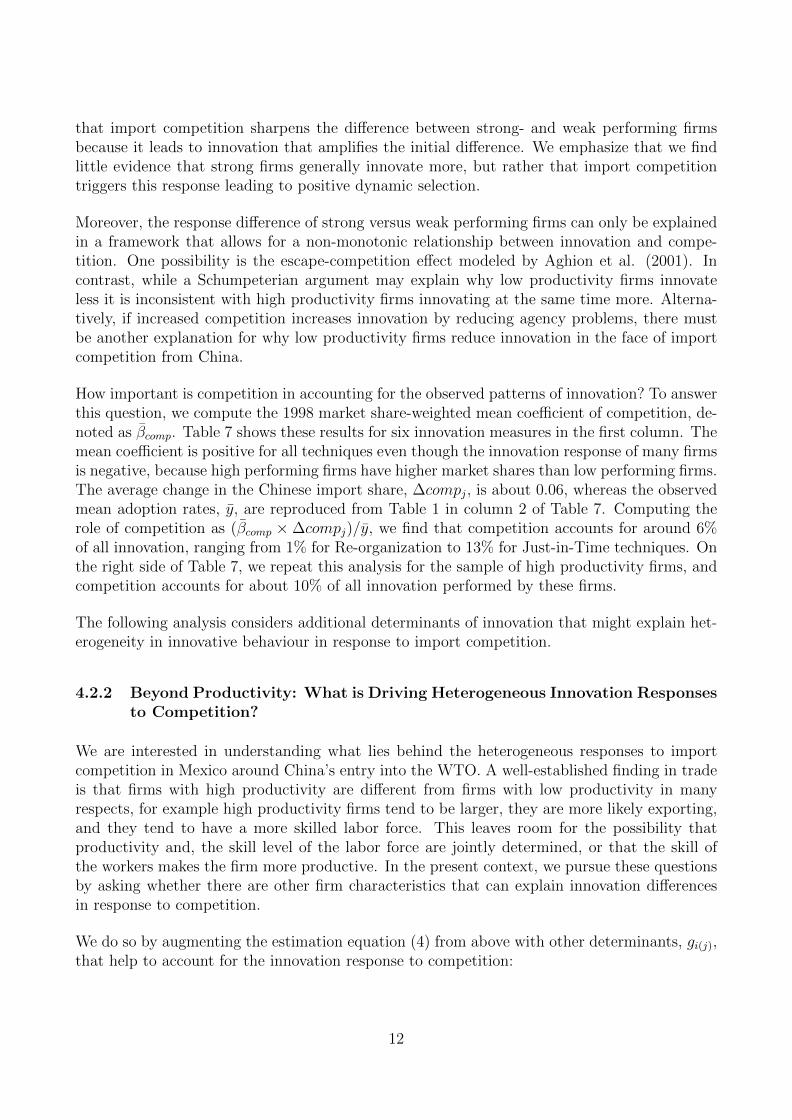
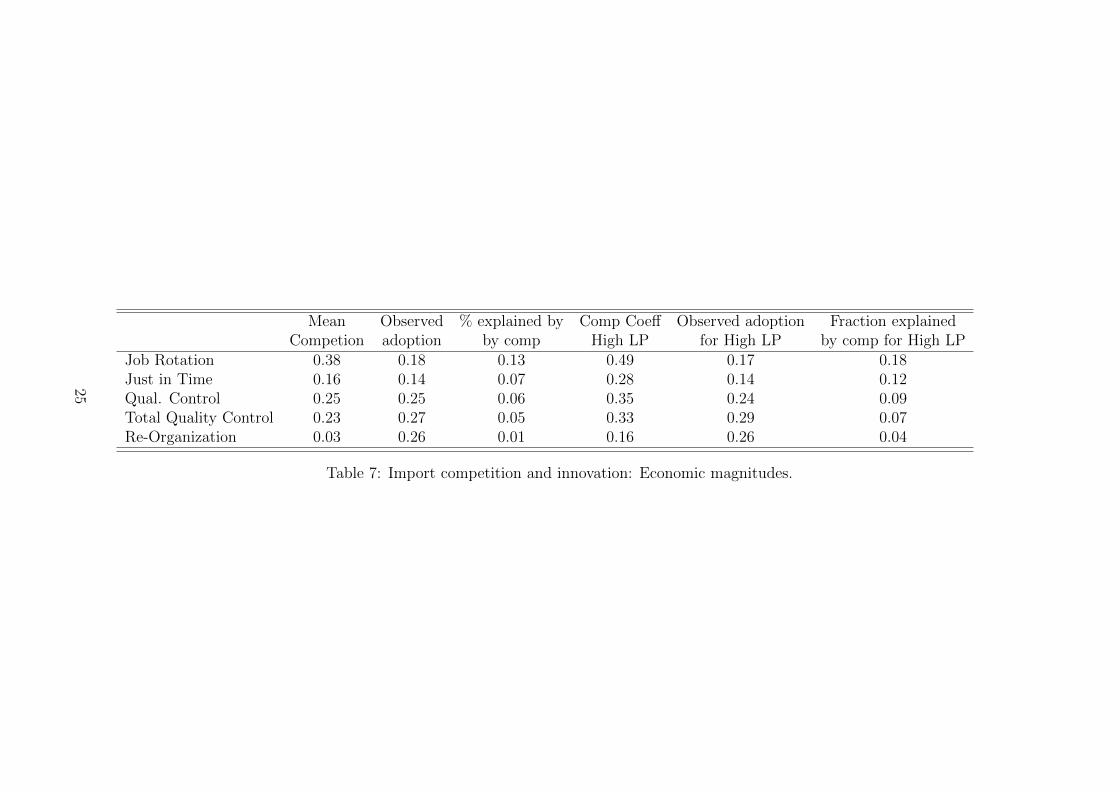
How important is competition in accounting for the observed patterns of innovation? To answerthis question, we compute the 1998 market share-weighted mean coefficient of competition, de-noted as βcomp. Table 7 shows these results for six innovation measures in the first column. Themean coefficient is positive for all techniques even though the innovation response of many firmsis negative, because high performing firms have higher market shares than low performing firms.The average change in the Chinese import share, ∆compj, is about 0.06, whereas the observedmean adoption rates, y, are reproduced from Table 1 in column 2 of Table 7. Computing therole of competition as (βcomp ×∆compj)/y, we find that competition accounts for around 6%of all innovation, ranging from 1% for Re-organization to 13% for Just-in-Time techniques. Onthe right side of Table 7, we repeat this analysis for the sample of high productivity firms, andcompetition accounts for about 10% of all innovation performed by these firms.
The following analysis considers additional determinants of innovation that might explain het-erogeneity in innovative behaviour in response to import competition.
4.2.2 Beyond Productivity: What is Driving Heterogeneous Innovation Responsesto Competition?
We are interested in understanding what lies behind the heterogeneous responses to importcompetition in Mexico around China’s entry into the WTO. A well-established finding in tradeis that firms with high productivity are different from firms with low productivity in manyrespects, for example high productivity firms tend to be larger, they are more likely exporting,and they tend to have a more skilled labor force. This leaves room for the possibility thatproductivity and, the skill level of the labor force are jointly determined, or that the skill ofthe workers makes the firm more productive. In the present context, we pursue these questionsby asking whether there are other firm characteristics that can explain innovation differencesin response to competition.
We do so by augmenting the estimation equation (4) from above with other determinants, gi(j),that help to account for the innovation response to competition:
12

yi(j) = β1∆compj +β2qi(j)+β3(qi(j) ×∆compj
)+β4gi(j)+β5
(gi(j) ×∆compj
)+γX+ui(j). (5)
The additional factors, gi(j), for each firm are foreign ownership, export status, import status,imports from Asia, skill level of the labor force, and the profitability of the firm, all for theyear 1998. Foreign ownership (FOR) is a 0/1 variable based on whether any capital of the firmis foreign-owned, export status (EXP ) is a 0/1 variable of whether the firm exports part ofits production, and import status (IMP ) is a 0/1 variable of whether the firm has importedpart of its materials and intermediate goods from abroad. The imports from Asia (IMPA)variable captures whether any of the materials and intermediate imports in 1998 came fromAsia (including China), the skill variable (SKILL) is the share of white collar in total laborforce, and profitability (PROFIT ) is captured by the price-cost margin of the firm in 1998,defined as sales minus labor and material costs over sales.
The results for the adoption of Just-in-Time techniques are shown in Table 8. In the firstcolumn, we add the foreign ownership indicator, FOR, both interacted with competition and byitself (last result row). The results indicate that, as before, firms with relatively low productivityin 1998 are less likely to adopt JIT when hit with import competition from China. Highproductivity firms tend to innovate more than low productivity firms, however, in contrast tothe earlier results we now see that overall the innovation rates of high productivity firms fall aswell (β1 +β3 = −0.09). This change is explained by the fact that foreign-owned firms are muchmore likely to adopt JIT in the face of import competition than domestically-owned firms; thecoefficient β5 is estimated at about 0.7. This shows that foreign ownership is explaining partof the differential response between low and high productivity firms.
The remaining columns (2) to (6) of Table 8 introduce the other variables, EXP , IMP , IMPA,SKILL, and PROFIT analogously to foreign ownership, FOR. It turns out that these vari-ables are not significant determinants of JIT, neither by themselves (last result row) nor inconjunction with competition. Note however that firms that import from Asia in the year 1998are marginally more likely to adopt JIT in the face of import competition from China (pointestimate of 0.4 in column (4), p-value of 17%), whereas generally importing has almost no effecton innovation (point estimate of 0.05, column (3)). This is consistent with the idea that firmsthat import from Asia are less concerned with new competition from China than that the newimports facilitate innovation of these firms.
Additional evidence on firm characteristics that help shaping innovative responses to importcompetition is given for a second innovation variable, the Re-Organization of equipment, ma-chinery, and installations in the work facility; Table 9 shows the results. An important aspectof this research is that comparing the results for JIT in Table 8 and Re-Organization in Table 9will also give a better idea of the specific conditions that have to be in place for different firm-level innovations to succeed.From Table 9, we see that the probability that a firm re-organizes
its work facility under competitive threat is not affected by whether the firm is foreign-ownedor not (column (1)). Part of why Re-Organization increases with competition appears to bedue to the skill composition of the labor force: only high productivity firms that have a skilledlabor force increase innovation in the presence of competition from China, while in other high
13
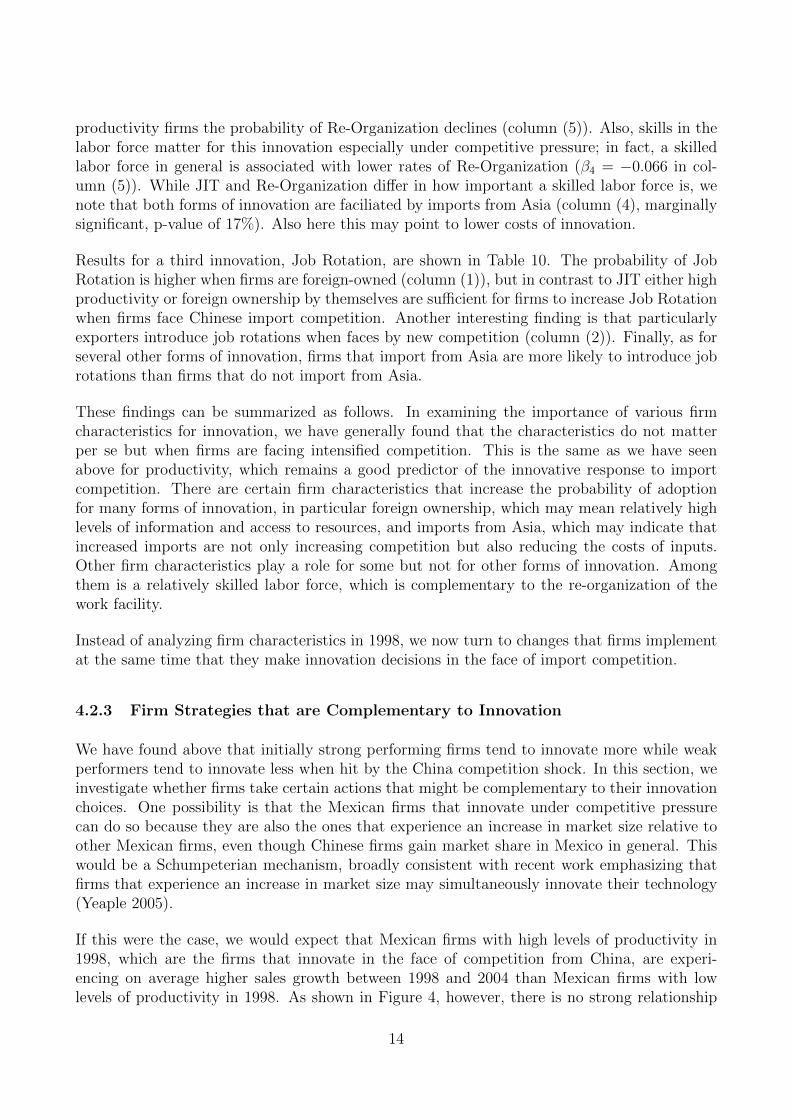
productivity firms the probability of Re-Organization declines (column (5)). Also, skills in thelabor force matter for this innovation especially under competitive pressure; in fact, a skilledlabor force in general is associated with lower rates of Re-Organization (β4 = −0.066 in col-umn (5)). While JIT and Re-Organization differ in how important a skilled labor force is, wenote that both forms of innovation are faciliated by imports from Asia (column (4), marginallysignificant, p-value of 17%). Also here this may point to lower costs of innovation.
Results for a third innovation, Job Rotation, are shown in Table 10. The probability of JobRotation is higher when firms are foreign-owned (column (1)), but in contrast to JIT either highproductivity or foreign ownership by themselves are sufficient for firms to increase Job Rotationwhen firms face Chinese import competition. Another interesting finding is that particularlyexporters introduce job rotations when faces by new competition (column (2)). Finally, as forseveral other forms of innovation, firms that import from Asia are more likely to introduce jobrotations than firms that do not import from Asia.
These findings can be summarized as follows. In examining the importance of various firmcharacteristics for innovation, we have generally found that the characteristics do not matterper se but when firms are facing intensified competition. This is the same as we have seenabove for productivity, which remains a good predictor of the innovative response to importcompetition. There are certain firm characteristics that increase the probability of adoptionfor many forms of innovation, in particular foreign ownership, which may mean relatively highlevels of information and access to resources, and imports from Asia, which may indicate thatincreased imports are not only increasing competition but also reducing the costs of inputs.Other firm characteristics play a role for some but not for other forms of innovation. Amongthem is a relatively skilled labor force, which is complementary to the re-organization of thework facility.
Instead of analyzing firm characteristics in 1998, we now turn to changes that firms implementat the same time that they make innovation decisions in the face of import competition.
4.2.3 Firm Strategies that are Complementary to Innovation
We have found above that initially strong performing firms tend to innovate more while weakperformers tend to innovate less when hit by the China competition shock. In this section, weinvestigate whether firms take certain actions that might be complementary to their innovationchoices. One possibility is that the Mexican firms that innovate under competitive pressurecan do so because they are also the ones that experience an increase in market size relative toother Mexican firms, even though Chinese firms gain market share in Mexico in general. Thiswould be a Schumpeterian mechanism, broadly consistent with recent work emphasizing thatfirms that experience an increase in market size may simultaneously innovate their technology(Yeaple 2005).
If this were the case, we would expect that Mexican firms with high levels of productivity in1998, which are the firms that innovate in the face of competition from China, are experi-encing on average higher sales growth between 1998 and 2004 than Mexican firms with lowlevels of productivity in 1998. As shown in Figure 4, however, there is no strong relationship
14

between productivity in 1998 and subsequent sales growth in our sample of Mexican firms; ifanything, the relationship is negative, not positive. It is therefore not the case that differencesin innovation behavior are driven by contemporaneous differences in sales.
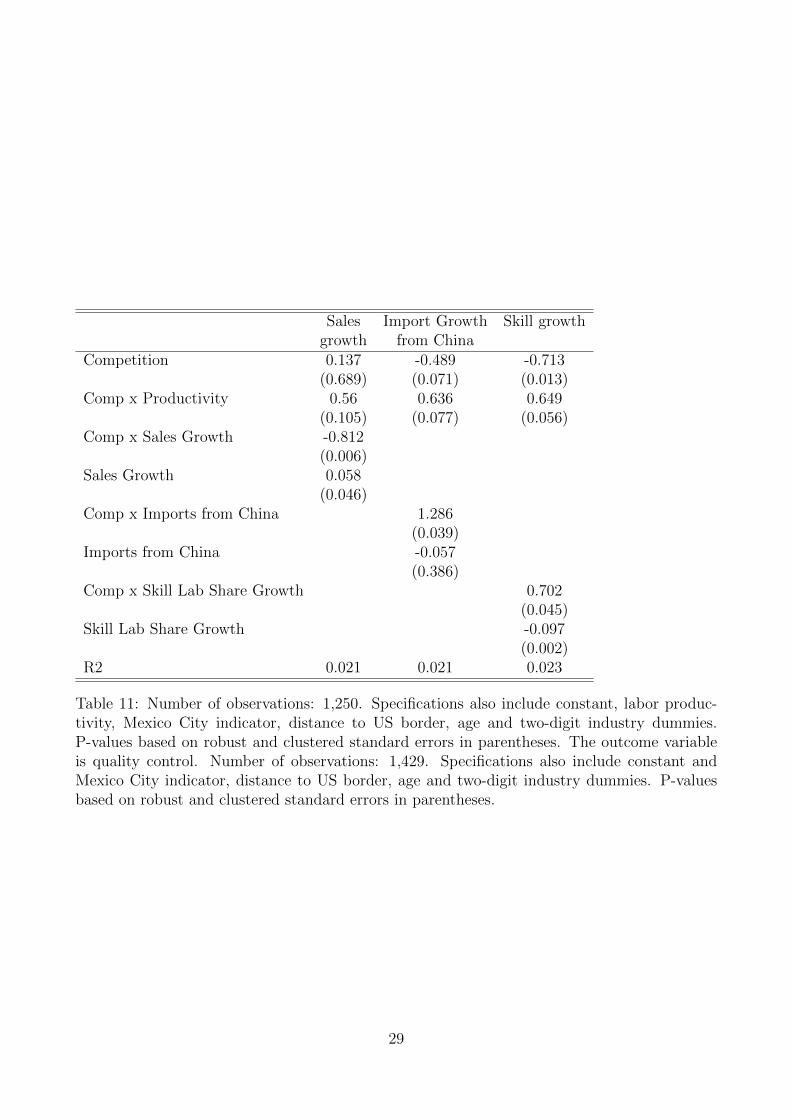
In the following we extend this analysis to a regression framework and consider additionalfactors, see Table 11, where Quality Control, as the specific form of innovation we consider,is the dependent variable. Column (1) confirms the message of Figure 4. It shows that eventhough sales growth in general raises the probability of innovation, in the face of Chinese importcompetition firms that experience lower sales growth actually innovate more than firms thathave higher sales growth (coefficient of −0.81 on sales growth x ∆compj). In contrast, firmsthat increase their imports from China (column (2)) and raise the skill level of their laborforce adopt at a higher rate Quality Control techniques than firms that do not do so. Thisprovides initial evidence on firm strategies that are complementary to innovation. Moreover,it is consistent with the role of skill and intermediate imports that we have found in terms of1998 differences across firms above.
To summarize, from our analysis so far it appears that in the face of new import competition, thedifferences across firms in terms of their innovative behavior–their forward looking activity–aremagnified relative to differences across firms in terms of current sales.
We now turn to some concluding discussion.
15

5 Conclusions
The Schumpeterian hypothesis that monopolists have a greater incentive to innovate than firmsfacing tough competition has been revisited by new theory and empirical results finding thatmore competition may on balance actually increase the rate of innovation. In our analysis ofthe impact of China’s emergence as a force in international trade, we find that the rate ofinnovation of Mexican plants seems on average unaffected. This may be specific to the shockwe are analyzing, which is extraordinary in many respects. At the same time, there is strongevidence that firms with higher labor productivity tend to innovate more than less productivefirms in the face of new competition.
For this investigation, we rely on data from surveys on Mexican plants, that allow us to dis-tinguish various specific measures of innovation, such as the introduction of Just in Time man-agement system, job rotation schemes, quality controls, continuous controls and productionre-organizations. We find for all these measures that more productive plants are more likelyto introduce them as a response to the unilateral competition from China than less productiveplants. This difference is strongest for Just in Time. Import competition is thus a force thatsharpens the difference between strong-performing and weak-performing firms, a result that isin line with the more qualitative body of research on countries’ foreign trade strategies that hasbeen accumulated since World War II.
16

References
[1] Aghion, P., R. Blundell, R. Griffith, P. Howitt and S. Prantl (2009), “The Effects of Entryon Incumbent Innovation and Productivity”, Review of Economics and Statistics, vol. 91,no. 1, pp. 20-32.
[2] Aghion P., C. Harris, P. Howitt, and J. Vickers (2001) “Competition, Imitation, andGrowth with Step-by-Step Innovation”, Review of Economic Studies 68: 467-492.
[3] Atkeson, Andrew and Ariel Burstein, “Pricing to Market, Trade Costs, and InternationalRelative Prices”, American Economic Review, December 2008.
[4] Aw, Bee Yan, Mark Roberts, and Tor Winston (2007), “Export Market Participation,Investments in R&D and Worker Training, and the Evolution of Firm Productivity”, WorldEconomy, pp. 83-104.
[5] Bernard, Andrew, Jonathan Eaton, J. Bradford Jensen and Samuel S. Kortum, “Plantsand Productivity in International Trade”, American Economic Review, 93(4), 2003.
[6] Bernard, Andrew, Stephen Redding and Peter Schott (2010), “Multiple Product Firmsand Product Switching”, American Economic Review.
[7] Bhagwati, J. (1978), Anatomy and Consequences of Exchange Control Regimes, Ballinger.
[8] Bloom, N., M. Draca and J. Van Reenen (2009), “Trade Induced Technical Change: TheImpact of Chinese Imports on Innovation, Diffusion and Productivity”, mimeo, StanfordUniversity.
[9] Bloom, N. and J. Van Reenen, “Measuring and Explaining Management Practices AcrossFirms and Countries”, The Quarterly Journal of Economics 122: 1351-1408.
[10] Bustos, Paula, “Trade Liberalization, Exports and Technology Upgrading: Evidence onthe Impact of MERCOSUR on Argentinean Firms”, American Economic Review, 2010.
[11] Costantini, James A., and Marc J. Melitz, “The Dynamics of Firm-Level Adjustment toTrade,” in The Organization of Firms in a Global Economy, Elhanan Helpman, DaliaMarin, and Thierry Verdier, eds. (Cambridge, MA: Harvard University Press, 2008).
[12] De Loecker, J. (2007), “Do exports generate higher productivity? Evidence from Slovenia”,Journal of International Economics, vol. 73, no. 1, pp. 69-98.
[13] Foster, Lucia, John C. Haltiwanger and Chad Syverson, 2008, “Reallocation, FirmTurnover, and Efficiency: Selection on Productivity or Profitability?”, American EconomicReview, 98(1): 394-425.
[14] Goldberg, P., A. Khandelwal, N. Pavcnik and P. Topolova (2009), “Trade Liberalizationand New Imported Inputs”, forthcoming, Quarterly Journal of Economics.
[15] Holmes, Thomas J. David K. Levine and James A Schmitz Jr., (2008), “Monopoly and theIncentive to Innovate When Adoption Involves Switchover Disruptions”, NBER WorkingPaper, 13864.
17
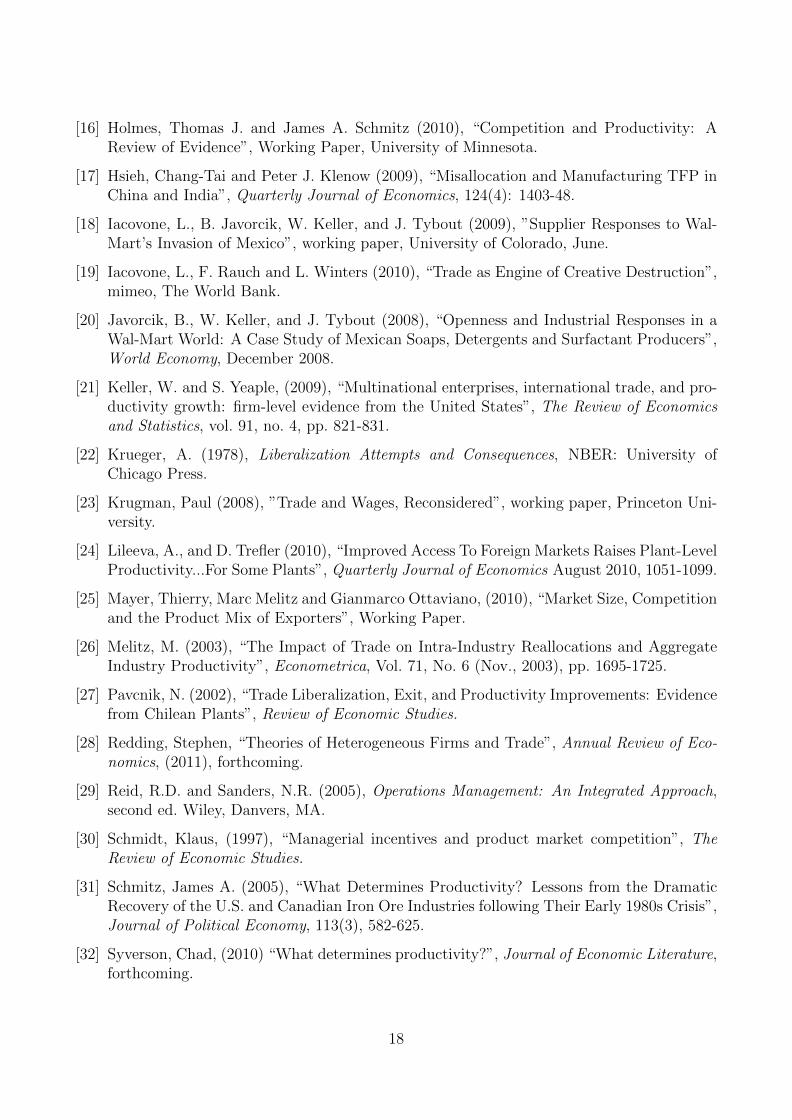
[16] Holmes, Thomas J. and James A. Schmitz (2010), “Competition and Productivity: AReview of Evidence”, Working Paper, University of Minnesota.
[17] Hsieh, Chang-Tai and Peter J. Klenow (2009), “Misallocation and Manufacturing TFP inChina and India”, Quarterly Journal of Economics, 124(4): 1403-48.
[18] Iacovone, L., B. Javorcik, W. Keller, and J. Tybout (2009), ”Supplier Responses to Wal-Mart’s Invasion of Mexico”, working paper, University of Colorado, June.
[19] Iacovone, L., F. Rauch and L. Winters (2010), “Trade as Engine of Creative Destruction”,mimeo, The World Bank.
[20] Javorcik, B., W. Keller, and J. Tybout (2008), “Openness and Industrial Responses in aWal-Mart World: A Case Study of Mexican Soaps, Detergents and Surfactant Producers”,World Economy, December 2008.
[21] Keller, W. and S. Yeaple, (2009), “Multinational enterprises, international trade, and pro-ductivity growth: firm-level evidence from the United States”, The Review of Economicsand Statistics, vol. 91, no. 4, pp. 821-831.
[22] Krueger, A. (1978), Liberalization Attempts and Consequences, NBER: University ofChicago Press.
[23] Krugman, Paul (2008), ”Trade and Wages, Reconsidered”, working paper, Princeton Uni-versity.
[24] Lileeva, A., and D. Trefler (2010), “Improved Access To Foreign Markets Raises Plant-LevelProductivity...For Some Plants”, Quarterly Journal of Economics August 2010, 1051-1099.
[25] Mayer, Thierry, Marc Melitz and Gianmarco Ottaviano, (2010), “Market Size, Competitionand the Product Mix of Exporters”, Working Paper.
[26] Melitz, M. (2003), “The Impact of Trade on Intra-Industry Reallocations and AggregateIndustry Productivity”, Econometrica, Vol. 71, No. 6 (Nov., 2003), pp. 1695-1725.
[27] Pavcnik, N. (2002), “Trade Liberalization, Exit, and Productivity Improvements: Evidencefrom Chilean Plants”, Review of Economic Studies.
[28] Redding, Stephen, “Theories of Heterogeneous Firms and Trade”, Annual Review of Eco-nomics, (2011), forthcoming.
[29] Reid, R.D. and Sanders, N.R. (2005), Operations Management: An Integrated Approach,second ed. Wiley, Danvers, MA.
[30] Schmidt, Klaus, (1997), “Managerial incentives and product market competition”, TheReview of Economic Studies.
[31] Schmitz, James A. (2005), “What Determines Productivity? Lessons from the DramaticRecovery of the U.S. and Canadian Iron Ore Industries following Their Early 1980s Crisis”,Journal of Political Economy, 113(3), 582-625.
[32] Syverson, Chad, (2010) “What determines productivity?”, Journal of Economic Literature,forthcoming.
18

[33] Tybout, James (2003), ”Plant- and Firm-level Evidence on the ’New’ Trade Theories”in E. Kwan Choi and James Harrigan, ed., Handbook of International Trade, Oxford:Basil-Blackwell, 2003.
[34] Utar, Hale, and Torres Ruiz (2010), “International Competition and Industrial Evolution:Evidence from the Impact of Chinese Competition on Mexican Maquiladoras”, Workingpaper, University of Colorado.
[35] Verhoogen, Eric, “Trade, Quality Upgrading and Wage Inequality in the Mexican Manu-facturing Sector,” Quarterly Journal of Economics, 123 (2008), 489–530.
[36] Winters, Alan and Shahid Yusuf, 2007, “Dancing with giants, China, India and the GlobalEconomy”, Washington DC., World Bank.
[37] Womack, J., D. Jones and D. Roos (1991), “The machine that changed the world”, NewYork: Harper Collins.
[38] Yeaple, Stephen, “A Simple Model of Firm Heterogeneity, International Trade, andWages”, Journal of International Economics, 2005, 65(1): 1-20.
19

Percent of firms No. of firms Percent of firms No. of firmswith innovation with innovation that adopt innovation that adopt innovation
in 1998 in 1998 between 2000-04 between 2000-04Just in Time 15.4 334 13.7 251Quality Control 33.5 726 24.7 356Re-Organization 40 867 26 338Total Quality Control 49.8 1,079 27.2 296Job Rotation 24.5 531 18.2 298
Table 1: Innovation frequency in 1998 and innovation adoption from 2000 to 2004. The total number of firms is 2,167.
20

Period Mean Median Std DevTotal Sales 1998 312 k 85 k 1,463 k
2004 541 k 144 k 2,316 kEmployment 1998 377 228 583 k
2004 341 210 491 kLabor training 1998 0.833 1 0.373
2004 0.719 1 0.449R & D (%) 1998 0.09 0 3
2004 1.68 0 34.9Foreign Ownership 1998 16.3 0 35.41
2004 16.8 0 35.41Exporter Status 1998 0.61 1 0.488
2004 0.579 1 0.494Intermediates from Asia 1998 0.025 0 0.157Intermediates from China 1998 0.691 0 4.69
Table 2: Labor training is a dummy variable that indicates the presence of any labor trainingefforts of firms, R&D measures the share of expenditures for R&D, foreign ownership measuresthe share of capital from outside Mexico, exporter status is a dummy variable equal to one forexporters, intermediates from Asia indicates by firms if Asia was origin of any intermediates,intermediates from China reports the percent of intermediate imports from China.
(1) (2) (3) (4) (5)Just in Quality Total Quality Re- JobTime Control Control Organization Rotation
Competition -0.202 -0.021 -0.067 -0.312 0.075(0.146) (0.195) (0.225) (0.233) (0.175)
Distance to US -0.017 -0.048 0.008 0.005 -0.012(0.022) (0.034) (0.038) (0.033) (0.025)
Mexico City -0.024 -0.055 0.011 -0.007 -0.028(0.022) (0.035) (0.041) (0.031) (0.032)
Age <5 years 0.052 -0.033 0.003 -0.025 0.004(0.035) (0.049) (0.060) (0.043) (0.040)
Age < 10 years -0.009 -0.013 -0.061 -0.002 -0.039(0.024) (0.039) (0.044) (0.041) (0.032)
Observations 1604 1250 951 1136 1429R-squared 0.012 0.014 0.014 0.028 0.014
Table 3: Industry fixed effects at the CMAP 2 digit level included. Robust standard errorsclustered at the CMAP 6 digit level.
21

(1) (2) (3) (4) (5)Just in Quality Total Quality Re- JobTime Control Control Organization Rotation
Competition -0.541*** -0.314 -0.473 -0.694** -0.380*(0.179) (0.268) (0.300) (0.270) (0.212)
Competition x Prod. in 1998 0.667** 0.595* 0.854* 0.742** 0.859***(0.265) (0.351) (0.481) (0.346) (0.290)
Productivity in 1998 In 1998 -0.038 -0.041 -0.027 -0.041 -0.078***(0.027) (0.036) (0.047) (0.031) (0.029)
Distance to US -0.018 -0.052 0.007 0.004 -0.020(0.022) (0.034) (0.038) (0.032) (0.025)
Mexico City -0.022 -0.055 0.015 -0.003 -0.027(0.022) (0.036) (0.042) (0.031) (0.032)
Age < 5 years 0.049 -0.036 -0.003 -0.028 0.003(0.035) (0.049) (0.061) (0.044) (0.041)
Age < 10 years -0.010 -0.013 -0.059 -0.002 -0.036(0.024) (0.039) (0.044) (0.041) (0.032)
Observations 1604 1250 951 1136 1429R-squared 0.017 0.016 0.019 0.032 0.020
Table 4: Industry fixed effects at the CMAP 2 digit level included. Robust standard errorsclustered at the CMAP 6 digit level.
22

(1) (2) (3) (4) (5) (6) (7) (8) (9) (10)Just in Time Quality Control Total Quality Control Re-Organization Job Rotation
Competition -0.541*** -0.532** -0.314 -0.390 -0.473 -0.575* -0.694** -0.749*** -0.380* -0.473**(0.179) (0.216) (0.268) (0.254) (0.300) (0.339) (0.270) (0.256) (0.212) (0.218)
Competition x Prod 0.667** 0.697** 0.595* 0.656* 0.854* 0.889* 0.742** 0.760** 0.859*** 0.838***(0.265) (0.284) (0.351) (0.354) (0.481) (0.502) (0.346) (0.363) (0.290) (0.300)
Productivity in 1998 -0.038 -0.043 -0.041 -0.047 -0.027 -0.034 -0.041 -0.053* -0.078*** -0.079***(0.027) (0.026) (0.036) (0.035) (0.047) (0.046) (0.031) (0.030) (0.029) (0.030)
Distance to US -0.018 -0.022 -0.052 -0.049 0.007 0.008 0.004 -0.001 -0.020 -0.017(0.022) (0.020) (0.034) (0.031) (0.038) (0.037) (0.032) (0.032) (0.025) (0.025)
Mexico City -0.022 -0.021 -0.055 -0.059* 0.015 0.021 -0.003 -0.010 -0.027 -0.031(0.022) (0.023) (0.036) (0.036) (0.042) (0.042) (0.031) (0.030) (0.032) (0.029)
Age < 5 years 0.049 0.042 -0.036 -0.046 -0.003 -0.006 -0.028 -0.035 0.003 -0.002(0.035) (0.034) (0.049) (0.050) (0.061) (0.059) (0.044) (0.043) (0.041) (0.039)
Age < 10 years -0.010 -0.010 -0.013 -0.012 -0.059 -0.066 -0.002 -0.007 -0.036 -0.037(0.024) (0.024) (0.039) (0.038) (0.044) (0.043) (0.041) (0.042) (0.032) (0.032)
Observations 1604 1604 1250 1250 951 951 1136 1136 1429 1429Method OLS Probit OLS Probit OLS Probit OLS Probit OLS Probit
Table 5: Industry fixed effects at the CMAP 2 digit level included. Robust standard errors clustered at the CMAP 6 digit level.For the probit estimations the table reports marginal effects.
23

(1) (2) (3) (4) (5) (6) (7) (8) (9) (10)Just in Time Quality Control Total Quality Control Re-Organization Job Rotation
Competition 0.278 -0.657*** 0.352 -0.451 0.331 -0.499 0.156 -0.822*** 0.485** -0.322(0.221) (0.209) (0.281) (0.304) (0.359) (0.312) (0.274) (0.270) (0.238) (0.244)
Distance to US -0.046 0.012 -0.027 -0.073 -0.024 0.033 0.024 -0.023 -0.032 -0.015(0.035) (0.027) (0.050) (0.047) (0.053) (0.051) (0.046) (0.052) (0.032) (0.042)
Mexico City 0.008 -0.050* -0.049 -0.050 0.059 -0.007 -0.007 0.004 0.040 -0.098**(0.037) (0.026) (0.053) (0.044) (0.070) (0.049) (0.046) (0.043) (0.042) (0.038)
Age < 5 years 0.064 0.038 -0.045 -0.025 -0.013 0.003 -0.054 -0.004 0.002 -0.000(0.047) (0.056) (0.057) (0.081) (0.077) (0.085) (0.057) (0.075) (0.051) (0.071)
Age < 10 years 0.022 -0.038 -0.053 0.042 -0.102* -0.014 -0.002 0.010 0.009 -0.100**(0.038) (0.036) (0.046) (0.054) (0.059) (0.065) (0.049) (0.061) (0.043) (0.045)
Observations 838 766 642 608 472 479 604 532 775 654R-squared 0.024 0.028 0.039 0.019 0.036 0.025 0.043 0.039 0.023 0.028Productivity High Low High Low High Low High Low High Low
Table 6: Industry fixed effects at the CMAP 2 digit level included. Robust standard errors clustered at the CMAP 6 digit level.High indicates firms with labor productivity in 1998 above the sample median.
24
Mean Observed % explained by Comp Coeff Observed adoption Fraction explainedCompetion adoption by comp High LP for High LP by comp for High LP
Job Rotation 0.38 0.18 0.13 0.49 0.17 0.18Just in Time 0.16 0.14 0.07 0.28 0.14 0.12Qual. Control 0.25 0.25 0.06 0.35 0.24 0.09Total Quality Control 0.23 0.27 0.05 0.33 0.29 0.07Re-Organization 0.03 0.26 0.01 0.16 0.26 0.04
Table 7: Import competition and innovation: Economic magnitudes.
25

Foreign Exporting Importing Importing Skilled Profi-Owner Asia Labor tability
Competition -0.657 -0.564 -0.566 -0.594 -0.51 -0.587(<0.01) (<0.01) (<0.01) (<0.01) (0.017) (0.004)
Comp x Productivity 0.568 0.678 0.659 0.639 0.683 0.643(0.034) (0.011) (0.013) (0.018) (0.011) (0.017)
Comp x Foreign Owner 0.707(0.018)
Comp x Exporter 0.463(0.264)
Comp x Importer 0.053(0.815)
Comp x Importer (Asia) 0.418(0.174)
Comp x Skilled Lab Share -0.075(0.751)
Comp x Mark-up 0.12(0.579)
Productivity -0.033 -0.038 -0.043 -0.035 -0.04 -0.036(0.242) (0.158) (0.118) (0.212) (0.131) (0.182)
Alternative var, linear -0.039 0.027 0.031 -0.044 0.011 -0.014(0.163) (0.365) (0.191) (0.131) (0.65) (0.591)
R2 0.02 0.019 0.019 0.018 0.017 0.017
Table 8: Alternative sources of heterogeneity in innovation: Just in Time. Number of obser-vations: 1,429. Specifications also include constant and Mexico City indicator, distance to USborder, age and two-digit industry dummies. P-values based on robust and clustered standarderrors in parentheses.
26

Foreign Exporting Importing Importing Skilled Profi-Owner Asia Labor tability
Competition -0.707 -0.7 -0.689 -0.781 -0.967 -0.606(0.014) (0.015) (0.045) (0.008) (0.002) (0.054)
Comp x Productivity 0.731 0.748 0.76 0.716 0.582 0.82(0.035) (0.034) (0.028) (0.041) (0.083) (0.018)
Comp x Foreign Owner 0.084(0.831)
Comp x Exporter 0.11(0.88)
Comp x Importer -0.066(0.86)
Comp x Importer (Asia) 0.569(0.169)
Comp x Skilled Lab Share 0.763(0.049)
Comp x Mark-up -0.245(0.533)
Productivity -0.038 -0.041 -0.05 -0.039 -0.028 -0.04(0.229) (0.187) (0.126) (0.218) (0.39) (0.206)
Alt. variable, linear -0.021 0.013 0.054 -0.046 -0.066 -0.016(0.593) (0.825) (0.087) (0.251) (0.081) (0.687)
R2 0.032 0.032 0.035 0.033 0.036 0.034
Table 9: Alternative sources of heterogeneity: Re-Organization. Number of observations: 1,429.Specifications also include constant and Mexico City indicator, distance to US border, ageand two-digit industry dummies. P-values based on robust and clustered standard errors inparentheses.
27

Foreign Exporting Importing Importing Skilled Profita-Owner Asia Labor bility
Competition -0.521 -0.429 -0.555 -0.466 -0.451 -0.496(0.018) (0.04) (0.049) (0.037) (0.051) (0.027)
Comp x Productivity 0.722 0.858 0.857 0.82 0.807 0.779(0.01) (0.004) (0.003) (0.005) (0.006) (0.013)
Comp x Foreign Owner 0.869(0.017)
Comp x Exporter 0.845(0.119)
Comp x Importer 0.34(0.271)
Comp x Importer (Asia) 0.585(0.197)
Comp x Skilled Lab Share 0.256(0.337)
Comp x Mark-up 0.321(0.291)
Productivity -0.0743 -0.077 -0.083 -0.079 -0.079 -0.07(0.016) (0.011) (0.007) (0.009) (0.011) (0.024)
Alt. variable, linear -0.024 -0.061 0.007 -0.001 0.008 -0.037(0.464) (0.15) (0.816) (0.976) (0.767) (0.229)
R2 0.026 0.023 0.023 0.023 0.022 0.021
Table 10: Alternative Sources of Heterogeneity: Job Rotation. Number of observations: 1,429.Specifications also include constant and Mexico City indicator, distance to US border, ageand two-digit industry dummies. P-values based on robust and clustered standard errors inparentheses.
28
Sales Import Growth Skill growthgrowth from China
Competition 0.137 -0.489 -0.713(0.689) (0.071) (0.013)
Comp x Productivity 0.56 0.636 0.649(0.105) (0.077) (0.056)
Comp x Sales Growth -0.812(0.006)
Sales Growth 0.058(0.046)
Comp x Imports from China 1.286(0.039)
Imports from China -0.057(0.386)
Comp x Skill Lab Share Growth 0.702(0.045)
Skill Lab Share Growth -0.097(0.002)
R2 0.021 0.021 0.023
Table 11: Number of observations: 1,250. Specifications also include constant, labor produc-tivity, Mexico City indicator, distance to US border, age and two-digit industry dummies.P-values based on robust and clustered standard errors in parentheses. The outcome variableis quality control. Number of observations: 1,429. Specifications also include constant andMexico City indicator, distance to US border, age and two-digit industry dummies. P-valuesbased on robust and clustered standard errors in parentheses.
29

The Shock: China’s Rise in World Trade
0
0.01
0.02
0.03
0.04
0.05
0.06
0.07
1970
1971
1972
1973
1974
1975
1976
1977
1978
1979
1980
1981
1982
1983
1984
1985
1986
1987
1988
1989
1990
1991
1992
1993
1994
1995
1996
1997
1998
1999
2000
2001
2002
2003
2004
2005
2006
2007
Ch
ina'
s Sh
are
in W
orl
d T
rad
e (
Exp
ort
s +
Imp
ort
s)
Year
Figure 1: Chinese exports over time.
30

Figure 2: Productivity measured by labor productivity above (high) or below (low) samplemean. Bars indicate marginal mean effects and 90 percent confidence intervals for the compe-tition coefficient.
31

Figure 3: Productivity measured by labor productivity above (high) or below (low) mean.Bars indicate marginal mean effects and 90 percent confidence intervals for the competitioncoefficient.
32

Sales growth vs 1998 labor productivity
Figure 4: Labor productivity of plants and sales growth.
33