innovate to generate – making offshore wind a … · restricted © siemens ag 2014 all rights...
TRANSCRIPT

Restricted © Siemens AG 2014 All rights reserved. siemens.com/answers
Innovate to Generate –Making Offshore Wind a Truly Global Energy Source
Carbon Trust, 18 September, 2014

September 2014
Confidential © Siemens AG 2014 All rights reserved.
Page 2 Henrik Stiesdal
Siemens Wind Power Offshore Facts at a glance
Pioneered the offshore market and current market leader
Sold more than 2,250 WTGs for offshore application
Installed base: 1.700 turbines with ~5.500 MW capacity
More than 23 years of offshore experience
Proven 20+ year product lifetime with >95% real availability
Known for robust design with innovative solutions

September 2014
Confidential © Siemens AG 2014 All rights reserved.
Page 3 Henrik Stiesdal
Offshore project size developed with Siemens Wind Power from 5 MW to 630 MW in 22 years
5 MW
World‘s 1st
offshorewind power
plant1991
Vindeby40 MW
World‘s 1st
offshore wind power plant w/ MW turbines
2000
Middelgrunden166 MW
World‘s largestoffshore wind power plant in
operation2003
Nysted630 MW
World‘s largestoffshore wind power plant in
operation2013
London Array504 MW
World‘s largestoffshore wind power plant in
operation2012
Greater Gabbard
Pioneered offshore wind powerStabilized market during difficult days in 2004Industrialized turbine part of offshore wind power
Our performance

September 2014
Confidential © Siemens AG 2014 All rights reserved.
Page 4 Henrik Stiesdal
From an innovation point of view, Offshore wind has had a steep technology development
From 30 kW to 6 MWin 30 years
79.8 meters
30 kW450 kW
1980:11 meters
1991:35 meters
2012:154 meters
6 MW

September 2014
Confidential © Siemens AG 2014 All rights reserved.
Page 5 Henrik Stiesdal
The classical yardstick for cost is LCoE(Levelized Cost of Electricity)

September 2014
Confidential © Siemens AG 2014 All rights reserved.
Page 6 Henrik Stiesdal
The fundamental challenge – LCOE of Wind
0.01
0.10
1.00
1980 1985 1990 1995 2000 2005 2010 2015 2020 2025 2030
LEC
(EU
R /
kWh)
Year
2040
- 5% p.a.

September 2014
Confidential © Siemens AG 2014 All rights reserved.
Page 7 Henrik Stiesdal
SCOE: Society’s Cost of Electricity
Geopolitical impact
Economy & employment
System LCOE
Social impact
Variability costs
Transmission costs
(Hidden) subsidies
LCOE
The concept of SCOE –Society’s Cost of Electricity
True cost of electricity
Macro-economiccost of electricity
„Ex-works“ electricity price
Examples
• Reduced tax on fossil fuels, waste disposal, disaster costs
• Grid reinforcements needed for integration of energy source
• Fuel + OPEX + CAPEX + CO2
• Capacity payments to gas plants for providing backup
• Job creation and associated increase in economic value
• Decline of house prices around power plants & wind farms
• Hedging against fuel price risk for imported fuels
SCOE Elements

September 2014
Confidential © Siemens AG 2014 All rights reserved.
Page 8 Henrik Stiesdal
SCOE United Kingdom 2020
SCOE: Society's costs of electricity [EUR/MWh]Projection for United Kingdom in 2020 - Average Scenario
Nuclear Coal Gas Photovoltaics Wind On Wind Off
LCOE
- thereof CO2
Cost subsidies
Transmission
Variability
System costs
Social impact
Employment effects
Geopolitical impact
SCOEE W ST SCC / CWN / 2014-09-18 / Projection for United Kingdom in 2020 - Average Scenario
79,2
0,0
59,8
0,0
0,9
140,0
0,1
-28,5
0,0
111,7
105,0
48,3
2,5
0,0
0,5
108,0
0,1
-5,9
1,7
103,9
79,8
21,8
0,5
0,0
0,0
80,4
0,1
-0,2
4,9
85,2
105,2
0,0
0,0
6,6
15,2
127,0
0,0
-44,9
0,0
82,1
40,0
0,0
0,0
2,0
14,3
56,2
5,3
0,0
0,0
61,6
100,0
0,0
0,0
2,0
13,4
115,4
0,0
-46,3
0,0
69,0

September 2014
Confidential © Siemens AG 2014 All rights reserved.
Page 9 Henrik Stiesdal
The fundamental motivation for the development offuture offshore wind turbines is reduction of LCOE
Reduction of investmentWTG investmentBOP investment
Reduction of O&M CostIncrease of energy output

September 2014
Confidential © Siemens AG 2014 All rights reserved.
Page 10 Henrik Stiesdal
Offshore LCOE is about much more than the wind turbine
September 2014
Confidential © Siemens AG 2014 All rights reserved.
Page 11 Henrik Stiesdal
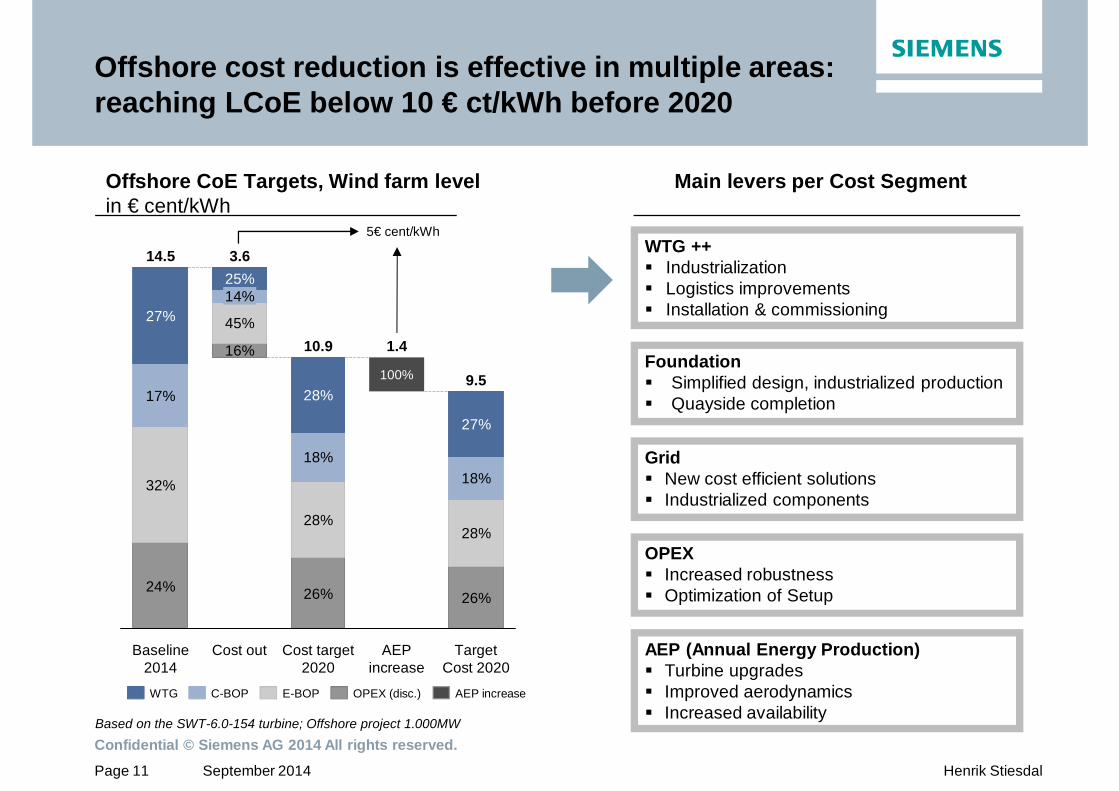
Offshore cost reduction is effective in multiple areas: reaching LCoE below 10 € ct/kWh before 2020
Offshore CoE Targets, Wind farm levelin € cent/kWh
Main levers per Cost Segment
5€ cent/kWh
Based on the SWT-6.0-154 turbine; Offshore project 1.000MW
WTG ++IndustrializationLogistics improvementsInstallation & commissioning
Target Cost 2020
9.5
26%
28%
18%
27%
AEP increase
1.4
100%
Cost target 2020
10.9
26%
28%
18%
28%
Cost out
3.6
16%
45%
14%25%
Baseline 2014
14.5
24%
32%
17%
27%
C-BOPWTG AEP increaseE-BOP OPEX (disc.)
Foundation Simplified design, industrialized productionQuayside completion
GridNew cost efficient solutionsIndustrialized components
OPEXIncreased robustnessOptimization of Setup
AEP (Annual Energy Production)Turbine upgradesImproved aerodynamicsIncreased availability

September 2014
Confidential © Siemens AG 2014 All rights reserved.
Page 12 Henrik Stiesdal
The baseline –The Siemens 6 MW turbine
Blade75 m, 25 t20,000 kNm moment (root)
HubØ4.5 m, 40 t
GeneratorØ6.5 m, 100 t, 6-11 rpm5,500 kNm torque
Bedplate3.5 x 3.5 x 4 m, 25 t
Power converter2 x 3 MW, AC–DC–AC
Transformer7 MVA, 690 / 33,000 V
Tower100 m, ø4 m / ø6 m, 300 t

September 2014
Confidential © Siemens AG 2014 All rights reserved.
Page 13 Henrik Stiesdal
Key factors in the cost development of theSiemens 6 MW turbine
Traditional measures remain key factors in thereduction of the total installed cost of the turbine
Classical Cost OutThe relentless pursuit of reduction in complexity, simplification of components, and better purchasing prices
InnovationThe application of new technologies on component level
Value-chain viewThe continuous improvement of the value-chain view, considering all measures in the view of the installed cost, focusing on the impact of improvements on the installation phase

September 2014
Confidential © Siemens AG 2014 All rights reserved.
Page 14 Henrik Stiesdal
Offshore cost reduction is effective in multiple areas: reaching LCoE below 10 € ct/kWh before 2020
Offshore CoE Targets, Wind farm levelin € cent/kWh
Main levers per Cost Segment
5€ cent/kWh
Based on the SWT-6.0-154 turbine; Offshore project 1.000MW
WTG ++IndustrializationLogistics improvementsInstallation & commissioning
Target Cost 2020
9.5
26%
28%
18%
27%
AEP increase
1.4
100%
Cost target 2020
10.9
26%
28%
18%
28%
Cost out
3.6
16%
45%
14%25%
Baseline 2014
14.5
24%
32%
17%
27%
C-BOPWTG AEP increaseE-BOP OPEX (disc.)
Foundation Simplified design, industrialized productionQuayside completion
GridNew cost efficient solutionsIndustrialized components
OPEXIncreased robustnessOptimization of Setup
AEP (Annual Energy Production)Turbine upgradesImproved aerodynamicsIncreased availability

September 2014
Confidential © Siemens AG 2014 All rights reserved.
Page 15 Henrik Stiesdal
Modular offshore foundation
Innovative TP design with focus on simplicity, material cost and functionality
1
4
5
6
Leg pipes from existing mass production facilities
3 Brace pipes in standard dimensions also from mass production facilities
Welded nodal joints produced in an automated production line
Bolted connections between nodes and pipes based on 35 years of in-house knowledge
2
Corrosion protection system
7 Suction buckets

September 2014
Confidential © Siemens AG 2014 All rights reserved.
Page 16 Henrik Stiesdal
LCoE reductions in real numbers!
Base case cost for an installed foundation: € 6,000,000
40% cost reduction: € 2,400,000
Target cost for the Siemens foundation: € 3,600,000
30m 55m
The cost target has proven to be realistic
The base case is a typical UK project:
Project Size: 600 MWLocation: UK East CoastDistance to port: 100 nmWTG’s: SWT-6.0-154Water depth: 50 m

September 2014
Confidential © Siemens AG 2014 All rights reserved.
Page 17 Henrik Stiesdal
Offshore cost reduction is effective in multiple areas: reaching LCoE below 10 € ct/kWh before 2020
Offshore CoE Targets, Wind farm levelin € cent/kWh
Main levers per Cost Segment
5€ cent/kWh
Based on the SWT-6.0-154 turbine; Offshore project 1.000MW
WTG ++IndustrializationLogistics improvementsInstallation & commissioning
Target Cost 2020
9.5
26%
28%
18%
27%
AEP increase
1.4
100%
Cost target 2020
10.9
26%
28%
18%
28%
Cost out
3.6
16%
45%
14%25%
Baseline 2014
14.5
24%
32%
17%
27%
C-BOPWTG AEP increaseE-BOP OPEX (disc.)
Foundation Simplified design, industrialized productionQuayside completion
GridNew cost efficient solutionsIndustrialized components
OPEXIncreased robustnessOptimization of Setup
AEP (Annual Energy Production)Turbine upgradesImproved aerodynamicsIncreased availability

September 2014
Confidential © Siemens AG 2014 All rights reserved.
Page 18 Henrik Stiesdal
Today’s infrastructure design is not long-term viable

September 2014
Confidential © Siemens AG 2014 All rights reserved.
Page 19 Henrik Stiesdal
The radical solution to the platform problem :No platform!
Measurement and protection
Turbine switch gear and distribution
Array switch gear
Cable hang-off
Complete AC Booster Turbine
Concept: Platform with 300MVA 220/66kV transformer
Transformer Deck

September 2014
Confidential © Siemens AG 2014 All rights reserved.
Page 20 Henrik Stiesdal
Basic 220kV version with back feed on 66kV level

September 2014
Confidential © Siemens AG 2014 All rights reserved.
Page 21 Henrik Stiesdal
Offshore cost reduction is effective in multiple areas: reaching LCoE below 10 € ct/kWh before 2020
Offshore CoE Targets, Wind farm levelin € cent/kWh
Main levers per Cost Segment
5€ cent/kWh
Based on the SWT-6.0-154 turbine; Offshore project 1.000MW
WTG ++IndustrializationLogistics improvementsInstallation & commissioning
Target Cost 2020
9.5
26%
28%
18%
27%
AEP increase
1.4
100%
Cost target 2020
10.9
26%
28%
18%
28%
Cost out
3.6
16%
45%
14%25%
Baseline 2014
14.5
24%
32%
17%
27%
C-BOPWTG AEP increaseE-BOP OPEX (disc.)
Foundation Simplified design, industrialized productionQuayside completion
GridNew cost efficient solutionsIndustrialized components
OPEXIncreased robustnessOptimization of Setup
AEP (Annual Energy Production)Turbine upgradesImproved aerodynamicsIncreased availability

September 2014
Confidential © Siemens AG 2014 All rights reserved.
Page 22 Henrik Stiesdal
The key levers for O&M:Robustness!
When reducing cost for offshore O&M,robustness is the key
RedundancySystem redundancy aiming at ensuring turbine operation
MonitoringSimple and efficient systems for continuous monitoring of system state and condition
AccessSafe access under demanding sea state conditions
Service intervalsLong intervals between service visits requiring use of heavy equipment

September 2014
Confidential © Siemens AG 2014 All rights reserved.
Page 23 Henrik Stiesdal
Offshore cost reduction is effective in multiple areas: reaching LCoE below 10 € ct/kWh before 2020
Offshore CoE Targets, Wind farm levelin € cent/kWh
Main levers per Cost Segment
5€ cent/kWh
Based on the SWT-6.0-154 turbine; Offshore project 1.000MW
WTG ++IndustrializationLogistics improvementsInstallation & commissioning
Target Cost 2020
9.5
26%
28%
18%
27%
AEP increase
1.4
100%
Cost target 2020
10.9
26%
28%
18%
28%
Cost out
3.6
16%
45%
14%25%
Baseline 2014
14.5
24%
32%
17%
27%
C-BOPWTG AEP increaseE-BOP OPEX (disc.)
Foundation Simplified design, industrialized productionQuayside completion
GridNew cost efficient solutionsIndustrialized components
OPEXIncreased robustnessOptimization of Setup
AEP (Annual Energy Production)Turbine upgradesImproved aerodynamicsIncreased availability

September 2014
Confidential © Siemens AG 2014 All rights reserved.
Page 24 Henrik Stiesdal
The key lever on the increase of AEP –Upgrades!
Upgrades have been a classical way forward toimprove competitiveness of wind turbines
The leading manufacturers have 30 years of experience in turbine upgrades …
22 30 kW95 120 kW450 600 kW1 MW 1.3 MW2 MW 2.3 MW3.6 MW 4.0 MW6.0 MW ..?
In round figures AEP increases by –6% at a 10% increase of rated power4% at a 10% increase of rotor area10% at a 10% increase of both

September 2014
Confidential © Siemens AG 2014 All rights reserved.
Page 25 Henrik Stiesdal
In 2020, wind turbines will look as today – but will be different …
OnshoreMain Data
Power rating: 2-4MWRotor: 100-150 mHub heights: 100-200 m
TechnologiesBlades with structural-aerodynamic coupling for passive load reductionHigh-stiffness fibers in blades (carbon, new fiber types)Direct drive transmissionCommoditized design, standard componentsAncillary services, fault robust with short-term storage
OffshoreMain Data
Power rating: 6-10MWRotor: 150-210 mHub heights: 80-140 m
TechnologiesBasics same as onshore technologiesTailored redundancy concepts for increased robustnessTwo-year service intervalsElectrical and civil infrastructure at 40% of today‘s costSimplified installation w/o piling

September 2014
Confidential © Siemens AG 2014 All rights reserved.
Page 26 Henrik Stiesdal
Changing the game once more …
An even larger turbine could offer significant benefits on Cost of Energy
Once turbine size has crossed the threshold necessitating use of offshore heavy lift equipment, increasing the turbine size does not materially increase the installation costs
Offshore infrastructure costs do not increase proportionally with turbine size.
Offshore maintenance costs do not increase proportionally with turbine size, at lease not when applying Direct Drive technology

September 2014
Confidential © Siemens AG 2014 All rights reserved.
Page 27 Henrik Stiesdal
Applying upscaling logic to 6 MW
The key parameters of Siemens’ next offshore turbine emerge from the upscaling logic
Direct Drive technology (same as 6 MW)
Same overall concept as earlier Direct Drive turbines – three blades, upwind, active yaw system
Same generator concept as in earlier Direct Drive turbines – outer rotor topology, permanent magnet excitation, segmented stator, LV winding (750 V rated voltage), redundant converter arrangement (separate power converters for subsets of segments)

September 2014
Confidential © Siemens AG 2014 All rights reserved.
Page 28 Henrik Stiesdal
Main data for 10 MW Siemens turbine
Hard dataRated power: 10 MWRotor diameter: 210 mTower height: 140 mBlade weight: 55 tonsGenerator weight: 200 tonsAnnual energy: 50,000 MWh
Soft dataAt 10 m/s wind speed, 420 tons of air will pass through rotor every secondOne 10 MW turbine will produce in five days what the first 30 kW turbine did in 35 years

September 2014
Confidential © Siemens AG 2014 All rights reserved.
Page 29 Henrik Stiesdal
Development of average LCOE trajectory withpresent measures and applicability to the market
0
2
4
6
8
10
12
14
16
2013 2014 2015 2016 2017 2018 2019 2020 2021
LCO
E, c
t/kW
h
Forecast 'Realistic'

September 2014
Confidential © Siemens AG 2014 All rights reserved.
Page 30 Henrik Stiesdal
The Carbon Trust OWA is an important vehicle for making this happen
Reducing O&M cost
Reducing Foundation
cost
Reducing Financing cost
NautiCraft WaveCraft Extreme OceanFjellstrand
UniversalKeystone Suction Bucket Jacket
FLIDAR Babcock Fuga Wake Campaign
Reducing Elec. System cost
66kV Cable qualification

September 2014
Confidential © Siemens AG 2014 All rights reserved.
Page 31 Henrik Stiesdal
New data on the competitive status of wind energy
Source: Danish Energy Agency (Energistyrelsen, "Elproduktionsomkostninger" )
Cost of Electricity – Danish Energy Agency Report (July 2014)

September 2014
Confidential © Siemens AG 2014 All rights reserved.
Page 32 Henrik Stiesdal
Recent data for wind production in Denmark
Wind Production relative to load
That is kind of cool!
Highest annual average33% (2013)
Highest three-month average55% (Dec.13 - Feb.14)
Highest monthly average:62% (January 2014)
Highest at individual wind turbine level89% (Siemens 2.3 MW, Frederikshavn)
Highest at wind farm level87% (Siemens 200 MW Horns Rev II project)
Single project contribution8% of DK load (Siemens 400 MW Anholt project)
Capacity factor

September 2014
Confidential © Siemens AG 2014 All rights reserved.
Page 33 Henrik Stiesdal
Share of wind in total energy consumption in Denmark
Source: Energinet.dk and Dansk Energi
41%
Feb
49%
Jan
62%
Dec
55%
Jul
23%
Jun
25%
May
25%
Apr
39%
Nov
36%
Oct
43%
Sep
29%
Aug
29%
Jul
22%
33%
Mar
37%
Feb
21%
Jan
29%
Jun
35%
May
26%
Apr
70%
60%
Mar Aug
43%
0%DecNovSep
50%
40%
30%
20%
10%
Oct
Share of wind 2014Share of wind 2013
Average 40%
Average 33%

September 2014
Confidential © Siemens AG 2014 All rights reserved.
Page 34 Henrik Stiesdal
A new world record!
Highest ever total wind productionIn August, 2014 Four Siemens SWT-2.3-82 turbines have each reached 100 million kWh
No other turbine in the world has reached this level. For the first time ever wind turbines need a 9-digit kWh meter
The four SWT 2.3-82 turbines are located at the Harboøre Tange in northwest Denmark. They were installed early 2003 and reached the 9-digit level after 11½ years of operation.
The turbine location is semi-offshore, with turbines located in shallow water on the shore side of a low strip of land facing the North Sea.

September 2014
Confidential © Siemens AG 2014 All rights reserved.
Page 35 Henrik Stiesdal
If the wind industry can manage to bring costs down to direct grid parity, the energy world may change
Comments
The “digital” thresholdsIf wind is more expensive than other energy sources, we serve only a politically driven part of the market.If we become competitive with other energy sources, we will serve the whole marketThis may completely change the energy world

September 2014
Confidential © Siemens AG 2014 All rights reserved.
Page 36 Henrik Stiesdal
Your moment of zen
SWT-6.0-154• The future offshore workhorse• Annual Energy Production 25
million kWh at an offshore site• 1000 pcs. 6 MW at an
offshore site have an AEP equal to the annual electricity consumption of Scotland
• Developed in Denmark and the UK
• To be manufactured in Hull, UK
That is kind of OK!

September 2014
Confidential © Siemens AG 2014 All rights reserved.
Page 37 Henrik Stiesdal
Can we do it?
Question:
Can the joint effort of industry and public funded research provide the basis for the required reductions in Cost of Energy?
Answer:
Why Not?

Restricted © Siemens AG 2014 All rights reserved. Answers for energy.
Thank you for your attention!