inner core attenuation anisotropy - stony brook...
TRANSCRIPT

tters 245 (2006) 581–594www.elsevier.com/locate/epsl
Earth and Planetary Science Le
Inner core attenuation anisotropy
Wen-che Yu ⁎, Lianxing Wen
Department of Geosciences, State University of New York at Stony Brook, NY 11794-2100, United States
Received 4 August 2005; received in revised form 24 March 2006; accepted 24 March 2006Available online 8 May 2006
Editor: S. King
Abstract
We investigate the attenuation structure of the Earth's inner core and its relationship to the velocity structure globally and alongvarious sampling directions, by studying the amplitude ratios and the differential travel times of the PKiKP–PKIKP and PKPbc–PKIKP phases. Our observations reveal that the amplitude ratios of these core phases, like the differential travel times, vary in bothsampling direction and geographic location, and the correlation is ubiquitous between small (large) PKIKP/PKiKP or PKIKP/PKPbc amplitude ratios and large (small) differential PKiKP–PKIKP or PKPbc–PKIKP travel times. These observations indicatethat the Earth's inner core is anisotropic in attenuation, and the direction of high (low) attenuation corresponds to that of high (low)velocity. Such anisotropic behaviors can be explained by different alignments of the hexagonal close-packed (hcp) iron crystalsunder the hypothesis that the hcp iron crystals are anisotropic in attenuation with their axis of high (low) attenuation correspondingto that of high (low) velocity.© 2006 Elsevier B.V. All rights reserved.
Keywords: Earth's inner core; anisotropy; attenuation structure; velocity structure; hexagonal close-packed iron
1. Introduction
It is well established that the compressional wave (Pwave) velocity in the Earth's inner core varies in bothdirection and geographic location [1–9]. These inferredseismic velocity structures of the inner core have played animportant role in understanding the mineral physics andgeodynamics of the inner core [10–18]. The attenuationstructure of the inner core is another important constraint inunderstanding the mineral physics and geodynamics of theinner core. It has been reported that the attenuation structureexhibits complex features [9,19–26] and that a correlation
⁎ Corresponding author. Tel.: +1 631 632 1790; fax: +1 631 6328240.
E-mail addresses: [email protected] (W. Yu),[email protected] (L. Wen).
0012-821X/$ - see front matter © 2006 Elsevier B.V. All rights reserved.doi:10.1016/j.epsl.2006.03.043
of high velocity with high attenuation exists in some partsof the inner core [9,22,25,27,28]. However, an overallattenuation structure and its relationship to the velocitystructure are not clear. Here, we investigate the attenuationstructure of the Earth's inner core and its relationship to thevelocity structure, by analyzing the amplitude ratios anddifferential travel times of the PKiKP–PKIKP andPKPbc–PKIKP phase pairs for the PKIKP waves sampling theinner core globally and along various directions.
2. Seismic data and coverage
Our data sets consist of amplitude ratios anddifferential travel times of the short-period PKiKP andPKIKP phases observed at the epicentral distance range of132°–141° and the PKPbc and PKIKP phases recorded atthe epicentral distance range of 147.5°–152.5°. PKIKP is

582 W. Yu, L. Wen / Earth and Planetary Science Letters 245 (2006) 581–594
the P wave transmitted through the inner core; PKiKP isthe P wave reflected off the inner core boundary (ICB);and PKPbc is the P wave propagating through the bottom
portion of the outer core (Fig. 1a). The amplitude ratios ofthe PKIKP/PKiKP and PKIKP/PKPbc phases are pri-marily sensitive to the attenuation structure of the inner

583W. Yu, L. Wen / Earth and Planetary Science Letters 245 (2006) 581–594
core, as the two phase pairs have similar ray paths in themantle (Fig. 1a), and there is little attenuation in the outercore. For the same reason, the differential travel times ofthe PKiKP–PKIKP and PKPbc–PKIKP phases areprimarily sensitive to the velocity structure of the innercore. The use of amplitude ratios and differential traveltimes of the same phase pair also ensures that theattenuation and velocity structures are inferred from thesame propagation path in the inner core. In this study, weonly use the PKiKP–PKIKP data recorded at the distancerange of 132°–141° and the PKPbc–PKIKP datarecorded at the distance range of 147.5°–152.5°, whichare sensitive to the seismic structures in the top 80 km and180–290 km of the inner core, respectively. At thedistances less than 132°, PKIKP and PKiKP phasesinterfere with each other, making simple picking ofamplitude and travel time implausible (see Fig. 3 of [9]).At the distances less than 147.5°, the differential traveltimes and amplitude ratios of the PKPbc–PKIKP phasesmay be affected by the interference of the PKPbc andPKPab phases at the caustic distances (see Fig. 4 of [29]).At the distances larger than 152.5°, the PKPbc wavesdiffract along the ICB, and the PKIKP/PKPbc amplituderatios would be affected by the seismic velocity structureat the bottom of the outer core.
Part of the seismic data is the collections from theprevious studies [6,8,9,30]. These waveforms are collect-ed from the recordings of the Global SeismographicNetwork (GSN) of the Incorporated Research Institutionsfor Seismology (IRIS) Consortium in the time period of1990–2001, GEOSCOPE, several regional seismic net-works in German Regional Seismic Network (GRSN),Grafenberg (GRF), FREESIA, the Brazilian LithosphericSeismic Project (BLSP), the Broadband Andean JointExperiment (BANJO), the Seismic Exploration DeepAndes (SEDA), and the Ocean Hemisphere Project(OHP). In this study, the new data sets are assembledfrom the Kyrgyzstan, the Kazakhstan, the CanadianNational Seismograph Network (CNSN), the BroadbandExperiment Across Alaskan Range (BEAAR), theAntarctic Microearthquake Project, and the AntarcticNetwork of Broadband Seismometers. Broadband seis-mograms are band-pass filtered with the World-WideStandard Seismograph Network (WWSSN) short-periodinstrument response, which has a dominant frequency of1 Hz (see examples of the broadband and short-period
Fig. 1. (a) PKP ray paths based on the Preliminary Reference Earth Model (PRPKIKP at 147°. (b, c) Map view of great-circle paths (light gray lines) and rayPKiKP–PKIKP phases (b) and the PKPbc–PKIKP phases (c). Equatorial andark gray broken lines, respectively. Stars and triangles indicate locations of ethe two hemispheres is marked, with the eastern hemisphere defined betweenand 40°E.
data in Fig. 2). Every seismogram is checked by eyes toensure its quality. We select our data based on the simpli-city of earthquake source and good signal-to-noise ratio.A total of 222 PKiKP–PKIKP and 254 PKPbc–PKIKPhigh quality phase pairs are selected from a collection ofmore than 16,000 seismograms. The selected seismic datahave good global coverage and sample along both polar(the paths that have an angle less than 35° between thePKIKP ray direction in the inner core turning point and theEarth's rotation axis) and equatorial (the paths that have anangle greater than 35° between the PKIKP ray direction inthe inner core turning point and the Earth's rotation axis)paths. Top portion of the inner core is well sampled alongequatorial paths, but relatively poorly sampled along polarpaths (Fig. 1b, c). The sampling along polar paths ismainly restricted by the fact that both earthquakes andseismographs must be at high latitudes. Our polar data arecollected from events occurring in the South SandwichIslands, theMacquarie Ridge, and the New Zealand in theSouthern Hemisphere, and the Kurile Island, the Kam-chatka, Alaska, and the Russia in the Northern Hemi-sphere. The amplitude ratios and differential travel timesare measured based on the relative magnitudes and timeseparations between the maximum amplitudes of thephase pairs. The travel time measurement is proved to becomparable to that determined from the waveform cross-correlation and the difference in travel time measurementbetween the two methods is less than 0.05 s. Thedifferential travel time residuals are obtained from theobserved differential travel times relative to the predictedones on the basis of the Preliminary Reference EarthModel (PREM) [31]. The observed amplitude ratios arecorrected for the radiation patterns of the earthquakesources, although the effect is very small due to the similartake-off angles of the phase pairs.
3. Seismic observations and models
Our observed differential travel time residuals exhibitvariations in both sampling direction and geographiclocation, consistent with previous results [1–9]. Thedifferential travel time residuals are, in general, larger forthe PKIKP waves sampling along polar paths than forthose along equatorial paths, and the magnitudes of thispolar–equatorial difference are different between the“eastern” and “western” hemispheres (Fig. 3a, c and
EM) [31]: PKiKP, PKIKP at an epicentral distance of 141° and PKPbc,segments of the PKIKP phases sampling the inner core for the observedd polar ray segments in the inner core are indicated by black solid andarthquakes and seismic stations, respectively. The geographic region of40°E and 180°E and the western hemisphere defined between 180°W

584 W. Yu, L. Wen / Earth and Planetary Science Letters 245 (2006) 581–594
examples of waveforms in Fig. 2). The “easternhemisphere” is defined for which the PKIKP ray segmentin the inner core is within 40°E–180°E; and the “westernhemisphere” is defined for which the PKIKP ray segment
in the inner core is within 180°W–40°E. In the followingtext, the “eastern” and “western” hemispheres are referredto the regions we define. Note that, the differential traveltime residuals of the PKPbc–PKIKP phases along polar

585W. Yu, L. Wen / Earth and Planetary Science Letters 245 (2006) 581–594
paths (blue solid triangles, Fig. 3c) are about 3–4 s largerthan those along equatorial paths (black open triangles,Fig. 3c) for the PKIKP waves sampling the westernhemisphere (see also examples of waveforms in Fig. 2g,h). The observed PKiKP–PKIKP differential travel timeresiduals exhibit regional variations in polar–equatorialdifference for the PKIKP waves sampling the westernhemisphere. In a localized region beneath Africa, thedifferential travel time residuals along polar paths (bluesolid triangles, Fig. 3a) are about 0.7–1.2 s larger thanthose along equatorial paths (black open triangles, Fig. 3a;see also examples of waveforms in Fig. 2c, d), while, inmost regions of the western hemisphere (the middleAtlantic Ocean, Central America, the Caribbean Sea), thedifferential travel time residuals do not show noticeablepolar–equatorial differences (green solid and black opentriangles for the polar and equatorial data, respectively,Fig. 3a). The polar–equatorial difference in differentialtravel time residuals for the PKIKP waves sampling theeastern hemisphere is non-existent at distances less than150° (red and black solid circles for the polar andequatorial data in Fig. 3a, c; see also examples of PKiKP–PKIKP waveforms in Fig. 2a, b and PKPbc–PKIKPwaveforms in Fig. 2e, f). Along equatorial paths, thePKiKP–PKIKP and PKPbc–PKIKP differential traveltime residuals also exhibit east–west hemispheric differ-ences. The differential travel time residuals for the PKIKPwaves sampling the eastern hemisphere (black solidcircles, Fig. 3a, c) are about 0.7 s larger than for thosesampling the western hemisphere (black open triangles,Fig. 3a, c; see also examples of PKiKP–PKIKP wave-forms in Fig. 2a, c and PKPbc–PKIKP waveforms inFig. 2e, g).
The observed differential travel time residuals reflectvelocity variations in the inner core. Large (small) dif-ferential travel time residuals would indicate high (low)velocities in the inner core. The velocity models E1 andW2, appropriate for explaining the seismic datasampling the eastern and western hemispheres alongequatorial paths, respectively, have been resolved fromthe joint modeling of the PKiKP–PKIKP waveformsand the PKPbc–PKIKP differential travel time residuals[9,29,30] (see gray line labeled as E1 and black solid
Fig. 2. Examples of the broadband (left panel) and band-pass filtered short-perare shown in (a–d) and the PKIKP and PKPbc phases are shown in (e–h). Fwith different sampling directions and geographic locations, are selected. Evdirection (for example, EAST (equ) is the PKIKP ray sampling the easternrelative to the Earth's rotation axis (ξ), epicentral distance (Δ), and event depfrom deconvolving the broadband raw data with the instrument response,convolving with the WWSSN short-period instrument response with a domiPKiKP (PKPbc) phases are marked by the black and gray bars, respectively. Nwide-angle reflection of the PKiKP phase.
line labeled as W2 in Fig. 3a, c for predictions). Readersare referred to these papers for the detailed discussions.E1 (for the eastern hemisphere) has PREM velocity inthe bottom of the outer core and a coupled small velocitygradient in the top 235 km, followed by a steeptransition in the depth range of 235–375 km below theICB; W2 (for the western hemisphere) has a lowvelocity gradient OW in the bottom of the outer core anda coupled steep velocity gradient in the top of the innercore (see Fig. 6 of [29] and Fig. 6a of [30] for thevelocity structures of E1 and W2). OW has reducedvelocities relative to PREM linearly decreasing from 0%at 200 km above the ICB to −0.35% at the ICB [29]. E1velocity is about 1% higher than W2 in the top 200 kmof the inner core. Along polar paths in the easternhemisphere, because the observed differential traveltime residuals exhibit no difference from those samplingequatorial paths until at a distance of about 150°, thedifferential travel time residuals can be, to the first order,explained by E1 (see gray line labeled as E1 in Fig. 3a, cfor predictions). In other words, there is no velocityanisotropy in the top 200 km of the inner core in theeastern hemisphere, consistent with the results in theprevious studies [8]. Along polar paths in most regionsof the western hemisphere where the PKiKP–PKIKPdifferential travel time residuals do not exhibit polar–equatorial differences, the differential travel timeresiduals can be explained by W2 (see black solid linelabeled as W2 in Fig. 3a for predictions). This indicatesno velocity anisotropy in the top 80 km of the inner corein most regions of the western hemisphere, consistentwith previous results [2,4,7]. In a localized regionbeneath Africa and in the deeper part of the inner corebeneath the western hemisphere, the polar differentialtravel time residuals can be explained by an anisotropyvelocity model W2A (see black dotted line labeled asW2A in Fig. 3a, c for predictions). W2A has anincreasing magnitude of velocity anisotropy relative toW2 from 1.3% at the ICB to 2.8% at 280 km below theICB. Such increase of anisotropy with depth is requiredby the seismic data. Note that models with uniformanisotropy cannot explain both the PKiKP–PKIKP andPKPbc–PKIKP differential travel time residuals. While
iod vertical displacements (right panel). The PKIKP and PKiKP phasesor comparison, the data recorded at approximately same distances, butent date, event location–seismic station, PKIKP sampling region andhemisphere of the inner core along equatorial path), PKIKP ray angleth (evdp) are labeled in the right panel. Short-period data are obtainedband-pass filtering in the frequency range of 0.005 Hz–4 Hz, andnant frequency of 1 Hz. The maximum amplitudes of the PKIKP andote that the polarity of PKiKP is opposite to that of PKIKP, due to the

586 W. Yu, L. Wen / Earth and Planetary Science Letters 245 (2006) 581–594
a uniform anisotropy of 1.3% can generally explain thePKiKP–PKIKP data, it underestimates the PKPbc–PKIKP differential travel time residuals (see black
Fig. 3. (a) Observed PKiKP–PKIKP and (c) PKPbc–PKIKP differential trav(Δ), along with the predicted differential travel time residuals based on E1 (gwith velocities being 1.3% and 2.8% higher than W2 (black dotted lines labelhas a linearly increasing velocity structure relative to W2 from 1.3% at the IC(d) PKIKP/PKPbc amplitude ratios as a function of epicentral distance (Δ),models of the inner core and their associated coupled outer core–inner core(E1) is predicted based on a model with a Q value of 300 and the velocity mosolid triangles represent the PKiKP–PKIKP data along polar paths samplingAmerica, the Caribbean Sea) of the western hemisphere (a, b). Predicted amplthe PKIKP and PKiKP phases (b) or PKPbc phases (d) of the synthetic wcorrections are made so that the differential travel time residuals and amplit200 km. Accordingly, the predicted differential travel time residuals and am
dotted line labeled as 1.3% in Fig. 3a, c for predictions).On the other hand, while a uniform anisotropy of 2.8%predicts generally well the PKPbc–PKIKP data, it over-
el time residuals relative to PREM as a function of epicentral distanceray line), W2 (black solid line), W2A (black dotted line), and modelsed as 1.3% and 2.8%). E1 is about 1% higher than W2 [9,29,30]. W2AB to 2.8% at 280 km below the ICB. (b) Observed PKIKP/PKiKP andalong with the predicted amplitude ratios based on several attenuationvelocity models labeled as Q value (velocity model) (for example, 300del E1). The meaning of the symbol is shown in the inset. Blue (green)a localized region beneath Africa (the middle Atlantic Ocean, Centralitude ratios are obtained from handpicking the maximum amplitudes ofaveforms, calculated using the generalized ray theory [32]. Distanceude ratios are plotted at the distances equivalent to a source depth ofplitude ratios are computed based on a source depth of 200 km.

Fig. 3 (continued).
587W. Yu, L. Wen / Earth and Planetary Science Letters 245 (2006) 581–594
predicts the PKiKP–PKIKP differential travel timeresiduals (see black dotted line labeled as 2.8% in Fig.3a, c for predictions).
The observed amplitude ratios exhibit variationsstrongly resembling those of differential travel time resi-duals in both the sampling direction and geographiclocation. Small (large) amplitude ratios are observed forthe data exhibiting large (small) differential travel timeresiduals (Fig. 3 and examples of waveforms in Fig. 2).Along polar paths in the western hemisphere, where theobserved differential travel time residuals of the PKiKP–PKIKP and PKPbc–PKIKP phases are much larger thanthose along equatorial paths (blue solid and black opentriangles, Fig. 3a, c), the observed amplitude ratios aremuch smaller than those along equatorial paths (samesymbols, Fig. 3b, d; see also examples of the equatorial
and polar PKiKP–PKIKPwaveforms in Fig. 2c, d and theequatorial and polar PKPbc–PKIKP waveforms in Fig.2g, h). For the region in the western hemisphere where thepolar–equatorial difference in PKiKP–PKIKP differen-tial travel time residual is non-existent (green solid andblack open triangles, Fig. 3a), the PKIKP/PKiKP amp-litude ratios do not show noticeable polar–equatorialdifference either (same symbols, Fig. 3b). Along polarpaths in the eastern hemisphere, where the differentialtravel time residuals are similar to those along equatorialpaths (red and black solid circles, Fig. 3a, c), theamplitude ratios are indistinguishable between equatorialand polar paths (same symbols, Fig. 3b, d; see alsoexamples of the equatorial and polar PKiKP–PKIKPwaveforms in Fig. 2a, b and the equatorial and polarPKPbc–PKIKP waveforms in Fig. 2e, f). Along

588 W. Yu, L. Wen / Earth and Planetary Science Letters 245 (2006) 581–594
equatorial paths in the eastern hemisphere, where thedifferential travel time residuals (black solid circles, Fig.3a, c) are about 0.7 s larger than those in the westernhemisphere (black open triangles, Fig. 3a, c), theamplitude ratios are on average smaller than thoseobserved in the western hemisphere (same symbols,Fig. 3b, d; see also examples of the equatorial PKiKP–PKIKP waveforms sampling the eastern and westernhemispheres in Fig. 2a, c and the equatorial PKPbc–PKIKP waveforms sampling the eastern and westernhemispheres in Fig. 2e, g).
The PKIKP/PKiKP and PKIKP/PKPbc amplituderatios are primarily sensitive to the attenuation structureof the inner core. Smaller amplitude ratios wouldindicate smaller amplitudes of the PKIKP phases, andthus higher attenuation in the part of the inner core theysample. The above observations indicate that the innercore is anisotropic in attenuation, with the direction ofhigh attenuation corresponding to that of high velocity.Attenuation is usually represented by quality factor Q,which is defined as fractional loss of energy per cycle ofwave oscillation as seismic waves travel through themedium. Attenuation structures in the inner core can bederived from fitting the observed amplitude ratios of thePKIKP/PKiKP and PKIKP/PKPbc phases. Because thePKiKP and PKIKP amplitudes are sensitive to the velo-city structure in the bottom of the outer core and the topof the inner core, our Q values are inferred based on theassociated velocity models that well explain the PKiKP–PKIKP waveforms and the PKPbc–PKIKP differentialtravel time residuals for the PKIKP waves samplingdifferent directions and different regions of the innercore. Predicted amplitude ratios are obtained from thehandpicked the maximum amplitudes of the PKIKP andPKiKP (PKPbc) phases of the synthetic waveforms,calculated using the generalized ray theory method [32].In this study, we adopt simple uniform Q values to fitboth data sets. Because the seismic observations havebeen filtered with the WWSSN short-period instrumentresponse, our inferred attenuation structures are appro-priate at about 1 Hz, the dominant frequency of the
Fig. 4. (a, b, c, d) Average observed differential travel time residuals of the PKthe PKIKP/PKiKP (b) and PKIKP/PKPbc (d) phases sampling the eastern hethe best-fitting velocity and attenuation model and models perturbed from thPKiKP–PKIKP and PKPbc–PKIKP phases sampling the western hemispheralong equatorial and polar paths, respectively. Black solid lines and grayattenuation model and models perturbed from the best-fitting model, respectfitting velocity model with the percent perturbation of velocity. For instance,−0.1% lower than E1. Prediction of the perturbed attenuation model is labele250 (E1) represents the predicted amplitude ratios based on aQ value of 250 abased onQ values decreasing from 5000 at the ICB to 100 at 80 km below theof the averages with data points being greater than 1 are plotted.
instrument response. The attenuation structures for theeastern and western hemispheres along equatorial pathsare derived and discussed elsewhere [9,30]. The atte-nuation structure for the eastern hemisphere has anaverageQ value of 300 in the top 300 km and an averageQ value of 600 in the deeper part of the inner core; theattenuation structure for the western hemisphere has anaverage Q value of 600 in the top 400 km of the innercore (Fig. 6b of [30]). Because the observed amplituderatios of the PKIKP/PKiKP phases and the PKIKP/PKPbc phases at the distance range of 147.5°–152.5° donot require a depth-dependent attenuation structure forthe eastern hemisphere, we adopt a uniform Q value of300 for the eastern hemisphere. A Q value of 300 (seegray line labeled as 300 (E1) in Fig. 3b, d for predictions)can explain the amplitude ratios along both equatorialand polar paths for the PKIKP waves sampling theeastern hemisphere (black and red solid circles, Fig. 3b,d). A Q value of 600 (see black solid line labeled as 600(W2) in Fig. 3b, d for predictions) can account for theamplitude ratios along equatorial paths for the PKIKPwaves sampling the western hemisphere (black opentriangles, Fig. 3b, d) and the PKIKP/PKiKP amplituderatios along polar paths for the PKIKP waves samplingmost regions of the western hemisphere (the middleAtlantic Ocean, Central America, the Caribbean Sea)(green solid triangles, Fig. 3b). A Q value of about 200–250 (see black dotted lines labeled as 200 (W2A) and250 (W2A) in Fig. 3b, d for predictions) can explain thePKIKP/PKiKP amplitude ratios along polar paths for thePKIKP waves sampling the region beneath Africa (bluesolid triangles, Fig. 3b) and the PKIKP/PKPbc amplituderatios along polar paths for the PKIKP waves samplingthe western hemisphere (blue solid triangles, Fig. 3d).
Averages and standard deviations of the observationscan be used to estimate the uncertainties of the velocityand attenuation models. Along equatorial paths, mostaverages and standard deviations of the observeddifferential time residuals are within the predictions of±0.1% velocity perturbations from the best-fittingvelocity models E1, W2 (Fig. 4a, c, e, g), indicating the
iKP–PKIKP (a) and PKPbc–PKIKP (c) phases and amplitude ratios ofmisphere, along with the standard deviations and predictions based one best-fitting model. Panels (e, f, g, h) similar to (a, b, c, d) but for thee. Solid and open symbols represent the averages of the data samplingdotted lines represent the predictions of the best-fitting velocity andively. Prediction of the perturbed velocity model is labeled as the best-E1−0.1% stands for the predictions based on a model with velocitiesd as Q value (the associated best-fitting velocity model). For instance,nd an associated velocity model E1. (f) Prediction of 5000–100 (W2) isICB and an associated velocity model W2. Only the standard deviations

589W. Yu, L. Wen / Earth and Planetary Science Letters 245 (2006) 581–594

590 W. Yu, L. Wen / Earth and Planetary Science Letters 245 (2006) 581–594
level of heterogeneity in isotropic velocity structure islow within each of the hemispheres. Along polar paths inthe western hemisphere, averages and standard devia-tions of the observed differential time residuals constrainthe uncertainties of the velocity model to be within−0.2% to +0.5% of W2A (Fig. 4e, g), suggesting com-plex anisotropic velocity structures. In the eastern hemis-phere, averages and standard deviations of the observedamplitude ratios are within the predictions of Q valuesbetween 250 and 400 (Fig. 4b, d). Along equatorial pathsin the western hemisphere, averages and standard de-viations of the observed PKIKP/PKPbc amplitude ratiosare within the predictions of Q values between 450 and700, while averages and standard deviations of theobserved PKIKP/PKiKP amplitude ratios are far deviat-ed from the predictions of Q values within a range of600–3000 (Fig. 4f). An attenuation structure similar tothe model proposed by Cao and Romanowicz [26],having Q values decreasing from 5000 at the ICB to 100at 80 km below the ICB, could explain the trend of theaverage PKIKP/PKiKP observations (Fig. 4f). However,such an attenuation structure would under-predict thePKIKP/PKPbc amplitude ratios at larger distances.Along polar paths in the western hemisphere, most ave-rages and standard deviations of the observed ampli-tude ratios constrain the Q value to be about 200–250(Fig. 4f, h).
In other words, in the regions of the western he-misphere that exhibit anisotropy, the attenuation ani-sotropy can be represented by a Q value of about 200–250 along polar paths and an average Q value of 600along equatorial paths. This attenuation anisotropycorresponds to a polar–equatorial velocity anisotropywith the polar paths being 1.3%–2.8% higher than theequatorial paths. Along equatorial paths, the attenuationstructure has an east–west hemispheric variation withan averageQ value of 300 in the eastern hemisphere andan average Q value of 600 in the western hemisphere.Such a hemispheric variation in attenuation corre-sponds to a hemispheric difference in velocity with thevelocity in the eastern hemisphere being about 1%higher than that in the western hemisphere.
4. Discussions
4.1. Mantle effect
The above observations can unlikely be explained bythe seismic heterogeneities near the core–mantle boundary(CMB). The Fresnel zone of these core phases is about150 km at the CMB for the P waves we use with adominant frequency of 1 Hz. For the PKiKP–PKIKP
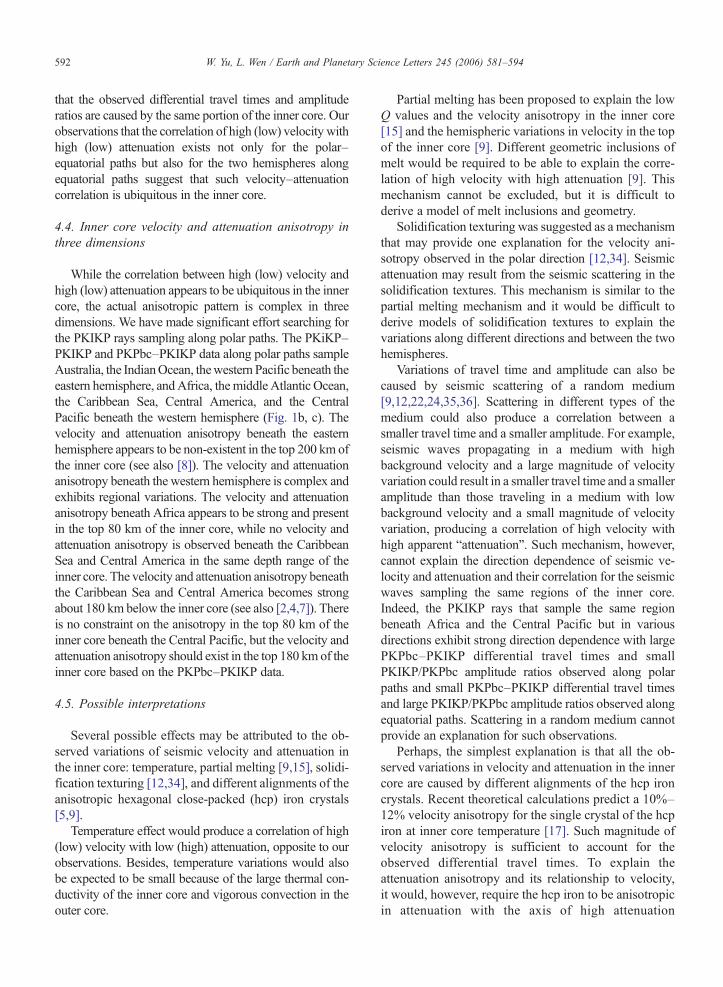
phases, the separations between two ray paths are about50 km at the CMB, and the Fresnel zones of these twophases overlap (Fig. 5a). For the PKPbc–PKIKP phases,the separations between two ray paths at the CMB areabout 300 km, about double the size of the Fresnel zone(Fig. 5b). It is difficult to correct for the mantle effects assmall-scale heterogeneities are not well known. It would,however, be contrived that small-scale seismic hetero-geneities at the CMB would preferentially affect onebranch of these core phase pairs in one particular region orin one particular sampling direction in a hemispheric scale.In fact, dense observations would allow us to exclude thepossibility that the signals observed in the PKPbc–PKIKPdata are originated from theCMB.Note that, in the regionssampled by dense observations, the Fresnel zones of thePKIKP and PKPbc phases overlap at the CMB (Fig. 5b).Seismic heterogeneities at theCMBwould affect the traveltimes and amplitudes of the PKIKP and PKPbc phases inthe same way, and thus cannot provide an explanation forthe observed differential travel times and amplitude ratios.The consistency between the observed PKiKP–PKIKPand PKPbc–PKIKP data provides another line of evidencethat amplitude ratios and differential travel times of thesecore phase pairs mainly reflect the signals originated fromthe seismic structures in the inner core.
4.2. Effect of velocity anisotropy on PKIKP amplitudes
The PKIKP amplitudes would also be affected by thewave propagation in a medium with velocity anisotropy.The velocity anisotropy would distort the wave front, andthus produce focusing or defocusing of wave energyalong the wave propagation. Such effects, however, maybe small for a small magnitude of velocity anisotropy[33]. To the first order, we have ignored such effects inderiving our attenuation models of the inner core. Furtherstudies on the effect of velocity anisotropy for these corephases are warranted, however.
4.3. Comparisons with previous studies
Inner core attenuation anisotropy and the velocity–attenuation relationship were studied by several previousstudies [23,25,27,28]. These studies were based on theanalyses of the differential travel times and amplitude ratiosof the PKPbc–PKIKP phases [25,27,28] or inversion forthe PKIKP waveforms [23]. Overall, our observedequatorial–polar difference of the PKPbc–PKIKP differ-ential travel times and the PKIKP/PKPbc amplitude ratiosis consistent with the results in the previous studies (see, forexample, Fig. 3 of [27] and Fig. 8 of [28]). Compared to theprevious studies, our study has included the PKiKP–
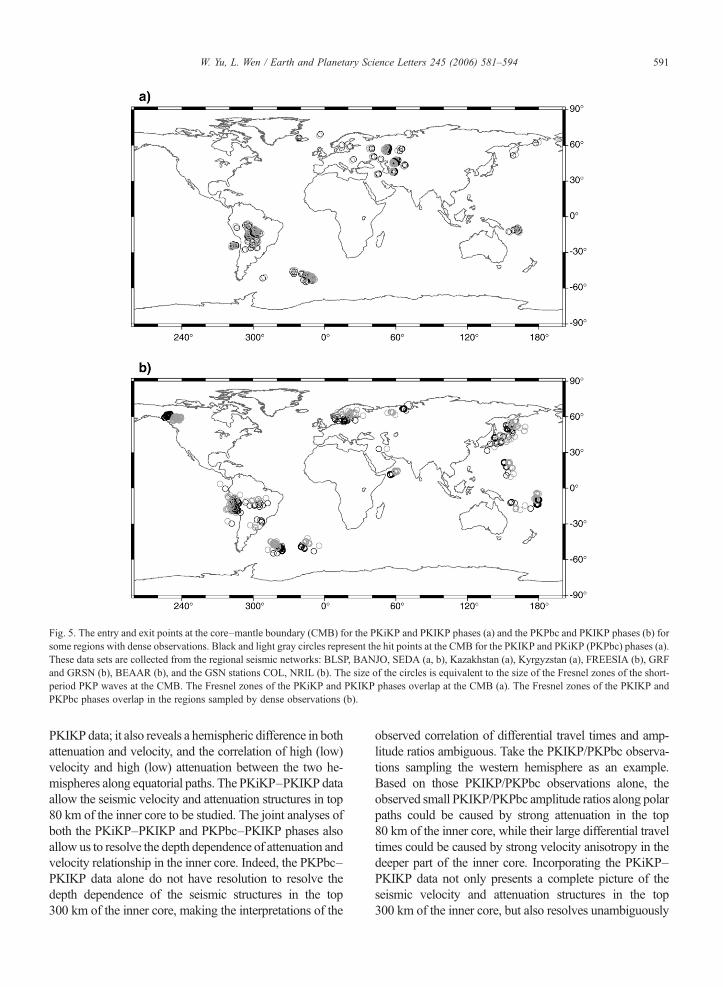
Fig. 5. The entry and exit points at the core–mantle boundary (CMB) for the PKiKP and PKIKP phases (a) and the PKPbc and PKIKP phases (b) forsome regions with dense observations. Black and light gray circles represent the hit points at the CMB for the PKIKP and PKiKP (PKPbc) phases (a).These data sets are collected from the regional seismic networks: BLSP, BANJO, SEDA (a, b), Kazakhstan (a), Kyrgyzstan (a), FREESIA (b), GRFand GRSN (b), BEAAR (b), and the GSN stations COL, NRIL (b). The size of the circles is equivalent to the size of the Fresnel zones of the short-period PKP waves at the CMB. The Fresnel zones of the PKiKP and PKIKP phases overlap at the CMB (a). The Fresnel zones of the PKIKP andPKPbc phases overlap in the regions sampled by dense observations (b).
591W. Yu, L. Wen / Earth and Planetary Science Letters 245 (2006) 581–594
PKIKP data; it also reveals a hemispheric difference in bothattenuation and velocity, and the correlation of high (low)velocity and high (low) attenuation between the two he-mispheres along equatorial paths. The PKiKP–PKIKP dataallow the seismic velocity and attenuation structures in top80 km of the inner core to be studied. The joint analyses ofboth the PKiKP–PKIKP and PKPbc–PKIKP phases alsoallow us to resolve the depth dependence of attenuation andvelocity relationship in the inner core. Indeed, the PKPbc–PKIKP data alone do not have resolution to resolve thedepth dependence of the seismic structures in the top300 km of the inner core, making the interpretations of the
observed correlation of differential travel times and amp-litude ratios ambiguous. Take the PKIKP/PKPbc observa-tions sampling the western hemisphere as an example.Based on those PKIKP/PKPbc observations alone, theobserved small PKIKP/PKPbc amplitude ratios along polarpaths could be caused by strong attenuation in the top80 km of the inner core, while their large differential traveltimes could be caused by strong velocity anisotropy in thedeeper part of the inner core. Incorporating the PKiKP–PKIKP data not only presents a complete picture of theseismic velocity and attenuation structures in the top300 km of the inner core, but also resolves unambiguously
592 W. Yu, L. Wen / Earth and Planetary Science Letters 245 (2006) 581–594
that the observed differential travel times and amplituderatios are caused by the same portion of the inner core. Ourobservations that the correlation of high (low) velocity withhigh (low) attenuation exists not only for the polar–equatorial paths but also for the two hemispheres alongequatorial paths suggest that such velocity–attenuationcorrelation is ubiquitous in the inner core.
4.4. Inner core velocity and attenuation anisotropy inthree dimensions
While the correlation between high (low) velocity andhigh (low) attenuation appears to be ubiquitous in the innercore, the actual anisotropic pattern is complex in threedimensions. We have made significant effort searching forthe PKIKP rays sampling along polar paths. The PKiKP–PKIKP and PKPbc–PKIKP data along polar paths sampleAustralia, the IndianOcean, thewestern Pacific beneath theeastern hemisphere, andAfrica, themiddle Atlantic Ocean,the Caribbean Sea, Central America, and the CentralPacific beneath the western hemisphere (Fig. 1b, c). Thevelocity and attenuation anisotropy beneath the easternhemisphere appears to be non-existent in the top 200 km ofthe inner core (see also [8]). The velocity and attenuationanisotropy beneath the western hemisphere is complex andexhibits regional variations. The velocity and attenuationanisotropy beneath Africa appears to be strong and presentin the top 80 km of the inner core, while no velocity andattenuation anisotropy is observed beneath the CaribbeanSea and Central America in the same depth range of theinner core. The velocity and attenuation anisotropy beneaththe Caribbean Sea and Central America becomes strongabout 180 km below the inner core (see also [2,4,7]). Thereis no constraint on the anisotropy in the top 80 km of theinner core beneath the Central Pacific, but the velocity andattenuation anisotropy should exist in the top 180 km of theinner core based on the PKPbc–PKIKP data.
4.5. Possible interpretations
Several possible effects may be attributed to the ob-served variations of seismic velocity and attenuation inthe inner core: temperature, partial melting [9,15], solidi-fication texturing [12,34], and different alignments of theanisotropic hexagonal close-packed (hcp) iron crystals[5,9].
Temperature effect would produce a correlation of high(low) velocity with low (high) attenuation, opposite to ourobservations. Besides, temperature variations would alsobe expected to be small because of the large thermal con-ductivity of the inner core and vigorous convection in theouter core.
Partial melting has been proposed to explain the lowQ values and the velocity anisotropy in the inner core[15] and the hemispheric variations in velocity in the topof the inner core [9]. Different geometric inclusions ofmelt would be required to be able to explain the corre-lation of high velocity with high attenuation [9]. Thismechanism cannot be excluded, but it is difficult toderive a model of melt inclusions and geometry.
Solidification texturing was suggested as a mechanismthat may provide one explanation for the velocity ani-sotropy observed in the polar direction [12,34]. Seismicattenuation may result from the seismic scattering in thesolidification textures. This mechanism is similar to thepartial melting mechanism and it would be difficult toderive models of solidification textures to explain thevariations along different directions and between the twohemispheres.
Variations of travel time and amplitude can also becaused by seismic scattering of a random medium[9,12,22,24,35,36]. Scattering in different types of themedium could also produce a correlation between asmaller travel time and a smaller amplitude. For example,seismic waves propagating in a medium with highbackground velocity and a large magnitude of velocityvariation could result in a smaller travel time and a smalleramplitude than those traveling in a medium with lowbackground velocity and a small magnitude of velocityvariation, producing a correlation of high velocity withhigh apparent “attenuation”. Such mechanism, however,cannot explain the direction dependence of seismic ve-locity and attenuation and their correlation for the seismicwaves sampling the same regions of the inner core.Indeed, the PKIKP rays that sample the same regionbeneath Africa and the Central Pacific but in variousdirections exhibit strong direction dependence with largePKPbc–PKIKP differential travel times and smallPKIKP/PKPbc amplitude ratios observed along polarpaths and small PKPbc–PKIKP differential travel timesand large PKIKP/PKPbc amplitude ratios observed alongequatorial paths. Scattering in a random medium cannotprovide an explanation for such observations.
Perhaps, the simplest explanation is that all the ob-served variations in velocity and attenuation in the innercore are caused by different alignments of the hcp ironcrystals. Recent theoretical calculations predict a 10%–12% velocity anisotropy for the single crystal of the hcpiron at inner core temperature [17]. Such magnitude ofvelocity anisotropy is sufficient to account for theobserved differential travel times. To explain theattenuation anisotropy and its relationship to velocity,it would, however, require the hcp iron to be anisotropicin attenuation with the axis of high attenuation
593W. Yu, L. Wen / Earth and Planetary Science Letters 245 (2006) 581–594
corresponding to that of high velocity. Such hypothesisof attenuation anisotropy in hcp iron crystal remains tobe confirmed by either laboratory experiments or theore-tical calculations, and the physical mechanisms that maybe responsible for these different alignments betweenthe eastern and western hemispheres and between thepolar and equatorial directions remain to be explored.
5. Conclusions
We have investigated the attenuation structure of theEarth's inner core and its relationship to the velocitystructure globally and along various sampling directions,by studying the amplitude ratios and differential traveltimes of the PKiKP–PKIKP and PKPbc–PKIKP phases.Our observations reveal that the amplitude ratios of thesecore phases, like the differential travel times, vary in bothsampling direction and geographic location, and thecorrelation is ubiquitous between small (large) PKIKP/PKiKP or PKIKP/PKPbc amplitude ratios and large(small) differential PKiKP–PKIKP or PKPbc–PKIKPtravel times. These observations indicate that the Earth'sinner core is anisotropic in attenuation, and the directionof high (low) attenuation corresponds to that of high (low)velocity. In the regions of the western hemisphere of theinner core that exhibit anisotropy, the attenuationanisotropy can be represented by a Q value of about200–250 along polar paths and an averageQ value of 600along equatorial paths. This attenuation anisotropycorresponds to a polar–equatorial velocity anisotropywith the polar paths being 1.3%–2.8% higher than theequatorial paths. Along equatorial paths, the attenuationstructures of the inner core have east–west hemisphericvariations with an average Q value of 300 in the easternhemisphere and an average Q value of 600 in the westernhemisphere. Such hemispheric variations in attenuationcorrespond to hemispheric differences in velocity with thevelocity in the eastern hemisphere being about 1% fasterthan that in the western hemisphere. The above observa-tions can be explained by different alignments of thehexagonal close-packed (hcp) iron crystals under thehypothesis that the hcp iron crystals are anisotropic inattenuation with their axis of high (low) attenuationcorresponding to that of high (low) velocity.
Acknowledgements
We are grateful to the IRIS-DMC, GEOSCOPE,GRF, GRSN, FREESIA, CNSN, OHP, BLSP, SEDA,BANJO, Kazakhstan, Kyrgyzstan, and various PASS-CAL seismic experiments for making the high-qualityseismic data available. We thank Fenglin Niu for sharing
the data collection and review. Critical reviews fromAnnie Souriau, Vernon Cormier, Paul Richards, ananonymous reviewer, and the Editor Scott King improvethe presentation of the manuscript. This work is sup-ported by an NSF grant EAR #0207746.
References
[1] K.C. Creager, Anisotropy of the inner core from differentialtravel times of the phases PKP and PKIKP, Nature 356 (1992)309–314.
[2] X. Song, D.V. Helmberger, Depth dependence of anisotropy ofEarth's inner core, J. Geophys. Res. 100 (1995) 9805–9816.
[3] S. Tanaka, H. Hamaguchi, Degree one heterogeneity andhemispherical variation of anisotropy in the inner core from PKP(BC)–PKP(DF) times, J. Geophys. Res. 102 (1997) 2925–2938.
[4] X. Song, D.V. Helmberger, Seismic evidence for an inner coretransition zone, Science 282 (1998) 924–927.
[5] K.C. Creager, Large-scale variations in inner core anisotropy,J. Geophys. Res. 104 (1999) 23127–23139.
[6] F. Niu, L. Wen, Hemispherical variations in seismic velocity atthe top of the Earth's inner core, Nature 410 (2001) 1081–1084.
[7] A. Ouzounis, K.C. Creager, Isotropy overlying anisotropy at thetop of the inner core, Geophys. Res. Lett. 28 (2001) 4331–4334.
[8] F. Niu, L. Wen, Seismic anisotropy in the top 400 km of the innercore beneath the “eastern” hemisphere, Geophys. Res. Lett. 29(12) (2002) doi:10.1029/2001GL014118.
[9] L. Wen, F. Niu, Seismic velocity and attenuation structures in thetop of the Earth's inner core, J. Geophys. Res. 107 (B11) (2002)2273 doi:10.1029/2001JB000170.
[10] L. Stixrude, R.E. Cohen, High-pressure elasticity of ironand anisotropy of Earth's inner core, Science 267 (1995)1972–1975.
[11] S. Yoshida, I. Sumita, M. Kumazawa, Growth model of the innercore coupled with the outer core dynamics and the resultingelastic anisotropy, J. Geophys. Res. 101 (1996) 28085–28103.
[12] M.I. Bergman, Measurements of elastic anisotropy due tosolidification texturing and the implications for the Earth'sinner core, Nature 389 (1997) 60–63.
[13] H.-K.Mao, et al., Elasticity and rheology of iron above 220GPa andthe nature of the Earth's inner core, Nature 396 (1998) 741–743.
[14] S.-I. Karato, Seismic anisotropy of the Earth's inner core inducedby Maxwell stresses, Nature 402 (1999) 871–873.
[15] S.C. Singh, M.A.J. Taylor, J.P. Montagner, On the presence ofliquid in Earth's inner core, Science 287 (2000) 2471–2474.
[16] H.-R. Wenk, S. Matthies, R.J. Hemley, H.-K. Mao, J. Shu, Theplastic deformation of iron at pressures of the Earth's inner core,Nature 405 (2000) 1044–1047.
[17] G. Steinle-Neumann, L. Stixrude, R.E. Cohen, O. Gulseren,Elasticity of iron at the temperature of the Earth's inner core,Nature 413 (2001) 57–60.
[18] B.A. Buffett, H.-R. Wenk, Texturing of the Earth's inner core byMaxwell stresses, Nature 413 (2001) 60–63.
[19] V.F. Cormier, Short-period PKP phases and the anelastic mechan-ism of the inner core, Phys. Earth Planet. Inter. 24 (1981) 291–301.
[20] A. Souriau, P. Roudil, Attenuation in the uppermost inner corefrom broad-band GEOSCOPE PKP data, Geophys. J. Int. 123(1995) 572–587.
[21] X. Song, D.V. Helmberger, A P-wave velocity model of Earth'score, J. Geophys. Res. 100 (1995) 9817–9830.

594 W. Yu, L. Wen / Earth and Planetary Science Letters 245 (2006) 581–594
[22] V.F. Cormier, X. Li, G.L. Choy, Seismic attenuation of the innercore: viscoelastic or stratigraphic? Geophys. Res. Lett. 25 (1998)4019–4022.
[23] X. Li, V.F. Cormier, Frequency-dependent seismic attenuation inthe inner core: 1. A viscoelastic interpretation, J. Geophys. Res.107 (B12) (2002) 2361 doi:10.1029/2002JB001795.
[24] V.F. Cormier, X. Li, Frequency-dependent seismic attenuation inthe inner core: 2. A scattering and fabric interpretation, J. Geophys.Res. 107 (B12) (2002) 2362 doi:10.1029/2002JB001796.
[25] S.I. Oreshin, L.P. Vinnik, Heterogeneity and anisotropy ofseismic attenuation in the inner core, Geophys. Res. Lett. 31(2004) L02613 doi:10.1029/2003GL018591.
[26] A. Cao, B. Romanowicz, Hemispherical transition of seismicattenuation at the top of the Earth's inner core, Earth Planet. Sci.Lett. 228 (2004) 243–253.
[27] A. Souriau, B. Romanowicz, Anisotropy in inner core attenua-tion: a new type of data to constrain the nature of the solid core,Geophys. Res. Lett. 23 (1996) 1–4.
[28] A. Souriau, B. Romanowicz, Anisotropy in the inner core:relation between P-velocity and attenuation, Phys. Earth Planet.Inter. 101 (1997) 33–47.
[29] W. Yu, L. Wen, F. Niu, Seismic velocity structure in the Earth'souter core, J. Geophys. Res. 110 (2005) B02302 doi:10.1029/2003JB002928.
[30] W. Yu, L. Wen, Seismic velocity and attenuation structures in thetop 400 km of the Earth's inner core along equatorial paths,J. Geophys. Res. (submitted for publication).
[31] A.M. Dziewonski, D.L. Anderson, Preliminary Reference EarthModel, Phys. Earth Planet. Inter. 25 (1981) 297–356.
[32] D.V. Helmberger, Theory and application of synthetic seismo-grams, in: H. Kanamori (Ed.), Earthquakes: Observation, Theoryand Interpretation, Soc. Italiana di Fisica, Bologna, Italy, 1983,pp. 173–222.
[33] P. Samec, J.P. Blangy, Viscoelastic attenuation, anisotropy, andAVO, Geophysics 57 (1992) 441–450.
[34] M.I. Bergman, Estimates of the Earth's inner core grain size,Geophys. Res. Lett. 25 (1998) 1593–1596.
[35] K. Aki, Scattering of P waves under Montana Lasa, J. Geophys.Res. 78 (1973) 1334–1346.
[36] K. Aki, P.G. Richards, Quantitative Seismology: Theory andMethods, W. H. Freeman, New York, 1980.