initial results from the experimental measurement … of maryland baltimore county, baltimore, md...
TRANSCRIPT
INITIAL RESULTS FROM THE EXPERIMENTAL MEASUREMENT CAMPAIGN (XMC)
FOR PLANETARY BOUNDARY LAYER (PBL) INSTRUMENT ASSESSMENT (XPIA)
EXPERIMENT
W.A. Brewer1, A. Choukulkar
2, S. Sandberg
1, A. Weickmann
2, J Lundquist
3, V. Iungo
4, R. Newsom
5, R. Delgado
6
1Chemical Sciences Division, National Oceanic and Atmospheric Administration, Boulder, CO
2Cooperative Institute for Research in Environmental Sciences, Boulder, CO
3University of Colorado, Boulder, CO
4University of Texas at Dallas, Dallas, TX
5Pacific Northwest National Laboratory, Richland, WA
5University of Maryland Baltimore County, Baltimore, MD
ABSTRACT
The Experimental Measurement Campaign
(XMC) for Planetary Boundary Layer (PBL)
Instrument Assessment (XPIA) is a DOE funded
study to develop and validate methods of making
three dimensional measurements of wind fields.
These techniques are of interest to study wind
farm inflows and wake flows using remote
sensing instrumentation. The portion of the
experiment described in this presentation utilizes
observations from multiple Doppler wind lidars,
soundings, and an instrumented 300m tower, the
Boulder Atmospheric Observatory (BAO) in Erie,
Colorado.
1. INTRODUCTION
Knowledge of the time evolving, three
dimensional wind field is essential in developing
and evaluating large eddy simulation (LES)
models, the study of turbine wake effects, and
optimization of turbine layout for wind farms.
A network of scanning, pulsed, Doppler wind
lidars can be used to measure the wind speed over
a common volume or along a common vertical
line (virtual towers (Calhoun, 2006)). These
observations, projected onto multiple line-of-site
(LOS) look angles, are combined to estimate the
three dimensional wind field.
The goal of this study was to develop an
understanding of the trade-off between:
(1) Synchronous vs asynchronous observations,
(2) The spatial resolution of the common
observational points within the measurement
volume vs the temporal update rate of entire
volume
(3) To optimize the geometric layout of the
observational network given maximum range of
the lidars, the rate at which the measurements are
made, the size of the measurement volume, and
the need to have sufficiently large relative look
angles to maintain precision in the 3-D wind
retrieval.
Utilizing a network of commercially available,
low-pulse-energy, high-pulse-repetition frequency
(PRF), Doppler wind lidars, the Experimental
Measurement Campaign (XMC) for Planetary
Boundary Layer (PBL) Instrument Assessment
(XPIA) Experiment was conducted at the Boulder
Atmospheric Observatory (BAO) from March 3rd
– May 1st 2015. It was funded by the Department
of Energy (DOE) and was designed to develop
and evaluate methods for making three
dimensional measurements of the wind field using
remote sensing techniques.
2. METHODOLOGY
The XPIA study was conducted at the NOAA
BAO, the site of a 300m meteorological tower
outfitted with a set of three-axis sonic
anemometers positioned on the NW and SE sides
of the tower, every 50m in height. The portion of
the study described in this presentation consisted
of eight Doppler wind lidars: five commercial
scanning units (either Leosphere 200S or Halo
DOI: 10.1051/09004 (2016)I
11911, 1190LRC 27
EPJ Web of Conferences epjconf/2016 9004
© The Authors, published by EDP Sciences. This is an open access article distributed under the terms of the Creative Commons Attribution License 4.0 (http://creativecommons.org/licenses/by/4.0/).
Photonics Streamline), one scanning research
system (NOAA High Resolution Doppler Lidar -
HRDL), and two vertically profiling systems
(Leosphere V1).
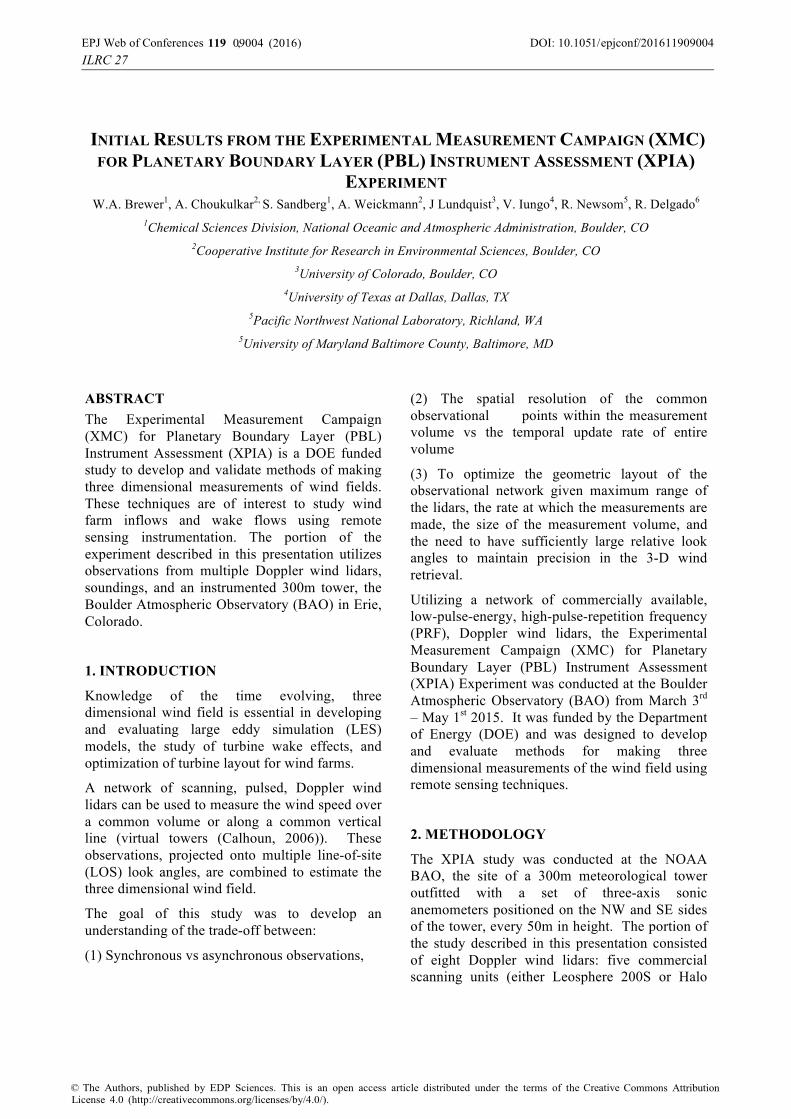
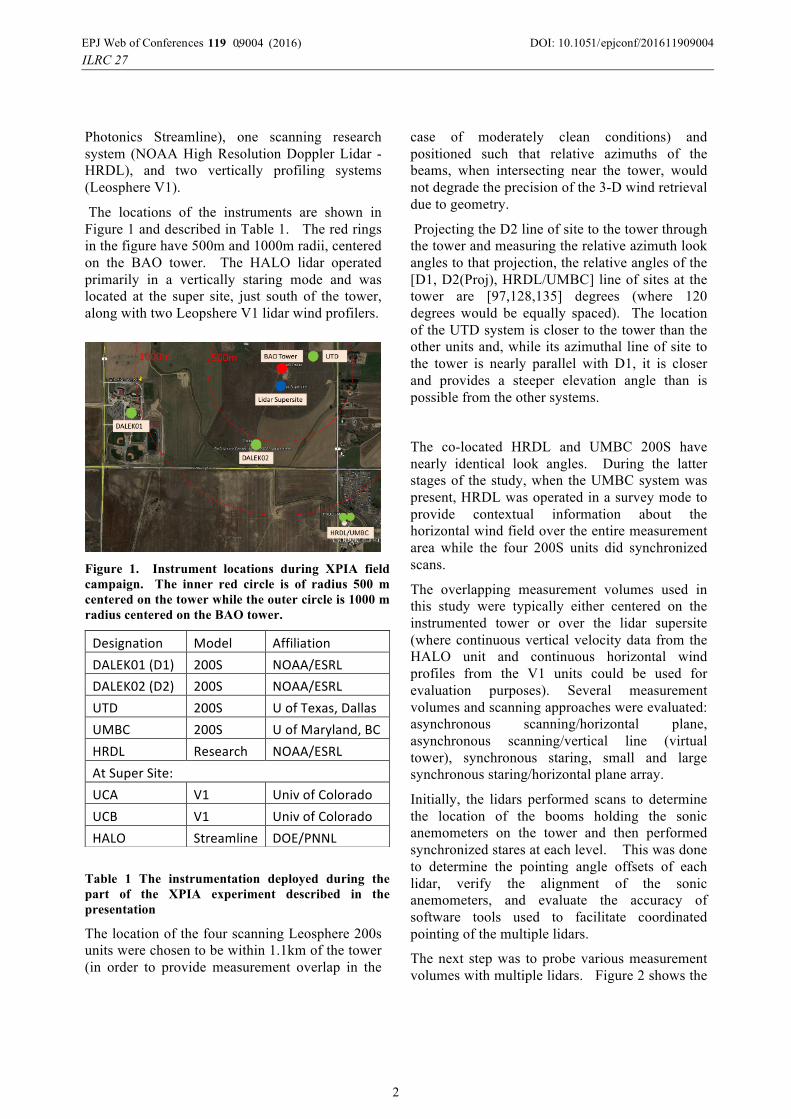
The locations of the instruments are shown in
Figure 1 and described in Table 1. The red rings
in the figure have 500m and 1000m radii, centered
on the BAO tower. The HALO lidar operated
primarily in a vertically staring mode and was
located at the super site, just south of the tower,
along with two Leopshere V1 lidar wind profilers.
The location of the four scanning Leosphere 200s
units were chosen to be within 1.1km of the tower
(in order to provide measurement overlap in the
case of moderately clean conditions) and
positioned such that relative azimuths of the
beams, when intersecting near the tower, would
not degrade the precision of the 3-D wind retrieval
due to geometry.
Projecting the D2 line of site to the tower through
the tower and measuring the relative azimuth look
angles to that projection, the relative angles of the
[D1, D2(Proj), HRDL/UMBC] line of sites at the
tower are [97,128,135] degrees (where 120
degrees would be equally spaced). The location
of the UTD system is closer to the tower than the
other units and, while its azimuthal line of site to
the tower is nearly parallel with D1, it is closer
and provides a steeper elevation angle than is
possible from the other systems.
The co-located HRDL and UMBC 200S have
nearly identical look angles. During the latter
stages of the study, when the UMBC system was
present, HRDL was operated in a survey mode to
provide contextual information about the
horizontal wind field over the entire measurement
area while the four 200S units did synchronized
scans.
The overlapping measurement volumes used in
this study were typically either centered on the
instrumented tower or over the lidar supersite
(where continuous vertical velocity data from the
HALO unit and continuous horizontal wind
profiles from the V1 units could be used for
evaluation purposes). Several measurement
volumes and scanning approaches were evaluated:
asynchronous scanning/horizontal plane,
asynchronous scanning/vertical line (virtual
tower), synchronous staring, small and large
synchronous staring/horizontal plane array.
Initially, the lidars performed scans to determine
the location of the booms holding the sonic
anemometers on the tower and then performed
synchronized stares at each level. This was done
to determine the pointing angle offsets of each
lidar, verify the alignment of the sonic
anemometers, and evaluate the accuracy of
software tools used to facilitate coordinated
pointing of the multiple lidars.
The next step was to probe various measurement
volumes with multiple lidars. Figure 2 shows the
Figure 1. Instrument locations during XPIA field
campaign. The inner red circle is of radius 500 m
centered on the tower while the outer circle is 1000 m
radius centered on the BAO tower.
Designation Model Affiliation
DALEK01(D1) 200S NOAA/ESRL
DALEK02(D2) 200S NOAA/ESRL
UTD 200S UofTexas,Dallas
UMBC 200S UofMaryland,BC
HRDL Research NOAA/ESRL
AtSuperSite:
UCA V1 UnivofColorado
UCB V1 UnivofColorado
HALO Streamline DOE/PNNL
Table 1 The instrumentation deployed during the
part of the XPIA experiment described in the
presentation
DOI: 10.1051/09004 (2016)I
11911, 1190LRC 27
EPJ Web of Conferences epjconf/2016 9004
2

simulated measurement density and scan
geometry required to cover a plane extending +/-
100m horizontally around the tower at a height of
100m. The data are gridded into 30mx30m cells
extending from 90m-110m vertically. The D2
unit, at a range of 600m, requires a 5 elevation
plane azimuthal sector scan to completely fill the
measurement volume (top plot). The lower plot
shows the combined measurement count for three
lidars (D1, D2, HRDL), asynchronously scanning,
with a pattern repeat time of 1.4 minutes. Several
versions of this pattern that were designed to
either minimize the pattern repeat period or
maximize the horizontal resolution were
attempted. The lidars also performed a set of
asynchronous elevation (RHI) scans that were
designed to intersect (virtual towers) over the
tower and the supersite. This pattern was
repeated for several days through a range of
atmospheric conditions.
Two sets of horizontal-plane, synchronized stares
were designed to probe a 3x3 or 4x4
measurement grid at a height of 100m. The
smaller 3x3 grid extended roughly 200m on a
side and the larger 4x4 grid extended 1800m.
The lidar scans were programmed to allow
roughly 10 seconds dwell at each location and an
attempt was made to keep the pattern repeat time
shorter than 2 minutes.
In order to study the effect of the geometry of the
look angles on the 3 dimensional fit (especially
the vertical component). A series of 10 minute
synchronous stares were programmed to have all
four 200S units staring above the super site at a
range of increasing altitudes (and elevation
angles) over a period of several days. During
these scans, the HRDL lidar performed a set of
two plane azimuthal sector scans designed to
provide contextual information on the horizontal
wind field.
3. RESULTS
At the time of the submission of this abstract, the
XPIA study is still underway. Significant effort
has gone into developing tools to aid in multiple
lidar coordinated scan design and
implementation. Programing scans on different
manufacturer’s scanner control software (or
different versions of the same software) so that
they remain synchronous has proven to be
challenging and techniques to do this have been
developed. The pointing accuracy and stability of
the commercial lidar systems have been
evaluated. Preliminary results from the
operations described in this abstract will be
presented.
ACKNOWLEDGEMENT
The authors would like to thank Jim Wilczak and
Daniel Wolfe (Physical Sciences Division,
NOAA) for their assistance in the experimental
Figure 2. Simulated scan geometry required to cover
a horizontal plane centered at the tower extending +/-
100m horizontally at a height of 100m AGL. The top
plot shows that it takes 5 sweeps to provide coverage
from D2. The bottom plot shows the combined
number of measurements from three systems (D1, D2,
HRDL) in each 30mx30m grid cell between the
heights of 90 and 110m AGL.
DOI: 10.1051/09004 (2016)I
11911, 1190LRC 27
EPJ Web of Conferences epjconf/2016 9004
3
design and deployment of the lidars at the BAO
facility. We thank the Lefthand water district and
Erie High School for allowing us to place lidars
on their property. In addition the authors would
like to acknowledge financial support from DOE
and NOAA.
REFERENCES
[1] R Calhoun, R Heap, M Princevac, R Newsom,
H Fernando, D Ligon (2006): Virtual towers using
coherent Doppler lidar during the Joint Urban
2003 dispersion experiment. Journal of Applied
meteorology and climatology 45 (8), 1116-1126
DOI: 10.1051/09004 (2016)I
11911, 1190LRC 27
EPJ Web of Conferences epjconf/2016 9004
4