information management specialization in geographic
TRANSCRIPT

Determinants of information and communication
technologies for the online citizen participation
adoption in urban contexts
Mijail Juanovich Naranjo Zolotov, MSc
A thesis submitted in partial fulfillment of the requirements
for the degree of Doctor in Information Management
August 2018
NOVA Information Management School (IMS)
Universidade Nova de Lisboa
Information Management
Specialization in Geographic Information
Systems
Joint Doctorate in Geoinformatics: Enabling Open Cities
II | P a g e
Determinants of information and communication
technologies for the online citizen participation
adoption in urban contexts
Supervised by:
Professor Doctor Tiago André Gonçalves Félix de Oliveira
Co-supervised by:
Professor Doctor Christian Kray
Professor Doctor Sven Casteleyn
2018

III | P a g e
Copyright © by
Mijail Juanovich Naranjo Zolotov
All rights reserved
IV | P a g e
Abstract
The electronic citizen participation (e-participation) is considered a branch of e-government
with a focus on citizen involvement in information, consultation, and decision-making processes
along with local governments. E-participation is considered an important pillar to support an
inclusive and participative democracy. Governments all around the world, mainly local
governments, are implementing different e-participation tools, for instance, online participatory
budgeting, e-petitions, online incident reporting systems, online forums, etc. The potential
benefits for the society of citizens engagement in the use of e-participation is widely agreed in
the literature. However, the drivers of the e-participation adoption by the citizens are still on an
exploratory stage in existing research. The understanding of the e-participation adoption factors
is of a crucial importance for defining governmental strategies that pursue the citizen
participatory engagement.
This thesis contributes to a better understanding of the determinants of e-participation
adoption in the urban contexts at individual level. The dissertation first carries out a review of
the existing literature following a quantitative approach. Second, we developed three research
models grounded in theories as unified theory of acceptance and use of technology (UTAUT),
psychological empowerment, social capital, and sense of virtual community. Each model was
evaluated in a cross-sectional experiment in two Portuguese cities that have implemented e-
participation tools. The analysis of each model and its results are analysed in detail in each of
the sections of this dissertation. And finally, we propose two lines for future research, one
focused on the citizens satisfaction with e-participation, and the other explores the inclusion of
components from social geography. Furthermore, the findings from this dissertation also
provide insights for local governments that implement e-participation tools.
The literature review of sixty quantitative studies published from the year 2000 to year
2017 revealed that the factors with stronger effect on the intention to use e-participation were
the perceived usefulness, attitude, trust, trust in government, effort expectancy, and social
influence. However, the most of these studies used a single theory of information systems to
investigate e-participation, which may not uncover specific factors of the e-participation
phenomenon. Moreover, the success of e-participation tools relies on the continuous usage over
time. Understanding solely the drivers of intention to use in the short time does not guarantee
the success in the long-term adoption.

V | P a g e
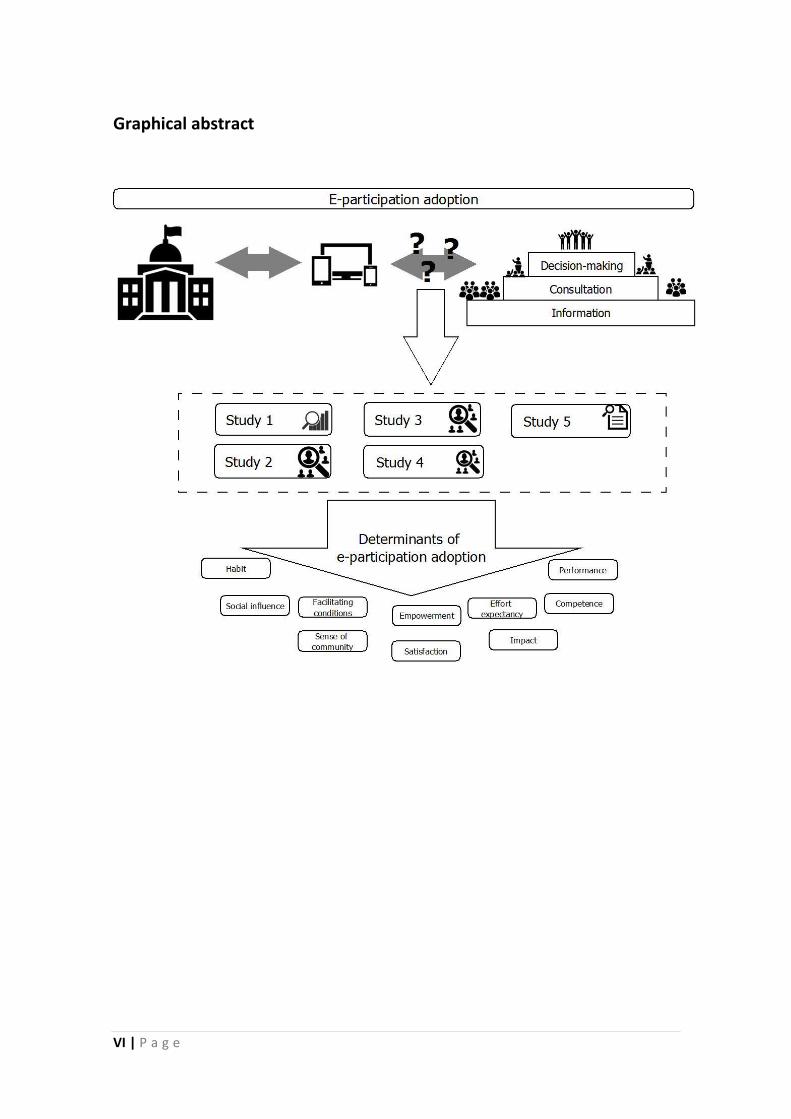
From the three research models presented in this dissertation, the first model focus on
the study of the intention to use, usage, and intention to recommend e-participation. The last
two focus on the continued intention to use e-participation. The first study develops a model
that integrates the psychological empowerment, as second-order construct, and UTAUT to
explain the intention to use and intention to recommend e-participation. We found that
performance expectancy and empowerment were the stronger motivators of intention to use,
and empowerment was the stronger driver for the citizens recommend the e-participation
technologies. The second study evaluates the effect of each of the dimensions of empowerment
plus habit on the continued intention to use e-participation. Results show that competence,
meaning, and habit have a significant effect on the continuous intention. Multigroup analysis in
this study revealed that the use of e-participation has stronger meaning for older participants.
The third cross-sectional study integrates the sense of virtual community theory with constructs
of UTAUT that have a direct effect on the usage behaviour, namely facilitating conditions and
habit. We found that habit is a good predictor of use behaviour and continued intention,
nevertheless, sense of virtual community resulted a good predictor of e-participation usage in
the short term, but not significant on the continued intention to use over time.
Keywords: E-participation, E-government, PLS-SEM, UTAUT, Social capital, Empowerment,
Sense of virtual community.
VI | P a g e
Graphical abstract

VII | P a g e
Publications
Journal articles
Naranjo Zolotov, M., Oliveira, T., & Casteleyn, S. (2018). E-participation adoption models
research in the last 17 years: A weight and meta-analytical review. Computers in Human
Behavior, 81, 350–365. http://doi.org/10.1016/j.chb.2017.12.031
Naranjo-Zolotov, M., Oliveira, T., & Casteleyn, S. (2018). Citizens’ intention to use and
recommend e-participation: Drawing upon UTAUT and citizen empowerment. Information
Technology & People. Accepted for publication. (Awarded as the Best Research Paper in
the conference)
Naranjo-Zolotov, M., Oliveira, T., & Casteleyn, S. (2018). Continuous usage of e-participation in
the long term: The role of the sense of virtual community. (Submitted to a top journal in
the area of information systems).
Acedo, A.; Oliveira, T.; Naranjo-Zolotov, M.; Painho, M. Place and city: Towards a geography of
engagement. (Submitted to a top journal in the area of Geographical Information Science)
Conference papers (Scopus indexed)
Zolotov, M. N., Oliveira, T., & Casteleyn, S. (2018). Continued intention to use online
participatory budgeting: The effect of empowerment and habit. Proceedings of the 11th
International Conference on Theory and Practice of Electronic Governance - ICEGOV ’18,
209–216. http://doi.org/10.1145/3209415.3209461
Zolotov M.N., Oliveira T., Cruz-Jesus F., Martins J. (2018) Satisfaction with e-participation: A
Model from the Citizen’s Perspective, Expectations, and Affective Ties to the Place. In:
Rocha Á., Adeli H., Reis L.P., Costanzo S. (eds) Trends and Advances in Information
Systems and Technologies. WorldCIST'18 2018. Advances in Intelligent Systems and
Computing, vol 745. Springer, Cham.

VIII | P a g e
Acknowledgements
To my lovely family, Mónica, my wife, and Nuno, my little child, for their everlasting patience
and support for this journey, in which, much of time dedicated to this dissertation was a priceless
time missed with my beloved ones.
To my parents, who encouraged me from the beginning to pursue a PhD degree. Even from
abroad, always proud of me.
To Prof. Tiago Oliveira, main supervisor of this thesis, for all the guidance and good advice from
the beginning and throughout the whole project.
To Prof. Sven Casteleyn, a co-supervisor of this thesis, for all the help and good advice to improve
the quality of the articles that were published.
To Prof. Christian Kray, a co-supervisor of this thesis, for all his help during the external semester
in the city of Muenster, Germany.
To the Municipality of Lisbon, for supporting me in my one-month internship where I could have
a closer look at the participatory budgeting project.
We acknowledge the support of the “Geoinformatics: Enabling Open Cities (GEO-C)”, the project
funded by the European Commission within the Marie Skłodowska-Curie Actions, International
Training Networks (ITN), and European Joint Doctorates (EJD). Grant Agreement number 642332
— GEO-C — H2020-MSCA-ITN-2014.
To all my sincere thanks.
IX | P a g e
Table of Contents
Chaper 1 - Introduction ................................................................................................................. 1
1.1 Background and motivation .......................................................................................... 1
1.2 Research focus .............................................................................................................. 2
1.3 Research objectives ....................................................................................................... 4
1.4 Research methodology ................................................................................................. 6
1.5 Path of research ............................................................................................................ 7
Chaper 2 - E-participation adoption models research in the last 17 years: A weight and
meta-analytical review ................................................................................................................ 12
2.1 Introduction ................................................................................................................ 12
2.2 Research Methodology ............................................................................................... 13
2.2.1 Criteria for Selection of Studies........................................................................... 13
2.2.2 Data Extraction .................................................................................................... 16
2.2.3 Merging of Variables ........................................................................................... 17
2.3 Results ......................................................................................................................... 18
2.3.1 Descriptive statistics ............................................................................................ 18
2.3.2 Weight analysis ................................................................................................... 20
2.3.3 Meta-analysis ...................................................................................................... 22
2.3.4 Evaluation of publication bias and normality ...................................................... 26
2.4 Discussion .................................................................................................................... 30
2.5 Implications ................................................................................................................. 33
2.5.1 Implications for theory ........................................................................................ 33
2.5.2 Implications for practice ...................................................................................... 34
2.6 Conclusions ................................................................................................................. 35
2.7 Limitations and Future Research................................................................................. 36
Chaper 3 - Citizen’s intention to use and recommend e-participation: Drawing upon
UTAUT and citizen empowerment .............................................................................................. 37
3.1 Introduction ................................................................................................................ 37
3.2 Background and hypothesis development .................................................................. 38
3.2.1 Contextualizing e-participation adoption ........................................................... 38
3.2.2 UTAUT ................................................................................................................. 40
3.2.3 Recommending the use of e-participation.......................................................... 42
3.2.4 Citizen empowerment ......................................................................................... 43
3.3 Research method ........................................................................................................ 45

X | P a g e
3.3.1 Research model ................................................................................................... 45
3.3.2 Control variables ................................................................................................. 46
3.3.3 Measurement ...................................................................................................... 46
3.3.4 Data Collection .................................................................................................... 47
3.4 Data Analysis and Results ............................................................................................ 48
3.4.1 Exploratory factor analysis and model fit ........................................................... 49
3.4.2 Measurement Model .......................................................................................... 49
3.4.3 Structural Model ................................................................................................. 51
3.5 Discussion .................................................................................................................... 54
3.5.1 Theoretical Implications ...................................................................................... 55
3.5.2 Practical Implications .......................................................................................... 56
3.5.3 Limitations and Future Research ......................................................................... 57
3.6 Conclusions ................................................................................................................. 58
Chaper 4 - Continuous usage of e-participation in the long term: The role of the sense of
virtual community ....................................................................................................................... 59
4.1 Introduction ................................................................................................................ 59
4.2 An overview of e-participation in the post-adoption stage ........................................ 60
4.3 Research model ........................................................................................................... 61
4.3.1 Hypotheses development ................................................................................... 63
4.4 Methodology ............................................................................................................... 66
4.4.1 Research context ................................................................................................. 66
4.4.2 Measurement and data collection ...................................................................... 66
4.5 Results ......................................................................................................................... 68
4.5.1 Measurement model ........................................................................................... 68
4.5.2 Structural model .................................................................................................. 69
4.6 Findings ....................................................................................................................... 70
4.7 Implications for practice.............................................................................................. 72
4.8 Conclusions ................................................................................................................. 73
4.9 Limitations and future research .................................................................................. 74
Chaper 5 - Continued intention to use online participatory budgeting: The effect of
empowerment and habit ............................................................................................................ 75
5.1 Introduction ................................................................................................................ 75
5.2 Online participatory budgeting in the city of Lisbon ................................................... 76
5.3 Research model development .................................................................................... 78
5.4 Methodology ............................................................................................................... 80

XI | P a g e
5.5 Results ......................................................................................................................... 81
5.5.1 Measurement Model .......................................................................................... 81
5.5.2 Structural Model and Multi-Group Analysis ....................................................... 82
5.6 Discussion .................................................................................................................... 84
5.7 Conclusion ................................................................................................................... 86
Chaper 6 - Satisfaction with e-participation: A model from the citizen’s perspective,
expectations, and affective ties to the place .............................................................................. 87
6.1 Introduction ................................................................................................................ 87
6.2 Citizen Satisfaction ...................................................................................................... 88
6.3 Conceptual Model and Hypotheses ............................................................................ 89
6.3.1 DeLone and McLean Variables ............................................................................ 90
6.3.2 Expectation-Confirmation Variables ................................................................... 92
6.3.3 Moderator Role of Sense of Place (SOP) ............................................................. 93
6.4 Implications and Future Research ............................................................................... 94
6.5 Conclusion ................................................................................................................... 95
Chaper 7 - Place and City: Towards a geography of engagement ........................................ 97
7.1 Introduction ................................................................................................................ 97
7.2 Theoretical background and hypotheses .................................................................... 99
7.2.1 Relating sense of place, social capital, and civic engagement .......................... 100
7.2.2 Relating sense of place, social capital, and civic engagement spatial dimensions
102
7.3 Methodology ............................................................................................................. 104
7.3.1 Experimental design .......................................................................................... 104
7.3.2 Research model ................................................................................................. 106
7.4 Results ....................................................................................................................... 109
7.4.1 Data collection and measurement model ......................................................... 109
7.4.2 Structural Model ............................................................................................... 111
7.4.3 A geographical evaluation of the structural model........................................... 112
7.5 Discussion .................................................................................................................. 115
7.6 Conclusions ............................................................................................................... 117
7.6.1 Notes to advance in the acquisition of the socio-spatial concepts ................... 118
Chaper 8 - Conclusions........................................................................................................ 119
8.1 Summary of findings ................................................................................................. 119
8.2 Contributions ............................................................................................................. 121
8.2.1 Implications for theory ...................................................................................... 121
XII | P a g e
8.2.2 Implications for practice .................................................................................... 122
8.3 Limitations and future research ................................................................................ 124
References ................................................................................................................................. 128
Appendix ................................................................................................................................... 162
Appendix 2.1. Merging variables ........................................................................................... 162
Appendix 3.1. Measurement Items and Factor’s Loadings ................................................... 164
Appendix 3.2. Exploratory factor analysis results ................................................................. 165
Appendix 4.1. Measurement instrument .............................................................................. 166
Appendix 5.1. Measurement instrument .............................................................................. 167
Appendix 7.1. Theoretical support for relationship between numbers in Figure 7.1 ........... 168
Appendix 7.2. Questions from the web map-based application .......................................... 169
XIII | P a g e
List of Tables
Table 1.1. Methodological approach summary ______________________________________ 7
Table 1.2. Match chapter - research article _________________________________________ 8
Table 2.1. Sets of keywords to query databases ____________________________________ 14
Table 2.2. List of useful datasets in studies (ordered by publication year, author) __________ 16
Table 2.3. Distribution of respondents by type (ordered by percentage) _________________ 18
Table 2.4. Respondents by country and year (ordered by country name) ________________ 19
Table 2.5. Weight analysis results (ordered by Frequency of use) ______________________ 21
Table 2.6. Meta-analysis results (ordered by frequency) _____________________________ 24
Table 2.7. List of 17 articles that examined the relationship [perceived usefulness - intention to
use] (ordered by year) ________________________________________________________ 27
Table 2.8. Egger Regression for asymmetry ________________________________________ 28
Table 2.9. Subgroup analysis of studies that examined [perceived usefulness - intention to use]
__________________________________________________________________________ 29
Table 3.1. Sample demographic characteristics (ordered by number of observations) ______ 48
Table 3.2. Quality criteria ______________________________________________________ 50
Table 3.3. Hetrotrait-Monotrait Ratio ____________________________________________ 50
Table 3.4. Measurement model evaluation for higher-order formative constructs _________ 51
Table 3.5. Comparison of results ________________________________________________ 53
Table 3.6. Summary of hypotheses testing ________________________________________ 54
Table 4.1. Demographic profile _________________________________________________ 67
Table 4.2. Assessment of measurement model _____________________________________ 68
Table 4.3. Heterotrait-Monotrait Ratio (HTMT) _____________________________________ 69
Table 4.4. Multicollinearity valuation for higher-order formative constructs ______________ 69
Table 5.1. Demographic profile _________________________________________________ 81
Table 5.2. Loadings and cross-loadings ___________________________________________ 82
Table 5.3. Correlation matrix and the square root of AVE (in bold) _____________________ 82
Table 5.4. Multi-group analysis _________________________________________________ 84
Table 7.1. Research hypotheses ________________________________________________ 102
Table 7.2. Spatial hypotheses __________________________________________________ 104
Table 7.3. Demographics of the sample for this study ______________________________ 110
Table 7.4. Quality assessment (square root of AVE in bold) __________________________ 111
Table 7.5. Higher-order formative constructs. Inner VIF values (N=119) ________________ 111

XIV | P a g e
Table 7.6. Structural model evaluation (β values) for the sample and related subsets _____ 114
Table 7.7. R2 values for the sample and related subsets _____________________________ 114
Table 7.8. Summary about supported (y) and rejected (n) hypothesis __________________ 114
Table 8.1. Relationships analysed in the quantitative studies _________________________ 119
XV | P a g e
List of Figures
Figure 1.1. Research focus _______________________________________________________________ 3
Figure 1.2. Research objectives by studies __________________________________________________ 5
Figure 2.1. Selection of studies __________________________________________________________ 15
Figure 2.2. World distribution of the respondents analysed in the articles considered for this study __ 20
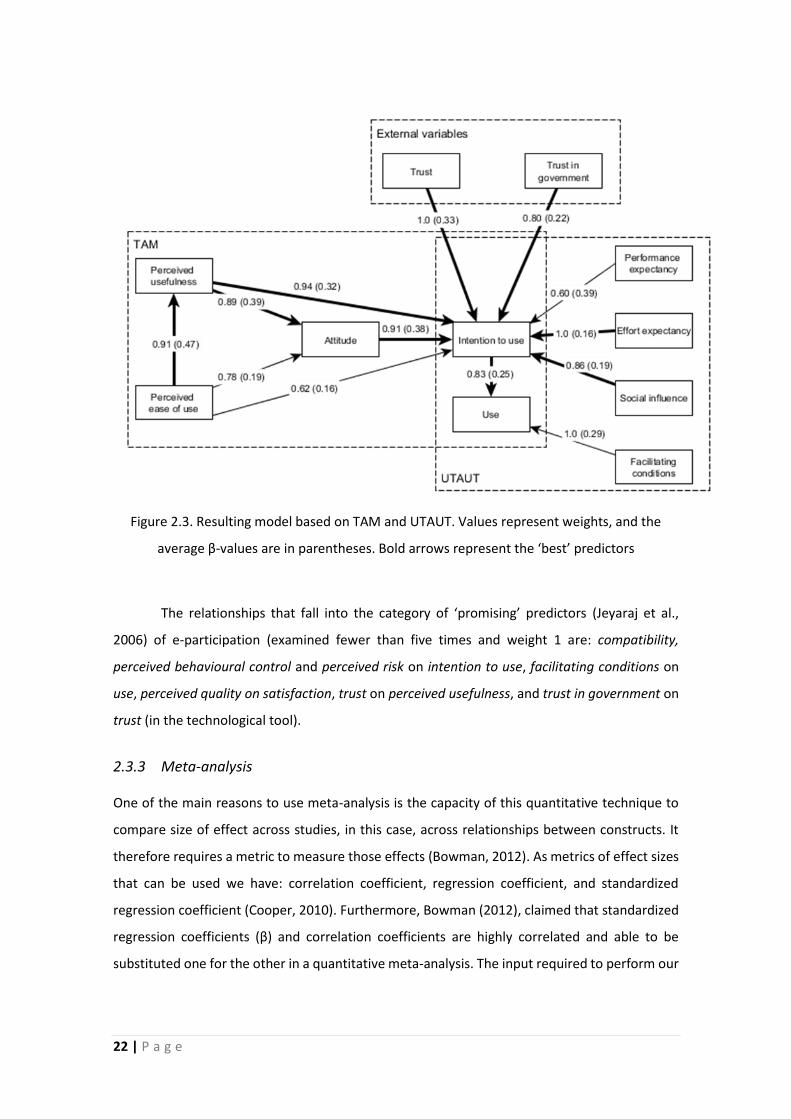
Figure 2.3. Resulting model based on TAM and UTAUT. Values represent weights, and the average β-
values are in parentheses. Bold arrows represent the ‘best’ predictors __________________________ 22
Figure 2.4. Forrest plot of Table 2.6 (Meta-analysis). Ordered by ∑ sample size descending _________ 25
Figure 2.5. Model resulting from meta-analysis _____________________________________________ 26
Figure 2.6. Funnel plot of studies that examined [perceived usefulness - intention to use] __________ 28
Figure 2.7. Forest plot of the 17 articles that examined [perceived usefulness - intention to use]. Ordered
by sample size descending _____________________________________________________________ 29
Figure 2.8. Normal quantile plot for the studies that examine [perceived usefulness - intention to use] 30
Figure 3.1.Research model _____________________________________________________________ 45
Figure 3.2. Structural model results ______________________________________________________ 52
Figure 4.1. Research model and hypotheses _______________________________________________ 62
Figure 4.2. Structural model results ______________________________________________________ 70
Figure 4.3. Moderating effect of SOVC between technology use and continuous intention to use ____ 72
Figure 5.1. Voting in the Lisbon participatory budgeting. (Data from: www.lisboaparticipa.pt) _______ 77
Figure 5.2. Research model and hypotheses _______________________________________________ 79
Figure 5.3. Structural model results by groups ______________________________________________ 83
Figure 6.1. Conceptual model ___________________________________________________________ 90
Figure 7.1. Relationships between sense of place and social capital dimensions toward civic engagement
__________________________________________________________________________________ 101
Figure 7.2. Schema of the application flow ________________________________________________ 106
Figure 7.3. Research model ____________________________________________________________ 107
Figure 7.4. Spatial relationships between the three constructors: sense of place, social capital, and civic
engagement. _______________________________________________________________________ 108
Figure 7.5. Structural model results _____________________________________________________ 112
Figure 7.6. Spatial relationships results. Discontinuous lines mean statistically not significant. ______ 113

XVI | P a g e
List of abbreviations and acronyms
AVE Average Variance Extracted
CA Cronbach’s Alpha
CES Combined effect size
CIU Continuous intention to use
CR Composite Reliability
CVM Civic voluntarism model
D&M DeLone & McLean
DOI Diffusion of innovation
ECT Expectation confirmation theory
GIM General incentives model
GIS Geographic Information System
HTMT Hetrotrait-Monotrait Ratio
ICEGOV International Conference on Theory and Practice of Electronic Governance
ICT Information Communication Technology
IEEE Institute of Electrical and Electronics Engineers
INE Instituto Nacional de Estadística
IS Information Systems
IT Information Technology
KMO Kaiser-Meyer-Olkin
MEA Meaning
NA/NR No answer/No response
NFI Normal fit index
NOVA IMS Nova Information Management School
PLS Partial Least Squares
PPGIS Public Participation Geographic Information System
SCT Social cognitive theory
SEM Structural Equation Modelling
SERVQUAL Service quality
SOC Sense of community
SOP Sense of Place
SOVC Sense of virtual community

XVII | P a g e
SRMR Root mean square residual
TAM Technology Acceptance Model
TPB Theory of Planned Behaviour
TRA Theory of Reasoned Action
UTAUT Unified Theory of Acceptance and Use of Technology
VIF Variance inflation factor

XVIII | P a g e
1 | P a g e
Chaper 1 - Introduction
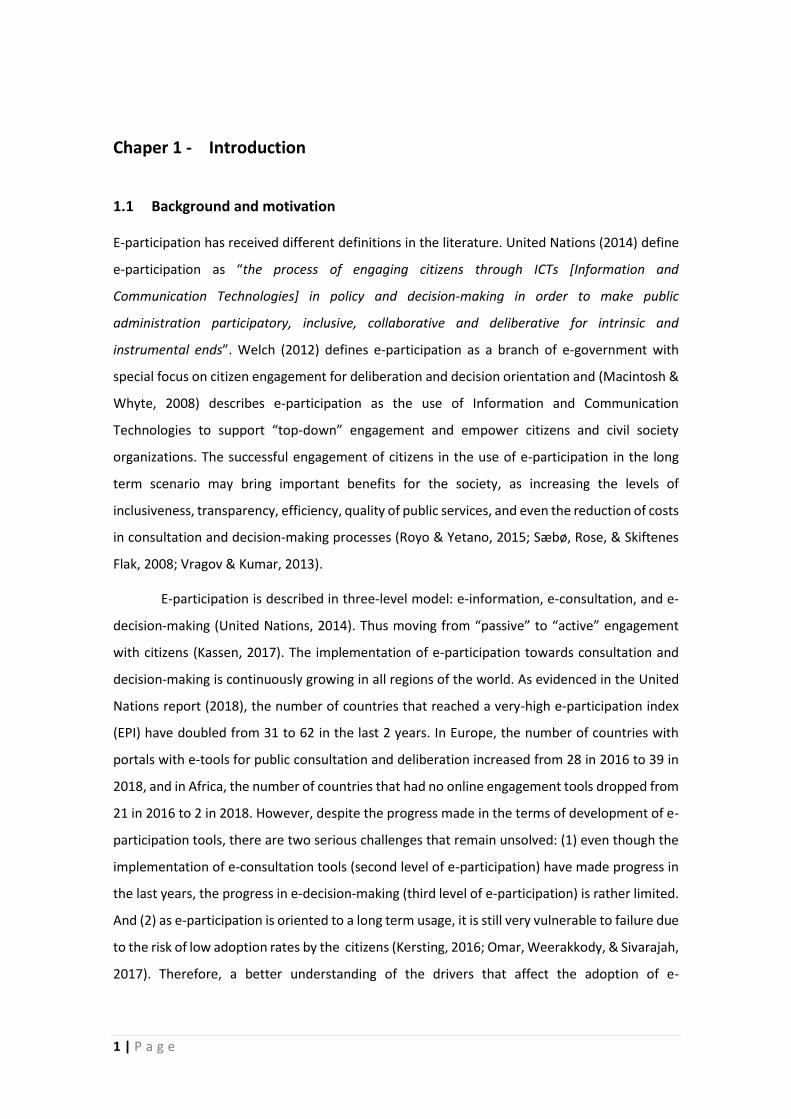
1.1 Background and motivation
E-participation has received different definitions in the literature. United Nations (2014) define
e-participation as “the process of engaging citizens through ICTs [Information and
Communication Technologies] in policy and decision-making in order to make public
administration participatory, inclusive, collaborative and deliberative for intrinsic and
instrumental ends”. Welch (2012) defines e-participation as a branch of e-government with
special focus on citizen engagement for deliberation and decision orientation and (Macintosh &
Whyte, 2008) describes e-participation as the use of Information and Communication
Technologies to support “top-down” engagement and empower citizens and civil society
organizations. The successful engagement of citizens in the use of e-participation in the long
term scenario may bring important benefits for the society, as increasing the levels of
inclusiveness, transparency, efficiency, quality of public services, and even the reduction of costs
in consultation and decision-making processes (Royo & Yetano, 2015; Sæbø, Rose, & Skiftenes
Flak, 2008; Vragov & Kumar, 2013).
E-participation is described in three-level model: e-information, e-consultation, and e-
decision-making (United Nations, 2014). Thus moving from “passive” to “active” engagement
with citizens (Kassen, 2017). The implementation of e-participation towards consultation and
decision-making is continuously growing in all regions of the world. As evidenced in the United
Nations report (2018), the number of countries that reached a very-high e-participation index
(EPI) have doubled from 31 to 62 in the last 2 years. In Europe, the number of countries with
portals with e-tools for public consultation and deliberation increased from 28 in 2016 to 39 in
2018, and in Africa, the number of countries that had no online engagement tools dropped from
21 in 2016 to 2 in 2018. However, despite the progress made in the terms of development of e-
participation tools, there are two serious challenges that remain unsolved: (1) even though the
implementation of e-consultation tools (second level of e-participation) have made progress in
the last years, the progress in e-decision-making (third level of e-participation) is rather limited.
And (2) as e-participation is oriented to a long term usage, it is still very vulnerable to failure due
to the risk of low adoption rates by the citizens (Kersting, 2016; Omar, Weerakkody, & Sivarajah,
2017). Therefore, a better understanding of the drivers that affect the adoption of e-
2 | P a g e
participation by the citizens is crucial for the governments that implement e-participation tools.
The literature does not provide a strong theoretical basis to support successful implementations
and adoption of e-participation.
Existing literature presents several research gaps that this dissertation contributes filling
out. First, there is a lack of comparative studies analysing e-participation; instead, the body of
research mainly consists of isolated case studies (Kubicek & Aichholzer, 2016). Second, the most
of studies that examined the drivers of the e-participation adoption have used research models
in the context of information technology (Naranjo Zolotov, Oliveira, & Casteleyn, 2018). Using
single models of information technology adoption may not provide a strong theoretical basis of
the general factors that drive the adoption of an interdisciplinary and highly dynamic
phenomenon as is the e-participation (Medaglia, 2012; Susha & Grönlund, 2012). For instance,
Wang & Shih (2009) analysed the adoption of information kiosks using UTAUT, Choi & Kim (2012)
studied the intention to use e-voting using the technology acceptance model (TAM) (Davis,
1989). The single-theory model’s approach provides little insights into the information
technology exogenous and individual elements that may help to explain e-participation usage.
Using technology adoption models alone may not be enough if we wish to analyse the specific
characteristics of e-participation. In this regard, Venkatesh et al. (2016) suggest that “it is
necessary to draw on other theoretical perspectives to identify and examine specific
characteristics” of e-participation. And third, the successful adoption and usage of e-
participation in the short term does not guarantee the success in the long term, which is the
desired scenario for implementations of e-participation. This dissertation also examines the
factors for both the intention to use and the continuous intention to use e-participation.
1.2 Research focus
E-participation tools are usually implemented and host by governments, mainly local, and
oriented to be adopted by the citizenry. The exploration and understanding of the factors,
technological and non-technological, that impact on the acceptance and post-acceptance stage
of e-participation is the focus of the dissertation. Specifically, we study the potential factors, at
individual level, that may help to explain the behavioural intention to use and use at the
acceptance stage, and the intention to recommend and continuous intention to use at the post-
acceptance stage. See Figure 1.1. This dissertation contributes to answer the question of what
are the main determinants factors of information and communication technologies (ICT) of the
e-participation adoption?

3 | P a g e
Figure 1.1. Research focus
The phenomenon of e-participation has unique characteristics that differentiate it from
other e-government systems, (i) the highest level of e-participation is the involvement of a
significant number of citizens in the decision-making process along with authorities (United
Nations, 2014), (ii) the usage of e-participation is oriented to produce an impact on the
community (Talò, Mannarini, & Rochira, 2014), and (iii) is designed to be used in the long term
scenario to produce the desired outcomes for the community (Zhao, Lu, Wang, Chau, & Zhang,
2012). Consequently, in order to provide better insights on the e-participation adoption drivers,
this phenomenon should be studied from different theoretical perspectives (Venkatesh et al.,
2016), different contexts, and different samples. In this regard, we used theories from the
information systems field, as is the unified theory of acceptance and use of technology – UTAUT
(Venkatesh, Morris, Davis, & Davis, 2003), in combination with theories from the cognitive
psychology field, as the psychological empowerment (Zimmerman, 1995) and sense of virtual
community (Koh & Kim, 2003), and differences at individual level as age and gender to
understand better the adoption of e-participation.
UTAUT is a theoretical model that has been widely used in the study of technology
acceptance and adoption. UTAUT is an appropriate theory to study e-participation adoption for
three main reasons: first, according to Venkatesh et al. (2003), UTAUT is suitable to study
complex organizational technologies. E-participation can be considered a complex technological
context due to the number of different tools available (Sæbø et al., 2008), different types and
amounts of data generated by the citizens, stakeholders with diverse interests, and two-way
government-citizen interactions in which citizens usually expect to receive feedback for their
actions. These factors make a complex research scenario in which UTAUT can be appropriate to
4 | P a g e
examine the behavioural intention to use the e-participation, which has been suggested as the
main predictor of human behaviour (JinKyu Lee & Rao, 2009).
Empowerment has been described as the highest expression of participation
(Macintosh, 2004). Earlier studies have found that several activities such as consulting, exchange
of opinions, and involving citizens in decision-making processes increase the intention to
participate in e-government initiatives (Bataineh & Abu-Shanab, 2016; Phang & Kankanhalli,
2008). Furthermore, Kang (2014) found empowerment to be a key dimension for public
engagement, which may lead to positive recommendations. These findings suggest that the
psychological empowerment theory may contribute to theoretical knowledge in the field of e-
participation, specifically, to understand its pre- and post-adoption behaviour.
One of the goals of using e-participation is to involve citizens in consultation and
decision-making process that have an impact on the community they belong to or to which they
have some affective ties. Existing literature provides evidence to support the belief that citizens
who are involved in different forms of civic engagement and community activities also show
high levels of sense of community (Peterson, Speer, & McMillan, 2008; Talò et al., 2014).
The implementation of e-participation systems by local governments has been proven
to increase the level of citizen satisfaction (Ahn & Bretschneider, 2011), and in turn, citizen
satisfaction positively impacts the level of trust in government (Christensen & Lægreid, 2005;
Welch, Hinnant, & Moon, 2005). In the case of e-participation, which is used voluntarily
(Medaglia, 2012), the perception of satisfaction may differ from other systems because the final
perceived outcomes and benefits for the community are influenced directly by the interactions
of the citizens with the e-participation.
1.3 Research objectives
The main objective of our research is to explore and understand better the factors that drive the
adoption of e-participation technologies in the urban contexts. In order to achieve that main
objective, we divided our research in five different sub-objectives that are developed each one
in a separate study, each study is presented in this dissertation as a separate chapter. Error! R
eference source not found.Figure 1.2 depicts how the five studies contribute to the
understanding of the e-participation adoption factors.

5 | P a g e
Figure 1.2. Research objectives by studies
List of objectives:
1. To identify the trends and synthesize the findings from existing research in the context
of e-participation adoption.
2. To explore the effect of psychological empowerment on the intention to use and
recommend e-participation.
3. To explore the effect of sense of virtual community (SOVC) (Koh & Kim, 2003) on the
usage and continued intention to use e-participation in the post-adoption stage.
4. To explore the effect of each of the components of empowerment and the effect of
habit over the continued intention to use e-participation.
5. To propose a theoretical model to evaluate the citizen satisfaction with e-participation.
6. To evaluate the impact of sense of place and sense of community on civic engagement
considering the geographic component.

6 | P a g e
1.4 Research methodology
Epistemologically, the core of our research methodology of the e-participation adoption
phenomenon follows a positivist approach which assumes that a set of variables related to the
phenomenon and the causal relationships between those variables actually exist and can explain
the e-participation adoption (Heeks & Bailur, 2007). The positivist approach requires the
deduction of research hypothesis on the theoretical grounds and quantifiable measures through
empirical work to validate those hypotheses (Orlikowski & Baroudi, 1991). In order to address
our research objectives, this dissertation is composed for five studies. The first study is a
literature review that follows a quantitative approach to develop a weight and meta-analysis of
the existing cross-sectional studies in the e-participation adoption context. From the second to
the forth study we developed three research models to evaluate our research hypotheses. The
research models are evaluated using partial least squares structural equation modelling method
(PLS-SEM) (J. Hair, Hult, Ringle, & Sarstedt, 2017) based on data collected through an electronic
questionnaire. And the fifth study follows a theoretical approach to propose a research model.
We used an electronic questionnaire for the data collection. The questions were derived
from previously validated scales for all the constructs in the three research models and adjusted
to the context of e-participation. The research was carried out in two Portuguese cities where
their municipalities have implemented a set of e-participation tools in the last few years to
promote the involvement of citizens in consultation and decision-making processes, these cities
are Lisbon and Cascais. Both cities have implemented the online participatory budgeting
(Sintomer, Herzberg, Allegretti, Röcke, & Alves, 2013), which is considered as e-participation
platform where citizens can submit project initiatives through a web portal, and then vote by
means of SMS messages or through the web portal to choose which project(s) should be funded
and implemented by the local government of each city.
We assess the research model using the partial least squares structural equation
modelling method (PLS-SEM) (Hair et al., 2017). PLS is a variance-based technique, which is data
driven and suitable for predictive analysis to test the causal relationships that were theoretically
derived as hypotheses and using empirical data (J. F. Hair, Ringle, & Sarstedt, 2011). The PLS-
SEM method is appropriate when the model complies with the following considerations: the
objective is to predict the key drivers of an information technology adoption, the research model
is considered complex, and the sample size is at least ten times the highest number of paths
directed to a construct in the model. The three models evaluated complied with those
7 | P a g e
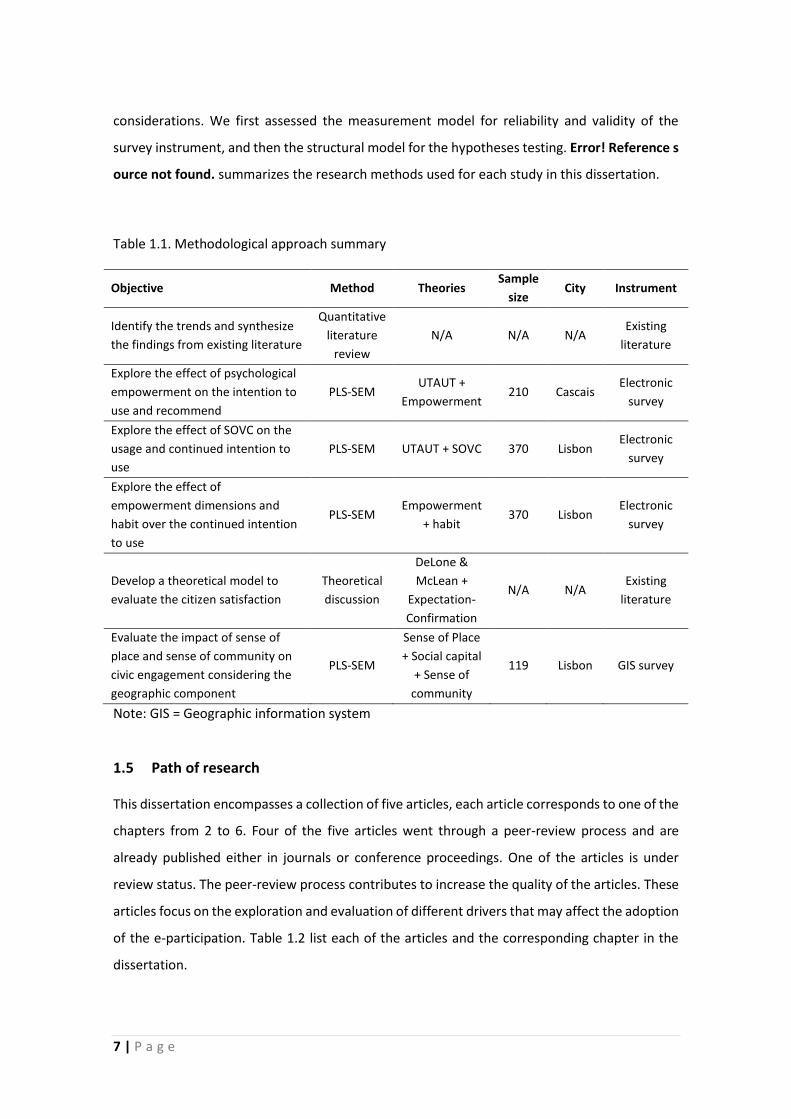
considerations. We first assessed the measurement model for reliability and validity of the
survey instrument, and then the structural model for the hypotheses testing. Error! Reference s
ource not found. summarizes the research methods used for each study in this dissertation.
Table 1.1. Methodological approach summary
Objective Method Theories Sample
size City Instrument
Identify the trends and synthesize
the findings from existing literature
Quantitative
literature
review
N/A N/A N/A Existing
literature
Explore the effect of psychological
empowerment on the intention to
use and recommend
PLS-SEM UTAUT +
Empowerment 210 Cascais
Electronic
survey
Explore the effect of SOVC on the
usage and continued intention to
use
PLS-SEM UTAUT + SOVC 370 Lisbon Electronic
survey
Explore the effect of
empowerment dimensions and
habit over the continued intention
to use
PLS-SEM Empowerment
+ habit 370 Lisbon
Electronic
survey
Develop a theoretical model to
evaluate the citizen satisfaction
Theoretical
discussion
DeLone &
McLean +
Expectation-
Confirmation
N/A N/A Existing
literature
Evaluate the impact of sense of
place and sense of community on
civic engagement considering the
geographic component
PLS-SEM
Sense of Place
+ Social capital
+ Sense of
community
119 Lisbon GIS survey
Note: GIS = Geographic information system
1.5 Path of research
This dissertation encompasses a collection of five articles, each article corresponds to one of the
chapters from 2 to 6. Four of the five articles went through a peer-review process and are
already published either in journals or conference proceedings. One of the articles is under
review status. The peer-review process contributes to increase the quality of the articles. These
articles focus on the exploration and evaluation of different drivers that may affect the adoption
of the e-participation. Table 1.2 list each of the articles and the corresponding chapter in the
dissertation.
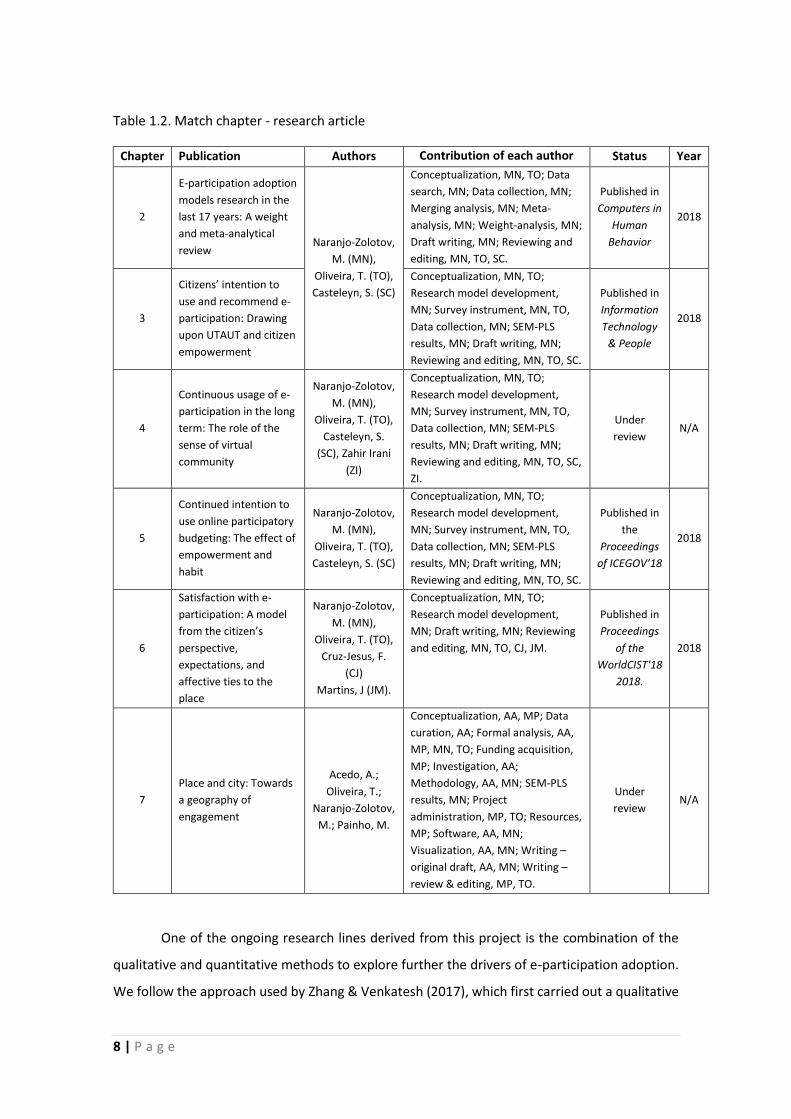
8 | P a g e
Table 1.2. Match chapter - research article
Chapter Publication Authors Contribution of each author Status Year
2
E-participation adoption
models research in the
last 17 years: A weight
and meta-analytical
review Naranjo-Zolotov,
M. (MN),
Oliveira, T. (TO),
Casteleyn, S. (SC)
Conceptualization, MN, TO; Data
search, MN; Data collection, MN;
Merging analysis, MN; Meta-
analysis, MN; Weight-analysis, MN;
Draft writing, MN; Reviewing and
editing, MN, TO, SC.
Published in
Computers in
Human
Behavior
2018
3
Citizens’ intention to
use and recommend e-
participation: Drawing
upon UTAUT and citizen
empowerment
Conceptualization, MN, TO;
Research model development,
MN; Survey instrument, MN, TO,
Data collection, MN; SEM-PLS
results, MN; Draft writing, MN;
Reviewing and editing, MN, TO, SC.
Published in
Information
Technology
& People
2018
4
Continuous usage of e-
participation in the long
term: The role of the
sense of virtual
community
Naranjo-Zolotov,
M. (MN),
Oliveira, T. (TO),
Casteleyn, S.
(SC), Zahir Irani
(ZI)
Conceptualization, MN, TO;
Research model development,
MN; Survey instrument, MN, TO,
Data collection, MN; SEM-PLS
results, MN; Draft writing, MN;
Reviewing and editing, MN, TO, SC,
ZI.
Under
review N/A
5
Continued intention to
use online participatory
budgeting: The effect of
empowerment and
habit
Naranjo-Zolotov,
M. (MN),
Oliveira, T. (TO),
Casteleyn, S. (SC)
Conceptualization, MN, TO;
Research model development,
MN; Survey instrument, MN, TO,
Data collection, MN; SEM-PLS
results, MN; Draft writing, MN;
Reviewing and editing, MN, TO, SC.
Published in
the
Proceedings
of ICEGOV’18
2018
6
Satisfaction with e-
participation: A model
from the citizen’s
perspective,
expectations, and
affective ties to the
place
Naranjo-Zolotov,
M. (MN),
Oliveira, T. (TO),
Cruz-Jesus, F.
(CJ)
Martins, J (JM).
Conceptualization, MN, TO;
Research model development,
MN; Draft writing, MN; Reviewing
and editing, MN, TO, CJ, JM.
Published in
Proceedings
of the
WorldCIST'18
2018.
2018
7
Place and city: Towards
a geography of
engagement
Acedo, A.;
Oliveira, T.;
Naranjo-Zolotov,
M.; Painho, M.
Conceptualization, AA, MP; Data
curation, AA; Formal analysis, AA,
MP, MN, TO; Funding acquisition,
MP; Investigation, AA;
Methodology, AA, MN; SEM-PLS
results, MN; Project
administration, MP, TO; Resources,
MP; Software, AA, MN;
Visualization, AA, MN; Writing –
original draft, AA, MN; Writing –
review & editing, MP, TO.
Under
review N/A
One of the ongoing research lines derived from this project is the combination of the
qualitative and quantitative methods to explore further the drivers of e-participation adoption.
We follow the approach used by Zhang & Venkatesh (2017), which first carried out a qualitative

9 | P a g e
study with the employees of a company about the usage of knowledge management systems
and then, using the insights obtained from the qualitative study they built a research model and
conducted a quantitative study to evaluate the model. Additionally, during May and July we
were honoured with the visit of two renowned scientists in the field of information systems to
collaborate with us for this future line of research: Prof. Dr. Christy Cheung and Prof. Dr.
Viswanath Venkatesh.
In most of scientific research projects, establishing a theoretical background is the first
logical step to follow. In chapter 2 we present a literature review in a form of a weight and meta-
analysis study of the existing quantitative articles of e-participation adoption from the year 2000
to year 2017. We identify the most used theories and variables used in the study of e-
participation adoption.
The engagement of citizens in consultation and decision-making processes may create
a feeling of empowerment in those citizens (Gonçalves et al., 2014), so empowerment can play
an important role as motivator of e-participation adoption. In chapter 3 we design and evaluate
a research model that integrates UTAUT (Venkatesh et al., 2003) and psychological
empowerment (Zimmerman, 1995) to measure the effect of the constructs from these theories
on the intention to use and intention to recommend e-participation, the acceptance stage.
The usage of e-participation is more likely to have a significant impact on the community
if used in the long term. The feeling of being part of a community may encourage the citizens to
use e-participation. In chapter 4 we present a cross-sectional study that analyses the effect of
SOVC as motivator for the continued intention to use e-participation in the post-adoption stage.
In chapter 5 we go back to the analysis of the empowerment and combine it with habit.
This study is carried out in a different context and focused on the continued intention to use. In
the post-adoption stage, citizens may develop an habit regarding the use of the information
technology (Venkatesh, Thong, & Xu, 2012). We discuss how both empowerment and habit can
have an effect on the continued intention to use e-participation.
In chapter 6 we propose a theoretical model to assess the citizens satisfaction with the
use of e-participation in the post-adoption stage. As citizen’s satisfaction is an indicator of
successful continuous usage of e-participation (Kipenis & Askounis, 2016), we develop a
theoretical model aimed for future research as next step of this project.

10 | P a g e
In chapter 7 we include the findings of an additional article which was co-authored by
the author of this dissertation. The article title is “Place and city: Towards a geography of
engagement” and uses PLS-SEM to evaluate the impact of geographical ties as drivers of sense
of belonging to a community and for civic engagement.
In chapter 8 we provide the conclusions of the major findings and implications for theory
and practice of the six articles included from chapter 2 to 7. Place and city: Furthermore, we
provide the limitations and suggestions for future research in the field of e-participation
adoption.

11 | P a g e
12 | P a g e
Chaper 2 - E-participation adoption models research in the last 17
years: A weight and meta-analytical review
2.1 Introduction
E-participation is defined as “the process of engaging citizens through ICTs [Information and
Communication Technologies] in policy and decision-making in order to make public
administration participatory, inclusive, collaborative and deliberative for intrinsic and
instrumental ends” (United Nations, 2014, p. 61). The definition provided by United Nations
emphasizes the importance of citizen engagement and e-participation for sustainable
development and for facing the current global challenges such as climate change, inequality,
poverty, and the collaboration between governmental and non-governmental actors. E-
participation is a strategic factor to improve citizen participation in digital governance (Sanford
& Rose, 2007) and to promote a more efficient society (Sæbø et al., 2008).
In recent years the availability of e-participation technologies has increased around the
globe. For instance, by 2010 there was an estimate of 795 to 1469 implementations of
participatory budgeting around the world (Sintomer, Herzberg, Allegretti, & Röcke, 2010),
whereas by 2013 the estimate was updated to nearly 2700 implementations worldwide
(Sintomer et al., 2013). Recently United Nations (2016) reported on the current situation of
forms of e-participation worldwide. Of the 193 members states: 183 have implemented e-
information by posting online information about education, health, finance, environment, social
protection, and labour; 62 provide the option for citizens to subscribe to updates via SMS and
e-mail about labour information; 152 use e-consultation through social network features;
however, in only 38 of these 152 countries e-consultation resulted in new policies or regulations;
and 120 countries have developed e-decision-making tools.
E-participation is considered a field of interdisciplinary nature (Macintosh, Coleman, &
Schneeberger, 2009; Medaglia, 2012; Susha & Grönlund, 2012). Comparative and review studies
on e-participation may help considerably to form a better picture of the research progress in
this field. From the qualitative perspective, review studies such as Medaglia (2012), Sæbø et al.
(2008), Sanford & Rose (2007), have contributed to the characterization of the field. However,
Kubicek & Aichholzer (2016) identified that there is a lack of comparative studies analysing e-
participation; instead, the body of research mainly consists of isolated case studies. They
contributed by reviewing the major types of conceptual frameworks and evaluation criteria in
13 | P a g e
the e-participation context. On the quantitative side, very few review and comparative studies
address e-participation directly. This article fills the gap of quantitative review in the e-
participation domain.
The main objective of this study is to perform a weight analysis (Jeyaraj, Rottman, &
Lacity, 2006) and meta-analysis (King & He, 2006), which are strong alternatives to the narrative
methods of literature review to synthetize findings presented in primary quantitative articles on
e-participation technology adoption. Specifically, we analyse the performance of the constructs
obtained from the assessment of the research models found in 60 articles published in the last
17 years. This article makes two contributions. First, according to Webster & Watson (2002) an
effective review can serve as a strong basis for advancement of knowledge, facilitating the path
for theoretical development and revealing gaps where more research is needed. Second, we
offer a better understanding of the existing trends and patterns in the use of theoretical models
and constructs, especially for the most widely used research models: the technology acceptance
model – TAM (Davis, 1989) and the unified theory of acceptance and use of technology – UTAUT
(Venkatesh et al., 2003). The most frequently used constructs are identified as ‘best’ and
‘promising’ predictors (Jeyaraj et al., 2006). Besides the weight and meta-analysis, the article
also examines trends on technologies used for e-participation and the type of sample
population, with its distribution by country and by year.
The paper is organized as follows. The next section describes the research methodology,
this is, the definition of the problem, the criteria for selection or rejection of studies, the data
extraction process, and merging the names of variables. Section 3 provide the results: (3.1)
descriptive statistics, (3.2) weight analysis, (3.3) meta-analysis, and (3.4) analysis of publication
bias. Then, a discussion of the findings with their implications for theory and practice is
presented; and finally, the conclusions, and limitations and future research.
2.2 Research Methodology
2.2.1 Criteria for Selection of Studies
The first step in a meta-analysis investigation is formulating the problem (Cooper, 2010). In our
case, we are interested in analysing the overall performance of the relationships between
independent and dependent variables, measured in theoretical models for adoption of e-
participation over the last 17 years or research. We included all available electronic databases
14 | P a g e
relevant to the topic: Science Direct, ISI Web of Science, ACM Digital Library, and Google Scholar.
The search engines of the databases provide options to perform advance search using keywords
and logical operators (AND/OR), within a specific timeframe.
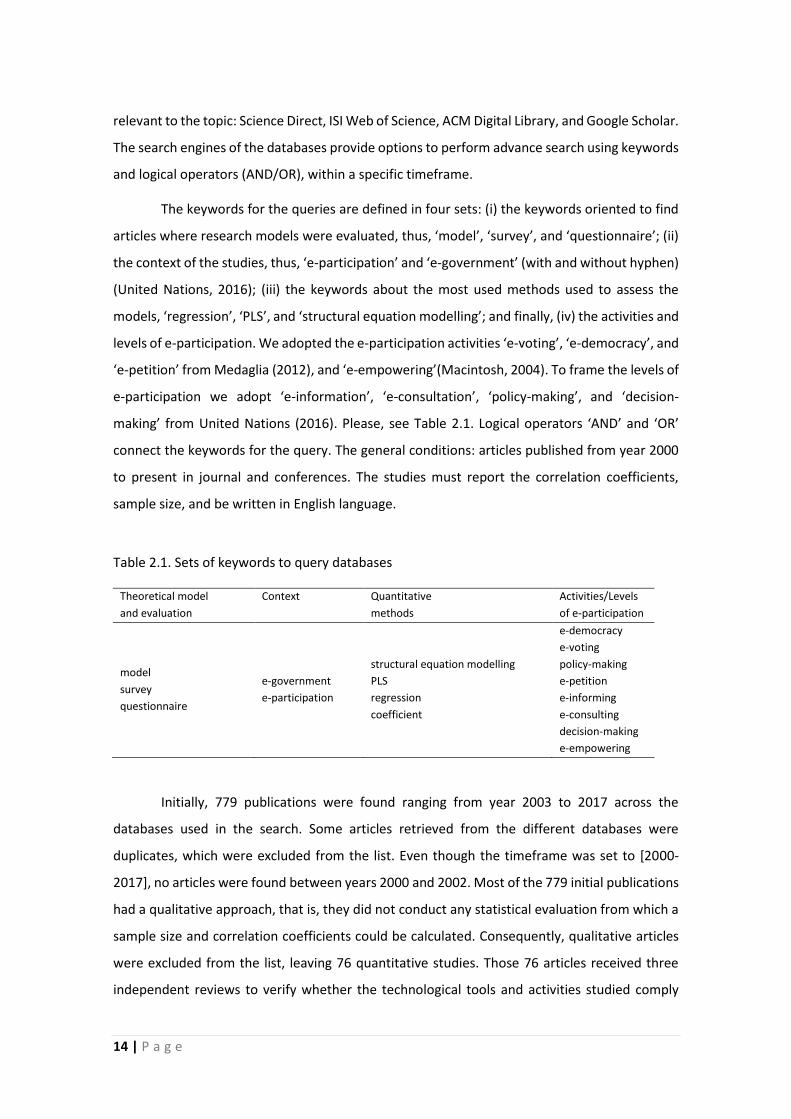
The keywords for the queries are defined in four sets: (i) the keywords oriented to find
articles where research models were evaluated, thus, ‘model’, ‘survey’, and ‘questionnaire’; (ii)
the context of the studies, thus, ‘e-participation’ and ‘e-government’ (with and without hyphen)
(United Nations, 2016); (iii) the keywords about the most used methods used to assess the
models, ‘regression’, ‘PLS’, and ‘structural equation modelling’; and finally, (iv) the activities and
levels of e-participation. We adopted the e-participation activities ‘e-voting’, ‘e-democracy’, and
‘e-petition’ from Medaglia (2012), and ‘e-empowering’(Macintosh, 2004). To frame the levels of
e-participation we adopt ‘e-information’, ‘e-consultation’, ‘policy-making’, and ‘decision-
making’ from United Nations (2016). Please, see Table 2.1. Logical operators ‘AND’ and ‘OR’
connect the keywords for the query. The general conditions: articles published from year 2000
to present in journal and conferences. The studies must report the correlation coefficients,
sample size, and be written in English language.
Table 2.1. Sets of keywords to query databases
Theoretical model
and evaluation
Context Quantitative
methods
Activities/Levels
of e-participation
model
survey
questionnaire
e-government
e-participation
structural equation modelling
PLS
regression
coefficient
e-democracy
e-voting
policy-making
e-petition
e-informing
e-consulting
decision-making
e-empowering
Initially, 779 publications were found ranging from year 2003 to 2017 across the
databases used in the search. Some articles retrieved from the different databases were
duplicates, which were excluded from the list. Even though the timeframe was set to [2000-
2017], no articles were found between years 2000 and 2002. Most of the 779 initial publications
had a qualitative approach, that is, they did not conduct any statistical evaluation from which a
sample size and correlation coefficients could be calculated. Consequently, qualitative articles
were excluded from the list, leaving 76 quantitative studies. Those 76 articles received three
independent reviews to verify whether the technological tools and activities studied comply

15 | P a g e
with the conditions of our study and the list of predefined activities. As a result, 12 articles were
excluded as not fitting our list of e-participation activities and levels (Table 2.1). Remaining 64
studies.
In these 64 studies, four were excluded for using the same dataset of respondents,
because of the same dataset in more than one publication may bias the aggregate effects in
meta-analysis (Wood, 2007). If two or more studies used the same dataset, we selected the one
that contained the highest number of variables. On the other hand, the article of Seo & Bernsen
(2016) contained four independent datasets, from which we consider only the one with biggest
sample size for weight and meta-analysis. Finally, this article includes 60 studies and 63 useful
datasets. Figure 2.1 describes the workflow and conditions of the search.
Figure 2.1. Selection of studies
16 | P a g e
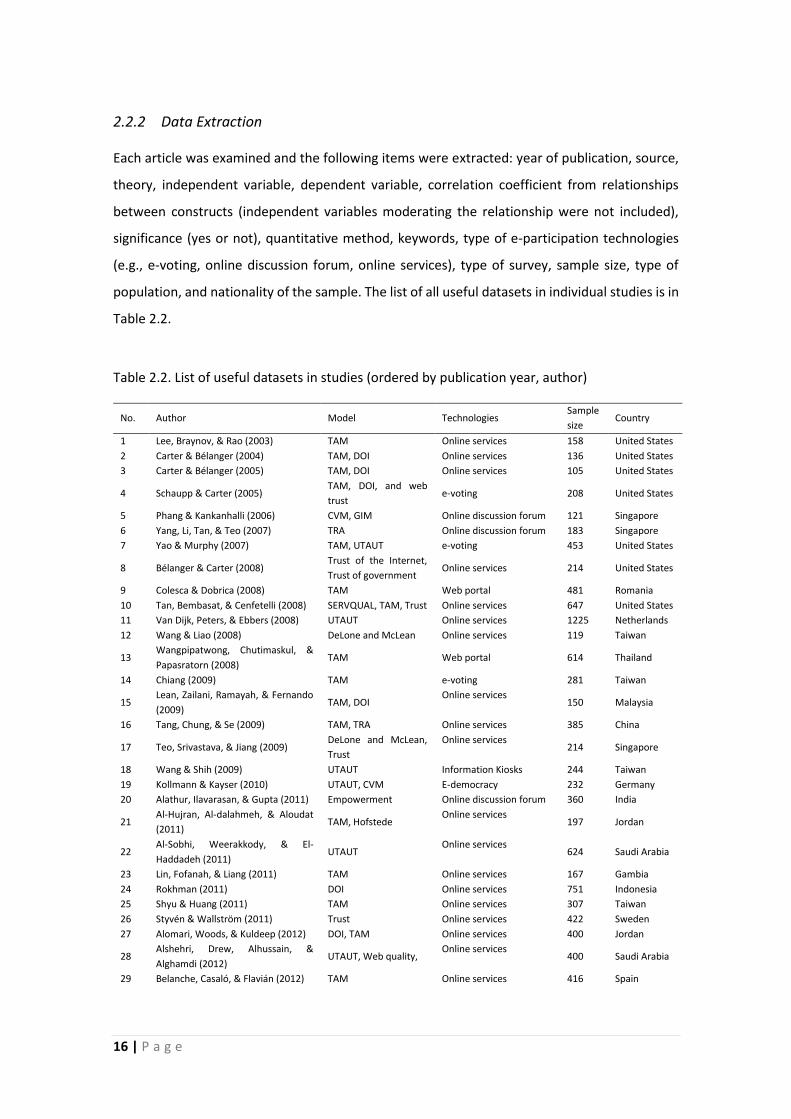
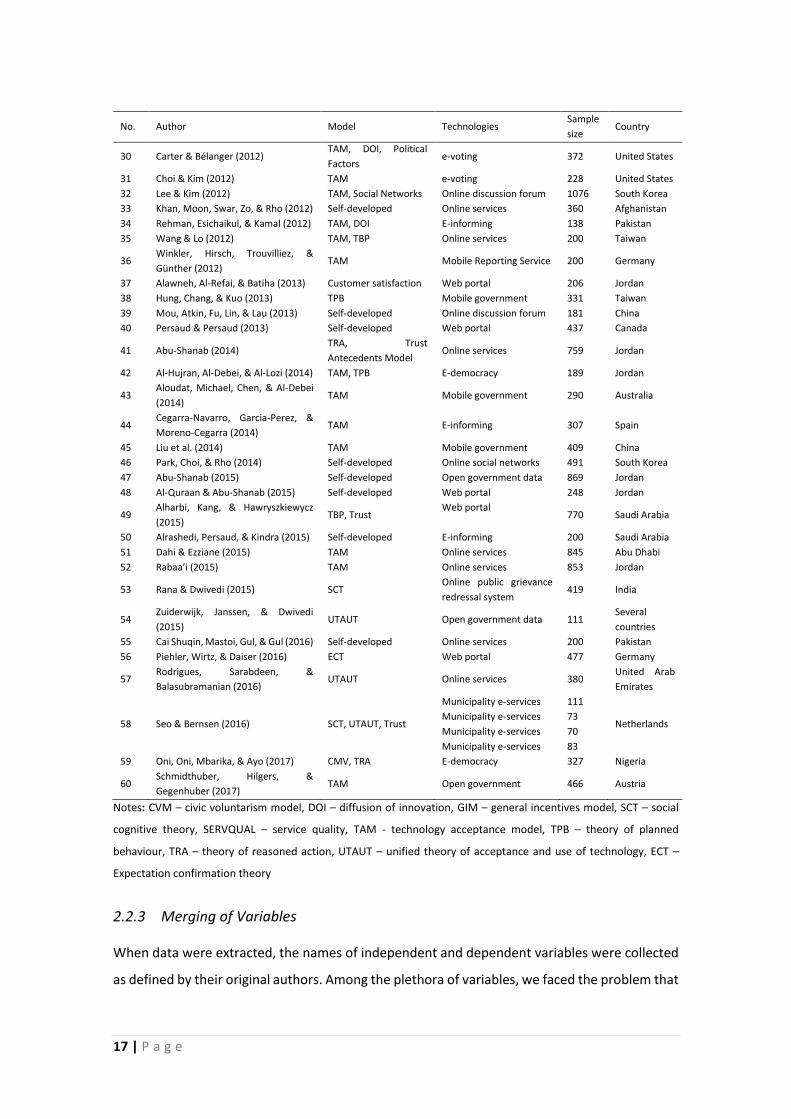
2.2.2 Data Extraction
Each article was examined and the following items were extracted: year of publication, source,
theory, independent variable, dependent variable, correlation coefficient from relationships
between constructs (independent variables moderating the relationship were not included),
significance (yes or not), quantitative method, keywords, type of e-participation technologies
(e.g., e-voting, online discussion forum, online services), type of survey, sample size, type of
population, and nationality of the sample. The list of all useful datasets in individual studies is in
Table 2.2.
Table 2.2. List of useful datasets in studies (ordered by publication year, author)
No. Author Model Technologies Sample
size Country
1 Lee, Braynov, & Rao (2003) TAM Online services 158 United States
2 Carter & Bélanger (2004) TAM, DOI Online services 136 United States
3 Carter & Bélanger (2005) TAM, DOI Online services 105 United States
4 Schaupp & Carter (2005) TAM, DOI, and web
trust e-voting 208 United States
5 Phang & Kankanhalli (2006) CVM, GIM Online discussion forum 121 Singapore
6 Yang, Li, Tan, & Teo (2007) TRA Online discussion forum 183 Singapore
7 Yao & Murphy (2007) TAM, UTAUT e-voting 453 United States
8 Bélanger & Carter (2008) Trust of the Internet,
Trust of government Online services 214 United States
9 Colesca & Dobrica (2008) TAM Web portal 481 Romania
10 Tan, Bembasat, & Cenfetelli (2008) SERVQUAL, TAM, Trust Online services 647 United States
11 Van Dijk, Peters, & Ebbers (2008) UTAUT Online services 1225 Netherlands
12 Wang & Liao (2008) DeLone and McLean Online services 119 Taiwan
13 Wangpipatwong, Chutimaskul, &
Papasratorn (2008) TAM Web portal 614 Thailand
14 Chiang (2009) TAM e-voting 281 Taiwan
15 Lean, Zailani, Ramayah, & Fernando
(2009) TAM, DOI
Online services 150 Malaysia
16 Tang, Chung, & Se (2009) TAM, TRA Online services 385 China
17 Teo, Srivastava, & Jiang (2009) DeLone and McLean,
Trust
Online services 214 Singapore
18 Wang & Shih (2009) UTAUT Information Kiosks 244 Taiwan
19 Kollmann & Kayser (2010) UTAUT, CVM E-democracy 232 Germany
20 Alathur, Ilavarasan, & Gupta (2011) Empowerment Online discussion forum 360 India
21 Al-Hujran, Al-dalahmeh, & Aloudat
(2011) TAM, Hofstede
Online services 197 Jordan
22 Al-Sobhi, Weerakkody, & El-
Haddadeh (2011) UTAUT
Online services 624 Saudi Arabia
23 Lin, Fofanah, & Liang (2011) TAM Online services 167 Gambia
24 Rokhman (2011) DOI Online services 751 Indonesia
25 Shyu & Huang (2011) TAM Online services 307 Taiwan
26 Styvén & Wallström (2011) Trust Online services 422 Sweden
27 Alomari, Woods, & Kuldeep (2012) DOI, TAM Online services 400 Jordan
28 Alshehri, Drew, Alhussain, &
Alghamdi (2012) UTAUT, Web quality,
Online services 400 Saudi Arabia
29 Belanche, Casaló, & Flavián (2012) TAM Online services 416 Spain
17 | P a g e
No. Author Model Technologies Sample
size Country
30 Carter & Bélanger (2012) TAM, DOI, Political
Factors e-voting 372 United States
31 Choi & Kim (2012) TAM e-voting 228 United States
32 Lee & Kim (2012) TAM, Social Networks Online discussion forum 1076 South Korea
33 Khan, Moon, Swar, Zo, & Rho (2012) Self-developed Online services 360 Afghanistan
34 Rehman, Esichaikul, & Kamal (2012) TAM, DOI E-informing 138 Pakistan
35 Wang & Lo (2012) TAM, TBP Online services 200 Taiwan
36 Winkler, Hirsch, Trouvilliez, &
Günther (2012) TAM Mobile Reporting Service 200 Germany
37 Alawneh, Al-Refai, & Batiha (2013) Customer satisfaction Web portal 206 Jordan
38 Hung, Chang, & Kuo (2013) TPB Mobile government 331 Taiwan
39 Mou, Atkin, Fu, Lin, & Lau (2013) Self-developed Online discussion forum 181 China
40 Persaud & Persaud (2013) Self-developed Web portal 437 Canada
41 Abu-Shanab (2014) TRA, Trust
Antecedents Model Online services 759 Jordan
42 Al-Hujran, Al-Debei, & Al-Lozi (2014) TAM, TPB E-democracy 189 Jordan
43 Aloudat, Michael, Chen, & Al-Debei
(2014) TAM Mobile government 290 Australia
44 Cegarra-Navarro, Garcia-Perez, &
Moreno-Cegarra (2014) TAM E-informing 307 Spain
45 Liu et al. (2014) TAM Mobile government 409 China
46 Park, Choi, & Rho (2014) Self-developed Online social networks 491 South Korea
47 Abu-Shanab (2015) Self-developed Open government data 869 Jordan
48 Al-Quraan & Abu-Shanab (2015) Self-developed Web portal 248 Jordan
49 Alharbi, Kang, & Hawryszkiewycz
(2015) TBP, Trust
Web portal 770 Saudi Arabia
50 Alrashedi, Persaud, & Kindra (2015) Self-developed E-informing 200 Saudi Arabia
51 Dahi & Ezziane (2015) TAM Online services 845 Abu Dhabi
52 Rabaa’i (2015) TAM Online services 853 Jordan
53 Rana & Dwivedi (2015) SCT Online public grievance
redressal system 419 India
54 Zuiderwijk, Janssen, & Dwivedi
(2015) UTAUT Open government data 111
Several
countries
55 Cai Shuqin, Mastoi, Gul, & Gul (2016) Self-developed Online services 200 Pakistan
56 Piehler, Wirtz, & Daiser (2016) ECT Web portal 477 Germany
57 Rodrigues, Sarabdeen, &
Balasubramanian (2016) UTAUT Online services 380
United Arab
Emirates
58 Seo & Bernsen (2016) SCT, UTAUT, Trust
Municipality e-services 111
Netherlands Municipality e-services 73
Municipality e-services 70
Municipality e-services 83
59 Oni, Oni, Mbarika, & Ayo (2017) CMV, TRA E-democracy 327 Nigeria
60 Schmidthuber, Hilgers, &
Gegenhuber (2017) TAM Open government 466 Austria
Notes: CVM – civic voluntarism model, DOI – diffusion of innovation, GIM – general incentives model, SCT – social
cognitive theory, SERVQUAL – service quality, TAM - technology acceptance model, TPB – theory of planned
behaviour, TRA – theory of reasoned action, UTAUT – unified theory of acceptance and use of technology, ECT –
Expectation confirmation theory
2.2.3 Merging of Variables
When data were extracted, the names of independent and dependent variables were collected
as defined by their original authors. Among the plethora of variables, we faced the problem that

18 | P a g e
many of those variables had different names, but likely stand for similar meanings. We identified
two main scenarios: (i) some constructs were identified as synonyms (i.e.: Internet Trust, Trust
of the Internet, and Trust in Internet were considered jointly as a single construct Trust in
Internet); (ii) several constructs presented longer names (i.e.: Intention to use online function,
and Attitude toward using e-voting system were reduced to Intention to use and Attitude,
respectively). When the names of the constructs were of these forms: Intention to use… [Studied
technology], Attitude towards… [Studied technology], or Trust in… [Studied technology], we
considered them as Intention to use, Attitude, and Trust, respectively. For further details see the
Appendix 2.1. After the merging process, we identified 24 relationships that have been used at
least three or more times. This threshold has been used also in Baptista & Oliveira (2016) and
Rana et al. (2015). Those relationships are used for the weight and meta-analysis in the next
section.
2.3 Results
2.3.1 Descriptive statistics
In these 60 articles, 483 relationships [independent-dependent variable] were identified to be
useful for the weight analysis. For the meta-analysis 11 relationships were dropped because the
articles did not report the correlation coefficient values when they were not significant. They
only reported whether significant or not; therefore, 472 useful relationships were identified for
the meta-analysis. The total number of individuals from the 63 datasets is 22,890. Based on the
description provided in each article, we categorized the type of respondents to obtain a
summarized view. General public in urban areas and University students were the most common
description of the population in the articles (see Table 2.3).
Table 2.3. Distribution of respondents by type (ordered by percentage)
Population type Respondents Percentage (%)
General public - urban area 15,972 69.78
University students 3,904 17.05
Employed people 1,666 7.28
E-business consumers 647 2.83
General public - rural area 590 2.58
Public in scientific conferences 111 0.48
TOTAL 22,890 100

19 | P a g e
In the analysis of distribution of respondents by country and year we take into account
a total of 22,779 respondents, the dataset presented in the article of Zuiderwijk et al. (2015) is
dropped for this particular analysis, because it reports individuals from various nationalities with
a sample size of 111 (public in conferences). Few articles were found until year 2007, but from
year 2008 to 2016 we observe a more regular number of publications per year (Table 2.4), 4.2
on average. The United States and Jordan are the countries that have contributed with the
highest number of articles and respondents. Two thirds of all respondents belong to Asia and
the Middle East. Given the limited number of datasets (63) for a global context study, there is
not enough evidence to identify trends at such a scale. Figure 2.2 represents the world
distribution of the respondents.
Table 2.4. Respondents by country and year (ordered by country name)
Country Year Total
2003 2004 2005 2007 2008 2009 2010 2011 2012 2013 2014 2015 2016 2017
Afghanistan 360 360
Australia 290 290
Austria 466 466
Canada 437 437
China 181 409 590
Gambia 167 167
Germany 232 200 477 909
India 360 419 779
Indonesia 751 751
Jordan 197 400 206 948 1970 3721
Macao 385 385
Malaysia 150 150
Netherlands 1225 337 1562
Nigeria 327 327
Pakistan 138 200 338
Romania 481 481
Saudi
Arabia 624 400 970 1994
Singapore 121 183 214 518
South Korea 1076 491 1567
Spain 416 307 723
Sweden 422 422
Taiwan 119 525 307 531 1482
Thailand 614 614
United Arab
Emirates 845 380 1225
United
States 158 136 313 453 861 600 2521
Total by
Year 158 136 434 636 3514 1060 232 2828 3590 1355 2445 4204 1394 793 22779
Notes: As an exception, Zuiderwijk et al. (2015) were not accounted for in this table, the
respondents (111) of that study were selected in an international conference, and therefore no
particular country was reported.

20 | P a g e
Figure 2.2. World distribution of the respondents analysed in the articles considered for this
study
2.3.2 Weight analysis
Weight is an indicator of the predictive power of independent variables (Jeyaraj et al., 2006).
The weight for a variable is calculated by dividing the number of times an independent variable
was reported to be significant by the total number of times the independent variable was
examined. In our case, we analyse the influence of an independent variable over a dependent
variable; that is, a constructs’ relationship strength. Following the approach implemented in
Baptista & Oliveira (2016) and Rana et al. (2015), we included in our analysis all relationships
that were examined three or more times, counting 24 relationships that comply with this
condition (see Table 2.5).
21 | P a g e
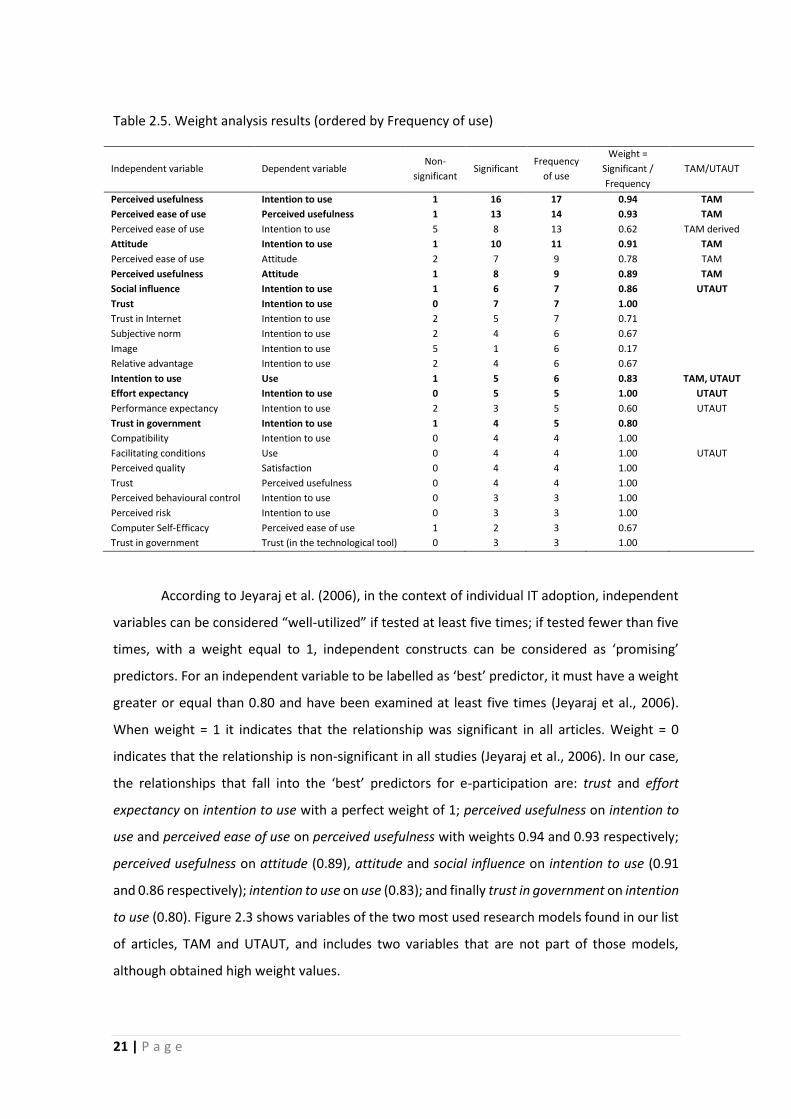
Table 2.5. Weight analysis results (ordered by Frequency of use)
Independent variable Dependent variable Non-
significant Significant
Frequency
of use
Weight =
Significant /
Frequency
TAM/UTAUT
Perceived usefulness Intention to use 1 16 17 0.94 TAM
Perceived ease of use Perceived usefulness 1 13 14 0.93 TAM
Perceived ease of use Intention to use 5 8 13 0.62 TAM derived
Attitude Intention to use 1 10 11 0.91 TAM
Perceived ease of use Attitude 2 7 9 0.78 TAM
Perceived usefulness Attitude 1 8 9 0.89 TAM
Social influence Intention to use 1 6 7 0.86 UTAUT
Trust Intention to use 0 7 7 1.00
Trust in Internet Intention to use 2 5 7 0.71
Subjective norm Intention to use 2 4 6 0.67
Image Intention to use 5 1 6 0.17
Relative advantage Intention to use 2 4 6 0.67
Intention to use Use 1 5 6 0.83 TAM, UTAUT
Effort expectancy Intention to use 0 5 5 1.00 UTAUT
Performance expectancy Intention to use 2 3 5 0.60 UTAUT
Trust in government Intention to use 1 4 5 0.80
Compatibility Intention to use 0 4 4 1.00
Facilitating conditions Use 0 4 4 1.00 UTAUT
Perceived quality Satisfaction 0 4 4 1.00
Trust Perceived usefulness 0 4 4 1.00
Perceived behavioural control Intention to use 0 3 3 1.00
Perceived risk Intention to use 0 3 3 1.00
Computer Self-Efficacy Perceived ease of use 1 2 3 0.67
Trust in government Trust (in the technological tool) 0 3 3 1.00
According to Jeyaraj et al. (2006), in the context of individual IT adoption, independent
variables can be considered “well-utilized” if tested at least five times; if tested fewer than five
times, with a weight equal to 1, independent constructs can be considered as ‘promising’
predictors. For an independent variable to be labelled as ‘best’ predictor, it must have a weight
greater or equal than 0.80 and have been examined at least five times (Jeyaraj et al., 2006).
When weight = 1 it indicates that the relationship was significant in all articles. Weight = 0
indicates that the relationship is non-significant in all studies (Jeyaraj et al., 2006). In our case,
the relationships that fall into the ‘best’ predictors for e-participation are: trust and effort
expectancy on intention to use with a perfect weight of 1; perceived usefulness on intention to
use and perceived ease of use on perceived usefulness with weights 0.94 and 0.93 respectively;
perceived usefulness on attitude (0.89), attitude and social influence on intention to use (0.91
and 0.86 respectively); intention to use on use (0.83); and finally trust in government on intention
to use (0.80). Figure 2.3 shows variables of the two most used research models found in our list
of articles, TAM and UTAUT, and includes two variables that are not part of those models,
although obtained high weight values.
22 | P a g e
Figure 2.3. Resulting model based on TAM and UTAUT. Values represent weights, and the
average β-values are in parentheses. Bold arrows represent the ‘best’ predictors
The relationships that fall into the category of ‘promising’ predictors (Jeyaraj et al.,
2006) of e-participation (examined fewer than five times and weight 1 are: compatibility,
perceived behavioural control and perceived risk on intention to use, facilitating conditions on
use, perceived quality on satisfaction, trust on perceived usefulness, and trust in government on
trust (in the technological tool).
2.3.3 Meta-analysis
One of the main reasons to use meta-analysis is the capacity of this quantitative technique to
compare size of effect across studies, in this case, across relationships between constructs. It
therefore requires a metric to measure those effects (Bowman, 2012). As metrics of effect sizes
that can be used we have: correlation coefficient, regression coefficient, and standardized
regression coefficient (Cooper, 2010). Furthermore, Bowman (2012), claimed that standardized
regression coefficients (β) and correlation coefficients are highly correlated and able to be
substituted one for the other in a quantitative meta-analysis. The input required to perform our

23 | P a g e
meta-analysis is the effect size and the sample size of each relationship that has been identified
three or more times in the articles.
We use the random effect models of error to calculate the variability in the effect size
estimated across studies (Cooper, 2010). As discussed in Cooper (2010), the fixed effect models
consider only variation within studies due to sampling of participations. Random effect models
take into consideration both the variance within a study and the variance between studies
methods. Several meta-analysis articles have adopted the random effect model for their
analysis, including for instance: Talò et al. (2014), random effect model was chosen because the
studies were heterogeneous from each other; Šumak, Heričko, & Pušnik (2011), conducted on
random effect basis, assuming that every population is likely to have a different effect size; King
& He (2006), adopted random effect model under the assumption that samples in individual
studies are taken from populations that had varying effect sizes; and finally, Dwivedi et al.
(2011), used the random effect model assuming that is more realistic in accordance with the
articles they examined. The 24 most often evaluated relationships are shown in Table 2.6. We
used the free tool software Meta-Essentials (Van Rhee, Suurmond, & Hak, 2015) for calculations
and graphics. The average of β-values (correlation coefficient between independent and
dependent variable) and the total sample size is previously calculated in a spreadsheet and then
provided as input for the meta-analytic software.
A forest plot (Hak, van Rhee, & Suurmond, 2016) is the graphical representation of the
meta-analysis. Figure 2.4 presents the forest plot of the meta-analysis of the set of studies in
Table 2.6. The X-axis represent the effect size (average β), the blue bullets represent the effect
size for each individual relationship and the line across the blue dot is the confidence interval
for that relationship at 95%. To generate the forest plot, the relationships are arranged from the
biggest to the smallest in terms of cumulative sample size. When the confidence interval lines
are entirely on the positive side (> 0) the relationships are considered statistically significant;
when the confidence interval includes zero, the relationship is not statistically significant. The
plot shows that all the relationships, but trust in government on trust, are statistically significant.
We also test for heterogeneity in the dataset, which is assessed by the statistic I2 (Higgins &
Thompson, 2002). I2 indicate the percentage of variance between studies produced by
heterogeneity rather than by chance. The results show a high level of heterogeneity for the list
of variables in Table 2.6 (I2 = 0.97).

24 | P a g e
Table 2.6. Meta-analysis results (ordered by frequency)
Independent variable Dependent variable Frequency Average
β
∑ sample
size
p-
value z-value
Confidence
interval (95%)
Low - High
Perceived usefulness Intention to use 17 0.32 4895 0.00 23.33 0.30 0.35
Perceived ease of use Perceived usefulness 14 0.47 5091 0.00 36.37 0.45 0.49
Perceived ease of use Intention to use 13 0.16 4475 0.00 10.81 0.13 0.19
Attitude Intention to use 10 0.38 3277 0.00 22.82 0.35 0.41
Perceived ease of use Attitude 9 0.19 3057 0.00 10.76 0.16 0.23
Perceived usefulness Attitude 9 0.39 3048 0.00 22.90 0.36 0.42
Social influence Intention to use 7 0.19 2798 0.00 10.28 0.16 0.23
Trust Intention to use 7 0.33 2963 0.00 18.44 0.29 0.36
Trust in Internet Intention to use 7 0.14 2106 0.00 6.60 0.10 0.18
Intention to use Use 6 0.25 2959 0.00 14.07 0.22 0.29
Relative advantage Intention to use 6 0.30 1722 0.00 12.94 0.26 0.34
Subjective norm Intention to use 6 0.28 2003 0.00 12.83 0.24 0.32
Image Intention to use 5 0.07 1350 0.00 2.65 0.02 0.13
Effort expectancy Intention to use 5 0.16 2436 0.00 7.98 0.12 0.20
Trust in government Intention to use 5 0.22 1110 0.00 7.39 0.16 0.27
Performance
expectancy Intention to use 4 0.39 1211 0.00 14.31 0.34 0.44
Compatibility Intention to use 4 0.35 1200 0.00 12.55 0.30 0.40
Facilitating conditions Use 4 0.29 1500 0.00 11.68 0.25 0.34
Perceived quality Satisfaction 4 0.39 1014 0.00 13.21 0.34 0.44
Trust Perceived usefulness 4 0.36 1834 0.00 15.88 0.31 0.39
Computer Self-
Efficacy Perceived ease of use 3 0.23 2312 0.00 11.10 0.19 0.27
Perceived behavioural
control Intention to use 3 0.22 631 0.00 5.54 0.14 0.29
Perceived risk Intention to use 3 0.03 463 0.27 0.60 -0.06 0.12
Trust in government Trust (technological
tool) 3 0.30 1743 0.00 12.83 0.25 0.34
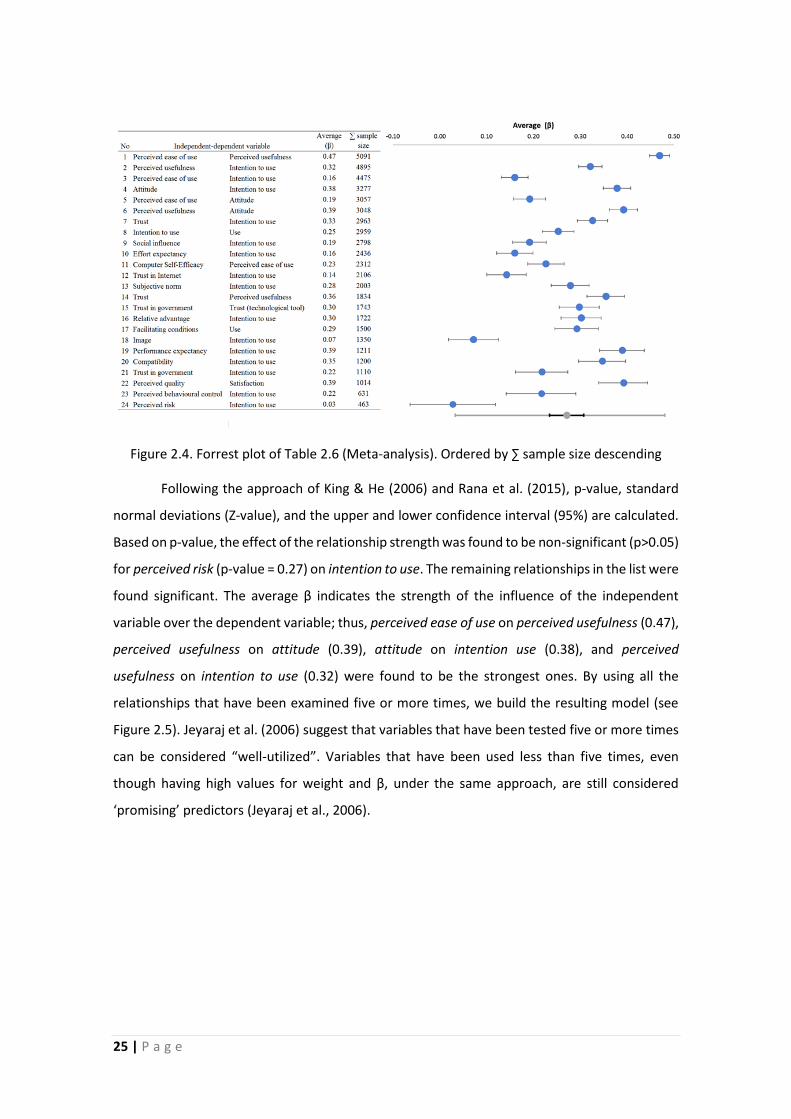
25 | P a g e
Figure 2.4. Forrest plot of Table 2.6 (Meta-analysis). Ordered by ∑ sample size descending
Following the approach of King & He (2006) and Rana et al. (2015), p-value, standard
normal deviations (Z-value), and the upper and lower confidence interval (95%) are calculated.
Based on p-value, the effect of the relationship strength was found to be non-significant (p>0.05)
for perceived risk (p-value = 0.27) on intention to use. The remaining relationships in the list were
found significant. The average β indicates the strength of the influence of the independent
variable over the dependent variable; thus, perceived ease of use on perceived usefulness (0.47),
perceived usefulness on attitude (0.39), attitude on intention use (0.38), and perceived
usefulness on intention to use (0.32) were found to be the strongest ones. By using all the
relationships that have been examined five or more times, we build the resulting model (see
Figure 2.5). Jeyaraj et al. (2006) suggest that variables that have been tested five or more times
can be considered “well-utilized”. Variables that have been used less than five times, even
though having high values for weight and β, under the same approach, are still considered
‘promising’ predictors (Jeyaraj et al., 2006).
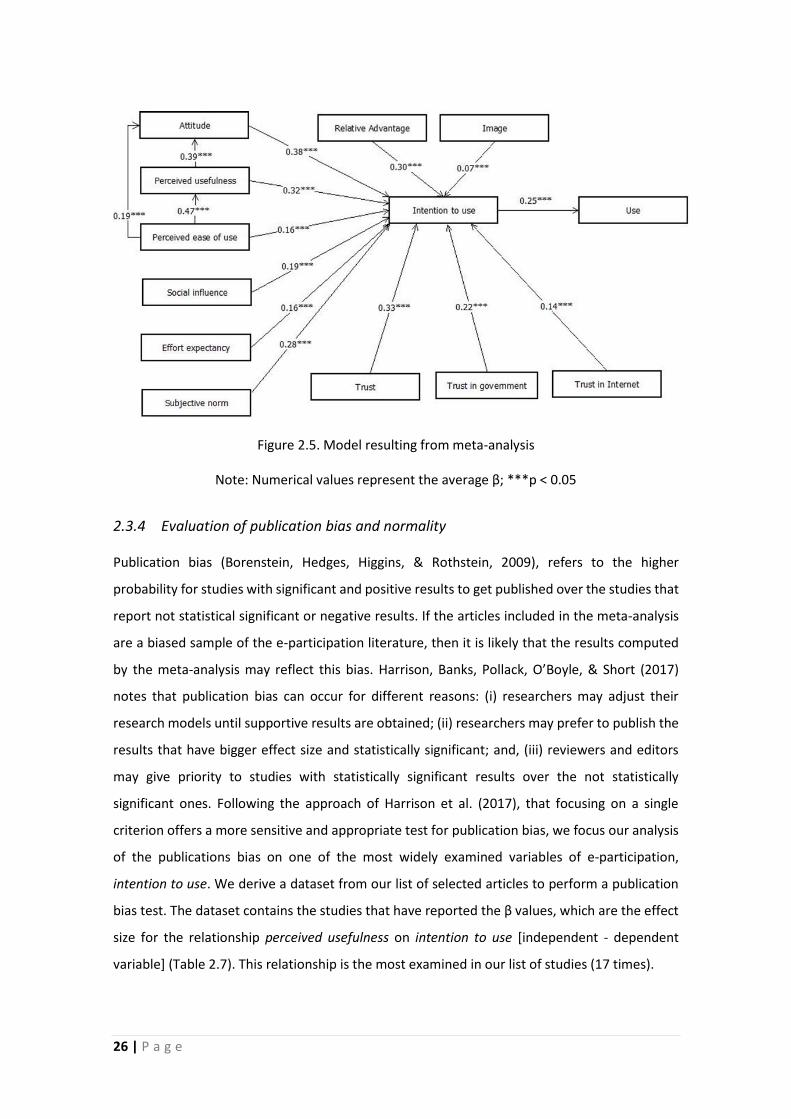
26 | P a g e
Figure 2.5. Model resulting from meta-analysis
Note: Numerical values represent the average β; ***p < 0.05
2.3.4 Evaluation of publication bias and normality
Publication bias (Borenstein, Hedges, Higgins, & Rothstein, 2009), refers to the higher
probability for studies with significant and positive results to get published over the studies that
report not statistical significant or negative results. If the articles included in the meta-analysis
are a biased sample of the e-participation literature, then it is likely that the results computed
by the meta-analysis may reflect this bias. Harrison, Banks, Pollack, O’Boyle, & Short (2017)
notes that publication bias can occur for different reasons: (i) researchers may adjust their
research models until supportive results are obtained; (ii) researchers may prefer to publish the
results that have bigger effect size and statistically significant; and, (iii) reviewers and editors
may give priority to studies with statistically significant results over the not statistically
significant ones. Following the approach of Harrison et al. (2017), that focusing on a single
criterion offers a more sensitive and appropriate test for publication bias, we focus our analysis
of the publications bias on one of the most widely examined variables of e-participation,
intention to use. We derive a dataset from our list of selected articles to perform a publication
bias test. The dataset contains the studies that have reported the β values, which are the effect
size for the relationship perceived usefulness on intention to use [independent - dependent
variable] (Table 2.7). This relationship is the most examined in our list of studies (17 times).
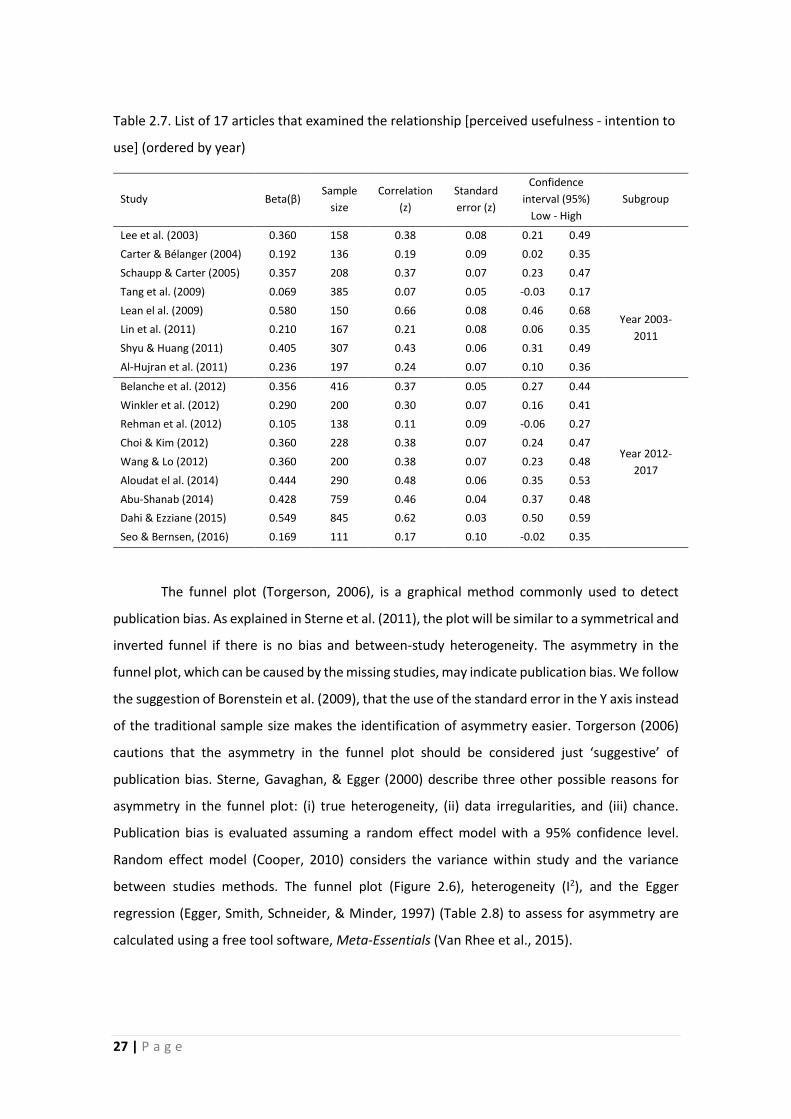
27 | P a g e
Table 2.7. List of 17 articles that examined the relationship [perceived usefulness - intention to
use] (ordered by year)
Study Beta(β) Sample
size
Correlation
(z)
Standard
error (z)
Confidence
interval (95%)
Low - High
Subgroup
Lee et al. (2003) 0.360 158 0.38 0.08 0.21 0.49
Year 2003-
2011
Carter & Bélanger (2004) 0.192 136 0.19 0.09 0.02 0.35
Schaupp & Carter (2005) 0.357 208 0.37 0.07 0.23 0.47
Tang et al. (2009) 0.069 385 0.07 0.05 -0.03 0.17
Lean el al. (2009) 0.580 150 0.66 0.08 0.46 0.68
Lin et al. (2011) 0.210 167 0.21 0.08 0.06 0.35
Shyu & Huang (2011) 0.405 307 0.43 0.06 0.31 0.49
Al-Hujran et al. (2011) 0.236 197 0.24 0.07 0.10 0.36
Belanche et al. (2012) 0.356 416 0.37 0.05 0.27 0.44
Year 2012-
2017
Winkler et al. (2012) 0.290 200 0.30 0.07 0.16 0.41
Rehman et al. (2012) 0.105 138 0.11 0.09 -0.06 0.27
Choi & Kim (2012) 0.360 228 0.38 0.07 0.24 0.47
Wang & Lo (2012) 0.360 200 0.38 0.07 0.23 0.48
Aloudat el al. (2014) 0.444 290 0.48 0.06 0.35 0.53
Abu-Shanab (2014) 0.428 759 0.46 0.04 0.37 0.48
Dahi & Ezziane (2015) 0.549 845 0.62 0.03 0.50 0.59
Seo & Bernsen, (2016) 0.169 111 0.17 0.10 -0.02 0.35
The funnel plot (Torgerson, 2006), is a graphical method commonly used to detect
publication bias. As explained in Sterne et al. (2011), the plot will be similar to a symmetrical and
inverted funnel if there is no bias and between-study heterogeneity. The asymmetry in the
funnel plot, which can be caused by the missing studies, may indicate publication bias. We follow
the suggestion of Borenstein et al. (2009), that the use of the standard error in the Y axis instead
of the traditional sample size makes the identification of asymmetry easier. Torgerson (2006)
cautions that the asymmetry in the funnel plot should be considered just ‘suggestive’ of
publication bias. Sterne, Gavaghan, & Egger (2000) describe three other possible reasons for
asymmetry in the funnel plot: (i) true heterogeneity, (ii) data irregularities, and (iii) chance.
Publication bias is evaluated assuming a random effect model with a 95% confidence level.
Random effect model (Cooper, 2010) considers the variance within study and the variance
between studies methods. The funnel plot (Figure 2.6), heterogeneity (I2), and the Egger
regression (Egger, Smith, Schneider, & Minder, 1997) (Table 2.8) to assess for asymmetry are
calculated using a free tool software, Meta-Essentials (Van Rhee et al., 2015).

28 | P a g e
Figure 2.6. Funnel plot of studies that examined [perceived usefulness - intention to use]
Note: Between sample heterogeneity I2 = 87.91%. CES = Combined effect size
Table 2.8. Egger Regression for asymmetry
Estimate SE CI LL CI UL
Intercept -10.64 6.01 -23.39 2.10
Slope 2.22 1.06 -0.03 4.47
Note: t test = -1.77; p-value = 0.10. SE=Standard error. CI LL=Confidence interval lower level. CI
UL=Confidence interval upper level.
Heterogeneity is assessed by the statistic I2 (Higgins & Thompson, 2002). The results
show a high level of heterogeneity (87.91 %) in the data set of studies. Even though having a
high level of heterogeneity may not produce a funnel shape in the plot (Terrin, Schmid, & Lau,
2005), Sterne et al. (2011) suggest that the “funnel plot will be symmetrical but with additional
horizontal scatter”. To provide a more accurate assessment of the asymmetry, rather than the
visual evaluation of the funnel plot, Egger regression is also presented in the results, which
resulted not significant for asymmetry (p-value = 0.10). In summary, there is no evidence to
suggest that there is a publication bias in the selected data set of e-participation adoption
studies. Nevertheless, there is a high level of heterogeneity. High level of heterogeneity in our

29 | P a g e
study coincides with studies like Harrison et al.(2017), that evaluated a set of meta-analysis
articles in the field of strategic management research, and I2 was found above 60% for most of
the meta-analysis studies.
Given the high level of heterogeneity of the dataset (Table 2.7), we perform a subgroup
analysis to examine if the level of heterogeneity decreases, the first group are the studies from
2003 to 2011 (8 articles) and the second group are the studies from 2012 to 2017 (9 articles).
Results of the subgroup analysis are shown in Table 2.9, heterogeneity I2 remains very high (0.86)
for each of the subgroups.
The forest plot of the 17 articles that examined the relationship perceived usefulness on
intention to use is presented in Figure 2.7. The plot shows three not significant studies in the
meta-analysis of this dataset (studies No. 1, 15, and 17). We can notice a small drift to the left
when the studies of smaller sample size are added. The drift can be an indicator of publication
bias (Harrison et al., 2017) produced by the inclusion of studies with small sample size.
Table 2.9. Subgroup analysis of studies that examined [perceived usefulness - intention to use]
Subgroup name Correlation CI Lower limit CI Upper limit I2
Studies year 2003-2011 0.31 0.16 0.44 0.86
Studies year 2012-2017 0.36 0.25 0.46 0.86
Figure 2.7. Forest plot of the 17 articles that examined [perceived usefulness - intention to
use]. Ordered by sample size descending
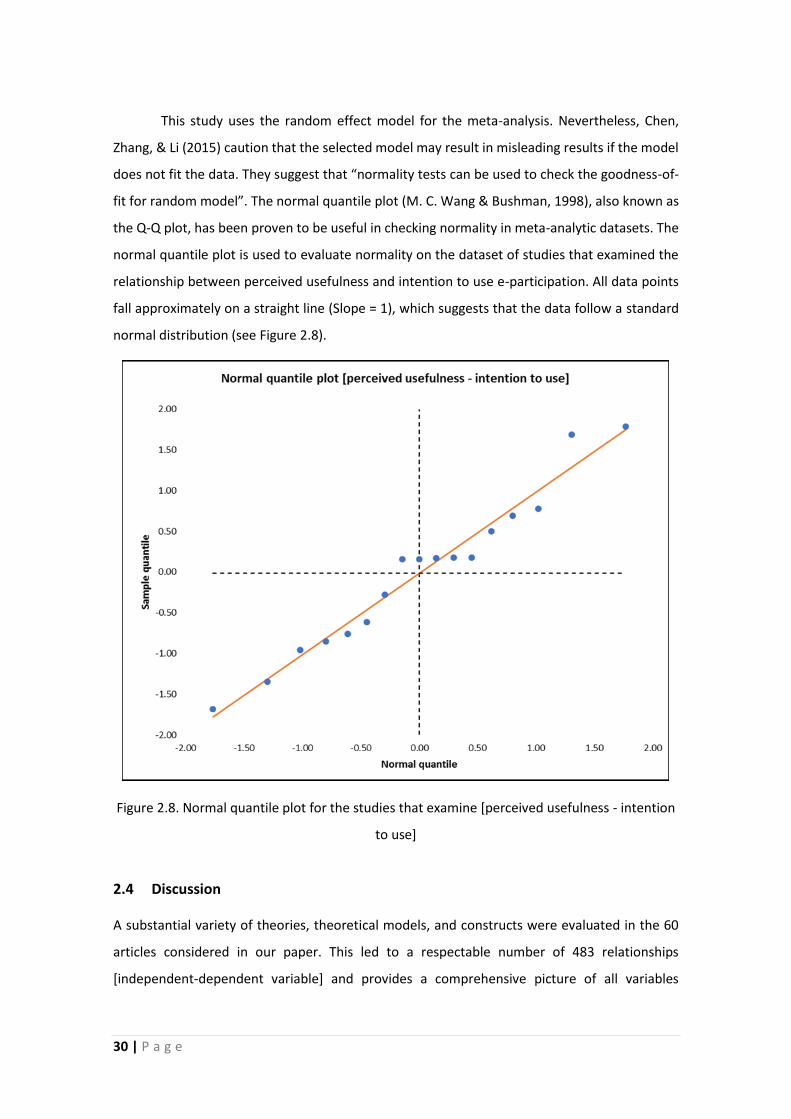
30 | P a g e
This study uses the random effect model for the meta-analysis. Nevertheless, Chen,
Zhang, & Li (2015) caution that the selected model may result in misleading results if the model
does not fit the data. They suggest that “normality tests can be used to check the goodness-of-
fit for random model”. The normal quantile plot (M. C. Wang & Bushman, 1998), also known as
the Q-Q plot, has been proven to be useful in checking normality in meta-analytic datasets. The
normal quantile plot is used to evaluate normality on the dataset of studies that examined the
relationship between perceived usefulness and intention to use e-participation. All data points
fall approximately on a straight line (Slope = 1), which suggests that the data follow a standard
normal distribution (see Figure 2.8).
Figure 2.8. Normal quantile plot for the studies that examine [perceived usefulness - intention
to use]
2.4 Discussion
A substantial variety of theories, theoretical models, and constructs were evaluated in the 60
articles considered in our paper. This led to a respectable number of 483 relationships
[independent-dependent variable] and provides a comprehensive picture of all variables

31 | P a g e
analysed in e-participation adoption research in the last 17 years, which may lay the foundations
for future research (Webster & Watson, 2002). The analysis of the correlations in those 483
relationships through weight analysis revealed the ‘best’ and ‘promising’ predictors (Jeyaraj et
al., 2006) in the analysis of e-participation. Meta-analysis complemented these findings by
providing the significance level, the level of heterogeneity I2 of the dataset, and an analysis of
publication bias using the forest plot and funnel plot.
‘Best’ predictors include perceived usefulness, attitude, social influence, trust, effort
expectancy, and trust in government on intention to use, perceived ease of use on perceived
usefulness, perceived usefulness on attitude, and intention to use on use. All those relationships
identified as best predictors in the weight analysis were also found to be statistically significant
in the meta-analysis, coinciding with the claim of Baptista & Oliveira (2016) and Rana et al.
(2015) about the predictors, that is, the higher its weight, the higher the probability that it
achieves significance in the meta-analysis. All of these predictors, except trust and trust in
government, are part of either TAM (Davis, 1989) and UTAUT (Venkatesh et al., 2003). Trust on
intention to use (weight 1) was also identified as a strong predictor in other contexts: Mobile
banking (Goncalo Baptista & Oliveira, 2016), e-government (Rana et al., 2015), mobile
commerce (L. Zhang, Zhu, & Liu, 2012), social network services (Shin, 2010), and health
informatics services (Shin, Lee, & Hwang, 2017). The importance of trust for e-participation was
also highlighted by Panopoulou, Tambouris, & Tarabanis (2014), as one of the success factors
for e-participation. Building trust is a challenging matter, however. The increase of citizen’s trust
can lead to satisfaction and continuance intention to use over time (Shin et al., 2017).
Relationships in the weight analysis that were examined three or four times and
obtained weight = 1 are considered ‘promising’ predictors (Jeyaraj et al., 2006): compatibility,
perceived behavioural control, and perceived risk on intention to use, facilitating conditions on
use, perceived quality on satisfaction, trust on perceived usefulness, and trust in government on
trust. The promising predictors need further analysis before being considered as best predictors
(Jeyaraj et al., 2006). However, results in meta-analysis and low value of average β for perceived
risk on intention to use suggest that perceived risk is a weak predictor of e-participation
adoption. An interesting relationship from the set of promising predictors is trust in government
as predictor trust on the e-participation system, that showed satisfactory results in terms of
weight, significance and average β. This finding may suggest that when the citizens have a higher
level of trust in their governments, are also more willing to trust, and indeed use, the e-
participation systems available from that government.

32 | P a g e
Publication bias (Borenstein et al., 2009) was not conclusive by the analysis of the funnel
plot (Figure 2.6) because the high level of heterogeneity (I2 = 0.879) in the dataset (Table 2.7).
As suggested by Hak et al. (2016), when exist a high level of heterogeneity, results in the funnel
plot are not very clear for interpretation. The high level of heterogeneity can be due to the use
of different research models, different variables, different populations, and different study
protocols to evaluate e-participation adoption. We also used a second approach to test for
publication bias, the forest plot (Figure 2.7) of the 17 studies that analysed the relationship
[perceived usefulness – intention to use]. In the forest plot we can observe a slight drift toward
the left when studies with smaller sample are added to the list, which may indicate a publication
bias (Harrison et al., 2017). However, we consider that there is not enough evidence to conclude
that there is publication bias in the set of studies. As suggested by Harrison et al. (2017) in the
context of management research, at least a sample of 20 studies should be analysed to obtain
clear results about the publication bias. In other scientific fields, as the medicine, publication
bias can be assessed with smaller datasets of studies, as few as 10 studies (Sterne et al., 2011).
In the case of e-participation research would be more appropriate to evaluate a sample of at
least 20 studies that analyse the same variable.
Research on e-participation adoption has used TAM, UTAUT, combinations of TAM and
UTAUT with other theories, and self-developed research models (see Table 2.2). Therefore, it is
not a surprise that the most frequently evaluated constructs across the studies also belong to
TAM and UTAUT or are adapted from them. Although, not all constructs from these well-known
theories resulted always significant or demonstrated to be strong predictors of e-participation
(see Figure 2.3). This is the case of perceived ease of use on attitude (TAM), and perceived ease
of use on intention to use (adaptation of TAM), which did not show a good performance in weight
analysis and obtained low average β values (0.19 and 0.16 respectively). On the other side,
perceived ease of use has the strongest average β (0.47) on perceived usefulness, which in turn
is a strong predictor of attitude and intention to use. The explanation for these seemingly
opposite results may be due to the fact that the solely perception that the e-participation system
is easy to use is not enough motivation to trigger the intention to use the system in the citizen.
Maybe there are other factors inherent to the participation itself -and not to the technological
tool- that can produce stronger motivation in the citizen to use e-participation, for instance,
trust in the public institutions, sense of community (Talò et al., 2014), or the perception of the
citizen that is truly making a contribution to a given community by using e-participation
(empowerment). Perceived usefulness may encompass, at least partially, those above-
33 | P a g e
mentioned factors, thus demonstrating to be a strong motivator for intention to use and
attitude.
Interestingly, effort expectancy on intention to use, a relationship of the UTAUT model
(Venkatesh et al., 2003) that was originally derived from perceived ease of use from TAM (Davis,
1989), has been found significant and examined five times in the studies. Due to the low number
of times that perceived ease of use has been examined in the articles, there is not enough
evidence to claim that effort expectancy performs better than its predecessor perceived ease of
use in the study of e-participation adoption.
Other relationships evaluated five or more times were found to be significant in the
meta-analysis but obtained a weight slightly below 0.80. This is the case for perceived ease of
use on attitude (weight = 0.78), relative advantage on intention to use (weight = 0.67), and trust
in Internet on intention to use (weight = 0.67). For those variables, further research is needed to
assess the impact in the prediction of e-participation adoption. Variables such as performance
expectancy (weight = 0.60), perceived ease of use (weight = 0.62) and image (weight = 0.17) on
intention to use ranked considerably lower from the threshold of 0.80. Even though they show
statistical significance in the meta-analysis, their low weight values may discourage their
continued use in future studies.
2.5 Implications
2.5.1 Implications for theory
First, the synthesis of cumulative influence of an independent variable on a dependent variable
in the form of weight analysis, and the evaluation of significance in the meta-analysis, allowed
us to derive a model of best predictors of intention to use and actual use of e-participation.
Results presented in this paper confirm the high performance of all TAM and UTAUT constructs
for research on e-participation adoption, except for perceived ease of use on intention to use,
which resulted in low performance. Trust and trust in government, without being part of UTAUT
or TAM, are also part of the best predictors of intention to use e-participation. These findings
suggest continuing the use of trust and trust in government on intention to use in future research
of e-participation adoption.
Second, weight and meta-analysis provide the performance of a wide-ranging view of
the relationships [independent-dependent variable] used in models to study e-participation
34 | P a g e
adoption at individual level, consequently allowing researchers to identify trends, and
highlighting issues in the use of some constructs. For instance, even though perceived ease of
use and image were found to be significant and frequently used in literature, their weight is
noticeably low. Researchers can use the findings of this study as a starting point for a more
accurate and effective selection of constructs in the analysis of e-participation adoption,
providing additional criteria whether to include or not a variable in the research model. For
example, on one hand, variables that showed high frequency of use, low weight, and non-
significance, may be excluded from further use; on the other hand, promising predictors require
further analysis to become best predictors, and their continued use may therefore be
appropriate.
2.5.2 Implications for practice
Findings in this study raise important implications for governments and institutions aiming to
implement e-participation platforms. Perceived usefulness, attitude, social influence, trust, and
effort expectancy on intention to use e-participation technologies resulted strong predictors in
the weight analysis. The meta-analysis confirms the significance. This suggest that governments
should put special attention on strategies that help to preserve positive attitude, the perception
that the platform is useful, and trust of citizens in the long-term. The implementation of e-
participation should not only lie on the use of cutting edge technology and innovative interface
design, solid back office processes are also recommended for e-participation platforms. For
instance, when users give opinions on forums or vote electronically, feedback should be
provided in a reasonable timeframe; this may contribute to improve the perception of
usefulness and preserve trust of citizens.
The high weight value of perceived usefulness on intention to use, but low weight value
of perceived ease of use on intention to use may suggest that citizens do not really find difficulties
in the use of e-participation, rather, citizens probably are more focused on the contributions
that they can make to a given community through e-participation, for instance, submitting a
project proposal to a government agency or giving an electronic vote for a project to be
implemented. The action to vote electronically, for instance, by SMS message may not be a
technical challenge for citizens (perceived ease of use) but is the final impact of the given vote
(perceived usefulness) that really motivates the intention to use e-participation. This implies that
governments that implement e-participation systems should make sure that the citizens have a
clear understanding about the impact of using e-participation to contribute for the community.

35 | P a g e
Due to voluntary nature of e-participation, ease and simplicity for general public users
is strongly advised to promote the diffusion of this technological platform amongst the citizens.
Even though, implementation and promotion of e-participation can lead to a better governance
in the long term, Andersen, Henriksen, Secher, & Medaglia (2007) highlight the importance for
public agencies to be aware of the significant administrative costs to support e-participation.
Furthermore, citizen participation involves a sense of community (Chavis & Wandersman, 1990),
thus social influence resulted an important predictor of the intention to use e-participation. This
suggest that governments should actively promote and socialize its e-participation tools among
the citizens.
2.6 Conclusions
We carried out a weight and meta-analysis of the constructs utilized in the evaluation of
theoretical models of e-participation adoption amongst 60 articles published in the last 17 years.
This study presents an extensive vision of the predictors and their cumulative synthesis through
weight and meta-analysis, serving as the foundation for future research and providing additional
criteria for researchers to accurately select the constructs to be included in research models to
analyse e-participation adoption. The article identifies ‘best’ and ‘promising’ predictors (Jeyaraj
et al., 2006) of e-participation adoption. The constructs: perceived usefulness, attitude, social
influence, trust, effort expectancy, and trust in government on intention to use; perceived ease
of use on perceived usefulness; perceived usefulness on attitude; and intention to use on use are
considered the best predictors. This suggests that public agencies, authorities, and governments
that plan to implement e-participation platforms should endeavour to preserve the positive
attitude, perception of usefulness, and trust of citizens in the long-term participative processes.
Moreover, best predictors achieved statistically significant results in most of the studies in which
they were used, and therefore represent a safe side for future research in e-participation
intention to use and use. The constructs identified as ‘promising’ predictors: compatibility and
perceived behavioural control on intention to use, facilitating conditions on use, perceived
quality on satisfaction, trust on perceived usefulness, and trust in government on trust (in the
technological tool), reached a perfect weight of 1, however, due to low frequency of usage in
research models, still more research is needed for the promising predictors may be considered
‘best’ predictors.
36 | P a g e
2.7 Limitations and Future Research
The 60 articles used for the weight and meta-analysis in this study are a small portion of
the existing literature on e-participation adoption. There are two main factors in the literature
search that limit the results: (i) The language of the articles is limited to English, which excludes
all the significant research conducted in other languages; and (ii) as for the calculations, the beta
coefficients and sample size are needed, the type of selected articles was of quantitative type,
excluding all the qualitative articles that are the majority retrieved from the database search.
Due to the relatively limited sample size, conclusions regarding the trends and patterns should
be interpreted with caution.
Since most of the studies did not report the items used in their surveys, it is not possible
to fully identify whether a construct is already used in other articles. Hence, the merging process
has its limitations. Not all variables with similar names, apparently standing for analogous
meanings, could be merged due to the lack of details in the articles that allow us to determine
their equivalence (see Appendix 2.1). For instance, trust, in some articles is not entirely clear
whether it refers to the technological tool, to the authorities, or to the whole process.
More than the half of the articles analysed do not describe the technologies evaluated
in sufficient detail, nor their specific interaction with citizens. For example, of the 60 studies, 25
described them only as online services and seven described them as web portals. Lack of
detailed description prevents us from deepening the research of more tailored adoption models
for different levels of e-participation. The use of moderator variables (e.g., cultural dimensions
or demographics, and second-order constructs) was scarce in the quantitative articles. As a
result, moderator analysis and second-order constructs analysis were not incorporated in this
study.
Hoftede, Hofstede, & Minkov (2010) have stated that culture is for humans what
software is for computers. Culture varies from country to country. The inclusion of new or barely
explored variables such as cultural dimensions in primary studies is suggested for future
research on e-participation adoption. We note that e-participation has several levels of citizen
involvement, from simply being informed to expressing opinion and voting. Therefore, a
comparative meta-analysis between incremental levels of e-participation is recommended. This
may provide interesting insights about whether the factors that influence e-participation have
the same impact across the different levels.
37 | P a g e
Chaper 3 - Citizen’s intention to use and recommend e-participation:
Drawing upon UTAUT and citizen empowerment
3.1 Introduction
E-participation is defined as a branch of e-government with special focus on citizen engagement
for deliberation and decision orientation (Welch, 2012). For instance, the online participatory
budgeting platforms (Sintomer et al., 2013) allow citizens to decide on how to spend a part of
the public budget managed by local governments. Engaging citizens in consultation and
decision-making has a prominent importance to promote a more efficient and inclusive society
(Sæbø et al., 2008), citizen participation in digital governance (Sanford & Rose, 2007),
transparency, efficiency, and quality of public services (Royo & Yetano, 2015). Electronic
consultation and decision-making tools are considered at the highest level of e-participation
from the perspective of empowering citizens. However, the implementation of e-participation
is still very challenging and vulnerable to failure due to the risk of low adoption rates on the part
of citizens (Kersting, 2016; Omar et al., 2017). The literature does not provide a strong
theoretical basis to support successful implementations and adoption of e-participation.
Beyond the potential benefits of involving citizens in consultation and decision-making,
e-participation also has the potential of reducing the costs for democratic and decision-making
processes (Vragov & Kumar, 2013). Traditional paper balloting for the same purpose would
demand many more resources from both the citizens (time) and the local governments (money).
Despite the latest growing number of implementations of the e-participation tools; significant
adoption and tangible positive outcomes from citizen interaction with e-participation remain at
low levels. For instance, comparing the levels of e-participation within the top 25 countries
ranked by the United Nations in 2014 and 2016, the utilization level rose from 36% (United
Nations, 2014) to 62% (United Nations, 2016), but only 20% of the United Nations member
states report that “e-consultation outcomes have resulted in new policy decisions, regulation or
service” (United Nations, 2016).
Previous studies of the factors that drive the adoption of e-participation have used
theoretical models in the context of technology adoption (Naranjo Zolotov et al., 2018). Using
only theoretical models of technology adoption may not provide a strong theoretical basis of
the general factors that drive the adoption of e-participation. For example, Chiang (2009) used
TAM (technology acceptance model) (Davis, 1989) to examine trust in the e-voting system; and
38 | P a g e
Wang & Shih (2009) studied the use of information kiosks by using UTAUT (Venkatesh et al.,
2003). Building theory on e-participation adoption is still challenging for researchers due to its
interdisciplinary and highly dynamic nature (Medaglia, 2012; Susha & Grönlund, 2012). Using
technology adoption models alone may not be enough if we wish to analyse the specific
characteristics of e-participation. Venkatesh et al. (2016) suggest that “it is necessary to draw on
other theoretical perspectives to identify and examine specific characteristics” of e-participation.
Even though citizen empowerment has been identified as a key factor for public participation
and engagement (Kang, 2014), little research has analysed the perspective of empowerment in
the adoption of e-participation for public consultation and decision-making. Consequently, the
integration of UTAUT and empowerment in a research model may bring valuable insights on e-
participation adoption drivers.
Our work makes three main contributions to the enrichment of the theoretical body of
literature in the e-participation context. First, we develop a research model that integrates
UTAUT and empowerment theory. The research model allows us to identify that the feeling of
empowerment in citizens is indeed a strong motivator of intention to use and intention to
recommend e-participation. Second, we analyse how the integration of empowerment with
UTAUT increases the intention to use and to recommend e-participation. And third, we
contribute to the construct clarity of second-order multidimensional constructs in the context
of e-participation. Moreover, this study yields insights for local governments seeking to
implement or extend the scope of e-participation.
The rest of the paper is organized as follows: Section 2 provides a literature review of
the e-participation context and the description of the theories employed in the research model.
Section 3 contains the research model and hypotheses development. Section 4 describes the
methods used and the data collected. Section 5 presents the data analysis and results. Then,
Section 6 discusses the findings along with theoretical and practical implications, limitations, and
future research. Finally, a conclusion presents final thoughts.
3.2 Background and hypothesis development
3.2.1 Contextualizing e-participation adoption
The United Nations E-Government Survey 2014 report (United Nations, 2014) includes e-
participation as one of e-government’s core components and describes a three-level e-

39 | P a g e
participation model: e-information, e-consultation, and e-decision-making, thus moving from
“passive” to “active” engagement with citizens (Kassen, 2017). The highest level in the e-
participation model, the decision-making, requires an active engagement and involvement of
the citizens in the long-term scenario for its success, which means that citizens should be highly
motivated to devote their time to activities such as deliberation, decision-making, and voting
using information and communication technologies (ICT). Today, most governments have
adopted one or more participation technologies to interact with citizens, for instance, open data
technologies (Zuiderwijk et al., 2015), information kiosks (Y.-S. Wang & Shih, 2009), and e-voting
(Chiang, 2009). Research shows that the adoption of participative technologies facilitates
interaction and collaboration between government and citizens (Welch, 2012). However,
interaction does not necessarily mean achieving consulting and decision-making levels. Those
levels of e-participation may require citizen empowerment.
Previous studies discussed important factors that can influence the process of e-
participation adoption, although they did not address the issue of what it is that would attain
consulting and decision-making levels. For instance, Oliveira & Welch (2013) studied the use of
social media in government for improving public service and engagement and found that the
organizational factors, such as innovativeness, technological capacity, and external influence,
predict the use of social media for different tasks; citizen satisfaction, trust in government, and
the use of e-participation were found to be interrelated (Welch et al., 2005); Schaupp et al.
(2010) found evidence that once trust is lost, adoption of e-government and e-participation
becomes very challenging; digital divide (Cruz-Jesus, Oliveira, & Bacao, 2012), such as lack of
computer literacy or limited access to infrastructure and internet connection, and accessibility
(J. Martins, Gonçalves, & Branco, 2017) can represent important barriers to adoption (Janssen,
Charalabidis, & Zuiderwijk, 2012); political factors (Oni et al., 2017) such as political awareness,
political efficacy, and political culture have been found to play an important role in e-
participation usage.
The literature suggests that citizen empowerment is one of the key ingredients for
successful citizen participation over time in consulting and decision-making processes (Kang,
2014; Macintosh, 2004; Omar et al., 2017). Empowering citizens implies allowing them to
influence the decisions made by the government. Nevertheless, it is not entirely clear how the
perception of empowerment affects the behavioural intention to use and recommend e-
participation technologies. Most studies rely on single theories from information technology,
which does not allow analysing specific effects from e-participation, such as citizen
40 | P a g e
empowerment. On the other hand, UTAUT allows the analysis of the drivers of technology
adoption in complex scenarios and can shed light on both the information technology factors
and social factors (Zuiderwijk et al., 2015). Analysing the drivers of the behavioural intention to
use and intention to recommend e-participation from both the empowerment perspective and
UTAUT can provide insights for governments to achieve higher levels of citizen involvement in
consulting and decision processes and exploit the potential benefits of citizen electronic
participation. In this study we address these issues by integrating UTAUT constructs with
empowerment theory to investigate the effect of these factors on the intention to use and
recommend e-participation.
3.2.2 UTAUT
The unified theory of acceptance and use of technology – UTAUT (Venkatesh et al., 2003) is a
theoretical model that has been widely used in the study of technology acceptance and
adoption. UTAUT is an appropriate theory to study e-participation adoption for three main
reasons: first, according to Venkatesh et al. (2003), UTAUT is suitable to study complex
organizational technologies. E-participation can be considered a complex technological context
due to the number of different tools available (Sæbø et al., 2008), different types and amounts
of data generated by the citizens, stakeholders with diverse interests, and two-way government-
citizen interactions in which citizens usually expect to receive feedback for their actions. These
factors make a complex research scenario in which UTAUT can be appropriate to examine the
behavioural intention to use the e-participation, which has been suggested as the main predictor
of human behaviour (JinKyu Lee & Rao, 2009). Second, UTAUT has the potential to provide
valuable insights in the investigation of e-participation because it takes into account both the
information technology factors and social factors (Zuiderwijk et al., 2015).
UTAUT has been used in a broad range of research fields to understand the factors that
drive the technology adoption, obtaining diverse results in terms of significance of the
constructs – for instance: (i) internet banking (Tarhini, El-Masri, Ali, & Serrano, 2016), in which
performance expectancy, effort expectancy, social influence, perceived credibility, and task
technology fit (Goodhue & Thompson, 1995) were found significant on intention to use; (ii) e-
government services (N. Alharbi, Papadaki, & Dowland, 2017), in which three of the four UTAUT
constructs are significant on intention to use (not effort expectancy); and, (iii) e-learning (Oh &
Yoon, 2014), in which performance expectancy, effort expectancy, and social influence have a
significant effect on intention to use. For the application of the UTAUT model, the hypotheses
41 | P a g e
are usually adapted to the context of the study (Venkatesh, Thong, Chan, Hu, & Brown, 2011).
In the case of our study, we have adapted the original UTAUT hypotheses to the context of e-
participation. We use four constructs from UTAUT to determine the behavioural intention to
use: performance expectancy, effort expectancy, social influence, and facilitating conditions.
(1) Performance expectancy (Venkatesh et al., 2003, 2012) has been found, in most
cases, to be the strongest predictor of intention to use an information technology, regardless
of the environment (X. Luo, Li, Zhang, & Shim, 2010). Herein it is defined as the degree to which
the individual considers that using e-participation will help to obtain gains or provide benefits
for the community. Performance expectancy implies that the citizen notices that she/he can
increase productivity in the participation processes. The existing ICT tools for e-participation,
such us e-petition, online incident reporting apps, and online participatory budgeting, allow the
citizens to express their ideas, opinions, and petitions using online resources such as text,
pictures, and videos. Thus, the use of e-participation may increase the citizen’s expectation of
performing better when giving their contributions to the community.
H1. Performance expectancy positively impacts the intention to use e-participation.
(2) Effort expectancy is defined as the degree of ease associated with the use of a given
technology, which influences the intention to use that technology (Venkatesh et al., 2003, 2012).
E-participation is designed for and oriented toward the citizenry. As e-participation is voluntary
and users devote their time for benefits that are not reflected at the individual level, but at the
community level, the perception of the effort required to use e-participation may play a critical
role in the citizen’s intention to use it. One of the main barriers to e-participation use are the
digital skills of citizens (van Deursen & van Dijk, 2009). We believe that citizens will expect that
e-participation tools are extremely easy to use. Consequently, if they find some level of difficulty
to use e-participation, they would probably not adopt the technology.
H2. Effort expectancy positively influences the intention to use e-participation.
(3) Social influence is defined as the extent to which an individual perceives that others
who are important to her/him, such as family and friends, consider that she or he should use
the system (Venkatesh et al., 2003, 2012). The important others are usually members of the
same community in which an online participation takes place. In the case of e-participation, the
social influence may also come from the media and politically active individuals (Oni et al., 2017).
The positive opinions of those members may encourage other citizens to contribute through e-
participation, thus, increasing their intention to use the system.

42 | P a g e
H3. Social influence positively impacts the intention to use e-participation.
(4) Facilitating conditions are the degree to which the individual perceives the existence
of resources and support to use a certain technology whenever necessary (Venkatesh et al.,
2003, 2012). E-participation is mainly provided and supported by local government agencies. A
citizen who has easy access to resources like computers, smartphones, internet connection,
support chat rooms, phone line, or other favourable conditions will increase his or her intention
to use e-participation. In the e-participation context the facilitation environment (Venkatesh et
al., 2012) can vary across citizens because of different technological devices and different e-
participation tools available according to the goal and level of participation. For instance, when
reporting an incident through a mobile app, the resources needed to carry out this task are less
demanding than the resources needed to participate in deliberation forums or ideas and online
project proposals.
H4. Facilitating conditions positively influence the intention to use e-participation.
3.2.3 Recommending the use of e-participation
Recommendation is considered a form of post-adoption behaviour (M. M. Luo, Chea, & Bui,
2016), which makes the intention to recommend a key factor for the successful diffusion of e-
participation. In the marketing context a positive recommendation has been shown to be very
persuasive and effective to influence the behaviour and attitude of other customers (P.-Y. Chen,
Wu, & Yoon, 2004; Hsiao & Chuang, 2009). Hong & Yang (2009) found that the customer-
company identification mediates the intention of positive recommendation. Intention to
recommend has also been found to be mediated by trust (Vlachos, Tsamakos, Vrechopoulos, &
Avramidis, 2009). In the context of e-participation the satisfaction and trust in government
(Welch et al., 2005) may mediate the effect of intention to use and empowerment over the
intention to recommend e-participation. In the field of mobile government, Liu et al. (2014)
suggest that after a positive recommendation, the likelihood of adoption may also increase.
Recommending a technology has not been widely studied due to a much greater focus
on the use behaviour construct. Miltgen et al. (2013); Oliveira et al. (2016) and Lee et al. (2011)
provide evidence that citizens with high levels of intention to use an information technology are
more likely to recommend the technology to others. The rationale to hypothesize an effect of
intention to use over intention to recommend is that when a citizen has the intention to use e-
participation, she/he may also have an interest in other citizens supporting the same goals and

43 | P a g e
getting involved in e-participation. The behaviour of recommending the technology may play a
critical role in supporting the diffusion of e-participation. Since the use of e-participation implies
that the citizen already has access to Internet, providing recommendations online is just one
more step ahead. The existing technologies such as online social networks (e.g. Facebook,
Twitter) allow the rapid dissemination of positive recommendations regarding the e-
participation technologies. When a citizen has the intention to use e-participation, she/he may
also have an interest in other citizens supporting the same goals and getting involved in e-
participation. For instance, when there is an e-voting process to choose some projects to be
implemented in the city amongst several candidate projects, the citizens interested in the
execution of a given project may recommend the technological platform to others to promote
the projects. It is also important to keep in mind that e-participation processes will be successful
in the long term only if a sufficient number of citizens contribute to them.
H5. Intention to use e-participation positively influences the intention to recommend the
technology to others.
3.2.4 Citizen empowerment
Psychological empowerment theory (Rappaport, 1987; Zimmerman, 1995; Zimmerman &
Rappaport, 1988), is described as “the connection between a sense of personal competence, a
desire for, and a willingness to take action in the public domain” (Zimmerman & Rappaport,
1988). This theory has been mainly applied in efforts to understand motivations in the work
environment. Spreitzer (1995) developed a multidimensional measure of psychological
empowerment in the work context that has been widely used and adjusted in many studies. For
instance, (i) Ergeneli, Ari, & Metin (2007) examined the relationship between psychological
empowerment and bank managers' cognition-based trust in immediate managers; and (ii)
Hochwälder & Brucefors (2005) studied the relationship between psychological empowerment
in the workplace and aspects of ill health. Despite the extensive use of psychological
empowerment in the work context, to the best of our knowledge, it has not yet been applied in
the context of e-participation adoption. Empowerment has been approached as a set of
dimensions, rather than as a singular concept (Peterson, 2014; Spreitzer, 1995; Thomas &
Velthouse, 1990). We measure the effect of citizen empowerment as a second-order construct
on the intention to use and intention to recommend e-participation. Empowerment is defined
by its first-order dimensions: impact, competence, meaning, and self-determination.

44 | P a g e
(1) Competence (Thomas & Velthouse, 1990), or self-efficacy (Bandura, 1986), is
defined as the degree to which a citizen can perform an e-participation activity with sufficient
required skills, for example, complete a search for a candidate project on e-participation and
send an SMS to vote for that project.
(2) Meaning refers to the individual judgment of the value of an e-participation action
or purpose, seen according to the citizen´s own ideas or standards (Thomas & Velthouse, 1990).
For instance, if there is a participative online discussion about a project that has a value for the
citizen, it is more likely that he or she will join the online discussion.
(3) Impact refers to the degree to which a behaviour or action on the e-participation is
seen as producing the effects or influence intended by the citizen (Sjoberg, Mellon, & Peixoto,
2017; Thomas & Velthouse, 1990), as for instance, an electronic vote for a project that later is
implemented in the community.
(4) Self-determination (Deci & Ryan, 1985), also known as choice, is the perception of
causal responsibility for an outcome of e-participation derived from an activity of the citizen
(Thomas & Velthouse, 1990). When a citizen submits a proposal for a project through e-
participation, he or she becomes the origin of that project’s existence, which is evaluated by the
local government and other citizens, thereby causing empowerment in the citizen.
Psychological empowerment has been described as the highest expression of
participation (Macintosh, 2004). Earlier studies have found that several activities such as
consulting, exchange of opinions, and involving citizens in decision-making processes increase
the intention to participate in e-government initiatives (Bataineh & Abu-Shanab, 2016; Phang &
Kankanhalli, 2008). Furthermore, Kang (2014) found empowerment to be a key dimension for
public engagement, which may lead to positive recommendations. These findings suggest that
the psychological empowerment theory may contribute to theoretical knowledge in the field of
e-participation, specifically, to understand its pre- and post-adoption behaviour. We posit that
a citizen who has the perception of being empowered by the actions performed on e-
participation will experience a greater intention to use, and later recommend, this technology.
H6. Empowerment positively influences the intention to use e-participation.
H7. Empowerment positively impacts the intention to recommend e-participation.
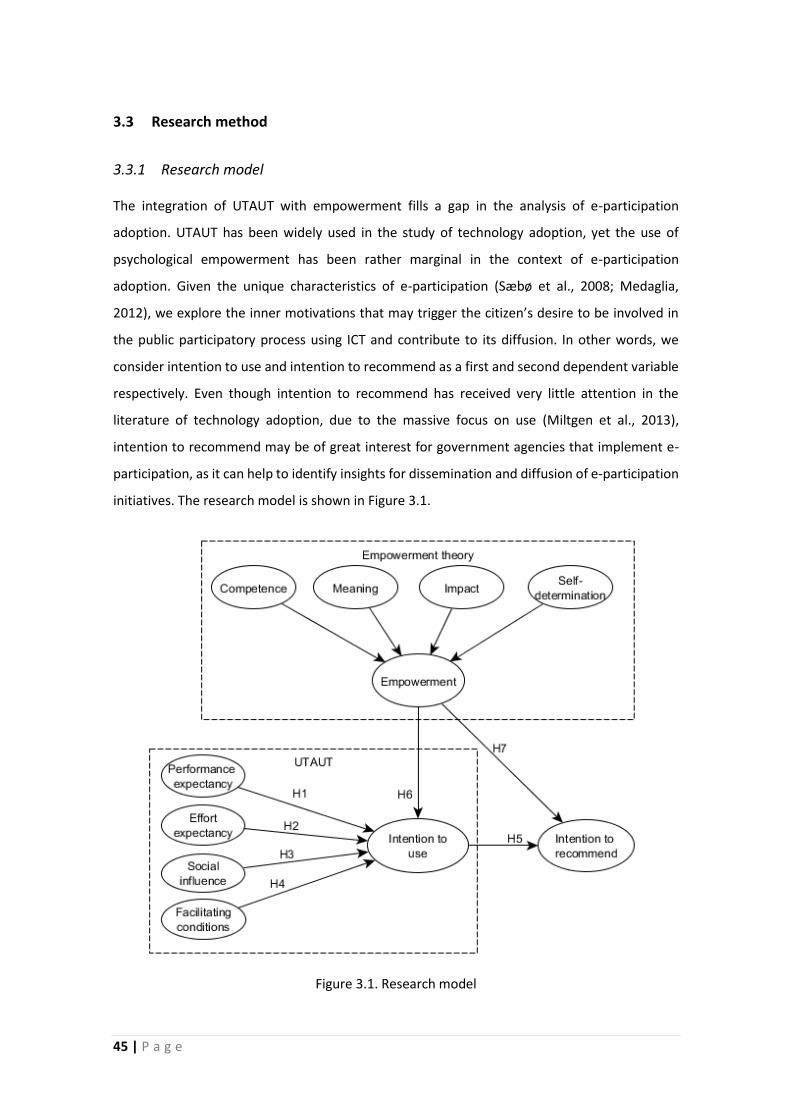
45 | P a g e
3.3 Research method
3.3.1 Research model
The integration of UTAUT with empowerment fills a gap in the analysis of e-participation
adoption. UTAUT has been widely used in the study of technology adoption, yet the use of
psychological empowerment has been rather marginal in the context of e-participation
adoption. Given the unique characteristics of e-participation (Sæbø et al., 2008; Medaglia,
2012), we explore the inner motivations that may trigger the citizen’s desire to be involved in
the public participatory process using ICT and contribute to its diffusion. In other words, we
consider intention to use and intention to recommend as a first and second dependent variable
respectively. Even though intention to recommend has received very little attention in the
literature of technology adoption, due to the massive focus on use (Miltgen et al., 2013),
intention to recommend may be of great interest for government agencies that implement e-
participation, as it can help to identify insights for dissemination and diffusion of e-participation
initiatives. The research model is shown in Figure 3.1.
Figure 3.1. Research model

46 | P a g e
3.3.2 Control variables
We include age, gender, and level of education as control variables on the intention to use and
recommend e-participation. Control variables are external to the theories being tested.
Individual differences such as age, gender, and level of education may affect the way users
perceive technology (Venkatesh, Morris, & Ackerman, 2000; White Baker, Al-Gahtani, &
Geoffrey S. Hubona, 2007). Nevertheless, results from earlier studies differ in the conclusions
about the preference for technology adoption regarding age and gender. For instance,
Venkatesh et al. (2016) found that age had significant impact on a citizen’s intention to use e-
government, although gender was not significant; Al-Somali, Gholami, & Clegg (2009) found that
age and gender had no effect on attitude toward use of online banking; Vicente & Novo (2014)
found that age was not significant while gender was significant for citizen online engagement
with e-participation, where men are more likely than women to express opinions about political
issues or sign online petitions; Choi & Kim (2014) analysed the effect of word-of-mouth on online
social networks and found that men are more likely than women to share online brand-related
content and product information. In the case of education, earlier research reports evidence
that citizens with higher levels of education are more likely to adopt e-participation (Lindner &
Riehm, 2011).
3.3.3 Measurement
We use previously validated scales for all the constructs in our research model, adjusted to the
context of e-participation (see Appendix 3.1). We use reflective measures for all first-order
constructs in the model. All the variables pertaining to the main constructs were measured by
multiple-type close-ended questions on a seven-point Likert scale ranging from 1 (totally
disagree) to 7 (totally agree). The items for performance expectancy, effort expectancy, social
influence, facilitating conditions, and intention to use are adapted from Venkatesh et al. (2012).
For intention to recommend, two of their items were adapted from Oliveira, Thomas, Baptista,
& Campos (2016), and another from Hoehle & Venkatesh (2015). Gender was coded as a 0 or 1
dummy variable where 1 represents men. Age was measured in years. Level of education is a
categorical variable for which the categories correspond to the Portuguese education system
from primary school to the PhD level. When evaluated in the model, level of education was
translated into years of schooling. Following the suggestion of Peterson (2014), we consider
empowerment as a second-order reflective-formative type construct represented by its first-
order dimensions: competence, meaning, impact, and self-determination. Their items were
47 | P a g e
adapted from Kim & Gupta (2014). The hierarchical model is of a reflective-formative type
(Becker, Klein, & Wetzels, 2012; Ringle, 2012).
The questions were originally written in English and reviewed for content validity by a
group of university researchers. The questionnaire was translated from English to Portuguese
by a professional translator, and then back to English by a different professional to check for
equivalence. Wording of the translated questions in Portuguese were discussed and polished
with local colleagues in academia and public officials of the municipality, who also provided us
with their database of contacts for the electronic survey. Previously, we carried out a pilot study
with 27 complete answers to test the questionnaire and correct possible errors. The data from
the pilot test were not used in the next phase of data analysis.
3.3.4 Data Collection
This study takes place in Portugal, where municipalities in several cities across the country have
implemented e-participation tools for the direct involvement of and contribution from citizens.
The so called online participatory budget (Allegretti & Antunes, 2014) is amongst the most
popular ones. The electronic participative budget allows citizens to submit project initiatives
through a web portal, and to vote for the available projects on the platform. Most of the citizens
vote by means of an SMS message from their mobile phone. These platforms stand out in the e-
participation context as they facilitate the inclusion of a larger number of citizens that are willing
to contribute with project proposals and/or by voting for the available projects to be
implemented by the municipality.
In Portugal, 74% of families had access to Internet at home by 2016 (INE - Instituto
Nacional de Estadística, 2016). The access to Internet at home is higher in the urban areas and
big cities (e.g., 82% in the metropolitan area of Lisbon). Regarding the political attitudes and
political action, Magalhães (2005) found that citizens are increasingly dissatisfied with the
democratic performance. This may be due to a negative perception of political responsiveness
of representative institutions (Torcal, 2014) and the economic crisis in Portugal one decade ago
that negatively influenced the political attitude (Brito Vieira, Carreira da Silva, & Pereira, 2017)
and the political trust (van der Meer & Hakhverdian, 2017). The e-participation tools oriented
for decision-making may open an interesting opportunity to allow the citizens themselves to
propose and decide on local issues, which could help to recover the trust and satisfaction in
representative institutions.

48 | P a g e
Data were collected through an electronic survey. An invitation email containing a
hyperlink to the questionnaire was sent to a database of registered users in the municipality
systems of a Portuguese city; the hyperlinks could be used only once. At the beginning of the
questionnaire the respondents were presented an explanatory introduction of the goal of the
survey, including electronic participative budget as one example of e-participation tool.
Participation in the survey was voluntary. We offered prizes as incentives to participants. The
questionnaire was available from September 6th to October 30th of 2016. A total of 210 valid
responses were collected. Details of respondents’ demographic characteristic are in Table 3.1.
Table 3.1. Sample demographic characteristics (ordered by number of observations)
Characteristics (n = 210) Obs. %
Gender Feminine 112 53.33
Masculine 98 46.67
Age From 40 to 55 123 58.57
From 26 to 39 47 22.38
56 or more 35 16.67
25 or less 5 2.38
Level of education Bachelor’s degree 92 43.81
High school 59 28.10
Master’s degree 29 13.81
Post-graduation 19 9.05
NA/NR 4 1.90
Doctorate 4 1.90
Primary school 3 1.43
Profession Worker for third parties 121 57.62
Self-employed 35 16.67
Retired 13 6.19
Unemployed 13 6.19
Freelancer 11 5.24
Other 10 4.76
Student 7 3.33
3.4 Data Analysis and Results
We assess the research model using the partial least squares structural equation modelling (PLS-
SEM) method (Hair, Hult, Ringle, & Sarstedt, 2014). We use SmartPLS 3.0 software (Ringle,
Wende, & Becker, 2015). PLS is a variance-based technique, which is data driven and suitable

49 | P a g e
for predictive analysis to test the causal relationships that were theoretically derived as
hypotheses and using empirical data (Hair et al., 2011). Although the study does not use
longitudinal data, the participants that answered the electronic questionnaire have previously
experienced the online participatory budgeting platform (Hibberts, Johnson, & Hudson, 2012).
Our model complies with several considerations stated in Hair et al. (2014) for choosing the PLS
method: (i) the goal is to predict key drivers of e-participation adoption; (ii) the structural model
is complex, comprising 11 constructs (empowerment as second-order construct) and its 31
indicators; and, (iii) the sample size (n = 210) fulfils the rule of being at least 10 times more than
the largest number of paths directed to a construct in the model; in this case the largest number
of structural paths is five.
3.4.1 Exploratory factor analysis and model fit
We conduct exploratory factor analysis with varimax rotation to check whether the
measurement items are adequately related to their constructs. The Kaiser-Meyer-Olkin (KMO)
test resulted in 0.9, which is considered “marvellous” (Sharma, 1996), indicating that the data
are appropriate for factor analysis. All the items loaded above 0.5 (Costello & Osborne, 2005)
except for FC4. We eliminated FC4 from the model, please see Appendix 3.2. The adequacy of
measurements items is confirmed.
For a tenable model fit, Hair et al. (2014) suggest 0.08 or smaller cut-off value for
standardized root mean square residual (SRMR). Ziggers & Henseler (2016) reported a good
model fit based on a normal fit index (NFI) of 0.865 or higher using PLS-SEM. Results for SRMR
(0.04) and NFI (0.87) support a good model fit.
3.4.2 Measurement Model
We have reflective and formative constructs in our model. For reflective constructs we analysed
the internal consistency, convergent validity, and discriminant validity (Hair et al., 2014).
Cronbach’s alpha and composite reliability are the two criteria used for internal consistency. As
reported in Table 3.2, both have values above 0.7 for all latent variables, which suggests internal
consistency (Hair et al., 2014; Mackenzie, Podsakoff, & Podsakoff, 2011). Convergent validity is
also assessed by two criteria, the average variance extracted (AVE) and the indicator reliability.
The AVE and the loadings are above 0.5 and 0.7 respectively (Table 3.2), in almost all cases,
showing a good convergent validity (Hair et al., 2014). Loadings below 0.4 should be dropped

50 | P a g e
(Henseler, Ringle, & Sinkovics, 2009), which was not necessary for any item in the measurement
model.
We use two criteria to test discriminant validity. (i) Fornell & Larcker (1981), which states
that the square root of AVE should be greater than its correlation with any other construct (see
Table 3.2), and (ii) the Hetrotrait-Monotrait Ratio (HTMT) (Henseler, Ringle, & Sarstedt, 2015),
which requires the HTMT ratios to be below the threshold of 0.9 (see Table 3.3). Therefore, the
model presents a good discriminant validity.
Table 3.2. Quality criteria
Constructs CA CR AVE 1 2 3 4 5 6 7 8 9 10
1. Performance expectancy 0.85 0.91 0.77 0.88
2. Effort Expectancy 0.91 0.93 0.78 0.52 0.88
3. Social influence 0.95 0.97 0.91 0.39 0.20 0.95
4. Facilitating conditions 0.83 0.90 0.75 0.37 0.58 0.17 0.87
5. Behavioural intention 0.91 0.94 0.85 0.50 0.48 0.24 0.51 0.92
6. Recommendation 0.90 0.94 0.84 0.47 0.45 0.24 0.45 0.49 0.91 7. Competence 0.97 0.98 0.95 0.37 0.62 0.19 0.66 0.42 0.49 0.97
8. Meaning 0.96 0.98 0.93 0.43 0.32 0.33 0.48 0.52 0.49 0.53 0.96
9. Impact 0.94 0.96 0.89 0.32 0.21 0.31 0.16 0.27 0.45 0.31 0.32 0.94
10. Self-determination 0.95 0.96 0.90 0.37 0.50 0.11 0.52 0.47 0.52 0.58 0.39 0.34 0.95
Notes: CA = Cronbach’s Alpha, CR = Composite Reliability, AVE = Average Variance Extracted.
Square root of AVE in bold.
Table 3.3. Hetrotrait-Monotrait Ratio
Constructs 1 2 3 4 5 6 7 8 9 10
1. Performance expectancy
2. Effort Expectancy 0.59
3. Social influence 0.44 0.21
4. Facilitating conditions 0.44 0.66 0.19
5. Behavioural intention 0.57 0.53 0.26 0.58
6. Recommendation 0.54 0.50 0.26 0.52 0.53
7. Competence 0.41 0.66 0.20 0.74 0.45 0.52
8. Meaning 0.48 0.34 0.35 0.54 0.56 0.53 0.55
9. Impact 0.35 0.22 0.33 0.18 0.29 0.49 0.32 0.33
10. Self-determination 0.40 0.55 0.11 0.59 0.51 0.56 0.60 0.41 0.36
For formative constructs we assessed the multicollinearity, statistical significance, and
sign of the weights. Psychological empowerment is modelled as a higher-order construct of a
reflective-formative type (Becker et al., 2012; Ringle, 2012). Multicollinearity is evaluated by the

51 | P a g e
variance inflation factor (VIF). The VIF ranges from 1.191 to 1.804, which is below 5, indicating
no collinearity issues (Hair et al., 2014). All the weights are statistically significant (p<0.01) and
positive. See Table 3.4.
Table 3.4. Measurement model evaluation for higher-order formative constructs
Higher-order formative construct First-order reflective constructs VIF Weight
Empowerment
Competence 1.804 0.363 ***
Meaning 1.462 0.355 ***
Impact 1.191 0.257 ***
Self-determination 1.585 0.346 ***
Note: *p<0.10; **p<0.05; ***p<0.01
3.4.3 Structural Model
To assess our research model, we follow the approach of Hair et al. (2014): coefficient of
determination (R2), f2 effect-size, predictive relevance Q2, and structural model path coefficients.
(1) R2 is a measure of the model’s predictive power. For this study we follow the
suggested rule of thumb in marketing research for the interpretation of R2 values (Hair et al.,
2014; Henseler et al., 2009), according to which, 0.75, 0.50, and 0.25, can be described as
substantial, moderate, and weak, respectively. Both, intention to use (0.442) and intention to
recommend (0.458), obtained moderate R2 values.
(2) From the constructs that were significant, most of the values in f2 yield small effects:
age on recommendation (0.028), psychological empowerment on intention to use (0.062),
facilitating conditions on intention to use (0.044), gender on intention to use (0.028), intention
to use on intention to recommend (0.034), and performance expectancy on intention to use
(0.060). The only exception is psychological empowerment on intention to recommend (0.329),
considered as a medium effect (Hair et al., 2014). The path coefficient of education level on
recommendation was also found to be statistically significant. However, since its effect size f2 is
less than 0.02, level of education has no meaningful effect on recommendation (f2 = 0.013).
(3) The blindfolding technique was used to calculate Q2, with omission distance set to 7.
All three of the Q2 values of endogenous latent variables are above zero, with the smallest Q2 =
0.338. This means that all exogenous variables have predictive relevance for the endogenous
constructs in the model (Hair et al., 2014).

52 | P a g e
(4) Significance of the path coefficients indicates whether our hypotheses are supported
or not, and was assessed using the bootstrapping technique (Hair et al., 2014) with 5000
iterations. Results are compared with the critical values for two-tailed tests. Amongst the seven
hypotheses posited in our study, five are confirmed by the results. The model explains 44.0% of
variation in the intention to use and 46.1% of variation in the intention to recommend. Figure
3.2 illustrates the values for path coefficients, their significance, R2, and predictive relevance Q2.
Figure 3.2. Structural model results
Notes: significant at *10%; **5%; ***1%. Non-significant paths are in dotted arrows.
Evidence shows that psychological empowerment improves the predictive power of
UTAUT. We evaluated two structural models: (i) UTAUT alone and (ii) UTAUT with psychological
empowerment. Hair et al. (2014) caution that problems emerge when comparing the R2 of
different models, since adding constructs slightly correlated with the endogenous variable will

53 | P a g e
increase its R2 value. Instead, they suggest the adjusted coefficient of determination (R2adj),
which allows avoiding bias in complex models. We compare the path coefficients, significance,
and R2adj for the two models. Based on R2
adj we can conclude that the full research model (UTAUT
+ empowerment) performs better than UTAUT alone in the e-participation context. The
increment of R2adj in the full model in comparison to the UTAUT alone model is more substantial
for intention to recommend. The increment for intention to use is rather modest. Table 3.5
compares the results of the two models.
Table 3.5. Comparison of results
UTAUT Only UTAUT + Empowerment
Independent variable Dependent variable Path coefficient R2adj Path coefficient R2adj
Performance expectancy
Intention to use
0.287***
0.385
0.236***
0.417
Effort Expectancy 0.130 0.081
Social influence 0.056 0.028
Facilitating conditions 0.339*** 0.223*
Empowerment - 0.268**
Age 0.001 0.022
Gender -0.131** -0.128**
Level of education -0.043 -0.029
Intention to use
Intention to
recommend
0.462***
0.272
0.166**
0.447 Empowerment - 0.526***
Age -0.212*** -0.127*
Gender 0.025 -0.028
Level of education -0.086 -0.086*
Notes: Significant at *10%; **5%; ***1%. Hypotheses are derived from the full model (UTAUT +
empowerment).
As can be seen in Table 3.6 and Figure 3.2, of the seven hypotheses five are confirmed.
Hypotheses H1, H2, H3, and H4 are about the constructs of UTAUT theory. Performance
expectancy (H1) and facilitating conditions (H4) are significant in explaining intention to use e-
participation (β = 0.236, p < 0.01 and β = 0.223, p < 0.1 respectively). Effort expectancy (H2) and
social influence (H3) have no significant effect on intention to use. Hypothesis H5 concerns the
relationship between intention to use and intention to recommend e-participation, which is
significant (β = 0.166, p < 0.05), and thus H5 is confirmed. Hypotheses H6 and H7 are about the
effect of empowerment theory of intention to use (β = 0.268, p < 0.05) and intention to
recommend (β = 0.526, p < 0.01), respectively. Both are supported. The results show that the
relationship between empowerment and intention to recommend is the strongest of the model.
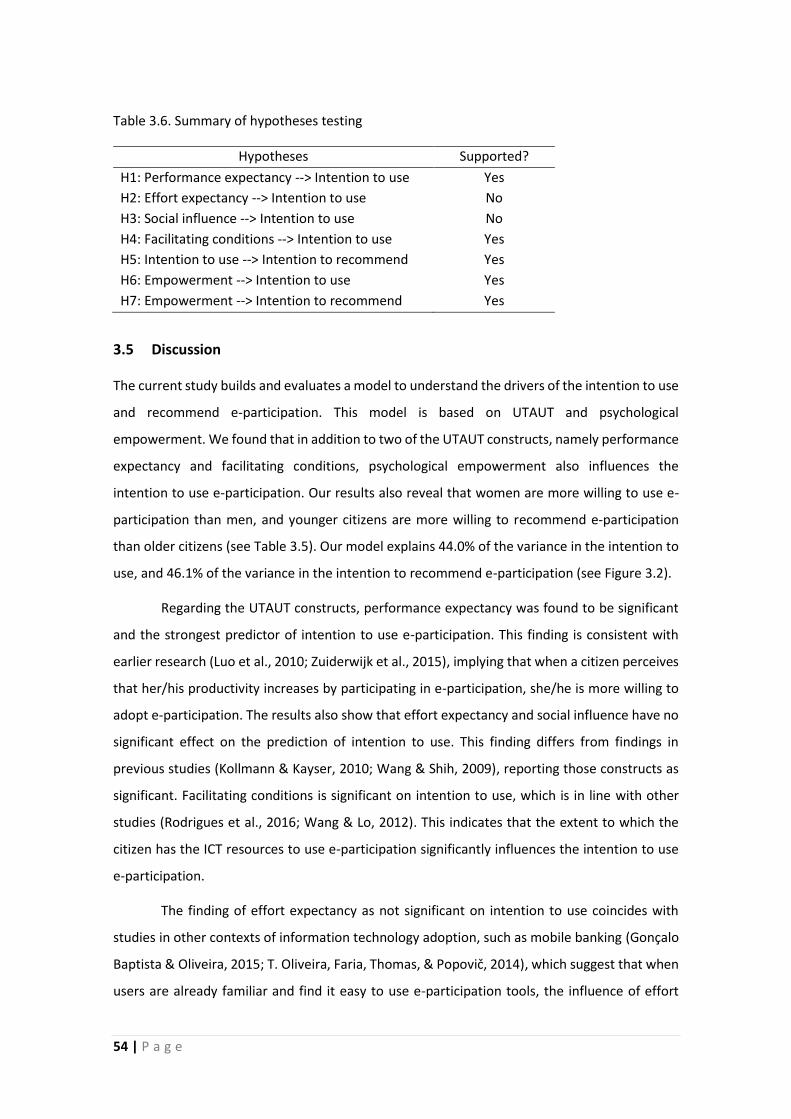
54 | P a g e
Table 3.6. Summary of hypotheses testing
Hypotheses Supported?
H1: Performance expectancy --> Intention to use Yes
H2: Effort expectancy --> Intention to use No
H3: Social influence --> Intention to use No
H4: Facilitating conditions --> Intention to use Yes
H5: Intention to use --> Intention to recommend Yes
H6: Empowerment --> Intention to use Yes
H7: Empowerment --> Intention to recommend Yes
3.5 Discussion
The current study builds and evaluates a model to understand the drivers of the intention to use
and recommend e-participation. This model is based on UTAUT and psychological
empowerment. We found that in addition to two of the UTAUT constructs, namely performance
expectancy and facilitating conditions, psychological empowerment also influences the
intention to use e-participation. Our results also reveal that women are more willing to use e-
participation than men, and younger citizens are more willing to recommend e-participation
than older citizens (see Table 3.5). Our model explains 44.0% of the variance in the intention to
use, and 46.1% of the variance in the intention to recommend e-participation (see Figure 3.2).
Regarding the UTAUT constructs, performance expectancy was found to be significant
and the strongest predictor of intention to use e-participation. This finding is consistent with
earlier research (Luo et al., 2010; Zuiderwijk et al., 2015), implying that when a citizen perceives
that her/his productivity increases by participating in e-participation, she/he is more willing to
adopt e-participation. The results also show that effort expectancy and social influence have no
significant effect on the prediction of intention to use. This finding differs from findings in
previous studies (Kollmann & Kayser, 2010; Wang & Shih, 2009), reporting those constructs as
significant. Facilitating conditions is significant on intention to use, which is in line with other
studies (Rodrigues et al., 2016; Wang & Lo, 2012). This indicates that the extent to which the
citizen has the ICT resources to use e-participation significantly influences the intention to use
e-participation.
The finding of effort expectancy as not significant on intention to use coincides with
studies in other contexts of information technology adoption, such as mobile banking (Gonçalo
Baptista & Oliveira, 2015; T. Oliveira, Faria, Thomas, & Popovič, 2014), which suggest that when
users are already familiar and find it easy to use e-participation tools, the influence of effort
55 | P a g e
expectancy on behavioural intention decreases (Alharbi et al., 2017). Regarding the non-
significance of social influence, this factor was introduced in UTAUT for the organizational
context as the next version of subjective norms (Venkatesh et al., 2003). In the case of e-
participation, different from the organizational settings, the usage is completely voluntary,
which may explain the non-significance of social influence. This finding goes in line with previous
literature suggesting that when the use is perceived as voluntary, social influence is less
important (Hartwick & Barki, 1994; Venkatesh et al., 2003). Moreover, as e-participation is not
yet widely used in the city where the data were collected, its usage cannot yet be considered
the norm. The actual users of e-participation do not receive a direct influence from the other
citizens who are so far not yet involved in e-participation projects. The initial influence to use e-
participation tools may well be the result of the marketing promotion and advertisement done
by the local government that hosts the system.
Psychological empowerment is defined as a higher-order construct. We found its first-
order formative components, namely competence, meaning, impact, and self-determination to
be significant and positive on the construct empowerment. This positively influences intention
to use e-participation. This result is consistent with another study in the e-participation context
(E. A. Abu-Shanab, 2015), in which empowerment was evaluated as a first-order construct in the
context of open government. This implies that if citizens perceive a feeling of empowerment
with e-participation, it will positively affect their intention to use e-participation. Furthermore,
we found that intention to use and psychological empowerment positively influence intention
to recommend. This finding is consistent with other studies that found intention to use to impact
significantly over intention to recommend; for instance, Miltgen et al. (2013) in the context of
biometrics, and Oliveira et al. (2016) in the context of mobile payment.
3.5.1 Theoretical Implications
The first theoretical implication is derived from the proposed integrated research model to
analyse the behavioural intention and the action to recommend e-participation technologies.
We explore the inner motivations of the individual by integrating psychological empowerment
theory with UTAUT. The positive values in each of the dimensions of psychological
empowerment may contribute, in some degree, to the perception of empowerment in the
citizen regarding the intention to use and recommend e-participation. Thus, (a) competence
may imply that the more skills the user has to use e-participation, the greater her/his intention
to use e-participation; (b) meaning may indicate that when the purpose of using e-participation

56 | P a g e
has a value for the citizen, she/he will be more willing to use and recommend e-participation to
others; (c) impact may suggest that if the citizen has the perception that his usage of e-
participation will have a final positive outcome for the community, she/he may be more
motivated to use and recommend the technology; and finally, (d) self-determination could
indicate that when citizens have a perception of responsibility for an outcome of e-participation,
they will also have a greater intention to use and recommend the system.
Secondly, our results confirm an acceptable explanatory power in predicting intention
to use and recommendation of e-participation. The results indicate that when psychological
empowerment is integrated with UTAUT the level of variance on intention to use and intention
to recommend e-participation is increased. The R2adj increases from 38.5% (UTAUT only) to
41.7% (full model) for intention to use, and from 27.2% (UTAUT only) to 44.7% (full model) for
intention to recommend (Table 3.5). The stronger impact of empowerment on intention to
recommend than on intention to use may imply that once the citizens have a perception of
empowerment, they will be much more willing to recommend the usage to others, as for
instance sharing the e-participation ideas in social networks and inviting others to join.
Thirdly, we contribute to the construct clarity of higher-order multidimensional
constructs (Johnson, Rosen, Chang, Djurdjevic, & Taing, 2012) in the context of e-participation.
We provide a model in which psychological empowerment is used as a higher-order construct
to explain intention to use and recommend e-participation. And finally, when the context of
technology usage is completely voluntary and easy to use, which is the case for e-participation,
the effect of effort expectancy and social influence, as they are defined in UTAUT, become little
or non-significant over the behavioural intention to use the technology.
3.5.2 Practical Implications
Understanding the behavioural intention to use and intention to recommend of e-participation
tools and platforms is critical for entities that implement and promote the use of those
technologies (usually local government institutions). The hypotheses tested from both theories
integrated in the model provide interesting insights for practitioners.
Regarding the empowerment-related hypotheses: positive effect of empowerment on
intention to use and recommend e-participation implies, for the public sector, that the strategies
for promotion and diffusion of e-participation should focus on citizens’ positive perception of
the four components of psychological empowerment: competence, meaning, impact, and self-

57 | P a g e
determination. For instance, in the case of impact, the e-participation platform should keep the
citizens informed about the effects produced by their participations through the platform (Royo
& Yetano, 2015). This may contribute to the perception of empowerment in the citizens, thereby
creating a positive attitude toward intention to use and recommend the technology.
Regarding the UTAUT-related hypotheses: (i) the positive and significant effect of
performance expectancy over intention to use suggests that citizens may perceive that their use
of e-participation is producing a positive outcome in the community. Local governments should
not only promote the use of e-participation tools, but also the positive final effects of that usage
on the community. (ii) The positive effects of facilitating conditions on intention to use may
indicate that local governments should keep a facilitating environment around e-participation,
as for instance support chat rooms or call centres. (iii) The non-significant effect of effort
expectancy and social influence suggest that local governments should keep the e-participation
simple and easy to use, oriented to all citizens without conditions or restrictions for using it.
3.5.3 Limitations and Future Research
The first limitation of our work concerns the location of participants in the questionnaire, which
was conducted in Portugal. Caution is needed when generalizing our findings toward the
adoption of e-participation in different locations or with different participants. This study offers
researchers a basis for future research by refining the model and testing it in different countries,
age groups, and identifying new constructs that may help to increase the predictive power of
the model. Secondly, we found effort expectancy and social influence to have no significant
effect on intention to use. Future research can investigate these constructs in different scenarios
in which they may become significant over the intention to use. Thirdly, the measurement and
use of psychological empowerment as a higher-order multidimensional construct is still under
research (Johnson et al., 2012; Peterson, 2014). Future research may explore each of the
dimensions of psychological empowerment on e-participation adoption separately and combine
psychological empowerment with other theories of technology adoption to compare the
predictive power compared to our model. And finally, the data were collected from 210 citizens
who are users of e-participation, which implies that they are probably more digitally savvy than
the rest of the population in the city. This may have created a limitation regarding the random
sample selection and may have influenced the result of non-significance of effort expectancy on
intention to use, since the users may find e-participation easy to use and expect few or no
problems when using it. Future research may address this limitation by collecting data from a
58 | P a g e
broader sample of citizens, thereby allowing a comparison between the more and less
experienced participants with e-participation.
Beyond citizen empowerment and the UTAUT constructs, a myriad of other factors can
influence the adoption of e-participation. Future research may create new models based on
UTAUT and integrate constructs such as sense of community (Talò et al., 2014), sense of place
(Acedo, Painho, & Casteleyn, 2017), and place identity (Cuba & Hummon, 1993), which have
been shown to potentially influence citizens’ willingness to engage in participation activities.
However, very little literature reports having measured the relationship between the degree of
identification with the community and the adoption of e-participation, which would be a fruitful
path forward.
3.6 Conclusions
This article provides insights on how citizens’ perceptions of empowerment can influence the
intention to use and intention to recommend e-participation systems, using a novel theoretical
model. The model integrates UTAUT and psychological empowerment theory. It was evaluated
based on data from 210 citizens in Portugal. Performance expectancy, facilitating conditions,
and empowerment were found to be significant on the intention to use e-participation.
Psychological empowerment significantly impacts intention to use and recommend e-
participation. These findings can help the public sector to design strategies to promote and
diffuse e-participation amongst the citizenry for a long-term use; for instance, keeping and
reinforcing the perception of empowerment in citizens who use e-participation tools. The model
offers researchers a basis for future examination of inner motivations of citizens to adopt e-
participation.

59 | P a g e
Chaper 4 - Continuous usage of e-participation in the long term: The
role of the sense of virtual community
4.1 Introduction
In recent years local governments around the globe have made considerable endeavours to
implement different forms of online public participation, the so-called e-participation, which is
considered a branch of e-government oriented for consultation and decision-making (Welch,
2012). For instance, tools to provide public opinion for deliberation, such as online discussion
forums (Jooho Lee & Kim, 2012; Mou et al., 2013) were found in 32 countries by 2010 (United
Nations, 2010) and increased to 72 countries by 2012 (United Nations, 2012). Active use of e-
participation in the long term can facilitate the engagement of citizens in consultation and
decision-making processes along with governments. E-participation can produce positive effects
in the community only if the members of that community use the systems in the long-term
scenario. Since e-participation is oriented to the general public, its adoption and diffusion
process is still a challenge for the local governments with a risk of discontinuity (Sun, 2013).
Understanding these drivers is crucial for the local governments to implement strategies for the
diffusion, active use, and engagement of citizens with e-participation in the long term.
Most local governments already integrated the use of online social networks in their e-
government platforms as means of improving a two-ways communication with citizens
(Mossberger, Wu, & Crawford, 2013) and increasing the public trustworthiness (Porumbescu,
2016). Nonetheless, only a small number of those implementation had an impact at policy-
making or decision-making level (United Nations, 2016). A growing body of literature has
devoted efforts to understand the factors that influence the online citizen participation (Naranjo
Zolotov, Oliveira, & Casteleyn, 2018; Rana, Dwivedi, Williams, & Weerakkody, 2016;
Schmidthuber, Hilgers, & Gegenhuber, 2017), and how the usage of e-participation can lead to
full partnership with the government (Abu-Shanab, 2015). However, the active involvement of
members of small or medium-sized communities, such as neighbourhoods, parishes, or cities, in
online consultation and decision-making processes in the long term is still a challenge.
The sense of community (Newbrough & Chavis, 1986) is considered a key factor for the
active involvement of citizens in public participation. The sense of virtual community (SOVC) is
the degree of affective attachment to a given community mediated by an information
technology (Koh & Kim, 2003), in this case, e-participation technologies. Little is known about
the factors that drive the intention to continue using e-participation in the post-adoption stage
60 | P a g e
from a perspective of SOVC. This article makes two contributions to fill the existing gap. First,
the article explores the effect of sense of virtual community on the usage and on the continuous
intention to use e-participation. Second, we propose a research model that integrates two
theories: (i) SOVC and (ii) the extended unified theory of acceptance and use of technology
(UTAUT) (Venkatesh et al., 2012). Since our focus is on the post-adoption stage, we consider
only the UTAUT constructs that have a direct influence on the use behaviour of e-participation:
facilitation conditions and habit.
The research model is tested using partial least squares structural equation modelling
(PLS-SEM) to analyse the data collected from 370 respondents through an electronic
questionnaire that was applied to the users of the participatory budgeting platform, an e-
participation platform managed by the municipality of a Portuguese city from 2008.
The rest of the paper is organized as follows: Section 2 presents a literature review of e-
participation and post-adoption behaviour. Section 3 explains the research model development
and hypotheses. Section 4 describes the methodology, including the description of research
context, measurements, and data collection. Section 5 presents the results of measurement and
structural model evaluations. Section 6 provides a discussion of results, and finally, conclusions
and directions for future research are presented in Sections 7 and 8, respectively.
4.2 An overview of e-participation in the post-adoption stage
E-participation is the use of Information and Communication Technologies (ICTs) to support
“top-down” engagement and empower citizens and civil society organizations (Macintosh &
Whyte, 2008). E-participation is seen as a type of e-government service (Jooho Lee & Kim, 2014)
with special focus on citizen engagement for deliberation and decision orientation (Welch,
2012). In this study e-participation is considered to be of a citizen-initiated nature, which implies
that although the e-platform can be sponsored by the government, the initiatives, namely
proposals, petitions, online voting, or suggestions, originate from the citizens toward the
government. The long-term use of e-participation has the potential to promote citizen
engagement in collaborative governance (Pereira, Cunha, Lampoltshammer, Parycek, & Testa,
2017).
Rodríguez-Bolívar, Alcaide-Muñoz, & López-Hernández (2016) suggest that e-
participation is a leading research topic in e-government literature for both developing and
developed countries, although studies in developed countries focus more on the latter stages of
61 | P a g e
e-government initiatives, whereas the developing-country focus is more on the early stages. The
implementation of e-participation platforms like the online participatory budgeting (Allegretti &
Antunes, 2014) in some cities in Portugal already crossed the barrier of acceptance a number
of years ago. Nevertheless, acceptance is not the ultimate indicator of success in e-participation
implementations. The challenge after acceptance is to assure its diffusion and continuous usage
in the long-term scenario.
Jasperson, Carter, and Zmud (2005) define post-adoption behaviour as “the myriad
feature adoption decisions, feature use behaviours, and feature extension behaviours”
performed by an individual after the use of a system. In our case, the system is e-participation.
Most of the earlier studies that contributed to the understanding of the factors that affect post-
adoption behaviour in different contexts of technology adoption focus primarily on the analysis
of satisfaction (Cho, 2016; Li & Liu, 2014; Liao, Palvia, & Chen, 2009; Tojib & Tsarenko, 2012).
However, more recent studies have found the existence of other factors with stronger predictive
power for specific contexts of technology adoption. For instance, Ong and Lin (2016) found that
well-being was the strongest predictor of continuance intention in the context of online social
networks. They suggest exploring new constructs that may contribute to the understanding of
the continuous intention to use the technology. Sun (2013) found that technology adoption
motivated mainly by herd behaviour leads to not meeting the initial expectations in the post-
adoption stage, thereby increasing the risk of discontinuation or abandonment of the previously
adopted e-participation.
4.3 Research model
The outcomes of using e-participation technologies, such as the creation of policies or the
implementation of projects proposed by citizens, imply an impact on the community and not
only on the individual. These outcomes are materialized only when the e-participation systems
are used in the long term. Traditional theories in the realm of information systems are robust
on the study of intention to use and usage of the technology (Davis, 1989; Venkatesh et al.,
2003). However, the factors that may lead to the acceptance of e-participation in an initial stage,
may not be the same in the continuous usage over time. As e-participation produces benefits
for the community in the long term, the sense of virtual community in the individuals that have
already accepted e-participation technologies may play a critical role as motivator of the
continuous use of e-participation. In this regard, the main objective of this article is to explore
the effects of SOVC on the usage and continuous intention to use e-participation.

62 | P a g e
The research model integrates constructs from UTAUT and sense of virtual community
to study the use behaviour and continued intention to use e-participation. SOVC is defined as
the individual perception of belonging, identity, and attachment to a given community with a
communication mediated by ICT (Cheng, Tsai, Cheng, & Chen, 2012). When this perception is
positive, it can act as a facilitator of active online participation in the community. The exploratory
study of SOVC may help to explain the inner motivations of the citizens to engage and
continuously use e-participation in the post-adoption stage. Since our focus is on the post-
adoption stage, SOVC constructs are combined with UTAUT constructs that have a direct impact
on the use and continuous intention to use of e-participation: facilitation conditions and habit.
UTAUT has been widely used in the study of technology adoption (Dwivedi et al., 2011; T.
Oliveira et al., 2014), focusing on the drivers that influence intention to use and use of
technology. However, one single theory may provide only a limited explanation about specific
characteristics in the e-participation context. In this regard, Venkatesh, Thong, Chan, and Hu
(2016) suggest drawing on additional theoretical perspectives. The integration of UTAUT
constructs on usage and SOVC may contribute interesting insights regarding the drivers of the
continuance intention to use e-participation in the post-adoption stage. The research model is
presented in Figure 4.1.
Figure 4.1. Research model and hypotheses

63 | P a g e
4.3.1 Hypotheses development
4.3.1.1 Facilitating conditions
External factors related to e-participation, such as the availability of support and resources from
the government that hosts and promotes the use of the system, may have an influence on
citizen’s behaviour regarding the use of e-participation. These external factors are captured in
the variable facilitating conditions (Venkatesh, Brown, Maruping, & Bala, 2008). Facilitating
conditions refers to the individual perception of existence of resources and support to use the
technology (Venkatesh et al., 2003, 2012). Earlier literature emphasized the importance of
facilitating conditions in different contexts of the information systems use. For instance, the
adoption of technology in households (S. A. Brown & Venkatesh, 2005), or the behavioural
intention to use biometric technologies (Miltgen et al., 2013).
The rationale for the effect of facilitating conditions on use behaviour and continued
intention to use in the e-participation context is that the whole participatory process requires
the support from the local government for the citizen contributions to be materialized. This
process is mostly external to the e-participation technology and can therefore be considered as
a facilitating condition. For instance, when reporting potholes through a mobile e-participation
app, there is an internal process in the government that finally will solve the problem of the
pothole. As the contributions on e-participation will have an impact on the community in the
long term, facilitating conditions will affect the use behaviour and the continued intention to
use e-participation technologies.
H1. Facilitating conditions positively influence the use behaviour of e-participation.
H2. Facilitating conditions positively influence the continuous intention to use e-participation.
4.3.1.2 Habit
E-participation systems are usually planned to be used for several years. For instance, online
participatory budgeting (Mkude, Pérez-Espés, & Wimmer, 2014), has a cyclical process that
repeats every year, whereby citizens are able to submit proposals to be implemented by the
local government. Once e-participation is adopted and the use of the system is stable, users may
experience the formation of habit as a result of favourable confirmation of expectations, which
may lead to increase the likeliness of repeating the behaviour (Hu, Stafford, Kettinger, Zhang, &
Dai, 2017).

64 | P a g e
Habit is defined as the extent to which the individual performs a behaviour
automatically (Venkatesh et al., 2012). Previous studies report evidence that once the habit is
formed, it can have a direct effect on the future usage behaviour (Hu et al., 2017; Verplanken,
2006). Other studies have also evaluated the effect of habit on the continuance intention to use.
For instance, Veeramootoo, Nunkoo, and Dwivedi (2018) showed evidence that habit has a
positive effect on the continued intention to use e-government services.
H3. Habit positively impacts the use behaviour of e-participation.
H4. Habit positively impacts the continuous intention to use e-participation.
4.3.1.3 Actual use and continued intention to use
Rather than measure intention to use, which is usually measured in technology adoption
research (Goncalo Baptista & Oliveira, 2016; C. Martins, Oliveira, & Popovič, 2014), continuous
intention to use is considered a more appropriate variable when users already have experienced
the e-participation technologies (Bhattacherjee, 2001; Hoehle & Venkatesh, 2015a). Continuous
intention to use is defined as the degree to which a citizen perceives that (s)he will continue
using e-participation in the future (Hoehle & Venkatesh, 2015a). The rationale is that a citizen
who uses e-participation to contribute to her/his community over time will keep the intention
to continuously use the system in the long term.
H5. Usage positively impacts the continuous intention to use e-participation.
4.3.1.4 Sense of virtual community (SOVC)
One of the goals of using e-participation is to involve citizens in consultation and decision-
making process that have an impact on the community they belong to or to which they have
some affective ties. Existing literature provides evidence to support the belief that citizens who
are involved in different forms of civic engagement and community activities also show high
levels of sense of community (Peterson et al., 2008; Talò et al., 2014). When citizens who are
involved in community activities use e-participation technologies, the levels of sense of
community may still be present in them, and this feeling may play a role as motivator to keep
using e-participation technologies over time.
Sense of virtual community is a multidimensional construct (Koh & Kim, 2003; Peterson
et al., 2008). Koh and Kim (2003) define three dimensions to measure SOVC: immersion,
influence, and membership. These dimensions are measured as second-order structure because

65 | P a g e
earlier studies have demonstrated that the dimensions of SOVC can be considered as
representing one SOVC construct (Peterson et al., 2008). In our research model SOVC is
hypothesised as a second-order construct of a reflective-formative type (Becker et al., 2012).
In the context of e-participation, (i) immersion is defined as the state of flow the citizens
may experience when using the system (Koh & Kim, 2003). For instance, in the case of online
participatory budgeting (Sintomer et al., 2013) citizens may find interesting the diversity of
project proposals available on the platform and keep exploring them, thereby reaching some
level of immersion, or in the case of a discussion forum, citizens may become immersed in a
discussion of a policy. (ii) Influence is the degree to which a citizen perceives that (s)he can
influence the other members in the e-participation community to share her/his view or goals
(Hsiao & Chuang, 2009; Koh & Kim, 2003). For instance, by sharing on the online social networks
the contributions made on e-participation, citizens may experience the feeling of influencing the
decision(s) of others, and therefore keep the interest in using e-participation. (iii) Membership,
or sense of belonging, is defined as the feeling of belonging to a community (Koh & Kim, 2003).
A group of citizens who use e-participation toward a common goal may experience the feeling
of membership even without knowing each other in person, for instance, e-voting for a project
of common interest for the members to be implemented in the community. Sense of belonging
was found to have the strongest impact on electronic word of mouth intention (Cheung & Lee,
2012).
Previous studies have confirmed a significant and positive effect of the SOVC to boost
social support in a virtual community (Y.-H. Tsai, Joe, Lin, Wang, & Chang, 2012). Chen, Yang,
Wang, and Farn (2008) found that SOVC has a positive and significant effect on behavioural
loyalty in the consumer context when the individuals are part of a virtual community. We posit
that the levels of SOVC in citizens can positively influence the continuous use of e-participation.
H6. SOVC positively impacts the use behaviour of e-participation.
Mesch and Talmud (2010) claimed that civic participation and sense of attachment to
the local communities can be increased by the participation in different forms of e-participation
(e.g. local electronic forums). SOVC not only may have a direct effect on the behavioural
intention to continuously use e-participation, but may also have an augmenting effect on that
behaviour when there are ties between the members of that community (Bansal & Voyer, 2012).
Previous studies found that SOVC has a significant positive effect as moderator of the intention
to engage in word of mouth in the context of disseminating word of mouth (Hsiao & Chuang,

66 | P a g e
2009). Moreover, SOVC has been also been found to have a positive effect on the purchase
intention in the context of online group buying (M.T. Tsai, Cheng, & Chen, 2011).
H7. The stronger the SOVC is in the citizen, the stronger will be the relationship between the
citizen’s use behaviour and the continuous intention to use e-participation.
H8. SOVC positively impacts the continuous intention to use e-participation.
4.4 Methodology
4.4.1 Research context
In the last decade several local governments in Portuguese cities and around the world have
implemented the so called online participatory budgeting (Allegretti & Antunes, 2014), which
are decision-oriented e-participation platforms. This implementation process can be
summarized in five steps that take place cyclically throughout the year: (i) online submission of
proposals from the citizens, (ii) technical feasibility analysis of the proposals submitted, (iii)
promotion of the final list of projects for public voting, (iv) citizens participating in the voting
process, mostly by SMS, and finally, (v) announcement of the winning projects to be funded and
implemented by the local government. For the evaluation of our research model, we use data
collected from the users who experienced an online participatory budgeting platform. Online
participatory platforms promote the direct involvement of citizens in consultation and the
decision making-process. The main activities that citizens are able to do regarding the online
participatory budgeting are: the submission of project initiatives, the search for information
about the initiatives submitted by other citizens and the progress status of the winning ones
from previous years, SMS vote for a candidate project, and the promotion on social networks of
the projects submitted.
4.4.2 Measurement and data collection
All measurement items were adapted from the literature and adjusted to the context of e-
participation. The items for the constructs facilitating conditions, habit, and technology use,
were adjusted from Venkatesh et al. (2012), continuous intention to use from Hsu, Yen, Chiu,
and Chang (2006). The items pertaining to SOVC, namely immersion, influence, and
membership, were adapted from Koh and Kim (2003). The variables were measured by multiple-
type close-ended questions on a seven-point scale from 1 (totally disagree) to 7 (totally agree).
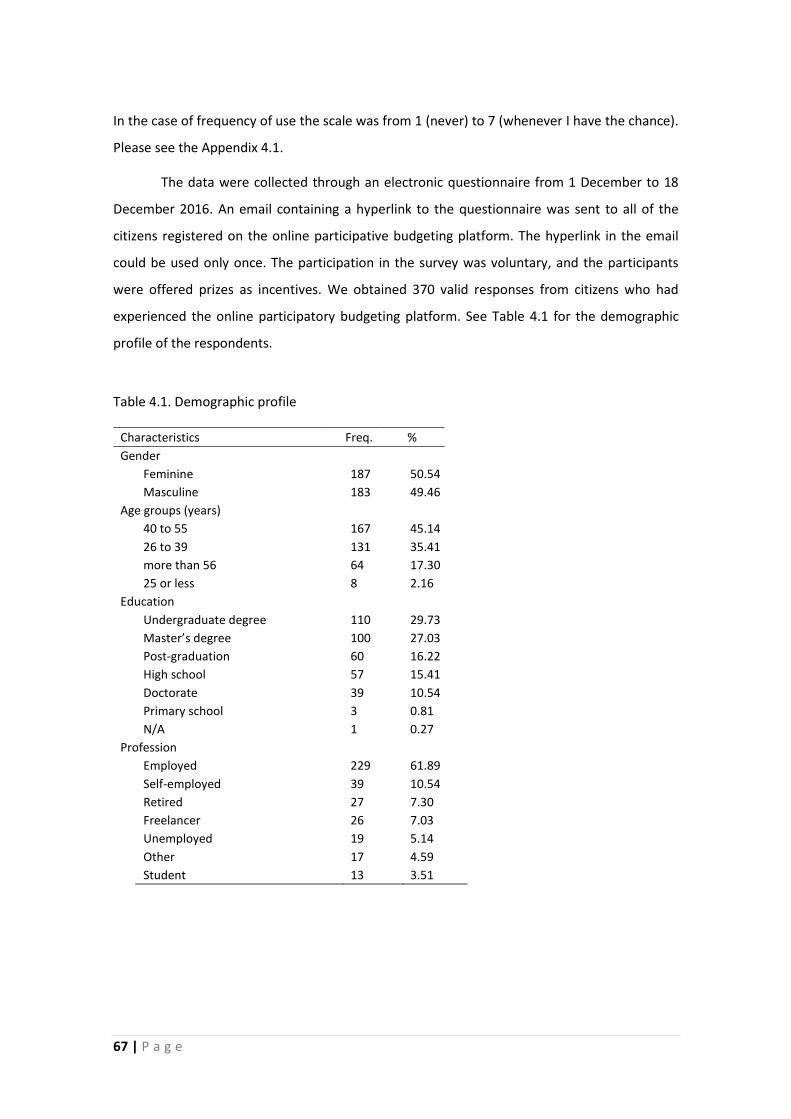
67 | P a g e
In the case of frequency of use the scale was from 1 (never) to 7 (whenever I have the chance).
Please see the Appendix 4.1.
The data were collected through an electronic questionnaire from 1 December to 18
December 2016. An email containing a hyperlink to the questionnaire was sent to all of the
citizens registered on the online participative budgeting platform. The hyperlink in the email
could be used only once. The participation in the survey was voluntary, and the participants
were offered prizes as incentives. We obtained 370 valid responses from citizens who had
experienced the online participatory budgeting platform. See Table 4.1 for the demographic
profile of the respondents.
Table 4.1. Demographic profile
Characteristics Freq. %
Gender
Feminine 187 50.54
Masculine 183 49.46
Age groups (years)
40 to 55 167 45.14
26 to 39 131 35.41
more than 56 64 17.30
25 or less 8 2.16
Education
Undergraduate degree 110 29.73
Master’s degree 100 27.03
Post-graduation 60 16.22
High school 57 15.41
Doctorate 39 10.54
Primary school 3 0.81
N/A 1 0.27
Profession
Employed 229 61.89
Self-employed 39 10.54
Retired 27 7.30
Freelancer 26 7.03
Unemployed 19 5.14
Other 17 4.59
Student 13 3.51

68 | P a g e
4.5 Results
4.5.1 Measurement model
All the constructs in our model have reflective indicators. SOVC is of a second-order construct
that has first-order components of the formative type: influence, immersion, and membership.
Following the guidelines of Hair, Hult, Ringle, and Sarstedt (2014), this study assesses the
internal consistency, convergent validity, and discriminant validity of the measurement model
(see Table 4.2). Internal consistency is assessed by Cronbach’s alfa (CA) and composite reliability
(CR). Both values are above 0.7 for all latent variables. Convergent validity is assessed by the
average variance extracted (AVE) and the loadings (see Appendix 4.1), which are above 0.5 and
0.7 respectively in almost all cases. Only the loading FC4 obtained a lower value (0.65), but we
decided to keep it due to the proximity to 0.7. Finally, discriminant validity was tested using
three criteria, (i) the cross-loadings, in which the loading of each indicator is greater than any of
the cross-loadings, (ii) the Fornell & Larcker (1981), which requires that the square root of AVE
should be greater than its correlation with any other construct, and (iii) Heterotrait-Monotrait
Ratio (HTMT) (Henseler, Ringle, et al., 2015), which requires HTMT values below 0.9 (Table 4.3)
for good discriminant validity. We assess multicollinearity for formative constructs. SOVC is
modelled as a higher-order reflective-formative type (Becker et al., 2012). Multicollinearity is
evaluated by the variance inflation factor (VIF). The VIF values range from 2.09 to 3.42, which
are below 5, indicating no collinearity issues (Table 4.4). Consequently, we conclude that our
measurement model is reliable and valid.
Table 4.2. Assessment of measurement model
Construct
Mea
n
SD CA CR AVE
1 2 3 4 5 6 7
1. Facilitating conditions (FC) 6.17 1.20 0.82 0.88 0.66 0.81
2. Habit (HA) 4.36 2.00 0.71 0.83 0.63 0.35 0.79
3. Technology use (USE) 4.59 2.21 0.78 0.86 0.60 0.27 0.50 0.78
4. Continuous Intention to Use (CIU) 6.11 1.21 0.95 0.97 0.91 0.52 0.54 0.50 0.95
5. Influence (INF) 2.63 1.75 0.92 0.95 0.86 0.05 0.35 0.37 0.14 0.93
6. Immersion (INV) 2.40 1.68 0.90 0.94 0.83 0.00 0.37 0.32 0.12 0.75 0.91
7. Membership (MEM) 3.87 1.93 0.80 0.88 0.72 0.20 0.46 0.39 0.33 0.72 0.54 0.85
Notes: SD = Standard Deviation, CA = Cronbach’s Alfa, CR = Composite Reliability, AVE = Average
Variance Extracted. Square root of AVE in bold.
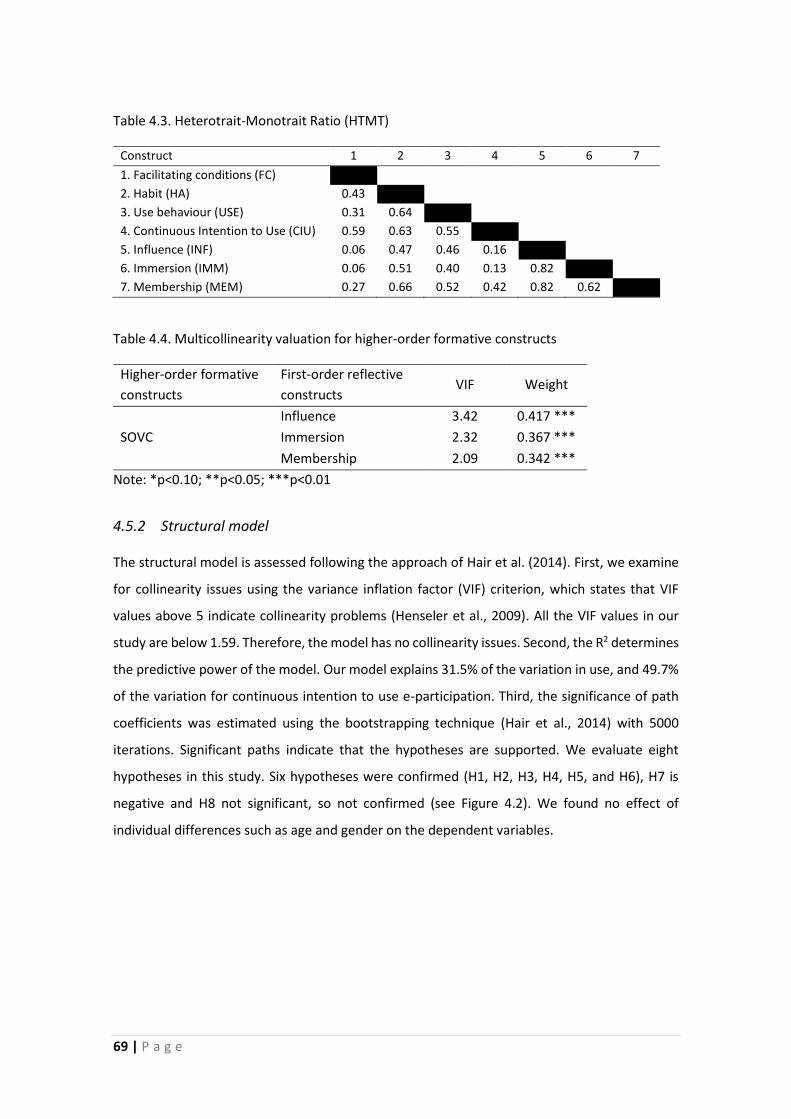
69 | P a g e
Table 4.3. Heterotrait-Monotrait Ratio (HTMT)
Construct 1 2 3 4 5 6 7
1. Facilitating conditions (FC) 2. Habit (HA) 0.43 3. Use behaviour (USE) 0.31 0.64 4. Continuous Intention to Use (CIU) 0.59 0.63 0.55 5. Influence (INF) 0.06 0.47 0.46 0.16 6. Immersion (IMM) 0.06 0.51 0.40 0.13 0.82 7. Membership (MEM) 0.27 0.66 0.52 0.42 0.82 0.62
Table 4.4. Multicollinearity valuation for higher-order formative constructs
Higher-order formative
constructs
First-order reflective
constructs VIF Weight
SOVC
Influence 3.42 0.417 ***
Immersion 2.32 0.367 ***
Membership 2.09 0.342 ***
Note: *p<0.10; **p<0.05; ***p<0.01
4.5.2 Structural model
The structural model is assessed following the approach of Hair et al. (2014). First, we examine
for collinearity issues using the variance inflation factor (VIF) criterion, which states that VIF
values above 5 indicate collinearity problems (Henseler et al., 2009). All the VIF values in our
study are below 1.59. Therefore, the model has no collinearity issues. Second, the R2 determines
the predictive power of the model. Our model explains 31.5% of the variation in use, and 49.7%
of the variation for continuous intention to use e-participation. Third, the significance of path
coefficients was estimated using the bootstrapping technique (Hair et al., 2014) with 5000
iterations. Significant paths indicate that the hypotheses are supported. We evaluate eight
hypotheses in this study. Six hypotheses were confirmed (H1, H2, H3, H4, H5, and H6), H7 is
negative and H8 not significant, so not confirmed (see Figure 4.2). We found no effect of
individual differences such as age and gender on the dependent variables.
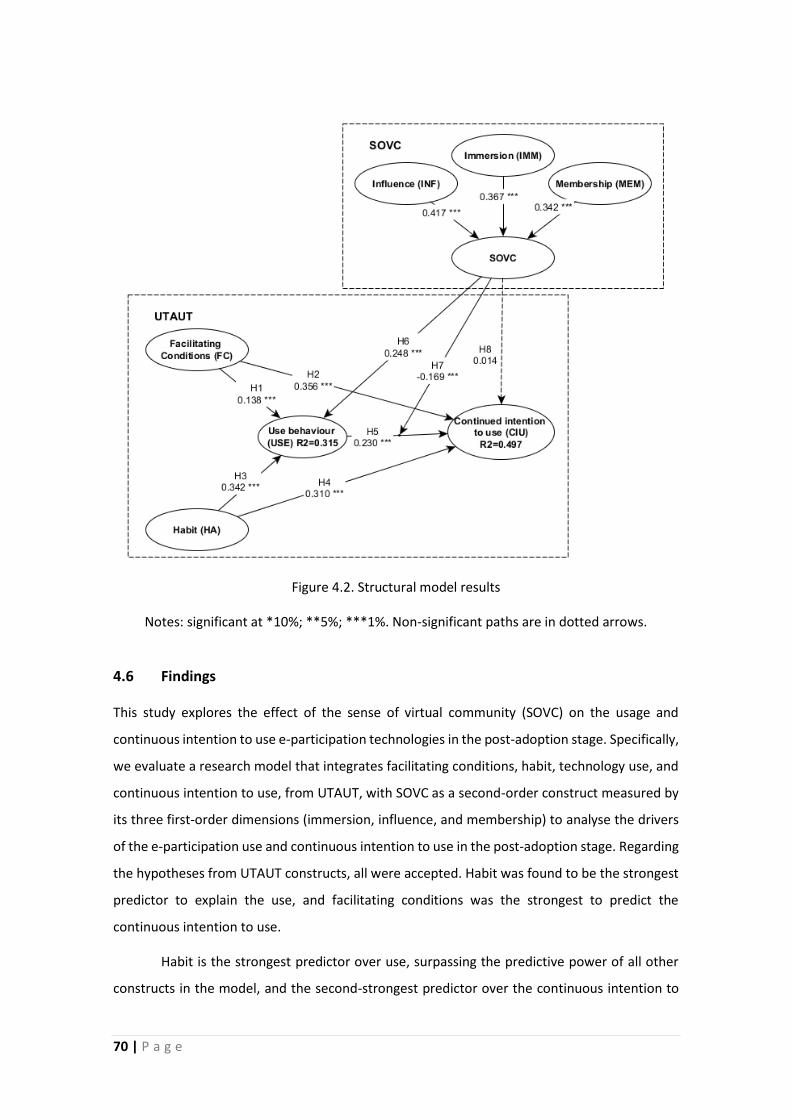
70 | P a g e
Figure 4.2. Structural model results
Notes: significant at *10%; **5%; ***1%. Non-significant paths are in dotted arrows.
4.6 Findings
This study explores the effect of the sense of virtual community (SOVC) on the usage and
continuous intention to use e-participation technologies in the post-adoption stage. Specifically,
we evaluate a research model that integrates facilitating conditions, habit, technology use, and
continuous intention to use, from UTAUT, with SOVC as a second-order construct measured by
its three first-order dimensions (immersion, influence, and membership) to analyse the drivers
of the e-participation use and continuous intention to use in the post-adoption stage. Regarding
the hypotheses from UTAUT constructs, all were accepted. Habit was found to be the strongest
predictor to explain the use, and facilitating conditions was the strongest to predict the
continuous intention to use.
Habit is the strongest predictor over use, surpassing the predictive power of all other
constructs in the model, and the second-strongest predictor over the continuous intention to
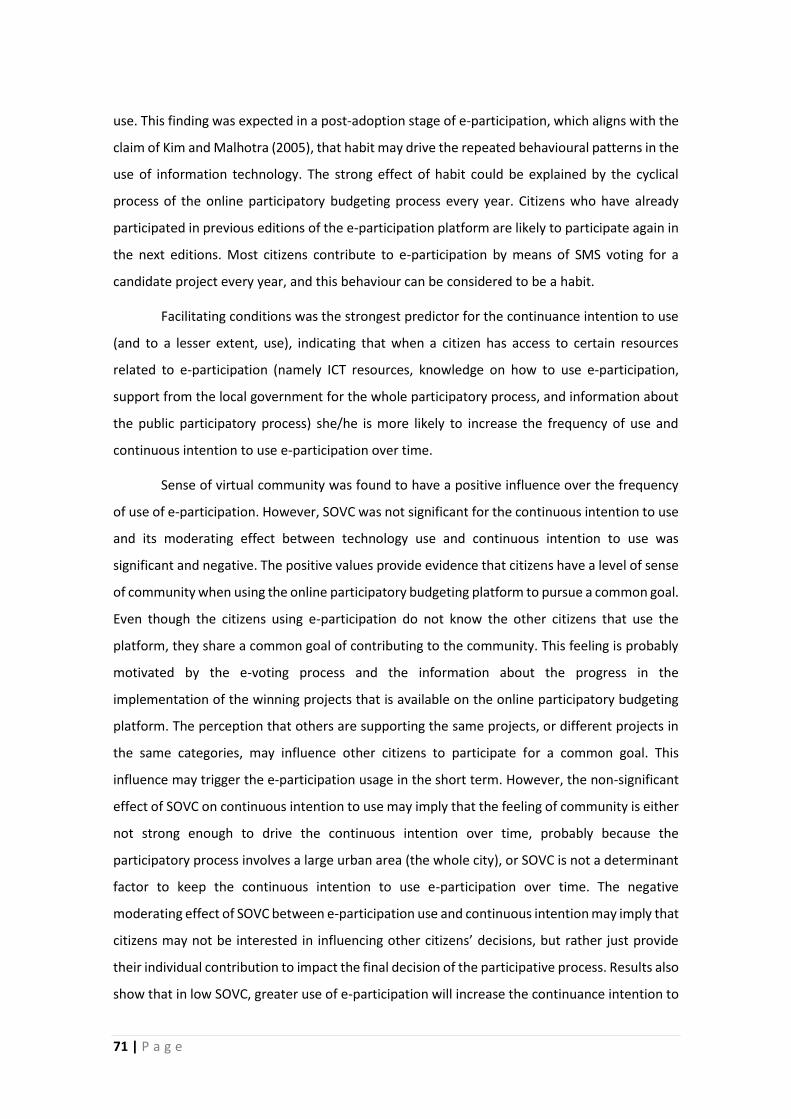
71 | P a g e
use. This finding was expected in a post-adoption stage of e-participation, which aligns with the
claim of Kim and Malhotra (2005), that habit may drive the repeated behavioural patterns in the
use of information technology. The strong effect of habit could be explained by the cyclical
process of the online participatory budgeting process every year. Citizens who have already
participated in previous editions of the e-participation platform are likely to participate again in
the next editions. Most citizens contribute to e-participation by means of SMS voting for a
candidate project every year, and this behaviour can be considered to be a habit.
Facilitating conditions was the strongest predictor for the continuance intention to use
(and to a lesser extent, use), indicating that when a citizen has access to certain resources
related to e-participation (namely ICT resources, knowledge on how to use e-participation,
support from the local government for the whole participatory process, and information about
the public participatory process) she/he is more likely to increase the frequency of use and
continuous intention to use e-participation over time.
Sense of virtual community was found to have a positive influence over the frequency
of use of e-participation. However, SOVC was not significant for the continuous intention to use
and its moderating effect between technology use and continuous intention to use was
significant and negative. The positive values provide evidence that citizens have a level of sense
of community when using the online participatory budgeting platform to pursue a common goal.
Even though the citizens using e-participation do not know the other citizens that use the
platform, they share a common goal of contributing to the community. This feeling is probably
motivated by the e-voting process and the information about the progress in the
implementation of the winning projects that is available on the online participatory budgeting
platform. The perception that others are supporting the same projects, or different projects in
the same categories, may influence other citizens to participate for a common goal. This
influence may trigger the e-participation usage in the short term. However, the non-significant
effect of SOVC on continuous intention to use may imply that the feeling of community is either
not strong enough to drive the continuous intention over time, probably because the
participatory process involves a large urban area (the whole city), or SOVC is not a determinant
factor to keep the continuous intention to use e-participation over time. The negative
moderating effect of SOVC between e-participation use and continuous intention may imply that
citizens may not be interested in influencing other citizens’ decisions, but rather just provide
their individual contribution to impact the final decision of the participative process. Results also
show that in low SOVC, greater use of e-participation will increase the continuance intention to
72 | P a g e
use in the citizen. On the other hand, in high SOVC, the low or high levels of e-participation
usages will not have an impact on the continuance intention to use (Figure 4.3).
Figure 4.3. Moderating effect of SOVC between technology use and continuous intention to
use
4.7 Implications for practice
The significant effect of habit over the usage and continued intention to use e-participation may
imply (for public agencies and local governments that implement e-participation) that citizens
who have already developed the habit of contributing through e-participation may be willing to
engage in new and more advanced forms of e-participation. This could represent an opportunity
for local governments that are seeking to increase the levels of public trust and higher levels of
citizen involvement (Abu-Shanab, 2014; Lee & Kim, 2018).
Hypotheses related to facilitating conditions were also confirmed. Local governments
that implement e-participation should pay special attention to two resources related to the use
of e-participation: (1) the clarity, accessibility, and availability online of the information about
the participatory process. As e-participation is strictly voluntary, citizens may be demotivated
from using the e-participation platform if they cannot find information in an effortless manner.
And (2) the usage of e-participation platforms is only a small portion of the participatory process,
which also involves background processes (Shareef, Kumar, Kumar, & Dwivedi, 2011). Local
governments that implement e-participation projects should ensure that the participants

73 | P a g e
involved in consultation and decision-making process have support throughout the entire
participatory process.
SOVC showed a partial effect on the continuous use of e-participation in the post-
adoption stage. This could be an indication that when e-participation is implemented in larger
urban areas, for instance at the level of the city of Lisbon, the influence of sense of community
decreases as a driver of continued intention to use e-participation. Consequently, local
governments may consider different strategies to promote the use of e-participation when
addressing a city level as when addressing at a neighbourhood level (Acedo, Painho, et al., 2017).
4.8 Conclusions
Local governments are making endeavours to engage citizens in consultation and decision-
making processes through their e-government platforms. In the case of traditional (physical)
forms of citizen participation, the literature review suggests that the level of sense of community
is positively associated with civic engagement and involvement in active participation. However,
our evidence shows that when the sense of community is mediated by an information
technology, such e-participation, the sense of virtual community has a positive effect only on
the usage of e-participation tools but is not enough to keep the motivation to use the system
over time.
• In an online environment, the sense of community plays a less important role to
engage citizens than in traditional participation.
Since e-participation is place and time independent, it allows the inclusion of more citizens in
the participatory process in a much wider geographical area, which at the same time will
diminish the effect of sense of community as driver of citizen engagement in e-participation.
• Local governments that aim to engage citizens in online participation should take into
consideration the size of the community to design their diffusion and promotion
strategies.
In the post-adoption stage, habit and facilitating conditions have a significant effect on the use
and continuous intention to use e-participation. The implementation of e-participation systems
that achieve the adoption and continuous usage over time is still challenging for local
governments. The positive effect of habit on e-participation usage may represent an indicator
74 | P a g e
of success in the e-participation usage over time.
• In the post-adoption stage, habit plays a stronger role than sense of community as driver
of e-participation adoption.
4.9 Limitations and future research
This study has two limitations. First, the data for the study were collected in Portugal. Therefore,
caution is suggested regarding generalization of the findings. Factors such as cultural differences
(Hofstede et al., 2010), or a different research context may affect the final results. Future
research may include cultural dimensions or test different e-participation contexts. Second, only
one hypothesis from SOVC was accepted. Future research is needed to evaluate different
scenarios and different e-participation platforms that may confirm or contradict the findings of
this study regarding the effect of SOVC over use and continuous intention to use e-participation
in the post-adoption stage. Moreover, since habit was found to be the strongest predictor of
use, we suggest including the construct habit for future research on e-participation and
investigate whether the sense of community may have an influence on the development of habit
over time.
75 | P a g e
Chaper 5 - Continued intention to use online participatory budgeting:
The effect of empowerment and habit
5.1 Introduction
Participatory budgeting started in Porto Alegre (Brazil) in 1989 (Matheus, Ribeiro, Vaz, & Souza,
2010) and since then rapidly gained popularity all around the world. Participatory budgeting is
considered a public participatory instrument, which in most cases is managed by the local
governments. It allows regular or non-elected citizens to participate in the allocation process of
part of the public finances (Sintomer, Herzberg, & Röcke, 2008) either providing suggestions on
where or how to spend the budget, or by voting for available proposals to be implemented by
the local governments. By 2013, participative budgeting has been implemented in around 1500
cities worldwide (Baiocchi & Ganuza, 2014). Participatory budgeting is implemented in the form
of (i) offline versions (public assemblies between local governments and citizens), (ii) online
versions using ICT (Information and communication technologies) tools to interact with citizens,
for instance receiving project proposals through a web portal or balloting via SMS votes, and (iii)
hybrid versions (Miori & Russo, 2011), when the citizens can participate both online and in public
assemblies. The present article focuses on the motivations of continuous intention to use the
online version of the participatory budgeting.
The online participatory budgeting implementations can be considered a form of e-
participation, a broader concept defined as “the process of engaging citizens through ICTs in
policy and decision-making in order to make public administration participatory, inclusive,
collaborative and deliberative for intrinsic and instrumental ends (p. 61)” (United Nations, 2014).
Online participatory budgeting is seen as an example of co-governance (Ackerman, 2004), the
involvement of social actors in the activities of the state. Moreover, Matheus et al. (2010)
suggest that the use of online participatory budgeting is a way to promote citizens’ rights and
the legitimacy of the democratic system. Despite the potential advantages of using digital
participatory budgeting, its diffusion and long-lasting adoption still represent a significant
challenge for local governments. For instance, in many German cities, online participative
budgeting is considered as an online suggestion box and 40% of citizens have rated it as a bad
participatory instrument (Kersting, 2016). Omar et al. (2017) caution that given the failure of
past e-participation platforms due to low adoption, the online participatory budgeting is also at
risk. Alves & Allegretti (2012) discuss the fragility and volatility of participative budgeting
implementations in various cases in Portugal.

76 | P a g e
Several implementations of digital participatory budgeting around the globe have been
examined from the qualitative perspective. For instance, Matheus et al. (2010) analysed case
studies of digital participatory budgeting in Latin American cities, whereas Mkude et al. (2014)
contributed to case studies of participatory budgeting in European cities. Nevertheless,
quantitative studies on the factors that may motivate the usage of online participatory
budgeting in the long-term scenario are scarce. Peixoto (2009) highlights that the lack of data at
individual level concerning the motivations of the citizens who participated in online
participatory budgeting represents a limitation to evaluate each motivational factor or which
are more important. This study contributes filling the gap by assessing the influence of the
psychological empowerment (Miguel, Ornelas, & Maroco, 2015) and habit (Venkatesh et al.,
2012) as inner motivators for the continued intention to use online participatory budgeting. The
implementation of online participatory budgeting in Lisbon is an ideal case of research due to
its increasing success in the number of votes year after year. The authors build and evaluate a
research model that is evaluated using structural equation modelling (Hair et al., 2014) based
on the data collected from the users of the online participative budgeting in the city of Lisbon.
Besides the evaluation of empowerment and habit, the article also provides a multigroup
analysis to find individual differences in terms of age and gender.
The rest of the paper is organized as follows, in section 2 the authors describe the online
participatory budgeting in the city of Lisbon. Section 3 provides the theoretical background for
the research model and hypothesis development. Section 4 describes the methodology used.
Section 5 shows the calculations for the measurement and structural models. Section 6 discusses
the results. And lastly, section 7 presents the conclusions.
5.2 Online participatory budgeting in the city of Lisbon
Participatory budgeting is an e-participation instrument implemented by the local governments
to involve regular citizens in the process of suggesting, debating and/or deciding on the
allocation of a portion of public budget managed by the local government (Sintomer et al.,
2008). Some implementations of online participatory budgeting have been described as a form
of online suggestion box (Kersting, 2016), whereas the Lisbon case, was described as providing
“effective decision-making power to the citizens” (Allegretti & Antunes, 2014).
By 2017, according to negocios.pt (2017), one of the best local business newspapers,
Portugal accounted for 118 participatory budgeting implementations, making it one of the
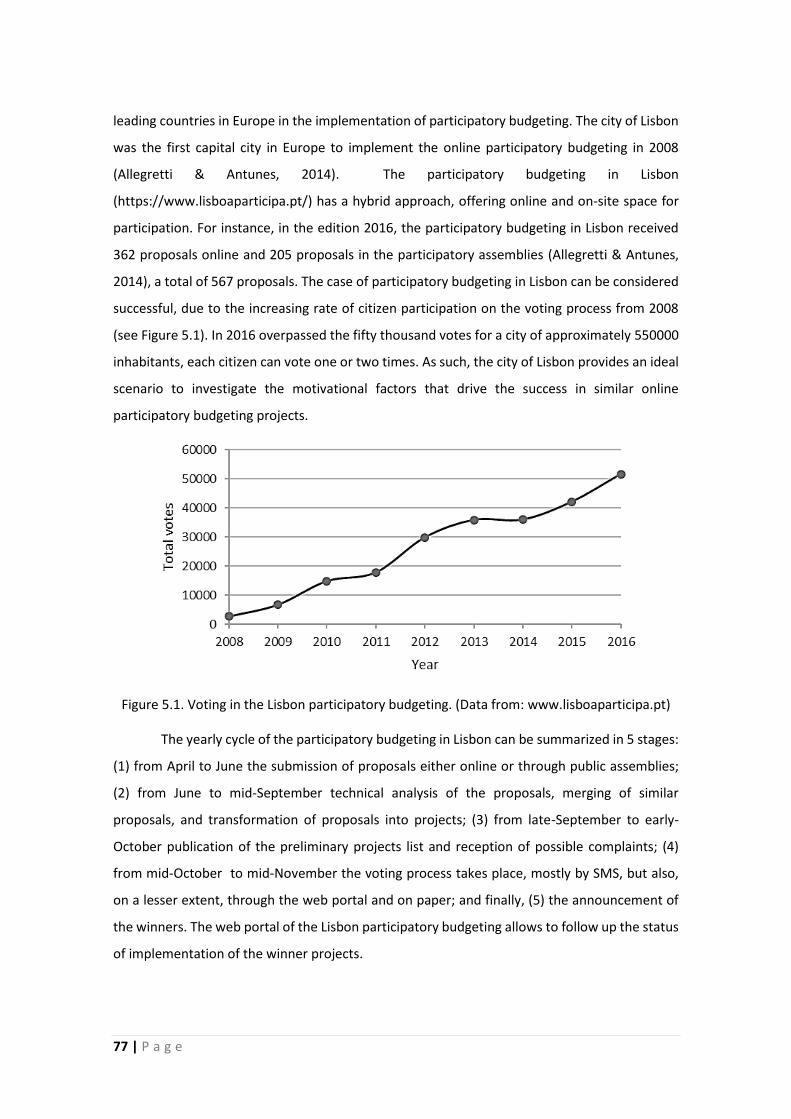
77 | P a g e
leading countries in Europe in the implementation of participatory budgeting. The city of Lisbon
was the first capital city in Europe to implement the online participatory budgeting in 2008
(Allegretti & Antunes, 2014). The participatory budgeting in Lisbon
(https://www.lisboaparticipa.pt/) has a hybrid approach, offering online and on-site space for
participation. For instance, in the edition 2016, the participatory budgeting in Lisbon received
362 proposals online and 205 proposals in the participatory assemblies (Allegretti & Antunes,
2014), a total of 567 proposals. The case of participatory budgeting in Lisbon can be considered
successful, due to the increasing rate of citizen participation on the voting process from 2008
(see Figure 5.1). In 2016 overpassed the fifty thousand votes for a city of approximately 550000
inhabitants, each citizen can vote one or two times. As such, the city of Lisbon provides an ideal
scenario to investigate the motivational factors that drive the success in similar online
participatory budgeting projects.
Figure 5.1. Voting in the Lisbon participatory budgeting. (Data from: www.lisboaparticipa.pt)
The yearly cycle of the participatory budgeting in Lisbon can be summarized in 5 stages:
(1) from April to June the submission of proposals either online or through public assemblies;
(2) from June to mid-September technical analysis of the proposals, merging of similar
proposals, and transformation of proposals into projects; (3) from late-September to early-
October publication of the preliminary projects list and reception of possible complaints; (4)
from mid-October to mid-November the voting process takes place, mostly by SMS, but also,
on a lesser extent, through the web portal and on paper; and finally, (5) the announcement of
the winners. The web portal of the Lisbon participatory budgeting allows to follow up the status
of implementation of the winner projects.

78 | P a g e
5.3 Research model development
Empowerment is considered as a key motivator for public participation and engagement (Kang,
2014). In the context of online participatory budgeting, Omar et al. (2017) suggest that the use
of these systems promotes citizens’ empowerment. Empowerment is defined as a set of
individual components: competence, impact, meaning, and self-determination. This article
assesses the effect of each dimension on the continued intention to use (CIU).
The four empowerment dimensions can be described as follows: (1) Competence (COM)
can be defined as the extent to which a citizen can use the online participatory budgeting system
with enough skills and ability. For instance, be able to search and obtain information about the
candidate projects and send an SMS to vote for a project. (2) Impact (IMP) is defined as the
degree of perception that an action on the online participatory budgeting will produce the
desired effect (Sjoberg et al., 2017) by the citizen who performs the action. For instance, a citizen
that provides a vote for a project that later is implemented may perceive that she/he influenced
the implementation of that project. (3) Meaning (MEA) refers to which degree each citizen
perceives the value of an action in the online participatory budgeting. For instance, if the citizen
perceives that a candidate project in the system will bring some benefit to the community, is
more likely that the citizen vote to support the project. Finally, (4) self-determination (SDET)
refers to the perception of the degree of autonomy and freedom to interact with the online
participatory budgeting. For instance, if a citizen can vote for a candidate project without
restrictions regarding location or schedule, that citizen may be more likely use the system.
Habit (Venkatesh et al., 2012) refers to which extent a citizen performs a use behaviour
of the online participatory budgeting automatically. For the Lisbon case study, every year a new
edition of the online participatory budgeting in Lisbon is opened to call for new project proposals
and, a few months later for electronic voting to select the winning projects. This yearly cyclical
workflow may influence to develop a habit in the citizens that use the system. Habit has been
evaluated in different contexts of the information systems adoption. For instance, in mobile
banking (Gonçalo Baptista & Oliveira, 2015), online social networks (Hu et al., 2017), and e-
government services (Alharbi et al., 2017). In all those studies, the results show a statistically
significant and positive impact of habit on the intention to use the technology.
According to Venkatesh et al. (2000), individual differences such as age and gender can
affect the way citizens perceive technology, in this case online participatory budgeting. For
instance, Vicente & Novo (2014) found that men are more likely than women to express political
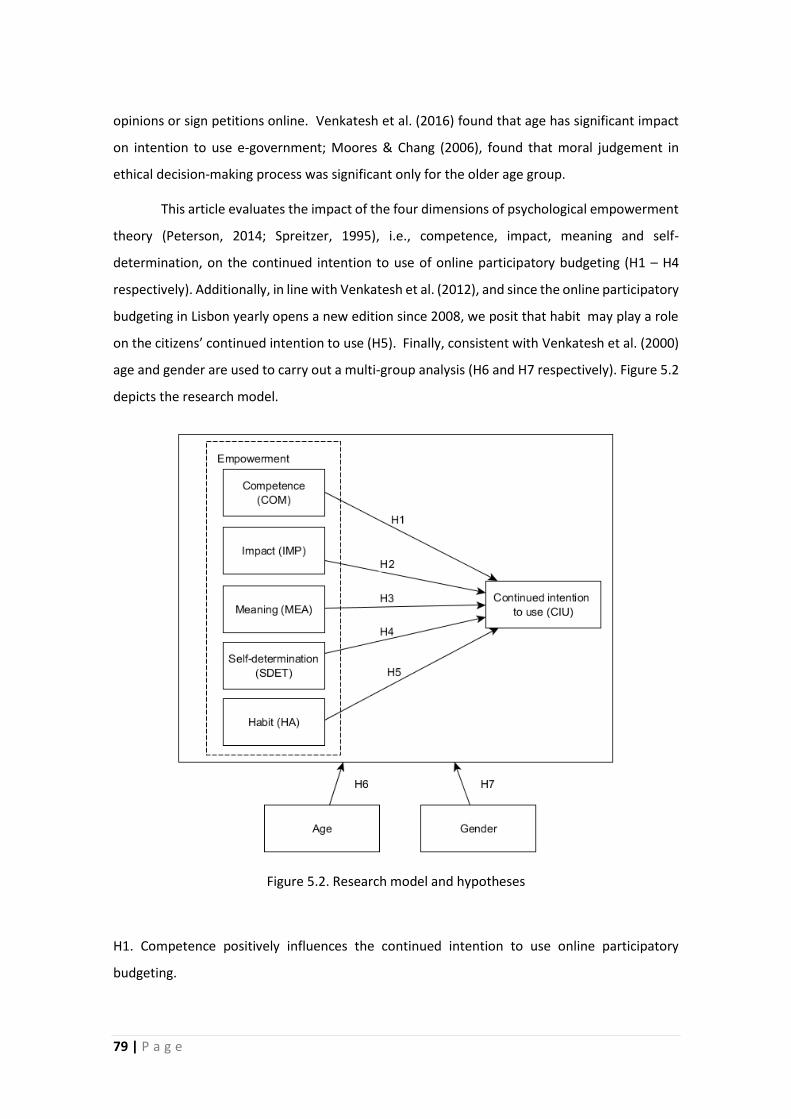
79 | P a g e
opinions or sign petitions online. Venkatesh et al. (2016) found that age has significant impact
on intention to use e-government; Moores & Chang (2006), found that moral judgement in
ethical decision-making process was significant only for the older age group.
This article evaluates the impact of the four dimensions of psychological empowerment
theory (Peterson, 2014; Spreitzer, 1995), i.e., competence, impact, meaning and self-
determination, on the continued intention to use of online participatory budgeting (H1 – H4
respectively). Additionally, in line with Venkatesh et al. (2012), and since the online participatory
budgeting in Lisbon yearly opens a new edition since 2008, we posit that habit may play a role
on the citizens’ continued intention to use (H5). Finally, consistent with Venkatesh et al. (2000)
age and gender are used to carry out a multi-group analysis (H6 and H7 respectively). Figure 5.2
depicts the research model.
Figure 5.2. Research model and hypotheses
H1. Competence positively influences the continued intention to use online participatory
budgeting.
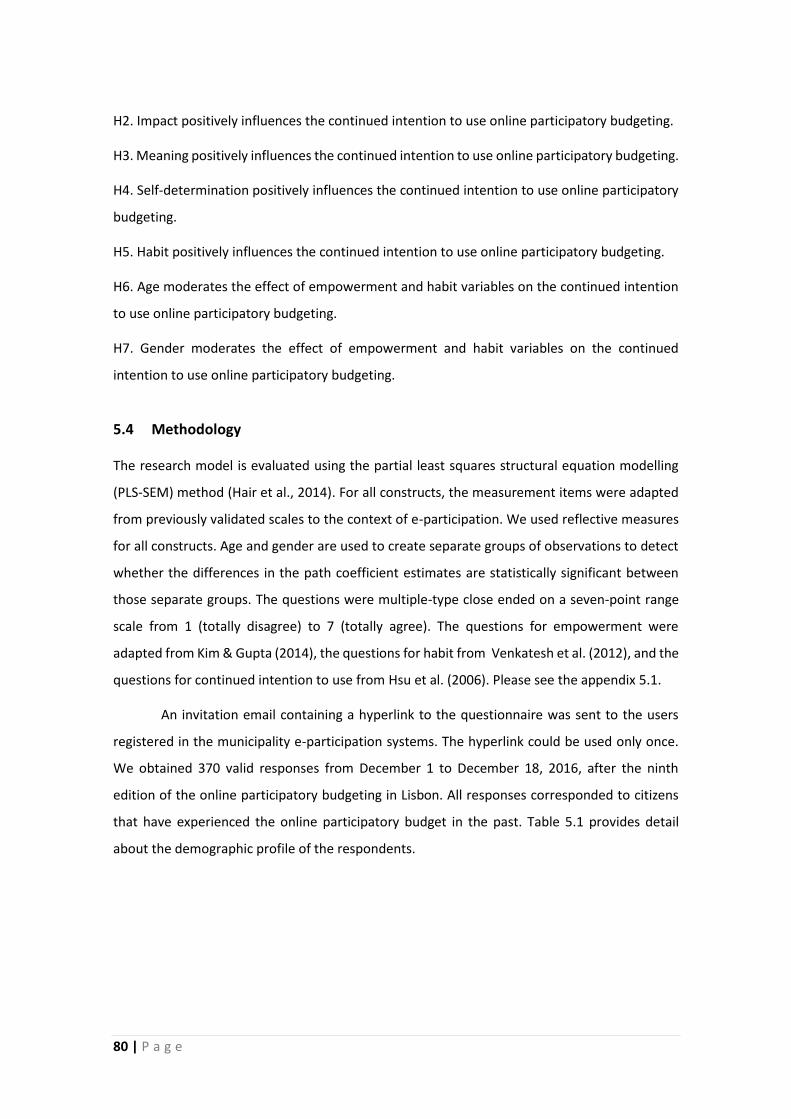
80 | P a g e
H2. Impact positively influences the continued intention to use online participatory budgeting.
H3. Meaning positively influences the continued intention to use online participatory budgeting.
H4. Self-determination positively influences the continued intention to use online participatory
budgeting.
H5. Habit positively influences the continued intention to use online participatory budgeting.
H6. Age moderates the effect of empowerment and habit variables on the continued intention
to use online participatory budgeting.
H7. Gender moderates the effect of empowerment and habit variables on the continued
intention to use online participatory budgeting.
5.4 Methodology
The research model is evaluated using the partial least squares structural equation modelling
(PLS-SEM) method (Hair et al., 2014). For all constructs, the measurement items were adapted
from previously validated scales to the context of e-participation. We used reflective measures
for all constructs. Age and gender are used to create separate groups of observations to detect
whether the differences in the path coefficient estimates are statistically significant between
those separate groups. The questions were multiple-type close ended on a seven-point range
scale from 1 (totally disagree) to 7 (totally agree). The questions for empowerment were
adapted from Kim & Gupta (2014), the questions for habit from Venkatesh et al. (2012), and the
questions for continued intention to use from Hsu et al. (2006). Please see the appendix 5.1.
An invitation email containing a hyperlink to the questionnaire was sent to the users
registered in the municipality e-participation systems. The hyperlink could be used only once.
We obtained 370 valid responses from December 1 to December 18, 2016, after the ninth
edition of the online participatory budgeting in Lisbon. All responses corresponded to citizens
that have experienced the online participatory budget in the past. Table 5.1 provides detail
about the demographic profile of the respondents.

81 | P a g e
Table 5.1. Demographic profile
Characteristics Freq. %
Gender
Feminine 187 50.54
Masculine 183 49.46
Age groups (years)
40 or less 164 45.14
41 and more 206 54.86
Education
Bachelor 110 29.73
Master’s degree 100 27.03
Post-graduation 60 16.22
High school 57 15.41
Doctorate 39 10.54
Primary school 3 0.81
NS/NR 1 0.27
Profession
Employed 229 61.89
Self-employed 39 10.54
Retired 27 7.3
Freelancer 26 7.03
Unemployed 19 5.14
Other 17 4.59
Student 13 3.51
5.5 Results
5.5.1 Measurement Model
We follow the guidelines of Hair et al. (2014) to evaluate the measurement model. Internal
consistency, convergent validity, and discriminant validity are analysed for the measurement
items. We used SmartPLS 3.0 software (Ringle et al., 2015) for the model estimation. The criteria
to assess for internal consistency are Cronbach’s alfa (CA) and composite reliability (CR), which
are both above 0.7 for all latent variables. Average variance extracted (AVE) and the loadings
are used to assess the convergent validity, both results above 0.5 and 0.7 respectively in almost
all cases, except for HA2 (0.68). Although, due to its proximity to 0.7 we decided to keep the
item (see Table 5.2). Finally, we tested discriminant validity by two criteria: the cross-loadings,
where the loading of each indicator must be greater that the cross-loadings (Table 5.2), and
using Fornell & Larcker (1981), which states that the square root of AVE should be greater than
its correlation with any other construct (see Table 5.3).
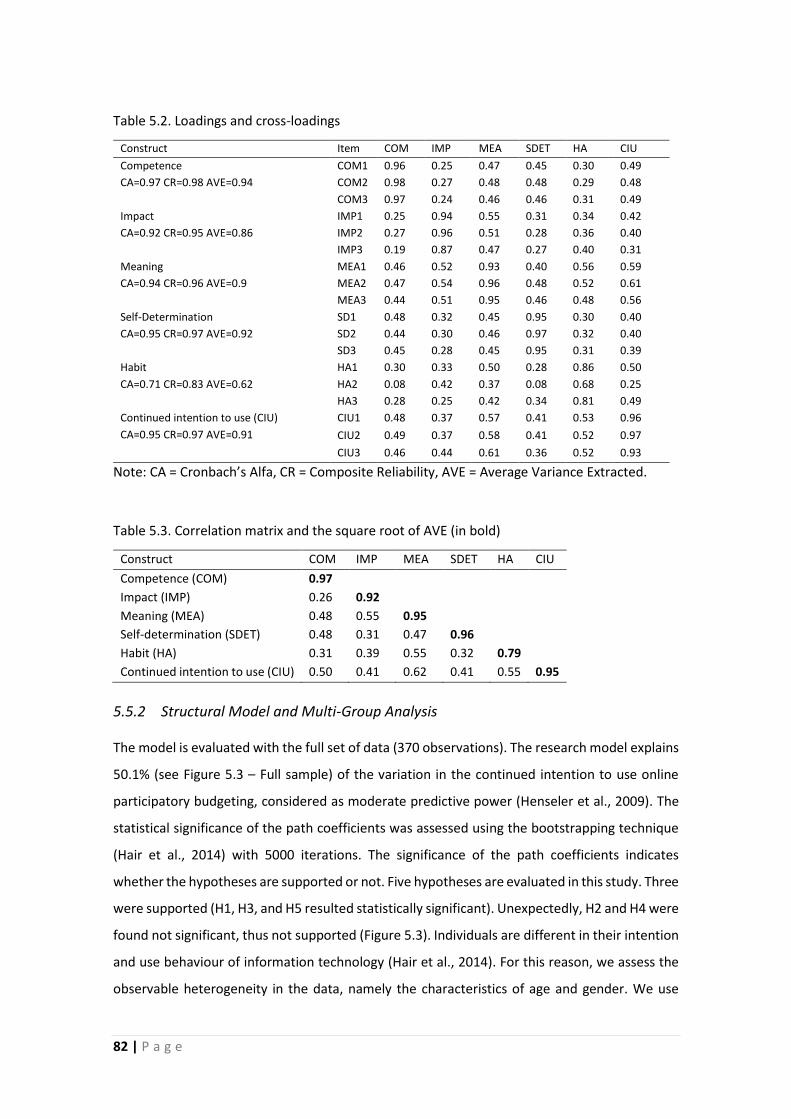
82 | P a g e
Table 5.2. Loadings and cross-loadings
Construct Item COM IMP MEA SDET HA CIU
Competence
CA=0.97 CR=0.98 AVE=0.94
COM1 0.96 0.25 0.47 0.45 0.30 0.49
COM2 0.98 0.27 0.48 0.48 0.29 0.48
COM3 0.97 0.24 0.46 0.46 0.31 0.49
Impact
CA=0.92 CR=0.95 AVE=0.86
IMP1 0.25 0.94 0.55 0.31 0.34 0.42
IMP2 0.27 0.96 0.51 0.28 0.36 0.40
IMP3 0.19 0.87 0.47 0.27 0.40 0.31
Meaning
CA=0.94 CR=0.96 AVE=0.9
MEA1 0.46 0.52 0.93 0.40 0.56 0.59
MEA2 0.47 0.54 0.96 0.48 0.52 0.61
MEA3 0.44 0.51 0.95 0.46 0.48 0.56
Self-Determination
CA=0.95 CR=0.97 AVE=0.92
SD1 0.48 0.32 0.45 0.95 0.30 0.40
SD2 0.44 0.30 0.46 0.97 0.32 0.40
SD3 0.45 0.28 0.45 0.95 0.31 0.39
Habit
CA=0.71 CR=0.83 AVE=0.62
HA1 0.30 0.33 0.50 0.28 0.86 0.50
HA2 0.08 0.42 0.37 0.08 0.68 0.25
HA3 0.28 0.25 0.42 0.34 0.81 0.49
Continued intention to use (CIU)
CA=0.95 CR=0.97 AVE=0.91
CIU1 0.48 0.37 0.57 0.41 0.53 0.96
CIU2 0.49 0.37 0.58 0.41 0.52 0.97
CIU3 0.46 0.44 0.61 0.36 0.52 0.93
Note: CA = Cronbach’s Alfa, CR = Composite Reliability, AVE = Average Variance Extracted.
Table 5.3. Correlation matrix and the square root of AVE (in bold)
Construct COM IMP MEA SDET HA CIU
Competence (COM) 0.97
Impact (IMP) 0.26 0.92
Meaning (MEA) 0.48 0.55 0.95
Self-determination (SDET) 0.48 0.31 0.47 0.96 Habit (HA) 0.31 0.39 0.55 0.32 0.79 Continued intention to use (CIU) 0.50 0.41 0.62 0.41 0.55 0.95
5.5.2 Structural Model and Multi-Group Analysis
The model is evaluated with the full set of data (370 observations). The research model explains
50.1% (see Figure 5.3 – Full sample) of the variation in the continued intention to use online
participatory budgeting, considered as moderate predictive power (Henseler et al., 2009). The
statistical significance of the path coefficients was assessed using the bootstrapping technique
(Hair et al., 2014) with 5000 iterations. The significance of the path coefficients indicates
whether the hypotheses are supported or not. Five hypotheses are evaluated in this study. Three
were supported (H1, H3, and H5 resulted statistically significant). Unexpectedly, H2 and H4 were
found not significant, thus not supported (Figure 5.3). Individuals are different in their intention
and use behaviour of information technology (Hair et al., 2014). For this reason, we assess the
observable heterogeneity in the data, namely the characteristics of age and gender. We use
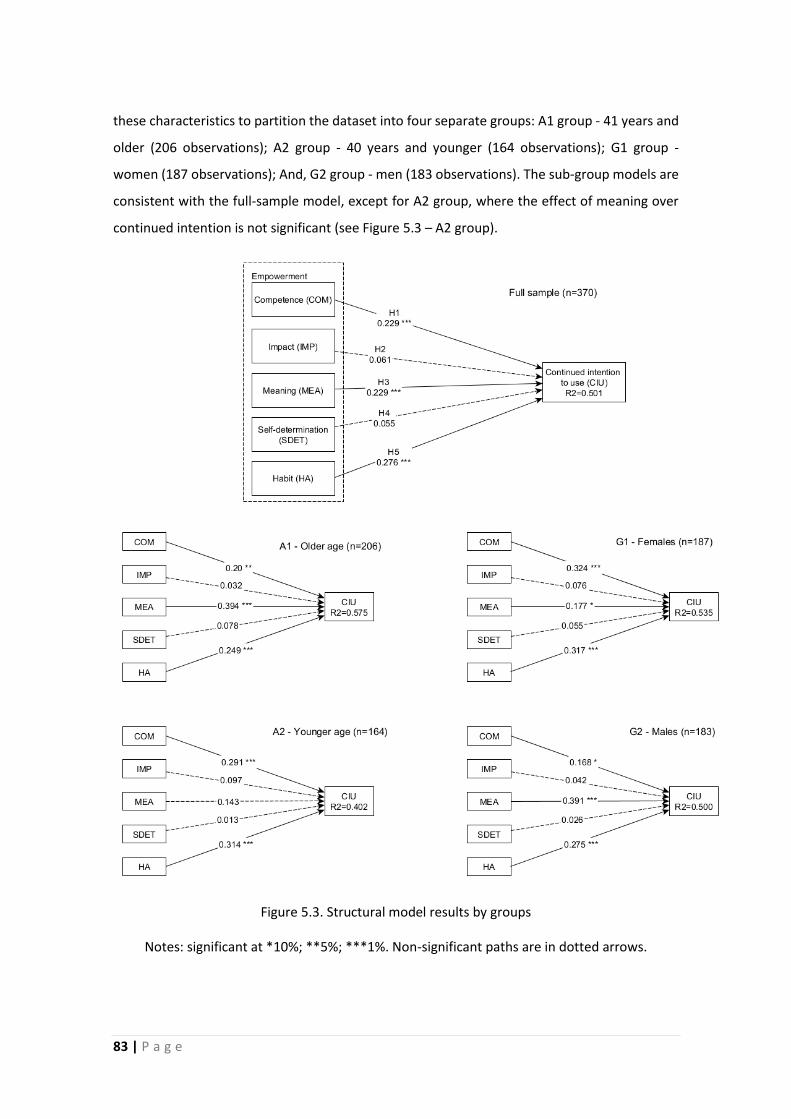
83 | P a g e
these characteristics to partition the dataset into four separate groups: A1 group - 41 years and
older (206 observations); A2 group - 40 years and younger (164 observations); G1 group -
women (187 observations); And, G2 group - men (183 observations). The sub-group models are
consistent with the full-sample model, except for A2 group, where the effect of meaning over
continued intention is not significant (see Figure 5.3 – A2 group).
Figure 5.3. Structural model results by groups
Notes: significant at *10%; **5%; ***1%. Non-significant paths are in dotted arrows.
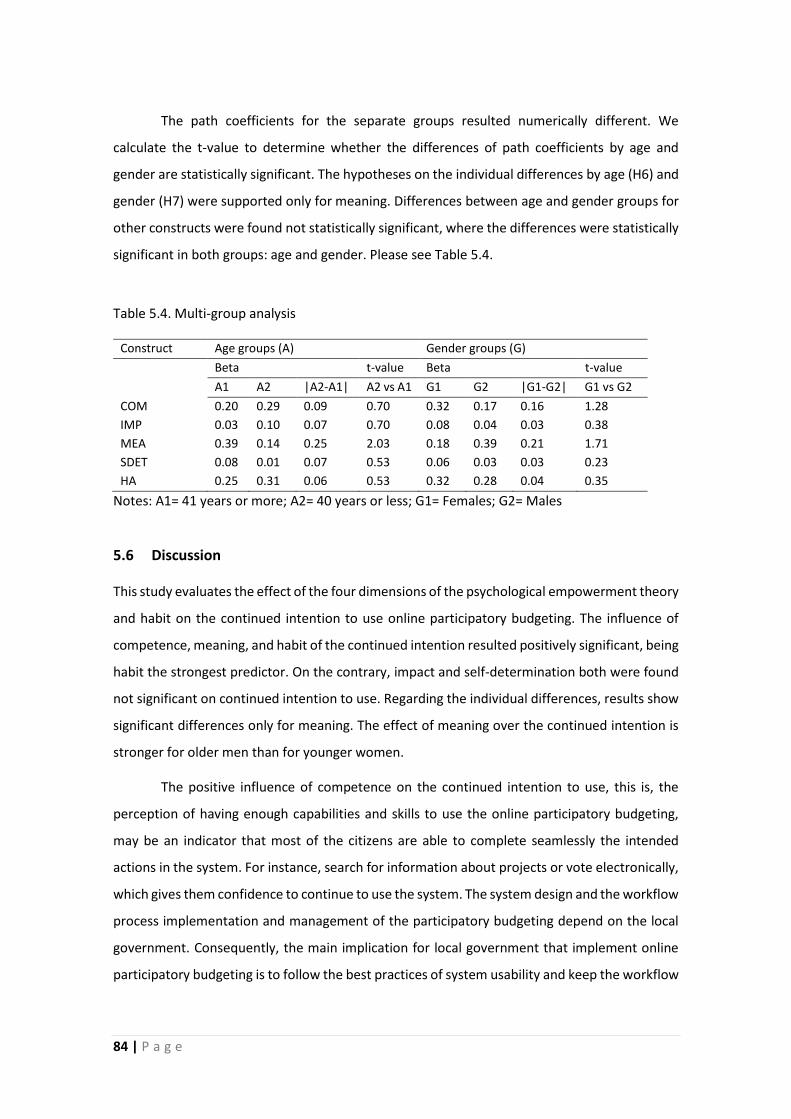
84 | P a g e
The path coefficients for the separate groups resulted numerically different. We
calculate the t-value to determine whether the differences of path coefficients by age and
gender are statistically significant. The hypotheses on the individual differences by age (H6) and
gender (H7) were supported only for meaning. Differences between age and gender groups for
other constructs were found not statistically significant, where the differences were statistically
significant in both groups: age and gender. Please see Table 5.4.
Table 5.4. Multi-group analysis
Construct Age groups (A) Gender groups (G)
Beta t-value Beta t-value
A1 A2 |A2-A1| A2 vs A1 G1 G2 |G1-G2| G1 vs G2
COM 0.20 0.29 0.09 0.70 0.32 0.17 0.16 1.28
IMP 0.03 0.10 0.07 0.70 0.08 0.04 0.03 0.38
MEA 0.39 0.14 0.25 2.03 0.18 0.39 0.21 1.71
SDET 0.08 0.01 0.07 0.53 0.06 0.03 0.03 0.23
HA 0.25 0.31 0.06 0.53 0.32 0.28 0.04 0.35
Notes: A1= 41 years or more; A2= 40 years or less; G1= Females; G2= Males
5.6 Discussion
This study evaluates the effect of the four dimensions of the psychological empowerment theory
and habit on the continued intention to use online participatory budgeting. The influence of
competence, meaning, and habit of the continued intention resulted positively significant, being
habit the strongest predictor. On the contrary, impact and self-determination both were found
not significant on continued intention to use. Regarding the individual differences, results show
significant differences only for meaning. The effect of meaning over the continued intention is
stronger for older men than for younger women.
The positive influence of competence on the continued intention to use, this is, the
perception of having enough capabilities and skills to use the online participatory budgeting,
may be an indicator that most of the citizens are able to complete seamlessly the intended
actions in the system. For instance, search for information about projects or vote electronically,
which gives them confidence to continue to use the system. The system design and the workflow
process implementation and management of the participatory budgeting depend on the local
government. Consequently, the main implication for local government that implement online
participatory budgeting is to follow the best practices of system usability and keep the workflow

85 | P a g e
as simple as possible. This will preserve the feeling of competence in the citizens and they will
be more willing to continue using the system over time.
The significant and positive effect of meaning as a motivator of the continued intention
to use online participatory budgeting implies that citizens indeed perceive that there is a value
derived from the utilization of the system, a meaningful participation (The World Bank, 2007).
This perception of value could be attributable to the implementation of the winning projects in
benefit of the community. Different from competence, the perception of meaning does not only
rely solely on the actions of local governments but also on the proposals submitted by the
citizens to the online participatory budgeting. If voters do not perceive value in the proposals,
the motivation to keep using the system in the upcoming editions may decrease. Nevertheless,
local governments may play a critical role to attract meaningful proposals. For instance, defining
the areas of interest in which the proposals should be framed. The results from the multi-group
analysis show that differences between separate groups by age and gender are significant only
for the effect of meaning over continued intention, being stronger for older men than younger
women. This finding may suggest for local governments to devote more efforts and define
strategies to promote the online participatory budgeting among younger citizens, especially
young women. The strategies should focus on increasing the perception of value derived from
using the online participatory budgeting.
Habit was found as the stronger predictor of the continued intention to use. Since the
online participatory budgeting in Lisbon started in 2008 and is still ongoing, this result is not a
surprise. The online participatory budgeting has a yearly general cyclical workflow, where most
of the citizens participate using electronic voting every year, this behaviour may be considered
a habit to a certain extent. Former studies demonstrated that habit is able to drive repeated
behavioural patterns regarding the use of information technology (Kim & Malhotra, 2005). This
finding could have positive implications for local governments. The citizens that already perceive
the use online participatory budgeting as a habit may be more willing to try and engage in new
forms of e-participation.
The effect of impact and self-determination was found not significant over continued
intention to use. In the case of impact, this may imply that the citizens do not perceive their
individual votes as a strong influence on the result of the selected projects for implementation
given the large number of votes (51591 votes in 2016). The degree of autonomy (self-
determination) to interact with online participatory budgeting seems to play a minor role over

86 | P a g e
continued intention, this may be due to the limited interaction in terms of tasks that citizens
perform in the system, which in the most of cases is limited to the search of information and
electronic voting.
5.7 Conclusion
The existence of a perception of empowerment in the citizens that may motivate the continued
intention to use online participatory budgeting is not confirmed by this study. Although, two out
of four dimensions of empowerment showed a significant and positive effect on continued
intention to use. The strongest predictor of the continued intention to use was habit, which
probably has been developed due to participation in previous editions of online participatory
budgeting. Individual differences of age and gender had no effect on the variables analysed in
this study, except on meaning, suggesting that older males perceive a higher value than young
females in the participatory budgeting. Local governments should keep the citizen perceptions
of competence and meaning high to ensure the use of online participatory budgeting over time.
Additionally, local governments should design strategies to increase the perception of meaning
regarding participatory budgeting among the young population, especially the younger women.
87 | P a g e
Chaper 6 - Satisfaction with e-participation: A model from the citizen’s
perspective, expectations, and affective ties to the place
6.1 Introduction
The United Nations e-government survey 2014 (United Nations, 2014, p. 61) defines e-
participation as “the process of engaging citizens through ICTs [information and communication
technologies] in policy and decision-making in order to make public administration participatory,
inclusive, collaborative and deliberative for intrinsic and instrumental ends”. The successful
implementation of e-participation can bring prominent benefits for the society (Royo & Yetano,
2015), as for instance, transparency, efficiency, and better quality of public services, even
reducing costs in democratic and decision-making processes (Vragov & Kumar, 2013). These
benefits are possible if a substantial number of citizens of a community or city adopt and use e-
participation in the long-term. Therefore, the level of citizen satisfaction regarding the usage of
e-participation is a crucial factor in the adoption of these technologies over time.
Citizen satisfaction with the use of e-participation and e-government systems has been
proven to improve the trust in government (Bélanger & Carter, 2008; United Nations, 2012), and
to have a direct influence in citizens’ adoption and use behaviour of the system. For instance, in
the context of e-government, a study by Foresee (2016) found that highly satisfied citizens,
compared to dissatisfied ones, are: 54% more likely to participate in democratic processes and
express their opinions, 52% more likely to return to the system, 100% more likely to recommend
the website to family and friends, and 63% more likely to trust the government agency. The
United Nations e-government survey report (2012) suggests that measuring citizens experience
and satisfaction is still a challenge, highlighting the crucial importance for governments to
improve the measurement methods and build assessment frameworks for citizens satisfaction.
However, scant literature has assessed the citizen satisfaction of e-participation (Kipenis &
Askounis, 2016; Naranjo Zolotov et al., 2018). This study proposes a conceptual model to fill this
gap.
The main contribution of this study is the development of a conceptual model to
evaluate citizens satisfaction with the use of e-participation systems, and the influence that the
level of satisfaction plays for the continued intention to use e-participation. To achieve our goal,
we propose integrating three well-known theories: The DeLone & McLean (2003) success model,
which measures satisfaction based on the perception of the e-participation system quality; the
88 | P a g e
expectation-confirmation model (ECM) (Bhattacherjee, 2001), which measures satisfaction
based on the perception of confirmation that citizens have in the post adoption stage of e-
participation; and finally, the dimensions of sense of place (SOP), which refer to the affective or
meaning ties that a citizen may have for a place, which may strengthen the level of satisfaction
when using e-participation systems.
The rest of the paper is organized as follows, Section 2 summarizes the insights from
earlier studies and the potential effects of citizen satisfaction over e-participation and e-
government initiatives. Section 3 develops the conceptual model and hypotheses proposed in
this study. Section 4 provides a conclusion and suggestions for future research.
6.2 Citizen Satisfaction
Most earlier studies have measured citizen satisfaction regarding government services
performance (Van Ryzin, 2005, 2007), finding that citizen satisfaction mainly depends on their
performance perception, which may also be influenced by external factors. The overall citizen
satisfaction may be an important factor in the prediction of behavioural responses, such as
trusting the government (Venkatesh et al., 2016) or influencing the adoption of e-government
(Al Hujran, Aloudat, & Altarawneh, 2013). However, in the case of e-participation platforms,
where the citizens may be directly involved in the decision-making process, it is not yet clear
what the main drivers of citizen satisfaction are.
In the context of the e-government mandatory services, Chan et al. (2010) evaluated
the four main determinants of the unified theory of acceptance and use of technology (UTAUT)
(Venkatesh et al., 2003) (performance expectancy, effort expectancy, social influence, and
facilitating conditions) as predictors of satisfaction. They found that all those determinants,
except social influence, positively influenced the level of citizen satisfaction. Other studies have
measured citizen satisfaction with e-government services using three dimensions of services
quality: responsiveness, reliability, and empathy (Al Hujran et al., 2013). Nevertheless, in the
case of e-participation, which is used voluntarily (Medaglia, 2012), the perception of satisfaction
may differ from other systems because the final perceived outcomes and benefits for the
community are influenced directly by the interactions of the citizens with the e-participation.
Satisfaction is a variable that has been widely measured in different fields of information
and communication technology. A variety of research models and variables have been employed
across the literature to measure and understand satisfaction. Two of the most used theoretical
89 | P a g e
models for this purpose are D&M (DeLone & McLean, 2003) and ECM (Bhattacherjee, 2001). For
instance, D&M model was used by Tam & Oliveira (2017) to study user satisfaction in the context
of mobile banking; and by Akter, D’Ambra, & Ray (2010) to assess the service quality of mobile
health applications. In the case of ECM, it was employed to evaluate the continuance intention
to use the smartphone banking services, having user satisfaction as one of the dependent
variables (Susanto, Chang, & Ha, 2016); and also, for the study of satisfaction and continuous
intention to use mobile instant messaging (Oghuma, Libaque-Saenz, Wong, & Chang, 2016).
The implementation of e-participation systems by local governments has been proven
to increase the level of citizen satisfaction (Ahn & Bretschneider, 2011), and in turn, citizen
satisfaction positively impacts the level of trust in government (Christensen & Lægreid, 2005;
Welch et al., 2005). Furthermore, citizen satisfaction has been found to be the strongest
predictor of the intention to use electronic services from the government, even stronger than
perceived usefulness and perceived ease of use (Al Hujran et al., 2013). A study across 32
European countries found evidence of a positive association between e-participation
performance and citizen satisfaction (Ma & Zheng, 2017).
6.3 Conceptual Model and Hypotheses
Our study adopts the updated version of the DeLone & McLean (2003) success model (D&M),
the objective of which is to assess citizen satisfaction and e-participation usage. Six constructs
define the D&M model: information quality, system quality, service quality, use, citizen
satisfaction, and net benefits. The net benefits refer to the benefits obtained by the organization
that adopts the information system (IS). However, in the e-participation context the final
beneficiary is a community of citizens. Consequently, we have dropped this construct from our
model.
The ECM analyses citizen satisfaction as the result of the confirmation from prior use of
an ICT and the perceived usefulness. The final goal of the expectation-confirmation model is to
explain the continuance intention of an ICT, in our case, e-participation. We adopt the model of
information system continuance proposed by Bhattacherjee (2001), which is composed of four
constructs: perceived usefulness, confirmation, satisfaction, and e-participation continuance
intention. The ECM sequence of e-participation adoption can be summarized as: (i) the citizen
makes an initial acceptance decision, (ii) the citizen has an initial experience with e-participation,

90 | P a g e
(iii) the citizen makes an ex-post decision regarding whether to continue using e-participation or
reverse the initial decision.
In the context of public services, Van Ryzin (2013) suggests that citizens judge public
services not only on the perceived quality of the information system, but also on an implicit
comparison with prior expectations. E-participation systems can be considered public services
provided by local or national governments, in this sense, the integration of D&M model with
ECM may provide a bigger picture of the factors that may explain citizen satisfaction and
continuous intention to use e-participation. Moreover, since e-participation is voluntary and
with the goal to bring benefits to a community, SOP (Jorgensen & Stedman, 2001) may have
roles to play as moderators between use and citizen satisfaction. Figure 6.1 presents the
conceptual model.
Figure 6.1. Conceptual model
6.3.1 DeLone and McLean Variables
Teo et al. (2009) define information quality as each citizen’s assessment of whether the
information on the e-participation website is accurate, valid, and timely. DeLone & McLean
(2003) identify five success metrics for information quality: completeness, ease of
understanding, personalization, relevance, and security. In the e-participation context the
information presented on the website is generated by both the government and the citizens.
The government presents information about the objectives, process description, and feedback,
which is essential to engage the citizens on e-participation and keep them using the system in

91 | P a g e
the long term. At the same time, because the interaction of citizens on e-participation also
generates information (e.g. discussion forums, project proposals), the improper presentation
design of this information on the website may create barriers for the citizen interaction on e-
participation. For instance, in online participatory budgeting processes (Allegretti & Antunes,
2014) it is expected that the information available on each project proposal is complete and can
be easily found on the website in order for the citizens to have a clear idea about which project
to vote for. Lack of clarity and consistency may cause citizen frustration and consequently
increase absenteeism in the voting process and stop or decrease the use of the e-participation
platform. Therefore, we hypothesize:
H1a. Information quality has a positive influence on the use of e-participation.
H1b. Information quality has a positive influence on the citizen satisfaction of e-participation.
System quality is defined as the individual perception of the system’s overall
performance (DeLone & McLean, 2003), which in turn may lead to greater user satisfaction and
use of the information system. In the e-participation context the overall system quality may be
judged by the degree to which a citizen is able to contribute to an online participatory process
(e.g. electronic voting, proposal submission, opinion giving). A citizen perception about the e-
participation overall quality may be initially linked to the trust in the local government that
manages the system (Teo et al., 2009). As e-participation is made available to all the citizens in
a given community, the system quality can be measured in terms of usability, ease of use,
accessibility, reliability, feedback, transparency, and so on. For instance, using the same e-
participation example used for information quality (the online participatory budgeting), citizens
who provided an electronic vote for a project may be interested in having access to a detailed
report of the voting results shortly after the voting period is over. Failing to provide the final
voting results in a reasonable time may affect the perception of transparency and trust in the e-
participation system, and thus, negatively impact the citizens perception of overall system
quality. We hypothesize:
H2a. System quality has a positive influence on the use of e-participation.
H2b. System quality has a positive influence on the citizen satisfaction of e-participation.
DeLone & McLean (2003) define “service quality is the overall support delivered by the
service provider”. According to Teo et al. (2009), in the context of e-government, service quality
is perceived as interaction between citizens and government officials. However, in e-
92 | P a g e
participation the existing interactions are both between citizens and governments and between
citizens and citizens. Government officials behind the online participatory platforms are
expected to keep the information updated, provide feedback, and/or regulate inappropriate
content generated by citizens. In turn, citizens are the core-content generators in e-
participation, for instance, providing opinions in online forums or submitting proposals for the
online participatory budgeting. Poor service quality from the government side may lead to poor
citizen participation, and consequently, poor content generated by citizens may lead to
demotivate other citizens from using e-participation.
H3a. Service quality has a positive influence on the use of e-participation.
H3b. Service quality has a positive influence on the citizen satisfaction of e-participation.
DeLone & McLean (2003) suggest that citizen satisfaction and usage of e-participation
are closely interrelated, in which a positive experience in use may lead to a positive citizen
satisfaction. Wang & Liao (2008) note that the use of e-participation systems is completely
voluntary and suggest that actual use has a closer meaning to success than intention to use. We
follow the approach of Wang & Liao (2008) and adopted use as a success measure in the context
of e-participation for our conceptual model. On the opposite direction, greater citizen
satisfaction has also being found to positively affect use of e-participation (Tam & Oliveira,
2017). Therefore, we hypothesize:
H4. The use affects the citizen satisfaction on e-participation.
H5. The citizen satisfaction affects the use of e-participation.
6.3.2 Expectation-Confirmation Variables
Bhattacherjee (2001) refers to confirmation as the “realization of the expected benefits of IS
use”. In the EMC for continuous use, expectation is represented by perceived usefulness, which
also suggests that perceived usefulness can be adjusted according to the citizen confirmation
experience. Earlier studies have found a positive influence of confirmation over satisfaction and
perceived usefulness (Hong, Thong, & Tam, 2006; Oghuma et al., 2016; Susanto et al., 2016).
Since e-participation platforms are oriented to the citizenry and managed by the governments,
they are planned to last for several years (e.g., online participatory budgeting and incident
reporting applications) before being changed or replaced. Therefore, it is expected that citizens
who experience e-participation can adjust their perception of usefulness over time based on the
confirmation experience.
93 | P a g e
H6. Confirmation positively influences the citizen satisfaction with e-participation.
H7. Confirmation positively influences the perceived usefulness of e-participation.
In the job context, perceived usefulness is defined as the individual belief that using the
ICT will help to increase one’s job performance (Bhattacherjee & Premkumar, 2004). For the
context of e-participation, perceived usefulness can be interpreted as the perception of the
citizen that using e-participation will help to make a better or more effective contribution to the
community. According to Bhattacherjee (2001), perceived usefulness may affect citizen
satisfaction in both phases: acceptance and post-acceptance. Due to the long-term vision of e-
participation, perceived usefulness becomes an especially suitable factor to analyse citizen
satisfaction in this context. Earlier studies report that perceived usefulness positively affects
citizens satisfaction and continuance intention to use (Oghuma et al., 2016; Susanto et al., 2016).
Continuance intention to use is defined as the degree to which citizens perceive that they will
continue using e-participation in the future (Hoehle & Venkatesh, 2015a).
H8. Perceived usefulness positively influences the citizen satisfaction with e- participation.
H9. Perceived usefulness positively influences the citizen continuance intention to use e-
participation.
Citizen satisfaction with prior use of e-participation has been found to be one of the strongest
predictors of continuance intention to use in several fields of ICT adoption; for instance, on
university information systems (Liao et al., 2009), mobile internet (Hong et al., 2006), mobile
banking (Susanto et al., 2016), and mobile instant messaging (Oghuma et al., 2016). As e-
participation systems are intended to be used in the long term, their frequent use over time may
also positively influence the continuance intention to use. Therefore, we hypothesize:
H10. The level of citizen satisfaction positively influences the continuance intention to use e-
participation.
H11. The use of e-participation positively affects the continuance intention to use e-
participation.
6.3.3 Moderator Role of Sense of Place (SOP)
SOP has been defined as “the meaning attached to a spatial setting by a person or group”
(Jorgensen & Stedman, 2001). Considering that the most e-participation projects implemented
by government are at city or parish level (e.g., participatory budgeting, incident reporting
94 | P a g e
applications), the ties that a citizen has to a place may significantly affect her/his behaviour
regarding the use of e-participation when that place is involved. Acedo et al. (2017) suggest that
geographical areas containing a higher level of SOP may create better conditions for
“cooperation and collaborative synergies between people who share more than just a space”.
SOP is encompassed and measured in three dimensions (Jorgensen & Stedman, 2006): place
attachment, place dependence, and place identity. Place attachment is defined as an emotional
bond that citizens develop with some geographical place (Lewicka, 2011). Earlier literature has
found that place attachment positively affects the neighbourhood ties of a citizen (Lewicka,
2005). Place dependence refers to the useful values that a place may have to satisfy the citizens’
goals and desires in comparison to other places (Stedman, 2002). Place identity is conceived as
the reflection of the citizen regarding a place (Jorgensen & Stedman, 2006), also defined as an
expression of “at homeness”(Cuba & Hummon, 1993). We include the three components of SOP
in our conceptual model as moderatos of the relationship between the use of e-participation
and citizen satisfaction. We posit that the stronger the feeling of SOP to a certain area, the higher
the level of satisfaction when the interaction on e-participation involves that area.
H12a. Place attachment moderates the effect of use of e-participation over citizen satisfaction,
in which the citizen satisfaction is greater when the feeling of place attachment is stronger.
H12b. Place dependence moderates the effect of use of e-participation over citizen satisfaction,
in which the citizen satisfaction is greater when the feeling of place dependence is stronger.
H12c. Place identity moderates the effect of use of e-participation over citizen satisfaction, in
which the citizen satisfaction is greater when the feeling of place identity is stronger.
6.4 Implications and Future Research
On e-participation context, citizen satisfaction is a complex variable, challenging to measure
from the citizen’s perspective. Van Ryzin (2007) points out that exogenous variables to the
information systems (IS) itself may impact on the performance perception and satisfaction of
the citizens. Our model presents a wholistic approach that not only measures the perception of
quality of the online information system (e.g., navigability or functionality of the e-participation
website (Foresee, 2016)). But also attempts to provide a better understanding of the citizen
satisfaction from the perspective of perceived usefulness.
Governments that implement e-participation, may use our model to evaluate citizen
satisfaction and design policies of continuous improvement and evolution of e-participation
95 | P a g e
tools, considering not only the improvement of the system quality, but also addressing the effect
of external factors and citizens’ perceived usefulness. Thus, achieving higher levels of citizen
satisfaction in the long-term scenario. The continuous evaluation of citizen satisfaction may be
crucial to prevent the risk, for governments, that citizens may generalize a non-satisfactory
experience using e-participation to a feeling of distrust on the governmental institution
(Petrovsky, Mok, & León-Cázares, 2017). Governments may use the model to monitor the level
of citizens satisfaction periodically and adjust the policies on time before the citizens loose
interest on the e-participation platforms.
Measuring sense of place and its effect on citizen satisfaction may facilitate to refine e-
participation tools to create a bigger impact at local community level as neighbourhoods or
parishes. For instance, to promote the use of participative budgeting platforms, the diffusion
campaigns may be tailored to the local communities depending of the levels of sense of place.
Satisfied citizens with the continued use of e-participation may also be more willing to
engage in democratic processes and try new e-participation initiatives proposed by the local
governments. Consequently, by identifying high levels of citizen satisfaction, governments may
identify the most appropriate period to promote new e-participation tools.
Future research may evaluate the proposed model by collecting data from citizens that
have experienced e-participation systems, and either are still using the system or have
discontinued the usage of e-participation. Using evaluation methods like structural equation
modelling (Hair et al., 2014), we can obtain results about the strength of the conceptual factors
as drivers of citizen satisfaction, use, and continued intention to use e-participation.
6.5 Conclusion
Citizen satisfaction is a critical factor that influences the e-participation adoption in the long
term. Once the citizens reach a high level of satisfaction with e-participation use, additional side
benefits come along with satisfaction, such as trust in government and increased willingness to
participate in democratic processes. The assessment of citizen satisfaction on e-participation
use is still a challenge for research and for governments that want to implement successful e-
participation projects. E-participation is of a voluntary use, accessible and inclusive to all citizens,
is managed and sponsored by the government, and the information on the system is mainly
generated by the citizens for the citizens. The assessment of the level of citizen satisfaction
should consider all these characteristics. We propose a conceptual model to evaluate citizen

96 | P a g e
satisfaction with e-participation. The model integrates the DeLone & McLean success model,
which measures the satisfaction in terms of perception of quality, the expectation-confirmation
model, which measures satisfaction based on the confirmation and perceived usefulness, and
finally, the sense of place, which refers to emotional and meaning ties that the citizen has to a
specific area, which may moderate the effect of satisfaction over e-participation use.

97 | P a g e
Chaper 7 - Place and City: Towards a geography of engagement
7.1 Introduction
The importance of encouraging people to act as participative citizens in issues of public concern
is essential for a functioning democracy, particularly when researchers are observing that civic
engagement (CE) is diminishing in developed countries (Aricat & Ling, 2016). In turn, the
relationship that individuals have toward a certain geographical area (i.e., sense of place (SoP))
or their significant social relationships (i.e., social capital (SC)) embedded within an area can play
a crucial role on the engagement of a citizen (Perkins, Brown, & Taylor, 1996). Researchers have
revised the connection between individuals’ place attachment and many forms of CE, such as
civic activity (Lewicka, 2005), community participation and planning (Manzo & Perkins, 2006) or
pro-environmental behaviour (Buta, Holland, & Kaplanidou, 2014). All these studies register the
importance of relationships among citizens and their meaningful places in which they have
significant relationships are central to citizens’ engagement. However, the relation between
participation, place and space has received little attention (Pain & Kindon, 2007), leaving aside
a further understanding of human–environment interactions in participatory processes. We
already know that most of participation processes are grounded in specific sites and
socioecological contexts (Haywood, 2014). Hence, the study of individuals’ spatialities
(individuals or collectives practices related to their geographical location) (Lussault, 2007)
regarding SoP and SC in the city context can offer an alternative vision to better understand and
foster participatory processes (i.e., CE). Our approach has its roots in the understanding of cities
as place networks (Acedo, Painho, Casteleyn, & Roche, 2018; Doreen Massey, 1994; Roche,
2016) and how we can comprehend a relational space based on networks of actions and actors
(Duff, 2011; Latour, 2005; Murdoch, 1998). Our study aims to exalt the spatial dimension of
individuals' spatialities (i.e., individuals’ SoP and SC) as the pivotal aspect to fully appreciate the
social-spatial practices of CE in the urban context.
This study performs a theoretical literature review to confirm the strong relationship
between SoP, SC and CE and their dimensions from a non-spatial perspective to justify their
revision from a spatial point-of-view. In this research, a spatial perspective means to study the
spatial imprint of a concept defined by its location and their relative location versus other
concepts (i.e., proximity, density). Then, we attempt the study and validation of the importance
of their (i.e., SoP, SC and CE) spatial relationship. We gather the spatial dimension of SoP, SC and
98 | P a g e
CE from a web map-based survey. We merge a web map-based approach with traditional
questionnaires based on soft-GIS methodology (Kahila & Kyttä, 2009; Kyttä & Kahila, 2011). We
analyse the answers using partial least squares structural equation modelling (PLS-SEM)
techniques (Hair et al., 2014) to illustrate their quantitative relationship and assess the potential
of considering the spatial dimension of the social concepts (i.e., SoP and SC) to better
understand CE in the city context. Our methodology is eminently based on citizens' spatialities
associated with the SoP, SC, and CE; i.e., the entire methodology is revolving around a
geographic perspective with a practical focus on studying the social-spatial practices of CE such
as participatory processes in local or community affairs in the city context.
We assume that there is a difficulty to switch current participatory geographies (i.e., the
spaces where the governments are setting up participatory processes) based on administrative
boundaries to one based on common citizens’ spatialities. The underlying reason to use those
administrative boundaries is to find out the percentage of the participatory results upon census
and socioeconomic data in those specific areas. However, the understanding of the spatial
relationship between SoP, SC and CE establishes novel spatial scenes based on human-city
interactions. These possible geographies can embrace a commitment to place (SoP), meaningful
social groups (SC) and spaces of participation (CE) for a citizen. Therefore, those new spatial
contexts can operate shared geographies of engagement that can underpin collaboration,
cooperation and interaction between citizens engaged with these specific geographic areas in,
for instance, local affairs, social issues or planning decision-making processes. This paper
materializes the first step towards these new “geographies of engagement” in 1) performing a
theoretical literature review between SoP, SC and CE and their dimensions, and 2) studying and
assessing the influence of SoP on SC and the latter on CE with special focus on when it occurs
their spatial relationship in a proposed model. This article starts with a review of the SoP, SC,
and CE conceptualizations and dimensions as well as the suitability to understand them from a
spatial point-of-view that end in a number of hypotheses. The article then presents the methods
and the results of an experiment conducted in Lisbon (Portugal) to clarify the importance of the
spatial dimensions of SoP, SC, and CE to explain their relationship. This explanation is followed
by a discussion of the results, the remaining gaps, the limitations, and finally the conclusions of
this research.
99 | P a g e
7.2 Theoretical background and hypotheses
A city can be understood under a relational nature between actions and actors (e.g. humans,
objects) (see actor-network theory (Latour, 2005; Law, 2008). Murdoch (1998) specified the
characteristics of that city-space arguing a folded and striated geography in which all action is
relational and reflects both the diversity of materials used in construction and the relations
between elements. Drawing in the same line, Duff (2011) mentioned three needed resources
(i.e., social, affective and material) to enable and define places. The inherent relation between
the three resources forms networks and flows that configure the city environment (Duff, 2011).
The same author defines the social resource as social capital, the affective resources mean
feeling states and action-potential and the material one covers the materiality of place as well
as services and information. Recently, Acedo et al. (2018) also put in value the understanding of
a city throughout spatial urban dynamics, arguing the potentiality to conceptualize SoP and SC
as inhibitors of place notion based on Agnew (2002, 2011). Those mentioned conceptualizations
can apply to any city, the challenge resides on how to operationalize those arrangements in the
city context to better understand the urban synergies.
SoP refers to the feelings, beliefs and behaviours that humans associate with a place
(Jorgensen & Stedman, 2001). The same authors argue explicitly for the positivistic research in
the SoP notion and propose three dimensions (place attachment, place identity and place
dependence). Place attachment is usually defined as an emotional bond that connects people
to places (Altman & Low, 1992; Lewicka, 2013; Manzo, 2005), while place identity refers to the
relation between a place and one’s personal identity (Proshansky, Fabian, & Kaminoff, 1983;
Trentelman, 2009). Finally, place dependence is the potential of a place to meet the necessities
of an individual or group with respect to other places (Jorgensen & Stedman, 2001).
SC analyses the value of social relationships and networks to societies and individuals
(Holt, 2008), and it can be analysed by four dimensions: sense of community, collective efficacy
or empowerment, neighbouring and citizen participation (Perkins, Hughey, & Speer, 2002;
Perkins & Long, 2002). Sense of community is the feeling of membership to a group (Perkins &
Long, 2002), while collective efficacy/empowerment is the belief and thought of the potentiality
of acting together. Neighbouring encloses the informal actions and behaviours of citizens to a
group or society (Acedo, Painho, et al., 2017) that essentially occurs in localities (Mahmoudi
Farahani, 2016), and citizen participation describes the change from passive to active
involvement in the local activities and decisions (Adler & Goggin, 2005) and electronic
100 | P a g e
participation (Naranjo Zolotov et al., 2018).
CE explains associations or ways in which citizens have a common purpose to preserve
and promote public goods (Son & Lin, 2008), to improve conditions for others (Cegarra-Navarro
et al., 2014), community (Putnam, 2000) or collective benefit (Moro, 2010). Many times CE is
conceptualized as a process rather than an event (UNDP Evaluation Office, 2002), as a
measurement of the right of citizens to have a say in the decisions that affect their lives (Sheedy,
Mackinnon, Pitre, & Watling, 2008, p. 4).
7.2.1 Relating sense of place, social capital, and civic engagement
A commitment to place motivates SC (Jorgensen, 2010) and neighbourhood ties (Lewicka, 2005).
Processes of collective action (dimension of SC) perform better when there are emotional ties
to places (Manzo & Perkins, 2006). In the same line, emotional and behavioural attachment is
related to a sense of community (Pretty, Chipuer, & Bramston, 2003). There are studies that
systematically demonstrate the existence of a relationship between SoP and SC (Jorgensen,
2010; Mesch & Manor, 1998; Raymond, Brown, & Weber, 2010). For instance, Acedo, Painho,
et al. (2017) performed a systematic literature review with more than 20 references showing
the strong relationships between SoP and SC and their dimensions (based on attitude theory
(Ajzen & Fishbein, 1977; Fishbein & Ajzen, 1975; Rosenberg, 1960)). Figure 7.1 depicts the
connections found between the dimensions of SC and SOP towards CE after to perform a
theoretical literature review.
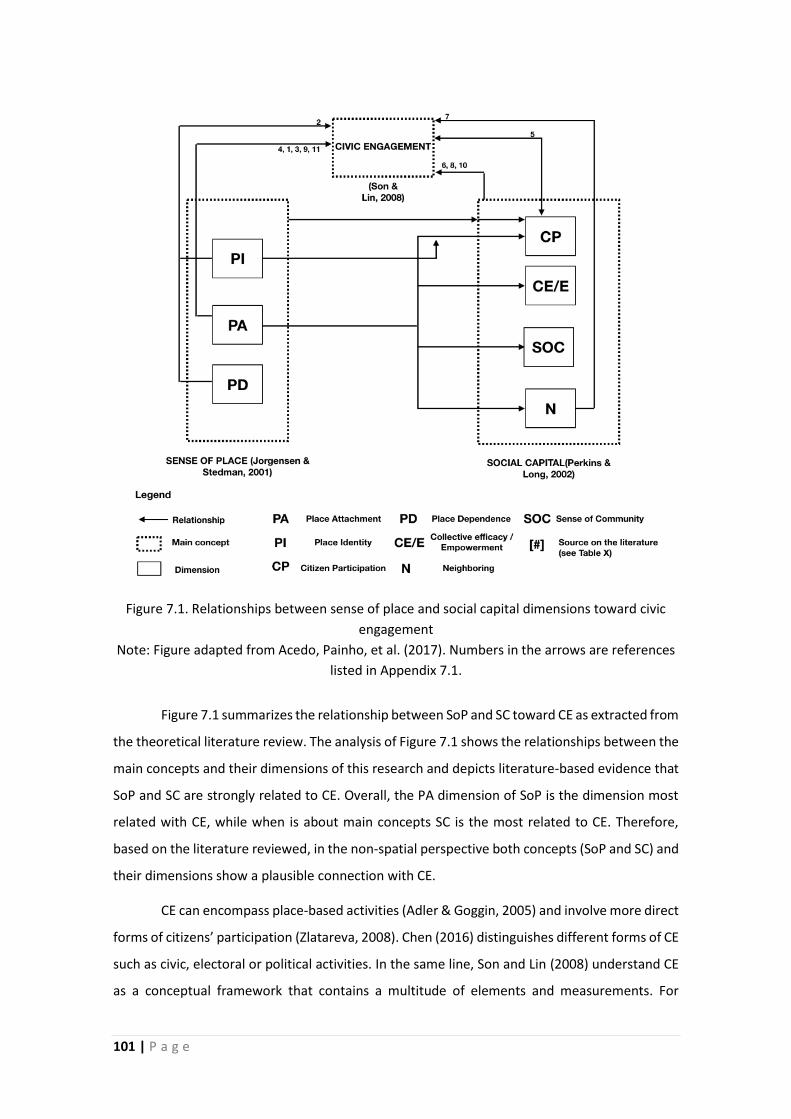
101 | P a g e
Figure 7.1. Relationships between sense of place and social capital dimensions toward civic
engagement
Note: Figure adapted from Acedo, Painho, et al. (2017). Numbers in the arrows are references
listed in Appendix 7.1.
Figure 7.1 summarizes the relationship between SoP and SC toward CE as extracted from
the theoretical literature review. The analysis of Figure 7.1 shows the relationships between the
main concepts and their dimensions of this research and depicts literature-based evidence that
SoP and SC are strongly related to CE. Overall, the PA dimension of SoP is the dimension most
related with CE, while when is about main concepts SC is the most related to CE. Therefore,
based on the literature reviewed, in the non-spatial perspective both concepts (SoP and SC) and
their dimensions show a plausible connection with CE.
CE can encompass place-based activities (Adler & Goggin, 2005) and involve more direct
forms of citizens’ participation (Zlatareva, 2008). Chen (2016) distinguishes different forms of CE
such as civic, electoral or political activities. In the same line, Son and Lin (2008) understand CE
as a conceptual framework that contains a multitude of elements and measurements. For

102 | P a g e
instance, membership in voluntary organizations, religious participation or membership in civic
associations. Both CE and SC incorporate mutual obligation and responsibility for action
(Putnam, 2000). In turn, a precondition for CE is the existence of SC (Zlatareva, 2008), since
highly attached people are more willing to work collectively to reach a desired goal (G.G. Brown,
Reed, & Harris, 2002). Interestingly, Haywood (2014) positioned sense of place scholarship as a
crucial resource to the better understanding of public participation in scientific research.
Whereas Lewicka (2005) proves that it is neighbourhood ties (SC dimension) and not place
attachment (SoP dimension) that predicts civic involvement. Later, the same author (Lewicka,
2011) underlines the inconsistent pattern of relationships between affective bonds with places
and place-focused actions such as participation or planning, claiming that social aspects (e.g.,
SC) are more decisive. Research hypotheses are shown in Table 7.1.
Table 7.1. Research hypotheses
H1 Citizens’ sense of place (SoP) has a positive effect on social capital (SC).
H2 Citizens’ social capital (SC) has a positive effect on their civic engagement (CE).
7.2.2 Relating sense of place, social capital, and civic engagement spatial dimensions
A recurrent issue studied in the literature is the integration of GIS in the humanities scholarship
(Bodenhamer, Corrigan, & Harris, 2010). This synergy is allowing new concepts such as hybrid
geographies that are forging creative connections within geographies (e.g., physical and human
perspectives) (Sui & DeLyser, 2012). Indeed, this merge highlights the epistemological and
social/political meanings inherent in maps and mapping (DeLyser & Sui, 2014) that reinforce the
better understanding of how mapping emerge between geographers and social scientists
(Kitchin, Gleeson, & Dodge, 2013). Conversely, non-representational theorists (e.g., Dewsbury,
2003; Thrift, 2007) advocate to not represent as the primary step to extract knowledge (Cadman,
2009) and put the attention on what cannot be represented (Pile, 2010). In the same line,
Massey (1991) highlights the problem of recurrently trying to draw boundaries to the conception
of place and place-related concepts that, inherently, distinguishes between an inside (e.g., us)
and an outside (e.g., them). She also supports that there is no need to conceptualize boundaries
in order to define place, advocating that place is a process of social interactions. But she asserts
that those boundaries may be necessary for certain studies. It is in this line that our study falls
in: we attempt to spatially contextualize SoP, SC and CE, to analyse the importance of their
spatial relationship and their association. Thus, we don't deny the social dynamism of the

103 | P a g e
studied concepts, but we need to spatially define individuals’ spatial dimensions about
significant places (i.e., SoP), meaningful social relationships (i.e., SC) and their spaces of
engagement (i.e., CE) in a given time to evaluate their relationship.
The studies attempting to connect CE with environmental psychology (e.g., SoP) and/or
social concepts (e.g., SC) have underestimated the geographical perspective that these concepts
own, i.e., the imprint that they (SoP and SC) acquire in the city context. Most of the studies that
measure SoP (or related places concepts, e.g., place attachment (PA)) and SC are using pre-
established administrative boundaries (i.e., neighbourhood, parish, city, region, country) or
individual-vague boundaries (i.e., home) as continuous and homogeneous containers (Hidalgo
& Hernández, 2001; Mesch & Manor, 1998; Westlund & Adam, 2010). However, the citizens’
perception of pre-established administrative boundaries can differ from the “real” one (Coulton,
Korbin, Chan, & Su, 2001; Montello, Goodchild, Gottsegen, & Fohl, 2003) and, consequently,
whole administrative boundaries might not cover the SoP, SC and CE of all its dwellers. Hence,
although studies systematically demonstrate that the sense of community (SC’s dimension
(Perkins & Long, 2002)) is significant, positive and moderately strong related to forms of
participation (Talò & Mannarini, 2015, p. 1) and some forms of SC are predictors of SoP (Mesch
& Manor, 1998; Raymond et al., 2010); the positive spatial dimension and relationship of the
three concepts (SoP, SC, and CE) has been briefly studied in the literature. In part, it is because
the gap of applications and methodologies to spatialize social concepts (Stedman, 2003). When
we refer to spatialize a concept, we are meaning to transfer the non-spatial knowledge on SoP
and SC to the geographical domain through GIS techniques.
The studied concepts (SoP, SC and CE) can be related to a human subjective meaning to
a geographic area. Among the three concepts discussed in this study, SoP is the one in which the
spatial dimension has been more thoroughly studied since its affective bonds are toward an area
(Altman & Low, 1992). The spatial dimension of social capital has also been analysed (Foster,
Pitner, Freedman, Bell, & Shaw, 2015; Rutten, Westlund, & Boekema, 2010; Westlund, Rutten,
& Boekema, 2010), advocating for the potential of understanding and conceptualizing SC
geographically (Holt, 2008; Putnam, 2000). However, some authors consider that geographical
SC is ‘almost dead’ (see Radcliffe 2004). Finally, CE and participation are inherently spatial (Pain
& Kindon, 2007) and, consequently, influenced by social relations, time and space. The spatial
dimension of CE (e.g., planning decisions or decision-making processes about communal spaces)
has been established in administrative boundaries because of the availability of census and
socioeconomic data in those areas (Dietz, 2002). However, this approach has probably hidden

104 | P a g e
the spatial nature of CE associated with space, place and locality - essential characteristics to
determine who is interested in the participatory processes and why (Carver, 2001). SoP and SC
are strongly related in the non-spatial approach, as well as in the spatial one (Acedo, Painho, et
al., 2017; Jorgensen, 2010; Jorgensen & Stedman, 2011), and the combination of both in a
geographical area may well be the most meaningful places for a citizen (Lewicka, 2011). On the
other hand, CE occurs within a particular spatial environment where an individual has informal
cooperation ties and strong horizontal linkages, that is, SC (Zlatareva, 2008). Therefore, the
inclusion of the spatial dimension and relationship in our study can offer a better performance
in the association between SoP-SC and SC-CE. Hence, we state the two spatial hypotheses in
Table 7.2.
Table 7.2. Spatial hypotheses
Hs1 A non-disjoint spatial relationship between SoP and SC spatial dimensions increases
the influence of SoP on SC.
Hs2 A non-disjoint spatial relationship between SC and CE spatial dimensions increases
the influence of SC on CE.
7.3 Methodology
This methodology studies the effect of our individuals' spatialities (i.e., SoP and SC) on our CE
behaviour when it occurs a spatial relationship between them. Thus, we stablish a twofold
methodology; firstly, to gather the spatial dimension of the three aforementioned concepts and,
secondly, to evaluate their association through a geographical perspective using SEM.
7.3.1 Experimental design
In spite of all the critical implications that are related to mapping through GIS methodologies
(see Elwood (2006)) and the inherent digital divide that this kind of methodologies represent
(Cruz-Jesus et al., 2012), we use a web map-based survey to gather all the (spatial) data of
complex notions (SoP, SC and CE). Thus, studied concepts derived from environmental, social
and participatory fields are artificially forced into geographic primitives (e.g., discrete points
and/or polygons). Regarding this issue, Brown and Pullar (2012) compared studies with the two
types of features, and recommended the use of points instead of polygons in participatory GIS
applications. Conversely, our approach uses polygons due to (1) the ease of implementation of
"standard" drawing tools to define polygons and users' familiarity with that type of approach
105 | P a g e
respect fuzzy designs (Huck, Whyatt, & Coulton, 2014); (2) the better encompass of high range
of spatial scales, (from an armchair to the whole earth (Tuan, 1978, p. 149)) and; (3) the better
performance of polygon features when there is a limited spatial dataset (Brown & Pullar, 2012).
Moreover, in the most recent and similar research to ours, Brown et al. (2015) use a PPGIS
application to measure and mapping place attachment. They also define place attachment with
polygon features from the minimum convex polygon of (at least) three points. However, the
representation of vague concepts (i.e., SoP, SC and CE) through geographic primitives in this
research answer the need to classify the spatial relationship between them as positive or
negative (i.e., there is an overlapping or not, respectively).
The data were collected by applying a web map-based survey (Acedo, Mendoza, Painho,
& Casteleyn, 2017)1. All the data gathered are referenced to a singular geographical geometry
along the Lisbon city. The main goal of this web map-based survey is to catch the spatial
dimension of SoP, SC and CE and measure their dimensions for a citizen in the city context. When
we refer to the spatial dimension is the geographical definition on a map of the area that covers
the feelings, thoughts and acts towards a place (i.e., SoP) a social group (i.e., SC) or engagement
(i.e., CE). We introduced the three concepts (SoP, SC and CE) and requested to the participants
to think about their own places, social groups and spaces that comprise these three concepts,
respectively. Each step of the survey has the same structure; some instructions to spatially
define the constructor (SoP, SC or CE) on a base map centred in Lisbon city, and the questions,
applied to the research model, pointing to that geometry. Participants first had to think of an
‘area’ and named since places need to be named (Gieryn, 2000). Then, they needed to draw this
area on a map and rate it according different criteria and finally to choose the most important
one and answer the respective questions (see Appendix 7.2). Each of the questions comprised
in the tool were adapted from the literature. We tried to precisely guide the respondents
throughout the application to improve the accuracy of the mapping activity (Brown & Pullar,
2012). At the end of the entire process, we gathered a spatial data (i.e., polygon) with qualitative
information that attempts to ‘translate’ participants’ rich socio-spatial understandings of SoP/SC
and socio-spatial practices of CE. Some of them (i.e., the chosen by the participant as the most
important) had qualitative information analysed in an ordinal scale about the dimensions of SoP
and SC, respectively. That ordinal information applies to measure the first-order dimensions of
the model (see Figure 7.3). We represented each variable through three questions; thus, SoP
1 https://placeandcity.com [accessed on 25th of August 2018]

106 | P a g e
with three dimensions (i.e., PA, PI and PD) needed nine inquiries, and SC (i.e., SoC, CEE, N and
CP) required twelve. All these questions are crucial to build the first-order dimensions that
nourish second-order reflective-formative constructs and, thus, the model. Figure 7.2 shows all
the sequence of steps that encompass the survey. Participants were also requested to
contribute their sociodemographic information (age, gender, profession, income and
nationality). The survey was sent by the municipality of Lisbon to a database that contains a
group of people engaged in the participatory processes in Lisbon; 373 people replied to the
questionnaire in approximately two weeks period (i.e., 12 June to 2 July 2017 for this study).
Figure 7.2. Schema of the application flow
7.3.2 Research model
This study integrates the SoP (Jorgensen & Stedman, 2001) and SC (Perkins et al., 2002; Perkins
& Long, 2002) conceptualizations as predictors of CE (Son & Lin, 2008). SoP is integrated in the

107 | P a g e
research model as a second-order reflective-formative construct determined by its three first-
order dimensions: place attachment (PA), place identity (PI), and place dependence (PD). SC is
another second-order reflective-formative construct determined by four first-order variables:
sense of community (SoC), collective efficacy (CEE), neighbouring (N), and citizen participation
(CP). CE is the dependent constructor of our model. Age and gender are included in the model
as control variables on SC and CE. Figure 7.3 shows the research model.
Figure 7.3. Research model
We use partial least squares structural equation modelling (PLS-SEM) (Hair et al., 2014)
to evaluate the model since it is suitable for predictive analysis to test the hypotheses using
empirical data (Hair et al., 2011). The measurement and structural model are estimated with
SmartPLS 3.0 software (Ringle et al., 2015).
7.3.2.1 Introducing the spatial perspective in the research model
As mentioned above, SoP, SC, and CE exhibit spatial dimensions that can influence their mutual
connections. Therefore, does the SoP, SC, and CE spatial relationship affect their association? Is
there a spatial behaviour between those concepts that can better explain their non-spatial
association? To answer these questions, this study analyses the proposed research model
(Figure 7.3) for different subsets of respondents based on the diverse spatial relationship
configurations that follow its constructors (SoP, SC and CE) for each citizen. This subsection
wants to emphasize and operationalize the spatial dimension of the studied concepts (i.e., SoP,
SC and CE) to be able to validate in the research model (Figure 7.3). The spatial characterization
of the participants’ subsets is based on the research of Egenhofer, Clementini, & Di Felice (1994),

108 | P a g e
which defined eight topological relationship types between two regions (polygons in this study)
with connected boundaries (i.e., disjoint, meet, contains, covers, equal, overlap, inside and
covered by). Seven of these spatial relationships follow a non-disjoint spatial behaviour (coded
as 1 for this study), that is assumed as the basis for classifying positive topological spatial
relationships for SoP-SC, SC-CE and their own non-disjoint relationship. Figure 7.4 summarizes
both the different spatial relationships between the different constructors (SoP, SC and CE) and
the resulting spatial subsets according to our model for each citizen (ci) in the city context (𝑋).
Subset A represents the positive spatial relationship between GSoP and GSC, and B between
GSC and GCE. The overlapping between the three constructors is defined by the subset C. Finally,
the last subset (D) is composed by those citizens without any positive spatial relationship
between GSoP-GSC and GSC-GCE. In order to make the article easier to read, we will treat 𝐺𝑆𝑜𝑃𝑖
as GSoP, 𝐺𝑆𝐶𝑖 as GSC and 𝐺𝐶𝐸𝑖 as GCE.
Figure 7.4. Spatial relationships between the three constructors: sense of place, social capital,
and civic engagement.
• A: 𝐺𝑆𝑜𝑃𝑖 ∩ 𝐺𝑆𝐶𝑖 ≠ ∅
• B: 𝐺𝑆𝐶𝑖 ∩ 𝐺𝐶𝐸𝑖 ≠ ∅
• C: 𝐺𝑆𝑜𝑃𝑖 ∩ 𝐺𝑆𝐶𝑖 ≠ ∅ ∧ 𝐺𝑆𝐶𝑖 ∩ 𝐺𝐶𝐸𝑖 ≠ ∅
• D: 𝐺𝑆𝑜𝑃𝑖 ∩ 𝐺𝑆𝐶𝑖 = ∅ ∧ 𝐺𝑆𝐶𝑖 ∩ 𝐺𝐶𝐸𝑖 = ∅
109 | P a g e
where:
𝐺𝑆𝑜𝑃𝑖 = ⋃ 𝐺𝑆𝑂𝑃𝑖𝑗
𝑁
𝑗=1
𝐺𝑆𝐶𝑖 = ⋃ 𝐺𝑆𝐶𝑖𝑘
𝑀
𝑘=1
𝐺𝐶𝐸𝑖 = ⋃ 𝐺𝐶𝐸𝑖𝑙
𝑂
𝑙=1
• ci is a citizen
• i is an integer number between 1 and n, and n is the total number of citizens of a given
city
• N, M and O are positive integers, representing the total number of SoP, SC and CE areas,
respectively, for a citizen ci
• GSoPi is the union of all individual Geographical Sense of Place(s) (GSoPij) for a citizen
ci
• GSCi is the union of all individual Geographical Social Capital(s) (GSCik) for a citizen ci
• GCEi is the union of all individual Geographical Civic Engagement(s) (GCEil) for a citizen
ci
• 𝑋 is the surface of a given city
We run the PLS-SEM using the four different datasets (i.e., A, B, C and D) based on the
disjoint and non-disjoint spatial relation of the citizens’ geometries regarding SoP-SC and SC-CE
(see Figure 7.4).
7.4 Results
7.4.1 Data collection and measurement model
All 373 participants drew at least a GSoP, but only 119 participants defined (at least) one area
of each SoP, SC and CE. Therefore, a total of 119 citizens offered valid responses to conduct this
study. Table 7.3 shows their demographics.
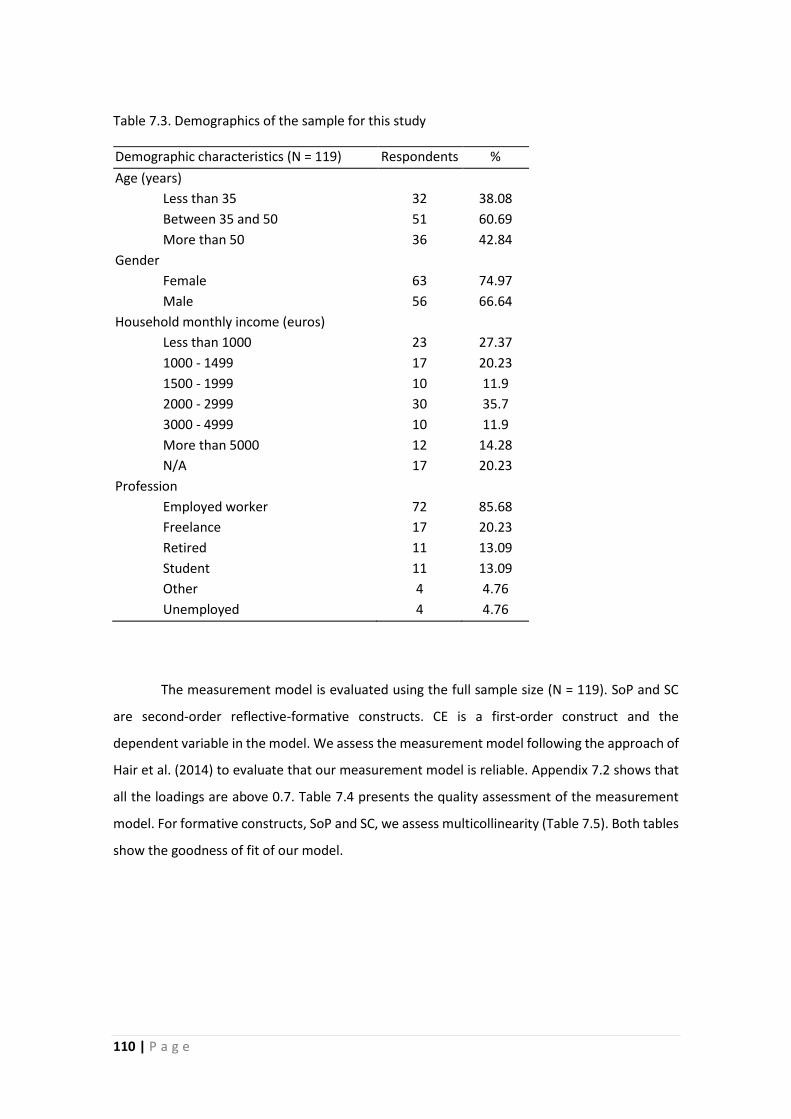
110 | P a g e
Table 7.3. Demographics of the sample for this study
Demographic characteristics (N = 119) Respondents %
Age (years)
Less than 35 32 38.08
Between 35 and 50 51 60.69
More than 50 36 42.84
Gender
Female 63 74.97
Male 56 66.64
Household monthly income (euros)
Less than 1000 23 27.37
1000 - 1499 17 20.23
1500 - 1999 10 11.9
2000 - 2999 30 35.7
3000 - 4999 10 11.9
More than 5000 12 14.28
N/A 17 20.23
Profession
Employed worker 72 85.68
Freelance 17 20.23
Retired 11 13.09
Student 11 13.09
Other 4 4.76
Unemployed 4 4.76
The measurement model is evaluated using the full sample size (N = 119). SoP and SC
are second-order reflective-formative constructs. CE is a first-order construct and the
dependent variable in the model. We assess the measurement model following the approach of
Hair et al. (2014) to evaluate that our measurement model is reliable. Appendix 7.2 shows that
all the loadings are above 0.7. Table 7.4 presents the quality assessment of the measurement
model. For formative constructs, SoP and SC, we assess multicollinearity (Table 7.5). Both tables
show the goodness of fit of our model.

111 | P a g e
Table 7.4. Quality assessment (square root of AVE in bold)
Constructs CA CR AVE 1 2 3 4 5 6 7 8
1. Place attachment 0.88 0.93 0.81 0.90
2. Place dependence 0.86 0.91 0.78 0.73 0.88
3. Place identity 0.86 0.91 0.78 0.78 0.66 0.88
4. Sense of community 0.94 0.96 0.90 0.34 0.32 0.32 0.95
5. Collective efficacy 0.84 0.90 0.76 0.26 0.17 0.18 0.26 0.87
6. Neighbouring 0.89 0.93 0.82 0.27 0.20 0.20 0.48 0.36 0.90
7. Citizen participation 0.88 0.92 0.80 0.12 0.04 0.13 0.35 0.27 0.46 0.90
8. Civic engagement 0.92 0.95 0.86 -0.08 -0.19 -0.11 0.01 0.39 0.11 0.21 0.93
Note: CA = Cronbach’s Alpha, CR = Composite Reliability, AVE = Average Variance Extracted
Table 7.5. Higher-order formative constructs. Inner VIF values (N=119)
Second-order formative constructs First-order reflective
constructs VIF Weights
Social capital (SC)
Sense of community 1.460 0.367 ***
Collective efficacy 1.200 0.292 ***
Neighbouring 1.589 0.377 ***
Citizen participation 1.332 0.336 ***
Sense of place (SOP)
Place attachment 3.177 0.398 ***
Place dependence 2.210 0.348 ***
Place identity 2.646 0.361 ***
7.4.2 Structural Model
The structural model is evaluated for the coefficient of determination (R2) and the path
coefficients (β). R2 is a measure of the model´s predictive power. Both SC and CE obtained R2
values below the threshold of 0.25 (Figure 7.5), which is described as weak predictive power
(Hair et al., 2014; Henseler et al., 2009). The model path coefficients (β), its sign, and the
statistical significance was assessed using the bootstrapping technique (Hair et al., 2014) with
5000 iterations. Age and gender were found not statistically significant on SC and CE.

112 | P a g e
Figure 7.5. Structural model results
Results of the structural model evaluation with the full sample size (N = 119) provide
evidence to support the model design (see Figure 7.5). The results reveal that all the three
variables (i.e., place attachment (PA), dependence (PD) and identity (PI)) significantly explain
SoP. Hence, this study validates the conceptualization of SoP by Jorgensen & Stedman (2001) as
it was performed by Pretty et al. (2003). The computed model also provides evidence that the
four first-order variables (i.e., sense of community (SoC), collective efficacy (CEE) neighbouring
(N) and citizen participation (CP)) significantly explain SC, supporting Perkins and his colleagues’
conceptualization of SC (Perkins et al., 2002; Perkins & Long, 2002). Finally, the results from the
structural model (Figure 7.5) disclose that SoP has a positive effect on SC (H1) and, in turn, SC
has a positive effect on CE (H2). The next subsection will analyse the acceptance of hypotheses
Hs1 and Hs2 based on H1 and H2, respectively, for the subsets derived from the spatial
relationship between SoP, SC, and CE.
7.4.3 A geographical evaluation of the structural model
As mentioned in previous discussions, one of the main goals of this study is the inclusion and
analysis of the spatial relationship between GSoP, GSC and GCE in our model to prove the
importance of the spatial dimension of studied concepts in the urban processes and dynamics.
Based on the data and methodology followed we obtained the following spatial subsets:
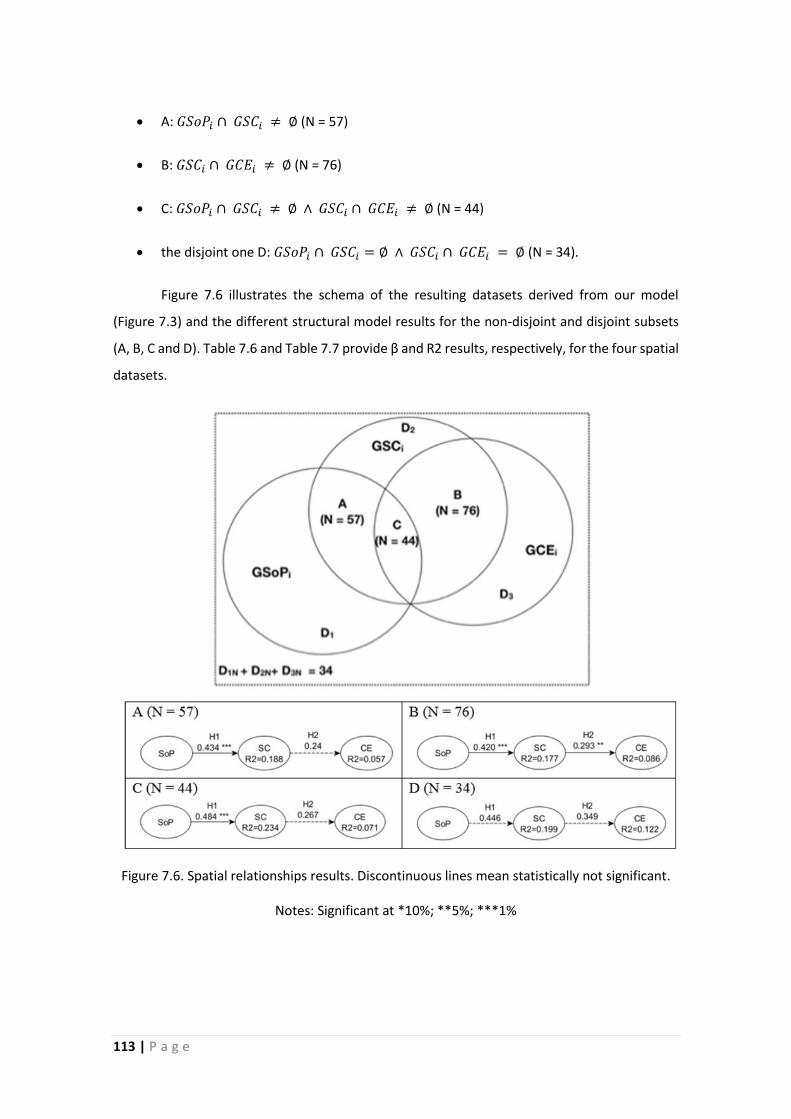
113 | P a g e
• A: 𝐺𝑆𝑜𝑃𝑖 ∩ 𝐺𝑆𝐶𝑖 ≠ ∅ (N = 57)
• B: 𝐺𝑆𝐶𝑖 ∩ 𝐺𝐶𝐸𝑖 ≠ ∅ (N = 76)
• C: 𝐺𝑆𝑜𝑃𝑖 ∩ 𝐺𝑆𝐶𝑖 ≠ ∅ ∧ 𝐺𝑆𝐶𝑖 ∩ 𝐺𝐶𝐸𝑖 ≠ ∅ (N = 44)
• the disjoint one D: 𝐺𝑆𝑜𝑃𝑖 ∩ 𝐺𝑆𝐶𝑖 = ∅ ∧ 𝐺𝑆𝐶𝑖 ∩ 𝐺𝐶𝐸𝑖 = ∅ (N = 34).
Figure 7.6 illustrates the schema of the resulting datasets derived from our model
(Figure 7.3) and the different structural model results for the non-disjoint and disjoint subsets
(A, B, C and D). Table 7.6 and Table 7.7 provide β and R2 results, respectively, for the four spatial
datasets.
Figure 7.6. Spatial relationships results. Discontinuous lines mean statistically not significant.
Notes: Significant at *10%; **5%; ***1%
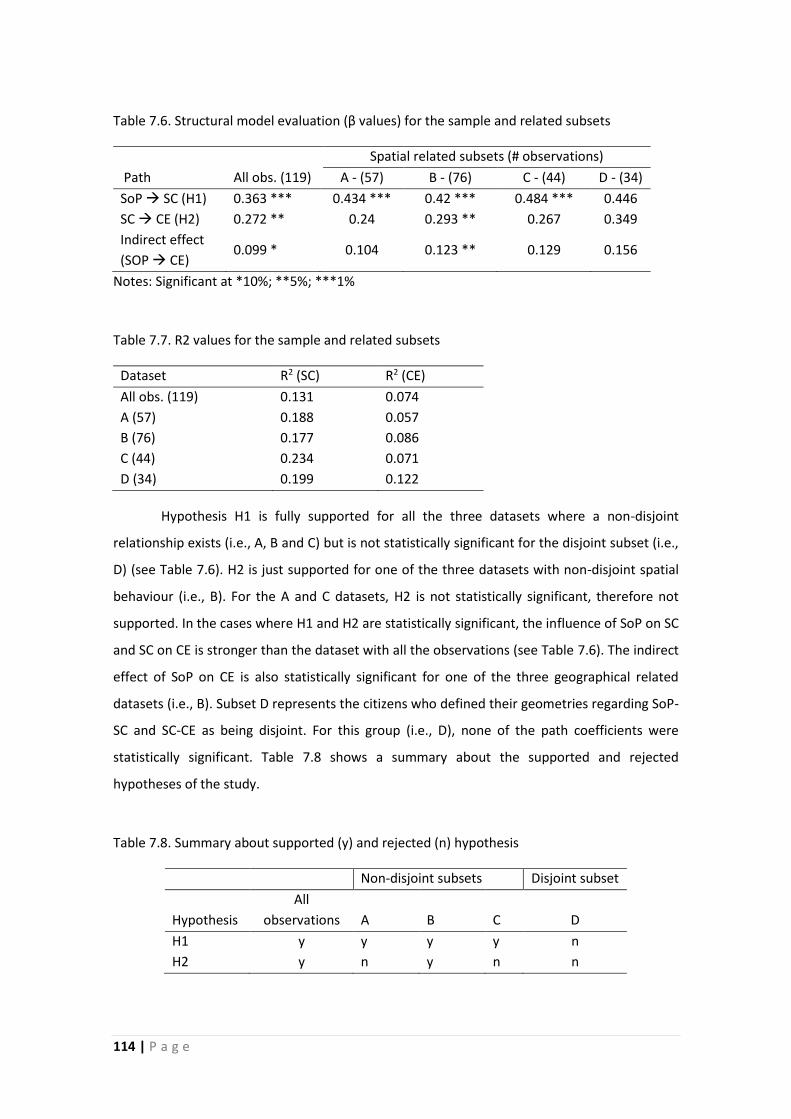
114 | P a g e
Table 7.6. Structural model evaluation (β values) for the sample and related subsets
Spatial related subsets (# observations)
Path All obs. (119) A - (57) B - (76) C - (44) D - (34)
SoP → SC (H1) 0.363 *** 0.434 *** 0.42 *** 0.484 *** 0.446
SC → CE (H2) 0.272 ** 0.24 0.293 ** 0.267 0.349
Indirect effect
(SOP → CE) 0.099 * 0.104 0.123 ** 0.129 0.156
Notes: Significant at *10%; **5%; ***1%
Table 7.7. R2 values for the sample and related subsets
Dataset R2 (SC) R2 (CE)
All obs. (119) 0.131 0.074
A (57) 0.188 0.057
B (76) 0.177 0.086
C (44) 0.234 0.071
D (34) 0.199 0.122
Hypothesis H1 is fully supported for all the three datasets where a non-disjoint
relationship exists (i.e., A, B and C) but is not statistically significant for the disjoint subset (i.e.,
D) (see Table 7.6). H2 is just supported for one of the three datasets with non-disjoint spatial
behaviour (i.e., B). For the A and C datasets, H2 is not statistically significant, therefore not
supported. In the cases where H1 and H2 are statistically significant, the influence of SoP on SC
and SC on CE is stronger than the dataset with all the observations (see Table 7.6). The indirect
effect of SoP on CE is also statistically significant for one of the three geographical related
datasets (i.e., B). Subset D represents the citizens who defined their geometries regarding SoP-
SC and SC-CE as being disjoint. For this group (i.e., D), none of the path coefficients were
statistically significant. Table 7.8 shows a summary about the supported and rejected
hypotheses of the study.
Table 7.8. Summary about supported (y) and rejected (n) hypothesis
Non-disjoint subsets Disjoint subset
Hypothesis
All
observations A B C D
H1 y y y y n
H2 y n y n n

115 | P a g e
Therefore, the better results for the H1 and H2 path coefficients values (Table 7.6) and
associated R2 (Table 7.7) in relation to the subsets A (GSOP and GSC non-disjoint relationship)
and B (GSC and GCE non-disjoint relationship), respectively (see bold results in Table 7.7), allow
us to support Hs1 and Hs2. This finding provides evidence that the geographical component
plays a critical role for the statistical significance of the path coefficients in the prediction of CE,
i.e., the influence on SoP to SC and SC on CE are statistically better explained when there is a
non-disjoint spatial relationship between them.
7.5 Discussion
This research attempts to validate the importance of SoP and SC spatial relationships to explain
CE at the individual level. These spatial interactions define new approaches to better
understanding the city's social realm from the geographic study of social concepts. We highlight
the suitability of these social concepts to encapsulate human notions that can be rendered on
the map and elucidate connections with already understanding of cities as place networks
(Acedo et al., 2018; Doreen Massey, 1994; Roche, 2016). Bridging (spatial) scholarship within
social theory, environmental psychology through a participatory methodology using GIS
techniques in a continually shifting city network environment (Duff, 2011; Latour, 2005;
Murdoch, 1998), expands the participatory research agenda and embraces two general areas
(i.e., GIS and humanities) that, unfortunately, has been rarely analysed together in deep
(Bodenhamer et al., 2010). Surely, this carelessness has been mainly due to the dynamism and
vague nature of those rich socio-spatial concepts (i.e., SoP, SC and CE) and the considerable
difficulty of GIS techniques to embed their fuzzy perseverance (Coulton et al., 2001; Huck et al.,
2014).
The results of our model shows low R2 values for both SC and CE in all models (Table
7.7) are in line with other studies that have reported similar R2 values; for instance, in the study
of civic activity (Lewicka, 2005) and pro-environmental CE (Buta et al., 2014), the R2 values found
were smaller than 0.16 and less than 0.33, respectively. Thus, this study introduces the spatial
component as part of the analysis to try to overcome this issue and to obtain better explanatory
models. Our findings show that when there is a non-disjoint spatial relationship between the
studied concepts (SoP, SC, and CE), the corresponding model performs a better statistical
description of their associations.
116 | P a g e
SoP and SC display the most consistent relationship of the model. This relationship is
statistically significant for all the subsets except for subset D. Furthermore, SC is better explained
by SoP when there is a non-disjoint relationship between both concepts’ spatial dimensions (i.e.,
GSoP and GSC). The results of this study are in line with the conceptualizations of Acedo, et al.
(2017), advocating for the strong spatial relationship of these two concepts, and Jorgensen
(2010), who assures the mutual spatial behaviour between the two concepts. Independently of
their spatial nature, it is clear from the findings of our study that the non-disjoint relationship
between SoP and SC strengthens the explanation of SC by SoP. Surprisingly, the other positive
geographical related spatial subsets (i.e., B and C) also show significant and better values than
the entire dataset, showing that H1 performs better when a positive (non-disjoint) spatial
interaction occurs in the model. Only for the subset D (disjoint subset) is the relationship from
SoP to SC not statistically significant. The method to statistically evaluate the different subsets
is (i.e., PLS-SEM), it is worthy to say that, to the best of our knowledge, this is the first study to
add the spatial relationship between constructs into a model. Jorgensen & Stedman (2011)
integrate the spatial and physical features of places with attitude and behavioural variables in
this type of models, but the specific study of the spatial dimension of model' constructs has been
never investigated to date.
Overall, the relationship between SC and CE is not as strong as that between SoP and
SC. Interestingly, the only geographical subset that has statistical significance is B (i.e., when
there is a positive spatial relationship between SC and CE for a citizen). Thus, to explain how SC
influences CE, it is interesting to highlight that its association is stronger when there is a non-
disjoint relationship between their geographical areas. This finding is in consonance, in part,
with studies assuring that participation is likely to occur in small-group situations (Rydin &
Pennington, 2011), where the citizen has a higher identification and satisfaction with the group
(Bernardo & Palma-Oliveira, 2016). In this line, this research contributes by highlighting the
importance of these group’s relationships (SC) being located in the same place where for
instance, the participatory or planning process is taking place to have better CE's performance.
The other two subsets (i.e., A and C) and the subset D do not show statistical significance in the
relationship between SC and CE.
The sample size to perform this study (N = 119) and the derived smaller subsets based
on the constructs’ geographical behaviour could represent a limitation to conduct the study.
Ideally, larger sample sizes lead to more accurate results. Other approaches to gather SoP
(Jenkins, Croitoru, Crooks, & Stefanidis, 2016) and SC (Antoci, Sabatini, & Sodini, 2015) data
117 | P a g e
through social network analysis are appearing in the last years. Unlike our approach, perhaps,
these techniques can provide a quick approach to the concept as well as to gather a massive
related dataset. However, it remains unclear how these techniques can infer the specific spatial
area (polygon) for citizens' SoP or to measure the dimensions of SC from social network analysis
to relate both pieces of information for a single citizen. Conversely, our approach goes straight
to the point with the spatial representation and measurement of SoP, SC and CE at the individual
level. Some non-representational theorists have defended the necessity of not emphasizing
representation as the primary step to extract knowledge (Dewsbury, 2003; Thrift, 2008),
especially in social theory attending to the constantly relational nature of actors’ interaction.
We do not deny this nature, but our study needs of a "spatial photo" of the individuals'
spatialities in a given time (e.g., 12 June to 2 July 2017 for this study) in order to evaluate their
spatial relationship in city socio-spatial processes such as participatory processes in a given time.
In turn, the authors of this study acknowledge the dynamism, time-dependent, and scale
variable of studied concepts (i.e., SoP, SC and CE) as a limitation of this kind of study and
methodology, highlighting the requisite for longitudinal time-series studies and a dynamic
collection of social data for a better comprehension. In the same line, the mapping activity using
polygons can also exhibit either spatial and/or scalar ambiguity (Huck et al., 2014). Moreover,
we already argued about the relative accuracy in defining the spatial dimension through
polygons for concepts such as SoP, SC and CE. Thereby, our approach can be understood as an
attempt to study the spatial dimension of those concepts and their spatial relationships.
However, based on the results of this paper, the mapping activity through polygons performs
better goodness of fit in the model (Figure 7.3) when there is a positive spatial relationship.
Therefore, our approach to mapping the spatial dimension of those concepts (i.e., SoP, SC and
CE) substantially cover their spatial association and trace a possible valid path to operationalize
their spatial imprint, and possibly other social concepts, in the city context.
7.6 Conclusions
This paper is connecting citizens' areas of significant interaction (i.e., SC), environmental positive
attitude towards places (i.e., SoP) and engagement to participate in community, society,
planning and governmental issues (i.e., CE). The spatial data gathered from the web map-based
application allows us to attempt the spatialization of citizens' SoP, SC and CE, psychological,
social and participatory concepts that are critical in citizens' daily tasks and interactions. The
findings of this study demonstrate, combining spatial and non-spatial data, the relationships
118 | P a g e
among SoP, SC and CE, based on a GIS analysis of data collected through an electronic survey.
The knowledge and management of these interactions, and where their spatial relationships
occur, creates an occasion that provides fruitful social-spatial data for other areas of knowledge
such as planning or citizen’s participation. To some extent, we are setting up the foundations of
new geographies of engagement for all the stakeholders of a city. Furthermore, the rainbow of
applications that may profit from such understanding of space is wide, from location-based
services to community detection and even citizen science processes (Haywood, 2014; Newman
et al., 2016). This article highlights the role of the geographical perspective in taking another
step forward to better understand citizens' social synergies in the urban context. Specifically,
how GIS techniques can be used to attempt the operationalization of rich-complex human based
concepts such as SoP, SC and CE. On the other hand, the use of PLS-SEM to explore the impact
of spatial components in combination with non-spatial variables has been rarely used in the
literature (Jorgensen & Stedman, 2011). The method used in this research discloses the potential
of introducing spatial perspectives in PLS-SEM models. Future work can be in line to add the
relevant features enclosed in the spatial dimension of studied concepts into the research model
to investigate how and what physical space is valued and influence the studied concepts (i.e.,
SoC, SC and CE).
7.6.1 Notes to advance in the acquisition of the socio-spatial concepts
We foresee a big potential to truly appreciate the spatial dimension of social concepts as spatial
(forgive the repetition), i.e., to make a step further, recognizing and operationalizing the crucial
matter of the spatial domain in social theory. This is not just to discuss or embed results in
administrative boundaries, but to really assign the spatial dimension of social concepts in the
studies' methodology section. Unfortunately, this research is one of the few studies of a long
way to go in the meaningful operationalization of the social concepts spatial dimension in the
urban context. Once this process is normalized and dynamically updated we will be able to
disclose the suitability of including the geographical perspective in social, planning and
participatory studies. There is a dearth of empirical research on the interactions between people
and places and how their spatial understanding highlights a promising area of future scholarship.
Therefore, this study calls for efforts that bridge multiple academic communities to open
innovative avenues for understanding social-spatial behaviours, the outcomes of such
encounters, and their addition in city' procedures such as participatory processes.

119 | P a g e
Chaper 8 - Conclusions
8.1 Summary of findings
The main goal of this dissertation is to contribute to answer the research question “what are the
main determinants factors of information and communication technologies (ICT) of the e-
participation adoption?”. In this regard, we conducted four quantitative studies (chapters 2 to 5
and chapter 7) and one theoretical study (chapter 6) that analyse the effect of different variables
and theoretical approaches over the intention to use, intention to recommend, usage, and
continued intention to use e-participation technologies. Table 8.1 summarizes the statistically
significant and non-significant relationships found through the four quantitative studies.
Table 8.1. Relationships analysed in the quantitative studies
E-participation variables Literature
review Cross-sectional
Independent Dependent Chapter 2 Chapter 3 Chapter 4 Chapter 5 Chapter 7*
Attitude
Intention to use
0.38 Effort expectancy 0.16 0.081 (ns)
Empowerment (second order)
0.27
Facilitating conditions 0.22
Perceived ease of use 0.16
Perceived usefulness 0.32
Performance expectancy 0.39 0.24
Social influence 0.19 0.028 (ns)
Trust 0.33
Trust in government 0.22 Empowerment (second order)
Intention to recommend
0.53
Intention to use 0.17
Facilitating conditions
Usage
0.29 0.14 Habit 0.34
Intention to use 0.25
Sense of virtual community (second order)
0.25
Competence
Continued intention to
use
0.23 Facilitating conditions 0.36
Habit 0.31 0.28 Impact 0.061 (ns) Meaning 0.23 Self-determination 0.055 (ns) Sense of virtual community (second order)
0.014 (ns)
Usage 0.23
Sense of place (SoP) Social capital 0.36
Social capital (second order) Civic engagement 0.27
Note: ns = not statistically significant. * = Complementary co-authored study.

120 | P a g e
The literature review revealed that: (1) the most quantitatively evaluated constructs in
the e-participation context are from TAM and UTAUT or are adapted from them. Although, not
all constructs from these well-known theories resulted always significant or demonstrated to be
strong predictors of e-participation (see Figure 2.3). (2) E-participation adoption research is
highly heterogeneous due to the use of different research models, different variables, different
populations, and different study protocols to evaluate the drivers of e-participation adoption.
And, (3) the ‘best’ predictors identified in the existing literature include perceived usefulness,
attitude, social influence, trust, effort expectancy, and trust in government on intention to use,
perceived ease of use on perceived usefulness, perceived usefulness on attitude, and intention to
use on use.
The cross-sectional studies evaluated three different research models. The first study
evaluated psychological empowerment as second order construct. As expected, the inner
motivations of the individual, represented in the psychological empowerment, were found to
have a positive effect on the intention to use and intention to recommend e-participation.
UTAUT showed a partial effect on the intention to use e-participation, only performance
expectancy and facilitating conditions were significant and positive. The results also indicate that
when psychological empowerment is integrated with UTAUT the level of variance on intention
to use and intention to recommend e-participation is increased in comparison to the variance
resulting from the UTAUT solely.
The second cross-sectional study, which was focused on the post-acceptance stage of
the e-participation adoption, was carried out using a different sample and context than the study
one. As expected for the post-acceptance stage (Kim & Malhotra, 2005), habit was found as the
strongest predictor over e-participation usage. Findings suggest that Sense of virtual community
(SOVC) has a positive effect on triggering e-participation usage in the short term. However, SOVC
was not significant for the continuous intention to use, which may imply that the feeling of
community is either not strong enough to drive the continuous intention over time in large
urban area (e.g. city), or SOVC is not a determinant factor to keep the continuous intention to
use e-participation over time.
The third cross-sectional study, also focused on the post-acceptance stage, evaluated
the dimensions of empowerment and habit over the continuance intention to use e-
participation. The existence of a perception of empowerment in the citizens was only partially
confirmed by this study. Only two out of four dimensions of empowerment, namely competence
121 | P a g e
and meaning, showed a significant and positive effect on continued intention to use. The
significant and positive effect of meaning as a motivator of the continued intention to use online
participatory budgeting implies that citizens indeed perceive that there is a value derived from
the utilization of the system, a meaningful participation. The strongest predictor of the
continued intention to use was habit, which was expected probably due to previous editions of
online participatory budgeting.
Regarding the individual differences as age and gender, our results showed that in the
e-participation context these differences are more tangible at the acceptance stage, later in the
post-acceptance stage the differences tend to diminish or disappear. In the first cross-sectional
study we found that younger citizens are more willing to recommend e-participation than older
citizens and that women are more likely to use e-participation than men. In the second cross-
sectional study we found no effect of individual differences such as age and gender on the
dependent variables for e-participation usage and continuous intention to use. In the third cross-
sectional study we performed a multi-group analysis, the individual differences of age and
gender had no effect on the variables analysed in this study, except on meaning, suggesting that
older males perceive a higher value than young females in the online participatory budgeting
(an e-participation platform).
The forth cross-sectional study presented in Chapter seven complements the main line
of research in this dissertation. Chapter seven was developed as a co-authorship of another
doctoral study of the GEO-C program (see Table 1.2 in Chapter 1). The author of this dissertation
contributed mainly with the methodological approach and the results section. This cross-
sectional study introduces the use of PLS-SEM to explore the impact of spatial components in
combination with non-spatial variables, which highlights the role of the geographical
perspective in taking another step forward to better understand citizens' social synergies in the
urban context. The use of spatial and non-spatial data show evidence of the relationships
existing among sense of place, social capital, and civic engagement.
8.2 Contributions
8.2.1 Implications for theory
The quantitative approach of the literature review presented in this dissertation contributes to
research by providing a more concise, clearer, and extensive vision of the predictors of e-
122 | P a g e
participation evaluated from years 2000 to 2017, serving as the foundation for future research
and providing additional criteria for researchers to accurately select the constructs to be
included in research models to analyse e-participation adoption.
The findings of the three cross-sectional studies presented in chapter three to five
provide important contributions for the theoretical body of knowledge. All the cross-sectional
studies combined different theories to investigate the drivers of e-participation adoption. In
chapter three, previous literature suggests that when citizens are involved in consultation and
decision-making processes they develop a perception of empowerment, however, scarce
literature have evaluated the citizen empowerment as driver of e-participation adoption. We
developed a research model that integrates UTAUT (Venkatesh et al., 2012) and empowerment
theory to explain intention to use and recommend e-participation. The research model allows
us to identify that the feeling of empowerment in citizens is indeed a strong motivator of
intention to use and intention to recommend e-participation. Empowerment is evaluated as
higher-order multidimensional constructs (Johnson et al., 2012), thus we contribute to the
construct clarity of in the context of e-participation.
In chapter four, we present a research model that integrates the sense of virtual
community theory (SOVC) (Koh & Kim, 2003) which is the degree of affective attachment to a
given community mediated by an information technology, as second-order construct, and
UTAUT to examine the use and continuous intention to use e-participation. Moreover, we also
evaluated the moderating effect of SOVC between the use and continuous use. And finally, in
chapter five we contribute by evaluating a research model that integrates the four dimensions
of psychological empowerment with habit as motivators for the continued intention to use e-
participation.
The use of PLS-SEM to explore the impact of spatial components in combination with
non-spatial variables has been rarely used in the literature. In chapter seven we contribute to
fill the existing gap using PLS-SEM to evaluate whether the spatial component has an effect on
the operationalization of rich-complex human based concepts such as sense of place, social
capital, and civic engagement.
8.2.2 Implications for practice
Local governments around the world still find challenging the implementation of e-participation
tools that may achieve the involvement of citizens in consulting and decision-making process in

123 | P a g e
the long-term scenario. Since the use of e-participation is completely voluntary and oriented to
have an effect on a community and not only on the individual, the risk of low adoption and even
abandonment of e-participation projects still exists. The findings of this dissertation provide
interesting insights for the public sector that implements e-participation projects.
First, the literature review revealed several constructs that resulted significant and
positive for the adoption of e-participation, namely perceived usefulness, attitude, social
influence, trust, effort expectancy, and trust in government on intention to use; perceived ease
of use on perceived usefulness; perceived usefulness on attitude; and intention to use on use.
This suggests for local governments that have implemented e-participation platforms that
should keep the positive attitude, perception of usefulness, and trust of citizens during the
participative process.
Second, the findings from the examination of empowerment are valuable for the design
of strategies for promotion and diffusion of e-participation. Those strategies should focus on
preserve citizens’ positive perception of the four components of psychological empowerment:
competence, meaning, impact, and self-determination, focused mainly on competence and
meaning. The e-participation platform should keep the citizens informed about the final
outcomes derived from the contributions of the citizens through the platform (Royo & Yetano,
2015). Local governments should not only promote the use of e-participation tools, but also the
positive final benefits of that usage on the community. Furthermore, the positive effects of
facilitating conditions on intention to use may indicate that local governments should keep a
facilitating environment around e-participation, as for instance support chat rooms or call
centres.
Third, the usage of e-participation platforms is only a small portion of the participatory
process, which also involves background processes (Shareef et al., 2011). Local governments
that implement e-participation projects should ensure that the participants involved in
consultation and decision-making process have support throughout the entire participatory
process.
Forth, the findings regarding the sense of virtual community as driver of e-participation
adoption indicate that the local governments should consider the size of the community where
the e-participation is promoted. When the size of the community is bigger, for instance a city,
the ties between the participants tend to disappear. Consequently, the strategies to promote

124 | P a g e
the use of e-participation when addressing a city level may be different as when addressing at a
neighbourhood level (Acedo, Painho, et al., 2017).
And finally, the findings form the complementary study (co-authored), which uses
geospatial data for the evaluation of the research model, showed evidence that introducing the
spatial component has an impact on the predictors of civic engagement. The analysis of the
spatial component in the study of civic engagement may help the local governments to
implement participatory processes that combine online and offline citizen participation.
8.3 Limitations and future research
This dissertation examined in detail, using cross-sectional studies, the drivers of e-participation
adoption that are grounded on three main theories, psychological empowerment, sense of
virtual community, and UTAUT. The first logical limitation derived from this approach is the
number of theories and constructs evaluated. Large models are difficult to test. Consequently,
the inclusion of more and new drivers to evaluate using cross-sectional studies that collect data
from users of e-participation can be a fruitful path forward. For instance, cultural moderators.
Hoftede, Hofstede, & Minkov (2010) have stated that culture is for humans what software is for
computers. Culture varies from country to country. The inclusion of new or barely explored
variables such as cultural dimensions in primary studies is suggested for future research on e-
participation adoption.
Regarding the limitations of the literature review study, the 60 articles analysed are a
small portion of the existing literature on e-participation adoption. The language of the articles
is limited to English, which excludes all the significant research conducted in other languages;
and the type of selected articles was of quantitative type, excluding all the qualitative articles
that are the majority retrieved from the database search. Due to the relatively limited sample
size, conclusions regarding the trends and patterns should be interpreted with caution.
The cross-sectional studies were carried out in two Portuguese cities; therefore, caution
should be taken when generalizing the results. In order to confirm or contract the results
presented in this dissertation, the research models should be replicated to examine results and
findings across different datasets of individuals in different samples, contexts, countries, and
with different e-participation technologies. Moreover, cross-sectional studies capture a single
point in time regarding the perception of the respondents using e-participation. These
125 | P a g e
perceptions change over the time and a longitudinal evaluation could provide more interesting
insights on how user perceptions and behaviour changes over time.
We note that e-participation has several levels of citizen involvement, from simply being
informed to consultation and decision-making. Therefore, a comparative approach regarding
the factors that drive the different levels of e-participation is recommended. This may provide
interesting insights about whether the factors that influence e-participation have the same
impact across the different levels.
The respondents who participated in the electronic survey were previously registered
in the database of the municipalities that collaborated with our study. This may have created a
limitation regarding the random sample selection and may have influenced the result of non-
significance of effort expectancy on intention to use, since the users may find e-participation
easy to use and expect few or no problems when using it. Future research may address this
limitation by collecting data from a broader sample of citizens, thereby allowing a comparison
between the more and less experienced participants with e-participation.
Regarding the analysis of sense of virtual community (SOVC), only one hypothesis was
accepted, which was not in line with what is stated in previous studies. Future research is needed
to evaluate different scenarios and different e-participation platforms that may confirm or
contradict the findings of this study regarding the effect of SOVC over use and continuous
intention to use e-participation in the post-adoption stage.
Future research may evaluate the proposed theoretical model in chapter six, which
focuses on the evaluation of the citizen satisfaction considering the quality of e-participation
system and the confirmation of expectations with the usage of e-participation tools. This model
also takes into account the geographical ties of the individual, known as sense of place. For the
evaluation, data should be collected from citizens that have experienced e-participation
systems, and either are still using the system or have discontinued the usage of e-participation.
Using evaluation methods like structural equation modelling (Hair et al., 2014) we can obtain
results about the strength of the conceptual factors as drivers of citizen satisfaction, use, and
continued intention to use e-participation.
Regarding the use of spatial data in the research of e-participation context, future work
may add new relevant features enclosed in the spatial dimension of studied concepts into the
research model to investigate how and what geographical space influence the studied concepts
126 | P a g e
of sense of place, social capital, and civic engagement. And how the introduction of spatial
dimensions can shed more light on the study of e-participation adoption.
Mixed-method and mixed-data approaches are scarce on e-participation research. The
combination of two methodological approaches may significantly contribute to unveil new
undetected factors that affect, positively or negatively, the adoption of e-participation. In our
plan for future research, we want to follow the approach used by Zhang & Venkatesh (2017) in
the field of knowledge management systems, built a research model based on a qualitative
approach and then conducted a quantitative study to evaluate the model. This line of future
research is already ongoing and has the collaboration of Prof. Dr. Christy Cheung and Prof. Dr.
Viswanath Venkatesh, two worldwide prominent researchers.

127 | P a g e

128 | P a g e
References
Abu-Shanab, E. (2014). Antecedents of trust in e-government services: an empirical test in
Jordan. Transforming Government: People, Process and Policy, 8(4), 480–499.
http://doi.org/10.1108/TG-08-2013-0027
Abu-Shanab, E. A. (2015). Reengineering the open government concept: An empirical support
for a proposed model. Government Information Quarterly, 32(4), 453–463.
http://doi.org/10.1016/j.giq.2015.07.002
Acedo, A., Mendoza, G., Painho, M., & Casteleyn, S. (2017). One tool to spatialize all : sense of
place , social capital and civic engagement. In A. Bregt, T. Sarjakoski, R. Lammeren, & F.
Rip (Eds.), Societal Geo-Innovation : short papers, posters and poster abstracts of the 20th
AGILE Conference on Geographic Information Science. Wageningen: Wageningen
University & Research.
Acedo, A., Painho, M., & Casteleyn, S. (2017). Place and city: Operationalizing sense of place
and social capital in the urban context. Transactions in GIS, 21(3), 503–520.
http://doi.org/10.1111/tgis.12282
Acedo, A., Painho, M., Casteleyn, S., & Roche, S. (2018). Place and City : Toward Urban
Intelligence. International Journal of Geo-Information, 7(9), 1–21.
http://doi.org/10.3390/ijgi7090346
Ackerman, J. (2004). Co-governance for accountability: Beyond “exit” and “voice.” World
Development, 32(3), 447–463. http://doi.org/10.1016/j.worlddev.2003.06.015
Adler, R. P., & Goggin, J. (2005). What Do We Mean By “Civic Engagement”? Journal of
Transformative Education, 3(3), 236–253. http://doi.org/10.1177/1541344605276792
Agnew, J. A. (2002). Place and politics in modern Italy. University of Chicago Press.
Agnew, J. A. (2011). Space and place. In J. A. and D. Livingstone (Ed.), Handbook of
geographical knowledge (Vol. 2011, pp. 316–330). London: SAGE Publications.
http://doi.org/http://dx.doi.org/10.4135/9781446201091.n24
Ahn, M. J., & Bretschneider, S. (2011). Politics of e-government: E-government and the political
control of bureaucracy. Public Administration Review, 71(3), 414–424.
http://doi.org/10.1111/j.1540-6210.2011.02225.x
Ajzen, I., & Fishbein, M. (1977). Attitude-behavior relations: A theoretical analysis and review
129 | P a g e
of empirical research. Psychological Bulletin, 84(5), 888–918.
http://doi.org/10.1037/0033-2909.84.5.888
Akter, S., D’Ambra, J., & Ray, P. (2010). Service quality of mHealth platforms: Development and
validation of a hierarchical model using PLS. Electronic Markets, 20(3–4), 209–227.
http://doi.org/10.1007/s12525-010-0043-x
Al-Hujran, O., Al-dalahmeh, M., & Aloudat, A. (2011). The role of national culture on citizen
adoption of eGovernment services: An empirical study. Electronic Journal of E-
Government, 9(2), 93–106.
Al-Hujran, O., Al-Debei, M., & Al-Lozi, E. (2014). Examining eDemocracy adoption intention for
digital society: An integrative model. In The Eighth International Conference on Digital
Society (pp. 39–47).
Al-Quraan, H., & Abu-Shanab, E. (2015). Predictors of e-participation levels: The case of Jordan.
In The 7th International Conference on Information Technology (pp. 325–331). Amman,
Jordan. http://doi.org/10.15849/icit.2015.0064
Al-Sobhi, F., Weerakkody, V., & El-Haddadeh, R. (2011). The relative importance of
intermediaries in egovernment adoption: A study of Saudi Arabia. In International
Conference on Electronic Government (pp. 62–74). Springer Berlin Heidelberg.
Al-Somali, S. A., Gholami, R., & Clegg, B. (2009). An investigation into the acceptance of online
banking in Saudi Arabia. Technovation, 29(2), 130–141.
http://doi.org/10.1016/j.technovation.2008.07.004
Al Hujran, O., Aloudat, A., & Altarawneh, I. (2013). Factors influencing citizen adoption of e-
government in developing countries. International Journal of Technology and Human
Interaction, 9(2), 1–19. http://doi.org/10.4018/jthi.2013040101
Alathur, S., Ilavarasan, P. V., & Gupta, M. P. (2011). Citizen empowerment and participation in
e-democracy. In Proceedings of the 5th International Conference on Theory and Practice
of Electronic Governance - ICEGOV ’11 (p. 11). New York, New York, USA: ACM Press.
http://doi.org/10.1145/2072069.2072072
Alawneh, A., Al-Refai, H., & Batiha, K. (2013). Measuring user satisfaction from e-government
services: Lessons from Jordan. Government Information Quarterly, 30(3), 277–288.
http://doi.org/10.1016/j.giq.2013.03.001
130 | P a g e
Alharbi, A., Kang, K., & Hawryszkiewycz, I. (2015). The influence of trust and subjective norms
on citizens’ intentions to engage in e-participation on e-government websites. In
Australasian Conference on Information Systems.
Alharbi, N., Papadaki, M., & Dowland, P. (2017). The impact of security and its antecedents in
behaviour intention of using e-government services. Behaviour & Information
Technology, 36(6), 620–636. http://doi.org/10.1080/0144929X.2016.1269198
Allegretti, G., & Antunes, S. (2014). The Lisbon Participatory Budget: results and perspectives
on an experience in slow but continuous transformation. Field Actions Science Reports
[Online], (Special Issue 11), 1–10.
Alomari, M., Woods, P., & Kuldeep, S. (2012). Predictors for e-government adoption in Jordan:
Deployment of an empirical evaluation based on a citizen-centric approach. Information
Technology & People, 25(2), 207–234. http://doi.org/10.1108/09593841211232712
Aloudat, A., Michael, K., Chen, X., & Al-Debei, M. M. (2014). Social acceptance of location-
based mobile government services for emergency management. Telematics and
Informatics, 31(1), 153–171. http://doi.org/10.1016/j.tele.2013.02.002
Alrashedi, R., Persaud, A., & Kindra, G. (2015). Drivers of eParticipation: Case of Saudi Arabia.
The Journal of Business Inquiry, 14(1), 1–22.
Alshehri, M., Drew, S., Alhussain, T., & Alghamdi, R. (2012). The effects of website quality on
adoption of e-government service: An empirical study applying UTAUT model using SEM.
In Australasian Conference On Information Systems. Greelong.
Altman, I., & Low, S. M. (1992). Place Attachment. (I. Altman & S. M. Low, Eds.). New York,
USA: Plenum Press. http://doi.org/10.1007/978-1-4684-8753-4
Alves, M. L., & Allegretti, G. (2012). (In)Stability, a key element to understand participatory
budgeting: Discussing Portuguese cases. Journal of Public Deliberation, 8(2), Article 3.
Andersen, K. V., Henriksen, H. Z., Secher, C., & Medaglia, R. (2007). Costs of e-participation: the
management challenges. Transforming Government: People, Process and Policy, 1(1), 29–
43. http://doi.org/10.1108/17506160710733689
Antoci, A., Sabatini, F., & Sodini, M. (2015). Online and Offline Social Participation and Social
Poverty Traps: Can Social Networks Save Human Relations? The Journal of Mathematical
Sociology, 39(4), 229–256. http://doi.org/10.1080/0022250X.2015.1022278

131 | P a g e
Anton, C. E., & Lawrence, C. (2016). The relationship between place attachment, the theory of
planned behaviour and residents’ response to place change. Journal of Environmental
Psychology, 47, 145–154. http://doi.org/10.1016/j.jenvp.2016.05.010
Aricat, R. G., & Ling, R. (2016). Civic Engagement in Myanmar: The Promise and Threat of
Mobile Communication and the Internet. In R. Wei (Ed.), Mobile Communication in Asia:
Local Insights, Global Implications (pp. 123–142). Springer Science & Business Media.
http://doi.org/10.1007/978-94-024-0917-8_7
Baiocchi, G., & Ganuza, E. (2014). Participatory budgeting as if emancipation mattered. Politics
& Society, 42(1), 29–50. http://doi.org/10.1177/0032329213512978
Bandura, A. (1986). Social foundations of thought and action: A social cognitive theory: A Social
Cognitive Theory. Englewood Cliffs, NJ: Prentice Hall.
Bansal, H. S., & Voyer, P. A. (2012). World-of-mouth processes within a services purchase
decision context. Journal of Service Research, 3(2), 166–177.
Baptista, G., & Oliveira, T. (2015). Understanding mobile banking: The unified theory of
acceptance and use of technology combined with cultural moderators. Computers in
Human Behavior, 50, 418–430. http://doi.org/10.1016/j.chb.2015.04.024
Baptista, G., & Oliveira, T. (2016). A weight and a meta-analysis on mobile banking acceptance.
Computers in Human Behavior, 63, 480–489. http://doi.org/10.1016/j.chb.2016.05.074
Bataineh, L., & Abu-Shanab, E. (2016). How perceptions of e-participation levels influence the
intention to use e-government websites. Transforming Government: People, Process and
Policy, 10(2), 315–334. http://doi.org/10.1108/TG-12-2015-0058
Becker, J. M., Klein, K., & Wetzels, M. (2012). Hierarchical Latent Variable Models in PLS-SEM:
Guidelines for Using Reflective-Formative Type Models. Long Range Planning, 45(5–6),
359–394. http://doi.org/10.1016/j.lrp.2012.10.001
Belanche, D., Casaló, L., & Flavián, C. (2012). Integrating trust and personal values into the
technology acceptance model: The case of e-government services adoption. Cuadernos
de Economía y Dirección de La Empresa, 15(4), 192–204.
http://doi.org/10.1016/j.cede.2012.04.004
Bélanger, F., & Carter, L. (2008). Trust and risk in e-government adoption. The Journal of
Strategic Information Systems, 17(2), 165–176. http://doi.org/10.1016/j.jsis.2007.12.002
132 | P a g e
Bernardo, F., & Palma-Oliveira, J. M. (2016). Identification with the neighborhood:
Discrimination and neighborhood size. Self and Identity, 15(5), 579–598.
http://doi.org/10.1080/15298868.2016.1178665
Bhattacherjee & Premkumar. (2004). Understanding changes in belief and attitude toward
information technology usage: A theoretical model and longitudinal test. MIS Quarterly,
28(2), 229–254.
Bhattacherjee, A. (2001). Understanding Information Systems Continuance: An Expectation-
Confirmation Model. MIS Quarterly, 25(3), 351–370. http://doi.org/10.2307/3250921
Bodenhamer, D. J., Corrigan, J., & Harris, T. M. (2010). The Spatial Humanities.
Borenstein, M., Hedges, L. V., Higgins, J. P. T., & Rothstein, H. R. (2009). Publication bias. In
Introduction to Meta-Analysis. John Wiley & Sons, Ltd.
http://doi.org/10.1002/9780470743386.ch30
Bowman, N. A. (2012). Effect sizes and statistical methods for meta-analysis in higher
education. Research in Higher Education, 53(3), 375–382. http://doi.org/10.1007/s11162-
011-9232-5
Brito Vieira, M., Carreira da Silva, F., & Pereira, C. R. (2017). Waiting for Godot? Welfare
Attitudes in Portugal before and after the Financial Crisis. Political Studies, 65(3), 535–
558. http://doi.org/10.1177/0032321716651653
Brown, G. G., & Pullar, D. V. (2012). An evaluation of the use of points versus polygons in public
participation geographic information systems using quasi-experimental design and
Monte Carlo simulation. International Journal of Geographical Information Science, 26(2),
231–246. http://doi.org/10.1080/13658816.2011.585139
Brown, G. G., Reed, P., & Harris, C. C. (2002). Testing a place-based theory for environmental
evaluation: an Alaska case study. Applied Geography, 22(1), 49–76.
http://doi.org/10.1016/S0143-6228(01)00019-4
Brown, G., Raymond, C. M., & Corcoran, J. (2015). Mapping and measuring place attachment.
Applied Geography, 57, 42–53. http://doi.org/10.1016/j.apgeog.2014.12.011
Brown, S. A., & Venkatesh, V. (2005). Model of adoption of technology in households: A
baseline model test and extension incorporating household life cycle. MIS Quarterly,
29(3), 399–426. http://doi.org/10.1080/01972240600791333
133 | P a g e
Buta, N., Holland, S. M., & Kaplanidou, K. (2014). Local communities and protected areas: The
mediating role of place attachment for pro-environmental civic engagement. Journal of
Outdoor Recreation and Tourism, 5–6, 1–10. http://doi.org/10.1016/j.jort.2014.01.001
Cadman, L. (2009). Nonrepresentational theory/nonrepresentational geographies.
International Encyclopaedia of Human Geography, 1–8. http://doi.org/10.1016/B978-
008044910-4.00717-3
Cai Shuqin, B. H. M., Mastoi, A. G., Gul, N., & Gul, H. (2016). Evaluating citizen e-satisfaction
from e-government services: A case of Pakistan. European Scientific Journal, 12(5), 346–
370. http://doi.org/10.19044/esj.2016.v12n5p346
Carter, L., & Bélanger, F. (2004). Citizen adoption of electronic government initiatives. In 37th
Annual Hawaii International Conference on System Sciences.
Carter, L., & Bélanger, F. (2005). The utilization of e-government services: citizen trust,
innovation and acceptance factors. Information Systems Journal, 15.
http://doi.org/10.1111/j.1365-2575.2005.00183.x
Carter, L., & Bélanger, F. (2012). Internet voting and political participation: an empirical
comparison of technological and political factors. ACM SIGMIS Database, 43.
http://doi.org/10.1145/2351848.2351851
Carver, S. (2001). Participation and Geographical Information : a position paper. In ESFNSF
Workshop on Access to Geographic Information and Participatory Approaches Using
Geographic Information (pp. 6–8).
Cegarra-Navarro, J.-G., Garcia-Perez, A., & Moreno-Cegarra, J. L. (2014). Technology
knowledge and governance: Empowering citizen engagement and participation.
Government Information Quarterly, 31(4), 660–668.
http://doi.org/10.1016/j.giq.2014.07.001
Chan, F. K. Y., Thong, J. Y. L., Venkatesh, V., Brown, S. A., Hu, P. J., & Tam, K. Y. (2010).
Modeling citizen satisfaction with mandatory adoption of an e-government technology.
Journal of the Association for Information Systems, 11(10), 519–549.
Chavis, D., & Wandersman, A. (1990). Sense of community in the urban environment: A
catalyst for participation and community development. American Journal of Community
Psychology, 18(1), 55–81. http://doi.org/10.1007/BF00922689

134 | P a g e
Chen, C.-D., Yang, S.-C., Wang, K., & Farn, C.-K. (2008). Antecedents and consequences of sense
of virtual community: The customer value perspective. Proc. 7th Workshop on e-Business
(WeB 2008).
Chen, J. (2016). Can online social networks foster young adults’ civic engagement? Telematics
and Informatics. http://doi.org/10.1016/j.tele.2016.09.013
Chen, P.-Y., Wu, S., & Yoon, J. (2004). The Impact of online recommendation and consumer
feedback on sales. Proceedings of the International Conference on Information Systems,
Paper 58, 711–724. http://doi.org/http://aisel.aisnet.org/icis2004/58
Chen, Z., Zhang, G., & Li, J. (2015). Goodness-of-fit test for meta-analysis. Scientific Reports,
5(1), 1–8. http://doi.org/10.1038/srep16983
Cheng, S.-Y., Tsai, M.-T., Cheng, N.-C., & Chen, K.-S. (2012). Predicting intention to purchase on
group buying website in Taiwan: Virtual community, critical mass and risk. Online
Information Review, 36(5), 698–712. http://doi.org/10.1108/14684521211275984
Cheung, C. M. K., & Lee, M. K. O. (2012). What drives consumers to spread electronic word of
mouth in online consumer-opinion platforms. Decision Support Systems, 53(1), 218–225.
http://doi.org/10.1016/j.dss.2012.01.015
Chiang, L. (2009). Trust and security in the e-voting system. Electronic Government, an
International Journal, 6(4), 343–360. http://doi.org/10.1504/EG.2009.027782
Cho, J. (2016). The impact of post-adoption beliefs on the continued use of health apps.
International Journal of Medical Informatics, 87, 75–83.
http://doi.org/10.1016/j.ijmedinf.2015.12.016
Choi, J., & Kim, Y. (2014). The moderating effects of gender and number of friends on the
relationship between self-presentation and brand-related word-of-mouth on Facebook.
Personality and Individual Differences, 68(October 2014), 1–5.
http://doi.org/10.1016/j.paid.2014.03.040
Choi, S. O., & Kim, B. C. (2012). Voter intention to use e-voting technologies: security,
technology acceptance, election type, and political ideology. Journal of Information
Technology & Politics, 9(4), 433–452. http://doi.org/10.1080/19331681.2012.710042
Christensen, T., & Lægreid, P. (2005). Trust in Government: The Relative Importance of Service
Satisfaction, Political Factors, and Demography. Public Performance & Management
135 | P a g e
Review, 28(4), 487–511. http://doi.org/10.1080/15309576.2005.11051848
Colesca, S. E., & Dobrica, L. (2008). Adoption and use of e-government services : The case of
Romania. Journal of Applied Research and Technology, 6(3), 204–217.
Cooper, H. (2010). Research synthesis and meta-analysis: A step-by-step approach (4th ed.).
Sage Publications, Inc.
Costello, A. B., & Osborne, J. W. (2005). Best practices in exploratory factor analysis: Four
recommendations for getting the most from your analysis. Practical Assessment,
Research & Evaluation, 10, 1–9. http://doi.org/10.1.1.110.9154
Coulton, C. J., Korbin, J., Chan, T., & Su, M. (2001). Mapping residents’ perceptions of
neighborhood boundaries: a methodological note. American Journal of Community
Psychology, 29(2), 371–383. http://doi.org/10.1023/A:1010303419034
Cruz-Jesus, F., Oliveira, T., & Bacao, F. (2012). Digital divide across the European Union.
Information and Management, 49(6), 278–291. http://doi.org/10.1016/j.im.2012.09.003
Cuba, L., & Hummon, D. M. (1993). A place to call home: Identification with dwelling,
community and region. The Sociological Quarterly, 34(1), 111–131.
http://doi.org/10.1111/j.1533-8525.1993.tb00133.x
Dahi, M., & Ezziane, Z. (2015). Measuring e-government adoption in Abu Dhabi with
technology acceptance model (TAM). International Journal of Electronic Governance,
7(3), 206–231. http://doi.org/10.1504/IJEG.2015.071564
Davis, F. (1989). Perceived usefulness, perceived ease of use, and user acceptance of
information technology. MIS Quarterly, 13(3), 319–340.
Deci, E. L., & Ryan, R. M. (1985). The general causality orientations scale: Self-determination in
personality. Journal of Research in Personality, 19(2), 109–134.
http://doi.org/10.1016/0092-6566(85)90023-6
DeLone, W. H., & McLean, E. R. (1992). Information systems success: The quest for the
dependent variable. Information Systems Research, 3(1), 60–95.
http://doi.org/10.1287/isre.3.1.60
DeLone, W. H., & McLean, E. R. (2003). The DeLone and McLean model of information system
success: A Ten-Year Update. Journal of Management Information Systems / Spring, 19(4),
9–30. http://doi.org/10.1073/pnas.0914199107
136 | P a g e
DeLyser, D., & Sui, D. (2014). Crossing the qualitative-quantitative chasm III: Enduring
methods, open geography, participatory research, and the fourth paradigm. Progress in
Human Geography, 38(2), 294–307. http://doi.org/10.1177/0309132513479291
Dewsbury, J. D. (2003). Witnessing space: “Knowledge without contemplation.” Environment
and Planning A, 35(11), 1907–1932. http://doi.org/10.1068/a3582
Dietz, R. D. (2002). The estimation of neighborhood effects in the social sciences: An
interdisciplinary approach. Social Science Research, 31(4), 539–575.
http://doi.org/10.1016/S0049-089X(02)00005-4
Duff, C. (2011). Networks, resources and agencies: On the character and production of
enabling places. Health and Place, 17(1), 149–156.
http://doi.org/10.1016/j.healthplace.2010.09.012
Dwivedi, Y. K., Rana, N. P., Chen, H., & Williams, M. D. (2011). A meta-analysis of the unified
theory of acceptance and use of technology (UTAUT). In IFIP International Working
Conference on Governance and Sustainability in Information Systems-Managing the
Transfer and Diffusion of IT (pp. 155–170). Springer Berlin Heidelberg.
http://doi.org/10.1007/978-3-642-24148-2
Egenhofer, M. J., Clementini, E., & Di Felice, P. (1994). Topological relations between regions
with holes. International Journal of Geographical Information Systems, 8(2), 129–142.
http://doi.org/10.1080/02693799408901990
Egger, M., Smith, G. D., Schneider, M., & Minder, C. (1997). Bias in meta-analysis detected by a
simple, graphical test. BMJ, 315(7109), 629–634.
Elwood, S. (2006). Critical Issues in Participatory GIS: Deconstructions, Reconstructions, and
New Research Directions. Transactions in GIS, 10(5), 693–708.
http://doi.org/10.1111/j.1467-9671.2006.01023.x
Ergeneli, A., Ari, S. G., & Metin, S. (2007). Psychological empowerment and its relationship to
trust in immediate managers. Journal of Business Research, 60(1), 41–49.
http://doi.org/10.1016/j.jbusres.2006.09.012
Fishbein, M., & Ajzen, I. (1975). Belief, attitude, intention and behavior: An introduction to
theory and research. Massachusetts: Addison-Wesley.
Foresee. (2016). Foresee e-government satisfaction index Q1 2016.
137 | P a g e
Fornell, C., & Larcker, D. F. D. (1981). Evaluating structural equation models with unobservable
variables and measurement error. Journal of Marketing Research, 18(1), 39–50.
http://doi.org/10.2307/3151312
Foster, K. A., Pitner, R., Freedman, D. A., Bell, B. A., & Shaw, T. C. (2015). Spatial Dimensions of
Social Capital. City & Community, 14(4), 392–409. http://doi.org/10.1111/cico.12133
Gieryn, T. F. (2000). A Space for Place in Sociology. Annual Review of Sociology, 26(1), 463–496.
http://doi.org/10.1146/annurev.soc.26.1.463
Gonçalves, J., Kostakos, V., Karapanos, E., Barreto, M., Camacho, T., Tomasic, A., &
Zimmerman, J. (2014). Citizen motivation on the go: The role of psychological
empowerment. Interacting with Computers, 26(3), 196–207.
http://doi.org/10.1093/iwc/iwt035
Goodhue, D. l., & Thompson, R. L. (1995). Task-technology fit and individual performance. MIS
Quarterly, 19(2), 213–236.
Grootaert, C., Narayan, D., Jones, V. N., & Woolcock, M. (2004). Measuring social capital: An
integrated Questionnaire. Washington, DC, USA.
Hair, J. F., Ringle, C. M., & Sarstedt, M. (2011). PLS-SEM: Indeed a Silver Bullet. The Journal of
Marketing Theory and Practice, 19(2), 139–152. http://doi.org/10.2753/MTP1069-
6679190202
Hair, J., Hult, T., Ringle, C. M., & Sarstedt, M. (2014). A primer on partial least squares
structural equation modeling (PLS-SEM) (1st ed.). Thousand Oaks, CA: SAGE Publications.
Hair, J., Hult, T., Ringle, C. M., & Sarstedt, M. (2017). A primer on partial least squares
structural equation modeling (PLS-SEM) (2nd Editio). Thousand Oaks, CA: Sage
Publications, Inc.
Hak, T., van Rhee, H., & Suurmond, R. (2016). How to interpret results of meta- analysis.
Rotterdam, The Netherlands.
Harrison, J. S., Banks, G. C., Pollack, J. M., O’Boyle, E. H., & Short, J. (2017). Publication bias in
strategic management research. Journal of Management, 43(2), 400–425.
http://doi.org/10.1177/0149206314535438
Hartwick, J., & Barki, H. (1994). Explaining the Role of User Participation in Information System
Use. Management Science, 40(4), 440–465. http://doi.org/10.1287/mnsc.40.4.440

138 | P a g e
Haywood, B. K. (2014). A “Sense of Place” in Public Participation in Scientific Research. Science
Education, 98(1), 64–83. http://doi.org/10.1002/sce.21087
Heeks, R., & Bailur, S. (2007). Analyzing e-government research: Perspectives, philosophies,
theories, methods, and practice. Government Information Quarterly, 24(2), 243–265.
http://doi.org/10.1016/j.giq.2006.06.005
Henseler, J., Hubona, G., & Ash Ray, P. (2015). Using PLS path modeling in new technology
research: updated guidelines. Industrial Management & Data Systems, 116(1), 2–20.
http://doi.org/10.1108/IMDS-09-2015-0382
Henseler, J., Ringle, C. M., & Sarstedt, M. (2015). A new criterion for assessing discriminant
validity in variance-based structural equation modeling. Journal of the Academy of
Marketing Science, 43(1), 115–135. http://doi.org/10.1007/s11747-014-0403-8
Henseler, J., Ringle, C. M., & Sinkovics, R. R. (2009). The Use of Partial Least Squares Path
Modeling in International Marketing. Advances in International Marketing, 20(3), 277–
319. http://doi.org/10.1108/S1474-7979(2009)0000020014
Hibberts, M., Johnson, R. B., & Hudson, K. (2012). Common survey sampling techniques. In
Handbook of survey methodology for the social sciences (pp. 53–74). New York: Springer.
http://doi.org/10.1007/978-1-4614-3876-2_5
Hidalgo, M. C., & Hernández, B. (2001). Place Attachment: Conceptual and empirical questions.
Journal of Environmental Psychology, 21(3), 273–281.
http://doi.org/10.1006/jevp.2001.0221
Higgins, J. P. T., & Thompson, S. G. (2002). Quantifying heterogeneity in a meta-analysis.
Statistics in Medicine, 21(11), 1539–1558. http://doi.org/10.1002/sim.1186
Hochwälder, J., & Brucefors, A. B. (2005). Psychological empowerment at the workplace as a
predictor of ill health. Personality and Individual Differences, 39, 1237–1248.
http://doi.org/10.1016/j.paid.2005.04.010
Hoehle, H., & Venkatesh, V. (2015a). Mobile application usability: Conceptualization and
instrument development. MIS Quarterly, 39(2), 435–472.
Hoehle, H., & Venkatesh, V. (2015b). Mobile application usability: Conceptualization and
instrument development - Annex, 39(2), 435–472.
Hofstede, G., Hofstede, J. G., & Minkov, M. (2010). Cultures and organizations: software of the
139 | P a g e
mind: intercultural cooperation and its importance for survival. McGraw-Hill.
Holt, L. (2008). Embodied social capital and geographic perspectives: performing the habitus.
Progress in Human Geography, 32(2), 227–246.
http://doi.org/10.1177/0309132507087648
Hong, S., Thong, J. Y. L., & Tam, K. Y. (2006). Understanding continued information technology
usage behavior: A comparison of three models in the context of mobile internet. Decision
Support Systems, 42(3), 1819–1834. http://doi.org/10.1016/j.dss.2006.03.009
Hong, S. Y., & Yang, S. U. (2009). Effects of reputation, relational satisfaction, and customer-
company identification on positive word-of-mouth intentions. Journal of Public Relations
Research, 21(4), 381–403. http://doi.org/10.1080/10627260902966433
Hsiao, T.-T., & Chuang, S.-T. (2009). The role of virtual community in disseminating electronic
word of mouth. In 2009 Joint Conferences on Pervasive Computing (JCPC) (pp. 755–760).
IEEE. http://doi.org/10.1109/JCPC.2009.5420083
Hsu, M.-H., Yen, C.-H., Chiu, C.-M., & Chang, C.-M. (2006). A longitudinal investigation of
continued online shopping behavior: An extension of the theory of planned behavior.
International Journal of Human-Computer Studies, 64.
http://doi.org/10.1016/j.ijhcs.2006.04.004
Hu, T., Stafford, T. F., Kettinger, W. J., Zhang, X. “Paul,” & Dai, H. (2017). Formation and Effect
of Social Media Usage Habit. Journal of Computer Information Systems, 1–10.
http://doi.org/10.1080/08874417.2016.1261378
Huck, J. J., Whyatt, J. D., & Coulton, P. (2014). Spraycan: A PPGIS for capturing imprecise
notions of place. Applied Geography, 55, 229–237.
http://doi.org/10.1016/j.apgeog.2014.09.007
Hung, S.-Y., Chang, C.-M., & Kuo, S.-R. (2013). User acceptance of mobile e-government
services: An empirical study. Government Information Quarterly, 30(1), 33–44.
http://doi.org/10.1016/j.giq.2012.07.008
Hunter, B. (2016). Social Capital: Models and Efforts to Build and Restore among Marginalized
Individuals and Communities. In T. P. Gullotta, H. J. Walberg, & R. P. Weissberg (Eds.),
Social Capital and Community Well-Being (pp. 199–212). London: Springer.
INE - Instituto Nacional de Estadística. (2016). A proporção de utilizadores de internet em
140 | P a g e
mobilidade duplicou em 4 anos. Lisboa.
Ingrams, A. (2015). Mobile phones, smartphones, and the transformation of civic behavior
through mobile information and connectivity. Government Information Quarterly, 32(4),
506–515. http://doi.org/10.1016/j.giq.2015.07.007
Janssen, M., Charalabidis, Y., & Zuiderwijk, A. (2012). Benefits, Adoption Barriers and Myths of
Open Data and Open Government. Information Systems Management, 29(4), 258–268.
http://doi.org/10.1080/10580530.2012.716740
Jasperson, J., Carter, P. E., & Zmud, R. W. (2005). A comprehensive conceptualization of post-
adoptive behaviors associated with information technology enabled work systems.
Management Information Systems Quarterly, 29(3), 525–557.
http://doi.org/10.2307/25148694
Jenkins, A., Croitoru, A., Crooks, A. T., & Stefanidis, A. (2016). Crowdsourcing a Collective Sense
of Place. Plos One, 11(4), 1–20. http://doi.org/10.1371/journal.pone.0152932
Jeyaraj, A., Rottman, J. W., & Lacity, M. C. (2006). A review of the predictors, linkages, and
biases in IT innovation adoption research. Journal of Information Technology, 21(1), 1–23.
http://doi.org/10.1057/palgrave.jit.2000056
Johnson, R. E., Rosen, C. C., Chang, C.-H. (Daisy), Djurdjevic, E., & Taing, M. U. (2012).
Recommendations for improving the construct clarity of higher-order multidimensional
constructs. Human Resource Management Review, 22(2), 62–72.
http://doi.org/10.1016/j.hrmr.2011.11.006
Jorgensen, B. S. (2010). Subjective Mapping Methodologies for Incorporating Spatial Variation
in Research on Social Capital and Sense of Place. Tijdschrift Voor Economische En Sociale
Geografie, 101(5), 554–567. http://doi.org/10.1111/j.1467-9663.2010.00633.x
Jorgensen, B. S., & Stedman, R. C. (2001). Sense of place as an attitude: Lakeshore owners
attitudes toward their properties. Journal of Environmental Psychology, 21(3), 233–248.
http://doi.org/10.1006/jevp.2001.0226
Jorgensen, B. S., & Stedman, R. C. (2006). A comparative analysis of predictors of sense of
place dimensions: Attachment to, dependence on, and identification with lakeshore
properties. Journal of Environmental Management, 79(3), 316–327.
http://doi.org/10.1016/j.jenvman.2005.08.003
141 | P a g e
Jorgensen, B. S., & Stedman, R. C. (2011). Measuring the spatial component of sense of place: a
methodology for research on the spatial dynamics of psychological experiences of places.
Environment and Planning B: Planning and Design, 38(5), 795–813.
http://doi.org/10.1068/b37054
Kahila, M., & Kyttä, M. (2009). SoftGIS as a Bridge-Builder in Collaborative Urban Planning. In S.
Geertman & J. Stillwell2 (Eds.), Planning Support Systems Best Practice and New Methods
(pp. 389–411). Springer, Dordrecht. http://doi.org/10.1007/978-1-4020-8951-0
Kang, M. (2014). Understanding Public Engagement: Conceptualizing and Measuring its
Influence on Supportive Behavioral Intentions. Journal of Public Relations Research, 26(5),
399–416. http://doi.org/10.1080/1062726X.2014.956107
Kassen, M. (2017). Open data in Kazakhstan: Incentives, implementation and challenges.
Information Technology & People, 30(2), 301–323. http://doi.org/10.1108/ITP-10-2015-
0243
Kersting, N. (2016). Participatory turn? Comparing citizens’ and politicians’ perspectives on
online and offline local political participation. Lex Localis, 14(2), 251–263.
http://doi.org/10.4335/14.2.249-263(2016)
Khan, G. F., Moon, J., Swar, B., Zo, H., & Rho, J. J. (2012). E-government service use intentions
in Afghanistan: Technology adoption and the digital divide in a war-torn country.
Information Development, 28(4), 281–299. http://doi.org/10.1177/0266666912438879
Kil, N., Holland, S., & Stein, T. (2014). Place meanings and participatory planning intentions.
Society & Natural Resources, 27(5), 475–491.
http://doi.org/10.1080/08941920.2013.842274
Kim, H.-W., & Gupta, S. (2014). A User Empowerment Approach to Information Systems
Infusion. IEEE Transactions on Engineering Management, 61(4), 656–668.
http://doi.org/10.1109/TEM.2014.2354693
Kim, S. S., & Malhotra, N. K. (2005). A longitudinal model of continued IS use: An integrative
view of four mechanisms underlying postadoption phenomena. Management Science,
51(5), 741–755. http://doi.org/10.1287/mnsc.1040.0326
King, W. R., & He, J. (2006). A meta-analysis of the technology acceptance model. Information
and Management, 43(6), 740–755. http://doi.org/10.1016/j.im.2006.05.003

142 | P a g e
Kipenis, L., & Askounis, D. (2016). Assessing e-participation via user’s satisfaction
measurement: the case of OurSpace platform. Annals of Operations Research, 247(2),
599–615. http://doi.org/10.1007/s10479-015-1911-8
Kitchin, R., Gleeson, J., & Dodge, M. (2013). Unfolding mapping practices: A New epistemology
for cartography. Transactions of the Institute of British Geographers, 38(3), 480–496.
http://doi.org/10.1111/j.1475-5661.2012.00540.x
Koh, J., & Kim, Y.-G. (2003). Sense of virtual community: A conceptual framework and empirical
validation. International Journal of Electronic Commerce, 8(2), 75–94.
http://doi.org/10.1080/10864415.2003.11044295
Kollmann, T., & Kayser, I. (2010). A comprehensive approach to citizen engagement in e-
democracy. In E. Ruhode (Ed.), 6th International Conference on e-Government - ICEG2006
(pp. 54–62). Cape Town: Academic Conferences and Publishing International.
Kubicek, H., & Aichholzer, G. (2016). Closing the Evaluation Gap in e-participation Research and
Practice. In Evaluating e-Participation Frameworks, Practice, Evidence (pp. 11–45).
Springer. http://doi.org/10.1007/978-3-319-25403-6
Kyttä, M., & Kahila, M. (2011). SoftGIS methodology—building bridges in urban planning. GIM
International (The Global Magazine for Geomatics), 25(3).
Latour, B. (2005). Reassembling the Social.
Law, J. (2008). On sociology and STS. Sociological Review, 56(4), 623–649.
http://doi.org/10.1111/j.1467-954X.2008.00808.x
Lean, O. K., Zailani, S., Ramayah, T., & Fernando, Y. (2009). Factors influencing intention to use
e-government services among citizens in Malaysia. International Journal of Information
Management, 29(6), 458–475. http://doi.org/10.1016/j.ijinfomgt.2009.03.012
Lee, J.-K., Braynov, S., & Rao, R. (2003). Effects of public emergency on citizens’ usage intention
toward e-government: a study in the context of war in Iraq. In International Conference
on Information Systems - ICIS (pp. 896–902).
Lee, J., & Kim, S. (2012). E-participation in the era of web 2.0: Factors affecting citizens’ active
e-participation in local governance. In Proceedings of the 6th International Conference on
Theory and Practice of Electronic Governance - ICEGOV ’12 (pp. 44–47). New York, New
York, USA: ACM Press. http://doi.org/10.1145/2463728.2463739
143 | P a g e
Lee, J., & Kim, S. (2014). Active Citizen E-Participation in Local Governance: Do Individual Social
Capital and E-Participation Management Matter? In System Sciences (HICSS) (47th Hawai,
pp. 2044–2053). IEEE. http://doi.org/10.1109/HICSS.2014.259
Lee, J., & Kim, S. (2018). Citizens’ e-participation on agenda setting in local governance: Do
individual social capital and e-participation management matter? Public Management
Review, 20(6), 873–895. http://doi.org/10.1080/14719037.2017.1340507
Lee, J., & Rao, H. R. (2009). Task complexity and different decision criteria for online service
acceptance: A comparison of two e-government compliance service domains. Decision
Support Systems, 47(4), 424–435. http://doi.org/10.1016/j.dss.2009.04.009
Lee, K., Yan, A., & Joshi, K. (2011). Understanding the dynamics of users’ belief in software
application adoption. International Journal of Information Management, 31(2), 160–170.
http://doi.org/10.1016/j.ijinfomgt.2010.07.009
Lewicka, M. (2005). Ways to make people active: The role of place attachment, cultural capital,
and neighborhood ties. Journal of Environmental Psychology, 25(4), 381–395.
http://doi.org/10.1016/j.jenvp.2005.10.004
Lewicka, M. (2011). Place attachment: How far have we come in the last 40 years? Journal of
Environmental Psychology, 31(3), 207–230. http://doi.org/10.1016/j.jenvp.2010.10.001
Lewicka, M. (2013). Place inherited or place discovered? Agency and communion in people-
place bonding. Estudios De Psicologia, 34(3), 261–274.
http://doi.org/10.1174/021093913808295154
Li, H., & Liu, Y. (2014). Understanding post-adoption behaviors of e-service users in the context
of online travel services. Information and Management, 51(8), 1043–1052.
http://doi.org/10.1016/j.im.2014.07.004
Liao, C., Palvia, P., & Chen, J. L. (2009). Information technology adoption behavior life cycle:
Toward a Technology Continuance Theory (TCT). International Journal of Information
Management, 29(4), 309–320. http://doi.org/10.1016/j.ijinfomgt.2009.03.004
Lin, C.-C., & Lockwood, M. (2014). Forms and sources of place attachment: Evidence from two
protected areas. Geoforum, 53, 74–81. http://doi.org/10.1016/j.geoforum.2014.02.008
Lin, F., Fofanah, S. S., & Liang, D. (2011). Assessing citizen adoption of e-government initiatives
in Gambia: A validation of the technology acceptance model in information systems

144 | P a g e
success. Government Information Quarterly, 28(2), 271–279.
http://doi.org/10.1016/j.giq.2010.09.004
Lindner, R., & Riehm, U. (2011). Broadening participation through e-petitions? An empirical
study of petitions to the German Parliament. Policy & Internet, 3(1), 63–85.
http://doi.org/10.2202/1944-2866.1083
Liu, Y., Li, H., Kostakos, V., Goncalves, J., Hosio, S., & Hu, F. (2014). An empirical investigation of
mobile government adoption in rural China: A case study in Zhejiang province.
Government Information Quarterly, 31(3), 432–442.
http://doi.org/10.1016/j.giq.2014.02.008
Luo, M. M., Chea, S., & Bui, T. X. (2016). Post-adoption behavior of digital Media: The merge of
U&G theory and affect event theory. In Pacific Asia Conference on Information Systems
(PACIS) 2016. Chia-Yi, Taiwan.
Luo, X., Li, H., Zhang, J., & Shim, J. P. (2010). Examining multi-dimensional trust and multi-
faceted risk in initial acceptance of emerging technologies: An empirical study of mobile
banking services. Decision Support Systems, 49(2), 222–234.
http://doi.org/10.1016/j.dss.2010.02.008
Lussault, M. (2007). L’Homme spatial. La construction sociale de l’espace humain: La
construction sociale de l’espace humain. Paris, France: Le Seuil.
Ma, L., & Zheng, Y. (2017). National e-government performance and citizen satisfaction: A
multilevel analysis across European countries. International Review of Administrative
Sciences, 1–21. http://doi.org/10.1177/0020852317703691
Macintosh, A. (2004). Characterizing e-participation in policy-making. In 37th Hawaii
International Conference on System Sciences (p. 10). Big Island, HI, USA: IEEE.
http://doi.org/10.1109/HICSS.2004.1265300
Macintosh, A., Coleman, S., & Schneeberger, A. (2009). eParticipation: The research gaps. In A.
Macintosh & E. Tambouris (Eds.), First International Conference of Electronic Participation
(pp. 1–11). Linz - Austria: Springer-Verlag Berlin Heidelberg.
Macintosh, A., & Whyte, A. (2008). Towards an evaluation framework for eParticipation.
Transforming Government: People, Process and Policy, 2(1), 16–30.
http://doi.org/10.1108/17506160810862928

145 | P a g e
Mackenzie, S. B., Podsakoff, P. M., & Podsakoff, N. P. (2011). Construct measurement and
validation procedures in MIS and behavioral research: Integrating new and existing
techniques. MIS Quarterly, 35(2), 293–334.
Magalhães, P. (2005). Disaffected democrats: Political attitudes and political action in Portugal.
West European Politics, 28(5), 973–991. http://doi.org/10.1080/01402380500310626
Mahmoudi Farahani, L. (2016). The Value of the Sense of Community and Neighbouring.
Housing, Theory and Society, 6096(April), 1–20.
http://doi.org/10.1080/14036096.2016.1155480
Manzo, L. C. (2005). For better or worse: Exploring multiple dimensions of place meaning.
Journal of Environmental Psychology, 25(1), 67–86.
http://doi.org/10.1016/j.jenvp.2005.01.002
Manzo, L. C., & Perkins, D. D. (2006). Finding Common Ground: The Importance of Place
Attachment to Community Participation and Planning. Journal of Planning Literature,
20(4), 335–350. http://doi.org/10.1177/0885412205286160
Martins, C., Oliveira, T., & Popovič, A. (2014). Understanding the Internet banking adoption: A
unified theory of acceptance and use of technology and perceived risk application.
International Journal of Information Management, 34(1), 1–13.
http://doi.org/http://dx.doi.org/10.1016/j.ijinfomgt.2013.06.002
Martins, J., Gonçalves, R., & Branco, F. (2017). A full scope web accessibility evaluation
procedure proposal based on Iberian eHealth accessibility compliance. Computers in
Human Behavior, 71, 676–684. http://doi.org/10.1016/j.chb.2016.12.010
Massey, D. (1991). A Global Sense of Place. Marxism Today, 35, 315–323.
http://doi.org/10.1016/j.pecs.2007.10.001
Massey, D. (1994). Space, Place, and Gender. Minneapolis: University of Minnesota Press.
http://doi.org/10.1049/el:19990302
Matheus, R., Ribeiro, M. M., Vaz, J. C., & Souza, C. A. de. (2010). Case studies of digital
participatory budgeting in Latin America - models for citizen engagement. In ICEGOV ’10 -
4th International Conference on Theory and Practice of Electronic Governance (pp. 31–
36). http://doi.org/10.1145/1930321.1930328
Medaglia, R. (2012). eParticipation research: Moving characterization forward (2006-2011).
146 | P a g e
Government Information Quarterly, 29(3), 346–360.
http://doi.org/10.1016/j.giq.2012.02.010
Mesch, G. S., & Manor, O. (1998). Social Ties, Environmental Perception, And Local
Attachment. Environment and Behavior, 30(4), 504–519.
http://doi.org/10.1177/001391659803000405
Mesch, G. S., & Talmud, I. (2010). Internet Connectivity, Community Participation, and Place
Attachment: A Longitudinal Study. American Behavioral Scientist, 53(8), 1095–1110.
http://doi.org/10.1177/0002764209356243
Miguel, C. M., Ornelas, H. J., & Maroco, P. J. (2015). Defining Psychological Empowerment
Construct: Analysis of three empowerment scales. Journal of Community Psychology, 43,
900–919.
Miltgen, C. L., Popovič, A., & Oliveira, T. (2013). Determinants of end-user acceptance of
biometrics: Integrating the “big 3” of technology acceptance with privacy context.
Decision Support Systems, 56(1), 103–114. http://doi.org/10.1016/j.dss.2013.05.010
Miori, V., & Russo, D. (2011). Integrating online and traditional involvement in participatory
budgeting. Electronic Journal of E-Government, 9(1), 41–57.
Mkude, C. G., Pérez-Espés, C., & Wimmer, M. A. (2014). Participatory budgeting: A framework
to analyze the value-add of citizen participation. In Proceedings of the 47th Hawaii
International Conference on System Sciences (pp. 2054–2062).
http://doi.org/10.1109/HICSS.2014.260
Mohammadi, S. H., Norazizan, S., & Shahvandi, A. R. (2011). Civic Engagement, Citizen
Participation and Quality of Governance in Iran. Journal of Human Ecology, 36(3), 211–
216.
Montello, D. R., Goodchild, M. F., Gottsegen, J., & Fohl, P. (2003). Where’s downtown?:
Behavioral methods for determining referents of vague spatial queries. Spatial Cognition
and Computation, 3(2–3), 185–204. http://doi.org/10.1080/13875868.2003.9683761
Moores, T. T., & Chang, J. C.-J. (2006). Ethical decision making in software piracy: Initial
development and test of a four-component model. MIS Quarterly, 30(1), 167–180.
http://doi.org/10.2307/4132321
Moro, G. (2010). Civic Action Key Issues. International Encyclopedia of Civil Society, 1–9.

147 | P a g e
Mossberger, K., Wu, Y., & Crawford, J. (2013). Connecting citizens and local governments?
Social media and interactivity in major U.S. cities. Government Information Quarterly,
30(4), 351–358. http://doi.org/10.1016/j.giq.2013.05.016
Mou, Y., Atkin, D., Fu, H., Lin, C. A., & Lau, T. Y. (2013). The influence of online forum and SNS
use on online political discussion in China: Assessing “spirals of trust.” Telematics and
Informatics, 359–369. http://doi.org/10.1016/j.tele.2013.04.002
Murdoch, J. (1998). The spaces of actor-network theory. Geoforum, 29(4), 357–374.
http://doi.org/10.1016/S0016-7185(98)00011-6
Naranjo Zolotov, M., Oliveira, T., & Casteleyn, S. (2018). E-participation adoption models
research in the last 17 years: A weight and meta-analytical review. Computers in Human
Behavior, 81, 350–365. http://doi.org/10.1016/j.chb.2017.12.031
negocios.pt. (2017). 118 Orçamentos Participativos colocam Portugal no topo da Europa.
Retrieved September 15, 2017, from
http://www.jornaldenegocios.pt/economia/autarquias/detalhe/118-orcamentos-
participativos-colocam-portugal-no-topo-da-europa
Newbrough, J. R., & Chavis, D. M. (1986). Psychological sense of community, I: Foreword.
Journal of Community Psychology, 14(1), 6–23. http://doi.org/10.1002/1520-
6629(198601)14:1<3::AID-JCOP2290140102>3.0.CO;2-U
Newman, G., Chandler, M., Clyde, M., McGreavy, B., Haklay, M., Ballard, H., … Gallo, J. (2016).
Leveraging the power of place in citizen science for effective conservation decision
making. Biological Conservation, (August). http://doi.org/10.1016/j.biocon.2016.07.019
Oghuma, A. P., Libaque-Saenz, C. F., Wong, S. F., & Chang, Y. (2016). An expectation-
confirmation model of continuance intention to use mobile instant messaging. Telematics
and Informatics, 33(1), 34–47. http://doi.org/10.1016/j.tele.2015.05.006
Oh, J.-C., & Yoon, S.-J. (2014). Predicting the use of online information services based on a
modified UTAUT model. Behaviour & Information Technology, 33(7), 716–729.
http://doi.org/10.1080/0144929X.2013.872187
Oliveira, G. H. M., & Welch, E. W. (2013). Social media use in local government: Linkage of
technology, task, and organizational context. Government Information Quarterly, 30(4),
397–405. http://doi.org/10.1016/j.giq.2013.05.019
148 | P a g e
Oliveira, T., Faria, M., Thomas, M. A., & Popovič, A. (2014). Extending the understanding of
mobile banking adoption: When UTAUT meets TTF and ITM. International Journal of
Information Management, 34(5), 689–703.
http://doi.org/10.1016/j.ijinfomgt.2014.06.004
Oliveira, T., Thomas, M., Baptista, G., & Campos, F. (2016). Mobile payment: Understanding
the determinants of customer adoption and intention to recommend the technology.
Computers in Human Behavior, 61, 404–414. http://doi.org/10.1016/j.chb.2016.03.030
Omar, A., Weerakkody, V., & Sivarajah, U. (2017). Developing criteria for evaluating a multi-
channel digitally enabled participatory budgeting platform. In International Conference
on Electronic Participation (Vol. 7444, pp. 3–11). Springer. http://doi.org/10.1007/978-3-
642-33250-0
Ong, C.-S., & Lin, M. Y.-C. (2016). Is being satisfied enough? Well-being and IT post-adoption
behavior: An empirical study of Facebook. Information Development, 32(4), 1042–1054.
http://doi.org/10.1177/0266666915587032
Oni, A. A., Oni, S., Mbarika, V., & Ayo, C. K. (2017). Empirical study of user acceptance of online
political participation: Integrating civic voluntarism model and theory of reasoned action.
Government Information Quarterly, (1). http://doi.org/10.1016/j.giq.2017.02.003
Orlikowski, W., & Baroudi, J. J. (1991). Studying information technology in organizations:
Research approaches and assumptions. Information Systems Research, 2(1), 1–28.
http://doi.org/10.1287/isre.2.1.1
Pain, R., & Kindon, S. (2007). Participatory geographies. Environment and Planning A, 39(12),
2807–2812. http://doi.org/10.1068/a39347
Panopoulou, E., Tambouris, E., & Tarabanis, K. (2014). Success factors in designing
eParticipation initiatives. Information and Organization, 24(4), 195–213.
http://doi.org/10.1016/j.infoandorg.2014.08.001
Park, M. J., Choi, H., & Rho, J. J. (2014). Citizen patronage behavior of government social media
services: Extended perspective of perceived value with the moderating effect of media
synchronicity. Information Development. http://doi.org/10.1177/0266666914543959
Peixoto, T. (2009). Beyond theory : e-Participatory budgeting and its promises for
eParticipation. European Journal of EPractice, 7(March), 1–9.
149 | P a g e
Pereira, G. V., Cunha, M. A., Lampoltshammer, T. J., Parycek, P., & Testa, M. G. (2017).
Increasing collaboration and participation in smart city governance: a cross-case analysis
of smart city initiatives. Information Technology for Development.
http://doi.org/10.1080/02681102.2017.1353946
Perkins, D. D., Brown, B. B., & Taylor, R. B. (1996). The ecology of empowerment: Predicting
participation in community organizations. Journal of Social Issues, 52, 85–110.
http://doi.org/10.1111/j.1540-4560.1996.tb01363.x
Perkins, D. D., Hughey, J., & Speer, P. W. (2002). Community psychology perspectives on social
capital theory and community development practice. Journal of the Community
Development Society, 33(1), 33–52. http://doi.org/10.1080/15575330209490141
Perkins, D. D., & Long, D. A. (2002). Neighborhood sense of community and social capital: A
multi-level analysis. In A. Fischer, C. Sonn, & B. Bishop (Eds.), Psychological sense of
community: Research, applications and implications (pp. 291–318). New York: Plenum
Press.
Persaud, A., & Persaud, P. (2013). Rethinking E-Government Adoption: A user-focussed model
abstract. International Journal of Electronic Government Research, 9(4), 56–74.
http://doi.org/10.4018/ijegr.2013100104
Peterson, N. A. (2014). Empowerment Theory: Clarifying the Nature of Higher-Order
Multidimensional Constructs. American Journal of Community Psychology, 53(1–2), 96–
108. http://doi.org/10.1007/s10464-013-9624-0
Peterson, N. A., Speer, P. W., & McMillan, D. W. (2008). Validation of a brief sense of
community scale: Confirmation of the principal theory of sense of community. Journal of
Community Psychology, 36(1), 61–73. http://doi.org/10.1002/jcop.20217
Petrovsky, N., Mok, J. Y., & León-Cázares, F. (2017). Citizen expectations and satisfaction in a
young democracy: A test of the expectancy-disconfirmation model. Public Administration
Review, 77(3), 395–407. http://doi.org/10.1111/puar.12623
Phang, C. W., & Kankanhalli, A. (2006). Engaging youths via e-participation initiatives: An
investigation into the context of online policy discussion forums. In Social inclusion:
societal and organizational implications for information systems (Vol. 208, pp. 105–121).
http://doi.org/10.1007/0-387-34588-4
Phang, C. W., & Kankanhalli, A. (2008). A framework of ICT exploitation for e-participation
150 | P a g e
initiatives. Communications of the ACM, 51(12), 128–132.
http://doi.org/10.1145/1409360.1409385
Piehler, R., Wirtz, B. W., & Daiser, P. (2016). An analysis of continuity intentions of
eGovernment portal users. Public Management Review, 18(2), 163–198.
http://doi.org/10.1080/14719037.2014.965270
Pile, S. (2010). Emotions and effect in recent human geography. Transactions of the Institute of
British Geographers, 35(1), 5–20. http://doi.org/10.1111/j.1475-5661.2009.00368.x
Porumbescu, G. A. (2016). Linking public sector social media and e-government website use to
trust in government. Government Information Quarterly, 33(2), 291–304.
http://doi.org/10.1016/j.giq.2016.04.006
Pretty, G. H., Chipuer, H. M., & Bramston, P. (2003). Sense of place amongst adolescents and
adults in two rural Australian towns: The discriminating features of place attachment,
sense of community and place dependence in relation to place identity. Journal of
Environmental Psychology, 23(3), 273–287. http://doi.org/10.1016/S0272-
4944(02)00079-8
Proshansky, H. M., Fabian, A. K., & Kaminoff, R. (1983). Place-identity: Physical world
socialization of the self. Journal of Environmental Psychology, 3(1), 57–83.
http://doi.org/10.1016/S0272-4944(83)80021-8
Putnam, R. D. (2000). Bowling alone: The collapse and revival of American community (Vol.
747). New York, USA: Simon and Schuster.
Rabaa’i, A. A. (2015). An empirical investigation on the adoption of e-Government in
developing countries: The case of Jordan. Computer and Information Science, 8(3), 83–
102. http://doi.org/10.5539/cis.v8n3p83
Radcliffe, S. A. (2004). Geography of development: development, civil society and inequality –
social capital is (almost) dead? Progress in Human Geography, 28(4), 517–527.
http://doi.org/10.1191/0309132504ph500pr
Rana, N. P., & Dwivedi, Y. K. (2015). Citizen’s adoption of an e-government system: Validating
extended social cognitive theory (SCT). Government Information Quarterly, 32(2), 172–
181. http://doi.org/10.1016/j.giq.2015.02.002
Rana, N. P., Dwivedi, Y. K., & Williams, M. D. (2015). A meta-analysis of existing research on

151 | P a g e
citizen adoption of e-government. Information Systems Frontiers, 17(3), 547–563.
http://doi.org/10.1007/s10796-013-9431-z
Rana, N. P., Dwivedi, Y. K., Williams, M. D., & Weerakkody, V. (2016). Adoption of online public
grievance redressal system in India: Toward developing a unified view. Computers in
Human Behavior, 59, 265–282. http://doi.org/10.1016/j.chb.2016.02.019
Rappaport, J. (1987). Terms of empowerment/exemplars of prevention: toward a theory for
community psychology. American Journal of Community Psychology, 15(2), 121–148.
http://doi.org/10.1007/BF00919275
Raymond, C. M., Brown, G., & Weber, D. (2010). The measurement of place attachment:
Personal, community, and environmental connections. Journal of Environmental
Psychology, 30(4), 422–434. http://doi.org/10.1016/j.jenvp.2010.08.002
Rehman, M., Esichaikul, V., & Kamal, M. (2012). Factors influencing e-government adoption in
Pakistan. Transforming Government: People, Process and Policy, 6(3), 258–282.
http://doi.org/10.1108/17506161211251263
Ringle, C. M. (2012). A Critical Look at the Use of PLS-SEM in MIS Quarterly. MIS Quarterly,
36(1), iii–xiv.
Ringle, C. M., Wende, S., & Becker, J.-M. (2015). SmartPLS 3. Bönningstedt: SmartPLS.
Retrieved from http://www.smartpls.com
Roche, S. (2016). Geographic information science II. Progress in Human Geography, 40(4), 565–
573. http://doi.org/10.1177/0309132515586296
Rodrigues, G., Sarabdeen, J., & Balasubramanian, S. (2016). Factors that influence consumer
adoption of e-government services in the UAE: A UTAUT model perspective. Journal of
Internet Commerce, 15(1), 18–39. http://doi.org/10.1080/15332861.2015.1121460
Rodríguez Bolívar, M. P., Alcaide Muñoz, L., & López Hernández, A. M. (2016). Scientometric
Study of the Progress and Development of e-Government Research During the Period
2000–2012. Information Technology for Development, 1102(June 2015), 1–39.
http://doi.org/10.1080/02681102.2014.927340
Rokhman, A. (2011). E-government adoption in developing countries; the case of Indonesia.
Journal of Emerging Trends in Computing and Information Sciences, 2(5), 228–236.
Rosenberg, M. J. (1960). Cognitive, affective, and behavioral components of attitudes. Attitude

152 | P a g e
Organization and Change.
Royo, S., & Yetano, A. (2015). “Crowdsourcing” as a tool for e-participation: two experiences
regarding CO2 emissions at municipal level. Electronic Commerce Research, 15(3), 323–
348. http://doi.org/10.1007/s10660-015-9183-6
Rutten, R., Westlund, H., & Boekema, F. (2010). The Spatial Dimension of Social Capital.
European Planning Studies, 18(6), 863–871. http://doi.org/10.1080/09654311003701381
Rydin, Y., & Pennington, M. (2011). Public Participation and Local Environmental Planning : The
collective action problem and the potential of social capital. Local Environment: The
International Journal of Justice and Sustainability, 5(2), 153–169.
http://doi.org/10.1080/13549830050009328
Sæbø, Ø., Rose, J., & Skiftenes Flak, L. (2008). The shape of eParticipation: Characterizing an
emerging research area. Government Information Quarterly, 25(3), 400–428.
http://doi.org/10.1016/j.giq.2007.04.007
Sanford, C., & Rose, J. (2007). Characterizing eParticipation. International Journal of
Information Management, 27(6), 406–421.
http://doi.org/10.1016/j.ijinfomgt.2007.08.002
Schaupp, L. C., & Carter, L. (2005). E-voting: From apathy to adoption. Journal of Enterprise
Information Management, 18(5), 586–601. http://doi.org/10.1108/17410390510624025
Schaupp, L. C., Carter, L., & McBride, M. E. (2010). E-file adoption: A study of U.S. taxpayers’
intentions. Computers in Human Behavior, 26(4), 636–644.
http://doi.org/10.1016/j.chb.2009.12.017
Schmidthuber, L., Hilgers, D., & Gegenhuber, T. (2017). Shedding light on participation in open
government arenas : Determinants of platform activity of web and app users. In
Proceedings of the 50th Hawaii International Conference on System Sciences | 2017 (pp.
2761–2770).
Seo, D., & Bernsen, M. (2016). Comparing attitudes toward e-government of non-users versus
users in a rural and urban municipality. Government Information Quarterly.
http://doi.org/10.1016/j.giq.2016.02.002
Shareef, M. A., Kumar, V., Kumar, U., & Dwivedi, Y. K. (2011). E-Government Adoption Model
(GAM): Differing service maturity levels. Government Information Quarterly, 28(1), 17–
153 | P a g e
35. http://doi.org/10.1016/j.giq.2010.05.006
Sharma, S. (1996). Applied multivariate techniques. New York, New York, USA: John Wiley &
Sons, Inc.
Sheedy, A., Mackinnon, P., Pitre, S., & Watling, J. (2008). Handbook on Citizen Engagement :
Beyond Consultation. Canadian Policy Research Networks, (March), 59.
Shin, D.-H. (2010). The effects of trust, security and privacy in social networking: A security-
based approach to understand the pattern of adoption. Interacting with Computers,
22(5), 428–438. http://doi.org/10.1016/j.intcom.2010.05.001
Shin, D.-H., Lee, S., & Hwang, Y. (2017). How do credibility and utility play in the user
experience of health informatics services? Computers in Human Behavior, 67, 292–302.
http://doi.org/10.1016/j.chb.2016.11.007
Shyu, S. H.-P., & Huang, J.-H. (2011). Elucidating usage of e-government learning: A perspective
of the extended technology acceptance model. Government Information Quarterly, 28(4),
491–502. http://doi.org/10.1016/j.giq.2011.04.002
Sintomer, Y., Herzberg, C., Allegretti, G., & Röcke, A. (2010). Learning from the South:
Participatory budgeting worldwide – an invitation to global cooperation. Bonn: InWEnt
gGmbH – Capacity Building International, Germany/ Service Agency Communities in One
World.
Sintomer, Y., Herzberg, C., Allegretti, G., Röcke, A., & Alves, M. (2013). Participatory budgeting
worldwide - Updated version. Bonn: GLOBAL CIVIC ENGAGEMENT – Service for
Development Initiatives.
Sintomer, Y., Herzberg, C., & Röcke, A. (2008). Participatory budgeting in Europe: Potentials
and challenges. International Journal of Urban and Regional Research, 32(1), 164–178.
http://doi.org/10.1111/j.1468-2427.2008.00777.x
Sjoberg, F. M., Mellon, J., & Peixoto, T. (2017). The Effect of Bureaucratic Responsiveness on
Citizen Participation. Public Administration Review, 77(3), 340–351.
http://doi.org/10.1111/puar.12697
Son, J., & Lin, N. (2008). Social capital and civic action: A network-based approach. Social
Science Research, 37(1), 330–349. http://doi.org/10.1016/j.ssresearch.2006.12.004
Spreitzer, G. (1995). Psychological Empowerment in the Workplace: Dimensions,
154 | P a g e
Measurement, and Validation. Academy of Management Journal, 38(5), 1442–1465.
Stedman, R. C. (2002). Toward a social psychology of place: Predicting behavior from place-
based congnitions, attitude, and identity. Environment and Behavior, 34(5), 561–581.
http://doi.org/10.1177/0013916502034005001
Stedman, R. C. (2003). Is It Really Just a Social Construction?: The Contribution of the Physical
Environment to Sense of Place. Society & Natural Resources, 16(8), 671–685.
http://doi.org/10.1080/08941920309189
Sterne, J. A. C., Gavaghan, D., & Egger, M. (2000). Publication and related bias in meta-analysis:
Power of statistical tests and prevalence in the literature. Journal of Clinical
Epidemiology, 53(11), 1119–1129. http://doi.org/10.1016/S0895-4356(00)00242-0
Sterne, J. A. C., Sutton, A. J., Ioannidis, J. P. A., Terrin, N., Jones, D. R., Lau, J., … Higgins, J. P. T.
(2011). Recommendations for examining and interpreting funnel plot asymmetry in
meta-analyses of randomised controlled trials. BMJ (Clinical Research Ed.), 343(d4002),
1–8. http://doi.org/10.1136/bmj.d4002
Styvén, M., & Wallström, Å. (2011). “IT’s complicated”: Influence of perceived sacrifice and
trust on eService adoption. In International Conference on Electronic Government (pp.
112–121). Springer Berlin Heidelberg.
Sui, D., & DeLyser, D. (2012). Crossing the qualitative-quantitative chasm I: Hybrid geographies,
the spatial turn, and volunteered geographic information (VGI). Progress in Human
Geography, 36(1), 111–124. http://doi.org/10.1177/0309132510392164
Šumak, B., Heričko, M., & Pušnik, M. (2011). A meta-analysis of e-learning technology
acceptance: The role of user types and e-learning technology types. Computers in Human
Behavior, 27(6), 2067–2077. http://doi.org/10.1016/j.chb.2011.08.005
Sun, H. (2013). A longitudinal study of herd behavior in the adoption and continued use of
technology. MIS Quarterly, 37(4), 1013–1041.
Susanto, A., Chang, Y., & Ha, Y. (2016). Determinants of continuance intention to use the
smartphone banking services. Industrial Management & Data Systems, 116(3), 508–525.
http://doi.org/10.1108/IMDS-05-2015-0195
Susha, I., & Grönlund, Å. (2012). eParticipation research: Systematizing the field. Government
Information Quarterly, 29(3), 373–382. http://doi.org/10.1016/j.giq.2011.11.005
155 | P a g e
Talò, C., & Mannarini, T. (2015). Measuring Participation: Development and Validation the
Participatory Behaviors Scale. Social Indicators Research, 123(3), 799–816.
http://doi.org/10.1007/s11205-014-0761-0
Talò, C., Mannarini, T., & Rochira, A. (2014). Sense of community and community participation:
A meta-analytic review. Social Indicators Research, 117(1), 1–28.
http://doi.org/10.1007/s11205-013-0347-2
Tam, C., & Oliveira, T. (2017). Understanding mobile banking individual performance The
DeLone & McLean model and the moderating effects of individual culture. Internet
Research, 27(3), 538–562. http://doi.org/10.1108/IntR-05-2016-0117
Tan, C.-W., Bembasat, I., & Cenfetelli, R. T. (2008). Building citizen trust towards e-government
services: Do high quality websites matter? In 41st Hawaii International Conference on
System Sciences (p. 217). IEEE.
Tang, H. L., Chung, S. H., & Se, C. W. (2009). Examining the impact of possible antecedents on
service usage: An empirical study on Macao e-government. Electronic Government, an
International Journal, 6(1), 97. http://doi.org/10.1504/EG.2009.022595
Tarhini, A., El-Masri, M., Ali, M., & Serrano, A. (2016). Extending the UTAUT model to
understand the customers’ acceptance and use of internet banking in Lebanon.
Information Technology & People, 29(4), 830–849. http://doi.org/10.1108/ITP-02-2014-
0034
Teo, T. S. H., Srivastava, S. C., & Jiang, L. (2009). Trust and electronic government success: An
empirical study. Journal of Management Information Systems, 25(3), 99–132.
http://doi.org/10.2753/MIS0742-1222250303
Terrin, N., Schmid, C. H., & Lau, J. (2005). In an empirical evaluation of the funnel plot,
researchers could not visually identify publication bias. Journal of Clinical Epidemiology,
58(9), 894–901. http://doi.org/10.1016/j.jclinepi.2005.01.006
The World Bank. (2007). Participatory Budgeting. Public Sector Governance and Accountability
Series. The World Bank. http://doi.org/10.1596/978-0-8213-6923-4
Thomas, K. W., & Velthouse, B. A. (1990). Cognitive Elements of Empowerment: An
“Interpretive” Model of Intrinsic Task Motivation. The Academy of Management Review,
15(4), 666. http://doi.org/10.2307/258687
156 | P a g e
Thrift, N. (2008). Non-representational theory: Space, politics, affect. (J. Urry, Ed.). Routledge.
Tojib, D., & Tsarenko, Y. (2012). Post-adoption modeling of advanced mobile service use.
Journal of Business Research, 65(7), 922–928.
http://doi.org/10.1016/j.jbusres.2011.05.006
Torcal, M. (2014). The Decline of Political Trust in Spain and Portugal: Economic Performance
or Political Responsiveness? American Behavioral Scientist, 58(12), 1542–1567.
http://doi.org/10.1177/0002764214534662
Torgerson, C. J. (2006). Publication bias: The achilles’ heel of systematic reviews? British
Journal of Educational Studies, 54(1), 89–102. http://doi.org/10.1111/j.1467-
8527.2006.00332.x
Trentelman, C. K. (2009). Place Attachment and Community Attachment: A Primer Grounded in
the Lived Experience of a Community Sociologist. Society & Natural Resources, 22(3),
191–210. http://doi.org/10.1080/08941920802191712
Tsai, M.-T., Cheng, N.-C., & Chen, K.-S. (2011). Understanding online group buying intention:
the roles of sense of virtual community and technology acceptance factors. Total Quality
Management & Business Excellence, 22(10), 1091–1104.
http://doi.org/10.1080/14783363.2011.614870
Tsai, Y.-H., Joe, S.-W., Lin, C.-P., Wang, R.-T., & Chang, Y.-H. (2012). Modeling the relationship
between IT-mediated social capital and social support: Key mediating mechanisms of
sense of group. Technological Forecasting & Social Change, 79(9), 1592–1604.
http://doi.org/10.1016/j.techfore.2012.05.013
Tuan, Y.-F. (1978). Space and Place: The Perspective of Experience. Contemporary Sociology
(Vol. 7). Minneapolis, MN, USA: University of Minnesota Press.
http://doi.org/10.2307/2064418
UNDP Evaluation Office. (2002). Civic Engagement, Essentials No. 8.
United Nations. (2010). E-Government Survey 2010 Leveraging e-government at a time of
financial and economic crisis. New York, New York, USA.
United Nations. (2012). E-Government Survey 2012 E-government for the People.
United Nations. (2014). E-government survey 2014 E-government for the future we want. New
York, New York, USA.

157 | P a g e
United Nations. (2016). E-government survey 2016 E-government in support of sustainable
development. New York, New York, USA.
United Nations. (2018). E-Government Survey 2018 Gearing e-government to support
transformation towards sustainable and resililent societies. New York.
van der Meer, T., & Hakhverdian, A. (2017). Political trust as the evaluation of process and
performance: A cross-national study of 42 European countries. Political Studies, 65(1),
81–102. http://doi.org/10.1177/0032321715607514
van Deursen, A. J. A. M., & van Dijk, J. A. G. M. (2009). Improving digital skills for the use of
online public information and services. Government Information Quarterly, 26(2), 333–
340. http://doi.org/10.1016/j.giq.2008.11.002
Van Dijk, J. A. G. ., Peters, O., & Ebbers, W. (2008). Explaining the acceptance and use of
government internet services: A multivariate analysis of 2006 survey data in the
Netherlands. Government Information Quarterly, 25(3), 379–399.
http://doi.org/10.1016/j.giq.2007.09.006
Van Rhee, H. J., Suurmond, R., & Hak, T. (2015). User manual for meta-essentials: Workbooks
for meta-analysis. Rotterdam, The Netherlands: Erasmus Research Institute of
Management. Retrieved from www.erim.eur.nl/research-support/meta-essentials
Van Ryzin, G. G. (2005). Testing the expectancy disconfirmation model of citizen satisfaction
with local government. Journal of Public Administration Research and Theory, 16(4), 599–
611. http://doi.org/10.1093/jopart/mui058
Van Ryzin, G. G. (2007). Pieces of a puzzle: Linking government performance, citizen
satisfaction, and trust. Public Performance & Management Review, 30(4), 521–535.
http://doi.org/10.2753/PMR1530-9576300403
Van Ryzin, G. G. (2013). An experimental test of the expectancy-disconfirmation theory of
citizen satisfaction. Journal of Policy Analysis and Management, 32(3), 597–614.
http://doi.org/10.1002/pam.21702
van Zomeren, M., Postmes, T., & Spears, R. (2008). Toward an integrative social identity model
of collective action: A quantitative research synthesis of three socio-psychological
perspectives. Psychological Bulletin, 134(4), 504–535. http://doi.org/10.1037/0033-
2909.134.4.504
158 | P a g e
Veeramootoo, N., Nunkoo, R., & Dwivedi, Y. K. (2018). What determines success of an e-
government service? Validation of an integrative model of e-filing continuance usage.
Government Information Quarterly, 35(2), 161–174.
http://doi.org/10.1016/j.giq.2018.03.004
Venkatesh, V., Brown, S. A., Maruping, L. M., & Bala, H. (2008). Predicting different
conceptualizations of system use: The competing roles of behavioral intention, facilitating
conditions, and behavioral expectation. MIS Quarterly, 32(3), 483–502.
Venkatesh, V., Morris, M. G., & Ackerman, P. L. (2000). A Longitudinal field investigation of
gender differences in individual technology adoption decision-making processes.
Organizational Behavior and Human Decision Processes, 83(1), 33–60.
http://doi.org/10.1006/obhd.2000.2896
Venkatesh, V., Morris, M. G., Davis, G. B., & Davis, F. D. (2003). User acceptance of information
technology: Toward a unified view. MIS Quarterly, 27(3), 425–478.
http://doi.org/10.2307/30036540
Venkatesh, V., Thong, J., & Xu, X. (2012). Consumer acceptance and use of information
technology: Extending the unified theory of acceptance and use of technology. MIS
Quarterly, 36(1), 157–178.
Venkatesh, V., Thong, J. Y. L., Chan, F. K. Y., Hu, P. J.-H., & Brown, S. A. (2011). Extending the
two-stage information systems continuance model: incorporating UTAUT predictors and
the role of context. Information Systems Journal, 21(6), 527–555.
http://doi.org/10.1111/j.1365-2575.2011.00373.x
Venkatesh, V., Thong, J. Y. L., Chan, F. K. Y., & Hu, P. J. H. (2016). Managing citizens’ uncertainty
in e-government services: The mediating and moderating roles of transparency and trust.
Information Systems Research, 27(1), 87–111. http://doi.org/10.1287/isre.2015.0612
Verplanken, B. (2006). Beyond frequency: Habit as mental construct. British Journal of Social
Psychology, 45(3), 639–656. http://doi.org/10.1348/014466605X49122
Vicente, M. R., & Novo, A. (2014). An empirical analysis of e-participation. The role of social
networks and e-government over citizens’ online engagement. Government Information
Quarterly, 31(3), 379–387. http://doi.org/10.1016/j.giq.2013.12.006
Vlachos, P. A., Tsamakos, A., Vrechopoulos, A. P., & Avramidis, P. K. (2009). Corporate social
responsibility: Attributions, loyalty, and the mediating role of trust. Journal of the
159 | P a g e
Academy of Marketing Science, 37(2), 170–180. http://doi.org/10.1007/s11747-008-
0117-x
Vragov, R., & Kumar, N. (2013). The impact of information and communication technologies on
the costs of democracy. Electronic Commerce Research and Applications, 12(6), 440–448.
http://doi.org/10.1016/j.elerap.2013.06.003
Wang, H.-J., & Lo, J. (2012). Determinants of citizens’ intent to use government websites in
Taiwan. Information Development, 29(2), 123–137.
http://doi.org/10.1177/0266666912453835
Wang, M. C., & Bushman, B. J. (1998). Using the normal quantile plot to explore meta-analytic
data sets. Psychological Methods, 3(1), 46–54. http://doi.org/10.1037/1082-989X.3.1.46
Wang, Y.-S., & Shih, Y.-W. (2009). Why do people use information kiosks? A validation of the
unified theory of acceptance and use of technology. Government Information Quarterly,
26(1), 158–165. http://doi.org/10.1016/j.giq.2008.07.001
Wang, Y., & Liao, Y. (2008). Assessing eGovernment systems success: A validation of the
DeLone and McLean model of information systems success. Government Information
Quarterly, 25(4), 717–733. http://doi.org/10.1016/j.giq.2007.06.002
Wangpipatwong, S., Chutimaskul, W., & Papasratorn, B. (2008). Understanding citizen’s
continuance intention to use e-government website: A composite view of technology
acceptance model and computer self-efficacy. The Electronic Journal of E-Government,
6(1), 55–64.
Webster, J., & Watson, R. T. (2002). Analyzing the past to prepare for the future: Writing a
review. MIS Quarterly, 26(2), xiii–xxiii.
Welch, E. W. (2012). The rise of participative technologies in government. In Transformational
government through eGov practice: Socio-economic, cultural, and technological issues
(pp. 347–367). Bingley, United Kingdom: Emerald Group Publishing Limited.
Welch, E. W., Hinnant, C. C., & Moon, M. J. (2005). Linking Citizen Satisfaction with E-
Government and Trust in Government. Journal of Public Administration Research and
Theory, 15(3), 371–391. http://doi.org/10.1093/jopart/mui021
Westlund, H., & Adam, F. (2010). Social Capital and Economic Performance: A Meta-analysis of
65 Studies. European Planning Studies, 18(6), 893–919.

160 | P a g e
http://doi.org/10.1080/09654311003701431
Westlund, H., Rutten, R., & Boekema, F. (2010). Social Capital, Distance, Borders and Levels of
Space: Conclusions and Further Issues. European Planning Studies, 18(6), 965–970.
http://doi.org/10.1080/09654311003701506
White Baker, E., Al-Gahtani, S. S., & Geoffrey S. Hubona. (2007). The effects of gender and age
on new technology implementation in a developing country: Testing the theory of
planned behavior (TPB). Information Technology & People, 20(4), 352–375.
http://doi.org/10.1108/09593841111182250
Winkler, T. J., Hirsch, H., Trouvilliez, G., & Günther, O. (2012). Participatory urban sensing:
Citizens’ acceptance of a mobile reporting service. In European Conference on
Information Systems (p. 106).
Wood, J. A. (2007). Methodology for dealing with duplicate study effects in a meta-analysis.
Organizational Research Methods, 11(1), 79–95.
http://doi.org/10.1177/1094428106296638
Yang, X., Li, Y., Tan, C.-H., & Teo, H. H. (2007). Students’ participation intention in an online
discussion forum: Why is computer-mediated interaction attractive? Information &
Management, 44(5), 456–466. http://doi.org/10.1016/j.im.2007.04.003
Yao, Y., & Murphy, L. (2007). Remote electronic voting systems: An exploration of voters’
perceptions and intention to use. European Journal of Information Systems, 16(2), 106–
120. http://doi.org/10.1057/palgrave.ejis.3000672
Zhang, L., Zhu, J., & Liu, Q. (2012). A meta-analysis of mobile commerce adoption and the
moderating effect of culture. Computers in Human Behavior, 28(5), 1902–1911.
http://doi.org/10.1016/j.chb.2012.05.008
Zhang, X., & Venkatesh, V. (2017). A nomological network of knowledge management system
use: Antecedents and consequences. MIS Quarterly, 41(4), 1275–1306.
Zhao, L., Lu, Y., Wang, B., Chau, P. Y. K., & Zhang, L. (2012). Cultivating the sense of belonging
and motivating user participation in virtual communities: A social capital perspective.
International Journal of Information Management, 32(6), 574–588.
http://doi.org/10.1016/j.ijinfomgt.2012.02.006
Ziggers, G. W., & Henseler, J. (2016). The reinforcing effect of a firm’s customer orientation
161 | P a g e
and supply-base orientation on performance. Industrial Marketing Management, 52, 18–
26. http://doi.org/10.1016/j.indmarman.2015.07.011
Zimmerman, M. A. (1995). Psychological empowerment: issues and illustrations. American
Journal of Community Psychology, 23(5), 581–599. http://doi.org/10.1007/BF02506983
Zimmerman, M. A., & Rappaport, J. (1988). Citizen participation, perceived control, and
psychological empowerment. American Journal of Community Psychology, 16(5), 725–
750.
Zlatareva, M. (2008). Promoting Civic Engagement in a Post- Totalitarian and EU Accession
Context : A Case from Bulgaria. United Nations Development Program Oslo Governance
Centre The Democratic Governance Fellowship Program.
Zuiderwijk, A., Janssen, M., & Dwivedi, Y. K. (2015). Acceptance and use predictors of open
data technologies: Drawing upon the unified theory of acceptance and use of technology.
Government Information Quarterly, 32(4), 429–440.
http://doi.org/10.1016/j.giq.2015.09.005

162 | P a g e
Appendix
Appendix 2.1. Merging variables
Study Original Variable Name
Merged/Modified
Variable Name
(Van Dijk et al., 2008) Attitude towards use
Attitude (Chiang, 2009) Attitude towards using e-voting system
(Lin et al., 2011) Attitude Towards Using
(Oni et al., 2017) Attitude towards e-democracy
(Wangpipatwong et al., 2008) Continuance Intention Intention to continue
using (Tan et al., 2008) Continuance usage intentions
(Piehler et al., 2016) Continuance Intention
(Yang et al., 2007) Intention towards Participation Intention to participate
(Yao & Murphy, 2007) Participation Intention
(Tang et al., 2009) Intention of usage
Intention to use
(Persaud & Persaud, 2013) Usage intentions e-government
(Alrashedi et al., 2015) e-Participation Intention
(Choi & Kim, 2012) User Intention
(Lee et al., 2003) Intention to use online function
(Wang & Shih, 2009)
Behavioural Intention
(Kollmann & Kayser, 2010)
(Shyu & Huang, 2011)
(Al-Sobhi et al., 2011)
(Zuiderwijk et al., 2015)
(Rana & Dwivedi, 2015)
(Lin et al., 2011) Behaviour Intention
(Rehman et al., 2012)
Intention to adopt
(Rabaa’i, 2015)
(Seo & Bernsen, 2016)
(Oni et al., 2017) Perceived e-democracy outcome Perceived outcome
(Yao & Murphy, 2007)
Ease of use Perceived ease of use
(Chiang, 2009)
(Rokhman, 2011)
(Choi & Kim, 2012)
(Al-Quraan & Abu-Shanab, 2015)
(F. Lin et al., 2011) Information System Quality *
Perceived quality
(Wang & Liao, 2008) System Quality *
(Teo et al., 2009)
(Cai Shuqin et al., 2016) Quality of E-services *
(Alshehri et al., 2012) Website Quality *
(Choi & Kim, 2012) Usefulness
Perceived usefulness
(Lee et al., 2003)
Perceived Usefulness of e-Government
services
(Mou et al., 2013) Political Internal efficacy Political efficacy
(Wang & Liao, 2008) User Satisfaction
Satisfaction (Choi & Kim, 2012)
Satisfaction with e-participation
applications
(Cai Shuqin et al., 2016) Citizen´s Satisfaction
(Teo et al., 2009) User Satisfaction
(Colesca & Dobrica, 2008) Perceived Trust Trust
(Alharbi et al., 2015) Trust in E-Participation
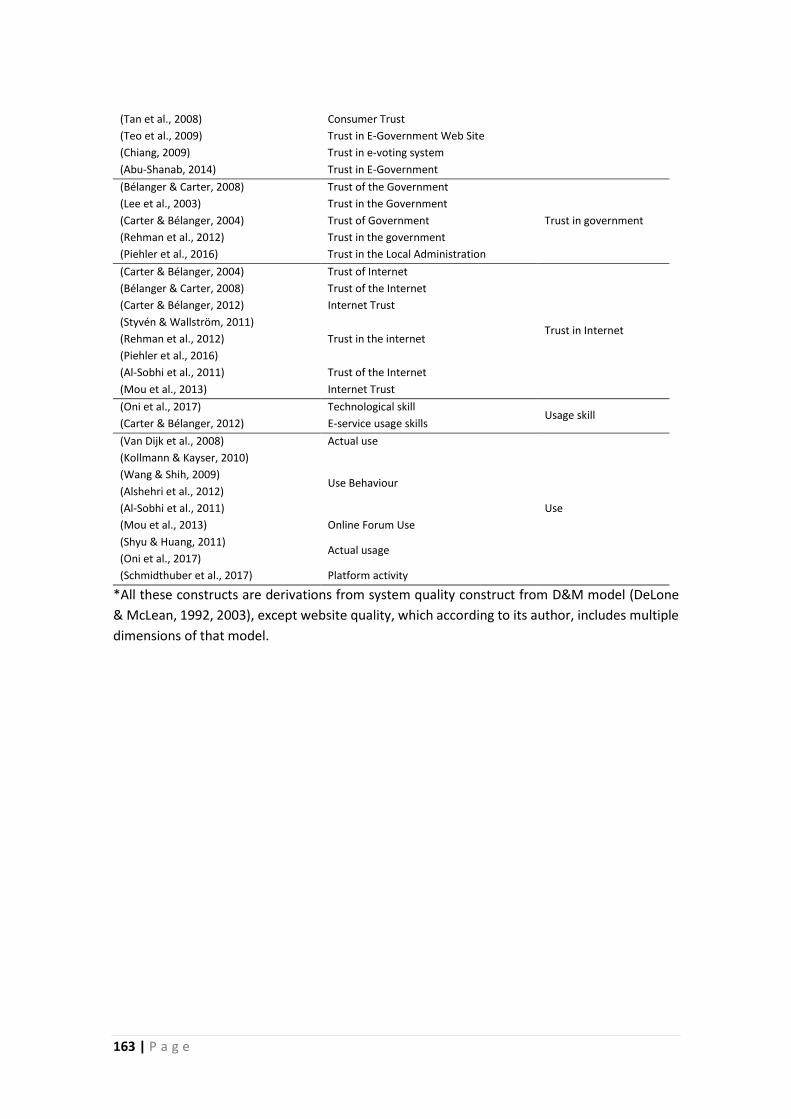
163 | P a g e
(Tan et al., 2008) Consumer Trust
(Teo et al., 2009) Trust in E-Government Web Site
(Chiang, 2009) Trust in e-voting system
(Abu-Shanab, 2014) Trust in E-Government
(Bélanger & Carter, 2008) Trust of the Government
Trust in government
(Lee et al., 2003) Trust in the Government
(Carter & Bélanger, 2004) Trust of Government
(Rehman et al., 2012) Trust in the government
(Piehler et al., 2016) Trust in the Local Administration
(Carter & Bélanger, 2004) Trust of Internet
Trust in Internet
(Bélanger & Carter, 2008) Trust of the Internet
(Carter & Bélanger, 2012) Internet Trust
(Styvén & Wallström, 2011)
Trust in the internet (Rehman et al., 2012)
(Piehler et al., 2016)
(Al-Sobhi et al., 2011) Trust of the Internet
(Mou et al., 2013) Internet Trust
(Oni et al., 2017) Technological skill Usage skill
(Carter & Bélanger, 2012) E-service usage skills
(Van Dijk et al., 2008) Actual use
Use
(Kollmann & Kayser, 2010)
Use Behaviour (Wang & Shih, 2009)
(Alshehri et al., 2012)
(Al-Sobhi et al., 2011)
(Mou et al., 2013) Online Forum Use
(Shyu & Huang, 2011) Actual usage
(Oni et al., 2017)
(Schmidthuber et al., 2017) Platform activity
*All these constructs are derivations from system quality construct from D&M model (DeLone
& McLean, 1992, 2003), except website quality, which according to its author, includes multiple
dimensions of that model.
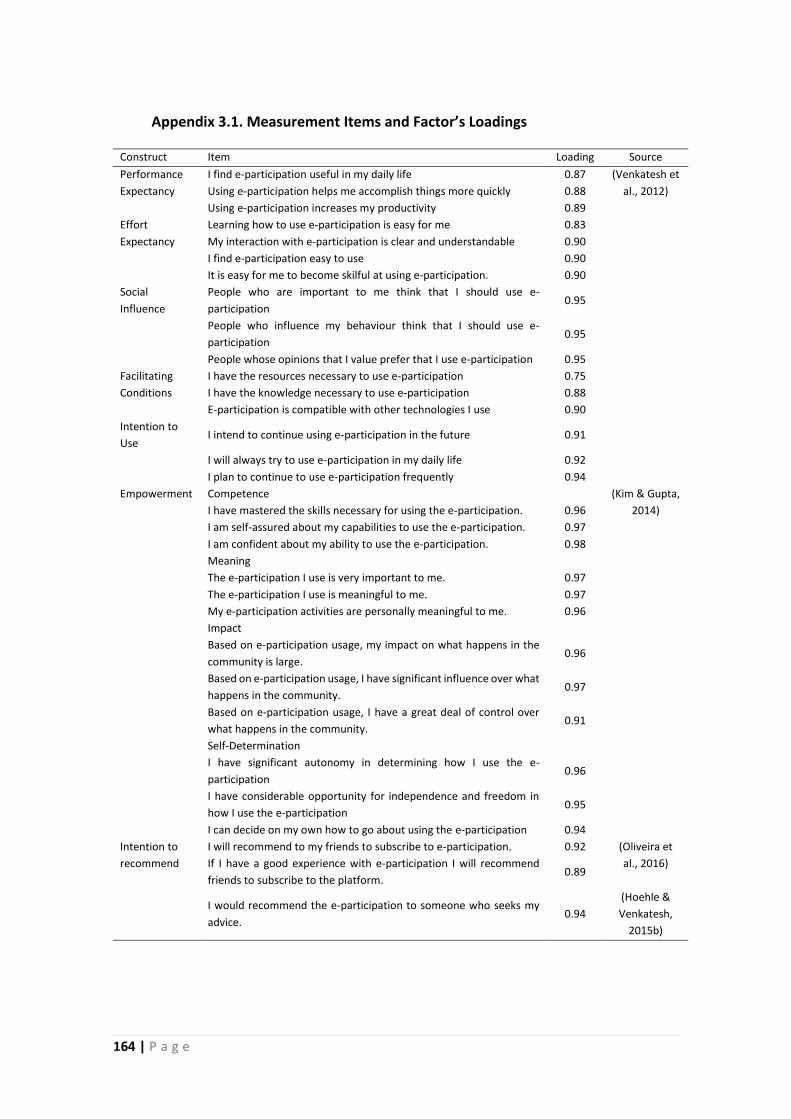
164 | P a g e
Appendix 3.1. Measurement Items and Factor’s Loadings
Construct Item Loading Source
Performance
Expectancy
I find e-participation useful in my daily life 0.87 (Venkatesh et
al., 2012) Using e-participation helps me accomplish things more quickly 0.88
Using e-participation increases my productivity 0.89
Effort
Expectancy
Learning how to use e-participation is easy for me 0.83
My interaction with e-participation is clear and understandable 0.90
I find e-participation easy to use 0.90
It is easy for me to become skilful at using e-participation. 0.90
Social
Influence
People who are important to me think that I should use e-
participation 0.95
People who influence my behaviour think that I should use e-
participation 0.95
People whose opinions that I value prefer that I use e-participation 0.95
Facilitating
Conditions
I have the resources necessary to use e-participation 0.75
I have the knowledge necessary to use e-participation 0.88
E-participation is compatible with other technologies I use 0.90
Intention to
Use I intend to continue using e-participation in the future 0.91
I will always try to use e-participation in my daily life 0.92
I plan to continue to use e-participation frequently 0.94
Empowerment Competence (Kim & Gupta,
2014) I have mastered the skills necessary for using the e-participation. 0.96
I am self-assured about my capabilities to use the e-participation. 0.97
I am confident about my ability to use the e-participation. 0.98
Meaning
The e-participation I use is very important to me. 0.97
The e-participation I use is meaningful to me. 0.97
My e-participation activities are personally meaningful to me. 0.96
Impact
Based on e-participation usage, my impact on what happens in the
community is large. 0.96
Based on e-participation usage, I have significant influence over what
happens in the community. 0.97
Based on e-participation usage, I have a great deal of control over
what happens in the community. 0.91
Self-Determination
I have significant autonomy in determining how I use the e-
participation 0.96
I have considerable opportunity for independence and freedom in
how I use the e-participation 0.95
I can decide on my own how to go about using the e-participation 0.94
Intention to
recommend
I will recommend to my friends to subscribe to e-participation. 0.92 (Oliveira et
al., 2016) If I have a good experience with e-participation I will recommend
friends to subscribe to the platform. 0.89
I would recommend the e-participation to someone who seeks my
advice. 0.94
(Hoehle &
Venkatesh,
2015b)
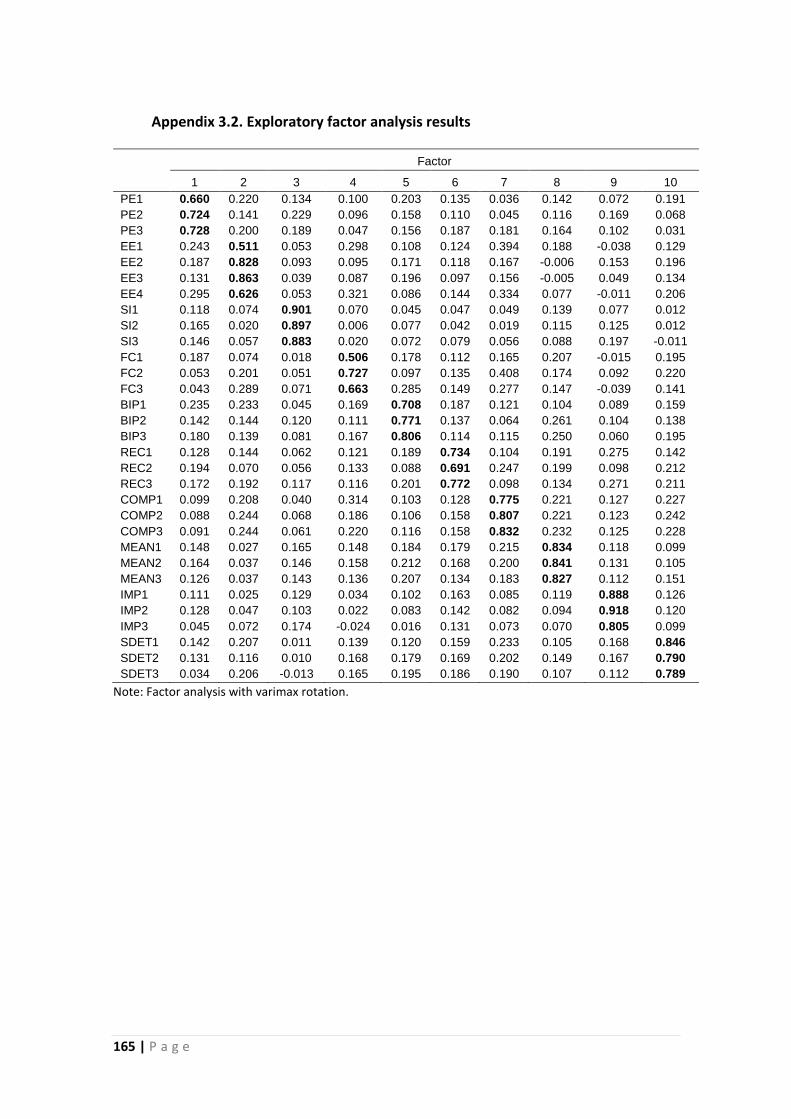
165 | P a g e
Appendix 3.2. Exploratory factor analysis results
Factor
1 2 3 4 5 6 7 8 9 10
PE1 0.660 0.220 0.134 0.100 0.203 0.135 0.036 0.142 0.072 0.191
PE2 0.724 0.141 0.229 0.096 0.158 0.110 0.045 0.116 0.169 0.068
PE3 0.728 0.200 0.189 0.047 0.156 0.187 0.181 0.164 0.102 0.031
EE1 0.243 0.511 0.053 0.298 0.108 0.124 0.394 0.188 -0.038 0.129
EE2 0.187 0.828 0.093 0.095 0.171 0.118 0.167 -0.006 0.153 0.196
EE3 0.131 0.863 0.039 0.087 0.196 0.097 0.156 -0.005 0.049 0.134
EE4 0.295 0.626 0.053 0.321 0.086 0.144 0.334 0.077 -0.011 0.206
SI1 0.118 0.074 0.901 0.070 0.045 0.047 0.049 0.139 0.077 0.012
SI2 0.165 0.020 0.897 0.006 0.077 0.042 0.019 0.115 0.125 0.012
SI3 0.146 0.057 0.883 0.020 0.072 0.079 0.056 0.088 0.197 -0.011
FC1 0.187 0.074 0.018 0.506 0.178 0.112 0.165 0.207 -0.015 0.195
FC2 0.053 0.201 0.051 0.727 0.097 0.135 0.408 0.174 0.092 0.220
FC3 0.043 0.289 0.071 0.663 0.285 0.149 0.277 0.147 -0.039 0.141
BIP1 0.235 0.233 0.045 0.169 0.708 0.187 0.121 0.104 0.089 0.159
BIP2 0.142 0.144 0.120 0.111 0.771 0.137 0.064 0.261 0.104 0.138
BIP3 0.180 0.139 0.081 0.167 0.806 0.114 0.115 0.250 0.060 0.195
REC1 0.128 0.144 0.062 0.121 0.189 0.734 0.104 0.191 0.275 0.142
REC2 0.194 0.070 0.056 0.133 0.088 0.691 0.247 0.199 0.098 0.212
REC3 0.172 0.192 0.117 0.116 0.201 0.772 0.098 0.134 0.271 0.211
COMP1 0.099 0.208 0.040 0.314 0.103 0.128 0.775 0.221 0.127 0.227
COMP2 0.088 0.244 0.068 0.186 0.106 0.158 0.807 0.221 0.123 0.242
COMP3 0.091 0.244 0.061 0.220 0.116 0.158 0.832 0.232 0.125 0.228
MEAN1 0.148 0.027 0.165 0.148 0.184 0.179 0.215 0.834 0.118 0.099
MEAN2 0.164 0.037 0.146 0.158 0.212 0.168 0.200 0.841 0.131 0.105
MEAN3 0.126 0.037 0.143 0.136 0.207 0.134 0.183 0.827 0.112 0.151
IMP1 0.111 0.025 0.129 0.034 0.102 0.163 0.085 0.119 0.888 0.126
IMP2 0.128 0.047 0.103 0.022 0.083 0.142 0.082 0.094 0.918 0.120
IMP3 0.045 0.072 0.174 -0.024 0.016 0.131 0.073 0.070 0.805 0.099
SDET1 0.142 0.207 0.011 0.139 0.120 0.159 0.233 0.105 0.168 0.846
SDET2 0.131 0.116 0.010 0.168 0.179 0.169 0.202 0.149 0.167 0.790
SDET3 0.034 0.206 -0.013 0.165 0.195 0.186 0.190 0.107 0.112 0.789
Note: Factor analysis with varimax rotation.
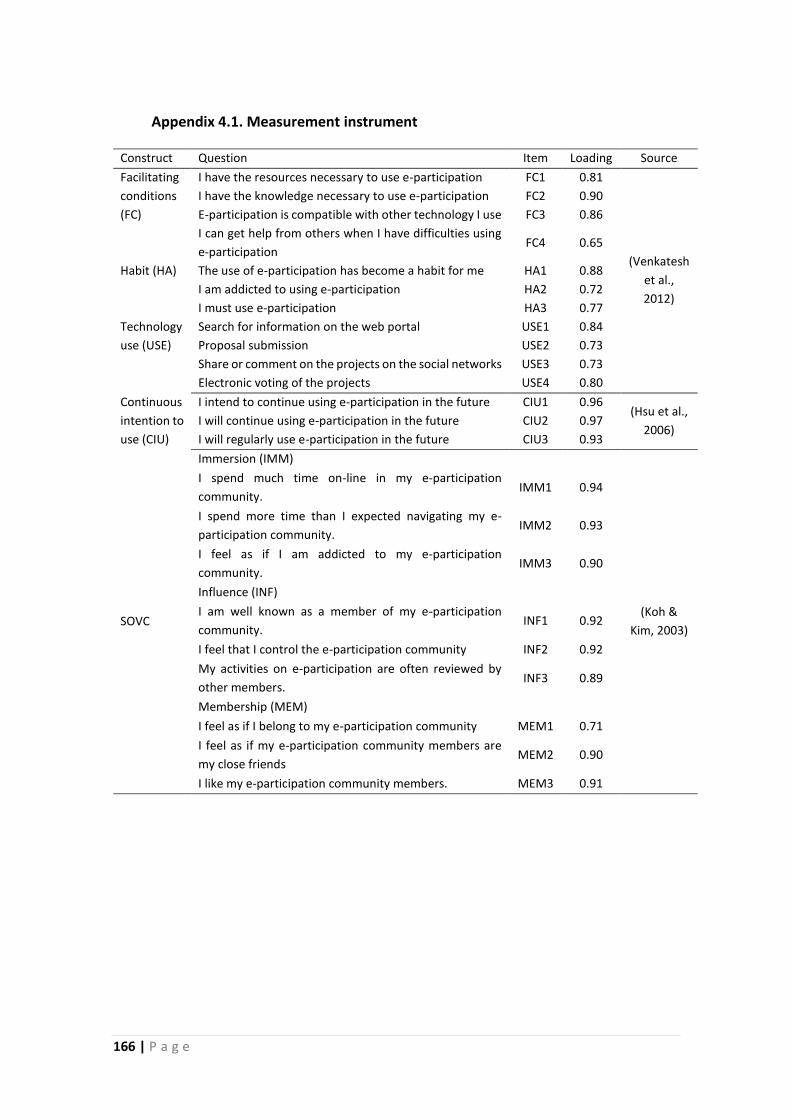
166 | P a g e
Appendix 4.1. Measurement instrument
Construct Question Item Loading Source
Facilitating
conditions
(FC)
I have the resources necessary to use e-participation FC1 0.81
(Venkatesh
et al.,
2012)
I have the knowledge necessary to use e-participation FC2 0.90
E-participation is compatible with other technology I use FC3 0.86
I can get help from others when I have difficulties using
e-participation FC4 0.65
Habit (HA) The use of e-participation has become a habit for me HA1 0.88
I am addicted to using e-participation HA2 0.72
I must use e-participation HA3 0.77
Technology
use (USE)
Search for information on the web portal USE1 0.84
Proposal submission USE2 0.73
Share or comment on the projects on the social networks USE3 0.73
Electronic voting of the projects USE4 0.80
Continuous
intention to
use (CIU)
I intend to continue using e-participation in the future CIU1 0.96 (Hsu et al.,
2006) I will continue using e-participation in the future CIU2 0.97
I will regularly use e-participation in the future CIU3 0.93
SOVC
Immersion (IMM)
(Koh &
Kim, 2003)
I spend much time on-line in my e-participation
community. IMM1 0.94
I spend more time than I expected navigating my e-
participation community. IMM2 0.93
I feel as if I am addicted to my e-participation
community. IMM3 0.90
Influence (INF)
I am well known as a member of my e-participation
community. INF1 0.92
I feel that I control the e-participation community INF2 0.92
My activities on e-participation are often reviewed by
other members. INF3 0.89
Membership (MEM)
I feel as if I belong to my e-participation community MEM1 0.71
I feel as if my e-participation community members are
my close friends MEM2 0.90
I like my e-participation community members. MEM3 0.91
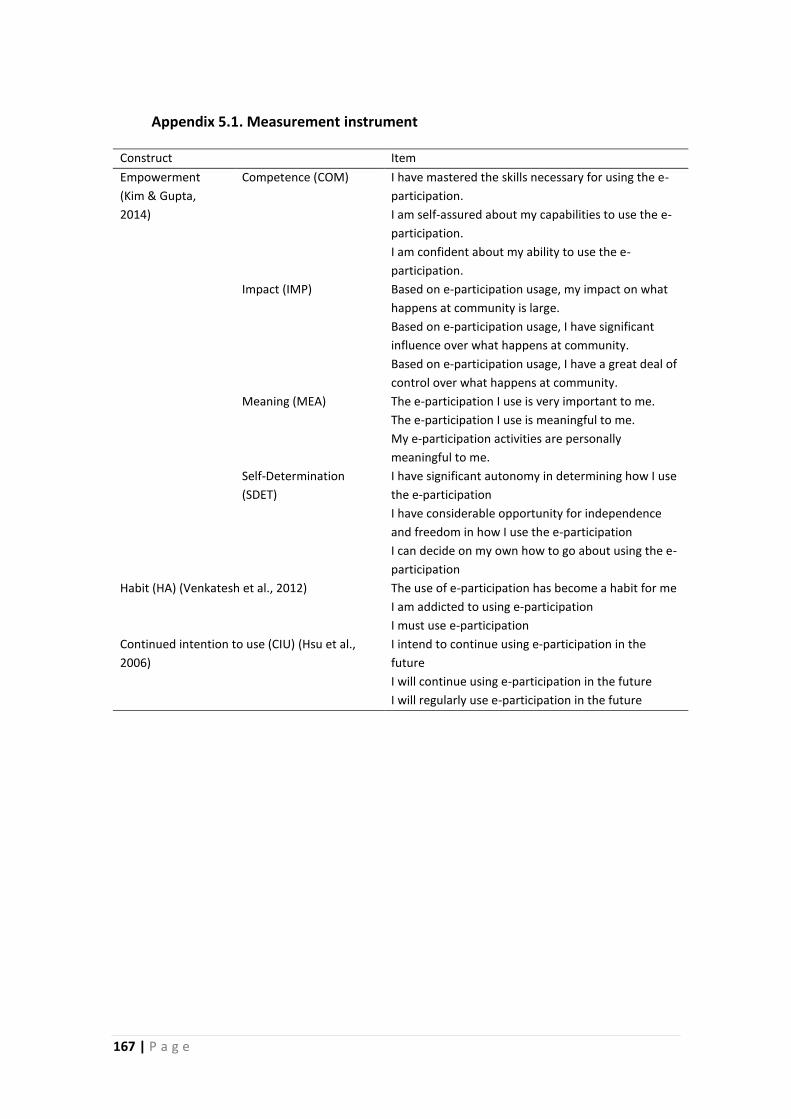
167 | P a g e
Appendix 5.1. Measurement instrument
Construct Item
Empowerment
(Kim & Gupta,
2014)
Competence (COM) I have mastered the skills necessary for using the e-
participation.
I am self-assured about my capabilities to use the e-
participation.
I am confident about my ability to use the e-
participation.
Impact (IMP) Based on e-participation usage, my impact on what
happens at community is large.
Based on e-participation usage, I have significant
influence over what happens at community.
Based on e-participation usage, I have a great deal of
control over what happens at community.
Meaning (MEA) The e-participation I use is very important to me.
The e-participation I use is meaningful to me.
My e-participation activities are personally
meaningful to me.
Self-Determination
(SDET)
I have significant autonomy in determining how I use
the e-participation
I have considerable opportunity for independence
and freedom in how I use the e-participation
I can decide on my own how to go about using the e-
participation
Habit (HA) (Venkatesh et al., 2012) The use of e-participation has become a habit for me
I am addicted to using e-participation
I must use e-participation
Continued intention to use (CIU) (Hsu et al.,
2006)
I intend to continue using e-participation in the
future
I will continue using e-participation in the future
I will regularly use e-participation in the future
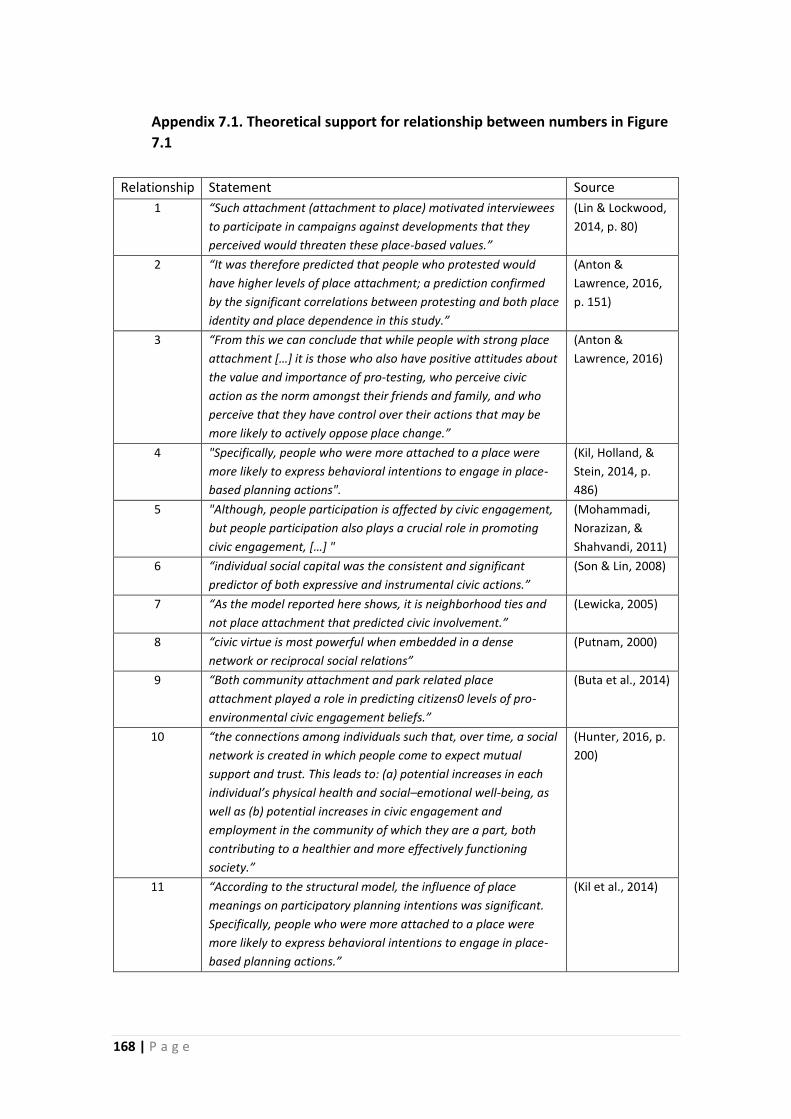
168 | P a g e
Appendix 7.1. Theoretical support for relationship between numbers in Figure
7.1
Relationship Statement Source
1 “Such attachment (attachment to place) motivated interviewees
to participate in campaigns against developments that they
perceived would threaten these place-based values.”
(Lin & Lockwood,
2014, p. 80)
2 “It was therefore predicted that people who protested would
have higher levels of place attachment; a prediction confirmed
by the significant correlations between protesting and both place
identity and place dependence in this study.”
(Anton &
Lawrence, 2016,
p. 151)
3 “From this we can conclude that while people with strong place
attachment […] it is those who also have positive attitudes about
the value and importance of pro-testing, who perceive civic
action as the norm amongst their friends and family, and who
perceive that they have control over their actions that may be
more likely to actively oppose place change.”
(Anton &
Lawrence, 2016)
4 "Specifically, people who were more attached to a place were
more likely to express behavioral intentions to engage in place-
based planning actions".
(Kil, Holland, &
Stein, 2014, p.
486)
5 "Although, people participation is affected by civic engagement,
but people participation also plays a crucial role in promoting
civic engagement, […] "
(Mohammadi,
Norazizan, &
Shahvandi, 2011)
6 “individual social capital was the consistent and significant
predictor of both expressive and instrumental civic actions.”
(Son & Lin, 2008)
7 “As the model reported here shows, it is neighborhood ties and
not place attachment that predicted civic involvement.”
(Lewicka, 2005)
8 “civic virtue is most powerful when embedded in a dense
network or reciprocal social relations”
(Putnam, 2000)
9 “Both community attachment and park related place
attachment played a role in predicting citizens0 levels of pro-
environmental civic engagement beliefs.”
(Buta et al., 2014)
10 “the connections among individuals such that, over time, a social
network is created in which people come to expect mutual
support and trust. This leads to: (a) potential increases in each
individual’s physical health and social–emotional well-being, as
well as (b) potential increases in civic engagement and
employment in the community of which they are a part, both
contributing to a healthier and more effectively functioning
society.”
(Hunter, 2016, p.
200)
11 “According to the structural model, the influence of place
meanings on participatory planning intentions was significant.
Specifically, people who were more attached to a place were
more likely to express behavioral intentions to engage in place-
based planning actions.”
(Kil et al., 2014)
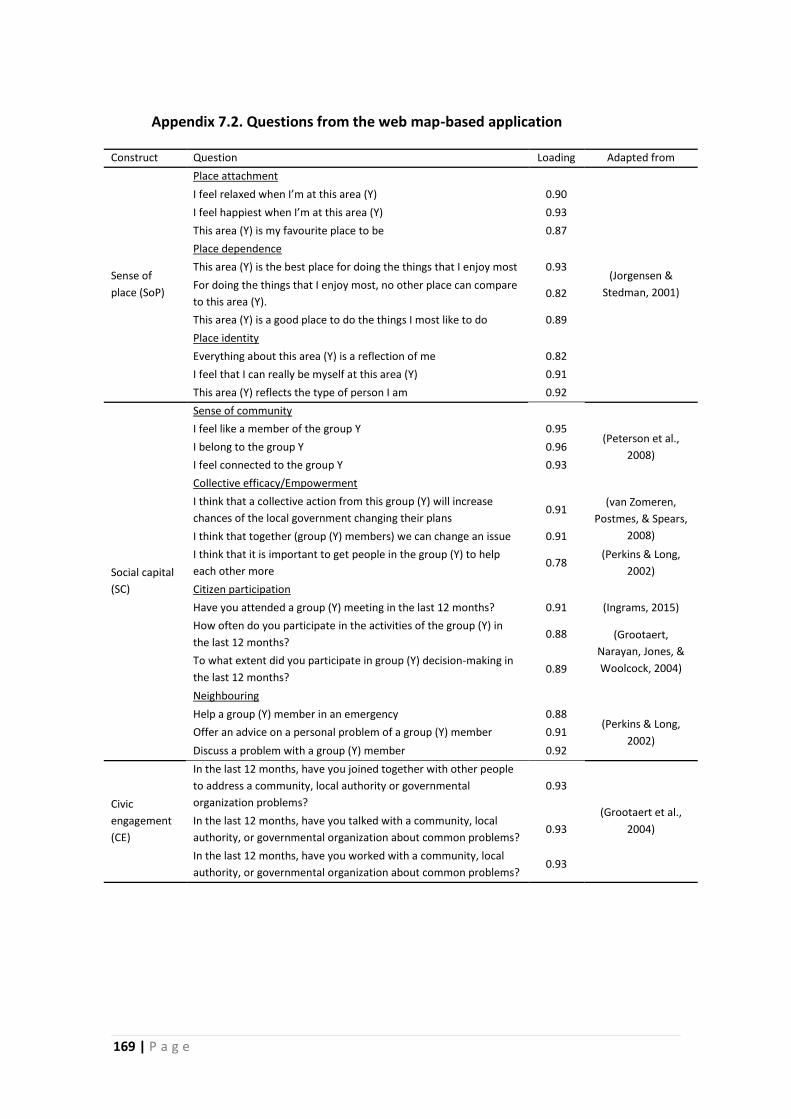
169 | P a g e
Appendix 7.2. Questions from the web map-based application
Construct Question Loading Adapted from
Sense of
place (SoP)
Place attachment
(Jorgensen &
Stedman, 2001)
I feel relaxed when I’m at this area (Y) 0.90
I feel happiest when I’m at this area (Y) 0.93
This area (Y) is my favourite place to be 0.87
Place dependence
This area (Y) is the best place for doing the things that I enjoy most 0.93
For doing the things that I enjoy most, no other place can compare
to this area (Y). 0.82
This area (Y) is a good place to do the things I most like to do 0.89
Place identity
Everything about this area (Y) is a reflection of me 0.82
I feel that I can really be myself at this area (Y) 0.91
This area (Y) reflects the type of person I am 0.92
Social capital
(SC)
Sense of community
I feel like a member of the group Y 0.95 (Peterson et al.,
2008) I belong to the group Y 0.96
I feel connected to the group Y 0.93
Collective efficacy/Empowerment
I think that a collective action from this group (Y) will increase
chances of the local government changing their plans 0.91
(van Zomeren,
Postmes, & Spears,
2008) I think that together (group (Y) members) we can change an issue 0.91
I think that it is important to get people in the group (Y) to help
each other more 0.78
(Perkins & Long,
2002)
Citizen participation
Have you attended a group (Y) meeting in the last 12 months? 0.91 (Ingrams, 2015)
How often do you participate in the activities of the group (Y) in
the last 12 months? 0.88 (Grootaert,
Narayan, Jones, &
Woolcock, 2004) To what extent did you participate in group (Y) decision-making in
the last 12 months? 0.89
Neighbouring
Help a group (Y) member in an emergency 0.88 (Perkins & Long,
2002) Offer an advice on a personal problem of a group (Y) member 0.91
Discuss a problem with a group (Y) member 0.92
Civic
engagement
(CE)
In the last 12 months, have you joined together with other people
to address a community, local authority or governmental
organization problems?
0.93
(Grootaert et al.,
2004) In the last 12 months, have you talked with a community, local
authority, or governmental organization about common problems? 0.93
In the last 12 months, have you worked with a community, local
authority, or governmental organization about common problems? 0.93

1 | P a g e

Book Spine
Determinants of information and communication technologies for the
online citizen participation adoption in urban contexts Mijail Naranjo Zolotov
PhD
Au
gu
st
2018