information and communications technology (ict) and trade
TRANSCRIPT

1
Information and Communications Technology
(ICT) and Trade in Emerging Market Economies
Lirong Liu* Hiranya K. Nath*,†
(February 2013)
Abstract: This paper examines the effects of information and communications technology (ICT) on international trade in emerging markets. Using panel data for 40 emerging market economies (EMEs) for a period from 1995 to 2010, we estimate fixed effects models of exports and imports with ICT as the main explanatory variable of interest. Our ICT variables include the growth of telecom investment, international Internet bandwidth, Internet subscriptions per 100 people, and the number of Internet hosts per 100 people. The first two variables represent ICT infrastructure while the last two represent the use of ICT. We use the share of total exports and of total imports in GDP as the dependent variables. Additionally, we consider the GDP share of exports and imports for goods and services separately. The main control variables are: per capita GDP growth, population growth, and country and year fixed effects. The empirical results overwhelmingly suggest that Internet subscriptions and Internet hosts have significant positive impacts on both export and import shares in EMEs. Thus, the trade enhancing effect of ICT does not depend on ICT infrastructure or ICT capability per se but on its use. This result is robust to a number of sensitivity checks: generalized method of moments (GMM) estimation with lagged independent variables as instruments; inclusion of all four ICT variables together; shorter sample period; a subsample of EMEs; dynamic specification with lagged dependent variable; and an alternative model specification with additional variables. These results suggest that policies to encourage the use of ICT would have a positive impact on trade in EMEs.
Keywords: Information and Communication Technology (ICT); Emerging Market
Economy (EME); Exports; Imports; Telecom investment; Internet bandwidth;
Internet subscriptions; Internet hosts
JEL Classification: F12; F14; F15
* Department of Economics and International Business, Sam Houston State University, Huntsville, TX 77341-2118 † Corresponding author: [email protected]
2
1. Introduction
Information and communications technology (ICT) has pervasive effects at micro as well as macro
level of an economy. Some macro-level studies (e.g., Jorgenson 2001; Stiroh 2002) show that ICT
advances in the 1990s raised productivity and contributed to growth. The use of ICT has been
shown to have important implications for employment and wage as well. Several studies (e.g. Autor
et al. 1998; Autor et al. 2003; Acemoglu and Autor 2010) argue that ICT has increased the demand
for skilled workers and has been largely responsible for growing wage gap between skilled and
unskilled workers. Although there are a few exceptions, most of these studies focus on the U.S. and
other developed countries.1
This paper examines the effects of ICT on exports and imports in emerging market economies
(EMEs). There are several intuitively plausible mechanisms through which ICT may affect the flows
of international trade. First, the use of ICT may reduce the fixed entry cost into a market and thus
stimulates exports. As Freund and Weinhold (2004) discuss, these fixed costs include the costs of
finding out information about the market (search cost), advertising, and establishing a distribution
network. Second, international transactions often require advance planning that involves handling
uncertainty. Some of these uncertainties are associated with the delay in acquiring and transmitting
relevant information. The use of ICT reduces such delays and makes planning more efficient and
accurate. Consequently, the volume of trade between countries is expected to go up. Finally, ICT
may directly facilitate international trade in services, particularly information-intensive services. 2
These services involve creating, processing, and communicating information. As ICT advances
lower the costs of these processes, information-intensive services can be produced and delivered
anywhere in the world. Furthermore, ICT facilitates global disaggregation of the production process
for information-intensive services and thereby increases trade in those services.3 This paper is not
intended to examine any particular mechanism because more than one mechanism may be at work
simultaneously and it is extremely challenging to separate out their effects empirically, particularly
when we examine cross-country experiences. Thus, we investigate the overall impact of ICT that
may affect trade through various mechanisms.
There have been a few studies that examine the effects of ICT on trade. For example, Freund
and Weinhold (2002) investigate how the Internet affects international trade in services. They
consider U.S. exports and imports of 14 service items to and from 31 countries between 1995 and
1999 and find that Internet development in those countries has significant positive impact on
bilateral trade with the U.S. They further extend this analysis to cover merchandise trade and to
1 Haacker (2010) examines the effects of ICT equipment investment on growth for low and lower middle income countries. In a recent paper, Dimelis and Papaioannou (2011) investigate the effects of ICT on aggregate technical efficiency for a group of 42 countries that include both developed and developing countries. 2 Examples of such services include various customer services, education, medical transcriptions, tax returns, web design etc. 3 See Apte and Mason (1995) and Mithas and Whitaker (2007) for a discussion on global disaggregation of information-intensive services.

3
include 56 countries in a subsequent study (Freund and Weinhold 2004). In this article, they also
include a theoretical model to explain how the Internet potentially affects trade. Fink et al (2005)
find evidence of significant influence of communication costs on bilateral trade in the data for 107
countries in 1999. Using data for 98 countries, Clarke and Wallsten (2006) further show that access
to the Internet improves export performance in developing countries and they export more to
developed countries. Vemuri and Siddiqi (2009) analyze panel data for 64 countries for a period
between 1985 and 2005 and conclude that ICT infrastructure and the availability of Internet for
commercial transactions have a positive and significant impact on the volume of international trade.
Using data for 175 countries, Demirkan et al (2009) also find evidence of bilateral trade enhancing
effect of ICT use. Choi (2010) provides further evidence of Internet usage raising services trade for
151 countries for a period from 1990 to 2006. More recently, Mattes et al (2012) examine the effects
of availability and use of ICT on trade using data from the European Union (EU) countries.
Although they do not find any significant impact of ICT on EU trade, their results suggest that trade
is enhanced if both trading partners are advanced users of ICT.4
In contrast to the existing studies, we focus on 40 emerging market economies (EMEs) during
the period between1995 and 2010. These countries have witnessed substantial increases in trade and
ICT adoption during this period and any evidence of a significant relationship between these two
phenomena will have important policy implications. Most previous studies (Freund and Weinhold
2002 & 2004; Clarke and Wallsten 2006; Choi 2010) use the number of Internet hosts as the main
independent variable of interest whereas we use four alternative variables that capture different
aspects of ICT with the potential impacts on trade. Furthermore, we estimate the export and import
models separately for goods and services. Finally, like Choi (2010), we use total exports and total
imports for each country instead of bilateral trade between two countries as used in most previous
studies.5
Thus, we estimate fixed effects models of exports and imports to examine the effects of ICT on
trade. Our ICT variables include growth of telecom investment, international Internet bandwidth,
Internet subscriptions per 100 people, and the number of Internet hosts per 100 people. We use the
percentage share of total exports and of total imports in GDP as the dependent variables.
Additionally, we consider the GDP share of exports and imports for goods and services separately.
The main control variables are: GDP per capita growth, population growth, and country and year
fixed effects. The empirical results overwhelmingly suggest that Internet subscriptions and Internet
hosts have significant positive impacts on export as well as import shares in EMEs. This result is
robust to a number of alternative specifications.
The rest of the paper is organized as follows. Section 2 includes a detailed discussion of the data
and methodology used for the empirical analysis presented in this study. In section 3, we present and
4 Fleming et al. (2009) and Thiemann et al (2012) examine the effects of ICT, particularly use of mobile phone and fixed telephone, on trade in flowers and trade in fruits and vegetables respectively. 5 The advantage of using bilateral trade data is that the empirical analysis can be based on the gravity model framework that provides a clear theoretical foundation. It also allows to control for a wider range of unobserved heterogeneity.
4
discuss the empirical results for our baseline model. Section 4 presents the sensitivity analysis results.
In the last section, we summarize and include a few concluding remarks.
2. Data and Methodology
2.1 Data
We compile a list of 40 EMEs from five different sources: the FTSE Group, Morgan Stanley Capital
International (MSCI), Standard and Poor (S&P), Dow Jones (DJ), and Banco Bilbao Vizcaya
Argentaria (BBVA) Research. We exclude a few countries that have been identified as EMEs by one
or more of these agencies, primarily due to a lack of relevant data for those countries. Table 1 lists
the countries in our sample and, for each country, indicates which agency (agencies) has (have)
identified it as an EME in its (their) latest report (reports). Note that 19 countries have been listed as
EMEs by each of these five agencies.6
[Insert Table 1]
For our empirical analysis, the main sources of data are the World Development Indicators
(WDI) and the Global Development Finance (GDF), compiled and published by the World Bank,
and the World Telecommunication ICT Indicator database compiled and maintained by the
International Telecommunication Union (ITU). Annual data on total exports (of goods and services
together) and total imports are available in both current prices and 2000 USD constant prices from
WDI. However, exports and imports data on goods and services separately are available only in
current USD prices. In order to convert the current price export and import values for goods and
services into constant prices, we first calculate an export deflator and an import deflator from
current and constant price total exports and imports data mentioned above. We then apply the
export deflator to both goods and services exports and import deflator to both goods and services
imports.7 Our sample covers a period from 1995 to 2010. Although the choice is primarily dictated
by the earliest and the latest year for which data on some of the ICT variables are available, this is
also the period that witnessed significant expansion of trade and the use of ICT in most EMEs.
It is almost impossible to find a single measure of ICT that reflects all different aspects of this
general-purpose technology. 8 , 9 Previous studies use the number of Internet hosts (Freund and
6 South Korea (Republic of Korea) has been listed as an EME by three of these five agencies. The FTSE group and S&P do not list it as an EME. By most measures, South Korea is at a much advanced stage of development. 7 A common deflator for both goods and services exports (imports) may lead to overestimation or underestimation of the real values due to a potential change in relative prices between goods and services. However, it is not possible to apply separate deflators due to a lack of appropriate data. 8 Because of its broader application across different sectors, ICT is referred to as a general-purpose technology. For example, see Basu and Fernald (2007). 9 ITU now publishes data on a composite indicator called the ICT Development Index (IDI) that combines seven variables representing ICT readiness, ICT use, and ICT capability. As of now, the data are available for 2007, 2009, 2010, and 2011 only. Mattes et al (2012) use this index in their study. They construct data for
5
Weinhold 2002 & 2004; Clarke and Wallsten 2006; Choi 2010) or/and the number of telephone
lines, personal computers, and Internet users (Vemuri and Siddiqi 2009). We use four alternative
variables that capture different aspects of ICT and have potential impacts on the growth of exports
and imports. These ICT variables are: total annual investment in telecom, international Internet
bandwidth (Mega Bits per second), total fixed (wired) broadband Internet subscriptions per 100
people, and the number of Internet hosts per 100 people. While the first variable reflects the
building of ICT infrastructure, the second variable is a measure of technical capability for
international transmission of data and communications. In contrast, the third and fourth variables
indicate proliferation of ICT uses for obtaining and transmitting information. Broadly, we divide
these four variables into two categories: the first two are ICT infrastructure variables and the third
and fourth are ICT use variables. This classification is consistent with the framework for ITU’s ICT
development index. The availability of data on these variables varies across countries and over time.
For some countries, data are missing for several years. The data on the number of Internet hosts are
available only for six years between 1999 and 2004. The telecom investment data are available in
current USD. It is almost impossible to find data on prices of telecom capital goods by countries.
However, it may be noted that prices of most ICT capital equipment have declined worldwide over
last two decades. Therefore, it is not unreasonable to use the communications equipment price
indices for the U.S., obtained from the Bureau of Economic Analysis (BEA), as harmonized
deflators to construct constant USD data on telecom investment for all countries in our sample.10
Besides these variables of interest, we use a number of control variables that include per capita
GDP and population obtained from WDI. Although we include these two control variables in our
baseline model specification, we consider additional control variables in our sensitivity analysis. For
example, we obtain data on nominal exchange rates from Penn World Table 7 and convert them
into real exchange rates using the Consumer Price Index (CPI) data for the U. S. and the respective
countries. The CPI data are available from WDI. Data on GDP of the rest of the world (World
GDP – Home Country GDP), Foreign Direct Investment (FDI) net inflow in current USD, gross
fixed investment in both current and constant USD, and average tariff rates (in percentages) are
obtained from WDI and GDF. We use an investment deflator calculated from gross fixed
investment data to convert FDI net inflow from current USD into constant USD. Finally, annual
data on M2 money supply are obtained from GDF. Appendix Table A.1 includes a description of
the variables along with the period of availability and the source of the data.
[Insert Table 2]
The summary statistics of the dependent variables, the ICT variables, and the control variables
for the baseline specification are presented in Table 2. We use the percentage share of exports and
imports in GDP as the dependent variable in our empirical model specifications. 11 This table
indicates that there are wide variations in average GDP shares of exports and imports – both for
additional years using the underlying data for the EU countries. However, data on some of these variables are not uniformly available for the EMEs that we consider in the current study. 10 See Schreyer (2000) for a discussion on using a harmonized deflator. 11 Clarke and Wallsten (2006) use export share in GDP as the dependent variable.
6
goods and services – across the countries. Furthermore, the year-to-year volatility of export and
import shares also varies widely. Among the variables of interest, the growth rate of telecom
investment during the sample period, averaged across the 40 EMEs, is about 13 % and it varies
between a minimum of – 11 % in Argentina and a maximum of 67 % in Ukraine. The natural log of
bandwidth averages at 7.57 with a minimum of 3.64 for Mauritius and a maximum of 10.34 for
Czech Republic. The broadband Internet subscriptions average at 5.04 per 100 people that vary
between a minimum of 0.05 for Bangladesh and a maximum of 19.79 for South Korea. The average
number of the Internet hosts per 100 people is 0.64 with a minimum of 0.0004 in Bangladesh and a
maximum of 3.96 in South Korea. Furthermore, there are significant cross-country variations in the
average per capita GDP growth rate and the average population growth rate, the two major control
variables in our model.
[Insert Table 3]
In order to get a sense of how the ICT variables may be correlated with the trade variables, we
calculate correlation coefficients. Table 3 presents the average correlation coefficients (averaged
across countries) along with the minimum and maximum. The average correlations are all positive.
However, they are stronger for Internet bandwidth, Internet subscriptions, and Internet hosts. In
general, these correlations are stronger for goods trade than for services trade.
2.2 Methodology
We estimate fixed effects panel data models for our empirical analysis. We estimate two sets of
equations: the first set for three export variables and the second for three import variables. The
export variables are: percentage share of total exports in GDP, goods export share in GDP, and
services export share in GDP. The import variables are: percentage share of total imports in GDP,
goods import share in GDP, and services import share in GDP. On the right-hand side of these
models, we include one of the ICT variables: telecom investment growth, natural log of bandwidth,
Internet subscriptions per 100 people, and the Internet hosts per 100 people, together with other
control variables, country fixed effects, and year fixed effects.12 Thus, we estimate a total of 24
models, with 6 models for each ICT variable. Overall, our model takes the following form:
12 We take into account the following considerations while deciding whether to include these ICT variables in growth rate, log-level, or levels. First, we conduct panel unit root tests on all these ICT variables. The conventional test procedures overwhelmingly reject the null of unit root for last three variables. For telecom investment, we have mixed results and, therefore, we decide to include this variable in growth rate. Second, by using Internet hosts per 100 people and Internet users per 100 people we control for the size of the country. In this case, our strategy is similar to Clarke and Wallesten (2006) who use Internet hosts per 100 people as the relevant ICT variable. Although Freund and Weinhold (2002) use log of total number of Internet hosts arguing that scaling by population may understate the importance of the Internet in large countries like India and China, their robustness checks with this variable scaled by population gives them qualitatively similar results (Footnote 5, Freund and Wenhold 2002). Third, International bandwidth represents technical capacity and does not depend on the size of the population. Transforming it into the logarithmic scale allows us to interpret the effect of a percentage change on trade shares in a meaningful way. Note that we do not report the unit root test results and interested readers may obtain them from the authors.

7
where is the percentage share of exports (or imports) in GDP for country i in year t; is the
country fixed effect; Yt is the year (time) fixed effect; is the ICT variable of interest; is the
vector of control variables; i indexes country with ; and t indexes time with
.13
In the baseline specification, we choose per capita GDP growth and population growth along
with country and year fixed effects as the control variables. This is the most parsimonious
specification that can be estimated with the most available data. This is also consistent with the
gravity model that has been the workhorse of most empirical trade models.14 However, unlike some
other studies (e.g.,Vemuri and Siddiqui 2009), we include the growth rates of the first two control
variables to avoid the potential spurious regression problem due to the presence of unit root in the
data generating process for each of these variables.15 We do not explicitly include distance in our
model. Since we use total exports from one country to all its trading partners and total imports into
one country from all its trading partners, we may include an average distance between the country
and all its trading partners. However, in our model specification, country fixed effects will capture
the effect of this time-invariant average distance and, therefore, we do not include it separately. The
growth of per capita GDP measures a country’s economic growth that reflects improvements in
standard of living. As a country grows, the import demand is expected to go up due to greater
consumption and investment demand. The effect on exports is not clear a priori. While as growth
takes place, the economy may increase its exports due to increased production, an increase in
domestic demand may, however, compete with external demand and thereby lower exports.
Furthermore, economic growth as reflected in per capita GDP growth also captures improvement in
infrastructural capacity which is crucial for international trade. In that case, we would expect it to
have a positive impact on both exports and imports.
Like per capita GDP growth, the effect of population growth on exports is ambiguous a-priori.
While, by increasing labor supply, it may increase domestic production and exports, a growing
population can reduce exports by creating domestic demand. However, population growth is likely
to increase the demand for imports. While the country fixed effects would capture the effects of
time-invariant country-specific factors, the year fixed effects are expected to capture the effects of
global events that may affect trade in all countries in the sample.
We use panel least square (PLS) method to estimate the baseline model.16 The country fixed
effects are expected to capture much of the heterosckedasticity among the countries while the year
13 Note that, by including percentage share of exports and imports in GDP, we are focusing on “accelerated growth” or “accelerated decline” effects of ICT. If both exports (imports) and GDP grow (or decline) proportionately, there will be no change in the percentage share of exports (or imports) in GDP. Thus, a positive (or a negative) effect on export or import share indicates a growth (decline) accelerating effect of ICT. 14 See, for example, Kimura and Lee 2006. 15 Using conventional panel unit root tests, we find overwhelming evidence of unit root in the level of these variables. The unit root results are not reported but can be obtained from the authors. 16 Choi (2010) uses this method.
8
fixed effects are expected to control for cross-correlations across countries. We rely on pooled
Durbin-Watson (DW) test statistics to examine if the estimated residuals are serially correlated. We
further estimate a dynamic version of the baseline model with 1-year lagged dependent variable on
the right hand side to check if the baseline model estimates are robust to the presence of
autocorrelation. We report the results in the section on sensitivity analysis (Section 4). Since in our
models the treatment takes place at the country level, the reported standard errors are clustered at
that level.
3. Empirical Results for The Baseline Model
As discussed above, the baseline specification includes an ICT variable, per capita GDP growth rate,
population growth rate, country fixed effects, and year fixed effects. We first report the estimation
results for the exports equations and then for imports. We use all available data for 40 countries in
our sample.
3.1 Exports
Table 4 presents the estimation results for the baseline model for exports. Columns (1) - (4) include
the coefficient estimates for regression equations with total export share in GDP as the dependent
variable. Of all the ICT variables, telecom investment growth has a negative and significant (at the
10% level) and international Internet bandwidth has a negative but statistically insignificant effect on
export share. The coefficient estimates for the remaining two ICT variables, namely broadband
Internet subscriptions per 100 people and the number of Internet hosts per 100 people, are positive
and statistically significant at the 1% level. The coefficient estimates for these two variables indicate
that an increase in Internet subscriptions and Internet hosts per 100 people by 1 will raise the export
share, on an average, by 0.73 and 0.72 percentage point respectively. That is, if broadband Internet
subscriptions increase by 10,000 from the current average of 50,400 in every 1 million population,
exports as a share of GDP will increase from an average of 44.84 % (Table 2) to 45.57 %.17
Furthermore, an addition of 10,000 Internet hosts to the current average of 6,400 per 1 million
people will have a very similar effect on the total export share.
[Insert Table 4]
Columns (5) – (8) include the coefficient estimates for the models with goods export share in
GDP as the dependent variable while columns (9) – (12) report the corresponding estimates for the
17 It is difficult to assign dollar values as both exports and GDP may increase. But, for a GDP of USD 100 billion, this roughly translates into an increase of USD 1.34 billion in exports (assuming that GDP increases only through the increase in exports). Since exports are a component of GDP, we obtain this figure by
solving the following equation for X:
where X is the increase in exports.
9
models with services export share as the dependent variable.18 According to these results, telecom
investment growth and Internet bandwidth do not matter either for goods export or for services
export. Internet subscriptions have a positive and significant effect on goods as well as services
exports. Furthermore, although the estimated coefficient of Internet hosts is positive and highly
significant for goods export, it is negative but statistically insignificant for services export. This is
interesting because it indicates that while broadband Internet connections help exports of both
goods and services, the positive impact of Internet hosts (as we observed in column 4 above) is
entirely on merchandise exports. This is in contrast with the results obtained by Freund and
Weinhold (2002) and Choi (2010). However, one needs to recognize that Freund and Weinhold
(2002) considered services exports from the U.S. and Choi (2010) uses a sample of 151 countries
including many developed countries that are the major exporters of services, particularly
information-intensive services. 19 Among the EMEs, barring a few exceptions (like India), most
countries export relatively small quantity of services that primarily include physical services such as
transportation, that are not likely to be significantly influenced by ICT. Further, note that the
estimated coefficients for services exports are quantitatively much smaller.
Among the control variables, per capita GDP growth has a negative and statistically insignificant
effect in most cases. It has a significant positive effect on total and goods export shares with
Internet hosts as the relevant ICT variable. Population growth has a positive and statistically
significant effect on total and goods export share in 7 out of 8 cases. In the case of services exports,
the estimated coefficients are not statistically significant. Note that the magnitudes and signs of the
coefficient estimates for each control variable cannot be directly compared across these model
specifications as the estimates are based on different samples depending on the data availability for
corresponding ICT variables. As for the significance of their signs, the estimated coefficients for the
control variables reflect the net effects of various forces working in different directions as we have
discussed in Section 2.
Overall, the results suggest that ICT infrastructure, as represented by telecom investment and
international Internet bandwidth, by itself does not have any significant impact on exports from the
EMEs. In contrast, evidence strongly suggests that the use of ICT as reflected by Internet
subscriptions and the number of Internet hosts, does increase exports from the EMEs. Thus,
building infrastructure and acquiring capability will not help with exports from these countries
unless and until they are put to use. Although our results do not point to a particular mechanism
through which the use of ICT may have increased exports (and it may vary across countries), it can
be inferred that use of the Internet reduces transactions costs associated with export and thereby has
a positive impact on it. These costs include the costs of gathering, processing, and communicating
information.
18 In general, the coefficient estimates for goods export share and services export share should add up to the coefficient estimate for total export. However, for some countries, data are not available by these two categories for all the years for which data on total exports are available. That is why they do not exactly add up. 19 For an overview of major exporters and importers of services, see Apte and Nath (2012).

10
3.2 Imports
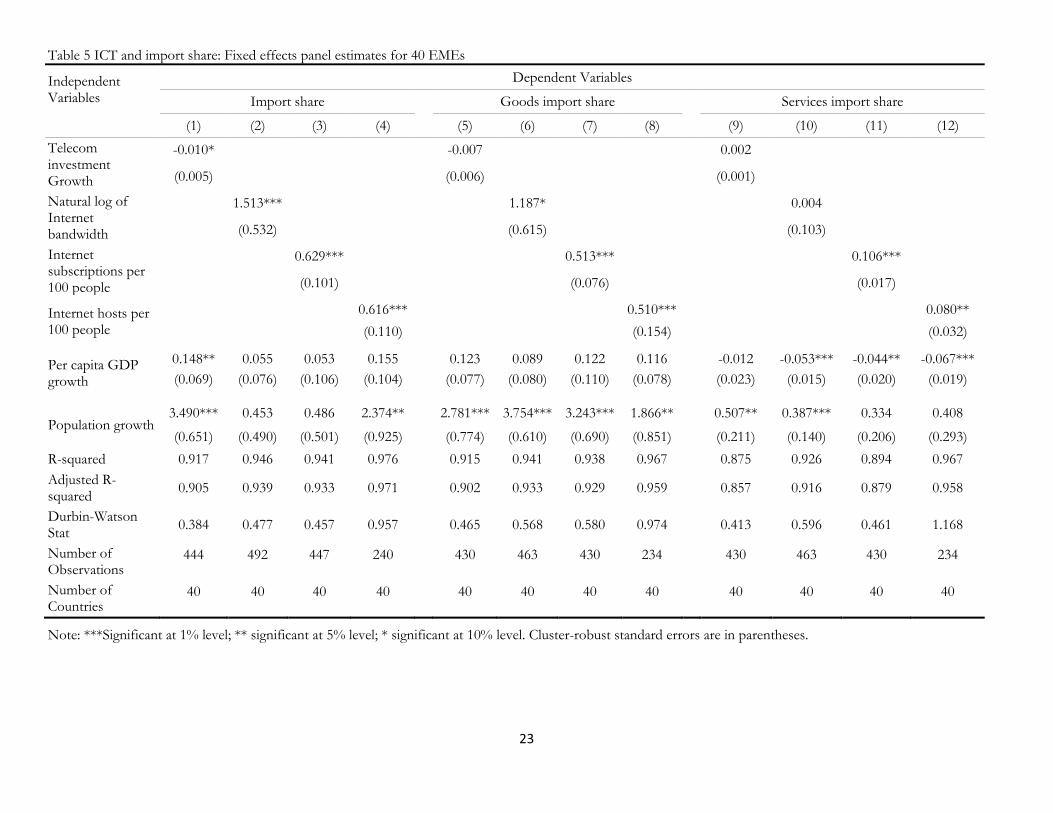
In Table 5, we present the estimation results for the baseline model for imports. The coefficient
estimates for the regression equations with total import share in GDP as the dependent variable are
included in columns (1) – (4). Among the ICT variables, telecom investment growth has a negative
and statistically significant (at the 10% level) effect while the rest three have significant positive
impacts on import share. The coefficient estimates are statistically significant at the 1 % significance
level for each of these three ICT variables. According to the coefficient estimates, a 1 % increase in
Internet bandwidth raises the import share by 1.51 percentage point. It implies that if International
Internet bandwidth increases by 1% from its average of 47,888 megabits per second, imports as a
share of GDP will increase from an average of 45.62% to 47.13%. Furthermore, as Internet
subscriptions and Internet hosts increase by 1 per 100 people, import share rises by 0.63 and 0.62
percentage point respectively. That is, an addition of 10,000 Internet subscriptions to the current
average of 50,400 per 1 million people will increase imports as a share of GDP from an average of
45.62 % to 46.25%. Adding 10,000 Internet hosts to the current average of 6,400 per 1 million
population will have a very similar effect on import share.
[Insert Table 5]
Columns (5) – (8) include the coefficient estimates for the models with GDP share of goods
imports as the dependent variable while columns (9) – (12) report the corresponding estimates for
the models with services import share as the dependent variable. The coefficient estimates for the
ICT variables in both sets of equations are qualitatively similar to those in total import share
equations for most cases. The only differences are: the estimated coefficient for telecom investment
growth is no longer statistically significant for goods imports and it is positive (but not statistically
significant) for services imports. Furthermore, the coefficient estimates for bandwidth is weakly
significant for goods imports and not statistically significant for services imports. As in the case of
exports, the estimated coefficients in the models for services imports are quantitatively much smaller.
Among the control variables, per capita GDP growth has a positive but, in 7 out of 8 cases,
statistically insignificant effect on total and goods import share. The coefficient estimates are
negative and, in 3 cases, statistically significant for services imports. Population growth has positive
and, in most cases, statistically significant effects on imports.
Overall, our results indicate that ICT infrastructure building through telecom investment does
not help with imports. However, in contrast to exports, international internet bandwidth has a
positive impact on imports although the evidence is much weaker for services imports. Services
imports to many of the EMEs include information-intensive services such as computer
programming, financial services that require ICT capability for the delivery of those services. The
positive and significant coefficient estimate for Internet bandwidth seems to have captured this trade
pattern. Furthermore, like in the case of exports, the use of ICT for acquiring and transmitting
information as captured by Internet subscriptions and Internet hosts have a significant positive
impact on import shares. Thus, it is primarily through the use of the Internet that ICT increases

11
imports into the EMEs. The low cost of information gathering and, in some cases, the low cost of
delivering services may have generated this positive impact.
The fact that the estimated ICT coefficients for services trade (both exports and imports) are
smaller than those for goods trade needs some explanation. For most of these EMEs, services trade
primarily include physical services such as travel and transportation, in which case the effects of ICT
would presumably be smaller than in the case of trade in information-intensive services such as
computer and data processing services or financial services. To give an example, our sample includes
major oil exporting countries like Iran, Kuwait, and Nigeria where the transportation services
associated mainly with oil exports (oil pipeline, port services etc.) are a substantial part of services
exports (they average 47%, 55%, and 56 % respectively over the years for which data are available).
These services are not likely to be significantly affected by ICT. Consequently, the estimated
coefficients that represent average impacts of ICT on services exports are expected to be relatively
smaller.
3.3 Endogeneity
Our empirical model is based on the assumption that the causality runs from ICT to export and
import shares. However, it is possible that exports and imports may also cause ICT.20 Similarly, the
causality may also run from trade to other control variables. Furthermore, both ICT (and other
right-hand side variables) and exports/imports may be caused by a third factor that is not observable.
These possibilities give rise to the endogeneity problem that has been widely recognized in the
literature. Clarke and Wallsten (2006) and Vemuri and Siddiqi (2009) extensively discuss this issue in
the context of ICT and trade.21 There are serious consequences of endogeneity. In the presence of
endogeneity, least square method can produce biased and inconsistent parameter estimates and
hypotheses tests can be seriously misleading. One way to handle endogeneity is to build a theoretical
model that clearly establishes a unidirectional causality from the right-hand variables to the left-hand
side variable in the regression model. Freund and Weinhold (2004) adopt this strategy. Since we do
not have a theoretical model, we have to rely on purely empirical strategies. We first include lagged
20 In our model, at least in two cases it is unlikely that trade would cause ICT, For example, when we use the growth of telecom investment as the ICT variable, it is the growth between last year and the current year whereas the dependent variable - the export (import) share - is for the current year. Therefore, it is not intuitively clear how the export (import) share in current period will cause the growth in investment since last year. For the same reason, trade in current period does not seem to cause growth of per capita income between last year and the current year, a major control variable that we have included in our model. In order to verify this, we estimate fixed effects regression models of per capita GDP growth on export and import shares. The estimated coefficients are statistically insignificant. These results are held as evidence against the potential reverse causality from trade to per capita GDP growth. Note that there is a substantial literature (e.g., Frankel and Romer 1999) that argues that trade causes growth. Furthermore, while an increase in export and import share may cause increases in Internet bandwidth and the number of Internet hosts, it does not seem to be the case with Internet subscriptions. 21 Clarke and Wallsten (2006) use a country’s regulation of data services as an instrument for Internet hosts in order to control for endogeneity. In contrast, Vemuri and Siddiqi (2009) use instrumental variable approach of Hausman and Taylor (2009). We also use a similar approach.
12
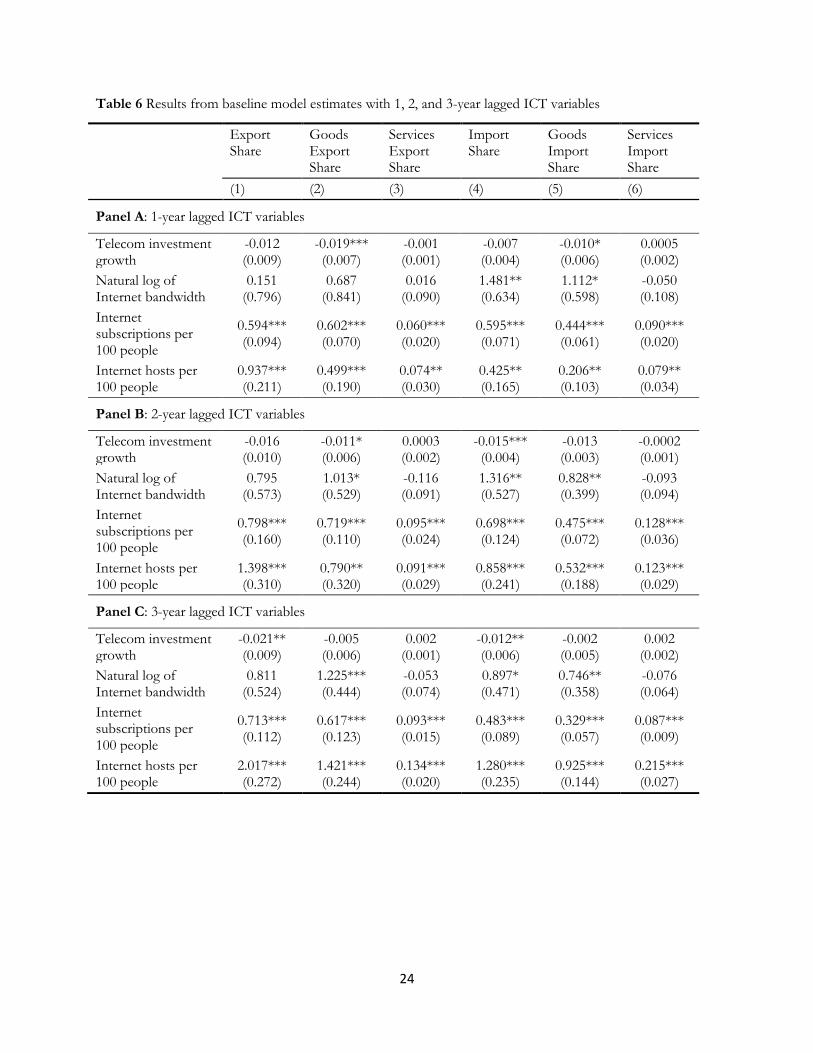
ICT variables (rather than including them contemporaneously) on the right-hand side. In particular,
we use 1-, 2-, and 3-year lag of the ICT variables.22 Freund and Weinhold (2004) use 1-year lag in
one of their specifications. The coefficient estimates for the lagged ICT variables are presented in
Table 6.23 In most cases, they are qualitatively similar to the coefficient estimates in Table 4 and 5.
Only in a few cases the signs of the estimated coefficients change but they are all statistically
insignificant before and after we replace contemporaneous ICT variable with a lagged ICT variable.
Furthermore, the estimated coefficients of lagged Internet subscriptions and Internet hosts are
positive and statistically significant at least at the 5% level. In terms of magnitude, Internet
subscriptions have the largest impact on trade variables at 2-year lag while Internet hosts have the
largest impact at 3-year lag.
[Insert Table 6]
The second strategy that we adopt is to use the instrumental variable (IV) method. Although it is
intuitively appealing, the most challenging issue is to find the appropriate instrument. However,
following Hausman and Taylor (1981), we can use lagged values of potentially endogenous variables
as instruments.24 We then use a panel GMM estimation method, as in Choi (2010). We use 1-year lag
of the ICT variables, 1 and 2-year lags of per capita GDP growth, and 1-year lag of population
growth as the instruments. Table 7 presents the results. Both telecom investment growth and
bandwidth have positive but, in most cases, statistically insignificant effects on export and import
shares. The estimated coefficients for internet subscriptions are positive and highly significant.
Finally, internet hosts have positive impacts in all but the case of services exports. However, the
coefficients are statistically significant only for goods exports and total imports. Overall, the results
are consistent with those in Table 4 and 5.
[Insert Table 7]
We also conduct Hansen’s J test for the validity of the instruments and report the estimated test
statistics and associated p-values at the bottom of Panel B. The high p-values indicate that the
instruments are valid. Only in the case of export share with bandwidth as the relevant ICT variable,
we reject the null that instruments are valid at the 5% level. However, an alternative set of
instruments (1-year lag of telecom investment growth and per capita GDP growth, and 1 and 2-year
lag of population growth) is more appropriate instruments in this case. When these instruments are
used, there is little change the estimated coefficient of the ICT variable.
4. Sensitivity Analysis
In order to examine if the results with regard to the effects of ICT on exports and imports are
robust, we estimate several alternative specifications of our regression models. First, we include all
22 Using more than 3 lags reduces the number of usable observations particularly when the number of Internet hosts is used as the relevant ICT variable. 23 For comparison, we adjust the sample period so that all three specifications include same number of periods. 24 Vemuri and Siddiqi (2009) use this approach.
13
four ICT variables together in the regression equations for exports and imports. Since most of these
variables are highly correlated, it would be interesting to see which ICT variables remain statistically
significant in the presence of the others. As for the correlations among the ICT variables, Internet
bandwidth is positively correlated with telecom investment growth, Internet subscriptions, and
Internet hosts with correlation coefficients of 0.40, 0.52, and 0.46 respectively. Furthermore,
Internet subscriptions and Internet hosts are strongly positively correlated with an estimated
coefficient of 0.66. Telecom investment growth is weakly correlated with Internet subscriptions and
Internet hosts. Second, we use a shorter sample period, 2002 -2008, to estimate the baseline model.
This period witnessed significant steady growth of both exports and imports in the EMEs in our
sample. Also, there was substantial proliferation of ICT during this period. We cut off the sample
period in 2008 because most countries experienced a large drop in their respective international
trade flows in 2009, primarily due to the global financial and economic crisis. Third, the countries in
our sample have been classified as EMEs based on a wide range of criteria and, therefore, there are
high variations in their economic performances in terms of growth, international trade, and
technology adoption. In order to have some uniformity among them, we pick 20 countries that are
listed by at least three (out of five) agencies. The fact that they are classified as EMEs by multiple
agencies suggests that some common criteria have been used and, therefore, we would expect more
similarities among them than in the full sample. Fourth, the pooled Durbin-Watson statistics reported
in the previous section indicate that we cannot reject the null of no serial correlation in most cases.
Therefore, we also estimate a dynamic version of the baseline model with 1-year lagged dependent
variable on the right hand side.25
Fifth, there are additional variables that may potentially affect trade. We consider the following
additional variables: growth of the rest of the world GDP, changes in real exchange rates, average
tariff rates, FDI share in total fixed investment, M2-GDP ratio as additional control variables.26 The
ROW GDP growth creates demand for exports from a country. The effect on imports is not quite
clear. While economic growth in the rest of the world increases the supply of imports into a country,
growth and higher standard of living in the rest of the world may crowd out some of these imports
and the net effect is not clear. The exchange rate appreciation (depreciation) is expected to have a
negative (positive) effect on exports and a positive (negative) effect on imports. Lower tariff rates
reflect trade openness and are expected to have a direct positive effect on imports and an indirect
positive effect on exports. As imports become cheaper, a country may increase imports of capital
goods that enhance its ability to export. An increase in FDI share may increase trade as well. When
FDI takes place, imports of capital goods rise and exports may also increase particularly when FDIs
25 Since the lagged dependent variable is correlated with country fixed effects, the coefficient estimates are biased and inconsistent. However, our objective for this specification is to examine if the estimates are qualitatively similar to our baseline estimates when we control for any potential autocorrelation in the error terms. Further, some researchers (e.g. Islam 1995) argue that the bias would not be large for moderate size T if N is relatively large. 26 Clark and Wallsten (2006) add other variables such as WTO membership, political openness, and a dummy variable for oil exporting countries. In an extended specification we add those variables and do not find any significant differences with respect to the coefficient estimates of the ICT variables. We do not report the results here.

14
are of efficiency-seeking variety. M2-GDP ratio is used as a measure of financial depth and, as
Freund and Weinhold (2002) discuss, serves as a proxy for overall comparative advantages in
services across countries. Sixth, we estimate model specifications similar to Choi (2010). Of all the
previous studies that we mention, this is the only study that uses total trade instead of bilateral trade
as the dependent variable. In this specification, like Choi (2010), we use log-level of all the variables.
Finally, it is likely that there are different trends across different countries and, therefore, we include
individual time trend for each country in addition to country and year fixed effects in our model.
[Insert Table 8]
Since our objective is to check if the results with respect to the effects of ICT on trade are
robust, we report only the coefficient estimates for the ICT variables from these alternative
specifications in Table 8. In the first alternative specification in this section, when we include all four
ICT variables together, the estimation procedure uses a much shorter sample period: 1999 – 2004, as
the data for Internet hosts are available only for those years. Therefore, for appropriate comparison,
we first estimate the baseline model for the sample period: 1999 – 2004, and report the results in the
first row of Table 8. With all four ICT variables together, the estimated coefficients are qualitatively
similar in most cases. The noticeable differences are: telecom investment growth has now positive
and significant effect on goods and services imports; the effect of Internet bandwidth is now
positive in all cases and statistically significant in all but the case of services exports (in both baseline
and the alternative specification); the estimated coefficients for Internet subscriptions now turn
negative for both exports and imports of services; and Internet hosts are a significant determinant of
services exports.
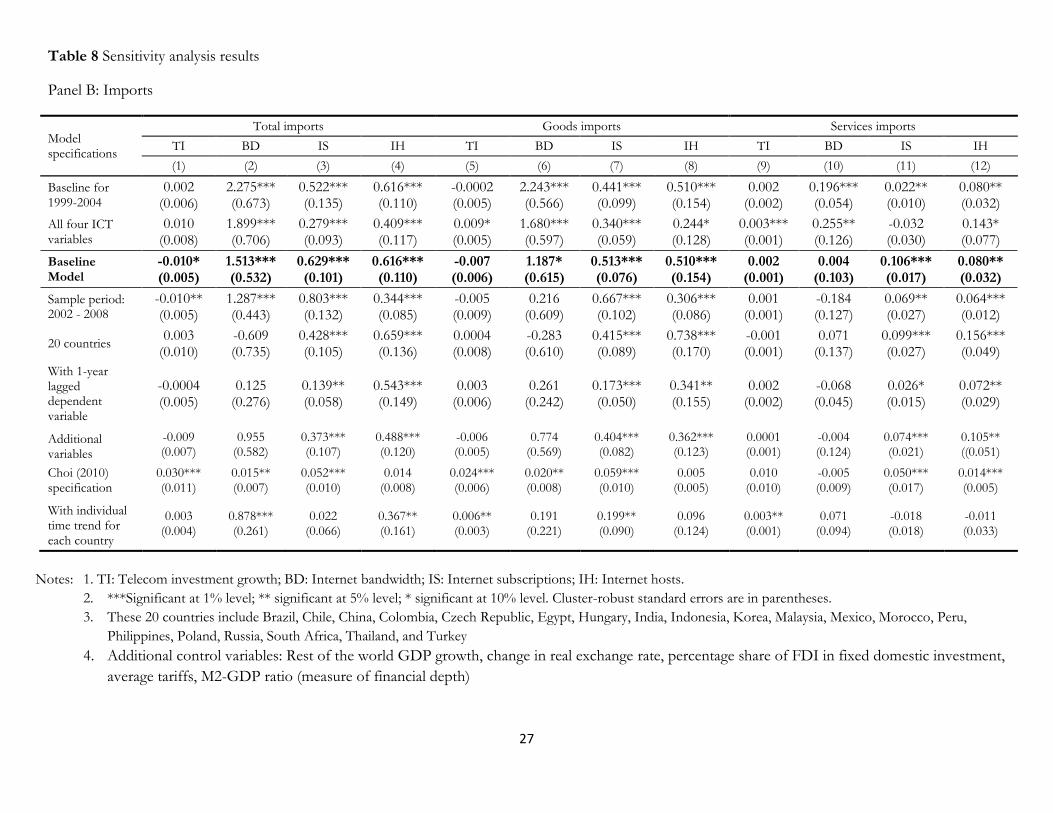
The third row of Panel A and B of Table 8 reproduces the estimated ICT coefficients from the
baseline model estimates reported in Table 4 & 5 so that they can be compared with the results from
the rest of the alternative specifications. With a shorter sample period, 2002 – 2008, the coefficient
estimates are qualitatively similar to the baseline estimates in most cases. However, the impact of
Internet bandwidth is now positive and significant on total and goods exports. Furthermore, the
coefficient estimate of Internet hosts in services export equation is not only positive but highly
significant. Note that there were significant increases in international Internet bandwidth during this
period of time which facilitated substantial data transfer that may have a significant positive impact
on trade. With only 20 EMEs, telecom investment growth and Internet bandwidth are not
significant in any of the cases. While the coefficient estimates for Internet subscriptions and Internet
hosts are qualitatively similar, Internet subscriptions coefficients are slightly smaller in magnitude
and those for Internet hosts are slightly larger. The coefficient estimates for the ICT variables,
particularly for Internet subscriptions and Internet hosts, are qualitatively very similar when we
include 1-year lagged dependent variable. However, they are quantitatively much smaller.
When we include additional control variables, barring a few exceptions, the coefficient estimates
for the ICT variables are qualitatively similar to our baseline model estimates. Internet subscriptions
and Internet hosts remain significant determinants of exports as well as imports. Finally, when we
estimate the model specifications similar to Choi (2010), Internet subscriptions remain a significant
determinant of both exports and imports. Internet hosts now do not seem to matter for services
15
exports and for total as well as goods imports. However, it has a significant positive impact on
services imports. Further, Internet bandwidth has a positive and significant impact on goods as well
as services exports, and on total as well as goods imports. Telecom investment growth also becomes
a significant determinant of total and goods imports. Our results regarding the impact of Internet
hosts on services exports are not quite consistent with the results reported in Choi (2010). However,
one needs to recognize that our sample is different: while we use only 40 EMEs, Choi (2010) uses a
much larger sample of 151 countries that include both developed and developing countries. In the
developed countries, the impact of ICT, particularly on services trade, is expected to be larger.
When individual time trends for different countries are included, the signs of the estimated
coefficients for the ICT variables change in 9 (out of total 24) cases but 6 of them are statistically
insignificant. Also, the coefficients now become statistically insignificant in 8 cases. In contrast, the
coefficient estimates are now significant in 2 cases. Further, the estimated coefficients for Internet
hosts remain positive and significant for total exports and goods exports. Internet subscriptions are
no longer a significant determinant of total and goods exports. However, this ICT variable has now
a significant negative effect on services exports. Also, bandwidth has a significant negative effect on
goods exports. The results indicate that Internet hosts have a significant positive impact on total
imports and Internet subscriptions have a significant positive effect on goods imports. Additionally,
like in the baseline model, bandwidth has a significant positive effect on total imports. However, we
need to be careful in interpreting these results. It is important to recognize that including individual
time trend makes the coefficient estimates imprecise. It increases the number of parameters to be
estimated and thus decreases the degrees of freedom substantially.27
Overall, the result that ICT as represented by Internet subscription and Internet hosts, has
significant positive impact on export and import shares in emerging market economies is robust to
most sensitivity checks that we have considered here. Thus, it is the use of ICT that matters the
most for international trade in EMEs.
5. Concluding Remarks
This paper examines the effects of ICT on exports and imports in emerging markets. Using panel
data for 40 EMEs for a period from 1995 to 2010, we estimate fixed effect models of exports and
imports. We use four ICT variables that include growth of investment in telecom services,
international Internet bandwidth, Internet subscriptions per 100 people, and the number of Internet
hosts per 100 people. The first two ICT variables represent ICT infrastructure while the last two
represent ICT use. We use the percentage share of total exports and total imports in GDP as
dependent variables. Additionally, we consider the GDP share of exports and imports for goods and
services separately. The main control variables are: per capita GDP growth, population growth, and
country and year fixed effects. The empirical results overwhelmingly suggest that Internet
subscriptions and Internet hosts have significant positive impacts on export as well as import shares
in EMEs. This result is robust to a number of sensitivity checks: generalized method of moments
27
Also, time trend is not statistically significant for a number of countries in our sample.
16
(GMM) estimation with lagged independent variables as instruments; inclusion of all four ICT
variables together; shorter sample period; a subsample of EMEs; dynamic specification with lagged
dependent variable; and an alternative model specification with additional control variables. In
general, the results are consistent with those reported by previous studies.
The evidence of trade enhancing impact of ICT is particularly important for developing
countries that have been trying to promote international trade. Policies that facilitate and encourage
the adoption and use of ICT will go a long way in boosting trade in those countries. The biggest
advantage of ICT is that over the years the price of ICT has gone down substantially and it is
relatively inexpensive to increase ICT adoption and use. Based on these results, one can also argue
that EMEs trying to promote international trade may introduce policies that would increase the use
of ICT.
This study uses aggregate data to examine the impact of ICT on exports and imports. Intuitively,
ICT may have differential impacts on different trade items. For example, ICT may have a larger
impact on trade in financial services than on trade in crude oil. Furthermore, examining the ICT
impact on bilateral trade would allow us to control for a wider range of heterogeneity. In our future
research, we would like to investigate how ICT affects trade of different items. Furthermore, like
most previous studies, we would like to use bilateral trade data. It would allow us to use the gravity
model framework that has been the workhorse of the empirical trade literature.

17
References
Acemoglu, D. and D. H. Autor. 2010. “Skills, Tasks and Technologies: Implications for Employment and Earnings.” Mimeo. MIT.
Apte, U M. and R. O. Mason. 1995. “Global Disaggregation of Information-Intensive Services.” Management Science, Vol. 41, No. 7: 1250-1262.
Apte, U.M. and H. K. Nath. 2012. “U.S. Trade in Information-Intensive Services.” In U.S. Karmarkar and V. Mangal (eds): The UCLA Anderson Business and Information Technologies (BIT) Project: A Global Study of Business Practice, Singapore: World Scientific Books.
Autor, D. H., L. F. Katz, A. B. Krueger. 1998. “Computing Inequality: Have Computers Changed the Labor Market?” The Quarterly Journal of Economics, Vol. 113, No.4: 1169-1213.
Autor, D. H., F. Levy and R. J. Murnane. 2003. “The Skill Content of Recent Technological Change: An Empirical Exploration.” The Quarterly Journal of Economics, Vol. 118, No. 4: 1279-1333.
Basu, S. and J. Fernald. 2007. “Information and Communications Technology as General-Purpose Technology: Evidence from US Industry data.” German Economic Review 8(2): 146 – 173.
Choi, C. 2010. “The effect of the Internet on service trade.” Economics Letters 109: 102 – 104.
Clarke, G. R. G. and S. J. Wallsten. 2006. “Has the Internet Increased Trade? Developed and Developing Country Evidence.” Economic Inquiry 44, No. 3: 465-484.
Demirkan, H., M. Goul, R. J. Kauffman, and D. M. Weber. 2009. “Does Distance Matter? The Influence of ICT on Bilateral Trade Flows.” Proceedings of the Second Annual SIG GlobDev Workshop, Phoenix USA.
Dimelis, S. P. and S. K. Papaioannou. 2011. “Technical Efficiency and the Role of ICT: A Comparison of Developed and Developing Countries.” Emerging Markets Finance & Trade 47 (Supplement 3): 40-53.
Fink, C. A. Mattoo, and I. C. Neagu. 2005. “Assessing the impact of communication costs on international trade.” Journal of International Economics 67, 428-445.
Fleming, E. R.A.E. Mueller, and F. Thiemann. 2009. “ICT and the blooming bloom trade.” EFITA Conference ’09, 767 – 774.
Frankel, J. A. and D. Romer. 1999. “Does Trade Cause Growth?” American Economic Review, Vol 89 (3): 379 – 399.
Freund, C. and D. Weinhold. 2002. “The Internet and International Trade in Services.” American Economic Review 92, No. 2: 236 – 240.
Freund, C. and D. Weinhold. 2004. “The effect of the Internet on international trade.” Journal of International Economics 62: 171 – 189.
Haacker, M. 2010. “ICT Equipment Investment and Growth in Low-and Lower-Middle-Income Countries.” IMF Working Paper WP/10/66.
Hausman, J. and W. Taylor. 1981. “Panel Data and Unobservable Individual Effects.” Econometrica 49 (6): 1377 – 1398.
Islam, N. 1995. “Growth empirics: A panel data approach.” Quarterly Journal of Economics 110(4): 1127 – 1170.
18
Jorgenson, D. W. 2001. “Information Technology and the U.S. Economy.” The American Economic Review, Vol. 91, No.1: 1-32.
Kimura, F. and H. H. Lee. 2006. “The Gravity Equation in International Trade in Services.” Review of World Economics 142, No. 1: 92 – 121.
Mattes, A. P. Meinen, and F. Pavel. 2012. “Goods Follow Bytes: The Impact of ICT on EU Trade.” DIW Berlin Discussion Papers.
Mithas, S. and J. Whitaker. 2007. “Is the World Flat or Spiky? Information Intensity, Skills, and Global Service Disaggregation.” Information Systems Research, Vol. 18: 237-259.
Schreyer, P. 2000. “The Contribution of Information and Communication Technology to Output Growth: A Study of the G7 Countries.” OECD Science, Technology and Industry Working Papers 2000/02.
Stiroh, K. J. 2002. “Information Technology and the U.S. Productivity Revival: What Do the Industry Data Say?” The American Economic Review, Vol. 92 No. 5:1559-1576.
Thiemann, F., E. Fleming, and R. A. F. Mueller. 2012. “Impact of information and communication technology (ICT) on international trade in fruit and vegetables: A gravity model approach.” Selected paper prepared for presentation at the International Association of Agricultural Economists (IAAE) Triennial Conference, Foz do Iguacu, Brazil, 18-24 August, 2012.
Vemuri, V. K. and S. Siddiqi. 2009. “Impact of Commercialization of the Internet on International Trade: A Panel Study Using the Extended Gravity Model.” The International Trade Journal 23, No. 4: 458 – 484.

19
Table 1 List of Emerging Market Economies (EMEs)
Country FTSE MSCI S&P Dow Jones BBVA Research Common
Argentina
x
Bahrain
x
Bangladesh
x
Brazil x x x x x x
Bulgaria
x
Chile x x x x x x
China x x x x x x
Colombia x x x x x x
Czech Republic x x x x x x
Egypt x x x x x x
Estonia
x
Hungary x x x x x x
India x x x x x x
Indonesia x x x x x x
Iran
x
Jordan
x
South Korea
x
x x x
Kuwait
x
Latvia
x
Lithuania
x
Malaysia x x x x x x
Mauritius
x
Mexico x x x x x x
Morocco x x x x x x
Nigeria
x
Oman
x
Pakistan x
x
Peru x x x x x x
Philippines x x x x x x
Poland x x x x x x
Romania
x
Russia x x x x x x
Slovak Republic
x
South Africa x x x x x x
Sri Lanka
x
Thailand x x x x x x
Tunisia
x
Turkey x x x x x x
Ukraine
x
Vietnam
x
Note: This list has been compiled from the latest reports published by various agencies listed in the top row.
The last column “Common” indicates that a country has been identified as an EME by at least three agencies.

20
Table 2 Summary statistics of the major variables
Variables
Mean
Standard Deviation
Overall Min Max Overall Min Max
% share of exports in GDP
44.84 10.39 (Argentina) 111.26 (Malaysia)
24.65 0.73 (South Africa) 24.82 (Hungary)
% share of goods exports in GDP
35.55 8.79 (Argentina) 97.38 (Malaysia)
21.04 0.61 (South Africa) 27.55 (Nigeria)
% share of services exports in GDP
9.03 1.50 (Iran) 25.35 (Estonia)
6.34 0.07 (Bangladesh) 6.37 (Philippines)
% share of import in GDP
45.62 11.31 (Argentina) 95.87 (Malaysia)
24.35 0.88 (Argentina) 23.70 (Hungary)
% share of goods import in GDP
37.25 8.41 (Argentina) 77.16 (Malaysia)
20.03 0.59 (Bangladesh) 21.59 (Hungary)
% of services import in GDP
8.52 2.62 (Brazil) 17.84 (Jordan)
4.91 0.12 (Colombia) 9.04 (Nigeria)
Telecom investment growth
12.52 -10.86 (Argentina) 67.15 (Ukraine)
62.74 3.72 (Vietnam) 194.53 (Nigeria)
Log of Internet bandwidth
7.57 3.64 (Mauritius) 10.34 (Czech Republic)
3.31 1.1 (Bahrain) 4.60 (Bulgaria)
Internet subscriptions per 100 people
5.04 0.05 (Bangladesh) 19.79 (South Korea)
6.49 0.03 (Bangladesh) 13.43 (Russian Federation)
Internet hosts per 100 people
0.64 0.0004 (Vietnam) 3.96 (South Korea)
1.24 0.0002 (Vietnam) 4.53 (South Korea)
Per capita GDP growth
2.96 -0.38 (Colombia) 8.65 (China)
4.13 0.50 (Bangladesh) 8.03 (Ukraine)
Population growth 0.96 -0.89 (Latvia) 3.29 (Kuwait)
1.10 0.02 (Vietnam) 1.54 (Kuwait)
Note: The name of the country that has the minimum or the maximum value of the relevant variable is in bracket.

21
Table 3 Average correlations between trade variables and ICT variables across 40 EMEs, 1995 - 2010
Telecom Investment Growth
Natural log of Internet bandwidth
Internet subscriptions per 100 people
Internet hosts per 100 people
(1) (2) (3) (4)
Export share 0.008
(-0.45, 0.69) 0.43
(-0.83, 0.97) 0.48
(-0.97, 0.96) 0.47
(-0.80, 0.99)
Goods export share 0.02
(-0.73, 0.67) 0.51
(-0.93, 0.97) 0.51
(-0.95, 0.95) 0.53
(-0.95, 0.99)
Services export share 0.04
(-0.60, 0.94) 0.35
(-0.93, 0.98) 0.29
(-0.93, 0.94) 0.19
(-0.90, 0.92)
Import share 0.11
(-0.51, 0.88) 0.43
(-0.86, 0.96) 0.40
(-0.90, 0.97) 0.49
(-0.88, 0.998)
Goods import share 0.15
(-0.67, 0.86) 0.48
(-0.91, 0.95) 0.44
(-0.80, 0.98) 0.44
(-0.97, 0.99)
Services import share 0.03
(-0.86, 0.62) 0.25
(-0.995, 0.94) 0.24
(-0.86, 0.95) 0.30
(-0.80, 0.95)
Note: The minimum and maximum correlation coefficients are in parentheses. Since data on some ICT variables are available only for 2 to 3 years in Iran, Kuwait, and
Vietnam, the correlation coefficients with trade variables are 1 (perfect correlation). However, we do not report those correlation coefficients as the maximum values
because they are outliers.

22
Table 4 ICT and export share: Fixed effects panel estimates for 40 EMEs
Note:***Significant at 1% level; ** significant at 5% level; * significant at 10% level. Cluster-robust standard errors are reported in parentheses.
Independent Variables
Dependent Variables
Export share Goods export share Services export share
(1) (2) (3) (4) (5) (6) (7) (8) (9) (10) (11) (12)
Telecom investment Growth
-0.012* -0.012 0.0004
(0.007) (0.008) (0.001)
Natural log of Internet bandwidth
-0.232 0.178 0.057
(0.678) (0.743) (0.100)
Internet subscription per 100 people
0.729*** 0.679*** 0.084***
(0.155) (0.129) (0.017)
Internet hosts per 100 people
0.721*** 0.770*** -0.007
(0.099) (0.084) (0.022)
Per capita GDP growth
-0.088 -0.115 -0.115 0.212*** -0.120 -0.127* -0.116 0.175** -0.010 -0.044** -0.026* 0.001
(0.094) (0.082) (0.110) (0.061) (0.090) (0.071) (0.141) (0.074) (0.022) (0.018) (0.015) (0.025)
Population growth
0.776 0.964*** 1.151*** 2.402*** 1.695* 3.494*** 2.516** 2.215*** 0.154 0.204 0.119 -0.127
(0.534) (0.253) (0.269) (0.615) (0.911) (0.957) (1.200) (0.636) (0.167) (0.143) (0.103) (0.104)
R-squared 0.901 0.928 0.930 0.975 0.894 0.931 0.919 0.971 0.933 0.953 0.943 0.979
Adj R-squared
0.887 0.919 0.920 0.969 0.878 0.921 0.907 0.963 0.922 0.946 0.934 0.973
Durbin-Watson stat
0.345 0.446 0.405 1.081 0.391 0.446 0.442 1.190 0.486 0.628 0.531 1.228
Number of observations
444 492 447 240 430 463 430 234 430 463 430 234
Number of countries
40 40 40 40 40 40 40 40 40 40 40 40
23
Table 5 ICT and import share: Fixed effects panel estimates for 40 EMEs
Independent Variables
Dependent Variables
Import share
Goods import share
Services import share
(1) (2) (3) (4) (5) (6) (7) (8) (9) (10) (11) (12)
Telecom investment Growth
-0.010*
-0.007
0.002
(0.005)
(0.006)
(0.001)
Natural log of Internet bandwidth
1.513***
1.187*
0.004
(0.532)
(0.615)
(0.103)
Internet subscriptions per 100 people
0.629***
0.513***
0.106***
(0.101)
(0.076)
(0.017)
Internet hosts per 100 people
0.616***
0.510***
0.080**
(0.110) (0.154) (0.032)
Per capita GDP growth
0.148** 0.055 0.053 0.155
0.123 0.089 0.122 0.116
-0.012 -0.053*** -0.044** -0.067***
(0.069) (0.076) (0.106) (0.104) (0.077) (0.080) (0.110) (0.078) (0.023) (0.015) (0.020) (0.019)
Population growth 3.490*** 0.453 0.486 2.374**
2.781*** 3.754*** 3.243*** 1.866**
0.507** 0.387*** 0.334 0.408
(0.651) (0.490) (0.501) (0.925)
(0.774) (0.610) (0.690) (0.851)
(0.211) (0.140) (0.206) (0.293)
R-squared 0.917 0.946 0.941 0.976 0.915 0.941 0.938 0.967 0.875 0.926 0.894 0.967
Adjusted R-squared
0.905 0.939 0.933 0.971 0.902 0.933 0.929 0.959 0.857 0.916 0.879 0.958
Durbin-Watson Stat
0.384 0.477 0.457 0.957 0.465 0.568 0.580 0.974 0.413 0.596 0.461 1.168
Number of Observations
444 492 447 240
430 463 430 234
430 463 430 234
Number of Countries
40 40 40 40
40 40 40 40
40 40 40 40
Note: ***Significant at 1% level; ** significant at 5% level; * significant at 10% level. Cluster-robust standard errors are in parentheses.
24
Table 6 Results from baseline model estimates with 1, 2, and 3-year lagged ICT variables
Export Share
Goods Export Share
Services Export Share
Import Share
Goods Import Share
Services Import Share
(1) (2) (3) (4) (5) (6)
Panel A: 1-year lagged ICT variables
Telecom investment growth
-0.012 (0.009)
-0.019*** (0.007)
-0.001 (0.001)
-0.007 (0.004)
-0.010* (0.006)
0.0005 (0.002)
Natural log of Internet bandwidth
0.151 (0.796)
0.687 (0.841)
0.016 (0.090)
1.481** (0.634)
1.112* (0.598)
-0.050 (0.108)
Internet subscriptions per 100 people
0.594*** (0.094)
0.602*** (0.070)
0.060*** (0.020)
0.595*** (0.071)
0.444*** (0.061)
0.090*** (0.020)
Internet hosts per 100 people
0.937*** (0.211)
0.499*** (0.190)
0.074** (0.030)
0.425** (0.165)
0.206** (0.103)
0.079** (0.034)
Panel B: 2-year lagged ICT variables
Telecom investment growth
-0.016 (0.010)
-0.011* (0.006)
0.0003 (0.002)
-0.015*** (0.004)
-0.013 (0.003)
-0.0002 (0.001)
Natural log of Internet bandwidth
0.795 (0.573)
1.013* (0.529)
-0.116 (0.091)
1.316** (0.527)
0.828** (0.399)
-0.093 (0.094)
Internet subscriptions per 100 people
0.798*** (0.160)
0.719*** (0.110)
0.095*** (0.024)
0.698*** (0.124)
0.475*** (0.072)
0.128*** (0.036)
Internet hosts per 100 people
1.398*** (0.310)
0.790** (0.320)
0.091*** (0.029)
0.858*** (0.241)
0.532*** (0.188)
0.123*** (0.029)
Panel C: 3-year lagged ICT variables
Telecom investment growth
-0.021** (0.009)
-0.005 (0.006)
0.002 (0.001)
-0.012** (0.006)
-0.002 (0.005)
0.002 (0.002)
Natural log of Internet bandwidth
0.811 (0.524)
1.225*** (0.444)
-0.053 (0.074)
0.897* (0.471)
0.746** (0.358)
-0.076 (0.064)
Internet subscriptions per 100 people
0.713*** (0.112)
0.617*** (0.123)
0.093*** (0.015)
0.483*** (0.089)
0.329*** (0.057)
0.087*** (0.009)
Internet hosts per 100 people
2.017*** (0.272)
1.421*** (0.244)
0.134*** (0.020)
1.280*** (0.235)
0.925*** (0.144)
0.215*** (0.027)

25
Table 7 Results from the GMM estimates of the baseline model with lagged independent variables as
instruments
Export Share
Goods Export Share
Services Export Share
Import Share
Goods Import Share
Services Import Share
(1) (2) (3) (4) (5) (6)
Telecom investment growth
0.079
(0.059)
0.158
(0.139)
0.012
(0.014)
0.052
(0.050)
0.155
(0.110)
0.014
(0.015)
Natural log of Internet bandwidth
0.543
(1.543)
0.876
(1.771)
0.005
(0.235)
2.702**
(1.300)
1.160
(1.539)
-0.252
(0.262)
Internet subscriptions per 100 people
0.875***
(0.307)
0.799***
(0.305)
0.140***
(0.049)
0.825***
(0.238)
0.614***
(0.146)
0.175***
(0.052)
Internet hosts per 100 people
1.270
(0.838)
1.308***
(0.477)
-0.038
(0.093)
0.344**
(0.165)
0.204
(0.170)
0.079
(0.131)
Hansen’s J-statistics
Telecom investment growth
1.466 (0.226)
0.586 (0.444)
0.001 (0.972)
0.002 (0.965)
0.002 (0.960)
0.280 (0.950)
Natural log of Internet bandwidth
5.257 (0.022)
2.490 (0.115)
2.751 (0.097)
0.625 (0.429)
0.017 (0.895)
0.437 (0.509)
Internet subscriptions per 100 people
0.461 (0.497)
0.093 (0.760)
0.695 (0.404)
0.135 (0.714)
1.036 (0.309)
0.120 (0.0729)
Internet hosts per 100 people
2e-05 (0.996)
0.004 (0.950)
0.378 (0.539)
0.133 (0.715)
0.007 (0.935)
0.728 (0.0394)
Note: 1-year lags of relevant ICT variable and population growth, and 1- and 2-year lags of per
capita GDP are used as instruments. The null hypothesis of Hansen’s J test is that the instruments
are valid. The numbers in parentheses under the estimated J-statistics are p-values.

26
Table 8 Sensitivity analysis results
Panel A. Exports
Model specifications
Total exports Goods exports Services exports
TI BD IS IH TI BD IS IH TI BD IS IH
(1) (2) (3) (4) (5) (6) (7) (8) (9) (10) (11) (12)
Baseline for 1999-2004
0.001 (0.005)
2.152*** (0.680)
0.373** (0.151)
0.721*** (0.099)
-0.001 (0.007)
2.215*** (0.744)
0.470*** (0.174)
0.770*** (0.084)
0.002 (0.001)
0.148 (0.102)
-0.027** (0.011)
-0.007 (0.022)
All four ICT variables together
0.001 (0.005)
1.341* (0.755)
0.202*** (0.055)
0.725*** (0.191)
-0.0003 (0.008)
1.606* (0.832)
0.300** (0.119)
0.540*** (0.199)
0.002 (0.002)
0.060 (0.129)
-0.062*** (0.017)
0.136*** (0.032)
Baseline Model -0.012* (0.007)
-0.232 (0.678)
0.729*** (0.155)
0.721*** (0.099)
-0.012 (0.008)
0.178 (0.743)
0.679** (0.129)
0.770*** (0.084)
0.0004 (0.001)
0.057 (0.100)
0.084*** (0.017)
0.007 (0.022)
Sample period: 2002 - 2008
-0.006 (0.011)
1.111*** (0.056)
0.364** (0.150)
0.664*** (0.087)
-0.016** (0.011)
-1.488** (0.610)
0.686*** (0.137)
0.564*** (0.038)
-6.5e-5 (0.0002)
-0.146 (0.159)
0.026 (0.023)
0.064** (0.026)
20 countries -0.006 (0.007)
-0.888 (0.919)
0.449** (0.181)
0.953*** (0.101)
-0.011 (0.008)
-0.540 (0.836)
0.451*** (0.145)
0.961*** (0.110)
0.0004 (0.003)
0.048 (0.122)
0.075** (0.033)
0.010 (0.037)
With 1-year lagged dependent variable
-0.001 (0.004)
-0.109 (0.270)
0.138*** (0.050)
0.549*** (0.087)
-0.004 (0.006)
0.378 (0.281)
0.077 (0.078)
0.669*** (0.106)
0.0004 (0.001)
-0.067 (0.072)
0.023** (0.011)
-0.020 (0.028)
Additional variables
-0.011* (0.006)
-0.473 (0.851)
0.388*** (0.143)
0.692*** (0.111)
-0.012** (0.006)
0.096 (0.719)
0.488*** (0.138)
0.770*** (0.199)
-0.003*** (0.001)
0.078 (0.125)
0.033* (0.020)
0.033 (0.042)
Choi (2010) specification
-0.001 (0.006)
0.014 (0.012)
0.061*** (0.015)
0.006** (0.003)
0.004 (0.009)
0.031** (0.014)
0.054*** (0.013)
0.017*** (0.003)
0.017 (0.024)
0.017* (0.009)
0.061*** (0.015)
0.009 (0.007)
With individual time trend for each country
4.e-05 (0.004)
-0.285 (0.218)
-0.128 (0.092)
0.596*** (0.170)
0.000 (0.006)
-0.785*** (0.190)
0.047 (0.084)
0.686*** (0.201)
0.001 (0.001)
0.131 (0.117)
-0.072*** (0.016)
-0.003 (0.031)
Notes: 1. TI: Telecom investment growth; BD: Internet bandwidth; IS: Internet subscriptions; IH: Internet hosts.
2. ***Significant at 1% level; ** significant at 5% level; * significant at 10% level. Cluster-robust standard errors are in parentheses.
3. These 20 countries include Brazil, Chile, China, Colombia, Czech Republic, Egypt, Hungary, India, Indonesia, Korea, Malaysia, Mexico, Morocco, Peru,
Philippines, Poland, Russia, South Africa, Thailand, and Turkey
4. Additional control variables: Rest of the world GDP growth, change in real exchange rate, percentage share of FDI in fixed domestic investment,
average tariffs, M2-GDP ratio (measure of financial depth)
27
Table 8 Sensitivity analysis results
Panel B: Imports
Model specifications
Total imports Goods imports Services imports
TI BD IS IH TI BD IS IH TI BD IS IH
(1) (2) (3) (4) (5) (6) (7) (8) (9) (10) (11) (12)
Baseline for 1999-2004
0.002 (0.006)
2.275*** (0.673)
0.522*** (0.135)
0.616*** (0.110)
-0.0002 (0.005)
2.243*** (0.566)
0.441*** (0.099)
0.510*** (0.154)
0.002 (0.002)
0.196*** (0.054)
0.022** (0.010)
0.080** (0.032)
All four ICT variables
0.010 (0.008)
1.899*** (0.706)
0.279*** (0.093)
0.409*** (0.117)
0.009* (0.005)
1.680*** (0.597)
0.340*** (0.059)
0.244* (0.128)
0.003*** (0.001)
0.255** (0.126)
-0.032 (0.030)
0.143* (0.077)
Baseline Model
-0.010* (0.005)
1.513*** (0.532)
0.629*** (0.101)
0.616*** (0.110)
-0.007 (0.006)
1.187* (0.615)
0.513*** (0.076)
0.510*** (0.154)
0.002 (0.001)
0.004 (0.103)
0.106*** (0.017)
0.080** (0.032)
Sample period: 2002 - 2008
-0.010** (0.005)
1.287*** (0.443)
0.803*** (0.132)
0.344*** (0.085)
-0.005 (0.009)
0.216 (0.609)
0.667*** (0.102)
0.306*** (0.086)
0.001 (0.001)
-0.184 (0.127)
0.069** (0.027)
0.064*** (0.012)
20 countries 0.003
(0.010) -0.609 (0.735)
0.428*** (0.105)
0.659*** (0.136)
0.0004 (0.008)
-0.283 (0.610)
0.415*** (0.089)
0.738*** (0.170)
-0.001 (0.001)
0.071 (0.137)
0.099*** (0.027)
0.156*** (0.049)
With 1-year lagged dependent variable
-0.0004 (0.005)
0.125 (0.276)
0.139** (0.058)
0.543*** (0.149)
0.003 (0.006)
0.261 (0.242)
0.173*** (0.050)
0.341** (0.155)
0.002 (0.002)
-0.068 (0.045)
0.026* (0.015)
0.072** (0.029)
Additional variables
-0.009 (0.007)
0.955 (0.582)
0.373*** (0.107)
0.488*** (0.120)
-0.006 (0.005)
0.774 (0.569)
0.404*** (0.082)
0.362*** (0.123)
0.0001 (0.001)
-0.004 (0.124)
0.074*** (0.021)
0.105** ((0.051)
Choi (2010) specification
0.030*** (0.011)
0.015** (0.007)
0.052*** (0.010)
0.014 (0.008)
0.024*** (0.006)
0.020** (0.008)
0.059*** (0.010)
0.005 (0.005)
0.010 (0.010)
-0.005 (0.009)
0.050*** (0.017)
0.014*** (0.005)
With individual time trend for each country
0.003 (0.004)
0.878*** (0.261)
0.022 (0.066)
0.367** (0.161)
0.006** (0.003)
0.191 (0.221)
0.199** (0.090)
0.096 (0.124)
0.003** (0.001)
0.071 (0.094)
-0.018 (0.018)
-0.011 (0.033)
Notes: 1. TI: Telecom investment growth; BD: Internet bandwidth; IS: Internet subscriptions; IH: Internet hosts.
2. ***Significant at 1% level; ** significant at 5% level; * significant at 10% level. Cluster-robust standard errors are in parentheses.
3. These 20 countries include Brazil, Chile, China, Colombia, Czech Republic, Egypt, Hungary, India, Indonesia, Korea, Malaysia, Mexico, Morocco, Peru,
Philippines, Poland, Russia, South Africa, Thailand, and Turkey
4. Additional control variables: Rest of the world GDP growth, change in real exchange rate, percentage share of FDI in fixed domestic investment,
average tariffs, M2-GDP ratio (measure of financial depth)
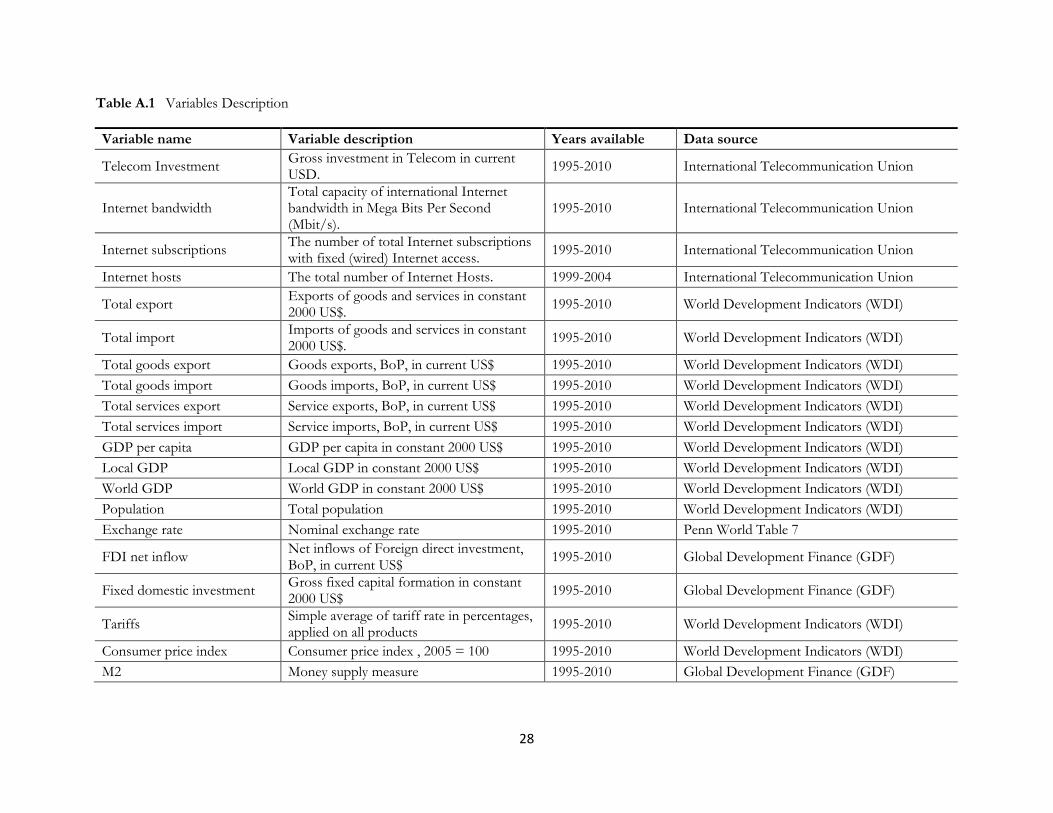
28
Table A.1 Variables Description
Variable name Variable description Years available Data source
Telecom Investment Gross investment in Telecom in current USD.
1995-2010 International Telecommunication Union
Internet bandwidth Total capacity of international Internet bandwidth in Mega Bits Per Second (Mbit/s).
1995-2010 International Telecommunication Union
Internet subscriptions The number of total Internet subscriptions with fixed (wired) Internet access.
1995-2010 International Telecommunication Union
Internet hosts The total number of Internet Hosts. 1999-2004 International Telecommunication Union
Total export Exports of goods and services in constant 2000 US$.
1995-2010 World Development Indicators (WDI)
Total import Imports of goods and services in constant 2000 US$.
1995-2010 World Development Indicators (WDI)
Total goods export Goods exports, BoP, in current US$ 1995-2010 World Development Indicators (WDI)
Total goods import Goods imports, BoP, in current US$ 1995-2010 World Development Indicators (WDI)
Total services export Service exports, BoP, in current US$ 1995-2010 World Development Indicators (WDI)
Total services import Service imports, BoP, in current US$ 1995-2010 World Development Indicators (WDI)
GDP per capita GDP per capita in constant 2000 US$ 1995-2010 World Development Indicators (WDI)
Local GDP Local GDP in constant 2000 US$ 1995-2010 World Development Indicators (WDI)
World GDP World GDP in constant 2000 US$ 1995-2010 World Development Indicators (WDI)
Population Total population 1995-2010 World Development Indicators (WDI)
Exchange rate Nominal exchange rate 1995-2010 Penn World Table 7
FDI net inflow Net inflows of Foreign direct investment, BoP, in current US$
1995-2010 Global Development Finance (GDF)
Fixed domestic investment Gross fixed capital formation in constant 2000 US$
1995-2010 Global Development Finance (GDF)
Tariffs Simple average of tariff rate in percentages, applied on all products
1995-2010 World Development Indicators (WDI)
Consumer price index Consumer price index , 2005 = 100 1995-2010 World Development Indicators (WDI)
M2 Money supply measure 1995-2010 Global Development Finance (GDF)