information and communications technology (ict ... · 4.4 ict and productivity at the industry...
TRANSCRIPT

Information and Communications Technology (ICT), Productivity and
Economic Growth in China
by
Chee Kong WONG
This thesis is presented for the degree of Doctor of Philosophy
of the University of Western Australia
Business School
December 2007

ABSTRACT
In the current literature on productivity and economic growth, many studies have
explored the relationship between information and communications technology (ICT)
and growth. In these studies, ICT capital stock is treated as an individual input in the
production process that contributes to output growth. In fact, ICT is found to be a key
driver of productivity growth in the developed economies. However, few empirical
studies deal with China which has in recent years become one of the world’s largest ICT
markets and production centres. The lack of empirical work in this field contrasts
sharply with the wealth of literature which presents background and descriptive studies
of China’s high technology sectors that include the telecommunications, the computer
and the Internet sectors.
This dissertation attempts to fill the void in the literature by examining the role of ICT
in China’s economy over the past two decades. It aims to develop a framework which
emphasizes ICT as a production factor and apply it to interpret China’s economic
growth. The dissertation contributes to the empirical literature by focusing on the
following core aspects underlying the linkage between ICT and economic growth. First,
it attempts to estimate the size of China’s ICT capital stock using the perpetual
inventory method. Second, based on such estimates, the dissertation measures the
contribution of ICT to China’s economic growth by means of a production function
model that segregates ICT from all other forms of capital. Third, the dissertation
examines the impact of ICT on technical efficiency in China’s regions by applying a
stochastic frontier model. Lastly, the dissertation looks at the demand aspect of the ICT
industry by estimating and projecting demand for ICT services, namely, the
telecommunications and computer markets in China.
According to this study, ICT capital is found to be a positive driver for the Chinese
economy, and is responsible for about 25% of the country’s economic growth, although
the percentage varies at different periods. ICT capital is also found to have a positive
and significant impact on technical efficiency in the Chinese regions. However, the
disparity between the coastal and inland regions in terms of technical efficiency scores
is found to be very wide, due to the bulk of ICT investment going into the municipal
cities and coastal provinces. It is also found that China may be facing the beginning of a
period of strong productivity growth driven by increased investment in ICT, especially
i

innovative investment. Furthermore, projections of demand show that the majority of
Chinese citizens will have access to a fixed-line telephone or the mobile phone in five
years from now, while about half of the Chinese population is expected to use the
computer by 2010.
ii

TABLE OF CONTENTS
Abstract i
List of tables vii
List of figures x
Acknowledgements xii
1 INTRODUCTION 1
1.1 Background 2
1.2 Objectives and contributions 3
1.3 Outline of the chapters 4
2 DEVELOPMENT OF THE ICT SECTOR 7
2.1 Definitions of ICT 7
2.2 The telecommunications industry 8
2.2.1 The monopoly era (1949-1994) 9
2.2.2 Telecommunications reform and policies 10
2.2.3 Telecommunications developments after WTO 12
2.3 The computer industry 16
2.3.1 Development of the hardware industry 17
2.3.2 Software development 24
2.4 National science and technology programs 32
2.4.1 Brief overview of China’s science and technology (S&T) policy 32
2.4.2 S&T projects 33
2.4.3 High technology development zones 35
2.5 The ICT market in China 40
2.5.1 Rise of the ICT market 41
2.5.2 China’s ICT trade 49
2.6 Conclusion 50
Appendix to Chapter 2 56
iii

3 ICT, PRODUCTIVITY AND GROWTH: DEBATES AND 59 MEASURES
3.1 Introduction 59
3.2 Debates on the role of ICT 60
3.2.1 ICT and productivity growth: A microeconomic view 60
3.2.2 ICT and productivity growth: A macroeconomic view 62
3.2.3 The ICT productivity paradox 65
3.3 Measuring the contribution of ICT to productivity and economic growth 69
3.3.1 ICT contribution to GDP or output growth 70
3.3.2 ICT contribution to average labour productivity (ALP) growth 71
3.3.3 ICT contribution to TFP growth 73
3.4 Conclusion 75
4 ICT, PRODUCTIVITY AND GROWTH: EMPIRICAL STUDIES 76
4.1 Introduction 76
4.2 ICT contribution to economic growth 76
4.3 ICT and labour productivity growth 89
4.4 ICT and productivity at the industry level 93
4.4.1 ICT-producing vs ICT-using industries 96
4.4.2 ICT contribution to TFP growth 100
4.5 China-related studies 103
4.6 Conclusion 105
5 ESTIMATIONS OF ICT CAPITAL STOCK 107
5.1 Introduction 107
5.2 ICT investment in China 108
5.2.1 Patterns of ICT investment 108
5.2.2 Explaining the growth of ICT investment 114
5.3 Estimation of capital stock 118
5.3.1 A theoretical model 118
5.3.2 Depreciation of ICT capital 119
5.3.3 Measurement of China’s ICT capital stock 120
iv

5.4 Estimation and sensitivity analysis 124
5.5 Conclusion 126
Appendix to Chapter 5 131
6 ICT AND ECONOMIC GROWTH: A NATIONWIDE STUDY 138
6.1 Introduction 138
6.2 ICT, productivity and the Chinese economy 138
6.3 Model specification 145
6.4 Description of data 146
6.5 Estimation results and interpretation 147
6.5.1 Estimation results 147
6.5.2 Decomposition of output growth 148
6.5.3 TFP growth in China 151
6.5.4 Sensitivity analysis 152
6.6 Conclusion 156
Appendix to Chapter 6 158
7 ICT AND EFFICIENCY IN CHINESE REGIONS 161
7.1 Introduction 161
7.2 ICT investment in Chinese regions 161
7.3 ICT and technical efficiency: a review 164
7.3.1 Conceptual issues 164
7.3.2 Efficiency measurement 164
7.3.3 ICT and technical efficiency 169
7.3.4 China-related studies 170
7.4 Modelling framework 171
7.5 Description of data 173
7.6 Estimation results and interpretation 175
7.6.1 Estimation results 175
7.6.2 ICT and technical efficiency in China 177
7.7 Conclusion 180
Appendix to Chapter 7 182
v

8 DEMAND FOR ICT SERVICES IN CHINA 184
8.1 Introduction 184
8.2 Literature review 185
8.2.1 Demand for telecommunications 185
8.2.2 Demand for computers 190
8.3 Modeling demand 191
8.3.1 Modeling demand for fixed-line telecommunications 191
8.3.2 Modeling demand for mobile telecommunications 193
8.3.3 Modeling demand for computers 194
8.4 Data issues 196
8.5 Estimation results 202
8.5.1 Estimation results for fixed-line telecommunications demand 202
8.5.2 Estimation results for mobile telecommunications demand 205
8.5.3 Estimation results for computer demand 209
8.6 Projection of ICT demand 210
8.6.1 Forecasting telecommunications demand 211
8.6.2 Forecasting computer demand 213
8.7 Conclusion and growth prospects 214
9 CONCLUSION 220
9.1 Summary of findings 220
9.2 Future directions of ICT in China 221
9.2.1 Prospects after WTO 221
9.2.2 Moving beyond the Earth: Development of satellite and space 223 technology
9.3 Epilogue 225
BIBLIOGRAPHY 227
vi

LIST OF TABLES
2.1 Market shares of China’s PCs (%) 19 2.2 China’s CPU market, 2001-2004 23 2.3 Market shares of China’s software (%) 27 2.4 Strategic choices for developing China’s software industry 31 2.5 China’s Golden Projects 36 2.6 Geographic distribution of HTDZs in China 37 2.7 Actual and projected output growth rate of computers and office 43
equipment in China and developed countries, 2004-2009 (% change y-o-y)
2.8 Breakdown of Internet usage by services in China, 2002-2006 49 (million users in June of the year)
A2.1 History of China’s computer history, 1956-2004 56 4.1 Sources of growth in GDP and ALP in the US, 1973-2001 79 4.2 Contribution of ICT to output growth in nine OECD countries, 80 1985-2000 4.3 Contribution of ICT to output growth in ten Asian countries, 82 1990-1999 4.4 Contributions to GDP growth 83 4.5 Sources of growth in non-farm output and ALP in the US, 90
1974-2001 4.6 Contribution of ICT to ALP growth in ten Asian economies, 92 1990-1999 4.7 Sources of growth in Canada, 1972-2001 93 4.8 Sources of growth in Australia, 1965-2000 94 4.9 Contributions of ALP growth: Single country study (Unit: %) 95 4.10 Contributions of ALP growth: Cross-country study, 1995-99 96 (Unit: %) 4.11 Decomposition of US labour productivity growth by industry, 98 1987-2000
vii

4.12 Decomposition of ALP growth in Canada, EU and US by industry, 98 1995-2000 4.13 Decomposition of TFP growth in the US, 1959-2001 101 4.14 Decomposition of TFP growth in the US, 1959-2003 102 4.15 Decomposition of TFP growth in Japan, 1975-2003 102 4.16 Contribution of ICT production to TFP growth in the EU and US, 104 1995-2001 4.17 Empirical studies of the contribution of ICT to China’s economic 104 and labour productivity growth 5.1 Growth indicators, 1986-2004 (%) 109 5.2 Depreciation rate of ICT equipment 121 A5.1 Real ICT investment in China, 1984-2004 (using CPI) 131 A5.2 ICT capital stock series in China, 1983-2004 (using CPI) 132 A5.3 Real ICT investment in China, 1984-2004 (using hedonic price indices) 134 A5.4 Alternative ICT capital stock series in China, 1983-2004 135 A5.5 Price deflators 137 6.1 Growth rate of labour productivity in China during the Five-year Plan 142
(FYP) periods (%) 6.2 Regression results of China’s sources of economic growth, 1983-2004 148 6.3 Contributions to output growth in China, 1983-2004 149 6.4 Sensitivity tests using various depreciation rates of ICT capital stock 155 in China 6.5 Results of sensitivity analysis 156 A6.1 Regression results of China’s sources of economic growth, 1983-2004 158 A6.2 Contributions to output growth in China, 1983-2004 159 A6.3 Results of sensitivity analysis 160 7.1 MLE estimates of the stochastic frontier models 177 7.2 Average technical efficiency (TE) in China’s regions 178 A7.1 Real ICT investment in China’s regions, 1996-2004 (million yuan) 182
viii

A7.2 ICT capital stock in China’s regions, 1995-2004 (million yuan) 183 8.1 A comparison of price and income elasticity in the telecommunications 187 market 8.2 A comparison of price and income elasticity in the computer market 191 8.3 Estimation results: fixed-line telephone demand 203 8.4 Estimation results: mobile telephone demand 208 8.5 Estimation results: computer demand 209 8.6 Estimated price and income elasticity for China’s fixed-line telecom 212 demand 8.7 Estimated growth rate of price and income for China’s fixed-line 212 telecom demand 8.8 Estimated price and income elasticity for China’s mobile telecom 213 demand 8.9 Estimated growth rate of price and income for China’s mobile 213 telecom demand 8.10 Estimated price and income elasticity for China’s computer demand 214 8.11 Estimated growth rate of price and income for China’s computer 214
demand
ix
LIST OF FIGURES
2.1 Production of PCs in China, 1990-2005 18 2.2 Growth and forecasts of Chinese software sales, 2000-2009 26 2.3 Telecommunications network capacity in China, 1978-2006 44 2.4 Number of fixed line and mobile subscribers in China, 1986-2006 45 2.5 Fixed and mobile penetration rates in China, 1988-2006 46 2.6 Number of Internet users in China, 1994-2007 47 2.7 China’s trade in ICT products, 1984-2005 51 2.8 ICT and total trade in China, 1984-2005 52 2.9 Growth rate of ICT and total trade in China, 1985-2005 53 3.1 ICT and firm productivity 61 3.2 ICT, productivity and growth 64 5.1 Real ICT investment in China, 1984-2004 110 5.2 Breakdown of ICT investment in China, 1984-2002 111 5.3 Investment in telecommunications and computer industries, 1984-2004 112 5.4 Ratio of ICT investment to total fixed investment in China, 1984-2004 113 5.5 ICT capital stock in China, 1983-2004 127 5.6 Ratio of ICT to total capital stock and output in China, 1983-2004 128 5.7 Growth rate of ICT capital stock and real GDP in China, 1993-2004 129 6.1 China’s tertiary output, 1978-2005 (in 1978 constant prices) 140 6.2 Labour productivity in China, 1978-2005 141 6.3 ICT investment per worker and labour productivity in China, 144 1985-2004 6.4 Output and input indexes in China, 1984-2004 153 6.5 TFP growth in China, 1984-2004 154 7.1 Correlation between GDP per worker and ICT investment per worker 165 in China’s provinces, 2004
x

7.2 Total ICT investment in China’s regions, 1996-2004 166 7.3 Ratio of ICT investment to GDP in China’s regions, 1996-2004 167 7.4 ICT capital stock in China’s regions, 1995-2004 176
7.5 The effect of ICT on technical efficiency in China’s regions, 1995-2004 181 8.1 Growth rate of fixed line, mobile and GDP in China, 1979-2005 198 8.2 Log-linear relationship between fixed line subscribers and ICT price 199 index in China, 1978-2005 8.3 Log-linear relationship between mobile subscribers and ICT price index 200
in China, 1988-2005 8.4 Correlations between fixed-line subscription, mobile subscription, and 201 income per capita in China, 1978-2005 8.5 Forecast of China’s fixed-line telephone demand, 2005-2010 215 8.6 Forecast of China’s mobile telephone demand, 2005-2010 216 8.7 Forecast of China’s computer demand, 2005-2010 217
xi

ACKNOWLEDGEMENTS
I wish to thank my supervisor, Associate Professor Yanrui Wu, for his patience and
excellent supervision in providing guidance in the course of writing this dissertation. He
has contributed invaluable and constructive comments in all aspects of the dissertation,
covering the econometric exercises, thesis structure and checks for grammar errors.
I am eternally grateful to my parents for the emotional and financial support which
helped me see through periods of anxiety and distress. They have been my greatest
supporters, not only in ensuring that I meet my financial needs, but most importantly,
with the love that they showered unceasingly at all times. It is when I live away from
home that I could feel the strong bonding between us, and truly appreciate the sacrifices
my parents have made in bringing me up.
There are several persons who have become an important part of my life in Perth.
Firstly, I will always remember Mr and Mrs Ng who provided accommodation at
Ballajura during the first six months of my stay upon arrival in Perth, by offering a
room at very low cost and treating me like a part of their family. During these four years
of candidature, I am also fortunate to be acquainted with many local residents, including
Mr and Mrs Jeremy Koh, Paul, Elaine, Jivan, Alvin, Irene, ‘Uncle’ Steven and ‘Aunt’
Cecilia, who have helped me feel at home and adapt to the community life within the
shortest possible time span.
In times of financial difficulties, especially when I had to pay my tuition fees before a
semester, I would not have been able to foot some of the bills without the selfless
assistance from Mr P. C. Wong, Liang Fook, Bernard Peh and David Phan. The
dissertation was also completed with financial support from the C. A. Vargovic Bursary
of UWA Business School and a Completion Scholarship of the Graduate Research
School.
Last but not least, there are many others who have lent their encouragement and moral
support that helped me to persevere. Special thanks go to Ian Li, Martin Lim, Cindy
Chia, Eugene Koo, Kenneth Wu and Dawn Low, who have rendered their assistance
with my research work in one form or another, including data entry and proof-reading.
xii
Chapter 1
INTRODUCTION
China’s economy has been growing at an average rate of 8.7% annually in the past two
decades (1986-2005).1 Many studies attribute China’s rapid growth to various macro-
economic factors, such as economic reform, including fiscal reform and exchange rate
reform, the huge domestic market and active participation in globalisation, including
increased international trade and inflow of foreign direct investment. However, few
studies have paid attention to the role of information and communications technology
(ICT) as a potential and increasingly significant source of productivity and economic
growth for this economy. 2 This is surprising as there is an increasing amount of
literature which studies China’s high technology sectors, such as telecommunications,
the computer industry and Internet.
The aim of this dissertation is to examine the relationship between ICT and
China’s economic growth over the past two decades, and thus contribute to the literature.
Since the 1990s, China’s economy has been increasingly stimulated through
development in its ICT sector. Most significantly, China has in recent years become one
of the world’s largest ICT markets and production centres. ICT is therefore expected to
be a crucial driving force for China’s economic growth in the 21st century. In fact,
China today is even looked upon as ‘a leader in technology and innovation’, or a
‘telecommunications superpower’ as recognized by the International
Telecommunications Union (Conan, 2005; Low and Johnston, 2005). In a country
where ICT investment is growing at twice the rate of national output, it would be
interesting to look at the impact of ICT on China’s economy over the past two decades.
1 Based on gross domestic product (GDP) data obtained from China Statistical Abstract 2006. 2 The terms, ICT and IT (information technology), have been used interchangeably in the literature. In general, American scholars use IT in their literature. They include, among others, Brynjolfsson (2003), Dedrick, Gurbaxani and Kraemer (2003), Jorgenson, Ho and Stiroh (2003, 2005), Oliner and Sichel (2000, 2003), and Shao and Lin (2001, 2002); whereas European (and OECD) scholars tend to use ICT. Examples include Atzeni and Carboni (2006), Becchetti, Bedoya and Paganetto (2003), Colecchia and Schreyer (2002), Edquist (2005), Fabiani, Schivardi and Trento (2005), Inklaar, O’Mahony and Timmer (2003), Katsuno (2005), OECD (2004), Oulton and Srinivason (2005), Pohjola (2003) and Susiluoto (2003). Chinese scholars have used ‘ICT’ in recent literature, including Jing (2006), and Meng and Li (2002).
1

1.1 Background
The general impacts of ICT on the economy can be outlined as follows (OECD, 2004).
First, countries that have a strong ICT-production sector such as the US and Finland
tend to enjoy comparative advantage over those with a weaker ICT sector by generating
technological innovation and creating high demand in their economies. The same goes
for countries that have a strong ICT-using service sector as well. Second, ICT
investment contributes to increased ‘capital deepening’, that is, more capital input per
worker, which leads to improved productive efficiency and therefore increases
productivity. Third, the use of ICT produces networking externalities, meaning that the
resulting greater interaction between firms and their customers or other agents will
improve firm performance and increase total factor productivity (TFP) throughout the
economy. In this respect, ICT capital plays a very significant role in the production
process and should be treated as an individual factor input in growth accounting
methods.
The positive relationship between ICT and productivity in developed economies
is well documented, and this applies to developing countries as well.3 Indeed, there is a
consensus of ICT being a key driver of productivity growth. In particular, the revival of
productivity growth in the US since the mid-1990s has been attributed to the
acceleration in average labour productivity (ALP) and total factor productivity (TFP)
growth, driven by the semiconductor industry (Jorgenson, 2001). However, while the
explosive growth of ICT investment and its rising contribution to GDP and labour
productivity growth in the advanced economies has already been extensively
researched, there has been little research on China, despite the giant developing
economy having one of the world’s largest ICT markets and a rapidly growing ICT
infrastructure. OECD (2004) has also acknowledged that there is a lack of research on a
single developing country which can challenge the findings in the current literature that
‘the contribution of ICT to economic growth in developing countries has been minimal’.
My research therefore aims to develop a framework for interpreting China’s economic
growth by examining the neoclassical growth theories with a special emphasis on ICT
as a factor in economic growth.
3 A review of theoretical literature with respect to this issue is discussed in Chapter 3, while empirical evidence gathered in studies of various countries is discussed in Chapter 4.
2

1.2 Objectives and contributions
The main objective of my dissertation is to examine the role of ICT in China’s
productivity and economic growth. First, it aims to present a review of the existing
literature analysing the effect of ICT on productivity and economic growth. Second, it
applies the conventional growth accounting method to assess the impact of ICT on
China’s economy. Finally, the empirical results provide a comprehensive analysis of the
sources of China’s economic growth during a period of rapid ICT development.
The dissertation will make the following contributions to the existing literature.
Its contribution to academia involves mainly the findings generated from the method
applied. One major contribution of the dissertation is the estimation of an ICT capital
stock series for China from the mid-1980s to the first few years of this century, using
various methods of estimation and assumed rates of depreciation, which is not found
anywhere in the literature. The attempt to estimate the size of ICT capital stock in China
will be an addition to current literature. These estimates are based on a consistent set of
data that can be obtained from the statistical sources available.
Next, based on the ICT capital stock series derived from ICT investment, the
dissertation will adopt a production function that segregates the contribution of ICT
capital to economic growth from that of other forms of capital. The impact of ICT on
China’s economic growth will be analysed at two levels. First, the contribution of ICT
capital to economic growth is examined at the national level. The empirical results
obtained from this exercise are also compared with those found in current literature,
which is still very scant.4 Second, the effect of ICT on technical efficiency is examined
at the provincial/regional level by using a stochastic production frontier model.
Finally, the dissertation attempts to estimate the demand functions for ICT usage
(namely, demand for telecommunications services and computers) and project the
growth of the ICT market in China for the next five years. Just like the literature
examining ICT contributions to growth, very few studies have attempted to estimate the
demand for telecommunications and computer markets in China. The dissertation will
4 As will be noted in chapter 4, there are currently only two empirical papers that examined the contribution of ICT capital to China’s economic growth.
3

estimate the elasticity of demand for ICT with respect to price and income, which can
be compared with findings using data from other parts of the world.
1.3 Outline of the chapters
The dissertation is broadly divided into three major sections, dealing with descriptive,
theoretical and empirical discussions. The descriptive section provides an introductory
background of the concept of ICT and an overview of ICT development in China
(Chapters 1 and 2). The theoretical section embarks on a review of current and recent
literature presenting debates concerning the relationship between ICT and economic
growth, as well as empirical evidence from various countries or regions around the
world (Chapters 3 and 4). The empirical section is focused mainly on analysis of the
role of ICT in China’s economy using data obtained from Chinese statistical sources
(Chapters 5 to 8). Finally, the thesis rounds up with a concluding chapter that
summarises the empirical findings and discusses growth prospects for the Chinese ICT
sector in the near future.
Chapter 2 provides an account of the development of the ICT industry in China
and a review of the science and technology (S&T) programs that have been
implemented to promote the development of this sector. It first defines what the term
‘ICT’ encompasses, and provides an overview of the ICT market in China. Next, the
chapter outlines the development of the telecommunications industry in China, followed
by a background review of the computer industry, which is made up of the hardware
and software sectors. Finally, the chapter provides an account and review of the major
policies that have been implemented to promote the development of science and
technology (S&T) in China.
Chapter 3 presents a review of the conceptual debates and measurement issues
associated with ICT, productivity and economic growth. The chapter will explore how
investment in ICT affects productivity at the firm, industry and country level. It begins
with an outline of evidence that shows how increasing ICT investment, especially in the
US and other developed countries has resulted in the recent revival of productivity
growth in these countries. Besides those supporting the positive link between ICT and
productivity, there are studies that question the real impact of ICT on productivity. This
is followed by a discussion of the theoretical frameworks used to measure the
4

contribution of ICT to labour productivity and economic growth, where ICT capital is
distinguished from other factor inputs in the growth accounting exercises.
Chapter 4 continues to review the empirical literature on the contribution of ICT
to economic growth. While current literature focuses mainly on empirical survey in the
developed countries, there is only a handful of research work that examines the
developing countries, including China. The empirical results for various countries are
then presented to illustrate the differing contribution of ICT capital among the
economies.
Chapter 5 is the starting point for empirical exercises in the dissertation. It aims
to estimate the ICT capital stock series in China using the perpetual inventory method.
The estimates are based on data of investment in telecommunications and computer
equipment for the period of 1983 to 2004. This will involve, first, estimating the initial
value of ICT capital stock in 1983, and second, estimating the capital stock series
assuming certain rates of depreciation throughout the entire period. The chapter will
conclude with a sensitivity analysis of capital stock estimation using different rates of
depreciation. The ICT capital stock series generated will be used for empirical exercises
in the subsequent chapters.
Chapter 6 focuses on assessing the contribution of ICT capital as a production
factor to economic growth in China. This chapter will add to the literature by focusing
on China, using the estimates of ICT capital stock series obtained in Chapter 5. This
chapter comprises three main parts. First, it describes the relationship between ICT,
productivity and economic growth in China by comparing the pattern of growth in ICT
capital and labour productivity during the past twenty years or so. Second, the chapter
attempts to specify an appropriate model to examine the contribution of ICT and other
factor inputs to economic growth in China. Finally, the chapter will test the robustness
of the model by comparing empirical results based on different estimates of the ICT
capital stock. Conclusions will then be drawn about the role of ICT in China’s economic
growth over the past two decades.
Chapter 7 seeks to estimate the regional ICT capital stock and to examine the
impact of ICT capital on technical efficiency in China’s regions. It contributes to the
literature by looking at the pattern of disparity in ICT investments in China. It will
5

provide a background review of how the pattern of regional disparity in China has
changed as far as ICT investment is concerned. The chapter attempts to look at the
impact of ICT on regional growth and technical efficiency in China. No previous work
in this area has been reported.
Chapter 8 looks at the demand side of the ICT industry by estimating demand
functions for ICT services in China. Specifically, this chapter attempts to estimate a
demand function for the telecommunications and computer markets in China,
respectively. It has two main objectives: first, to estimate the demand elasticity of ICT
services and compare them with those of other countries; second, to project demand for
ICT services in the near future till 2010. It contributes to current literature that has
largely focused on the supply-side growth accounting and hence the contribution of ICT
capital/investment to economic and labour productivity growth.
Finally, the dissertation concludes with a discussion of outlook and growth
prospects for the Chinese ICT industry in the near future. The chapter first summarises
the empirical findings from the previous chapters. It will next discuss the direction of
growth for the ICT sector after the first few years of accession into WTO whereby
China is expected to fulfil its entry commitments, and conclude by highlighting some
important areas where growth will be focused on.
6

Chapter 2
DEVELOPMENT OF THE ICT SECTOR
This chapter provides an overview of the development of the information and
communications technology (ICT) sector in China. It outlines the historical
development as well as government policies introduced to encourage and promote
development of this sector. The chapter begins by looking at various definitions of the
term ‘ICT’ used in current literature and provides an assessment of the ICT market in
China. This is followed by an outline of the development of the telecommunications
industry in China and a background review of the computer industry, which is made up
of the hardware and software sectors. Finally, the chapter presents a review of the major
policies that have been implemented to promote the development of science and
technology (S&T) in China. The latter is vital to the development of the ICT sector.
2.1 Definitions of ICT
In most literature, the term ICT is used interchangeably with information technology
(IT) although slight variations exist. ICT is broadly defined in the literature to include
the telecommunications, computer hardware and software sectors. According to the
Information Technology Agreement (ITA) of the World Trade Organization (WTO), IT
includes telecommunications equipment, computers and semiconductors. 1 The ICT
sector was defined by the OECD in 1998 as ‘the combination of manufacturing and
service industries that capture, transmit, and display data and information electronically’
(Jing, 2006). Similarly, ICT is divided into three broad categories according to its use,
namely, computing, communication as well as the transmission of data and
communication via Internet (Quibria et al., 2003).
In the empirical literature, the term ‘IT’ investment generally covers ‘computer
hardware, software and communications equipment’ (Shinjo and Zhang, 2003;
Miyagawa et al., 2004; Timmer and van Ark, 2005). Miyagawa et al. (2004) included a
range of communications and electronic equipment in their definition of ‘IT capital
goods’, such as telecommunications systems, radio, consumer electronic equipment as 1 Following the conclusion of the Ministerial Declaration on Trade in Information Technology Products at the Singapore Ministerial Conference in December 1996, the ITA entered into force with the first stage of reduction in tariffs for IT products that took place on 1 July 1997. See WTO website, http://www.wto.org/English/tratop_e/inftec_e/itaintro_e.htm.
7
well as electrical and optical instruments. In another study of the Japanese economy,
Jorgenson and Motohashi (2005) defined ‘IT investment’ in accordance to the Japanese
national accounts, which consists of computer equipment (including computer
peripherals), and communications equipment (including television and radio, video, and
cable and wireless communications devices). However, Timmer and van Ark (2005)
used the term ‘ICT investment’ to include computers, communications equipment
(which comprises radio, TV, telecommunications and photocopiers) and software. In
examining the role of ICT in Australia’s economy, Diewert and Lawrence (2005)
defined ICT capital to consist of computers, software and electrical machinery.
In China, the ICT industries defined above are encompassed in the term
‘electronic industry’, used by the Ministry of Information Industry (MII) and in official
statistical publications, which also includes electronic consumer goods such as
televisions and radio. Time series data that is available from statistical sources
published by MII are investment in the ICT manufacturing sector. As listed in Katsuno
(2005), the ICT sector covers the following category of products – telecommunications
equipment, broadcasting equipment, computer equipment and software, household
electronics, electronic measuring instruments, electronic devices, electronic parts and
equipment, and other materials used for the production of electronics. The computer
sector is further comprised of personal computers (PCs), PC peripherals (such as disk
drives and printer), PC parts (such as motherboard, memory card, power supply units
and other parts), as well as software (consists of operating system, intermediate and
application software). Based on the data available from Chinese statistical sources, the
ICT sector to be discussed in this dissertation covers the telecommunications (excluding
broadcasting equipment and household electronics) and computer sectors (including
software).
2.2 The telecommunications industry
This section provides an overview of development of telecommunications policy in
China by examining how telecommunications policies have changed since the
beginning of economic reform to meet changes in market demand and the need to open
up the telecommunications market to foreign competition. The main focus of this
section is on developments in the Chinese telecommunications industry after entry into
the WTO, as current literature covering developments during the reform period is
8

already substantial (Loo, 2004; Lu, 2000a; Lu and Wong, 2003; Mueller and Tan, 1997;
Wong, 2002). Finally, the section rounds up with an overview of the growth of the
telecommunications market in China, using the most recent statistical data available.
2.2.1 The monopoly era (1949-1994)
The historical development and changing policies of the telecommunications industry in
China have been evaluated by several authors in the recent literature. An account of the
achievements up to the late 1990s is covered in detail by Lu (2000a) and Wong (2002).
These studies began with the formation of the Ministry of Posts and
Telecommunications (MPT) on 27 September 1949, stretching through the Cultural
Revolution (1966-76) and beginning of reform till the end of the 1990s. Other authors
have examined the evolution of China’s telecommunications policy in response to
changing market demands, bureaucratic reform and negotiations for entry into the WTO
(Mueller and Tan, 1997; Lu and Wong, 2003). As such, this dissertation will only
provide a brief outline of changes in China’s telecommunications policy with materials
drawn from the more recent studies.2
Loo (2004) analysed the changing telecommunications policies in China since
the opening by breaking the period of study into four stages – pre-1994, 1994-97, 1998-
99 and 2000 onwards, each period reflecting the change in the way different forces were
influencing telecommunications development. During the 1980s, the primary goal of the
MPT was the provision of universal service of fixed line telephones to the population at
large (Loo, 2004). The MPT enjoyed an almost exclusive monopoly of the public
telecommunications network, with other private and independent networks maintained
by some powerful governmental bodies, such as the Ministry of Railway (MOR), the
Chinese Academy of Sciences (CAS) and the State Education Commission (SEC).
Telecommunications was made a strategic priority during the Seventh Five-Year Plan
(1986-2000) when China placed emphasis on high technology as a means to speed up
telecom development. It was in 1987 that the mobile phone first came into use when
China began its utilization of cellular technology with the analogue TACS (Total
Access Communications System) (Wong, 2002).
2 The main focus will be on the recent developments related to new technologies in the few years after accession into WTO (in section 2.2.3 of this dissertation).
9

China entered the Information Age only in 1994 following a breakthrough in
Sino-American talks concerning the connection of the Chinese network with the
Internet in April of that year (Loo, 2004). Prior to this development, the first computer
networking activities in China took place when CAnet (China Academic Network) was
successfully established on September 20, 1987 between the Institute for Computer
Applications (ICA) in Beijing and Karlsruhe University in Germany.3 Subsequently,
Internet access was extended to the research community from CAS and the universities
in Beijing, Chengdu, Shijiazhuang, Shanghai and Nanjing, following the completion of
the China Research Network (CRN) in May 1989 (Tan, Mueller and Foster, 1997; Loo,
2004). The implementation of the Golden Bridge Project in March 1993 was a further
step initiated by the central government to develop an advanced telecommunications
infrastructure throughout China.4 It can thus be seen that up till the mid-1990s, the
development of the Chinese telecommunications industry was largely led by state
initiatives.
2.2.2 Telecommunications reform and policies
During the second half of the 1990s, the evolution of China’s telecommunications
reform and policies could be seen as a result of the interplay between foreign pressure,
market forces brought about by increased demand and the ‘power tussle’ between
various ministries and government bodies. The Chinese central government hopped
onto the bandwagon of worldwide liberalization of the telecommunications industry by
breaking the monopoly of the MPT and establishing new players in their domestic field.
A major milestone in the history of Chinese telecommunications took place in July 1994
when the MPT was renamed as China Telecommunications Corporation (China
Telecom) and at the same time, a new firm, China United Telecommunications (China
Unicom) was set up to bring in competition to the incumbent monopoly.5 However,
competition did not truly exist as China Telecom still owned the only fixed line network
in China, while China Unicom had a restricted share of the mobile services – less than
5% at the end of 1999 (Wong, 2002). Nevertheless, this was a sign of mounting foreign
3 China Internet Network Information Center (CNNIC), http://www.cnnic.net.cn/en/index/0O/ index.htm. For more details of the origin of China’s Internet connection, refer to “How China was Connected to the International Computer Networks”, Willkommen, http://www-ks.hpi.uni-potsdam.de/ index.php?id=76. 4 The Golden Bridge Project is the first of several “Golden Projects” that have been implemented to modernize the ICT infrastructure in China. Refer to section 2.4 of this chapter for further details. 5 China Unicom was established as a joint venture between the Ministry of Electronics Industry (MEI), the Ministry of Electrical Power (MEP), the Ministry of Railway (MOR) and thirteen autonomous state-owned enterprises (Lu and Wong, 2003).
10

pressure together with surging domestic demand to open up the monopolistic Chinese
telecommunications industry to competition.
Rising market demand has also prompted a rapid expansion of the Internet
infrastructure, which consisted of: the China Science and Technology Network
(CSTNet) which began construction in 1989 and was connected to the global Internet
network in 1994; the ChinaNet which is the primary nationwide commercial network
run by China Telecom and was completed in January 1996; the China Education and
Research Network (CERNet) which provided network connection to academic
institutions in China by October 1994; and the Golden Bridge Network (GBNet) which
was operated by Jitong Communications and completed in 1996.6
The influence of foreign pressure became more visible towards the end of the
1990s as China sought entry into the WTO. As it became apparent that membership into
the world body would not be realised unless the telecommunications industry was
unlocked to foreign investment, the Chinese government took the first step towards
opening up through ministerial restructuring in March 1998 by merging the MPT and
Ministry of Electronic Industry (MEI) to form the Ministry of Information Industry
(MII), which became the ‘super-authority’ overseeing the ICT industry in China.
The following three years (1999-2001) saw an influx of new competitors,
although only in small numbers. First, China Netcom (CNC) was established in April
1999 as the fourth telecommunications operator in China, for the construction of a
broadband Internet Protocol (IP) network (CNCNet). A major restructuring of China
Telecom took place when its code division multiple access (CDMA) Great Wall
Network and Guoxin Paging branch were merged with China Unicom, in which the
incumbent still retained the local fixed line network. The next player to enter the
telecommunications field was China Railway Telecommunications Corporation (China
Railcom) in June 1999. China Railcom had its own exclusive communications network,
6 Other networks include the China Uninet (launched by China Unicom in July 2000), the CNCnet (launched by China Netcom in December 2005), the China International Economy and Trade Net (CIETNet), the CMNet (provided by China Mobile), the China Great Wall Net (Cgwnet), the China Satellite Net (CSNet) and the China Next Generation Internet (CNGI) which is a five-year plan initiated for the implementation of IPv6 (Internet Protocol version 6), scheduled for showcase at the 2008 Olympic Games in Beijing. See China Internet Network Information Center (CNNIC), 10th - 18th Statistical Survey Report on the Internet Development in China (July 2002 - July 2006), http://www.cnnic.net.cn/en/index/0O/index.htm.
11

and was subsequently granted a license to provide the fixed line, Internet and IP
telephony services in 2001 (Lu and Wong, 2003).
Further restructuring of the Chinese telecommunications industry occurred with
the ‘second divestiture’ (a term coined by Lu and Wong, 2003) of China Telecom in
December 2001, almost immediately after the entry of China into the WTO. China
Telecom was restructured geographically when it was to operate only the network of 21
provinces in south China and the western autonomous regions, with the remaining 10
provinces in north China to be taken over by the merger of China Netcom and Jitong
Communications. Finally, the most recent player to join the ‘telecom league’, China
Satellite Communications Corporation (China Satcom), was formed in December 2001,
through the merger of satellite-based telecommunications companies such as China
Telecommunications Broadcast Satellite Corporation, China Orient Telecom, China
Space Mobile Satellite and ChinaSat of China Telecom (Hong Kong) (Lu and Wong,
2003).
Despite rising demand for further deregulation and calls for foreign competition,
the telecommunications field in China still remain almost ‘exclusively Chinese’, over
which the State has majority ownership and control. As of 2006, there are six telecom
operators in China, namely, China Telecom and China Netcom (operating the fixed-line
network), China Mobile and China Unicom (mobile network), China Railcom and
China Satcom.
2.2.3 Telecommunications developments after WTO
This final section examines how further developments in the telecommunications
industry in China after entry into WTO are driven by new technologies. The most recent
developments in the Chinese telecom field are mainly related to the deployment of 3G
(third generation) mobile standards. Currently, among the four leading
telecommunications network operators in China, the mobile carriers, namely China
Mobile and China Unicom, are providing 2G (second generation) and 2.5G mobile
services (i.e. GSM and CDMA) respectively; whereas the fixed-line carriers, China
Telecom and China Netcom, are providing an alternative form of wireless service
known as Xiaolingtong (meaning ‘little smart’ in Mandarin) with limited geographical
12
coverage (Yuan et al., 2006).7 As convergence between the telecommunications and
traditional information technology industries takes shape, the Chinese government and
enterprises alike now recognise the increasingly significant role of 3G technologies in
the race to boost competitiveness.
One of the major breakthroughs in the history of China’s telecommunications
industry occurred when a leading Chinese telecom equipment manufacturer, Datang
Technology8, together with Siemens of Germany, developed the Chinese 3G standard
known as Time Division-Synchronous Code Division Multiple Access (TD-SCDMA),
which was approved by the International Telecommunications Union (ITU) in May
2000 as one of the internationally-accepted 3G mobile communications standards,
rivalling W-CDMA (Wideband CDMA) adopted by Europe and CDMA2000 used in
the US, Japan and Korea. 9 However, it was only in October 2002 that Datang
Technologies obtained support from the Chinese government when the MII announced
an allocation of 155MHz of Time Division Duplex (TDD) resource to TD-SCDMA;
and at the following week, seven telecommunications equipment manufactures –
namely, Datang Technology, Huawei Technology, Huali Group, Southern Hitech,
Shenzhen Zhongxin Technology (ZTE), China Electronics Group and China PuTian
Group, formed the ‘TD-SCDMA Industrial Alliance’ with support from three
government agencies – the State Planning Commission, the MII and the National
Science and Technology Department (Fan, 2006).10
Another significant milestone in Chinese telecommunications development is
exemplified in the achievements of another domestic telecom equipment manufacturer,
Huawei Technology which was established in 1988. After launching its first GSM
7 ‘GSM’ stands for ‘Global System for Mobile Communications’ and ‘CDMA’ stands for ‘Code Division Multiple Access’. Xiaolingtong is based on the Personal Handy Phone System (PHS) technology which originated in Japan in 1995. For more details on a description of the Xiaolingtong technology, refer to Yuan et al. (2006). 8 Datang Telecom Technology Corporation (DTT) was established in the Haidian district of Beijing on September 21, 1998. It is a leading communications equipment manufacturer and provider of a wide range of telecommunications services in China. See DTT website, http://www.datang.com/. 9 “PacificNet Announces 3G Strategy at ITU Telecom World 2006”, TMCnet (December 6, 2006), http://www.tmcnet.com/usubmit/2006/12/06/2148540.htm. 10 The delay in announcement of support from MII was attributed to the fact that TD-SCDMA had less support and R&D investment compared with the other standards, WCDMA and CDMA2000 which are favoured by China Mobile and China Unicom respectively. WCDMA is also supported by major multinational companies such as NTT DoCoMo of Japan, and Ericsson and Nokia of Europe; while CDMA2000 is mainly supported by North American and Korean companies, including Qualcomm, Nortel Networks, Motorola and Samsung. Leading Chinese companies such as Huawei and ZTE have invested in WCDMA and CDMA2000 respectively. For more details, see Fan (2006).
13
equipment in 1997, the company started R&D investment in 3G, i.e. WCDMA in 1998.
In 2002, Huawei established the first 3G Open Lab with NEC in China and introduced
WCDMA core network equipment based on soft switches at ITU (Fan, 2006). Two
years later, Huawei established a joint venture with Siemens to develop the TD-
SCDMA mobile communications technology to serve the Chinese market.11 Adding
further glory to its record of achievements to date, the company obtained three awards
at the 2006 Frost & Sullivan Asia Pacific ICT Awards – namely, ‘2006 Vendor of the
Year’, ‘2006 Optical Vendor of the Year’ and ‘2006 Broadband Equipment Vendor of
the Year’.12
In anticipation of such a trend towards greater application of 3G technology in
the future, nine leading Chinese telecom institutions, namely, the telecom operators –
China Telecom, China Mobile, China Unicom and China Netcom; equipment providers
– Huawei Technologies, ZTE Corporation, Putian Corporation and Vimicro Corporation;
and a research institute – the China Academy of Telecommunication Research of the
MII, formed a mobile multimedia technology alliance (MMTA) in October 2004. The
MMTA alliance will serve to ‘boost technical innovation and development of standards
and applications in the booming mobile multimedia industry, and thereby boosting the
competitiveness of Chinese enterprises in applying upcoming 3G technologies’ (Xiao,
2004).
The key lies in greater co-operation among the Chinese enterprises if they are to
grab a larger market share facing tense competition with international rivals. The mobile
communication multimedia represented by 3G service is expected to attract newcomers
into the industry, with an increasingly wider range of services coming onto the scene,
including the mobile game services, mobile photo services, mobile colour message
services, mobile short message services as well as other existing services (Xiao, 2004).
The latest sign of the ambition by Chinese companies to expand their influence into the
international telecommunications field took place in May 2006, with China Mobile
signing a US$5.3 billion deal to acquire (its first ever overseas acquisition) Millicom
International Cellular SA of Luxembourg, which operates mobile services in 16
countries (Singer and Dean, 2006). 11 Huawei website, http://www.huawei.com/. 12 Frost & Sullivan is a global consulting company for emerging high technology and industrial markets. Huawei had also been awarded “Vendor of the Year” in 2005 based on its strong performance such as revenue growth, new customer wins and innovative strategy. See “Huawei Technologies Bags Three Awards at the 2006 Frost & Sullivan Asia Pacific ICT Awards”, M2 Presswire (Coventry: June 19, 2006).
14
Yet, despite the hype about the competitive advantages that 3G will bring, it
took almost six years since the recognition by ITU in 2000 for an official announcement
from the Chinese authorities concerning the long-awaited issue of 3G licences to the
leading telecommunications operators in the country. On January 20, 2006, the MII
formally announced TD-SCDMA to be the country’s standard of 3G mobile
communications.13 The Chinese government has taken a cautious approach to this issue
as it has invested heavily in developing TD-SCDMA technology, spending about 55
billion yuan (US$6.63 billion) in 2005. It is estimated that more than one trillion yuan
would have to be spent on building the 3G network alone if all the four leading Chinese
telecommunications operators were to be awarded with 3G licenses (Yuan et al., 2006).
Nevertheless, it was a significant development when the nation’s two largest
fixed-line operators, China Telecom and China Netcom, were licensed by the MII in
May 2006 to obtain the number segment prefixed with 188 and 189 respectively in their
test 3G networks in the northern city of Baoding and eastern city of Qingdao. In
addition, China Mobile and China Unicom have already been permitted to use numbers
prefixed with 159 and 153 respectively in the southwestern municipality of Chongqing,
beginning in June 2006.14
The ‘big news’ eventually came when MII Minister, Wang Xudong, seizing the
opportunity at the ITU Telecom World 200615, announced that China would issue 3G
licenses ‘very soon’, and assured that it would be on time for operators to ‘offer 3G
services during the 2008 Olympic Games in Beijing’.16 The 3G licenses are expected to
be issued no later than the first quarter of 2007 to ensure 3G networks to be operational
before the Games begin (Perez, 2006). China Mobile has been reported to be planning
the operation of the TD-SCDMA network in Beijing and Qingdao, before implementing
it in the provincial capitals of the coastal areas and finally in the inland provincial
capitals.17
13 “PacificNet Announces 3G Strategy at ITU Telecom World 2006”, TMCnet (December 6, 2006), http://www.tmcnet.com/usubmit/2006/12/06/2148540.htm. 14 “China Telecom, China Netcom obtain 3G number segment”, SinoCast China Business Daily News (London: May 10, 2006).
15 Held on 4-8 December, 2006, at AsiaWorld-Expo, Hong Kong, China, http://www.itu.int/WORLD2006/ 16 “PacificNet Announces 3G Strategy at ITU Telecom World 2006”, TMCnet (December 6, 2006), http://www.tmcnet.com/usubmit/2006/12/06/2148540.htm. 17 “China Mobile prepares for TD-SCDMA”, SinoCast China Business Daily News (London: January 2, 2007).
15

Finally, the growth of China’s telecommunications can be further boosted by
tapping on the resources of foreign companies. In this respect, the Chinese government
has taken a proactive approach when the National Development and Reform
Commission (NDRC) signed a deal with SK Telecom, the leading provider of mobile
communications services in Korea, in August 2006, to develop the TD-SCDMA for 3G
mobile telecom by setting up a joint centre for research in China. The agreement was
followed up with the joint construction of a TD laboratory between the Korean
company and Datang Technology, with the possibility of ZTE Corporation joining the
partnership to build the first trial TD-SCDMA network in the first quarter of 2007.18
The Chinese telecommunications market received an added boost with news of a
merger between Lucent Technologies of the US and Alcatel of France on November 30,
2006, both of which have strong ties to Datang Technology.19 The former had signed a
deal for TD-SCDMA in November 2005, while the latter had signed a Memorandum of
Understanding (MOU) with the Chinese company in November 2006 (before the
merger) which will reinforce its commitment to invest in the development of TD-
SCDMA in China.20
2.3 The computer industry
This section traces the development of computer hardware and software in China. In
particular, it explores the various government-led policies implemented to foster
development in the computer industry as well as the shift in the focus of policies in
18 “SK Telecom, Chinese government sign 3G services deal”, Asia Pacific Telecom 10 (10), October 2006; “Datang to build 1st TD network in South Korea”, USITO website, http://www.usito.org/news_dl.php?id=76. 19 Based in Paris, Alcatel-Lucent will have the combined revenue of approximately Euro €21.3 billion (US$28 billion) with 79,000 employees in more than 130 countries. With the merger, the company has a global leading position in a wide spectrum of ICT services, such as Internet Protocol (IP) television, broadband access, carrier IP and 3G technologies, including CDMA2000, WCDMA and TD-SCDMA. See Alcatel-Lucent website, http://www.alcatel-lucent.com/. 20 Alcatel and Datang first signed an agreement to invest in TD-SCDMA two years earlier, in November 2004. It is also estimated that the former Lucent had invested a total of US$2.9 billion in China between 1995 and 2005, while the former Alcatel invested more than US$1 billion in the mainland in 2005 alone. See “Lucent Takes IMS (IP Multimedia Subsystem) to China”, Light Reading (November 16, 2005), http://www.lightreading.com/document.asp?doc_id=84416; “Alcatel and Datang Group to advance TD-SCDMA development”, Premium mobile technologies (November 30, 2006), http://premium-mobile.com/content/alcatel-and-datang-group-to-advance-td-scdma-development/. “Alcatel-Lucent to boost mainland investment: Communications giant will concentrate on the enterprise market in China”, South China Morning Post (Hong Kong: December 5, 2006).
16

17
recent years in adaptation to changing consumer demands and the competitive
environment.
2.3.1 Development of the hardware industry
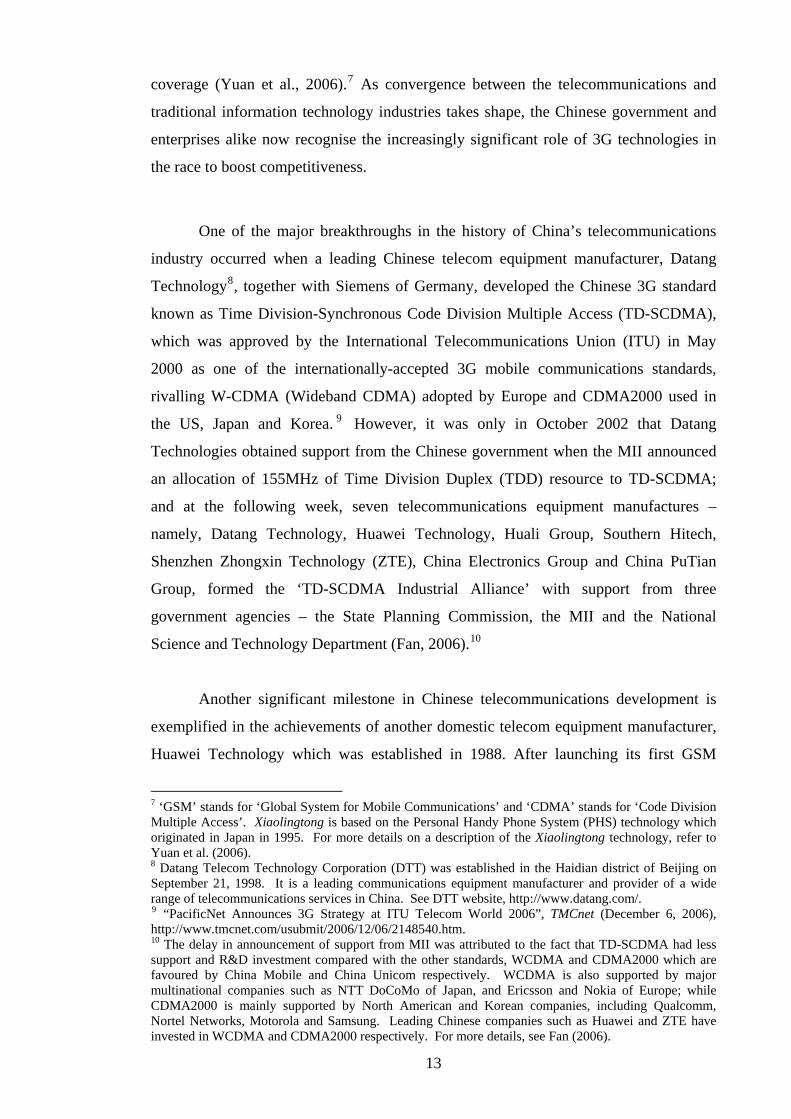
China is now the world’s second largest PC (personal computer) maker and is expected
to become the world’s largest by 2010 (Kshetri, 2005). The production of PC in China
has jumped almost 100 times since 1995, from less than one million units in that year to
80 million in 2005 (Figure 2.1). This is an amazing achievement, considering the fact
that China had only 500,000 PCs for more than 1.2 billion people in 1990 (Kraemer and
Dedrick, 2002b). The sales of Chinese PC (including desktops and laptops) grew
annually by about 15% between 2002 and 2004.21 In 2004, the desktop and laptop PCs
accounted for 88% and 12% of the Chinese PC market respectively. The market was
dominated by the largest domestic firm, Lenovo Group Ltd, holding 25% of the market
share. The largest shares held by foreign companies were Dell Inc. and IBM
Corporation, holding about 7% and 5% respectively (Table 2.1).
There has been less discussion on the history of the computer hardware industry
in China compared with that of the telecoms industry. The development of the computer
industry had been a priority in the agenda of the science and technology development
policies since 1955. An overview of the historical development of computers in China
has been discussed in Witzell and Smith (1989). The history of China’s computer
industry could be said to begin with the founding of its first national computer research
institution, the Institute of Computing Technology within the Chinese Academy of
Sciences (CAS) in 1956.22 With assistance from the Soviet Union, in August 1958, the
CAS Institute built the first generation of computers in China, known as Model 103.23
Such assistance was however ended in 1960 which rendered China with only the ‘self
reliance’ path (Lu, 2000b).
The Cultural Revolution of 1966-76 disrupted the development of the national
economy as well as the computer industry. Yet surprisingly, China seemingly was
closing the gap in computer achievements with the Soviet Union. For instance, by 1977,
the CAS Institute developed the model 013, ‘a third generation computer capable of 2
21 “China PCs 2005”, Snapshots International, March 2005. 22 The Institute of Computing Technology will be referred hereafter as ‘CAS Institute’. 23 Institute of Computing Technology website, http://www.ict.ac.cn/.

0
10
20
30
40
50
60
70
80
90
1990 1991 1992 1993 1994 1995 1996 1997 1998 1999 2000 2001 2002 2003 2004 2005
Mill
ion
units
-40
-20
0
20
40
60
80
100
120
140
%
PC (million)Growth rate (%)
Figure 2.1 Production of PCs in China, 1990-2005
18
Source: State Statistical Bureau, China Statistical Abstract 2006, Beijing.

million ops compared with the 1976 RIAD 1060 of the Soviet Union which was only
capable of 1.5 million ops’, the reason being that the Soviet Union ‘chose to concentrate
on producing R&D computers for military use’ (Witzell and Smith, 1989: 37). Yet, in
spite of the disruptions caused by the Cultural Revolution, the computer industry
seemed to overcome the economic turmoil with impressive achievements, as reported
by Witzell and Smith (1989: 41) and listed in Appendix 2.1.
Table 2.1 Market shares of China’s PCs (%) Company 2004 Lenovo Group Ltd Founder Electronics Co. Tsinghua Dongfang Co. Ltd Dell Inc. IBM Corporation Hewlett-Packard Co. Others Total
25.1 9.9 7.8 7.2 5.1 4.8 40.1 100
Source: “China PCs 2005”, Snapshots International, March 2005.
During the pre-reform era, computers in China were not produced for
commercial use until 1973. Computer models developed by various ministries and
universities were used mainly for military and scientific purposes such as developing
the atomic bomb, satellites and weather-forecasting models (Lu, 2000b). As China
sought to revive its economy from the shocks of the Cultural Revolution, the Chinese
government laid out the ‘Four Modernizations’ – Agriculture, Defence, Industry, and
Science and Technology, as the pillars of national economic revival and development.
Consequently, a National Plan for the Development of Science and Technology (1978-
85) emerged at the National Science Conference on March 18, 1978, where Fang Yi (a
member of the Central Committee of the Chinese Communist Party) spoke: ‘The eight-
year outline plan draft gives prominence to the comprehensive science and technology
spheres … agriculture, energy, materials, electronic computers, lasers, space, high
energy physics and genetic engineering.’ Going on further, Fang Yi emphasized that
‘China must make a big new advantage in computer science and technology, and should
lose no time in solving the scientific and technical problems in the production of large
scale integrated circuits (ICs), and make a breakthrough in the technology of ultra-large
scale ICs….. We aim to acquire, by 1985, a comparatively advanced force in research in
computer science and build a fair size modern computer industry… A number of key
19

enterprises will use computers to control the major processes of production and
management’ (Witzell and Smith, 1989: 39).
As economic reform steered the whole country towards a more open and market-
oriented economy, a similar fashion was occurring in the reform of Chinese science and
technology policies that helped further expansion of the computer industry. There was
evident recognition by Chinese leaders from national to local levels of a larger role of
foreign investment and multinational corporations in the development of high
technology in China, thus paving the way for less dependence on government-led
planning initiatives and more on individual innovation and entrepreneurship. China’s
drive to commercialise its computer industry formally began in 1986 with an ambitious
effort to create an electronics industry which was listed as a ‘pillar industry’ for
developing the national economy in accordance with the Seventh Five-Year Plan
(Kraemer and Dedrick, 2002b).
If ‘government involvement’ was the key characteristic defining the
development process during the reform period of the 1980s and early 1990s, then
‘learning’ and ‘innovation’ have been the driving forces behind the rapid growth of the
Chinese computer industry since the 1990s.24 In his study of how indigenous Chinese
computer companies were catching up in the high technology sector, Lu (2000b) noted
that the traditional model of technology transfer which has been used to describe the
export-led technology learning in the East Asian Newly Industrialized Economies
(NIEs) could not explain China’s rapid catch-up in high technology sectors such as
telecommunications equipment and computers. While technology transfer normally
follows a ‘bottom-up’ linear sequence in four stages – cheap labour assembly of
imported kits, original equipment manufacturing (OEM) or the localization of parts and
components, original design manufacturing (ODM) or product redesign, and original
brand manufacturing (OBM) or product design, “learning” assumes ‘top-down’
approach as it could start off at any stage such as product design or redesign.25 Such a
mode of technology learning is also known as “innovation” by definition (Lu, 2000b).
A comparison of China’s experience in developing its computer industry reveals
some similarities as well as differences between them and other developing countries. 24 ‘Learning’ is defined as a process of acquiring the capability to develop technological resources and converting them to commercial uses (Lu, 2000b: 3). 25 The terms ‘OEM’, ‘ODM’ and ‘OBM’ originated from Hobday (1995).
20

China’s policies are said to resemble the developmental approach of Japan and the East
Asian NIEs such as Korea, Taiwan and Singapore with strong support from the
government which combines the promotion of exports to achieve global
competitiveness with strong efforts to develop indigenous technological capabilities
such as building an information infrastructure as well as providing financial and
technical aid to domestic companies (Kraemer and Dedrick, 2002b). In fact, China’s
export-oriented policy turned it into a net computer export for the first time in 1994
when it established export-processing zones and offered tax incentives to attract foreign
investment (Kraemer and Dedrick, 2002b).
However, China’s developmental path differs from other developing countries in
certain ways. First, unlike the East Asian NIEs which rely primarily on export markets,
China enjoys the benefit of having a huge domestic market which ‘provided a stimulus
for indigenous technological innovations for processing Chinese characters in computer
systems’ (Lu, 2000b). China is also different from many developing countries in the fact
that it had established an extensive S&T infrastructure during the central planning era.
The latter enables Chinese companies to tap on both domestic as well as foreign sources
of technology. Finally, and perhaps most importantly, China has been able to attract
foreign investment on terms favourable to the host country – a strategy which is less
successful in many other developing countries. With the lure of their huge market size,
China ‘could exchange market access for foreign technology, by requiring foreign
multinationals to develop joint ventures with domestic companies and allowing
Taiwanese companies to set up production networks in the mainland to support
domestic companies’ (Kraemer and Dedrick, 2002b).
For instance, IBM was unable to penetrate the Chinese PC market until it set up
a joint venture with a domestic company, Great Wall, in 1994 which allowed the latter
access to IBM technology and manufacturing know-how in return for access to local
distribution channels. Other foreign multinationals which have set up joint ventures
include Compaq (with Stone Group), Hewlett-Packard (with Lenovo), Toshiba (with
Tontru) and LG Electronics (with Tontru) (Kraemer and Dedrick, 2002b).
China’s policy to nurture its computer industry is further embodied in the ninth
Five-Year Plan (1996-2000) which emphasized the implementation of several ‘Golden
21

Projects’26 to support the development of ICT and encourage computer use throughout
the country (Kraemer and Dedrick, 2002b). The Plan laid out the following goals:27
• Increase the percentage of domestic components in Chinese-assembled computers and increase
the nation’s capacity to produce peripherals such as monitors, printers, disk drives, add-on cards,
and high-definition displays;
• Achieve a per capita national computer penetration of 1%, and 20% among urban families;
• Develop two to three domestic PC manufacturers into enterprises with an annual production
capacity of more than US$1 billion;
• Apply computer technologies to the renovation of traditional industries;
• Develop uniform PC standards via a production licensing system to answer complaints about
lack of service and intellectual property protection on clone PCs.
Indeed, it was the strategy which focuses on home-grown innovation that
culminated in one of the most astonishing news that rattled across the globe. In
December 2004, for the first time in Chinese and global history of the computer
industry, China’s computer giant Lenovo Group bought over the PC division of IBM for
US$1.25 billion, effectively acquiring the latter’s entire global desktop and laptop
computer R&D and manufacturing business. It was a deal that would turn the Chinese
company into the world’s third largest PC maker with annual revenue exceeding US$10
billion, and accounting for 8% of the world market share.28 On the other hand, IBM will
gradually withdraw from the PC market and focus on the game machine business in
China.29
The turning point for the Chinese computer industry came in September 2002,
when the Institute of Computing Technology (CAS Institute) developed the first ever
Chinese-made CPUs (central processing unit) known as ‘Godson-I’.30 However, the
new developments did not fundamentally alter the structure of the Chinese CPU market
which was still largely dominated by foreign manufacturers. The introduction of
Godson-I did not make any impact in the Chinese market due to limited demand and its
26 See Table 2.5 in this chapter for the list of Golden Projects implemented in China. 27 These points are extracted from Kraemer and Dedrick (2002b). 28 “China’s Lenovo Group acquires IBM’s PC business”, People’s Daily (Beijing: December 8, 2004). 29 “IBM to fade from PC market, quit China PC business”, People’s Daily (Beijing: December 6, 2004). 30 It was designed by Professor Hu Weiwu, a researcher of the CAS Institute who graduated from the University of Science and Technology of China (USTC) in 1991. See “The Chief Designer of the CPU ‘Godson I’ Made his Presentation at His Alma Mater”, USTC website, http://www.ustc.edu.cn/ en/ article/56/42ff2484/.
22

clock speed of 266 MHz failed to meet the minimum requirement of 400 MHz for
procurement by the Beijing government (USITO, 2005).
A new breakthrough occurred a year later with an announcement of Godson-II,
China’s first 64-bit high performance processor which supports the Linux operating
system and X-window system, and it’s the equivalent of Pentium III.31 Compared to the
earlier Godson-I, it has ‘an improved frequency scaling, true 64-bit instruction support,
and significantly reduced power consumption at less than 5 watts for the 500 MHz
model (Richmond, 2003). The introduction of Godson-II increased the market share of
home-grown processors from zero to 1% in 2003 (Table 2.2).
Table 2.2 China’s CPU market, 2001-2004 Market share (%)
Company 2001 2002 2003 2004Intel AMD Via Tech Chinese processors Others
90.05.02.00.03.0
84.0 8.0 3.0 0.0 5.0
83.0 9.5 3.5 1.0 3.0
74.018.0
4.01.03.0
Source: USITO (May 13, 2005).
The story of Chinese processors has not ended though. It was reported in early
2006 that a new type of CPU, the ‘Godson-III’, the equivalent of Pentium IV, was being
developed by a research team at CAS Institute known as the ‘Super Dragon’.32 It did
not take too long for one of the greatest achievements to materialise when the CAS
Institute developed the first Chinese low-cost computer, Longmeng (meaning ‘Dragon
Dream’ in Chinese), having the size of a notebook, which costs only 1,000 yuan
(US$125) which was announced by Zhang Fuxin, a researcher at the institute.33 Using
Red Flag Linux as its operating system, and equipped with a DVD drive and a video
game player, Longmeng is ‘equivalent to a 1G Pentium III desktop’.34 The computer is
marketed for users from low income groups and students in rural areas by the Menglan
Group from Changshu in Jiangsu province. However, it will take a few years to assess
whether there is any impact of the new Chinese processors on their market share
compared to those of major foreign competitors like Intel and AMD.
31 “Chinese-made CPU Chip Equivalent to Pentium III”, China Education and Research Network (Beijing: April 20, 2005), http://www.edu.cn/20050420/3134777.shtml. 32 “Future Super Dragon Super Server”, Zhongguo Wang (China Net) (Beijing: March 4, 2006), http://www.china.org.cn/english/scitech/160125.htm. 33 “China to produce low-cost computers of its own”, China Economic Net (Beijing: March 15, 2006). 34 Ibid.
23

Meanwhile, China has taken great strides in developing its own models of
supercomputers. China had developed the 10-teraflop Dawning 4000A in June 2004 on
its own.35 Later on, when IBM announced its success in developing the 100-teraflop
supercomputer at the end of 2004, the National Research Centre for Intelligent
Computing Systems (NCIC) and the Dawning Company responded with similar
research and had expected to put their 100-teraflop ‘Dawning-5000’ supercomputer
model into use in 2008. 36 Finally, China was also reported to have commenced on a
preliminary research to develop the 1,000-teraflop supercomputers during the 11th Five-
Year Plan (2006-2010), headed by Lenovo Group.37 The key objective of this project,
which started in July 2005, was to develop a supercomputer without dependence from
foreign countries.
2.3.2 Software development
The software market is broadly defined to cover the application and systems software,
as well as the intermediate link software. Presently, it is dominated by the segment of
application software (about 65%), which consists of accounting software, word-
processing packages, anti-virus software and publishing software; followed by platform
software (29%), which includes the operating system (OS) and Linux-based operating
software; and intermediate software (6%).38
In 2005, the Chinese software industry increased its world market share to 3.5%,
exceeding those of India and South Korea.39 Chinese software sales grew annually by
almost 19% between 2000 and 2004. It had increased about six times within a decade
from US$1.1 billion in 1996 to almost US$6 billion in 2004 (Figure 2.2). According to
CCID Consulting, China’s software market is estimated to have reached US$6.8 billion
(56.5 billion yuan) in 2005, climbing to almost US$8 billion (66.1 billion yuan) in mid-
2006, and it’s further forecast to hit more than US$13 billion (110 billion yuan) in 2009,
growing annually at about 18%.40 In 2003, the Chinese software market was dominated
by Microsoft and Ufsoft Co. which had 21% and 17% of the market share respectively.
35 It means the supercomputer system calculates 10 teraflops per second. 36 “China begins preliminary research on 1,000 teraflops supercomputer”, People’s Daily (Beijing: July 22, 2005). 37 Ibid. The US has planned to develop the 1000-teraflop supercomputer in 2010. 38 “China Software 2005”, Snapshots International, March 2005. 39 “China’s Software Industry Sales to reach 1.3 trillion yuan in 2010”, SinoCast China Business Daily News (June 29, 2006). 40 “China Software Industry’s Development Trend and Feature”, China ComputerWorld Research (July 2006), http://www.ccwresearch.com.cn/en/; “China’s Software Industry Sales to reach 1.3 trillion yuan in 2010”, SinoCast China Business Daily News (June 29, 2006).
24

25
The largest shares held by domestic companies were Langchao Group and Beida
Fangzheng Co., at about 15% and 7% respectively (Table 2.3).
Yet, in comparison with its counterpart in India, there are indications that
China's software industry is still at a premature stage in many aspects. Although China
has far outperformed the latter in terms of ICT expenditure and telecommunications
development, its software exports in 2003 of US$2 billion were less than one-sixth of
India’s (US$12.5 billion). The gap in development of the software industry between the
two countries has been mainly attributed to the Chinese policy of ‘emphasizing
hardware while neglecting software’ during the 1980s (Wong and Wong, 2004). As far
as the software standard is concerned, only two Chinese firms have obtained the CMM
Level 5 in 2004, as compared with India’s 60, despite having doubled the number of
software enterprises (Kshetri, 2005). 41 Moreover, China’s software industry is
dominated by small and medium-sized enterprises (SMEs) which account for 97% of
China's total 5,000 software enterprises (Wong and Wong, 2004). Most Chinese
software enterprises hire 25 employees on average, much smaller than India’s average
of 174 (Kshetri, 2005).
China’s primary competitive disadvantage (when compared with India) lies in
the lack of manpower skills and resources. Language and cultural barriers are the main
factors determining their respective software export destinations. While Indian software
is exported mainly to the US (the world’s largest software market) and Europe
(accounting for 80% altogether), about 60% of Chinese exports in 2004 went to Japan,
which has a smaller market size than the US. The lack of English language skills have
also prevented Chinese companies from venturing into the US or other foreign markets,
and therefore miss out on the opportunities to ‘work with clients on the front end of an
IT service contract, such as business process requirements, system architecture and
system design’ (Dedrick, Kraemer and Ren, 2004).
41 CMM (Capability Maturity Model) is the international certification which serves as the primary index for software standardization (Wong and Wong, 2004).

0
20
40
60
80
100
120
2000 2001 2002 2003 2004 2005 2006 2007 2008 2009
Bill
ion
yuan
0
5
10
15
20
25
30
%
Software sales (billion RMB) Growth rate
Figure 2.2 Growth and forecasts of Chinese software sales, 2000-2009
26
Source: “China Software 2005”, Snapshots International, March 2005.

Table 2.3 Market shares of China’s software (%) Company 2003 Microsoft Ufsoft Co. Langchao Group Beida Fangzheng Co. SAP Sybase Kingdee Software (China) Co. Ltd Newgrand Software Co. Others Total
21.4 16.7 15.4 6.8 6.7 4.2 4.1 3.2 21.5
100.0
Source: “China Software 2005”, Snapshots International, March 2005.
Nevertheless, Chinese policies are now geared towards lesser dependence on
foreign technology via exporting Chinese standards to the world as well as reducing the
dominance of foreign firms in the domestic market. For instance, 30% of the Chinese
software markets have been captured by domestic vendors in 2003, with the aim of
expanding the share to 60% by 2010 (Kshetri, 2005). Marketing research firm Gartner
Group was confident that if China were to continue its fast-track growth from building
software parks, providing incentive packages for programmers, boosting its English
training programs and enforcing protection of intellectual property rights, the country
could catch up with India by 2006.42
Indeed, competition with India need not become an obstacle to China’s advance
in developing its software industry. Chinese President Hu Jintao, in his speech at the
China-India Economic, Trade and Investment Cooperation Summit and CEO Forum
held in Mumbai, India on November 23, 2006, put forward a five-point proposal, in
which he suggested a strengthening of mutual investment involving
telecommunications, software and other emerging industries so as to promote trade and
economic cooperation between the two countries.43 The emphasis is on supplementing
the respective ‘strong points’ in information technology, infrastructure, science and
technology and other areas between them, and thus creating more potential for
cooperation and investment opportunities for their respective domestic companies in
each other’s country.
42 “High Tech in China: Is it a threat to Silicon Valley?”, BusinessWeek Online (October 28, 2002), http://www.businessweek.com/magazine/content/02_43/b3805001.htm. 43 “Chinese president makes proposals at China-India CEO forum – Xinhua”, BBC Monitoring South Asia (London: November 24, 2006).
27

China took a major step to promote the development of its software industry
when on July 24, 2000, the State Council launched a package of policy under the ‘No.
18’ document, known as the ‘Policies for Encouraging the Development of the Software
and Integrated Circuit (IC) Industries’. Among the most favourable to software
businesses were the tax incentives outlined in the Policies as follows (Liu, 2004b):
• A reduction of the value-added tax (VAT) for R&D investment and additional production for
software companies from 17% to 3%.
• A two-year tax holiday for new software companies, and 50% of income tax for the next three
years, starting from the first year of earning profits.
Two years later, the Chinese government launched another policy package under
the ‘No. 47’ document, known as ‘The Principle of Rejuvenating the Software Industry’
which covered financing, exporting, human resources, and government procurement,
etc. (Liu, 2004b). The document stated more explicitly that the government will give
priority to domestic software in its purchasing decision and will use only licensed
software. The document further stated that more than 4 billion yuan will be spent on
R&D in the software industry during the 10th Five-Year Plan (2001-2005).
In a significant move to boost its software industry, China has sought to expand
its software infrastructure and human resource base. First, it has built 19 software parks
in Beijing, Tianjin, Shanghai, Xian, Dalian, Guangzhou, Wuhan, Fuzhou, Xiamen and
Hefei, and established 53 high-tech industrial development zones throughout the
country in 2000 (Wong and Wong, 2004). It currently has six software export bases in
Beijing, Shanghai, Tianjin, Dalian, Shenzhen and Xian cities, and now further aims to
increase its export bases to 15 by 2010 (Zhang, 2006c). Second, where software talent is
concerned, China had 900,000 software industry workers in 2005, and this number is
expected to grow up to 2.5 million in the next five years. The Ministry of Information
Industry (MII) also aims to increase the number of software enterprises with sales
revenue of over 5 billion yuan (US$625 million) in China (Zhang, 2006b).
Finally, the Chinese software industry faces the major problem of piracy. The
MII recognizes the importance of intellectual property rights (IPR) protection, as can be
seen from the crackdown on software piracy in recent years. In a move to address this
issue, the central government allocated almost 150 million yuan (US$18.5 million) for
the purchase of licensed products. Chinese officials were also insistent against claims by
the Business Software Alliance (BSA) that up to 94% of Chinese software could be
28

unlicensed (Zhao, 2006). In April 2005, the MII and the National Copyright
Administration (NCA) required all PCs produced and sold in China to be installed with
authentic operating software systems. The spokesman for the National Copyright
Administration of China, Wang Ziqiang, remarked that such legal requirement proves
the consistent ability of the Chinese government to control the rampant software piracy
(Zhao, 2006). The meeting between Chinese President Hu Jintao and Microsoft founder
Bill Gates in Seattle in April 2006 was also meant to boost the confidence of overseas
investors in China’s determination to crack down on IPR violations.
“During the last ten years, China’s information technology industry has emerged as a global
centre for growth and innovation. We’re encouraged by China’s efforts to strengthen intellectual
property protection, which will provide the foundation for continued expansion of the IT
industry in China. We look forward to working with the Chinese government and partner
companies in China to create new opportunities for growth.”
-- Bill Gates, Chairman and Chief Software Architect of Microsoft, welcome speech to Chinese
President Hu Jintao44
“With the recently announced cooperative engagement agreements with computer manufacturers
to pre-load genuine Windows® operating systems, we see even greater opportunities in China
and the chance to build long-lasting relationships with customers and partners in China.”
-- Tim Chen, Corporate Vice President and Chief Executive Officer of Microsoft Greater China
Region45
In the same year, the Chinese domestic office software producer, Evermore, won
bids for office software products to be used in government sectors in 21 provinces,
municipalities and autonomous regions (Zhao, 2006). One of the major battles over
software piracy was won by Microsoft when the Chinese PC manufacturer, Lenovo,
agreed to load only the legitimate copies of Microsoft Windows operating system onto
their new PCs. Such a move is expected to be followed by another major Chinese firm,
Tsinghua Dongfang Company (Batson, 2006).
44 “President Hu Jintao and Bill Gates to Discuss Microsoft’s Commitment to the Chinese Software Industry”, Microsoft PressPass (April 18, 2006), http://www.microsoft.com/presspass/press/2006/ apr06/04-18ChinesePresidentPR.mspx 45 Ibid.
29

China’s software industry has further taken on a structural shift, by increasing its
emphasis on the development of open source software (OSS), which offers an
alternative to foreign software and an opportunity to break the domination of foreign
companies in the industry (Dedrick, Kraemer and Ren, 2004). It started when the
Chinese government established Red Flag Linux with the Chinese Academy of Science
and the Beijing Software Industry Production Centre in 1999. In 2002, Yangfan Linux
was launched by the centre, based on versions of Linux developed by Red Flag and the
China Computer Software Corporation. In fact, the Dawning 4000 supercomputer is
based on the locally-designed Linux operating system (Kshetri, 2005).46
With this new strategy that has shifted from the traditional reliance on domestic
consumption to exporting to major overseas markets such as the US and Europe, the
MII recognizes software outsourcing as ‘a shortcut that will allow the Chinese software
industry to catch up with the developed countries’. The MII aims to triple its software
exports from 2005 to US$ 12.5 billion by 2010.47 As an example of a joint development
between Chinese and foreign companies, Datang Mobile, a core member of Datang
Technologies has joined a global consortium of Linux-based operating systems, Open
Source Development Labs (OSDL) in November 2006, to accelerate the deployment of
Linux on its mobile handsets.48
At its current position, there is a strong case for China to focus on its domestic
market while at the same time build alliances that foster greater cooperation with
foreign investors to spur the growth of its software industry. To understand the
strategies that China could adopt to strengthen its software industry, it would be useful
to look at the framework of Li and Gao (2003). The software industry is categorized
into a 2 x 2 contingency table representing two dimensions – the target market served
(domestic vs. export) and the type of business (service vs. packages) (Table 2.4).
Positions A and B, which represent export-oriented strategies, have been
successfully used by India and Israel respectively – the former having captured 16% of
the global market in customized software while the latter has emerged as a source of
46 OSS has enabled the Chinese military to use domestically produced supercomputers. The Red Flag Linux applications are also deployed in Chinese aircraft, weapons systems, vehicles, industrial equipment and other consumer devices besides the PCs (Kshetri, 2005). 47 Ibid. 48 “OSDL Mobile Linux Initiative Gains Another Heavy Hitter”, PR Newswire (New York: November 28, 2006).
30

enterprises developing packaged products such as Internet security and antivirus
software (Li and Gao, 2003). Although China has the potential to develop its software
industry for exporting to overseas markets, such an export-oriented approach may result
in a ‘brain drain’ as it diminishes the flow of skills and technology into the domestic
market, since the net benefits would be passed on to its overseas customers. As a
relatively new player in the software export market, China does not have the adequate
legal establishment, infrastructure and track records as those countries that have
successfully built up their software export bases such as India, Ireland, Israel and
Singapore (Li and Gao, 2003).
Table 2.4 Strategic choices for developing China’s software industry
Software Business
Service Packages
Export A B Market served
Domestic D C E
Source: Li and Gao (2003).
Position C represents a strategy whereby the country will face tough competition
from international rivals, as seen in the case of the price battle between Chinese
software producer Kingsoft and international giant Microsoft over their respective
word-processing software, WPS Office and MS Office, whereby the former sold its
software for only US$157 (1,300 yuan) compared to the latter’s US$846 (7,000 yuan)
(Wong and Wong, 2004). Such a strategy however easily invites piracy which is already
widely prevalent in the country.
In the opinion of Li and Gao (2003), the most appropriate starting point for
China to develop its software industry is Position D, as there is a huge and growing
domestic demand for software services in the country, stimulated by high economic
growth. Li and Gao (2003) further introduced a Position E, situated at the cross-junction
of all other positions in Table 2.6, which represents a form of specialization for a variety
of niche markets that can be categorized by sector (banking, insurance, health
administration, hotel management, mining, forestry, etc), application (Web browser or
utility programs) or linguistics (regional languages). Therefore, China need not follow
the same path of India, as it should focus on the domestic market (Position D) with
specialized services that cater to specific markets (Position E).
31

A drawback of the above-mentioned strategy is its neglect of the interaction
between domestic and foreign software companies. Despite its shortcomings in terms of
software development and availability of human capital, China could make up for it
through fostering greater collaboration and cooperation by building alliances with
software enterprises from India or other software superpowers. Eventually, players from
all sides will gain as the burgeoning Chinese market and favourable government
policies attracts a greater inflow of foreign investment into the country, while at the
same time, Chinese firms will benefit from tapping the expertise and management skills
of the foreign partners that they work with (Li and Gao, 2003).
2.4 National science and technology programs
2.4.1 Brief overview of China’s science and technology (S&T) policy
The development of ICT industry in China has gone hand in hand with the nation’s
economic growth since the beginning of reform. Driven by the belief that developing
science and technology (S&T) was the key to ‘catching up’ with the developed nations
of the West, the Chinese government has developed S&T policies right from the
beginning of the founding of the People’s Republic in 1949, when at that time all
research and development activities were put under the control of the State
Development Planning Commission and the State Science and Technology
Commission.
As mentioned in the earlier sections of this chapter, resources for S&T (in
telecommunications as well as computer development) were mainly channelled to
military and non-commercial uses by government-linked administrative bodies during
the pre-reform period. It was only in the mid-1980s when the Chinese government
started to initiate various projects or programmes that have heavily supported the
development of high technology in line with market-oriented reforms. These projects
included the 863 Program (named after the year and month that the project was
implemented), the Torch Program, the High Technology Development Zones or Parks
and the 973 Program.
The development of S&T in China entered a period of rapid take-off in the early
1990s with new policy changes that further opened up the Chinese economy to foreign
investment. First, the Chinese government indicated its concrete support for non-
32

governmental corporations with the 1993 ‘Decision on Several Problems Facing the
Enthusiastic Promotion of Non-governmental Technology Enterprises’ which
recognised the role of non-state-owned enterprises in ‘developing a new innovation
system based on market-oriented technology firms as well as changing an S&T system
dominated by public institutions to one that embraced organizations of various
ownership structures’ (Naughton and Segal, 2001). This was followed up with a 1995
‘Decision on Accelerating S&T Development’ which further lent encouragement to
non-state companies as ‘an important force in the high-tech field’ and accepted the role
of market in the development of applied technologies (Naughton and Segal, 2001).
Second, the year 1993 witnessed the implementation of a series of projects that
sought to emulate the US’ information superhighway, known as the “Golden Projects”,
initiated by the former Ministry of Electronics Industry (MEI). It began with the
establishment of Jitong Communications Corporation that oversaw the Golden Bridge
Network in March 1993, which aimed to build a nationwide telecommunications
network. Subsequently, a series of Golden Projects was implemented, each serving
different aspects of ICT infrastructure in China (Table 2.5).
2.4.2 S&T projects
In March 1986, four Chinese scientists gathered together to propose a project that would
accelerate China’s high technology development, in order to meet the global challenges
of high-tech competition and revolution.49 The plan, known as 863 (which stands for
the year, 1986, and the month of March), aimed to ‘pool together the best technological
resources in China over fifteen years to keep up with international high-technology
development, bridge the gap between China and other countries in several high
technologies and strive for breakthroughs’ (Segal, 2003: 30). It was approved by former
Chinese leader Deng Xiaoping. The 863 Program targeted industries in the area of
biotechnology, new materials, lasers, energy, information, robotics, and space.
In spite of the numerous breakthroughs made since its implementation, the 863
Program was not without problems. As various institutions competed for resources and
equipment for R&D and production, this made coordination among them difficult.
Furthermore, the program participants had very few connections with private 49 They were Wang Daheng, Wang Ganchang, Yang Jiachi and Chen Fangyun. See the website of Ministry of Science and Technology of the People’s Republic of China, http://www.most.gov.cn.
33

enterprises, and therefore provided little incentives for innovative activities. The central
policymakers sought to refocus on the potential role of small non-governmental
enterprises in technological innovation. As a solution, the central government passed
numerous regulations that would provide greater support for R&D and
commercialization in the state owned enterprises (SOEs), and also encourage
individuals to start their own non-governmental enterprises.
One such plan is the Torch Plan, officially initiated by the Chinese government
in May 1988, the main objective of which was to promote the development of science
and education, and also to transform laboratory projects into commercial products,
thereby improving China’s competitiveness internationally (Lin, 2003). The plan would
expand the sources of funds available to nongovernmental enterprises and link them to
the development of high technology development zones (HTDZ) (Segal, 2003: 31-2).
The Torch Plan has also provided financial support to the software industry. For
instance, it has funded more than 600 software projects since 1995, and built 19
software parks in Beijing, Tianjin, Shanghai, Xi’an, Dalian, Guangzhou, Wuhan,
Fuzhou, Xiamen and Hefei (Kharbanda and Suman, 2002).
In an initiative to spur further breakthroughs from research in order to meet the
fast changing socio-economic demands, the State Science and Education Steering
Committee formulated the ‘National Plan on Key Basic Research and Development’
and implemented the ‘National Program on Key Basic Research Project’ on June 4,
1997, known as the ‘973 Program’. The main objectives of the program were to
mobilize Chinese scientific talents in conducting innovative research on major scientific
issues in agriculture, energy, information, resources and environment, population and
health, as well as materials and related areas, in accordance with the objectives of
China’s economic, social and S&T development goals up to 2010 and the mid-21st
century.50
50 Ministry of Science and Technology website, http://www.most.gov.cn
34

2.4.3 High technology development zones
Besides expanding the source of funding for technology enterprises, the Torch Plan
further promoted the creation of new high technology development zones (HTDZs) to
support these industries. Also known as the ‘high-tech parks’, the HTDZs have
contributed significantly to the Chinese economy through the development of ICT and
more recently, Internet-related products and services (Lin, 2003).
The establishment of HTDZs was accomplished in three stages.51 First, the State
Council officially approved the establishment of the first batch of 26 state-level HTDZs
in 1991.52 Subsequently, another 25 new and high-tech zones were approved in 1992,
when the State Basic Policy for High-Tech Industrial Development Zones was issued
which covered five areas of concern pertaining to high-tech industries, namely, taxation,
finance, trade, pricing and personnel policy (Segal, 2003). These policies were
favourable to new technology enterprises. In 1997, the construction of Yangling New
and High Agrotechnology Development Zone was approved. 53 Together with the
Beijing New Technology Experimental Zone, there are 53 HTDZs established
throughout the country by 2000 (Table 2.6).
The HTDZs in China have become important bases for the development of new
and high technology industry and promoting development of the regional economy.
During the late 1990s, the HTDZs have seen rapid annual growth. For instance, from
1997 to 1999 alone, the number of high-tech enterprises grew by 28% while the number
of employees increased by more than 50%; and the value of total output grew annually
by about 40%.54 By the end of 1998, more than 70,000 small and medium-sized high-
tech businesses have sprouted all over China.55
51 High-tech parks in fact started as early as 1980 when a group of researchers from the Chinese Academy of Sciences (CAS) set up a small shop in Zhongguancun, about twelve miles to the northwest of Beijing city, engaging mainly in the repair and servicing of equipment used by CAS institutes (Lin, 2003: 31). 52 “China’s New and High-Tech Development Zones”, China Internet Information Centre (Beijing: September 16, 2001). 53 Ibid. 54 “General Characteristics of the Development of New and High Technology Industry Development Zones in China”, World Economy & China (Beijing: November/December 2000). 55 “The Next Tech Superpower”, Asiaweek (Hong Kong: July 27, 2001).
35

Table 2.5 China’s Golden Projects
Project title Project design and goals Golden Bridge Golden Customs Golden Card Golden Enterprises Golden Health Golden Intelligence Golden Macro Golden Medical Golden Real Estate Golden Tax
The national public telecommunications network and the foundation of China’s entire ICT infrastructure. It provides the country with satellite and optical fiber cable networks for the financial, customs, foreign trade, tourism, meteorological, traffic service, State security, and other scientific and technological sectors. Develops applied information system services to track quota permits, bank sales of foreign currency, and trade statistics for China’s General Administration of Customs. It also aims to link all foreign trade departments and firms, and realize electronic data exchange and paperless trading. To replace cash transactions with an electronic service system for savings, withdrawals, and payments through credit and debit cards, through the use of the Golden Bridge telecommunications networks. A production and marketing information system supported by the State Economic and Trade Commission to link the state-owned enterprises and other industrial and commercial firms with Chinese government offices. It offers online services and assists commercial and industrial firms in the efficient use of personnel, capital and natural resources. Provides all Chinese citizens with an optical memory card containing personal health care data by the year 2002. A national science and technology information network for academic use. To build macroeconomic tools for use by ministries and provincial-level information centres. To connect large hospitals and research institutions, facilitating transmission of critical medical information and images among health organizations, sponsored by the Ministry of Health and Jitong Corporation. To facilitate the exchange of real estate information across different regions in China, jointly developed by the Ministry of Construction and local agencies. A computerized tax collection system sponsored by the Ministry of Finance, the People’s Bank of China, the State Tax Administration and the Ministry of Electronics Industry.
Source: Simon and Ashton (1996: 10).
36

Table 2.6 Geographic distribution of HTDZs in China Geographic location
HTDZs Number %
Northeast North East Coastal Area Central Northwest Southwest Total
Harbin, Changchun, Jilin, Daqing, Shenyang, Anshan, Dalian Beijing Zhongguancun, Tianjin, Zhengzhou, Shijiazhuang, Taiyuan, Jinan, Baoding, Luoyang, Qingdao, Weihai, Zibo, Weifang Shanghai, Nanjing, Suzhou, Wuxi, Changzhou, Hefei, Hangzhou, Nanchang Guangzhou, Shenzhen, Fuzhou, Xiamen, Zhongshan, Huizhou, Foshan, Zhuhai, Haikou Wuhan, Changsha, Xiangfan, Zhuzhou Lanzhou, Baoji, Xi’an, Yangling, Baotou, Wulumugi Chengdu, Chongqing, Kunming, Mianyang, Guiyang, Guilin, Nanning
7 12 8 9 4 6 7 53
13.2 22.6 15.1 17.0 7.5 11.4 13.2 100.0
Source: Ma and Goo (2005: 332).
In 1999, the establishment of the Beijing Zhongguancun Science and
Technology Park was approved by the State Council, as part of the Chinese
government’s move to speed up development of new and high-tech industry. Beijing
has developed a massive linkage of high-tech industries covering electronic
information, bio-engineering and new medicine, integration of photoelectron,
machinery and electronics, new materials, new energy, environmental protection,
aerospace, and earth and space technology.56
Beijing has promulgated and implemented more than 70 policies for the
development of high-tech industries. It has established preferential policies guided by
Certain Suggestions of Beijing Municipality on Promoting Development of New and
High-Tech Industry (33 articles) and an industrial policy system led by Guidelines for
Major Areas in New and High-Tech Industrialization to be Given Priority in 56 “The Development Trend of New and High-Tech Zones”, World Economy & China (Beijing: November/December 2000).
37

Development.57 In 1999, the capital city registered an industrial value-added of 16.5
billion yuan in the high-tech industry, accounting for 65% of industrial growth. The
Zhongguancun Science and Technology Park alone churned out 52.7 billion yuan value
of industrial output, and exporting US$820 million.58
In 2000, the HTDZs produced a total output value of 794.2 billion yuan,
equivalent to about 9% of GDP. About 50-80% of ICT products, such as optical fibre
cable, computer and related devices, and software and network product, are produced by
enterprises based in the HTDZs. By end of 2000, the HTDZs have registered more than
1,250 companies whose annual output exceeded 100 million yuan, compared with only
seven in 1991; 143 with an annual output exceeding 1 billion yuan, and six with 10
billion yuan. Some famous domestic enterprises have developed rapidly in the HTDZs,
including Lenovo, Stone, Founder, Huawei, Zhongxing and Diao.59 In 2003, the total
industrial output generated by the 53 HTDZs increased 34% over the previous year to
hit more than 1,730 billion RMB (raising the contribution to 15% of GDP).60
The HTDZs are also an important ground for attracting and fostering new and
high-tech talents. They have formulated special policies to attract talents and strengthen
the protection of intellectual property rights. For instance, there are more than 2,000
enterprises in the HTDZs established by scientific and technological personnel from
universities and scientific research institutes, with 2.5 million employees in 2000.
Among them, one-third have a college education or above, about 350,000 hold
professional titles, more than 30,000 hold masters’ degrees and over 4,000 have
doctoral degrees. The HTDZs have also attracted almost 5,000 students returned from
overseas.61 By 2002, the number of employees had risen by 40% to 3.5 million.62
As China moved into the early years of the 21st century, they have continued to
press on with policies designed to adapt to new and changing demands in the
international as well as domestic economic and technological environment. During the
10th Five Year Plan (2001-2005), the Chinese government aimed to focus on innovation
57 Ibid. 58 Ibid. 59 “China’s New and High-Tech Development Zones”, China Internet Information Centre (Beijing: September 16, 2001). 60 “High-tech zones to spur local economies”, China Daily (New York: February 12, 2004). 61 Ibid. 62 “Plugging into high-tech”, China Daily (New York: September 20, 2003).
38

and creations by implementing the strategies of ‘developing China through science and
education’ and ‘sustainable development’, as well as strive for greater breakthrough in
areas such as electronic information, software, bioengineering, optical-
electromechanical, new materials, new energy and environmental protection
industries.63
At the National Conference on Industrialization of New and High Technologies
in Beijing that marked the 15th anniversary of the Torch Programme, Science and
Technology Minister Xu Guanhua emphasized ‘the need to develop internationally
competitive high-tech industries and development zones, by urging domestic firms to
compete overseas in the global market and stepping up innovations to earn advantages
of intellectual property, while at the same time integrating themselves with advanced
technologies and overseas capital.’64
The Beijing Zhongguancun Science and Technology Park has also become an
attractive venue for multinational enterprises. In 2002, 39 out of the world’s top 500
enterprises have set up research and development centers in Beijing, including
Microsoft, IBM, Nokia, Nortel, Motorola, Intel and GE. 65 Multinationals such as
Microsoft, Hewlett-Packard, Oracle and IBM have set up software research centers in
Shandong Province, Shanghai, Beijing and Xiamen respectively to train and hire
software professionals over the next few years (Wong and Wong, 2004).
Another sign of increasing international co-operation came about in February
2003, when one of the largest semiconductor projects was launched in Nanjing New and
High-tech Industrial Development Zone, in which US$360 million (almost three billion
yuan) was invested by domestic as well as foreign firms from Singapore, France, US,
Japan, Germany and Korea in the Nanjing Semiconductor Manufacturing Corporation.
This project was regarded to be in line with China’s investment priorities. For instance,
during the 10th Five Year Plan, a total of US$10 billion (more than 82 billion yuan)
would be expected to be invested in integrated circuit manufacturing in order to boost
production to 700,000 pieces a month.66
63 “China’s New and High-Tech Development Zones”, China Internet Information Centre (Beijing: September 16, 2001). 64 “Plugging into high-tech”, China Daily (New York: September 20, 2003). 65 “Tech park strives for more giants to come”, China Daily (New York: June 18, 2002). 66 “Semiconductor production to expand”, China Daily (New York: February 25, 2003).
39

To further boost the contribution of the HTDZs to economic growth of the
country, the Ministry of Science and Technology (MOST) has planned to widen the
scope of the 53 development zones. First, the High-Tech R&D Center of the Ministry of
Science and Technology and Guangzhou Development Zone jointly set up the National
863 Program (Guangzhou) Industrialization Promotion Office in Guangzhou in
December 2003, aimed at carrying on the National 863 Program to improve China’s
overall capability of R&D in high technology.67
Besides providing continued support to the Zhongguancun in Beijing, the MOST
established seven high-tech industrial zones in the provinces of Heilongjiang, Jilin and
Liaoning in Northeast China as part of the “Northeast Revitalization Programme” in
2004. The measures include ‘commercialization of the latest high-tech advancement
among related industrial sectors as well as encouraging private high-tech firms to jointly
develop new technologies with State-owned firms.’68 To date, the most recent project
involving a foreign firm took place when Applied Materials, an US semiconductor
equipment manufacturer, signed a contract to construct its Global Development
Capability Centre in Xi’an HTDZ, in April 2006.69
2.5 The ICT market in China
The development of individual sectors related to ICT in China, i.e. the
telecommunications and computer sectors have been reviewed in the preceding sections.
In this section, the state of the overall ICT market as well as the telecommunications
market in the country will be discussed. China has emerged as a ‘star’ performer in the
global ICT market in recent years. According to the Italian Information Industry
Association, China has become a ‘global leader’ in the ICT market, topping the growth
rate at 19.7% in 2005, well above the world average of 6.1%.70 China Telecom existed
as a monopoly for almost five decades since the founding of the People’s Republic in
1949. With the courtesy of a deregulation policy that began with ministerial reform in
67 “Guangzhou Development Zone carries on 863 Project”, SinoCast China Business Daily News (London: January 2, 2004). 68 “High-tech zones to spur local economies”, China Daily (New York: February 12, 2004). 69 “Semiconductor firm plans new development centre in Xi’an”, China Daily (New York: April 11, 2006). 70 This is followed by 6.0% in Spain, 5.0% in the US, 3.3% in France, 3.1% in the UK, 2.9% in Japan, 2.5% in Germany and 0.9% in Italy, indicating that the growth rate of ICT market in China more than doubles that of any other single country. See “China Recording Highest ICT Market Growth in 2005”, Info-Prod Research (Ramat-Gan: April 11, 2006).
40

1998, the monopoly disintegrated into seven licensed competitors within a span of three
years till the nation’s entry into WTO in 2001. With the backing of a massive domestic
market for building high technology industries, China has also become the world’s
second largest personal computers (PCs) market – producing 81 million computers in
2005, and the world’s third largest producer of semiconductors after the US and Japan
(OECD, 2006). The rapid rise of the Chinese ICT industry is mainly attributed to the
rapid increase in ICT investment (especially after 1992 following the ‘southern tour’ by
former leader Deng Xiaoping) and the establishment of high technology development
zones (HTDZs). The rapid adoption of ICT by millions of Chinese consumers and
businesses is becoming an ‘antidote’ to the slowing sales growth of ICT markets in the
West.71
2.5.1 Rise of the ICT market in China
Government support for investment in the ICT industry has proven to be crucial since
the early stages of development. For instance, in the 1980s, the Chinese government
created special funds for the development of integrated circuits (ICs), computers,
software and communications switches (Dong, 2004). In 1992, the ICT industry was
listed as a pillar industry, and subsequently ICT products were emphasized as the new
drivers for China’s economic growth (Dong, 2004). The driving force of growth in
China’s ICT sector is perhaps best summed up in the words of Jamie Popkin, Vice-
President of Gartner:72
China’s growth in information and communication technology sectors is fuelled by strong
government involvement through state-owned enterprises, agency programs and policies.
China’s ICT market survived the downturn in the global ICT industry in 2001
and the negative impact of the SARS outbreak in early 2003. This was reflected in the
increase in sales volume of desktop computers due to factors such as the cut in desktop
prices, the increase in Internet users, upgrading of hardware, as well as the integration
of consumer electronics such as the digital camera, digital video and MP3 player with
computer hardware for family use.73 In rise in computer sales volume was also partly
71 “The Next Tech Superpower”, Asiaweek (Hong Kong: July 27, 2001). 72 “China sets its sights on technology superpower status”, Manufacturing Business Technology, November 2005. 73 “6 Million Computers Shipped in China”, SinoCast China Business Daily News (London: September 1, 2004).
41

attributed to an increasing number of domestic ICT enterprises expanding their sales in
the overseas market.74
In comparison with the rest of the world, China has attained a relatively higher
growth rate of the output of ICT equipment. For instance, the output of computers and
office equipment in China grew by 82% in 2005, which doubled that of Germany (36%)
and was much higher than the US growth rate of 8%, at the time when most countries of
Western Europe were facing negative growth of their ICT production (Table 2.7). A
forecast by International Data Corporation (IDC) estimates China’s ICT market to reach
430 billion yuan (US$51.74 billion) by 2008, and may become the world’s third largest
ICT market after the US and Japan in 2010, and assume the first position in 2015.75 In
another forecast, China is projected to have the sixth-highest growth rate in ICT
investment from 2005 to 2009 among 55 countries (Zhang, 2006a).76 However, the
combined ICT spending of the top five countries is less than that of China. Moreover,
China is the only country expected to enjoy accelerated growth in ICT spending over
the next five years.77 As a matter of fact, China’s prominent position in the global ICT
market is expected to continue as the country expands its infrastructure investment in
the six mainland cities designated for the 2008 Summer Olympics, i.e. Beijing, Tianjin,
Shanghai, Qingdao, Qinhuangdao and Shenyang, together with Hong Kong (Perez,
2006).
The booming Chinese economy and changing telecommunications policies
associated with rising market demand are the major factors which have led to China
becoming the world’s largest telecommunications market. The country had a network
capacity of 503 and 611 million lines for the fixed line and mobile phone segments,
serving up to 368 and 461 million subscribers in 2006 respectively. In 2006, the total
revenue for the Chinese telecommunications industry reached 648 billion yuan, an
increase by 11.7% from 2005, which was about 4% of GDP. 78 The development of
China’s telecommunications industry has often been described as a success story
initiated by the state at the beginning of economic reform in 1979. In fact, the expansion
74 “China IT Market is Robust”, Asiainfo Daily China News (Dallas: August 6, 2002). 75 “China Forecast to be Third Biggest IT Market Worldwide”, SinoCast China Business Daily News (London: May 12, 2005). 76 The only countries projected to have a faster growth in ICT spending are Russia, India, Turkey, Indonesia and Vietnam (Zhang, 2006a). 77 Ibid. 78 Ministry of Information Industry website, http://www.mii.gov.cn/.
42

43
of the Chinese telecommunications network is attributed to ongoing reforms which have
been determined by ‘the forces of state consideration, foreign influence and market
forces, subject to changing domestic politics and technological advancement’ (Loo,
2004).
Table 2.7 Actual and projected output growth rates of computers and office equipment in China and developed countries, 2004-2009 (% change y-o-y)
2004 2005 2006 2007 2008 2009Germany
France Italy
United Kingdom Spain
Netherlands Sweden
Belgium Switzerland
Western Europe
United States Japan
China
9.4 -5.3 7.9-23.3-23.1 0.6 25.3-11.2 -8.5 -6.3
1.6 3.9
37.4
35.9-45.3-48.6 -3.8 0.0 -8.1 -5.0 19.9 -2.2 1.8
8.1-2.1
82.1
26.0-19.1-23.1 -5.8 -9.1 -4.3 2.4 11.5 1.9 9.3
9.1 1.1
41.7
8.7 2.3 1.8 1.0 1.8 2.3 2.2 3.8 3.1 5.8
9.7 1.8
30.2
6.7 1.1 0.5 3.3 0.5 2.2 0.6 2.8 2.7 5.1
12.2 1.5
28.3
6.0 1.0 1.1 2.2 0.4 2.0 0.3 2.2 2.6 4.4
11.1 1.9
20.0Source: “Electronics and Computers”, International Industrial Prospects Quarterly, Spring 2006, 20-22.
As China enters the era of information technology, the growth of its
telecommunications market can be seen from the rate at which its number of telecom
and Internet users has increased over the past decade. For instance, its local switchboard
capacity and fixed-line subscription has grown by about 30% on average over the past
decade (Figures 2.3 and 2.4). The Chinese telecom market is also characterised by the
rapid expansion of its mobile network since the mid-1990s (Figure 2.4). It can be
noticed that mobile phone subscribers exceeded that of the fixed-line phone in 2003.
This pattern is also noticed within regional boundaries, where mobile phone
subscription has exceeded that of fixed-line phone in all provinces except Liaoning,
Jiangsu, Anhui, Hainan, Gansu, Xinjiang and Tibet in 2006. The market for mobile
phone is even almost twice as big as the size of fixed-line market in Beijing and
Guangdong Province.

Figure 2.3 Telecommunications network capacity in China (1978-2006)
0
100
200
300
400
500
600
700
1978
1979
1980
1981
1982
1983
1984
1985
1986
1987
1988
1989
1990
1991
1992
1993
1994
1995
1996
1997
1998
1999
2000
2001
2002
2003
2004
2005
2006
Mill
ion
lines
Fixed network Mobile network
Source: Lu and Wong (2003), Ministry of Information Industry (MII) website, http://www.mii.gov.cn/.
44

Figure 2.4 Number of fixed line and mobile subscribers in China (1988-2006)
0
50
100
150
200
250
300
350
400
450
500
1988 1989 1990 1991 1992 1993 1994 1995 1996 1997 1998 1999 2000 2001 2002 2003 2004 2005 2006
Mill
ion
subs
crib
ers
0
0.2
0.4
0.6
0.8
1
1.2
1.4
Fixed-line subscribers Mobile subscribers Ratio of mobile to fixed-line subscribers
Source: Lu and Wong (2003), MII website, http://www.mii.gov.cn/.
45

Figure 2.5 Fixed and mobile penetration rates in China (1988-2006)
0
5
10
15
20
25
30
35
40
1988 1989 1990 1991 1992 1993 1994 1995 1996 1997 1998 1999 2000 2001 2002 2003 2004 2005 2006
%
Fixed penetration Mobile penetration
Note: The penetration rate is defined as the number of phone subscribers per hundred residents.
Source: Estimated from Figure 2.4.
46

Source: Lu and Wong (2003); China Internet Network Information Center (CNNIC), 15th, 17th, 18th and 19th Statistical Survey Report on the Internet Development in China (Jan 2005, Jan 2006, July 2006 and January 2007), http://www.cnnic.net.cn/en/index/0O/index.htm.
0
20
40
60
80
100
120
140
160
1994 1995 1996 1997 1998 1999 2000 2001 2002 2003 2004 2005 2006 2007
Mill
ion
subs
crib
ers
Figure 2.6 Number of Internet users in China (1994-2007*)
47
Note: * As of January 2007.

Figure 2.5 shows that the mobile penetration rate in China has been increasing
rapidly since 1999, and it has exceeded the fixed line penetration rate since 2003, at
slightly above 20% and rising to 35% in 2006. Yet this rate was still low when
compared to other transition economies such as the Czech Republic (96.5% in 2003) as
well as Hungary, Estonia and Slovenia which had penetration rates of over 70%
(Vagliasindi et al., 2006). Another phenomenon is that the mobile penetration rate has
been growing by almost 70% annually on average, much higher than the 18% annual
growth rate of the fixed penetration rate. Whether there is any evidence of a fixed-
mobile substitution effect will be explored in Chapter eight of the dissertation.79
The dawn of the information age in China can also be shown by the explosive
growth of its Internet user population since the late 1990s (Figure 2.6). Internet
subscribers have exceeded 120 million in 2006, eight times the size in 2000. A
fundamental change in the Chinese Internet market is also reflected in the surge in
broadband access in recent years. Coined as the ‘broadband revolution’ by Morris
(2006), China has seen the number of broadband users jump almost forty times, from 2
million in June 2002 to 53 million four years later, growing at 90% annually on average
– in sharp contrast with that of dial-up service which grew by only 40% over the four
years and an average of 9% annually (Table 2.8). The number of China’s broadband
users has overtaken that of the US it reached 77 million in June 2006, which was 20
million more than the 57 million predicted for end of 2007 by market analysts, and
much higher than 54 million predicted for the US. 80
79 Fixed-mobile substitution is defined as “the use of mobile instead of fixed phone for calls or access to telecom services” (Vagliasindi et al., 2006: 350). 80 In terms of the total number of broadband subscribers, China was in the world’s third position in 2004 and rose to second in 2005. See “China will pass US in Broadband Lines by late 2006”, WebSiteOptimization.Com, http://www.websiteoptimization.com/bw/0601/, and “China to trump US in broadband subscribers”, CNET News.com, http://www.websiteoptimization.com/bw/0601/.
48

Table 2.8 Breakdown of Internet usage by services in China, 2002-06 (million users in June of the year)
Leased linea Dial-upb Broadbandc Mobile and
other forms of accessd
Totale
2002 16.1 33.4 2.0 - 45.8 2003 23.4 45.0 9.8 1.8 68.0 2004 28.7 51.6 31.1 2.6 87.0 2005 29.7 49.5 53.0 4.5 103.0 2006 26.8 47.5 77.0 19.1 123.0 Note: a. Leased line refers to users connected through the Local Area Network (LAN) via Ethernet. b. Dial-up users include ISDN (Integrated Services Digital Network) users. c. Broadband users refer to those who connect through the xDSL (Digital Subscriber Line) or cable
modem. d. Users who have access to Internet through the mobile telephone or other types of accessing
facilities such as mobile terminals or information appliances. e. The total does not add up to 100% as Internet users who adopt multiple methods of access have
been recounted. Source: China Internet Network Information Center (CNNIC), 10th - 18th Statistical Survey Report on the Internet Development in China (July 2002 - July 2006), http://www.cnnic.net.cn/en/index/0O/ index.htm.
2.5.2 China’s ICT trade
The rising importance of ICT to the Chinese economy is also indicated by the expansion
of trade in ICT products. The export of ICT products has grown 650 times since the
mid-1980s, from US$343 million in 1984 to US$226 billion in 2005 (Figure 2.7). As a
further demonstration of China’s rapid rise in the arena of ICT trade, the nation has
emerged as the world’s top exporter of ICT products (which include laptops, mobile
phones, digital cameras and other communications equipment) in 2004 – its export of
more than US$170 billion exceeded that of the US’ $149 billion.81 During the first three
quarters of 2006, China’s export of ICT products was estimated at US$520 billion, ten
times greater than that of 2001, the year when the nation joined the WTO (Zi, 2006).
China’s import of ICT has grown eighty times from US$2 billion in 1984 to
almost US$160 billion in 2005. From being an importer of ICT since the 1980s when it
relied primarily on technology transfer and import for the development of its ICT
industry, China became a net exporter for the first time in 1995. A recent study by
OECD also showed that China’s ICT exports have exceeded those of imports since
1995 (Katsuno, 2005). In the beginning of this century, the only category of ICT goods
81 One year earlier, in 2003, the US was the world’s top exporter of ICT products, at US$ 137 billion compared to China’s US$120 billion. See “OECD names China as top ICT goods exporter”, Telecomworldwire (Coventry: December 13, 2005); “China’s Export of ICT Products Topped USD180 billion in 2004”, SinoCast China Business Daily Nws (London: December 13, 2005); and “China beats US to top ICT exporter spot”, Office Products International (London: February 2006).
49

50
which China imported more than it exported are the integrated circuits (ICs) and some
basic components such as memory chips and CPUs (Katsuno, 2005). Since the mid-
1990s, China’s export share out of total ICT trade has gradually rose to almost 60% in
2005, except for two years – 1999 and 2000 – when it fell slightly below import share.
Furthermore, China’s trade balance in ICT products has been widening since 2001,
increasing by 25 times from US$2.7 billion in that year to US$65 billion in 2005.
China’s total trade volume of ICT has expanded by almost 170 times since 1984.
Its trade in ICT products has also steadily increased as a proportion of total trade, from a
mere 4% in 1984 to more than 27% in 2005 to reach more than US$386 billion (Figure
2.8).82 This ratio has been constantly rising since the mid-1980s, and such a trend is
therefore projected to continue in the next decade. The average annual growth rate of
trade in ICT products has also been consistently above that of total trade, except in 1986
when it dipped to a negative 34% (Figure 2.9). In fact, the growth of ICT trade has been
at least twice as fast as that of the total trade through most years of the past two decade.
2.6 Conclusion
Regarded as a relatively ‘latecomer’ to the ICT sector, China has risen very rapidly to a
prominent place in the world in terms of telecommunications infrastructure, market size,
ICT investment and high technology development. Convergence holds the key to the
future development of China’s ICT industry, at least in the next five years. A continued
rapid growth will be driven mainly by new products, new services and new demand
created by convergence between the traditional information technology sector (i.e.
computer) and the telecommunications sector, spurred by the Internet and 3G mobile
communications network applications.83
82 ICT products are referred to as ‘office and telecom equipment’ in WTO’s statistical source. 83 “Convergence assists ICT market growth”, China Daily (New York: March 23, 2005).

Figure 2.7 China’s trade in ICT products, 1984-2005
0
50000
100000
150000
200000
250000
1984 1985 1986 1987 1988 1989 1990 1991 1992 1993 1994 1995 1996 1997 1998 1999 2000 2001 2002 2003 2004 2005
US$
mill
ion
Exports Imports
Source: WTO Trade Statistics, http://www.wto.org/english/res_e/statis_e/statis_e.htm.
51

Figure 2.8 ICT and total trade in China, 1984-2005
0
200
400
600
800
1000
1200
1400
1600
1984 1985 1986 1987 1988 1989 1990 1991 1992 1993 1994 1995 1996 1997 1998 1999 2000 2001 2002 2003 2004 2005
US$
bill
ion
0
5
10
15
20
25
30
%
ICT trade Total trade Proportion of ICT out of total trade
Source: WTO Trade Statistics, http://www.wto.org/english/res_e/statis_e/statis_e.htm; State Statistical Bureau, China Statistical Yearbook, various issues.
52

-40
-20
0
20
40
60
80
100
1985 1986 1987 1988 1989 1990 1991 1992 1993 1994 1995 1996 1997 1998 1999 2000 2001 2002 2003 2004 2005
%
Growth of ICT trade Growth of total trade
Figure 2.9 Growth rates of ICT and total trade in China, 1985-2005
53
Source: Estimated from Figure 2.8.

A clear departure from the 1980s, Chinese policy on promoting the production
and use of ICT is now fixated on developing home-grown technologies and standards,
and providing continued support to domestic companies (Dedrick, Kraemer and Ren,
2004). To achieve these objectives, China has laid out the following high technology
projects to be undertaken for the 11th Five-Year Plan (2006-2010)84:
• Integrated circuits (IC) and software: establishing IC research and development
centres, industrializing the technology for 90-nanometer and smaller ICs, and
developing basic software, middleware, large key applied software and integrated
systems.
• New-generation network: building next-generation Internet demonstration projects,
a nationwide digital TV network and mobile communication demonstration
networks with independent property rights.
• Advanced computing: making breakthrough in technology for petaflop computer
systems, building grid-based advanced computing platforms, and commercializing
the production of teraflop computers.
• Satellite application: developing new meteorological, oceanographic, resource and
telecommunication satellites, and pollution-free thrust augmented carrier rockets;
building earth observation and navigation positioning satellite systems and facilities
and application demonstration projects for civil satellite ground systems.
• New materials: building demonstration projects for commercial production of high-
performance new materials badly needed in the information, biological and
aerospace industries.
As a result of the state policy focusing on computer hardware development for
domestic consumption, China will need to overcome various institutional and cultural
barriers if it were to catch up with the leading players (India at least) in the software
market. To overcome its competitive disadvantage posed by the language, it has been
suggested that China could focus on ‘niche markets’ in the ICT sector. For instance, the
Chinese could utilise the programming synergies between China, Japan and South
Korea due to the common requirements for developing software using the double-byte
84 Extracted from “Major High-tech Projects Planned for 2006-2010”, Zhongguo Wang (China Net), http://www.china.org.cn/english/2006lh/160294.htm.
54

programming.85 To overcome its shortage of skilled talents, China could establish more
joint ventures with foreign operators by setting up R&D and other forms of
development centres.
A few points should be noted about the structure of China’s ICT industry in the
years to come. Firstly, although the telecommunications industry, especially in
equipment manufacturing, is becoming more intensely competitive with more domestic
and foreign businesses appearing onto the scene, the provision of fixed line and mobile
phone services is still dominated by the ‘Big Four’ national carriers. For instance, in
2005, China’s fixed line telephone services were dominated by China Telecom and
China Netcom with market shares of about 60% and 33% respectively; while the mobile
phone services were dominated by China Mobile and China Unicom with shares of
about 63% and 33% respectively. 86 Secondly, China has moved away from the
traditional approach of relying on technological import and transfer from foreign firms.
Instead, with a vision to steer the country towards becoming a world power in science
and technology, as pointed out in the newly drawn 11th Five-Year Plan, China’s
competitive edge in ICT will more likely come from investment in innovation and the
application of new technologies, in which the country seems well-positioned to
‘increase its innovative capacity with strong political and financial support from the
government and a huge pool of scientists, engineers and researchers’.87
85 “China industry: Focusing on niche markets in the IT sector”, EIU ViewsWire (New York: January 21, 2004). 86 Snapshots International, China Fixed Telephone Services, March 2006; Snapshots International, China Mobile Phone Services, March 2006. 87 “Powerhouse that’s reinventing itself: A surge of innovation is fuelling growth in the mainland through an ambitious science and technology agenda”, South China Morning Post (Hong Kong: September 11, 2006).
55

APPENDIX TO CHAPTER 2
Table A2.1 History of China’s computer industry (1956-2004) 1956 1958 1959 1964 1965 1968 1973 1975 1976 1977 1979 1983
The preparatory committee of Institute of Computing Technology, Chinese Academy of Sciences (CAS) was set up on August 25. Model 103 (“August 1” in Chinese), China’s first computer was produced in August. The Institute of Computing Technology of CAS was formally founded on May 17. Model 104, China’s first large-scale Vacuum tube computer was developed in September. Model 119, a large-scale general computer was put into use in April. Model 109C, a large-scale general transistor digital computer passed the test conducted by the State Science and Technology Commission in June. The first 717 transistor computer was developed in July. Model 109B Computer was developed in December. Szuprowicz reported China making its own integrated circuits (ICs). Nippon Electric reported that China was producing high capacity LSIs (10K transistor elements compared to 12k US and Japanese elements) at the Beijing Semi-Conductor Plant in October. Model 013, a large-scale Vacuum tube computer was developed in November. Szuprowicz reported rapid strides in micro-processor work as a result of use of LSI work being done at Qinghua University. East China Research Institute of Computer Technology built the first large IC computer capable of five million ops. China developed a small electronic computer capable of responding to 100 voice commands. The Chinese Academy of Sciences (CAS) reported that the Shanghai Institute of Metallurgy developed an ECL 1024 bit random access memory of world standards. Model 757, a large-scale vector computer was developed in November.
1985
The Software Institute of CAS, which comprised three laboratories that split from the Institute of Computing Technology, was formed in February to accelerate the development of software technology in China.
56

1987 1990 1991 1993 1995 1998 1999 2000
CAS was expected to have a super computer capable of 20 million ops by that year. The National Research Centre for Intelligent Computing Systems (NCIC) was founded in March. Model KJ8920, a large-scale data processing system for Petroleum and Mineral Exploration was developed, which won the first prize of CAS Science and Technology Progress Award. Dawning Computer Company was founded in Beijing. Dawning-I, the first of a series of Dawning high-performance computers, was developed in October. The Computer Network Centre of CAS was founded in March when a part of lab 10 split from the Institute of Computing Technology. Dawning-1000, a massive parallel processor (MPP) system was developed in May. The Institute of Computing Technology commenced its “knowledge innovation project” initiated by the CAS in September. The Dawning 2000-II Superservers were exhibited at the Achievements Exhibition in September for the celebration of the 50th Anniversary of the People’s Republic of China. On January 7, a key project of the National ‘863’ Program – the combination of computer communication with house appliance II, passed the scientific and technological achievements appraisal organized by the CAS. On January 28, the Dawning 2000-II Superservers passed the scientific and technological achievements appraisal organized by the Ministry of Science and Technology, and passed the acceptance acknowledgement by CAS. From May 14-17, at the 4th Asia-Pacific High-Performance Computing International Conference and Exhibition held in Beijing, an Information Technology International Panel (ITIP) highly praised the Dawning 2000-II Superserver and considered that Chinese high-performance computers were close to the standards of advanced Western countries. On June 15, the Dawning 2000-II Superserver was formally situated at the Network Centre of CAS. On August 18, the Institute of Computing Technology signed a cooperation agreement with Nokia on the testing of IPV6 protocol. On November 27, the Dawning Series of Scalable Parallel computer
2001
system passed the scientific and technological achievements appraisal organized by the CAS. The Dawning-3000 Superserver was verified and accepted by the Ministry of Science and Technology in January.
57

2002 2004
The grid-oriented Linux Superserver was introduced in September. Dawning-4000A was developed in June.
Sources: Institute of Computing Technology, http://www.ict.ac.cn/; National Research Centre for Intelligent Computing Systems, http://www.ncic.ac.cn/; Witzell and Smith (1989).
58

Chapter 3
ICT, PRODUCTIVITY AND GROWTH: DEBATES AND MEASURES
3.1 Introduction
With the invention of the computer in the 1960s and emergence of the Internet since the
early 1990s, the age of information and communications technology (ICT) has dawned
upon the world. The widespread use of the Internet has brought about fundamental
changes to the livelihood of people around the world. Also hailed as the “third industrial
revolution”, the ICT revolution affects the economy on all fronts by improving
production methods and changing consumer behaviour. While businesses and
governments are investing in ICT and electronic commerce (or e-commerce) to reduce
costs and improve productivity, consumers now enjoy the benefit of time and cost savings
as they can shop on the Internet with access to more complete information and better
quality of goods and services that are available (Chaker, 2005). In macroeconomic
theory, such phenomenon has been brought about by increased production and use of ICT
in the production process, which in turn generates more output as a result of increased
labour productivity.
This phenomenon has been observed in most developed countries, especially the
US. However, even among the developed countries, it is found that productivity growth
attributed to ICT was higher in the US than in other countries. As my research focuses on
the emergence of ICT as well as its rising importance to China’s economy, it is necessary
to conduct a review of the main debates and measurement issues. The chapter begins with
a general discussion of debates on issues underlying the role of ICT in the ‘new
economy’. This is followed by a discussion of the debate concerning the “Solow
paradox” which originated from observations that productivity growth did not seem to
materialise from increased ICT investment. Finally, the chapter examines the theoretical
frameworks used to measure the contribution of ICT to economic and labour productivity
growth, where ICT capital is distinguished from other factor inputs in the growth
accounting framework.
59

3.2 Debates on the role of ICT
The explosive growth in ICT investment, especially during the 1990s in the US and other
developed economies, has led to a call for new economic theories and models, which can
be employed to assess the impact of ICT investment on economic growth. In the literature,
ICT is often associated with the term ‘New Economy’, which generally refers to an
economy that is characterized by increased investment in and use of ICT. Kraemer and
Dedrick (2002a) defined the ‘New Economy’ as ‘the association of non-inflationary,
sustained economic growth with high investment in ICT and a restructuring of the
economy due to the use of ICT-led innovations such as enterprise systems, supply chain
management, customer relationship management, the Internet and e-commerce.’
Salvatore (2003) referred the New Economy to “the rapid improvements and spread in the
use of ICT, based on computers, software, and communications systems.” Lipsey (2004)
used the term ‘New Economy’ to refer to ‘the social, economic and political changes
brought about by the current revolution in ICTs – the revolution that is driven by
computers, lasers, satellites, fibre-optics, the Internet and other communications-related
technologies’. It can thus be seen that the investment in and use of ICT in generating
output is the heart of the issue.
3.2.1 ICT and productivity growth: A microeconomic view
The relationship between ICT and output growth can be explained from the
microeconomic as well as macroeconomic perspectives. The microeconomic perspective
normally explains how firms derive productivity gains from investment in ICT. It is based
on the assumption that ICT can be treated as an input in the production function of a firm
and a substitution effect exists between ICT and non-ICT factors. Firms generally can
benefit from ICT investments through adaptation and innovation in their work processes
(OECD, 2004). ICT investments therefore create competitive advantages by improving
the operational efficiency of business processes which in turn will lead to better
firm-level performance (Hu and Quan, 2005).
The following explanation is drawn from Oz (2005), as illustrated in Figure 3.1.
When a firm adopts a new ICT (which may be an innovative hardware equipment or
software application), its productivity as well as income and profit increase as the new
technology enables the firm to produce the same goods or services more efficiently, or to
produce new goods or services. Gradually, as all firms competing in an industry
60

successfully adopt the technology, the ICT becomes standard over time. 1 With the
increased productivity, firms are now able to offer their goods or services at lower prices.
In the final phase, firms may experience a decrease in cash value of their goods and
services due to the decrease in prices in spite of the productivity gains. However,
productivity has increased simply because the firm can now produce more units of its
goods or services at lower costs, and subsequently, is able to invest more in ICT in the
future.
Figure 3.1 ICT and firm productivity
Adoption of new ICT
Cash value decreases due to productivity gains
Increased income and profit
New ICT becomes standard
Competition pushes prices down
Source: Oz (2005: 794).
One of the earliest researches at the firm-level found that spending on information
technology capital has had a substantial contribution to output, providing an answer to
the ongoing debate on the ‘productivity paradox’ which will be discussed in a later
section (Brynjolfsson and Hitt, 1996). In that study which used data on information
systems spending in more than 300 firms for the period of 1987-1991, the marginal
product for computers was found to be higher than investment returns on other types of
capital. More specifically, the marginal product for computer capital was approximately
0.81 per year, meaning that an additional dollar of spending on computer capital yields an
increase in output by 81 cents.
A few hypotheses have been constructed pertaining to the relationship between
ICT investments and firm/industry productivity, according to Hu and Quan (2005). First,
industries with high value of ICT intensity such as manufacturing, transportation,
1 For instance, all banks adopted ATM technology which became standard by the late 1970s in the US (Oz, 2005).
61

banking and the retail sector would benefit more from ICT investments as efficiency is
significantly enhanced by the use of computer applications which further reduces errors
and time taken for the completion of business processes.
Second, ICT investments can also improve the efficiency of ‘value-chain’
activities such as human resource management, procurement and technology
development. However the contribution of ICT to productivity will be limited in
industries with low value-chain information intensity, such as the construction and
building materials industries which is mainly dependent on the production technology.
Therefore the impact of ICT investments on a firm’s productivity will depend on whether
it invests in ICT assets to enhance its strategic and operational capabilities in times of
favourable conditions, such as in anticipation of higher productivity.
A few studies of Italian manufacturing firms have found a strong impact of ICT
investment on firms’ productivity growth. In the work of Atzeni and Carboni (2006), ICT
productivity was found to be about eight times greater than that of non-ICT investment,
given the former’s proportionately low share of total investment. Firms which invested in
technology appeared to be more efficient than those which invested mainly for
replacement purpose. In addition, firms which invested in standardised technology were
found to be more productive than those which invested in new technology due to the costs
and risk involved in learning and adopting the new skills. In summary, realising the
benefits of ICT adoption requires some reorganisation of the ‘complete cluster of tangible
and intangible components that make up the firm such as skill, infrastructure,
organisation structure, diffusion and adaptation, etc.’ (Atzeni and Carboni, 2006). In
another study of about 1,500 Italian manufacturing firms, ICT is found to have a stronger
impact on productivity in information-intensive industries than that of traditional
low-technology industries, especially those firms that adopt ICT and ‘change their
internal organization by reducing the number of hierarchical levels and making more
intensive use of teamwork and worker participation’ (Fabiani, Schivardi and Trento,
2005).
3.2.2 ICT and productivity growth: A macroeconomic view
In the preceding section, the ‘microeconomics view’ which looks at how ICT investments
create values to output at the firm and industry level, mainly through generating excess
returns over other forms of capital investments, was discussed. This section goes on to
62

examine the ‘macroeconomic’ perspective, which looks at how the national economy
benefits from ICT investment.
A typical macroeconomic framework pertaining to the relationship between ICT,
productivity and economic growth is illustrated in Figure 3.2. Traditionally, this is based
on the production function model where output is a function of factor inputs, namely,
capital and labour. In the ICT literature, capital is divided into ICT capital and non-ICT
capital. The theoretical basis with which to distinguish ICT capital from other forms of
capital was established in Yorukoglu (1998). First, compared with other capital, ICT
capital has a much higher pace of technological improvement.2 Second, the rapid pace of
technological improvements in ICT equipment gives rise to the problem of poor
compatibility between ICT and non-ICT capital. Lastly, the efficient use of ICT is
relatively more dependent on skills and experience, which requires more investment in
human capital. In the production function model, the factor inputs are transformed into
outputs through the processes of capital deepening, improvement in labour quality and
technical progress (also known as total factor productivity, or TFP). 3 During the
transformation process, the production methods can be improved or enhanced by
complementary factors such as investment in human capital or a more efficient
organizational practice. Output can be measured at three levels, namely, country (i.e.
national), industry and firm level.
As the chapter will show later, there has been an acceleration of productivity
growth in many developed countries since the mid-1990s. To explain how the late 1990s
is different from earlier periods, Pohjola (2002) identified three main trends, i.e.
technological breakthrough in the semiconductor industry occurring in the mid-1990s,
increase in network computing due to the rapid diffusion of the Internet, and acceleration
in labour productivity growth in the US non-farming business sector. Pohjola also
summed up three major ways of measuring the size of ICT in the New Economy: (i) the
shares of production, employment and export of ICT in the economy; (ii) the use of ICT,
i.e., average share of ICT spending in GDP; and (iii) the size of the Internet which
provides a proxy measure of a country’s degree of global integration through digital
means.
2 For instance, within a span of less than a decade, IBM introduced its Pentium PCs that were 20 times more powerful in terms of speed and memory capacities at about the same costs (Yorukoglu, 1998). 3 In the traditional growth accounting literature, TFP and technical progress are used interchangeably. In the stochastic frontier literature, technical progress is only a part of TFP.
63

Figure 3.2 ICT, productivity and growth
InputsCapital ICT capital Non-ICT capital Labour
Process Capital deepening Labour quality Technical progress (Total factor productivity)
Outputs Economic growth/ productivity growth measured at 3 levels: Country level Industry level Firm level
Complementary factors Organization and management practices Industry organization and regulation Economic structure Government policy Investment in human capital
Source: Dedrick, Gurbaxani and Kraemer (2003: 3).
Therefore, how is ICT related to productivity growth and why is it important? In
the analysis, there are two distinct concepts of ‘productivity’. The first is average labour
productivity (ALP) which usually means output per hour worked; and second is the total
factor productivity (TFP), also known as multifactor productivity (MFP), which refers to
the growth in total output that is not accounted for by the growth in factor inputs. 4 TFP
growth is often analogously used to mean technological progress, the sources of which
include new technology, organizational skills and economies of scale (McGuckin, Stiroh
and van Ark, 1997). Conceptually, TFP growth allows additional output to be produced
from the same inputs, as a result of improved production methods. TFP is usually
measured by estimating a production function such as:
)( tttt LKfAY ⋅= (3.1)
where At represents TFP which is also equivalent to:
)( tt
t
LKfYTFP = (3.2)
64

However, it should be noted that although TFP is often used to represent
technological change caused by more efficient production methods or better skills of the
labour force, it could also be a function of exogenous factors such as government policy,
monetary shocks and military spending, or even crime and disease which have negative
effects on output for any given amount of inputs as they cause workers to become less
productive.5
3.2.3 The ICT productivity paradox
Generally, the national economy gains when there is an overall improvement in
productivity across all firms. Networking among firms investing in ICT will also reduce
transaction costs and speed up the innovation process in the economy (OECD, 2004).
Such network externalities have been generated with the widespread use of the Internet
and e-commerce which leads to further diffusion of ICT within the economy. The channel
through which ICT affects economic growth is explained by Timmer and van Ark (2005).
First, the production of ICT goods increases TFP growth in ICT-producing industries.
Next, ICT investment is induced by rapidly falling prices of ICT goods. Jorgenson
(2001), in accounting for the sharp acceleration in the level of economic activity since
1995, demonstrated that the decline in ICT prices will continue for some time, which will
in turn provide incentives for the ongoing substitution of ICT for other productive inputs.
He concludes that the accelerated ICT price decline signals faster productivity growth in
ICT-producing industries, which have been the main source of aggregate productivity
growth throughout the 1990s. Parham (2004) however questioned the effect of decline in
prices on productivity, as it merely leads to input substitution and movements along the
production frontier, but not any shifts of the frontier. Finally, ICT is viewed to function as
a form of General Purpose Technology (GPT) which ‘facilitates and induces firms to
introduce more efficient organizational forms, subsequently boosting productivity
growth throughout the economy’ (Timmer and van Ark, 2005). 6 Three major
technological developments have been identified that helped establish ICT as a form of
GPT: technological advances that combined computing power with portable sizes (such
as desktops and laptops) at affordable prices; the convergence of information
technologies and communications technologies to form what we now refer to as ICT such
4 MFP is used in conjunction with TFP in the literature, and the dissertation will use TFP throughout as the standard term that defines productivity growth that is attributed to variables other than factor accumulation.
5 “Dictionary Definition of Total Factor Productivity”, Economics at About.com, http://economics.about.com/.
65

as the Internet and other networking devices; and new software applications which
improve the user-friendliness of computers to a larger segment of the workforce (Parham,
2004).
The story behind the relationship between ICT and economic growth has largely
been that of input substitution between ICT capital (mainly computers) and non-ICT
capital. First, there has been a dramatic decline in the price for computers in the US since
the 1970s. According to McGuckin et al. (1997), the price of computers in the US
decreased at more than 17% annually between 1975 and 1996. This in turn led to a
massive investment in computers, resulting in the share of computers in the producers’
durable equipment increasing from zero to more than 27% during the same period.
However, it is also found that the most computer-intensive sectors have produced the
slowest productivity growth in the US during the 1970s and 1980s, which led Robert M.
Solow to remark in 1987 that ‘you can see the computer age everywhere but in the
productivity statistics’, which came to be known as the ‘Solow paradox’ or ‘ICT
productivity paradox’ (Pohjola, 2002). It was generally concluded that ICT investment
was a too insignificant share of the national capital stock to produce substantial economic
effects (Dedrick et al., 2003). Nevertheless, there has been a rapid increase in the share of
ICT investment. For example, Dedrick et al. (2003) reported that ICT capital as a share of
the total capital investment in the US increased from a mere 3.5% in 1980 to 9% in 1990.
Another study found that the average share of ICT expenditure in the country’s GDP
during the period of 1992-99 was 8.1% for Australia and the US, 7.6% for Canada and
Singapore, 6.5% for Japan and Hong Kong, 5.3% for Korea and 4.1% for Taiwan in the
same period (Pohjola, 2002).7
There have been efforts to examine the Solow paradox. McGuckin et al. (1997)
found that computers were actually highly concentrated in the service sectors and in only
a few manufacturing sectors during the 1970s and 1980s, although they might “appear
everywhere”. They also reported a similar pattern occurring in the OECD countries where
computers were highly concentrated in specific sectors. The authors further revealed that
computer-using sectors showed faster ALP growth than other sectors in the 1980s. When
they restricted their sample to the manufacturing sector alone, it was found that the
6 General purpose technologies (GPTs) can be defined as ‘changes which transform both household life and the ways in which firms conduct business. They include the steam engine, electricity and information technology’ (Jovanovic and Rousseau, 2003). 7 The share of ICT investment in China’s GDP will be estimated in Chapter five of the dissertation.
66
computer-using sectors showed dramatic increases in ALP growth which was almost
three times faster than that of the non-computer-using sectors for the period of 1979-91.
Despite the productivity slowdown in the past two or three decades, there is
compelling evidence to support the argument that ICT is still a significant factor in
economic and productivity growth. For instance, Jorgenson and Stiroh (1999) found that
while TFP growth for 1973-90 was only 0.3% on average and it lowered further to 0.2%
in 1990-96, the TFP decline was due to the decline in the growth of capital inputs. They
then provided evidence that computer substitution for other forms of capital and labour
inputs had indeed taken place in the US which contributed to economic growth. They
found that computer inputs contributed 0.16% to the annual output growth of 2.4% for
1990-96, which is a direct consequence of substitution toward relatively cheaper
computers.
Even with evidence in support of a strong productivity revival that is associated
with the increase in ICT investment, there is also some debate that questions whether
such revival has been due to other factors such as the effects of the business cycle or
structural changes in the economy. Robert J. Gordon is an ardent skeptic of the ‘ICT
productivity’ debate, even though he reports that Robert M. Solow had declared his 1987
paradox statement as obsolete (Gordon, 2000). His argument comes in twofold: (i) the
major revival in TFP productivity growth in 1995-99 occurred mainly within the durable
manufacturing sector, including the manufacturing of computers and semiconductors,
which accounted for only 12% of the private business economy. The spread of the New
Economy into the remaining 88% of the economy is therefore questionable; (ii) the period
of 1995-99 is considerably shorter than the earlier time periods under study, and he
therefore questions the sustainability of long-term growth of the New Economy.
Nevertheless, the Solow paradox has been ‘put to rest’ (Dedrick et al., 2003: 22).
As the ongoing debate will further prove, ICT investment is and will continue to be a
significant force to improving firm, industry as well as national productivity, especially
due to innovation and invention of more advanced softwares as a result of increased
expenditure on R&D and human capital. This can be explained by the fact that ‘while it
was difficult for companies to adopt automation processes such as phone calls and
personal face-to-face services during the period before the mid-1990s, ICT gradually
provided the ability to improve efficiency and productivity in services as it developed
67

rapidly’ (Atkinson, 2006). Examples include electronic banking payments, the design of
cars using computer programmes and delivery of machine parts in the automobile
industry (Atkinson, 2006).
There were recent signs of slowing productivity growth of the US workers. The
latter dropped to 1.8% in 2005 from 3% in the previous year. In response to that, the
former Federal Reserve Chairman Alan Greenspan suggested that ‘the economy is
unlikely to maintain rapid advances from productivity gains unless information
technology can be obtained from new sources, which could be the greater and more
efficient collaboration between people and companies’ (Chabrow and McGee, 2006).
Conference Board economist Catherine Guillemineau however noted that US
productivity growth was still higher than that of the European Union, due to ‘greater
flexibility and adaptability among US companies and managers, particularly their ability
to adapt very quickly to far-reaching innovation’ (Chabrow and McGee, 2006).
Future productivity gains will depend on the following factors, as explained by
Atkinson (2006): technology that is easier to use and more reliable, i.e. less complicated
digital technologies; linking together a variety of services, such as the interconnection
between televisions, phones, laptops, printers and MP3 players at home, or the integration
of new devices such as smart cards, e-book readers and sensors in information systems;
improved technologies are needed in areas such as monitoring of large networks,
distributed database and systems integration, or other technologies such as better voice,
handwriting and optical recognition features which facilitate easier interaction between
humans and computers; and lastly, a more ‘ubiquitous or simultaneous adoption of the
Internet across homes and industries such as broadband connections and use of electronic
bill payment in the government, health care, transportation and many other business
service sectors’ (Atkinson, 2006). In fact, it has often been speculated that robots would
play the key role in the economy, especially after 2015 when the rapid rate of progress in
computer chip technology known as Moore’s Law is predicted to reach its end (Atkinson,
2006).
The debate over the paradox between ICT and productivity growth could perhaps
be wrapped up from a microeconomic or organisational perspective, as summed up in
Hughes and Morton (2005). Based on a case study of Schneider National Inc., the second
largest full truckload transportation company in the US, two key lessons were drawn
68

about the impact of ICT on overall productivity growth at the national level. First, ICT
users are more significant than ICT producers in accounting for labour productivity
growth. The demand for, as well as the capacity to absorb the output of ICT-producing
sectors by high-tech users are the crucial drivers of recent performance in the US
economy, which further depend on ‘the technical competence of management in
implementing appropriate investments in complementary assets’. The second factor
relates to the time taken for the process to work through the productivity transformation
of the late 1990s. Despite the rapid fall in ICT prices (such as the price of computers), it
had to take decades for cost savings to materialise when the link with ICT through
adoption of communications standards and implementation of a software system
produced the productivity acceleration of the 1990s (Hughes and Morton, 2005). In other
words, ICT will only become significant when it is used effectively to enhance business
competitiveness.
3.3 Measuring the contribution of ICT to productivity and economic growth
In the computation of ICT capital contribution to growth, authors generally define ICT
capital to be comprised of computer hardware, software and communications (or
electronic) equipment (Dedrick et al., 2003). Literature on productivity gains of ICT
capital goods looks at the potential for increasing returns to investment in non-ICT capital
goods as well as labour, as ICT products have ‘high up-front development costs and low
marginal costs’ and at the same time, ICT innovations are easily ‘captured in replicated
sets of instructions such as semiconductors and software code’ (Kraemer and Dedrick,
1999).
ICT capital contributes to growth in a different manner from other forms of
capital. By comparing the intrinsic differences between ICT and non-ICT capital, it was
found that ICT capital differs from other forms of capital in terms of the rate of
technological progress, the compatibility between old and new capital, as well as the
extent of learning by doing (Atzeni and Carboni, 2006). First, technological progress
would bring uncertainty to usage of new ICT capital goods due to the effects of learning,
compatibility and organizational structure, as capital goods of different vintages may not
be perfectly compatible with each other owing to changes in technological standards.
Second, firms do not simply invest in new machines and equipment although more
efficient ICT (as well as non-ICT) capital becomes available. Rather they would also
69
invest in capital with technological standards that are equivalent to those already owned.
This section discusses three main areas where the contribution of ICT to growth is
concerned, namely, the contribution to output growth, average labour productivity (ALP)
growth, and total factor productivity (TFP) growth.
3.3.1 ICT contribution to GDP or output growth
Most studies that explore the contribution of ICT to GDP or output growth employ the
standard neo-classical growth accounting framework pioneered by Solow (1957). The
most commonly used method to measure the contributions of ICT to (US) economic
growth and labour productivity growth is the production function approach, notably
employed by Jorgenson and Stiroh (2000), Jorgenson (2001), and Jorgenson, Ho and
Stiroh (2003a).
Based on Equation (3.1), an extended form of the production function that
explicitly distinguishes ICT capital from non-ICT capital is given by Jorgenson, Ho and
Stiroh (2003a) as:
Yt (Yn, IICT ) = At · X(ICTt , KNt , Lt) (3.3)
where total output, Yt, comprises ICT investment goods (IICT) and non-ICT output (Yn),
and capital services are decomposed into ICT capital (ICTt) and non-ICT capital services
(KNt). Total factor productivity (TFP) is represented by (A) which augments the input
function (X). Therefore, an advantage of employing this production function is having a
clearly defined contribution of ICT capital to economic growth. We can measure the
contribution of individual inputs to output growth by re-expressing the relationship
between inputs and output from Equation (3.3) as follows:
Growth of GDP = ICT capital’s share times growth of ICT capital input + Non-ICT capital’s share
times growth of non-ICT capital input + Labour’s share times growth of labour input + Aggregate
TFP growth
The technical detail which is based on Oulton and Srinivasan (2005) will be
explained in Chapter 6 of the dissertation. A positive correlation between ICT investment
and GDP growth has been found by Kraemer and Dedrick (1999) in a study of 43
countries including China, from 1985 to 1995. They show that ICT investment makes a
70

significant contribution to economic growth of the developed countries due to the
existence of a ‘complementary system of ICT infrastructure’ but not to the developing
countries which are obviously lacking in such investments. In that study, China is
regarded as an ‘outlier’ case with its exceptionally high correlation between growth in
ICT investment and GDP growth, as well as on a per worker basis. Therefore, one
question is to what extent a cross-country analysis of developing countries is applicable to
China, which has a low proportion of ICT investment to output but has one of the world’s
largest ICT market and a rapidly-growing ICT infrastructure such as the telecom network
and Internet.
In a recent study of the contribution of ICT to economic growth in Australia,
using a database that covers 10 capital stocks, 5 inventory stocks and labour as inputs in
the production function, it is shown that the returns from ICT investment more than
compensates its cost to producers (Diewert and Lawrence, 2005). This is attributed to
several factors, such as rapidly falling ICT prices, innovation-related externalities
associated with investment in ICT technologies, and investment in human capital
associated with the acquisition and operation of ICT technologies in the business sector
(i.e. the process of ‘learning-by-doing’). For the reasons above, investment in ICT
equipment tends to contribute more to GDP growth than an equal investment in other
forms of capital such as structures and transport equipment in developed countries
(Diewert and Lawrence, 2005).
3.3.2 ICT contribution to average labour productivity (ALP) growth
The contribution of ICT investment on the labour productivity has also attracted attention
from researchers. Labour productivity growth, or the growth in output per worker, is a
measure of the efficient use of resources in creating value to goods and services, since it
‘allows the economy to provide lower-cost goods and services relative to the income of
domestic consumers, and to compete for customers in international markets’ (Dedrick et
al., 2003: 4).
The calculation of ALP is derived from the production function approach outlined
in Equation (3.1) above. Jorgenson et al. (2003a) defined ALP as the ratio of output to
hours worked such that ALP = y = Y/H, where y denotes output (Y) per hour (H). The
ALP function can be rewritten in the double-log form as
71

Δln yt = αICT ΔlnICTt +βKNΔlnKNt + γL (Δln Lt – Δln Ht) + Δln At (3.4)
where αICT, βKN and γL denote the respective factor income shares of output, whereas
ΔlnICTt and ΔlnKNt (denoted in lowercase) reflect changes in the respective use of ICT
and non-ICT capital per worker, or capital deepening, as explained below. Equation (3.4)
indicates that ALP growth comprises three components: (i) capital deepening, which
Jorgenson et al. (2003) defined as “the contribution of capital services per hour and
allocated between ICT and non-ICT components” (=αICTΔlnICTt + βKNΔlnKNt). It
enhances the efficiency of labour by increasing capital per worker in proportion to the
capital share (that is, increase in the capital-labour ratio); (ii) labour quality, which is
defined as ‘the contribution of increases in labour input per hour worked’ [γL (Δln Lt – Δln
Ht)]. It reflects changes in the composition of the workforce and raises labour
productivity in proportion to the labour share; and (iii) TFP, which augments factor
accumulation (Δln At) (Jorgenson et al., 2003a).
The relationship between ICT and productivity has generated numerous debates.
In particular, the debates have focused on how ICT contributes to productivity growth.
Indeed, the general consensus is ICT being a key (or rather, the key) driver of factor
productivity and growth resurgence, particularly with reference to the acceleration of the
US’ ALP and TFP growth since the mid-1990s, albeit differences in the magnitude of
contribution to growth. All studies show that the contribution of ICT capital to the growth
of output, labour productivity and TFP in developed as well as developing countries has
increased over the past decade. Most literature also shows that ICT capital contributes to
ALP growth through capital deepening, that is, an increase in the capital-labour ratio.
These studies are examined in the remaining sections of the chapter.
A distinctively different approach to the conventional growth accounting method
that examines the association between ICT investment and economic growth was
explored in Lee, Gholami and Tan (2005). The authors used the Solow residual approach
on 20 countries to examine evidence of the contribution of ICT investments to economic
growth. The authors found that developed countries and NIEs experienced growth in ICT
investment, while developing countries (including China) did not gain productivity
improvements from their ICT investments. They further suggested ICT-complementary
factors to rectify possible flaws in ICT policies as a contribution towards improvement in
global productivity.
72

On top of the discussion about the contribution of ICT, questions have also been
raised about the effect of intangible factors on labour productivity. Brynjolfsson (2003)
asked what the real drivers of productivity growth are: ICT capital, technology
complements or intangible assets such as human capital and business culture. Sharpe
(2003) pointed out the following factors as the main drivers of productivity growth -
capital intensity, technological innovation and human capital. He further elaborated on
the environment which may influence the productivity drivers - economies of scale and
scope, taxes, social policies, unionization, regulation, capacity utilization, minimum
wages and competition. Some of these factors may have implications for China, such as
the impact of deregulation and competition on output, trade and employment following
its entry into the World Trade Organization (WTO). Atzeni and Carboni (2006) have also
pointed out that the benefits from ICT may be lost and give rise to higher costs rather than
improving output if ICT does not improve together with the other components of a
‘complex set of causalities’ which include both tangible and intangible assets such as
skill, infrastructure, organisation, diffusion, adoption and adaptation.
3.3.3 ICT contribution to TFP growth
Most of the literature reviewed in this chapter uses the conventional growth accounting
method to measure the contribution of ICT capital to output growth or labour productivity
growth. In the production function, TFP is derived as a residual. However, one question is:
what drives TFP growth? There are a few studies that further examine the role of
ICT-producing sector to the growth of TFP. The production possibility frontier model
developed by Jorgenson et al. (2003a) is a typical representation of the methodology
employed to measure the contribution of ICT to TFP growth.8
Jorgenson et al. (2003a) used the ‘price dual approach’ to estimate TFP growth in
the ICT-producing industries, based on the assumption that TFP growth is reflected by
the decline in relative prices of ICT investment goods. The price declines are weighted by
the share of ICT investment in total output in order to estimate the contribution of ICT
production to the national TFP growth. TFP growth is then decomposed as follows:
NNICTICT AuAuA lnlnln Δ+Δ=Δ (3.5)
73

where aggregate TFP growth is represented by AlnΔ , ICTu represents ICT’s average
share of output, is TFP growth related to ICT production, and therefore ICTAlnΔ
ICTICT Au lnΔ is the contribution of ICT production to TFP while NN Au lnΔ is the
contribution of non-ICT production to TFP growth derived as a residual of Equation (3.5).
The authors estimated the contribution of ICT production to TFP growth by estimating
the output shares and growth rates of TFP for computer hardware, software and
communications equipment.
Earlier studies had emphasized the role of semiconductors as a key driver of the
acceleration in TFP growth in the ICT-producing sector, and attributed productivity (i.e.
TFP) gains to the sharp decline in semiconductor prices, especially for the years after
1995 (Jorgenson, 2001; Jorgenson et al., 2003a; Oliner and Sichel, 2003). The reduction
in the product cycle of semiconductors from three to two years in 1995 was cited as a key
source of TFP growth acceleration, owing to increasing competition in the semiconductor
industry. The average TFP growth for ICT production in the US was 7.35% for
1990-1995, and increased to 9.31% for 1995-2000 (Jorgenson et al., 2003). Oliner and
Sichel (2003) constructed a five-sector model that specifically focused on the
contribution of semiconductors to TFP growth, and presented the equation for TFP as
follows:
sii
i PFTPFTPFT +=∑=
4
1μ
(3.6)
where i represents the four final-output sectors, s denotes the semiconductor sector, and
the µ term for each sector represents its output expressed as a share of total non-farm
business output in current dollars. By isolating from the other ICT sectors, they found
semiconductors as the greatest contributor to TFP growth, and even exceeding that of the
four aggregate non-ICT sectors for the period of 1995-2001. Similarly, Jorgenson (2001)
highlighted the significance of the development and deployment of semiconductors as the
foundation for US growth resurgence, owing to the decline in the prices of ICT
equipment. He further queried the implications of the lack of ‘constant quality price
indexes for semiconductors and ICT in national accounting systems outside the US’ for
8 In Jorgenson et al. (2003), the term ‘productivity growth’ is used to refer to TFP growth.
74
developing countries such as China and India.
3.4 Conclusion
This chapter serves mainly to draw the theoretical link between ICT investments or
capital and productivity growth, based on the microeconomic (or firm-level) as well as
macroeconomic perspectives. The former explains how ICT investment benefits firms by
improving their competitiveness and efficiency, and thereby increasing productivity. The
latter approach normally explains how ICT capital contributes to the national productivity
and output growth through the improvement of production methods, using the production
function model. This chapter further introduces how authors have recently modified the
conventional production function model by distinguishing the effect of ICT capital from
other forms of capital. Essentially, there are three major approaches in examining the
issue of ICT and growth: the contribution of ICT to (i) economic growth, (ii) average
labour productivity (ALP) growth, and (iii) total factor productivity (TFP) growth.
Empirical evidence related to these issues will be presented in Chapter 4 of the
dissertation.
75

Chapter 4
ICT, PRODUCTIVITY AND GROWTH: EMPIRICAL STUDIES
4.1 Introduction
This chapter aims to review the most recent empirical studies on the contribution of ICT
to productivity and economic growth of various countries, covering the past five years
or so. This chapter carries on from the previous one by examining the empirical
evidence related to the contribution of ICT to economic growth. It presents a survey of
empirical evidence concerning productivity revival in the US and other countries, which
tells whether ICT capital is becoming a major driving force of growth. The empirical
results for various countries, which are mainly developed and a few developing
countries, are then presented to illustrate the differing contribution of ICT capital. The
chapter begins with the following section which presents a set of empirical studies that
look at the contribution of ICT capital to economic growth of the country/countries
involved. This is followed by another section which surveys empirical evidence dealing
with the contribution of ICT capital to average labour productivity (ALP) growth. The
subsequent section further examines the contribution of ICT to total factor productivity
(TFP) growth at both country and industry level. Finally, literature that has included
China in the studies is highlighted.
4.2 ICT contribution to economic growth
Being the world’s largest investor in ICT capital, the US is not surprisingly the most
extensively researched for an individual country in this area on the relationship between
ICT capital and growth/productivity. Other developed countries have been found to lag
behind the US in terms of the size of ICT investment and the contribution of ICT to
productivity growth. Salvatore (2003) attributed the US’ superior performance to other
G7 countries to the greater efficiency of the US’ labour market, a more sophisticated
financial market, and the highest price competitiveness as well as growth potential
among the G7 countries.
The empirical evidence for the resurgence of US economic and productivity
growth during the 1990s is well established in Jorgenson (2001), Jorgenson et al.
(2003a), and Oliner and Sichel (2000, 2003). Empirical works on countries other than
76

the US include Colecchia and Schreyer (2002), Diewert and Lawrence (2005),
Harchaoui et al. (2003), Javala and Pohjola (2001), Jorgenson and Motohashi (2005),
Kim (2002), Lee and Khatri (2003), Oulton and Srinivasan (2005), Parham et al. (2001),
Robidoux and Wong (2003), Schreyer (2000), and Simon and Wardrop (2002). Among
the studies pertaining to countries outside the G7 countries, Parham et al. (2001), Simon
and Wardrop (2002) and Diewert and Lawrence (2005) look at Australia specifically,
Javala and Pohjola (2001) study Finland, Kim (2002) investigates Korea, and Lee and
Khatri (2003) include several Asian developing countries, including China, in their
model.1
Current studies show that the GDP growth rate has generally accelerated in the
US and other OECD countries between the pre-1995 and post-1995 periods. The US,
for instance, has witnessed a jump in the GDP growth rate from about 2.7% to more
than 4% between the periods before and after 1995 (Jorgenson et al., 2003a; Oliner and
Sichel, 2003). Output growth in most of the OECD countries has increased between the
first and second halves of the 1990s, with the exception of Germany, Japan and Korea.
For the years between 1995 and 2000, output growth ranged from 2.8% in France to
over 4% in Australia, Canada and US, and 6% in Finland (Colecchia and Schreyer,
2002; Harchaoui et al., 2003; Jalava and Pohjola, 2001; Simon and Wardrop, 2002).
At the same time, there has been an increase in the contribution of ICT capital to
the economic growth of these countries. During the first half of the 1990s, the share of
contribution from ICT capital ranged from 8% in the former West Germany to more
than 18% in Canada and France (Schreyer, 2000). The contribution from ICT capital to
GDP growth in the US increased from 0.42 percentage point in 1973-95 to 0.98
percentage points in 1995-2000, with the share rising from 15% to 24% respectively
(Table 4.1).
Among the OECD countries under study, only Japan and Korea have a
contribution of ICT capital of more than 25% which exceeds that of the US (Colecchia
and Schreyer, 2002; Kim, 2002). Colecchia and Schreyer (2002) extended the analysis
of Schreyer (2000) to compare the impact of ICT capital accumulation on output growth
in the G7 countries with the inclusion of Australia and Finland for the period of 1980-
1 Literature in this field of research is exhaustive, and it would suffice for the dissertation to focus on a sample which will provide a summary of evidence showing the relationship between ICT and growth.
77

2000. They found that over the past two decades, ICT contributed between 0.2 - 0.5%
per year to economic growth, depending on the country. During the period of 1995-
2000, this contribution rose to 0.3-0.9% per year. Table 4.2 shows that the contribution
of ICT to output growth in 1995-2000 was highest in the US (with 0.87 percentage
point), followed by Australia and Canada (with 0.79 and 0.51 percentage points
respectively). The authors further showed that concurrent with the rise in demand for
ICT investment, prices for ICT capital goods fell in relative and absolute terms, which
led to substitution effects toward ICT capital goods and away from other factors of
production. In another study that includes only the computer hardware and software in
the measurement of ICT capital stock, it is found that the contribution from ICT capital
to output growth in Australia during 1995-2001 reached as high as 33% (Simon and
Wardrop, 2002).
Atzeni and Carboni (2006) found the returns from ICT investment to be about
eight times higher than that arising from non-ICT investment in a survey of Italian
manufacturing firms. First, this finding was based on the fact that ICT investment
accounted for only 12% of total investment. Yet it accounted for 34% of total
investment growth. Using their methodology of Partial Price Changes, the rate of return
on ICT capital is 0.814, compared with 0.1 for non-ICT capital. ICT capital generally
contributed about 0.5 percentage point to output growth, smaller than those found in the
US, due to having a lower share of ICT to the total capital stock (for example, 2.1%
compared to 7.4% in the US in 1996) (Schreyer, 2000). One main reason was that ICT
investment in Italy is concentrated in the service industries which occupy a relatively
small share in the economy.
The Asian developing countries, however, have a scenario different from that of
the developed countries. Many Asian countries experienced declines in their GDP
growth rates between the two halves of the 1990s, except for the Philippines and India
(Lee and Khatri, 2003). This is due mainly to the Asian financial crisis which started
with devaluation of the Thai baht in mid-1997 and contagiously spilled over to other
countries towards the end of the decade. China’s economic growth decreased slightly
from 10.6% in 1990-94 to 8.8% in 1995-99, but it still remained the strongest in the
Asia-Pacific region. Yet, the contribution from ICT capital to economic growth has
largely increased in spite of the economic downturn. The share of ICT capital
contribution to economic growth ranges from a mere 2-3% in China and India to more
78

than 50% in Hong Kong during the period 1995-99. However, the increase in ICT
capital share can be attributed to the decline in GDP growth rate since ICT capital now
occupies a relatively greater portion of economic growth than that during the early
1990s (Table 4.3).
Table 4.1 Sources of growth in GDP and ALP in the US, 1973-2001
Contributions Period
GDP ICT KN L TFP
1973-95 2.78 (100)
0.42 (15.1)
0.98 (35.3)
1.12 (40.3)
0.26 (9.4)
1995-00 4.07 (100)
0.98 (24.1)
1.10 (27.0)
1.37 (33.7)
0.62 (15.2)
1995-01 3.55 (100)
0.93 (26.2)
1.10 (31.0)
1.12 (31.5)
0.40 (11.3)
ALP ICT KN L TFP 1973-95 1.33
(100) 0.37 (27.8)
0.43 (32.3)
0.27 (20.3)
0.26 (19.5)
1995-00 2.07 (100)
0.87 (42.0)
0.37 (17.9)
0.21 (10.1)
0.62 (30.0)
1995-01 2.02 (100)
0.85 (42.1)
0.54 (26.7)
0.22 (10.9)
0.40 (19.8)
Note: Figures in italic parentheses are the shares of each factor growth. ICT = ICT capital KN = Non-ICT capital L = Labour TFP = Total factor productivity Source: Jorgenson, Ho and Stiroh (2003a).
OECD (2004) highlighted some intrinsic characteristics of developing countries
which distinguish the effects of ICT on their productivity and economic growth from
those of the developed countries. First, most developing countries do not have a large
ICT-production sector, except those with huge markets such as China and India.
Investment in ICT is obtained primarily through foreign capital rather than the domestic
market. Second, the size of ICT investment in developing countries as a proportion of
their total output is much lower compared with developed countries as they are largely
dominated by primary industries such as raw materials or agriculture. As such, the
OECD found that ‘the contribution of new technologies to growth in developing
economies has been minimal from a macroeconomic perspective’. However, China has
features which distinguish it from many other developing countries. As shown in
Chapter two, the Chinese economy is no longer dominated by primary industries. As a
matter of fact, it has already emerged as one of the world’s largest ICT market and
production centre. Therefore, any study of developing countries in general should not be
79

extrapolated to the case of China.
Table 4.2 Contribution of ICT to output growth in nine OECD countries, 1985-2000
1985-90 1990-95 1995-00
Output growtha
ICT KN Output growth
ICT KN Output growth
ICT KN
Australia Canada Finland France Germany Italy Japan UK US
3.79 (100) 2.90 (100) 3.42 (100) 3.46 (100) 3.59 (100) 3.04 (100) 5.14 (100) 3.90 (100) 3.31 (100)
0.51 (13.5) 0.36 (12.4) 0.25 (7.3) 0.21 (6.1) 0.16 (4.5) 0.20 (6.6) 0.18 (3.5) 0.23 (5.9) 0.43 (13.0)
1.46 (38.5) 0.89 (30.7) 0.58 (17.0) 0.70 (20.2) 0.64 (17.8) 0.66 (21.7) 1.2 (23.3) 0.87 (22.3) 0.67 (20.2)
3.37 (100) 1.79 (100) -0.70 (100) 0.97 (100) 2.22 (100) 1.44 (100) 1.33 (100) 2.12 (100) 2.64 (100)
0.47 (13.9) 0.28 (15.6) 0.01 (-1.4) 0.13 (13.4) 0.22 (9.9) 0.10 (6.9) 0.14 (10.5) 0.15 (7.1) 0.43 (16.3)
0.88 (26.1) 0.44 (24.6) 0.02 (-2.9) 0.60 (61.9) 0.77 (34.7) 0.52 (36.1) 1.19 (89.5) 0.59 (27.8) 0.54 (20.5)
4.62 (100) 4.20 (100) 5.62b
(100) 2.81 (100) 2.06 (100) 1.93b
(100) 1.10b
(100) 3.55 (100) 4.40 (100)
0.79 (17.1) 0.51 (12.1) 0.20 (3.6) 0.27 (9.6) 0.22 (10.7) 0.16 (8.3) 0.29 (26.4) 0.27 (7.6) 0.87 (19.8)
0.94 (20.3) 0.58 (13.8) -0.05 (-0.9) 0.78 (27.8) 0.61 (29.6) 0.66 (34.2) 0.68 (61.8) 0.77 (21.7) 0.84 (19.1)
Note: Figures in italic parentheses are the shares of each factor growth. For denotations of factor inputs and TFP in this and subsequent tables, refer to Table 4.1.
a. Business sector only. b. Data for the period of 1995-99. Source: Colecchia and Schreyer (2002).
The empirical findings pertaining to the contribution of ICT to economic growth
is summarized in Tables 4.3 and 4.4. The growth accounting framework employed by
most authors is more or less similar. One slightly different model is found in Kim
(2002) who examines the sources of Korea’s economic growth and productivity during
the period of 1971-2000 using the ‘extended growth model’, by adding the business
cycle to the model. Overall, while one would expect the US to lead the world in ICT
investment, yet the highest contribution of ICT capital to growth during the period of
1995-2003 occurred in Germany and Japan, with shares exceeding 46% and 40%
respectively (Jorgenson and Vu, 2005 – Table 4.4).
80

81
Another group of empirical research work focused on cross-country studies,
including Schreyer (2000) covering G7, Colecchia and Schreyer (2002) on G7 plus
Australia and Finland, Lee and Khatri (2003) on Asian developing economies, and
Jorgenson and Vu (2005) on the world economies. Schreyer (2000) measured the
contribution of ICT capital to output growth in the G7 countries for the first half of the
1990s. They found that in all of these countries except the former West Germany, ICT
contributed more than 10% to economic growth (Table 4.4). In a later work that
examined the sources of growth in nine OECD countries (i.e. the G7, Australia and
Finland) for the second half of the 1990s, the highest contributions from ICT investment
to output growth were found in Japan (26%), the US (20%) and Australia (17%)
(Colecchia and Schreyer, 2002). Among the Asian developing economies, the highest
contributions from ICT to economic growth in the second half of the 1990s came from
Hong Kong (56%), Singapore (25%) and Korea (19%) (Lee and Khatri, 2003).
Jorgenson and Vu (2005) analysed the impact of ICT investment (including
equipment and software) on the growth of the world economy, as well as growth for
each of the seven regions and 14 major economies (i.e. seven countries of the G7 and
seven major developing economies, including China) (Table 4.4). The US data was
revised and updated since the earlier work of Jorgenson (2001). The contribution of ICT
to world economic growth increased from 10.8% in 1989-1995 to 15.4% in 1995-2003;
for the US, it rose from 20.2% to 24.6%; for the G7 as a whole, the contribution jumped
by 10 percentage points, from 17.4% to 27%. Empirical findings for the developing
economies also showed a general increase in the contribution of ICT to economic
growth between 1989-1995 and 1995-2003, except for Sub-Sahara Africa. For instance,
the contribution of ICT to economic growth increased from 2% to 7.7% in the 16
countries of developing Asia; from 15.8% to 16.3% in the 15 countries of non-G7; from
5.2% to 18.5% in Latin America; from -1.4% to 8% in Eastern Europe; from 10.7% to
10.1% in Sub-Sahara Africa; and from 3.4% to 9.8% in North Africa and Middle East.
Each of the seven major developing economies (excluding China, which will be
discussed in the next section) except Mexico has also experienced a rising trend in the
share of ICT to economic growth. The findings are as follows: from 4.6% to 23.7% in
Brazil; from 1.8% to 4.2% in India; from 1.5% to 3.7% in Indonesia; from 11% to 6.5%
in Mexico; from -0.8% to 3.1% in Russia; and 3.9% to 11.2% in South Korea. The
increasing trend in the contribution of ICT to economic growth in developing Asia was
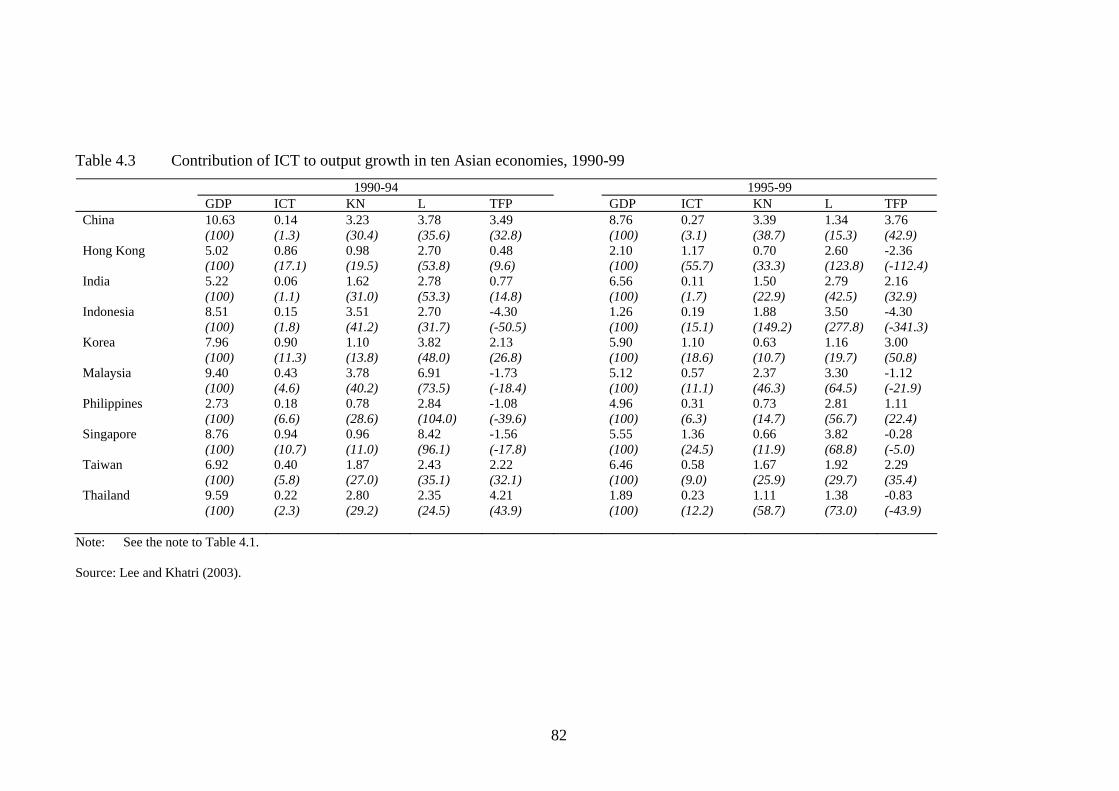
Table 4.3 Contribution of ICT to output growth in ten Asian economies, 1990-99 1990-94 1995-99
GDP ICT KN L TFP GDP ICT KN L TFP China Hong Kong India Indonesia Korea Malaysia Philippines Singapore Taiwan Thailand
10.63 (100) 5.02 (100) 5.22 (100) 8.51 (100) 7.96 (100) 9.40 (100) 2.73 (100) 8.76 (100) 6.92 (100) 9.59 (100)
0.14 (1.3) 0.86 (17.1) 0.06 (1.1) 0.15 (1.8) 0.90 (11.3) 0.43 (4.6) 0.18 (6.6) 0.94 (10.7) 0.40 (5.8) 0.22 (2.3)
3.23 (30.4) 0.98 (19.5) 1.62 (31.0) 3.51 (41.2) 1.10 (13.8) 3.78 (40.2) 0.78 (28.6) 0.96 (11.0) 1.87 (27.0) 2.80 (29.2)
3.78 (35.6) 2.70 (53.8) 2.78 (53.3) 2.70 (31.7) 3.82 (48.0) 6.91 (73.5) 2.84 (104.0) 8.42 (96.1) 2.43 (35.1) 2.35 (24.5)
3.49 (32.8) 0.48 (9.6) 0.77 (14.8) -4.30 (-50.5) 2.13 (26.8) -1.73 (-18.4) -1.08 (-39.6) -1.56 (-17.8) 2.22 (32.1) 4.21 (43.9)
8.76 (100) 2.10 (100) 6.56 (100) 1.26 (100) 5.90 (100) 5.12 (100) 4.96 (100) 5.55 (100) 6.46 (100) 1.89 (100)
0.27 (3.1) 1.17 (55.7) 0.11 (1.7) 0.19 (15.1) 1.10 (18.6) 0.57 (11.1) 0.31 (6.3) 1.36 (24.5) 0.58 (9.0) 0.23 (12.2)
3.39 (38.7) 0.70 (33.3) 1.50 (22.9) 1.88 (149.2) 0.63 (10.7) 2.37 (46.3) 0.73 (14.7) 0.66 (11.9) 1.67 (25.9) 1.11 (58.7)
1.34 (15.3) 2.60 (123.8) 2.79 (42.5) 3.50 (277.8) 1.16 (19.7) 3.30 (64.5) 2.81 (56.7) 3.82 (68.8) 1.92 (29.7) 1.38 (73.0)
3.76 (42.9) -2.36 (-112.4) 2.16 (32.9) -4.30 (-341.3) 3.00 (50.8) -1.12 (-21.9) 1.11 (22.4) -0.28 (-5.0) 2.29 (35.4) -0.83 (-43.9)
Note: See the note to Table 4.1. Source: Lee and Khatri (2003).
82

Table 4.4 Contributions to GDP growth (Unit: %) Author Country Period GDP ICT KN L TFP Other
variable Jorgenson and Stiroh (1999) US 1990-96 2.36
(100) 0.12 (5.1)
0.51 (21.6)
1.22 (51.7)
0.23 (9.7)
0.28a
(11.9) Jorgenson and Stiroh (2000) US 1995-98 4.73
(100) 0.76 (16.1)
0.86 (18.2)
1.57 (33.2)
0.99 (20.9)
0.56a
(11.8) Oliner and Sichel (2000) US 1996-99 4.82
(100) 1.10 (22.8)
0.75 (15.6)
1.81 (37.6)
1.16 (24.1)
Jorgenson (2001) US 1995-99 4.08 (100)
0.99 (24.3)
1.07 (26.2)
1.27 (31.1)
0.75 (18.4)
Jorgenson, Ho and Stiroh (2003a) US 1995-2001 3.55 (100)
0.93 (26.2)
1.10 (31.0)
1.12 (31.5)
0.40 (11.3)
Parham et al (2001) Australia 1995-2000 4.9 (100)
1.3 (26.5)
0.8 (16.3)
0.7 (14.3)
2.0 (40.8)
Simon and Wardrop (2002) Australia 1996-2001 3.86 (100)
1.26 (32.6)
0.60 (15.5)
0.57 (14.8)
1.43 (37.0)
Harchaoui et al (2003) Canada 1995-2000 4.9 (100)
0.7 (14.3)
1.0 (20.4)
2.2 (44.9)
1.0 (20.4)
Jalava and Pohjola (2001) Finland 1995-1999 6.0 (100)
0.7 (11.7)
-0.4 (-6.7)
1.6 (26.7)
4.2 (70.0)
Jorgenson and Motohashi (2005) Japan 1995-2003 0.83 (100)
0.54 (65.1)
0.62 (74.5)
-0.32 (-38.6)
0.45 (54.2)
Kim (2002) Korea 1996-2000 4.96 (100)
1.22 (24.6)
2.62 (52.8)
0.21 (4.2)
1.40 (28.2)
-0.49b
(-9.9) Schreyer (2000) Canada
France W. Germany Italy Japan
1990-96
1.7 (100) 0.9 (100) 1.8 (100) 1.2 (100) 1.8 (100)
0.31 (18.2) 0.17 (18.9) 0.15 (8.3) 0.21 (17.5) 0.20 (11.1)
0.39 (22.9) 0.83 (92.2) 0.85 (47.2) 0.49 (40.8) 0.80 (44.4)
83

UK US
2.1 (100) 3.0 (100)
0.31 (14.8) 0.41 (13.7)
0.59 (28.1) 0.49 (16.3)
Colecchia and Schreyer (2002) Australia Canada Finland (1995-99) France Germany Italy (1995-99) Japan (1995-99) UK US
1995-2000
4.62 (100) 4.20 (100) 5.62 (100) 2.81 (100) 2.06 (100) 1.93 (100) 1.10 (100) 3.55 (100) 4.40 (100)
0.79 (17.1) 0.51 (12.1) 0.20 (3.6) 0.27 (9.6) 0.22 (10.7) 0.16 (8.3) 0.29 (26.4) 0.27 (7.6) 0.87 (19.8)
0.94 (20.3) 0.58 (13.8) -0.05 (-0.9) 0.51 (18.1) 0.61 (29.6) 0.66 (34.2) 0.68 (61.8) 0.77 (21.7) 0.84 (19.1)
Lee and Khatri (2003)
US Hong Kong Indonesia Korea Malaysia Philippines
1995-99
3.64 (100) 2.10 (100) 1.26 (100) 5.90 (100) 5.12 (100) 4.96 (100)
0.79 (21.7) 1.17 (55.7) 0.19 (15.1) 1.10 (18.6) 0.57 (11.1) 0.31 (6.3)
0.29 (8.0) 0.70 (33.3) 1.88 (149.2) 0.63 (10.7) 2.37 (46.3) 0.73 (14.7)
1.30 (35.7) 2.60 (123.8) 3.50 (277.8) 1.16 (19.7) 3.30 (64.5) 2.81 (56.7)
1.26 (34.6) -2.36 (-112.4) -4.30 (-341.3) 3.00 (50.8) -1.12 (-21.9) 1.11 (22.4)
84

Singapore Taiwan Thailand India China (1995-99) (1990-94)
5.55 (100) 6.46 (100) 1.89 (100) 6.56 (100) 8.76 (100) 10.63 (100)
1.36 (24.5) 0.58 (9.0) 0.23 (12.2) 0.11 (1.7) 0.27 (3.1) 0.14 (1.3)
0.66 (11.9) 1.67 (25.9) 1.11 (58.7) 1.50 (22.9) 3.39 (38.7) 3.23 (30.4)
3.82 (68.8) 1.92 (29.7) 1.38 (73.0) 2.79 (42.5) 1.34 (15.3) 3.78 (35.6)
-0.28 (-5.0) 2.29 (35.4) -0.83 (-43.9) 2.16 (32.9) 3.76 (42.9) 3.49 (32.8)
Jorgenson and Vu (2005) World (110 economies) G7 Developing Asia Non-G7 Latin America Eastern Europe Sub-Sahara Africa North Africa & Middle East G7 economies Canada France
1989-95
2.50 (100) 2.18 (100) 7.35 (100) 2.03 (100) 3.06 (100) -7.05 (100) 1.21 (100) 4.36 (100) 1.39 (100) 1.30 (100)
0.27 (10.8) 0.38 (17.4) 0.15 (2.0) 0.32 (15.8) 0.16 (5.2) 0.10 (-1.4) 0.13 (10.7) 0.15 (3.4) 0.49 (35.2) 0.19 (14.6)
0.91 (36.4) 0.90 (41.3) 1.73 (23.5) 0.68 (33.5) 0.58 (18.9) -0.15 (2.1) 0.24 (19.8) 0.72 (16.5) 0.27 (19.4) 0.93 (71.5)
0.79 (31.6) 0.49 (22.5) 1.61 (21.9) 0.42 (20.7) 1.57 (51.3) -0.50 (7.0) 2.22 (183.5) 1.99 (45.6) 0.62 (44.6) 0.44 (33.8)
0.53 (21.2) 0.42 (19.3) 3.86 (52.5) 0.61 (30.0) 0.75 (24.5) -6.50 (92.2) -1.39 (-114.9) 1.50 (34.4) 0.01 (0.7) -0.26 (-20.0)
85

Germany Italy Japan UK US Major developing economies (D7) Brazil China India Indonesia Mexico Russia South Korea All D7
2.34 (100) 1.52 (100) 2.56 (100) 1.62 (100) 2.43 (100) 1.97 (100) 9.94 (100) 5.03 (100) 6.82 (100) 2.19 (100) -8.44 (100) 7.48 (100) 3.45 (100)
0.26 (11.1) 0.26 (17.1) 0.31 (12.1) 0.27 (16.7) 0.49 (20.2) 0.09 (4.6) 0.17 (1.7) 0.09 (1.8) 0.10 (1.5) 0.24 (11.0) 0.07 (-0.8) 0.29 (3.9) 0.13 (3.8)
1.05 (44.9) 0.86 (56.6) 1.16 (45.3) 1.69 (104.3) 0.71 (29.2) 0.29 (14.7) 2.12 (21.3) 1.18 (23.5) 1.62 (23.8) 0.95 (42.4) -0.07 (0.8) 2.31 (30.9) 1.17 (33.9)
-0.09 (-3.8) 0.03 (2.0) 0.15 (5.9) -0.24 (-14.8) 0.93 (38.3) 1.38 (70.1) 1.32 (13.3) 1.70 (33.8) 2.07 (30.4) 1.86 (1.3) -0.65 (1.3) 1.76 (23.5) 1.13 (32.8)
1.12 (47.9) 0.37 (24.3) 0.94 (36.7) -0.10 (-6.2) 0.31 (12.8) 0.20 (10.2) 6.33 (62.7) 2.06 (41.0) 3.04 (44.6) -0.87 (-39.7) -7.79 (92.3) 3.13 (41.8) 1.03 (29.9)
86

World (110 economies) G7 Developing Asia Non-G7 Latin America Eastern Europe Sub-Sahara Africa North Africa & Middle East G7 economies Canada France Germany
1995-2003
3.45 (100) 2.56 (100) 5.62 (100) 3.01 (100) 2.11 (100) 2.87 (100) 2.88 (100) 4.08 (100) 2.51 (100) 1.92 (100) 0.86 (100)
0.53 (15.4) 0.69 (27.0) 0.43 (7.7) 0.49 (16.3) 0.39 (18.5) 0.23 (8.6) 0.29 (10.1) 0.40 (9.8) 0.65 (25.9) 0.36 (18.8) 0.40 (46.5)
1.03 (29.9) 0.74 (28.9) 2.27 (40.4) 0.77 (25.6) 0.61 (28.9) -0.81 (28.2) 0.68 (23.6) 0.88 (21.6) 0.61 (24.3) 0.75 (39.1) 0.50 (58.1)
0.89 (25.8) 0.46 (18.0) 1.19 (21.2) 1.26 (41.9) 1.44 (68.2) 0.40 (13.9) 1.60 (55.6) 2.51 (61.5) 0.84 (33.5) 0.29 (15.1) -0.15 (-17.4)
0.99 (28.7) 0.67 (26.2) 1.72 (30.6) 0.49 (16.3) -0.32 (-15.2) 3.06 (106.6) 0.32 (11.1) 0.30 (7.4) 0.42 (16.7) 0.52 (27.1) 0.11 (12.8)
Italy Japan UK US
1.48 (100) 1.39 (100) 2.55 (100) 3.56 (100)
0.46 (31.1) 0.56 (40.3) 0.65 (25.5) 0.88 (24.7)
0.96 (64.9) 0.26 (18.7) 0.19 (7.5) 1.01 (28.4)
0.88 (59.5) -0.10 (-7.2) 0.64 (25.1) 0.67 (18.8)
-0.82 (-55.4) 0.67 (48.2) 1.07 (42.0) 0.99 (27.8)
87

Major developing economies (D7) Brazil China India Indonesia Mexico Russia South Korea All D7
1.94 (100) 7.13 (100) 6.15 (100) 2.41 (100) 3.56 (100) 3.18 (100) 4.09 (100) 5.18 (100)
0.46 (23.7) 0.63 (8.8) 0.26 (4.2) 0.09 (3.7) 0.23 (6.5) 0.10 (3.1) 0.46 (11.2) 0.40 (7.7)
0.24 (12.4) 3.17 (44.5) 1.77 (28.8) 1.47 (61.0) 1.11 (31.2) -1.30 (-40.9) 1.67 (40.8) 1.70 (32.8)
1.04 (53.6) 0.84 (11.8) 1.63 (26.5) 1.32 (54.8) 2.07 (58.1) 0.65 (26.4) 1.12 (27.4) 1.13 (21.8)
0.21 (10.8) 2.49 (34.9) 2.49 (40.5) -0.47 (-19.5) 0.14 (3.9) 3.73 (117.3) 0.85 (20.8) 1.96 (37.8)
88
Note: See the note to Table 4.1. a. Consumer durables services b. Business cycle

attributed to the surge in investment in ICT equipment and softwares after 1995, with the
highest investment recorded in China and India. This is not the end of the story, however,
as the next section will show whether ICT is contributing more towards labour productivity
growth.
4.3 ICT and labour productivity growth
In assessing the US productivity growth, there is an unanimous conclusion about 1995 as
the specific breaking point of acceleration in productivity growth attributed to a surge in
ICT investments (Jorgenson, 2001; Jorgenson et al., 2003a; Oliner and Sichel, 2000, 2003).
There is comparatively less empirical work on ICT contribution to ALP growth than that on
ICT contribution to GDP growth. The countries examined are the US (Jorgenson et al.,
2003a; Oliner and Sichel, 2003), Canada (Harchaoui et al., 2003; Robidoux and Wong,
2003), Australia (Parham et al., 2001), Finland (Jalava and Pohjola, 2001) and ten Asia-
Pacific countries (Lee and Khatri, 2003). Most findings reveal an increase in ALP growth
in major economies around the world between the periods before and after the mid-1990s
(Jorgenson and Stiroh, 2000; Jorgenson, 2001; Jorgenson et al., 2003a; Oliner and Sichel,
2000, 2003; Parham et al., 2001; Harchaoui et al. 2003; Robidoux and Wong, 2003; Lee
and Khatri, 2003). An exception is Finland which experienced a decline of 0.4 percentage
points in ALP growth rate between 1990-95 and 1995-99 (Jalava and Pohjola, 2001).
Among the developing countries in Asia which experienced economic decline during the
late 1990s due to the financial crisis, only China, India and Korea are found to have an
increase in ALP growth between 1990-94 and 1995-99 (Lee and Khatri,2003).
Corresponding to the increase in productivity growth rate in the developed countries
is a rise in the contribution of ICT capital deepening. In terms of the share of ICT capital
contribution to ALP growth, there is a clear lag between the US and other developed
countries. For the US, the share of ICT capital contribution to ALP growth amounted to
42% during the period of 1996-2001 (Jorgenson et al., 2003a; Oliner and Sichel, 2003)
(Table 4.5). This is followed by Singapore (with 38% in 1995-99), Australia (35% in 1995-
2000), Canada (24% in 1995-2000) and Korea (18% in 1995-99) (Parham et al., 2001;
Harchaoui et al., 2003; Lee and Khatri, 2003). Ironically, Hong Kong which had the largest
share of ICT contribution to GDP growth in 1995-99 (56%), experienced a negative -184%
89

share of the corresponding contribution to ALP growth during the same period. Other Asian
NIEs and developing countries have less than 15% share of the contribution from ICT
capital deepening to ALP growth. Besides Hong Kong, the only country that had a negative
contribution from ICT capital is Indonesia (Table 4.6).
Table 4.5 Sources of growth in non-farm output and ALP in the US, 1974-2001 Contributions
Period Non-farm GDP ICT KN L TFP 1974-90 3.06
(100) 0.49 (16.0)
0.86 (28.1)
1.38 (45.1)
0.33 (10.8)
1991-95 2.75 (100)
0.57 (20.7)
0.44 (16.0)
1.26 (45.8)
0.48 (17.5)
1996-99 4.82 (100)
1.10 (22.8)
0.75 (15.6)
1.81 (37.6)
1.16 (24.1)
ALP ICT KN L TFP 1974-90 1.36
(100) 0.41 (30.1)
0.37 (27.2)
0.22 (16.2)
0.37 (27.2)
1991-95 1.54 (100)
0.46 (29.9)
0.06 (3.9)
0.45 (29.2)
0.58 (37.7)
1996-01 2.43 (100)
1.02 (42.0)
0.17 (7.0)
0.25 (10.3)
0.99 (40.7)
Note: See the note to Table 4.1. Source: Oliner and Sichel (2000, 2003).
The increase in ICT contribution relative to other factor inputs lends weight to the
argument about ICT being the predominant source of the productivity revival in the US.
This is due to (i) an increase in TFP growth in the ICT-producing sectors (computer
hardware, software and telecom) and (ii) induced capital deepening in ICT equipment
(Jorgenson et al., 2003). These two contributions account for a majority of the acceleration
in labour productivity growth after 1995. The contribution of ICT to ALP growth gained by
0.50 percentage points between 1973-95 and 1995-2000, with the corresponding share
rising from 28% to 42% (Table 4.1). Jorgenson et al. (2003) further found that when
compared with 1995-2000, the growth rates of GDP and ALP in the US as well as the
contributions from ICT capital and TFP to output and productivity growth was lower in
1995-2001, suggesting the dampening effect of the recession in 2001 on the US’ ICT
productivity. Their findings are further supported by those of Oliner and Sichel (2003) who
showed that the share of ICT capital contribution has risen from 30% in 1991-95 to 42% in
1996-2001 (Table 4.5). Oliner and Sichel (2003) also generated a steady-state growth
framework which projects growth in labour productivity of about 2% per year. They
90

91
observed that future increases in labour productivity will depend significantly on the pace
of technological advance in the semiconductor industry and on the extent to which products
embodying these advances diffuse through the economy. This observation is consistent
with the emphasis on semiconductor technology in Jorgenson (2001), as discussed earlier in
Chapter three.
The US’ closest neighbour, Canada, however, has a different story. Two different
empirical works have produced contrasting results. Harchaoui et al. (2003) show that while
Canada has had an improvement in economic performance between the periods before and
after 1995 just as in the US, the share of contribution from ICT capital deepening to ALP
growth actually declined, even though it remained more than 20% in 1995-2000. In another
finding, the corresponding share of ICT contribution to ALP growth increased from 27% in
1988-96 to 33% in 1996-2001 (Table 4.7).
The difference may lie in the methods employed. Robidoux and Wong (2003) do
not include labour quality as a factor in their analysis, thereby possibly overestimating the
contribution of ICT capital deepening. Harchaoui et al. (2003) include a ‘structures’
variable as one of the non-ICT capital inputs, which refers to all forms of fixed assets such
as land, dwellings and construction of infrastructure. Nevertheless, in both cases, ICT is
found to be the largest contributor to growth within the capital services, although its
contribution is lower than that in the US. TFP growth is also found to be a key source of
ALP growth in Canada, constituting more than 50% (Table 4.7). The improvement in ALP
growth therefore reflects not only increased capital deepening in ICT, but also higher TFP
growth.
The question of whether using the dating of the US productivity revival, that is,
1995 as a universal benchmark is appropriate for all countries is questioned by Robidoux
and Wong (2003). They point out that labour productivity growth in Australia improved
earlier than in the US. This comment is supported by Parham et al. (2001) and Parham
(2004) who show that labour productivity growth in Australia has been steadily increasing
since the late 1980s (Table 4.8). Furthermore, ICT capital has consistently contributed more
than 30% to output and ALP growth in Australia since 1995. However, a drawback in the
analysis of Parham et al. (2001) is that labour quality was omitted in the accounting

1990-94 1995-99 ALP ICT KN L TFP ALP ICT KN L TFP
China Hong Kong India Indonesia Korea Malaysia Philippines Singapore Taiwan Thailand
6.63 (100) 3.81 (100) 4.09 (100) 6.70 (100) 5.13 (100) 5.31 (100) -0.12 (100) 5.04 (100) 5.17 (100) 7.80 (100)
0.10 (1.5) 0.73 (19.2) 0.05 (1.2) 0.12 (1.8) 0.69 (13.5) 0.29 (5.5) 0.13 (-108.3) 0.66 (13.1) 0.33 (6.4) 0.19 (2.4)
2.16 (32.6) 0.80 (21.0) 1.35 (33.0) 2.78 (41.5) 0.80 (15.6) 2.58 (48.6) 0.15 (-125.0) 0.58 (11.5) 1.50 (29.0) 2.38 (30.5)
1.10 (16.6) 1.79 (47.0) 2.01 (49.1) 1.82 (27.2) 1.64 (32.0) 4.23 (79.7) 0.66 (-550.0) 5.58 (110.7) 1.22 (23.6) 1.20 (15.4)
3.27 (49.3) 0.50 (13.1) 0.68 (16.6) 1.98 (29.6) 2.01 (39.2) -1.79 (-33.7) -1.07 (891.7) -1.78 (-35.3) 2.12 (41.0) 4.04 (51.8)
7.41 (100) -0.49 (100) 5.82 (100) -0.69 (100) 5.21 (100) 1.78 (100) 2.12 (100) 2.68 (100) 5.04 (100) 1.21 (100)
0.21 (2.8) 0.90 (-183.7) 0.09 (1.5) 0.15 (-21.7) 0.94 (18.0) 0.41 (23.0) 0.23 (10.8) 1.02 (38.1) 0.47 (9.3) 0.19 (15.7)
2.92 (39.4) 0.33 (-67.3) 1.34 (23.0) 1.30 (-188.4) 0.61 (11.7) 1.39 (78.1) 0.19 (9.0) 0.35 (13.1) 1.35 (26.8) 0.99 (81.8)
0.65 (8.8) 0.54 (-110.2) 2.34 (40.2) 2.38 (-344.9) 0.76 (14.6) 1.16 (65.2) 0.61 (28.8) 1.56 (58.2) 0.99 (19.6) 0.95 (78.5)
3.63 (49.0) -2.26 (461.2) 2.05 (35.2) -4.52 (655.1) 2.91 (55.9) -1.18 (-66.3) 1.09 (51.4) -0.24 (-9.0) 2.23 (44.2) -0.93 (-76.9)
Table 4.6 Contribution of ICT to ALP growth in ten Asian economies, 1990-99
92
Note: See the note to Table 4.1. Source: Lee and Khatri (2003).
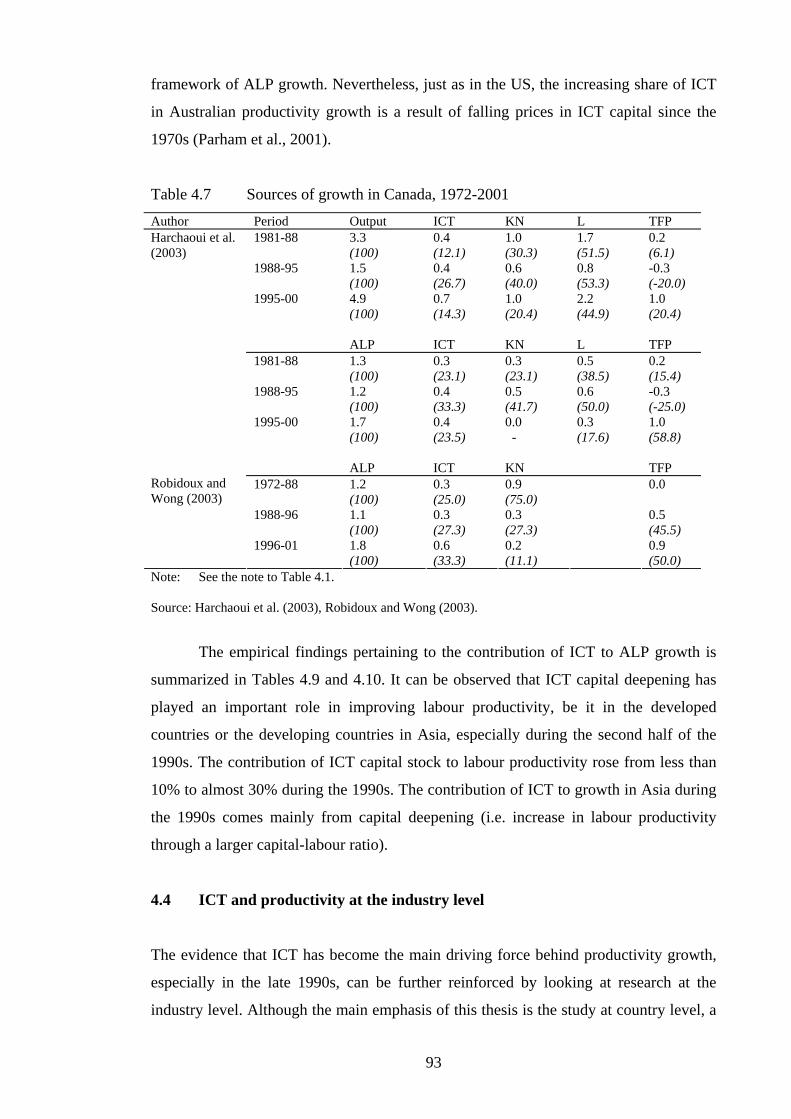
framework of ALP growth. Nevertheless, just as in the US, the increasing share of ICT
in Australian productivity growth is a result of falling prices in ICT capital since the
1970s (Parham et al., 2001).
Table 4.7 Sources of growth in Canada, 1972-2001 Author Period Output ICT KN L TFP
1981-88 3.3 (100)
0.4 (12.1)
1.0 (30.3)
1.7 (51.5)
0.2 (6.1)
1988-95 1.5 (100)
0.4 (26.7)
0.6 (40.0)
0.8 (53.3)
-0.3 (-20.0)
1995-00 4.9 (100)
0.7 (14.3)
1.0 (20.4)
2.2 (44.9)
1.0 (20.4)
ALP ICT KN L TFP 1981-88 1.3
(100) 0.3 (23.1)
0.3 (23.1)
0.5 (38.5)
0.2 (15.4)
1988-95 1.2 (100)
0.4 (33.3)
0.5 (41.7)
0.6 (50.0)
-0.3 (-25.0)
Harchaoui et al. (2003)
1995-00 1.7 (100)
0.4 (23.5)
0.0 -
0.3 (17.6)
1.0 (58.8)
ALP ICT KN TFP 1972-88 1.2
(100) 0.3 (25.0)
0.9 (75.0)
0.0
1988-96 1.1 (100)
0.3 (27.3)
0.3 (27.3)
0.5 (45.5)
Robidoux and Wong (2003)
1996-01 1.8 (100)
0.6 (33.3)
0.2 (11.1)
0.9 (50.0)
Note: See the note to Table 4.1. Source: Harchaoui et al. (2003), Robidoux and Wong (2003).
The empirical findings pertaining to the contribution of ICT to ALP growth is
summarized in Tables 4.9 and 4.10. It can be observed that ICT capital deepening has
played an important role in improving labour productivity, be it in the developed
countries or the developing countries in Asia, especially during the second half of the
1990s. The contribution of ICT capital stock to labour productivity rose from less than
10% to almost 30% during the 1990s. The contribution of ICT to growth in Asia during
the 1990s comes mainly from capital deepening (i.e. increase in labour productivity
through a larger capital-labour ratio).
4.4 ICT and productivity at the industry level
The evidence that ICT has become the main driving force behind productivity growth,
especially in the late 1990s, can be further reinforced by looking at research at the
industry level. Although the main emphasis of this thesis is the study at country level, a
93
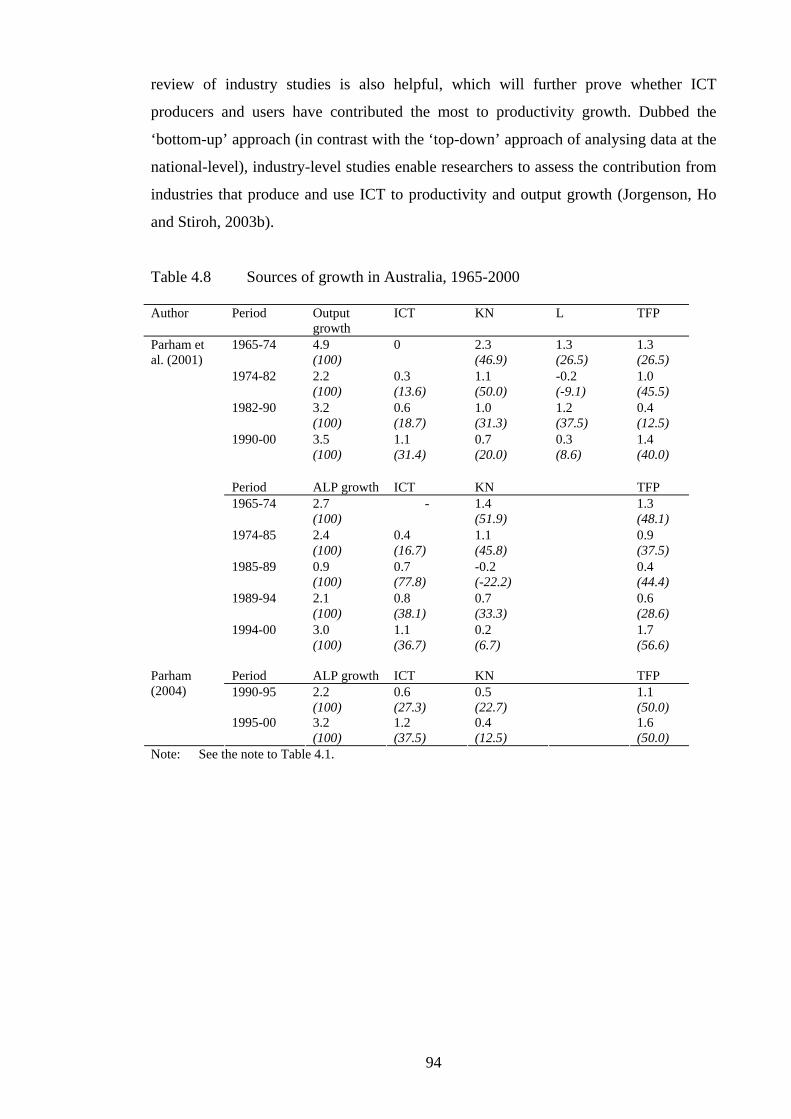
94
review of industry studies is also helpful, which will further prove whether ICT
producers and users have contributed the most to productivity growth. Dubbed the
‘bottom-up’ approach (in contrast with the ‘top-down’ approach of analysing data at the
national-level), industry-level studies enable researchers to assess the contribution from
industries that produce and use ICT to productivity and output growth (Jorgenson, Ho
and Stiroh, 2003b).
Table 4.8 Sources of growth in Australia, 1965-2000 Author Period Output
growth ICT KN L TFP
1965-74 4.9 (100)
0 2.3 (46.9)
1.3 (26.5)
1.3 (26.5)
1974-82 2.2 (100)
0.3 (13.6)
1.1 (50.0)
-0.2 (-9.1)
1.0 (45.5)
1982-90 3.2 (100)
0.6 (18.7)
1.0 (31.3)
1.2 (37.5)
0.4 (12.5)
1990-00 3.5 (100)
1.1 (31.4)
0.7 (20.0)
0.3 (8.6)
1.4 (40.0)
Period ALP growth ICT KN TFP 1965-74 2.7
(100) - 1.4
(51.9) 1.3
(48.1) 1974-85 2.4
(100) 0.4 (16.7)
1.1 (45.8)
0.9 (37.5)
1985-89 0.9 (100)
0.7 (77.8)
-0.2 (-22.2)
0.4 (44.4)
1989-94 2.1 (100)
0.8 (38.1)
0.7 (33.3)
0.6 (28.6)
Parham et al. (2001)
1994-00 3.0 (100)
1.1 (36.7)
0.2 (6.7)
1.7 (56.6)
Period ALP growth ICT KN TFP 1990-95 2.2
(100) 0.6 (27.3)
0.5 (22.7)
1.1 (50.0)
Parham (2004)
1995-00 3.2 (100)
1.2 (37.5)
0.4 (12.5)
1.6 (50.0)
Note: See the note to Table 4.1.

Table 4.9 Contributions to ALP growth: Single country study (Unit: %) Author Country Period ALP ICT KN L TFP Other
variable Jorgenson and Stiroh (2000) US 1995-98 2.37
(100) 1.13
(47.7) 0.25 (10.5)
0.99 (41.8)
Oliner and Sichel (2000) US 1996-99 2.57 (100)
0.96 (37.4)
0.14 (5.4)
0.31 (12.1)
1.16 (45.1)
Jorgenson (2001) US 1995-99 2.11 (100)
0.89 (42.2)
0.35 (16.6)
0.12 (5.7)
0.75 (35.5)
Jorgenson, Ho and Stiroh (2003a)
US 1995-2000 1995-2001
2.07 (100) 2.02 (100)
0.87 (42.0) 0.85 (42.1)
0.37 (17.9) 0.54 (26.7)
0.21 (10.1) 0.22 (10.9)
0.62 (30.0) 0.40 (19.8)
Oliner and Sichel (2003) US 1996-2001 2.43 (100)
1.02 (42.0)
0.17 (7.0)
0.25 (10.3)
0.99 (40.7)
0.42a
(17.3) Parham et al (2001) Australia 1995-2000 3.7
(100) 1.3 (35.1)
0.4 (10.8)
2.0 (54.1)
Jalava and Pohjola (2001) Finland 1995-99 3.5 (100)
0.6 (17.1)
-1.4 (-40.0)
0.2 (5.7)
4.1 (117.1)
Harchaoui et al (2003) Canada 1995-2000 1.7 (100)
0.4 (23.5)
0.0 -
0.3 (17.6)
1.0 (58.8)
Robidoux and Wong (2003) Canada 1996-2001 1.8 (100)
0.6 (33.3)
0.3 (16.7)
-
1.0 (55.6)
Oulton and Srinivasan (2005) UK 1995-2000 2.93 (100)
1.37 (46.8)
0.79 (27.0)
0.45 (15.4)
0.32 (10.9)
95
Note: See the note to Table 4.1. a. Semiconductors

Table 4.10 Contributions to ALP growth: Cross-country study, 1995-99 (Unit: %) Country ALP ICT KN L TFP Hong Kong Indonesia Korea Malaysia Philippines Singapore Taiwan Thailand India China
-0.49 (100) -0.69 (100) 5.21 (100) 1.78 (100) 2.12 (100) 2.68 (100) 5.04 (100) 1.21 (100) 5.82 (100) 7.41 (100)
0.90 (-183.7) 0.15 (-21.7) 0.94 (18.0) 0.41 (23.0) 0.23 (10.8) 1.02 (38.1) 0.47 (9.3) 0.19 (15.7) 0.09 (1.5) 0.21 (2.8)
0.33 (-67.3) 1.30 (-188.4) 0.61 (11.7) 1.39 (78.1) 0.19 (9.0) 0.35 (13.1) 1.35 (26.8) 0.99 (81.8) 1.34 (23.0) 2.92 (39.4)
0.54 (-110.2) 2.38 (-344.9) 0.76 (14.6) 1.16 (65.2) 0.61 (28.8) 1.56 (58.2) 0.99 (19.6) 0.95 (78.5) 2.34 (40.2) 0.65 (8.8)
-2.26 (461.2) -4.52 (655.1) 2.91 (55.9) -1.18 (-66.3) 1.09 (51.4) -0.24 (-8.96) 2.23 (44.2) -0.93 (-76.9) 2.05 (35.2) 3.63 (49.0)
Note: See the note to Table 4.1. Source: Lee and Khatri (2003).
4.4.1 ICT-producing vs ICT-using industries
Research at the industry level distinguishes between contributions from ICT-producing
(or IT-producing) and ICT-using (or IT-using) industries to productivity growth.
Dedrick et al. (2003) defined ICT-producing industries as ‘those which manufacture
semiconductor, computer, or telecommunications hardware or provide software and
services that enable these technologies to be used effectively in organizations’, whereas
ICT-using industries are ‘all the other sectors of the economy that apply ICT as part of
their operations in order to achieve greater efficiency and effectiveness, and they
include manufacturing (durable and nondurable), wholesale and retail trade, finance,
insurance and real estate, business and professional services, etc.’
96

The study of industry productivity is exemplified in Stiroh (2001, 2002a) who
explains that productivity revival can be proven by evidence that ICT producers and the
most intensive users experience the largest productivity acceleration in the late 1990s.
As he commented: ‘If productivity increases have been widespread, then the
productivity revival is likely to be more enduring. In contrast, if the increases have been
concentrated in a single sector, then the revival may be vulnerable to a slowdown in that
sector’ (Stiroh, 2001). In this exercise, he finds productivity to have accelerated in eight
of ten broad sectors in the US during the period of 1987-95; only mining and agriculture
were the exceptions. Among the eight sectors, the durable manufacturing sector which
produces ICT equipment achieved the most impressive productivity gains after 1995,
and this is attributable to the ‘rapid technological advances driving the ICT revolution’
(Stiroh, 2001). Overall, he finds that ICT-producing industries have shown the largest
productivity gains when compared with ICT-using and other industries.
Stiroh (2002a) addressed the issue of the contribution of ICT production and use
to the US aggregate productivity revival in the late 1990s by examining the variation in
productivity growth over time and across industries and by exploring the link with ICT
capital. He finds further evidence that suggests the US productivity revival is not
confined to only a few ICT-producing industries, with the mean productivity
acceleration from 1987-1995 to 1995-2000 for 61 industries being 0.87% (Stiroh,
2002a). His findings also show that ICT-producing and ICT-using industries accounted
for all of the direct industry contributions to the US productivity revival (Table 4.11).
On the whole, ICT-using industries, which made up 51% of total industry, have a
greater share of contribution to ALP growth than ICT-producing industries, which
comprise only 4% of the total industry. It should also be noted that while the ICT-
producing industries contributed 0.54 percentage points to ALP growth in 1995-2000,
the non-ICT industries which made up 44% of total industry contributed only 0.53
percentage points during the same period (Stiroh, 2002a).
Van Ark, Inklaar and McGuckin (2003) compared the contributions of ICT-
producing, ICT-using and non-ICT industries in Canada, Europe and the US to labour
productivity growth, with a detailed categorization of ICT and non-ICT industries. They
found that ICT-using industries contribute more than ICT-producing industries to ALP
growth in Canada and the US, whereas the opposite case occurred in Europe (Table
4.12). Another study found that the ICT-producing industries contributed more to ALP
97

growth than ICT-using industries in Sweden (Edquist, 2005).
Table 4.11 Decomposition of US labour productivity growth by industry, 1987-2000 Period ALP2 ICT-producing ICT-using Other
industries Material reallocation
Hours reallocation
1987-95 0.98 (100)
0.37 (37.8)
0.75 (76.5)
0.74 (75.5)
-0.40 (-40.8)
-0.47 (-48.0)
1995-00 2.29 (100)
0.54 (23.6)
1.58 (69.0)
0.53 (23.1)
-0.02 (-0.9)
-0.34 (-14.8)
Note: The numbers in parentheses are percentage shares.
Source: Stiroh (2002a).
Evidence of a stronger contribution from ICT capital deepening, i.e. ICT-using
industries, than that of ICT-producing industries to labour productivity growth can also
be found in Australia (Parham et al., 2001; Colecchia and Schreyer, 2002; and Parham,
2004). In a detailed examination of industrial productivity in Australia, Parham et al.
(2001) found a strong contribution from ICT capital deepening among ICT-using
industries, especially in the service sectors such as restaurants, finance and insurance,
utilities, transport and communications, and the retail sector, as well as in the
manufacturing and construction sectors. Similarly, Parham (2004) reinforced the
conclusion that the increase in ICT use has raised TFP growth in Australia.
Table 4.12 Decomposition of ALP growth in Canada, EU and US by industry, 1995-2000
Country/ Region
ALP ICT KN
Production Use Canada EU US
1.76 (100) 1.40 (100) 2.49 (100)
0.42 (23.9) 0.46 (32.9) 0.74 (29.7)
0.83 (47.2) 0.41 (29.3) 1.40 (56.2)
0.52 (29.5) 0.47 (33.6) 0.36 (14.5)
Note: See the note to Table 4.1. Source: Van Ark, Inklaar and McGuckin (2003).
2 Note that the share of industrial contribution to ALP growth exceeds 100%. The two other factor inputs which contributed negatively to ALP growth in both periods are: ‘material reallocation’ (RM), which ‘reflects variation in intermediate input intensity across industries’; and ‘hours reallocation’ (RH), which “weights industries by their (lagged) share of aggregate hours” (Stiroh, 2002a).
98

Other studies have produced mixed results about the effects of ICT-producing
and ICT-using industries on economic growth are concerned. Colecchia and Schreyer
(2002) demonstrated that Australia, which has a relatively small ICT-producing sector
in comparison with the G7 countries, has experienced the highest GDP growth rate
during 1995-2000. Its share of contribution from ICT capital deepening to economic
growth is exceeded only by Japan and the US. By contrast, Japan, which has the largest
ICT-producing sector among the G7 countries, experienced the lowest GDP growth rate
during 1995-1999, which coincided with the Asian financial crisis that occurred within
that period. The analysis of Colecchia and Schreyer (2002) suggests that the existence
of a large ICT-producing industry is neither a necessary nor a sufficient condition to
successfully experience the growth effects of ICT. Finally, a study that compares the
effects of ICT on labour productivity growth between the European Union (EU) and the
US found that Europe’s lagging growth performance behind the US was caused by
‘having a smaller ICT-producing sector, lower ICT investment rates and/or a failure to
renew business processes in ICT-using industries’ (Timmer and van Ark, 2005).
The proposition of ICT-using industries having a stronger impact on
productivity growth is also supported by Oulton and Srinivasan (2005) who examined
the role of ICT in explaining productivity growth in the UK, using data for 34 industries
for the period of 1970-2000. Oulton and Srinivasan found that ICT capital deepening
was concentrated in only a small number of industries during the 1990s, namely,
business services, finance, communications, wholesaling and retailing – all of which are
in the service sector. Furthermore, among the manufacturing industries (which
accounted for only 14% of ICT capital deepening), only the ICT-producing industries,
namely electrical and electronics, had a significant role in productivity growth.
Another group of research concentrated on examining the relationship between
information intensity and labour productivity growth. Hu and Quan (2005) used the
Granger causality model to test the correlation between ICT investments and industry-
level productivity for eight industries in the US from 1970 to 1999. Their findings
suggested a causal relationship between ICT investments and productivity in six out of
eight industries, namely mining, service, retail, wholesale, transportation and
manufacturing, most of which have high value-chain information intensity.
99

In examining the link between ICT intensity and labour productivity growth of
29 industries in New Zealand over the period of 1988-2003, evidence was found to
support the view that labour productivity growth of more ICT intensive industries has
improved over time relative to that of other industries (Engelbrecht and Xayavong,
2006). The authors have found ICT intensity to be higher in sectors such as
publishing/media, machinery and equipment manufacturing, wholesale trade, retail
trade, transport and storage, communication services, finance and insurance, business
services, government, education, health and community services, cultural and
recreational services as well as other personal and home ownership services – a finding
similar to those of Stiroh (2002a).
4.4.2 ICT contribution to TFP growth
In applying the production function to measure factor contribution to growth, some
literature finds that ICT-producing industries contribute to ALP growth through
increased TFP, while ICT-using industries contribute to ALP growth through increased
capital deepening (i.e., an increased capital-labour ratio) (Stiroh, 2002b; Van Ark,
Inklaar and McGuckin, 2003). Studies that measure the contribution of ICT-producing
industries mainly attempt to determine the contribution of ICT industries to TFP
growth. For example, Jorgenson and Stiroh (2000), using the “price dual approach” (by
estimating for moderate and rapid price decline in high-tech investment goods) to
measure productivity at the industry level, found a marked increase in non-ICT TFP
growth in the late 1990s compared to the early 1990s, and that its contribution was
higher than that of ICT capital in the base case.
In earlier works, McGuckin, Stiroh and van Ark (1997) showed that the
computer sector alone accounted for one-third of the TFP growth for the entire US
economy in the 1980s, despite having only less than 3% share of the GDP. Stiroh
(1998), in examining the relationship between computers and economic growth using
US sectoral data from 1947 to 1991, found that the computer-producing (CP) sector
showed strong TFP growth that reflects the fundamental technological progress behind
the computer revolution, and resulting in a large substitution towards computers as an
input for computer-using (CU) sectors. In other words, computers have made a clear
and increasing contribution to economic growth. The contribution of computer capital to
aggregate output growth increased from 0.03% per year for 1947-73 to 0.19% for 1981-
91. The contribution of CP sector to aggregate TFP growth increased from 0.01% to
100
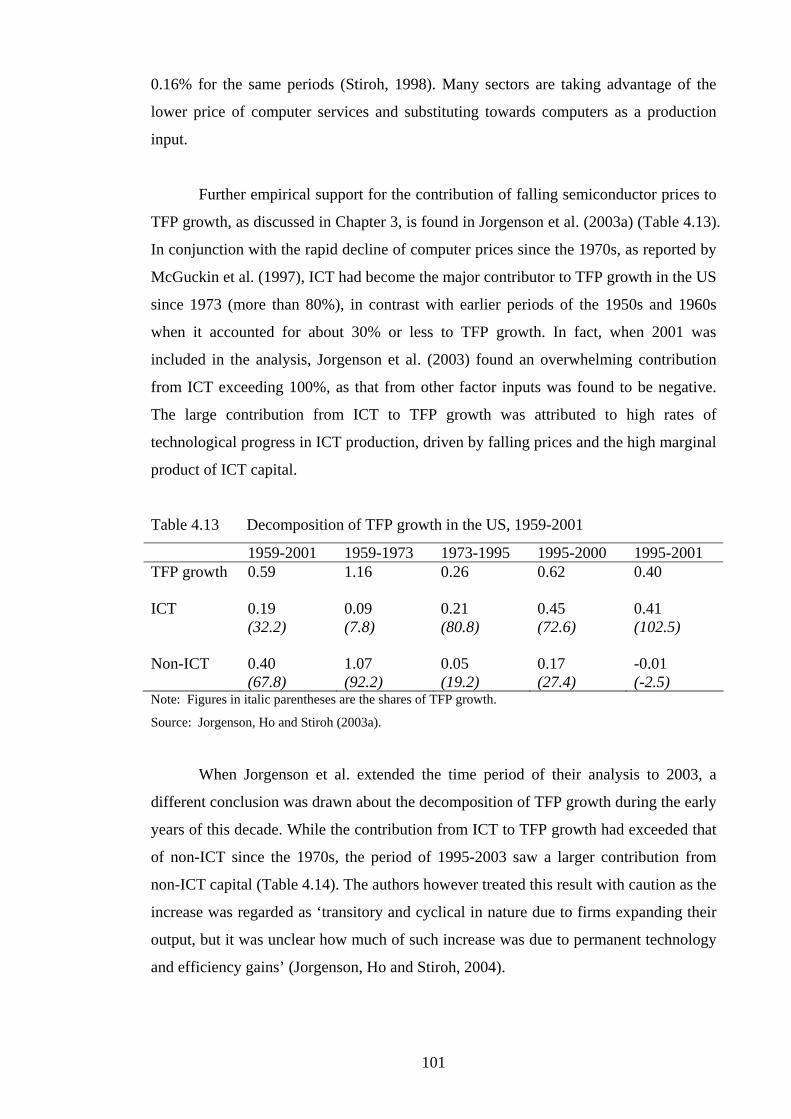
0.16% for the same periods (Stiroh, 1998). Many sectors are taking advantage of the
lower price of computer services and substituting towards computers as a production
input.
Further empirical support for the contribution of falling semiconductor prices to
TFP growth, as discussed in Chapter 3, is found in Jorgenson et al. (2003a) (Table 4.13).
In conjunction with the rapid decline of computer prices since the 1970s, as reported by
McGuckin et al. (1997), ICT had become the major contributor to TFP growth in the US
since 1973 (more than 80%), in contrast with earlier periods of the 1950s and 1960s
when it accounted for about 30% or less to TFP growth. In fact, when 2001 was
included in the analysis, Jorgenson et al. (2003) found an overwhelming contribution
from ICT exceeding 100%, as that from other factor inputs was found to be negative.
The large contribution from ICT to TFP growth was attributed to high rates of
technological progress in ICT production, driven by falling prices and the high marginal
product of ICT capital.
Table 4.13 Decomposition of TFP growth in the US, 1959-2001
1959-2001 1959-1973 1973-1995 1995-2000 1995-2001 TFP growth ICT Non-ICT
0.59 0.19 (32.2) 0.40 (67.8)
1.16 0.09 (7.8) 1.07 (92.2)
0.26 0.21 (80.8) 0.05 (19.2)
0.62 0.45 (72.6) 0.17 (27.4)
0.40 0.41 (102.5) -0.01 (-2.5)
Note: Figures in italic parentheses are the shares of TFP growth. Source: Jorgenson, Ho and Stiroh (2003a).
When Jorgenson et al. extended the time period of their analysis to 2003, a
different conclusion was drawn about the decomposition of TFP growth during the early
years of this decade. While the contribution from ICT to TFP growth had exceeded that
of non-ICT since the 1970s, the period of 1995-2003 saw a larger contribution from
non-ICT capital (Table 4.14). The authors however treated this result with caution as the
increase was regarded as ‘transitory and cyclical in nature due to firms expanding their
output, but it was unclear how much of such increase was due to permanent technology
and efficiency gains’ (Jorgenson, Ho and Stiroh, 2004).
101

Table 4.14 Decomposition of TFP growth in the US, 1959-2003
1959-2003 1959-1973 1973-1995 1995-2003 TFP ICT Non-ICT
0.74 0.25 (33.8) 0.49 (66.2)
1.12 0.09 (8.0) 1.03 (92.0)
0.34 0.24 (70.6) 0.10 (29.4)
1.14 0.53 (46.5) 0.61 (53.5)
Note: Figures in italic parentheses are the shares of TFP growth. Source: Jorgenson, Ho and Stiroh (2004).
A few empirical works examined the contribution of ICT to TFP growth in
countries outside the US. The case for acceleration in TFP growth owing to ICT after
1995 was also found in Japan (Table 4.15). For instance, the share of ICT contribution
to TFP growth doubled from 40% during the early 1990s to 80% after 1995. Such
increase was attributed to the more rapid fall in the relative price of computers
compared with the prices of communications equipment and software in Japan
(Jorgenson and Motohashi, 2005).
Table 4.15 Decomposition of TFP growth in Japan, 1975-2003
1975-1990 1990-1995 1995-2003 TFP ICT Non-ICT
1.57 0.23 (14.6) 1.35 (86.0)
0.80 0.32 (40.0) 0.48 (60.0)
0.45 0.36 (80.0) 0.10 (22.2)
Note: Figures in italic parentheses are the shares of TFP growth. Source: Jorgenson and Motohashi (2005).
One of the recent works has compared the contribution of ICT to TFP growth
between US and the European countries (Timmer and van Ark, 2005). The authors used
the ‘Domar weighting system’ which estimates the contribution of ICT industry to
aggregate TFP growth by weighting TFP growth for the industry based on the ratio of
the ICT industry’s output to aggregate GDP in each country. It was found that the
contribution of ICT industry to TFP growth was larger in the US than most countries in
the European Union (EU), except Ireland, Finland and Sweden (Table 4.16), since the
former has a relatively larger ICT-producing industry. For instance, the ICT-producing
industries in the US contributed 0.17 percentage points more than the EU (0.44 vs 0.27)
102

to TFP growth. This was attributed to the US having a much larger electronic
components manufacturing industry (which manufactures semiconductors) than the
latter (Timmer and van Ark, 2005).
Within the EU, the three afore-mentioned countries (Ireland – producing mainly
computers; Finland and Sweden – communications equipment) have relatively larger
ICT-producing industries than the rest (Timmer and van Ark, 2005). The evidence for
the contribution of declining semiconductor prices to the acceleration of TFP growth
was further found in Finland (Daveri and Silva, 2004). In this study (which examined
technological spillover between Nokia and other industries in the Finnish economy),
ICT-producing industries contributed about 75% to TFP growth in 1992-1994, against
25% of non-ICT producers. The share of ICT producers increased to 103% in 1995-
2000, as non-ICT producers had a negative contribution to TFP growth. The fact that
productivity gains were concentrated in Nokia as well as few other firms belonging to
the ‘ICT cluster’ led the authors to conclude that the acceleration in TFP growth in
Finland was not due to the spillovers from Nokia, but to ‘the world decline in the price
of semiconductors’ (Daveri and Silva, 2004). Based on the collection of empirical
results gathered so far, it can therefore be deduced that the fall in semiconductor prices
has been highly significant in accelerating TFP growth in the developed countries.
4.5 China-related studies
Among the current literature reviewed to date, the contribution of ICT to Chinese
economic growth is examined only in two studies, namely Lee and Khatri (2003) and
Jorgenson and Vu (2005) (Table 4.17). The former measures the contribution of ICT
capital stock to the growth of GDP and labour productivity in major Asian economies
for the period 1990-1999, while the latter addresses the impact of ICT investment on the
growth of world economy, seven regions and 14 major economies during the period
1989-2003.
103

Table 4.16 Contribution of ICT production to TFP growth in the EU and US, 1995-2001
Contribution of ICT production to aggregate TFP (%) Country
Office, accounting and
computing equipment
Electronic components
Communication equipment
Total
Ireland Finland Sweden
United Kingdom Portugal
France Austria
Germany Italy
Belgium Spain
Netherlands Denmark
Greece
European Union United States
2.310.100.040.260.160.120.220.120.060.190.080.080.030.00
0.130.15
1.130.050.070.070.110.120.020.080.090.010.040.010.040.01
0.080.23
0.18 0.53 0.46 0.05 0.04 0.07 0.01 0.04 0.07 0.00 0.03 0.02 0.03 0.00
0.06 0.06
3.620.690.570.380.310.310.250.240.210.210.150.110.100.01
0.270.44
Source: Timmer and van Ark (2005). Table 4.17 Empirical studies of the contribution of ICT to China’s economic and
labour productivity growth
Contributions Period GDP ICT KN Labour TFP
10.63
0.14 (1.3)
3.23 (30.4)
3.78 (35.6)
3.49 (32.8)
8.76 0.27 (3.1)
3.39 (38.7)
1.34 (15.3)
3.76 (42.9)
Lee and Khatri (2003): 1990-94 1995-99
9.94 0.17
(1.7) 2.12 (21.3)
1.32 (13.3)
6.33 (63.7)
Jorgenson and Vu (2005): 1989-95 1995-03 7.13 0.63
(8.8) 3.17 (44.5)
0.84 (11.8)
2.49 (34.9)
ALP ICT KN Labour TFP 1990-94 6.63 0.10
(1.5) 2.16 (32.6)
1.10 (16.6)
3.27 (49.3)
1995-99
7.41
0.21 (2.8)
2.92 (39.4)
0.65 (8.8)
3.63 (49.0)
Note: See the note to Table 4.1.
Lee and Khatri (2003) showed that the contribution of ICT capital to GDP
growth in China has increased steadily from 1% in 1990-94 to 3% in 1995-99; while the
corresponding contribution to ALP growth increased from 1.5% to almost 3% during
104

the same periods. One of the deficiencies in Lee and Khatri (2003) is that the time frame
under study covered only the 1990s. However, the more recent study of Jorgenson and
Vu (2005) found the contribution of ICT capital to China’s economic growth increasing
from 1.7% during 1989-1995 to 8.8% during 1995-2003. China, being the world’s
largest recipient of foreign investment, is also the most attractive market for ICT
investment in the developing world. The factors contributing to the sharp rise in ICT
investment in the most recent years will be discussed in Chapter 5 of the dissertation.
There is a handful of studies which provide a descriptive account of ICT
development in China. The earliest work could be found in Meng and Li (2002) who
provided some empirical evidence on the development of China’s ICT industry during
the 1990s. Meng and Li argued that in order to boost the development of ICT, China
will have to address the problems of financing its ICT industry (through venture
capital), overcome the problem of brain drain by encouraging the return of overseas
talents and expatriates (through the building of high-tech parks), and deregulate to
increase competition in the sector. More recent accounts that analyse the development
of ICT in China are found in Katsuno (2005) and Jing (2006). In a similar fashion to
Meng and Li (2002), these authors compile a wide array of statistical evidence to
present an overview of the growth of ICT market in China. Katsuno (2005) represents
the first attempt by OECD to compile a complete set of indicators which could be used
for comparing China’s ICT development with other countries. The author concludes that
China is not only developing as an ICT hardware production centre, but also rapidly
emerging as a software development centre. Therefore, while China is turning into one
of the world’s major ICT producer on one hand (but its role is more like a major
assembly line for foreign manufacturers), it is also seen to pursue a balanced
development between both the hardware and software sectors on the other hand. Finally,
in the most recent study of ICT in China, Jing (2006) introduced various definitions of
ICT and used market indicators to compare the level of ICT development in China with
other countries. The latter also looked at the issue of regional disparity in China where
the use of ICT is concerned.
4.6 Conclusion
This chapter reinforces the previous one with findings dealing with the contribution of
ICT capital to economic and labour productivity growth in major economies throughout
105

the world. Based on a review of current literature, this chapter finds that ICT has a
positive impact on productivity and economic growth in developed countries. Such
evidence can be found in studies that look at the firm, industry and national levels.
However, differences occur between the US, Europe and other developed countries with
regards to the contributions from ICT production and use to economic growth. On the
whole, a stronger contribution is found to come from ICT use in the US, Canada,
Australia and New Zealand, whereas ICT production is found to be the primary cause of
productivity growth in Europe, with the exception of UK.
A survey of recent literature finds the contribution of ICT to economic growth to
have increased between the two periods before and after 1995, be it the developed or
developing world. Differences occur between developed and developing countries, and
between individual countries within the developed world as to the magnitude of the
contribution. For instance, in developed countries as well as the Asian NIEs, the
contribution rate of ICT to economic growth tends to exceed 20% in the period after
1995; whereas in other parts of the world, the contribution rate usually falls below 15%.
The literature review of both the previous and this chapter found there is very
little empirical studies on China where the contribution and impact of ICT on
productivity and growth is concerned. A survey of the literature finds that the
contribution of ICT capital to Chinese economic growth has increased from less than
2% before 1995 to almost 9% in the period after. In the subsequent chapters 5 and 6, the
dissertation will focus on empirical exercises which estimate the size of ICT capital
stock and the contribution of ICT capital to economic growth in China. This will allow
us to draw further conclusions about the role of ICT in the economic growth of China.
The main contribution of this chapter to current literature is the attempt to piece
together the empirical findings of recent academic works related to sources of growth
that distinguishes ICT capital from other factor inputs. This would allow readers to
compare the similarities and differences between the findings of different authors and
make some inferences about the actual contribution of ICT as well as other factors to
output and productivity growth.
106

Chapter 5
ESTIMATIONS OF ICT CAPITAL STOCK
5.1 Introduction
The literature review in the previous chapters has provided an overview of the role and
contribution of information and communications technology (ICT) capital in the
production process. It is obvious that capital as a factor of production is one of the most
important inputs in growth accounting analysis. In economic theory, the process of
investing in the real productive stock of equipment in the economy is known as capital
formation (Black, 1997). This can be achieved either through construction or purchase
from suppliers. The process of increasing the capital stock as a source of economic
growth is known as capital accumulation. To examine the role of ICT in economic
growth, the starting point is invariably the estimation of ICT capital stock which is not
available in statistical sources.
This chapter serves as the beginning of the empirical exercises in the
dissertation. It aims to employ the perpetual inventory method to estimate the ICT
capital stock series in China for the period of 1983 to 2004. This will involve, first,
estimating the initial value of ICT capital stock in 1983, and second, estimating the
capital stock series assuming certain rates of depreciation throughout the entire period.
The chapter begins with a background overview of the pattern of ICT investment that
has taken place in China since the mid-1980s. The time series for ICT investment in
China is drawn from Chinese statistical sources. By comparing the growth rates of ICT
investment and overall economic growth in China, some inferences can be drawn about
the relationship between ICT and economic growth in the country. The chapter begins
by examining the factors that account for the increase in ICT investment over the past
two decades. This is followed by a discussion of methods used to estimate the ICT
capital stock and a review of empirical studies pertaining to determination of the
depreciation rate of ICT capital. Next, a series of ICT capital stock in China is derived
using the conventional perpetual inventory method. The dissertation attempts to apply
three approaches to estimate alternative sets of ICT capital stock series. The chapter
will finally conclude with a sensitivity analysis of capital stock estimates using different
rates of depreciation.
107

5.2 ICT investment in China
5.2.1 Patterns of ICT investment
Since statistical data for ICT capital stock is not readily available in Chinese statistical
sources, it is derived from investments in ‘telecommunications equipment’ and
‘computer equipment’. However, we can only find data on gross ICT investment in the
Yearbook of China’s Electronics Industry from the year 1984 onwards. Time series data
for ICT investment from 1996-2004 is also available from China Statistical Yearbook of
High Technology Industry. In both sources, the data appear in the form of ‘investment
in capital construction’ and ‘investment in innovation’ for various sectors in the
electronics and high technology industry respectively. 1
For the period of 1984-1992, data for ICT investment appear only in the
category of investment in capital construction. However, data for capital investment
from 1993 onwards includes investment in innovation, thus creating a picture of a surge
in investment after 1992 (Figure 5.1). It is noted that investment in capital construction
has been consistently twice the size of investment in innovation since the early 1990s
(Figure 5.2). 2 However, the ratio of investment in innovation over that in capital
construction has been rising steadily since 1998, from 33% to over 60% in 2002. This
statistical evidence supports empirical findings that China has moved away from
dependence on technology transfer or import during the 1980s (Lu, 2000b). Instead,
domestic companies in China have gradually emphasized on technology acquisition by
building up their ‘innovation capability’ to enhance competitiveness since the mid-
1990s, be it telecommunications or computer (PC manufacturing and software
development) enterprises (Fan, 2006). Another important reason for the surge in
investment may be related to China’s new phase of high-speed economic growth since
the ‘southern tour’ (nanxun) by Deng Xiaoping in the spring of 1992. As shown in
Figure 5.1, the total real investment in ICT has increased by more than 300 times since
1992.
1 Investment in innovation refers to ‘the renewal of fixed assets and technological innovation of the original facilities by the enterprises and institutions as well as the corresponding supplementary projects and related activities covering only projects each with a total investment of 500,000 RMB or more.’ Investment in capital construction refers to ‘the new construction projects and related activities of enterprises, institutions or administrative units for the purpose of expanding production capacity or improving project efficiency covering only projects each with a total investment of 500,000 RMB or more.’ See State Statistical Bureau (2002), China Statistical Yearbook, pp. 243. 2 From 2003 onwards, no data on the breakdown of ICT investment into ‘capital construction’ and ‘innovation’ in the statistical source, i.e. China Statistics Yearbook on High Technology Industry is available.
108

109
Figure 5.3 illustrates the growth of investment in the telecommunications and
computer industries. It indicates a huge jump in telecommunications investment in
2001. Although no direct explanations can be found in official sources so far, several
phenomena may be attributed to the surge. First, there were signs of burgeoning demand
for telecommunications services in that year, when China overtook the US as the
world’s largest mobile phone market, exceeding 120 million subscribers, and its local
telephone switchboard capacity reached 200 million lines. Second, the number of
Internet users doubled from 15 million in 2000 to more than 32 million the following
year (Lu and Wong, 2003). This further contributed to the increased demand for
telecommunications services since access to the Internet requires the use of telephone
lines.
The ratio of ICT investment to total investment has shown an increasing trend
over the past two decades, although it still remained below 1% in 2004 (Figure 5.4). It is
also shown that ICT investment has grown at a higher rate compared with total
investment as well as real output. In addition to the Sixth Five-year Plan Period (1986-
1990) when ICT investment declined by more than 24% on average, and the Seventh
FYP (1991-95) when its growth rate shot over 100%, the growth of ICT investment has
been three to four times that of real GDP during the past ten years (Table 5.1). Such a
trend suggests that the importance of ICT investment to China’s economic growth can
only increase in the future.
Table 5.1 Growth indicators, 1986-2004 (%) Five-year Plan Period (FYP)
ICT investment Non-ICT investment
Total investment
GDP
7th (1986-90) 8th (1991-95) 9th (1996-00) 10th (2001-04)
-46.3
88.5
16.8
16.1
1.3
17.0
8.7
15.3
1.3
17.0
8.7
15.3
4.5
11.5
8.0
10.5
Sources: State Statistical Bureau, Yearbook of China’s Electronics Industry, China Statistics Yearbook on High Technology Industry and China Statistical Yearbook (various issues).

Figure 5.1 Real ICT investment in China, 1984-2004
0
2000
4000
6000
8000
10000
12000
1984 1985 1986 1987 1988 1989 1990 1991 1992 1993 1994 1995 1996 1997 1998 1999 2000 2001 2002 2003 2004
Inve
stm
ent (
mill
ion
yuan
)
Source: State Statistical Bureau, Yearbook of China’s Electronics Industry and China Statistics Yearbook on High Technology Industry (various issues).
110
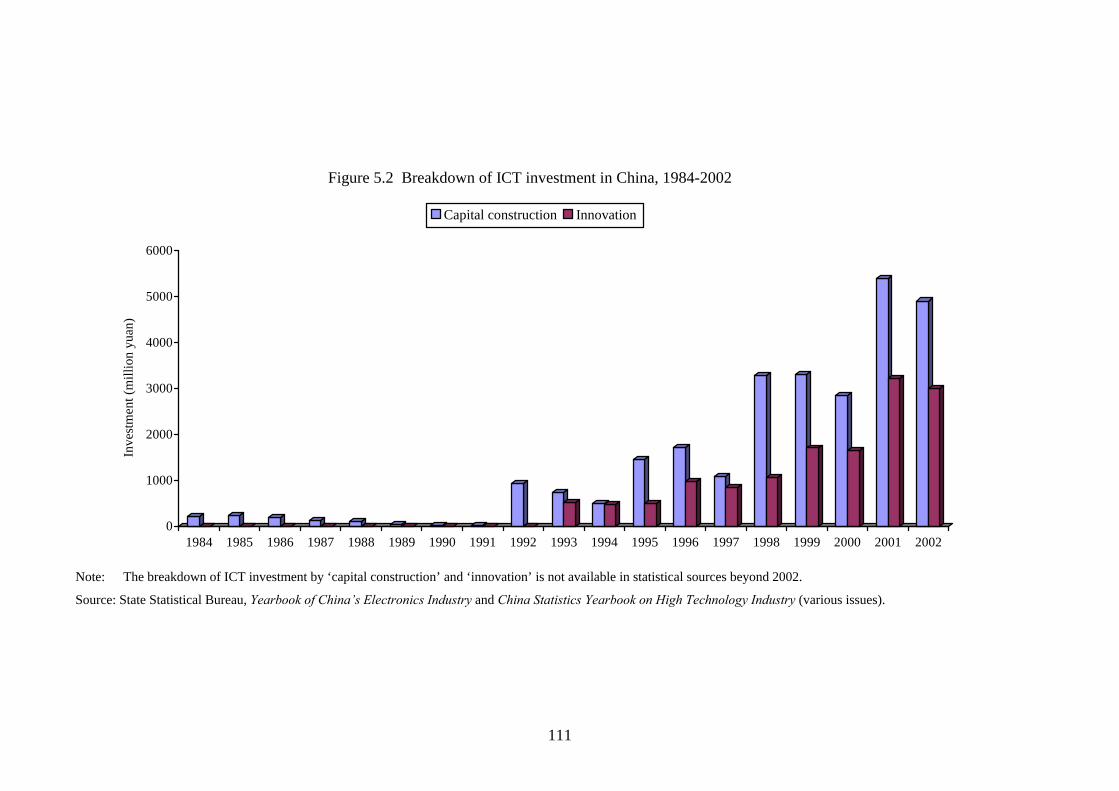
0
1000
2000
3000
4000
5000
6000
Inve
stm
ent (
mill
ion
yuan
)
1984 1985 1986 1987 1988 1989 1990 1991 1992 1993 1994 1995 1996 1997 1998 1999 2000 2001 2002
Figure 5.2 Breakdown of ICT investment in China, 1984-2002
Capital construction Innovation
Note: The breakdown of ICT investment by ‘capital construction’ and ‘innovation’ is not available in statistical sources beyond 2002.
Source: State Statistical Bureau, Yearbook of China’s Electronics Industry and China Statistics Yearbook on High Technology Industry (various issues).
111
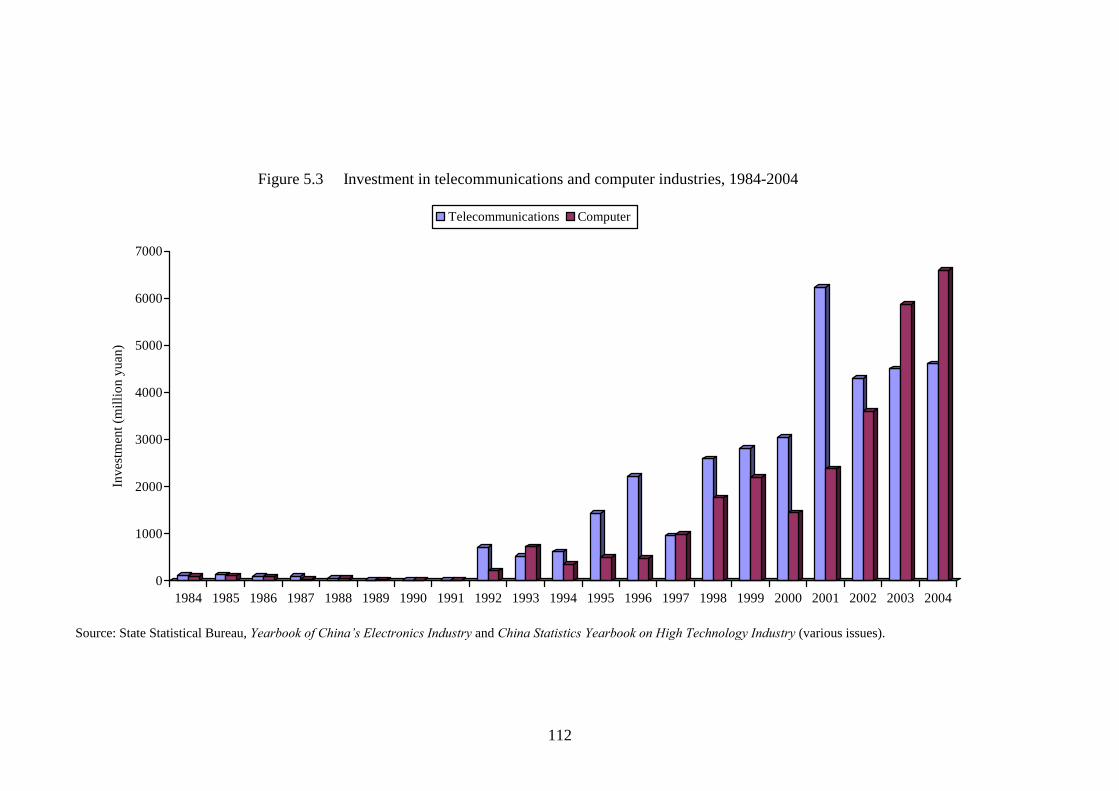
0
1000
2000
3000
4000
5000
6000
7000
Inve
stm
ent (
mill
ion
yuan
)
1984 1985 1986 1987 1988 1989 1990 1991 1992 1993 1994 1995 1996 1997 1998 1999 2000 2001 2002 2003 2004
Figure 5.3 Investment in telecommunications and computer industries, 1984-2004
Telecommunications Computer
Source: State Statistical Bureau, Yearbook of China’s Electronics Industry and China Statistics Yearbook on High Technology Industry (various issues).
112

Figure 5.4 Ratio of ICT investment to total fixed investment in China, 1984-2004
0
0.05
0.1
0.15
0.2
0.25
0.3
0.35
0.4
0.45
1984 1985 1986 1987 1988 1989 1990 1991 1992 1993 1994 1995 1996 1997 1998 1999 2000 2001 2002 2003 2004
%
Source: State Statistical Bureau, Yearbook of China’s Electronics Industry and China Statistics Yearbook on High Technology Industry (various issues).
113

5.2.2 Explaining the growth of ICT investment
This section seeks to account for the factors explaining the rapid growth of ICT
investment in China over the past two decades. The answer could be found in the
channels through which investment in ICT flowed into China. During the early stages
of ICT development in China, this could be largely attributed to the transfer of foreign
technology which led to inflow of ICT capital. After the founding of the PRC in 1949,
China had relied primarily on technology transfer and imports for acquisition of foreign
technology as a major channel of introducing ICT capital and expertise into the country
(Zhao, 1995). Between 1978 and 1980, China reached training agreements with
multinational companies from the US, Britain, France, Germany, Italy and Japan with
the aim of expanding its skilled labour pool of computer personnel involved in R&D,
maintenance and manufacture. On the other hand, China also sought to increase
technology import by entering into foreign joint venture and technology cooperation
agreements with foreign governments of Australia, Belgium, Britain, Denmark, Finland,
France, Greece, Italy, Japan, Luxembourg, Norway, Sweden, US and West Germany
since 1978 (Zhao, 1995).
Japan had been the leading country in technology transfer to China up to the
early 1990s. It was shown that Japanese contractual investments dropped sharply from
1988 to 1991, before rising again by five times in 1992, which accounted for the
negative growth rate of ICT investment during the late 1980s (Tang, 1997). Xu (1997)
identified three phases in China’s import of technologies since the 1980s. There was a
stagnation of technology import during the period 1988-91, followed by a surge in
imports from 1992 onwards. The period of stagnation in the late 1980s is illustrated in
this chapter’s findings on ICT investment which decreased by 7% annually on average
during 1987-1991. This was due to “the implementation of a contractionary
macroeconomic policy which saw a drop in the number of technology import contracts
from 437 in 1988 to 232 in 1990” (Xu, 1997: 86).
China’s investment in ICT increased twenty times in 1992. This phenomenon
occurred in parallel to China’s new phase of high-speed economic growth since the
“southern tour” (nanxun) by Deng Xiaoping in the spring of 1992. In 1992, the ICT
industry was listed as a pillar industry, and ICT products recognized as the new drivers
for economic growth (Dong, 2004). The establishment of high technology parks and
R&D centers in the early 1990s is also a major factor that explains the huge increase in
114
ICT investment. For instance, total investment in science and technology for the Torch
Plan, in which a key task was to establish high-technology development zones,
increased by more than 40 times from 100 million yuan at its inception in 1988 to 4.4
billion yuan in 1992 (Segal, 2003).
By 1993, there were fifty-two designated high technology development zones
(HTDZs) which could enjoy preferential treatment granted by the Provisional
Stipulations about Some Policy Measures on State High-tech Industrial Development
Zones and the Stipulations about Tax Policies on State High-tech Industrial
Development Zones, which were approved by the State Council on 6 March 1991, and
subsequently promulgated as the State Basic Policy for High-Tech Industrial
Development Zones in 1992 which covered taxation, finance, imports and exports,
pricing and personnel policy (Wall and Yin, 1997; Segal, 2003). Those preferential
policies that favored investment include the reduction in the income tax rate for high-
tech enterprises by 15%, and 10% for those enterprises whose share of exports in total
output exceeds 70%; a two-year tax holiday for newly established high-tech enterprises
in the HTDZs; provision of bank loans to high-tech enterprises located within the zones;
exemption from export taxes or import tariffs and license, etc. (Segal, 2003).
During 1993-2001, China’s ICT investment grew by an average of almost 33%
annually. Xu (1997) cited two main reasons for the enormous rise in technology imports
since 1992. The first is attributed to inward FDI which became ‘a strong force in the
development of China’s economy which created a new channel for the import of
technology’. The second factor is the increasing role given to private enterprises which
now had greater autonomy to import technology, whereas the main task of government
was simply ‘to set macro targets for technology imports but not to seek micro-control of
the structure and content of such imports’ (Xu, 1997: 88-9).
As explained earlier, the share of innovation out of the ICT investment in China
has been steadily increasing since the late 1990s. The innovative achievements of
China’s indigenous enterprises such as Lenovo and Stone Group Corporation have been
examined in Chapter 2. The effect of innovation on a firm’s output is explained by
Oulton and Srinivasan (2005). Investment in innovation (which may include consultant
fees, management salary or expenditure on the retraining of workers) often incurs total
costs that could be several times the amount spent on equipment and software.
115

However, incurring such costs would actually enable firms to acquire the capability to
absorb new technology in the future, therefore creating a stock that ‘yields future
benefits’ (Oulton and Srinivasan, 2005). However, it has been cautioned that putting
more investment in innovation should be complemented with a corresponding
improvement in the quality of human capital owing to the complexity of the learning
process, as the country would have to face the problem of standardization following the
technological improvements in ICT capital (Atzeni and Carboni, 2006). The
effectiveness of such investment also depends on the pace of firms’ adaptation to the
new technology. Therefore, with the current structure of ICT investment in China,
whereby investment in capital construction and innovation make up approximately 62%
and 38% of total ICT investment in 2002 respectively, it is important that China
maintains a balanced approach to investment over the next few years, although a rising
share of innovation is expected.
Lastly, with the blessings of geography and culture, China has become the
biggest beneficiary of being the closest neighbour to one of the world’s major producers
of ICT – i.e. Taiwan.3 Taiwan has become the largest source of FDI in ICT investment
for China.4 According to study carried out by Rand Corporation which examines the
political and security impact of cross-strait transfer of ICT production, the rapid growth
of the ICT industry in China is attributed mainly to the transfer of technology and
capital from Taiwan. 5 In fact, more than 70% of the computer hardware produced in
China came from factories funded by Taiwanese companies (Hu and Chan, 2004). In a
survey of the top 100 Taiwanese ICT companies located in China, over 85% have set up
R&D centres in China between 1999 and 2004 (Hsu, 2006).
Taiwanese ICT investment, consisting of desktop PCs, monitors, motherboards,
keyboards, cables and other components, began flowing into mainland China in the
early 1990s due to rising costs and labour shortage in Taiwan, concentrating mainly in
the Yangtze River Delta regions of Shanghai and Suzhou (Dedrick, Kraemer and Ren,
2004).6 After the mid-1990s, with further opening up and rapid growth of the Chinese
3 Taiwanese companies accounted for 60% of the world’s notebook PC production in 2003 (Dedrick, Kraemer and Ren, 2004). 4 According to the Ministry of Foreign Trade and Economic Cooperation, between 1979 and 1998, over 70% of the total FDI in China came from Hong Kong, Taiwan and Singapore (Hsu, 2006). 5 “Taiwan’s IT exports to China not hurting US”, The Straits Times (6 August 2004, Singapore). 6 Taiwanese investment in China took the following pattern: First, it started in the late 1980s with investment mainly in labour-intensive, traditional sectors such as garments, food-processing and downstream production chain of the petrochemical industry. Second, in the mid-1990s, investment was
116
economy, the mainland became the ‘green pasture’ for Taiwanese investors seeking
greater wealth and prosperity. While low cost was still the main pull factor, the
availability of skilled labour in mainland China had become one of the most critical
factors since the late 1990s (Hsu, 2006). One survey of 56 Taiwanese ICT companies
revealed that accessing the local human resources in China has become the main motive
of extending R&D activities over there, which is ‘abundant and cost-effective with
benefits of linguistic and geographical proximities’ (Lu and Liu, 2004).
In the meantime, the mainland Chinese government implemented policies to
attract more ICT investment from Taiwan.7 Taiwanese manufacturers have also been
lured to shift their production to mainland China by the latter’s high technology
industrial parks, despite the ‘go slow, no haste’ policy (Jieji Yongren in Chinese)
adopted by former Taiwanese President Lee Teng-Hui in August 1996 which restricted
the production of high value-added products such as notebook PCs in China (Hu and
Chan, 2004). However, Taiwan’s notebook manufacturers were able to circumvent the
ruling by ‘making components and base units in China, and then shipping them abroad
for final assembly’ (Kraemer and Dedrick, 2002b). In fact, they are now investing in
mainland facilities to produce complete notebooks (Kraemer and Dedrick, 2002b).
In a move to attract more investment from Taiwan, the Xi’an HTDZ (which
currently houses 66 Taiwanese companies) planned to construct a technology industrial
base for Taiwanese enterprises, covering telecommunications, software and
bioengineering in 2005. It will include a central plant, ICT and integrated circuit
manufacturing center as well as an international exhibition, information and logistics
center. In addition, it will also build community facilities for the Taiwanese that include
five-star hotels, a hospital, a kindergarten and an international school.8
Taiwan has also played an important role in China’s transition from being
merely a ‘production factory’ to an ‘innovation centre’. Taiwanese investors have
spearheaded by upstream firms trying to skirt round the restrictions imposed by their government’s ‘go slow, no haste’ policy. The third round of investment, which began in the late 1990s, were led by firms in the ICT sector producing computer peripherals, assembly parts, programming and finally the semiconductor (Chang and Cheng, 2002). 7 For instance, local governments established closer relations with Taiwanese investors by allowing the latter to set up the ‘Taiwanese investor associations’ (TIAs) in major host cities such as Shanghai, Suzhou, Kunshan and Dongguan (Hsu, 2006). 8 “Xi’an to build technology industrial base for Taiwan firms”, SinoCast China Business News (London: July 19, 2005).
117

brought to mainland China not only their capital and new standards in technology, but
also the entrepreneurial spirit that is embedded in Taiwanese companies and that is
beneficial to young and highly-educated Chinese engineers (Lu and Liu, 2004). Indeed,
it was such continuous and massive inflow of investments that resulted in mainland
China replacing Taiwan as the world’s third largest producer of computer hardware in
2000, and eventually surpassing Japan to assume second place in 2002 (Dedrick,
Kraemer and Ren, 2004).
5.3 Estimation of capital stock
Capital, being a factor of production of the economy as well as a measure of the wealth
of a nation, has attracted a great deal of attention in economics literature. Capital stock
is defined to consist of ‘all assets which are durable (with a service life longer than a
year), reproducible and tangible’ (Bohm et al., 2002). For instance, the average service
life of computer equipment is determined to be five years in France (Brilhault, 2000).
Capital stock excludes assets such as land and natural resources which are not
reproducible and inventory stocks which are not durable (Pyo, 1988). The estimation of
aggregate (or gross) capital stock is useful for determining its contribution to economic
growth. Data on capital stock, however, are seldom available in official statistical
sources, and usually estimated using data of gross investment. Investment figures are
normally first deflated using a price index.
5.3.1 A theoretical model
One of the most commonly used methods of estimating the capital stock is the perpetual
inventory method, which ‘requires a time series of deflated values of capital investment
data, obtained by dividing the current value of investment by a capital goods price index
in order to adjust for changes in the purchasing power of investment dollars’ (Anderson
and Rigby, 1989). The perpetual inventory method has been applied in various studies
of estimating capital stock using investment data from the national accounts in the US
(Jorgenson, 1989), Australia (Levtchenkova and Petchey, 2000; Diewert and Lawrence,
2005), European Union (Timmer and van Ark, 2005), France (Brilhault, 2000), Japan
(Shinjo and Zhang, 2003; Miyagawa, Ito and Harada, 2004; Jorgenson and Motohashi,
2005), Russia (Hall and Basdevant, 2003), Spain (Mas, Perez and Uriel, 2000), and
other selected developed economies (Abadir and Talmain, 2001).
118

In estimating the capital stock, the perpetual inventory method takes into
account the depreciation rate, δ, which is defined as ‘the rate of decline in value of
capital asset due to wear and tear, obsolescence, accidental damage and aging’
(Fraumeni, 1997). Assuming a constant rate of depreciation, i.e. ‘an equal proportion of
the services of capital is withdrawn in each of the λ periods following its installation’
(Anderson and Rigby, 1989), the capital stock is estimated according to the following
equation, which is commonly used by various authors (for example, Anderson and
Rigby, 1989; Nadiri and Prucha, 1996; Shinjo and Zhang, 2003; Wu, 2004; Diewert and
Lawrence, 2005; Timmer and van Ark, 2005):
Kt = It + (1–δ) Kt-1 (5.1)
where the capital stock, Kt, at year t is dependent on the level of capital investment, It in
the same year and capital stock level in the preceding year which is deflated by the rate
of depreciation, δ. Similarly, Nadiri and Prucha (1996) used the same method to
measure the R&D capital stock in the US manufacturing sector.
5.3.2 Depreciation of ICT capital
As pointed out by Nadiri and Prucha (1996), and based on a review of recent empirical
literature, few studies have been carried out to measure the depreciation rate of ICT
capital stock. Most studies covering the contribution of ICT capital to economic or
productivity growth do not provide an estimate of the depreciation rate for the
respective country or countries. Following Pyo (1998), Kim (2002) used 13.1% as the
depreciation rate of Korean IT capital for the period of 1970-77, and 14.2% for 1977-
2000.
The measurement of depreciation requires data on the price and quantity of
investment goods, with the price of acquiring capital goods being given by the unit cost
of acquisition which depends on its characteristics as well as its age (Jorgenson, 2000).
Essentially, depreciation depends on the cost as well as usage life of the asset. For
example, the unit cost of using a computer for a specified period of time determines its
rental price (Jorgenson, 2000). The measurement of depreciation for ICT capital was
explored in Fraumeni (1997) for US computing equipment during the periods before
and after 1978, and in Doms et al. (2004) for US personal computers. Fraumeni (1997)
used the following formula to derive the depreciation rate, δ,
119

TR
=δ (5.2)
where T is the average asset service life and R is the estimated declining-balance rate.
Doms et al (2004) attempted to derive the depreciation rate of personal computers based
on the price of computers specified by a set of embodied characteristics including the
speed of the processor, the size of the hard drive and the amount of memory, etc. One
problem of estimating δ with the perpetual inventory method, however, is that the
specification of the service lifetime of the capital good is usually not empirically
observed (Anderson and Rigby, 1989), as in the case of China where the time series
data is not available.
Nadiri and Prucha (1996) estimated the depreciation rates of both physical and
R&D capital stocks for the US manufacturing sector. Their results show that physical
capital and R&D capital depreciate at the rates of 6% and 12%, respectively. The
authors employed the method of Pakes and Schankerman (1986) who stated that ‘the
conceptually appropriate rate of depreciation of knowledge’ (i.e. the proxy definition of
R&D capital) is ‘the rate at which the appropriate revenues decline, which arises not
from any decay in productivity of knowledge, but due to inability to appropriate the
benefits from the innovations and the obsolescence of original innovations by new
ones’. In other words, the depreciation rate of ICT capital depends very much on
‘investments in innovation’ and the obsolescence of ICT equipment. Pakes and
Schankerman (1986) reported a depreciation rate of 26% for R&D capital in the UK in
the 1950s and 17% in the 1960s and 1970s, and about 12% for France and Germany.
Therefore, it can be assumed that the depreciation rate of ICT (or R&D) capital stock
falls within the range of 10-30% (Table 5.2).
5.3.3 Measurement of China’s ICT capital stock
The estimation of China’s capital stock during the pre-reform era was reported in Chow
(1993) for the period of 1952-85. He estimated China’s capital stock series for five
sectors, namely, agriculture, industry, construction, transportation and commerce. Wu
(2004) also derived a comprehensive database for China’s total capital stock series for
1953-2000. Wu (2004) adopted three approaches to the estimation of China’s capital
stock, namely, the initial value, backcasting and integral approaches. As no study has
120

ever estimated the ICT capital stock of China, the dissertation attempts to do so using
these three approaches.
Table 5.2 Depreciation rate of ICT equipment Author(s) Category of equipment Depreciation rate (%) Jorgenson (1989) Nadiri and Prucha (1996) Fraumeni (1997) Kim (2002) Miyagawa, Ito and Harada (2004) Oulton and Srinivasan (2005)
Office, computing and accounting machinery - 1977 Communications equipment - 1977 R&D capital stock Office, computing and accounting machinery - Before 1978 - 1978 and later Communications equipment - Business services - Other industries ICT capital (Korea) - 1970-77 - 1977-00 ICT capital (Japan) Office, computing and accounting machinery - Before 1978 - 1978 and later Communications equipment - Business services - Other industries ICT capital (UK) - 1992-2000 Computers Software Communications equipment
27 12 12 27 31 15 11 13 14 27 31 15 11 31.5 40 11
The first approach, initial value approach, assumes that the only unknown
variable is the initial value of capital stock. Wu (2004) adopted the initial value
121

approach by estimating the value of China’s total capital stock in 1952, which is the
unknown variable. To calculate the initial value, one needs to look at the relationship
between investment and capital stock since the function of investment is to replace
depreciating capital, and create new capital to maintain economic growth (Harberger,
1978). Therefore the relationship between investment and capital stock can be expressed
in the following form:
It = (δ + γ) Kt-1 (5.3)
where investment in the current year, It, is dependent on the value of depreciated capital
stock in the previous year, Kt-1, given an assumed depreciation rate, δ. Assuming that
capital stock has been growing at the same rate as output (i.e. GDP), γ is therefore taken
to be the average growth rate of GDP over a period of time.
By re-expressing Equation (5.3), the value of capital stock in the initial year can
thus be written as follows:
γδ += 1
0IK (5.4)
where K0 is the value of ICT capital stock in the initial year, which is determined by I1, the level of ICT investment in the first year of the series that is available from the
statistical source; δ, the depreciation rate for ICT capital, and γ, the average growth rate
of real GDP. This method has been applied for calculating the initial value of ICT
capital stock in the US (Shinjo and Zhang, 2003), Japan (Miyagawa et al., 2004) and the
Central American countries (Reinsdorf and Cover, 2005). Nadiri and Prucha (1996) also
applied the same formula for calculating the initial value of the US’ R&D capital stock
by using the growth rate of total capital stock reported in Musgrave (1992) and an
arbitrary depreciation rate of 10%.
Owing to the time series data available for this exercise, the initial year is taken
to be 1983. In the absence of data on the price of acquisition of capital goods, the choice
of the depreciation rate for China’s ICT capital is based on those used by other authors.
The depreciation rate used for the period after 1983 is based on Kim (2002) who
assumed a rate of 14% for Korean ICT capital for the period of 1977-2000. The
122
dissertation thus adopts a depreciation rate of 15% for China’s ICT capital stock from
1983 to 2004. To determine the value of γ, the growth rate of real GDP during the three
years before the initial year, i.e. 1981-1983 is taken from Wu (2004), which is
equivalent to about 10%. Thus, to calculate the initial value of ICT capital stock in
1983, it is assumed that δ = 0.15 and γ = 0.10.
As no data on an ICT price index is available in Chinese statistical sources,
unlike that of the US in which the hedonic price index is available from the website of
Bureau of Economic Analysis (BEA) of the U.S. Department of Commerce, ICT
investment is deflated by the fixed asset investment price index at constant prices
(1991=1) obtained from China Statistical Yearbook. The real ICT investment and
capital stock data derived using this approach is presented in the Appendix to this
chapter.9 Using the formula in equation (5.4), the initial value of ICT capital stock in
1983 is estimated to be 887 million yuan.
The second approach attempts to estimate the data series for incremental value
of capital stock by backcasting to a much earlier period, 1950, assuming ICT investment
increases at a constant rate. The equation (5.1) is then expanded to the following form,
used in Wu (2004):
1950,19501951
0, )1()1( it
ktt k
ti KIrK −−
−−+−= ∑ δ (5.5)
where a capital stock series can be derived given the value of capital stock in 1950 and a
given depreciation rate. ICT investment is first backcast to 1951, assuming that it had
been growing at a constant rate (r) of 19% since that year till the early 1980s. Next, in
order to derive the value of ICT capital stock in 1950, a few assumptions are made. t is
assumed that the ICT equipment used in the 1980s is similar to those of the US and
Japan in the 1970s. It was also noted that in 1987, China was still ‘ten to fifteen years
behind the world leaders in almost all aspects of the computer spectrum except for the
area of Chinese I/O’ (Witzell and Smith, 1989). Based on the empirical information
given in Table 5.2, by comparing the depreciation rates for office, computing and
accounting machinery in the US and Japan corresponding to the period before and after
1978, used by Fraumeni (1997) and Miyagawa et al (2004), it can be assumed that the
9 An alternative set of ICT investment and capital stock data are derived from deflating total investment by the US’ ICT hedonic price index, and presented in the Appendix to this chapter.
123

depreciation rate before the 1980s is lower than that of the period after. Therefore, since
the depreciation rate for the period after 1983 is already assumed to be δ = 0.15, we
assume the depreciation rate for the period of 1950-1983 to be lower, at δ = 0.10. Using
this approach, the initial value of capital is estimated to be 5 million yuan in 1950, and
734 million yuan in 1983.
The third approach, integral approach, assumes capital stock in the first period to
be the sum of all past investments, as used in Wu (2004). By using the investment data
of 1951, and assuming a constant growth rate of r, the value of ICT capital stock in the
initial year (1983) can be expressed as follows:
(5.6) ∑=
+⋅=31
019511983 )1(
t
trIK
where the value of ICT investment in 1951 was estimated to be 0.75 million yuan, and r
is assumed to be 19%. This approach yields the highest initial value of ICT capital stock
at 984 million yuan in 1983.
A comparison of the ICT capital stock series obtained from the three approaches
is illustrated in Figure 5.5. To establish some relationships between ICT capital and the
economy, the capital stock series based on the initial value approach is used as the
benchmark. One reason is that the initial value estimated from this approach lies in
between those obtained from the other two approaches. Furthermore, this approach has
been used by many authors for deriving the initial value of capital in their empirical
work. One aspect of the relationship is illustrated by the ratio of ICT capital stock to the
total capital stock and real GDP (at constant prices) in China, which is still immensely
low even in the recent years, averaging below one per cent. Yet it has been steadily
increasing over the past two decades, the respective ratios rising from 0.03% during the
early 1980s to 0.25% twenty years later, and 0.04% to almost 0.9% during the same
period (Figure 5.6).
5.4 Estimation and sensitivity analysis
Figure 5.5 illustrates the phenomenal increase in the ICT capital stock estimated using
the three approaches outlined earlier. Although the initial values of capital are different,
124

the values of capital stock have gradually converged since the 1990s. ICT capital stock
has grown by almost thirty times since 1992, for instance, from about 1.5 billion yuan in
1992 to almost 40 billion yuan in 2004 – using the initial value approach (Table A5.2 in
the appendix). The ratio of ICT capital stock to total capital stock and GDP has also
consistently increased over the past two decades (Figure 5.6). The ratio of ICT capital
stock to GDP has risen from 0.3% in 1995 to 1.2% within a span of ten years in 2004.
However, this figure is still below that of the OECD countries which had a ratio of 4.7%
for ICT capital to GDP in 1999 (OECD, 2001). The relationship between capital stock
and output will be examined in the next chapter which calculates the contribution of
ICT capital and other factor inputs to output growth of China. Another phenomenon to
look at is that the growth of ICT capital has been consistently above that of real output
in China over the past two decades (Figure 5.7). The growth rate of ICT capital stock
shot up by over 200% and 100% in 1992 and 1993 respectively. This is a direct
consequence of a fifty-five fold increase in ICT investment over 1991, as shown in the
statistical sources (Table A5.1 in the appendix). Other explanations were discussed in
the preceding section.
The robustness of the estimation results can be examined with a sensitivity
analysis by assuming different rates of depreciation for the ICT capital stock. From
Table 5.2, it is shown that current literature estimated the depreciation rate of ICT
capital ranging between 10% and 30%. The dissertation conducts a sensitivity analysis
for all three approaches by adopting depreciation rates of δ = 0.1, 0.15, 0.2, 0.25 and 0.3
for the period after 1983.
The various scenarios for estimation of ICT capital stock series using different
rates of depreciation are illustrated in Table A5.2 of the appendix to this chapter, where
the following observations are noted. First, the size of capital stock is inversely related
to the depreciation rate regardless of the estimation method used. Next, although the
initial value of the capital stock in 1983 is different for each estimation method, the
value of capital stock gradually converges towards the 21st century. For instance, the
value of ICT capital stock is estimated to reach about 28 billion yuan in 2004 at δ =
0.30; 31 billion yuan at δ = 0.25; 35 billion yuan at δ = 0.20; 40 billion yuan at δ = 0.15;
and 46 billion yuan at δ = 0.10.
125

126
An alternative set of ICT investment and capital stock series is also derived
using the ICT hedonic price index reported by the Bureau of Economic Analysis (BEA),
as no data is available for an ICT price index in Chinese statistical sources (Table A5.4
of the appendix to this chapter).10 The hedonic price index for ICT is used in US and
Japanese statistical sources (Shinjo and Zhang, 2003). The use of US hedonic price
index for ICT as an appropriate proxy measure of price changes of ICT assets in other
countries is supported by Timmer and van Ark (2005). As the ICT hedonic price index
uses 2000 as the base year, all other variables, i.e. GDP and non-ICT investment are
deflated by the consumer price index and fixed asset investment price index respectively
converted to the same base year (Table A5.5 of the appendix to this chapter). In this
case, since investment at the initial years was deflated by a higher price index,
considerably lower initial values of ICT capital stock in 1983 are obtained, i.e. 9, 12 and
22 million yuan respectively, according to the three approaches. Whichever set of ICT
database is more appropriate for the empirical exercises of the dissertation will be
determined in the following chapter which examines the contribution of factor inputs
(including ICT) on output growth.
5.5 Conclusion
China’s ICT capital stock intensity (i.e. capital-output ratio) today is comparatively
much lower than OECD countries. The size of China’s ICT capital stock remains
miniscule – less than 1% of the total capital stock.11 Nevertheless, its increasing ratio to
total capital stock as well as GDP reflects the role of ICT becoming a significant driver
of growth in China’s new economy. China has experienced a dramatic transformation as
far as the accumulation of ICT capital is concerned. From being a nation that relied
primarily on technology transfer and import from technologically advanced countries
since the founding of the PRC, China is now building up ICT capital through attracting
FDI by investing in high-tech infrastructure as well as cultivating homegrown
innovative enterprises.
10 Bureau of Economic Analysis (BEA), “National Economic Accounts”, in
http://bea.gov/bea/dn/nipaweb/index.asp. 11 By comparison, the ratio of ICT capital to total capital stock is much higher in Japan, ranging from 10% to 25% in several industries (Miyagawa et al., 2004).

0
5000
10000
15000
20000
25000
30000
35000
40000
Mill
ion
yuan
1983 1984 1985 1986 1987 1988 1989 1990 1991 1992 1993 1994 1995 1996 1997 1998 1999 2000 2001 2002 2003 2004
Figure 5.5 ICT capital stock in China, 1983-2004
Initial value approach Backcasting approach Integral approach
Source: Estimates of this study.
127

Figure 5.6 Ratio of ICT capital stock to total capital stock and output in China, 1983-2004
0
0.2
0.4
0.6
0.8
1
1.2
1983 1984 1985 1986 1987 1988 1989 1990 1991 1992 1993 1994 1995 1996 1997 1998 1999 2000 2001 2002 2003 2004
%
ICT-total capital ICT-GDP
Source: Estimates of this study.
128

Figure 5.7 Growth rate of ICT capital stock and real GDP in China, 1993-2004
0
10
20
30
40
50
60
1993 1994 1995 1996 1997 1998 1999 2000 2001 2002 2003 2004
%
ICT GDP
129
Source: Estimates of this study.
This chapter provides the basis for subsequent empirical exercises by estimating
the value of ICT capital stock in China. Using the perpetual inventory method, the ICT
capital stock is derived from deflating the ICT investment figures with the fixed assets
investment price index and using an arbitrary depreciation rate for ICT capital
determined from the literature reviewed, based on three distinct approaches. The initial
values of China’s ICT capital stock – set at 1983, are estimated to be 887, 734 and 984
billion yuan respectively. Some limitations of this exercise lie in the lack of official data
on the price index of ICT capital and other characteristics that determine the
depreciation rate of ICT equipment, such as the unit price of ICT goods and service life
of assets. However, the robustness of the exercise here is proven from the fact that ICT
capital stock converges to similar values using different approaches with different initial
values.
130

APPENDIX TO CHAPTER 5 Table A5.1 Real ICT investment in China, 1984-2004 (using CPI) Year Telecommunications Computer Total1984 1985 1986 1987 1988 1989 1990 1991 1992 1993 1994 1995 1996 1997 1998 1999 2000 2001 2002 2003 2004
122.86130.39102.05100.5057.4613.1710.878.60
712.30523.87615.46
1441.082227.73956.76
2591.672813.163053.506230.774303.184503.224611.79
97.95 104.88 85.75 26.46 56.70 20.38 12.34 8.00
215.22 723.52 356.23 495.64 475.76 983.92 761.67
2199.11 1443.46 2378.57 3605.26 5880.36 6596.04
220.81235.27187.81129.96114.1533.5523.2116.60
927.521247.40971.69
1936.722703.491940.694353.335012.274496.978609.347908.44
10383.5811207.83
Unit: million yuan.
131

Table A5.2 ICT capital stock series in China, 1983-2004 (using CPI)
Rates of depreciation Year 0.10 0.15 0.20 0.25 0.30 Initial value approach 1983 1984 1985 1986 1987 1988 1989 1990 1991 1992 1993 1994 1995 1996 1997 1998 1999 2000 2001 2002 2003 2004
886.80 1018.93 1152.31 1224.89 1232.35 1223.27 1134.50 1004.26
956.43 1788.31 2856.88 3542.88 5125.31 7316.27 8525.33
12026.13 15835.79 18749.18 25483.60 30843.68 38142.90 45536.43
886.80 974.59
1063.68 1091.93 1058.10 1013.54
895.06 784.01 683.01
1508.08 2529.26 3121.56 4590.04 6605.03 7554.97
10775.05 14171.07 16542.37 22670.36 27178.25 33485.09 39670.15
886.80 930.25 979.48 971.39 907.06 839.81 705.40 587.53 486.62
1316.82 2300.85 2812.37 4186.61 6052.79 6782.92 9779.67
12836.00 14765.77 20421.96 24246.01 29780.39 35032.14
886.80 885.91 899.71 862.59 776.90 696.83 556.17 440.34 346.86
1187.66 2138.14 2575.29 3868.19 5604.64 6144.16 8961.46
11733.36 13296.99 18582.08 21845.00 26767.34 31283.33
886.80 841.57 824.37 764.87 665.36 579.91 439.49 330.85 248.20
1101.26 2018.28 2384.48 3605.86 5227.59 5600.00 8273.34
10803.60 12059.49 17050.98 19844.13 24274.48 28199.96
Backcasting approach 1983 1984 1985 1986 1987 1988 1989 1990 1991 1992 1993 1994 1995 1996 1997 1998 1999 2000 2001 2002 2003 2004
734.42 881.80
1028.89 1113.81 1132.38 1133.30 1053.52
971.38 890.84
1729.28 2803.75 3495.06 5082.27 7277.54 8490.47
11994.76 15807.55 18723.76 25460.73 30823.10 38124.37 45519.76
734.42 845.07 953.59 998.35 978.56 945.93 837.59 735.16 641.49
1472.79 2499.26 3096.06 4568.37 6586.61 7539.31
10761.74 14159.75 16532.76 22662.18 27171.30 33479.19 39665.13
734.42 808.35 881.95 893.37 844.65 789.88 665.45 555.57 461.06
1296.37 2284.49 2799.28 4176.14 6044.41 6776.21 9774.30
12831.71 14762.34 20419.21 24243.81 29778.63 35030.73
734.42 771.63 814.00 798.30 728.68 660.67 529.05 420.00 331.60
1176.22 2129.56 2568.86 3863.36 5601.02 6141.45 8959.42
11731.84 13295.84 18581.22 21844.36 26766.85 31282.97
734.42 734.91 749.71 712.60 628.78 554.30 421.56 318.31 239.41
1095.11 2013.97 2381.47 3603.75 5226.12 5598.97 8272.61
10803.10 12059.14 17050.74 19843.96 24274.35 28199.87
132

Integral approach 1983 1984 1985 1986 1987 1988 1989 1990 1991 1992 1993 1994 1995 1996 1997 1998 1999 2000 2001 2002 2003 2004
984.47 1106.84 1231.42 1296.09 1296.43 1280.95 1186.40 1090.98
998.48 1826.15 2890.93 3573.53 5152.89 7341.10 8547.67
12046.24 15853.89 18765.46 25498.26 30856.88 38154.77 45547.12
984.47 1057.61 1134.24 1151.91 1109.08 1056.87
931.89 815.32 709.62
1530.70 2548.49 3137.91 4603.94 6616.84 7565.00
10783.59 14178.32 16548.54 22675.60 27182.70 33488.88 39673.37
984.47 1008.39 1041.98 1021.39
947.07 871.81 731.00 608.01 503.01
1329.93 2311.34 2820.76 4193.32 6058.15 6787.21 9783.10
12838.75 14767.97 20423.71 24247.41 29781.52 35033.04
984.47 959.17 954.65 903.79 807.80 720.00 573.55 453.38 356.63
1195.00 2143.64 2579.42 3871.28 5606.96 6145.91 8962.76
11734.34 13297.72 18582.63 21845.42 26767.65 31283.56
984.47 909.94 872.23 798.37 688.81 596.32 450.98 338.90 253.83
1105.20 2021.04 2386.41 3607.21 5228.54 5600.67 8273.80
10803.93 12059.72 17051.14 19844.24 24274.55 28200.01
Unit: million yuan.
133

Table A5.3 Real ICT investment in China, 1984-2004 (using hedonic price indices)
Telecommunications Computer Total
1984 1985 1986 1987 1988 1989 1990 1991 1992 1993 1994 1995 1996 1997 1998 1999 2000 2001 2002 2003 2004
2.803.713.584.413.280.960.930.92
105.13119.52177.56552.34
1239.26746.54
2811.934151.445536.00
14372.6212302.5115544.4418298.39
2.23 2.98 3.01 1.29 3.23 1.49 1.06 0.85
31.77 165.07 102.77 189.97 264.66 767.73
1911.39 3245.27 2617.00 5486.69
10307.21 20298.15 26171.37
5.036.696.585.706.512.452.001.77
136.90284.59280.33742.31
1503.921514.274723.337396.718153.00
19859.3222609.7235842.5944469.76
Unit: million yuan.
134

Table A5.4 Alternative ICT capital stock series in China, 1983-2004 Rates of depreciation Year 0.10 0.15 0.20 0.25 0.30 Initial value approach 1983 1984 1985 1986 1987 1988 1989 1990 1991 1992 1993 1994 1995 1996 1997 1998 1999 2000 2001 2002 2003 2004
9.08 13.21 18.58 23.30 26.68 30.52 29.92 28.92 27.80
161.91 430.31 667.62
1343.17 2712.77 3955.77 8283.52
14851.87 21519.69 39227.03 57914.05 87965.24
123638.50
9.08 12.75 17.53 21.49 23.97 26.88 25.30 23.50 21.74
155.38 416.66 634.50
1281.64 2593.31 3718.59 7884.13
14098.22 20136.48 36975.33 54038.74 81775.53
113979.00
9.08 12.30 16.53 19.81 21.55 23.75 21.45 19.16 17.09
150.57 405.05 604.37
1225.81 2484.57 3501.93 7524.87
13416.60 18886.28 34968.34 50584.39 76310.11
105517.80
9.08 11.84 15.58 18.27 19.40 21.06 18.25 15.68 13.53
147.04 394.87 576.49
1174.68 2384.93 3302.97 7200.56
12797.12 17750.84 33172.45 47489.05 71459.38 98064.30
9.08 11.39 14.67 16.85 17.50 18.76 15.58 12.90 10.80
144.46 385.71 550.33
1127.55 2293.20 3119.52 6906.99
12231.60 16715.12 31559.90 44701.65 67133.75 91463.38
Backcasting approach 1983 1984 1985 1986 1987 1988 1989 1990 1991 1992 1993 1994 1995 1996 1997 1998 1999 2000 2001 2002 2003 2004
12.10 15.93 21.03 25.51 28.66 32.30 31.52 30.37 29.10
163.08 431.37 668.56
1344.02 2713.54 3956.46 8284.14
14852.43 21520.19 39227.49 57914.46 87965.60
123638.80
12.10 15.32 19.71 23.34 25.55 28.22 26.44 24.47 22.57
156.08 417.26 635.00
1282.07 2593.68 3718.90 7884.39
14098.44 20136.67 36975.49 54038.88 81775.64
113979.10
12.10 14.72 18.46 21.36 22.79 24.74 22.24 19.79 17.60
150.98 405.37 604.63
1226.02 2484.74 3502.06 7524.98
13416.69 18886.35 34968.40 50584.44 76310.14
105517.90
12.10 14.11 17.28 19.54 20.36 21.78 18.78 16.08 13.83
147.27 395.04 576.62
1174.78 2385.00 3303.03 7200.60
12797.15 17750.87 33172.47 47489.07 71459.39 98064.30
12.10 13.51 16.15 17.89 18.23 19.27 15.94 13.15 10.97
144.58 385.79 550.39
1127.59 2293.23 3119.54 6907.00
12231.61 16715.13 31559.90 44701.65 67133.75 91463.38
135
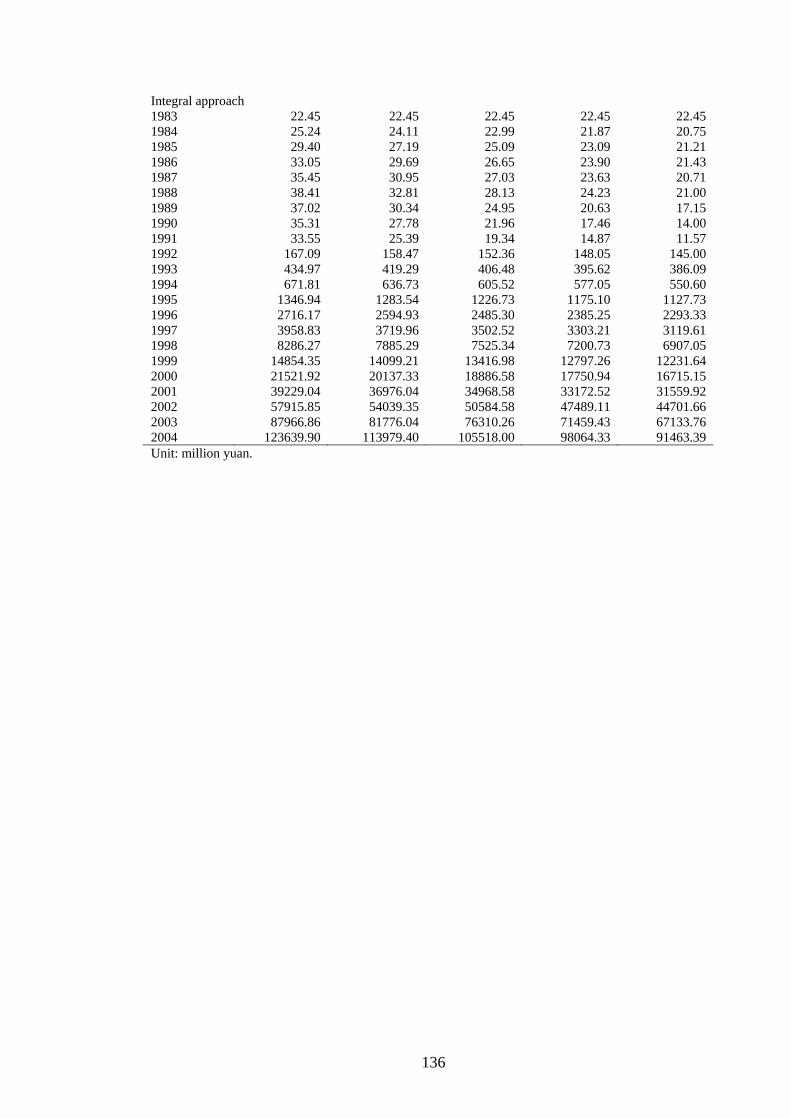
Integral approach 1983 1984 1985 1986 1987 1988 1989 1990 1991 1992 1993 1994 1995 1996 1997 1998 1999 2000 2001 2002 2003 2004
22.45 25.24 29.40 33.05 35.45 38.41 37.02 35.31 33.55
167.09 434.97 671.81
1346.94 2716.17 3958.83 8286.27
14854.35 21521.92 39229.04 57915.85 87966.86
123639.90
22.45 24.11 27.19 29.69 30.95 32.81 30.34 27.78 25.39
158.47 419.29 636.73
1283.54 2594.93 3719.96 7885.29
14099.21 20137.33 36976.04 54039.35 81776.04
113979.40
22.45 22.99 25.09 26.65 27.03 28.13 24.95 21.96 19.34
152.36 406.48 605.52
1226.73 2485.30 3502.52 7525.34
13416.98 18886.58 34968.58 50584.58 76310.26
105518.00
22.45 21.87 23.09 23.90 23.63 24.23 20.63 17.46 14.87
148.05 395.62 577.05
1175.10 2385.25 3303.21 7200.73
12797.26 17750.94 33172.52 47489.11 71459.43 98064.33
22.45 20.75 21.21 21.43 20.71 21.00 17.15 14.00 11.57
145.00 386.09 550.60
1127.73 2293.33 3119.61 6907.05
12231.64 16715.15 31559.92 44701.66 67133.76 91463.39
Unit: million yuan.
136

Table A5.5 Price deflators Year Consumer price
index (2000=1) Fixed asset investment price index (2000=1)
ICT hedonic price index (2000=1)
1983 1984 1985 1986 1987 1988 1989 1990 1991 1992 1993 1994 1995 1996 1997 1998 1999 2000 2001 2002 2003 2004
0.265 0.270 0.277 0.303 0.323 0.346 0.412 0.486 0.501 0.518 0.551 0.632 0.784 0.918 0.994 1.022 1.014 1.000 1.004 1.011 1.003 1.015
0.306 0.284 0.298 0.314 0.339 0.407 0.484 0.497 0.552 0.636 0.805 0.889 0.941 0.978 0.995 0.993 0.989 1.000 1.004 1.006 1.028 1.085
27.884 22.603 19.021 16.255 14.011 12.945 12.006 10.485 9.387 7.812 6.395 5.584 4.451 3.189 2.312 1.659 1.215 1.000 0.789 0.638 0.540 0.496
137

Chapter 6
ICT AND ECONOMIC GROWTH: A NATIONWIDE STUDY
6.1 Introduction
The previous chapters of the dissertation have provided a review of debates and
empirical studies pertaining to the relationship between information and
communications technology (ICT) and economic growth. Various studies have shown
ICT to be instrumental in propelling productivity and economic growth in the developed
countries. This chapter will add to the literature by focusing on China. It examines the
relationship between ICT and China’s economic growth using the estimates of ICT
capital stock series obtained in Chapter 5. Given China’s current stage of economic
development, it will be interesting to find out how this country is similar to or different
from the advanced economies with regard to the contribution of ICT to economic
growth.
This chapter comprises three main parts. First, it provides a preliminary analysis
of the relationship between ICT and China’s productivity growth, based on data
obtained from Chinese statistical sources. Second, the chapter attempts to specify an
appropriate model drawn from the literature to analyze the contribution of ICT and
other factor inputs to economic growth in China. Finally, the chapter will test the
robustness of the model by comparing empirical results based on different estimations
of the ICT capital stock. Conclusions will then be drawn about the role of ICT in
China’s economic growth over the past decades.
6.2 ICT, productivity and the Chinese economy
Current discussions on China’s economic development tend to focus on its transition
from an agriculture-based to an industrial economy that relies more on the
manufacturing sector. An ‘information economy’ or a ‘knowledge economy’ is
normally associated with the tertiary or service sector which relies heavily on the use of
communications and computer services. As the tertiary sector has not attained a
significant share of total output, there is a debate over whether it is too early to even
discuss the relevance of the information or knowledge economy to China (Lan and
Sheehan, 2002).
138
139
However, the share of tertiary industry output over total output in China has
been gradually increasing since the beginning of economic reform. The tertiary sector
has maintained a share of more than 30% of real GDP since the late 1980s, peaking at
42% in 2002 before dropping to about 40% in 2005 (Figure 6.1). The share of China’s
primary industry, on the other hand, has declined from less than 20% since 1997 to
about 12% in 2005, while the secondary industry (comprising mainly manufacturing
and construction) made up about 47% of the GDP in 2005.1 At the same time, China’s
economy is increasingly spurred on through development in the ICT sector. As China is
now the world’s largest telecommunications (fixed line and mobile phone) market, and
achieving rapid growth in its computer industry as well (see Chapter 2 for an overview
of its development history), the implications of the growth in ICT for the rise of the
service sector in the Chinese economy cannot be ignored.
Figure 6.2 illustrates the trend of labour productivity growth in China from the
beginning of reform in 1979 till the most recent year, 2005. Labour productivity
(measured as GDP per worker) declined in 1989 and 1990 when economic sanction was
imposed by US and other Western countries following the occurrence of the Tiananmen
incident in June 1989. However, it did not last long, as labour productivity shot up
almost immediately soon after, reaching its peak growth rate of 14% in 1992, the year
that Deng Xiaoping went on his southern tour which sparked off an investment boom.
From then on, Chinese labour productivity has been rising steadily into the 21st century,
achieving a peak growth rate of 11.5% in 2004. While there has been much discussion
in the literature (as examined in Chapters 3 and 4) of a productivity revival in the US
and other developed countries after 1995, in China the breaking point appears to be
2000, after which labour productivity has been growing annually at more than 9%
(Table 6.1). This point can be reinforced when this chapter examines the growth rate of
TFP during that period in a later section.
1 China Statistical Abstract 2006, pp. 20-21.

Figure 6.1 China's tertiary output, 1978-2005 (in 1978 constant prices)
0
200
400
600
800
1000
1200
1400
1600
1800
1978 1980 1982 1984 1986 1988 1990 1992 1994 1996 1998 2000 2002 2004
Bill
ion
yuan
0
5
10
15
20
25
30
35
40
45
%
Tertiary output % of GDP
Source: State Statistical Bureau, China Statistical Yearbook 2005; China Statistical Abstract 2006.
140

Figure 6.2 Labour productivity in China, 1978-2005
0
1000
2000
3000
4000
5000
6000
1978 1979 1980 1981 1982 1983 1984 1985 1986 1987 1988 1989 1990 1991 1992 1993 1994 1995 1996 1997 1998 1999 2000 2001 2002 2003 2004 2005
Yua
n pe
r wor
ker
-15
-10
-5
0
5
10
15
20
%
Labour productivity Growth rate
Source: State Statistical Bureau, China Statistical Yearbook 2005; China Statistical Abstract 2006.
141
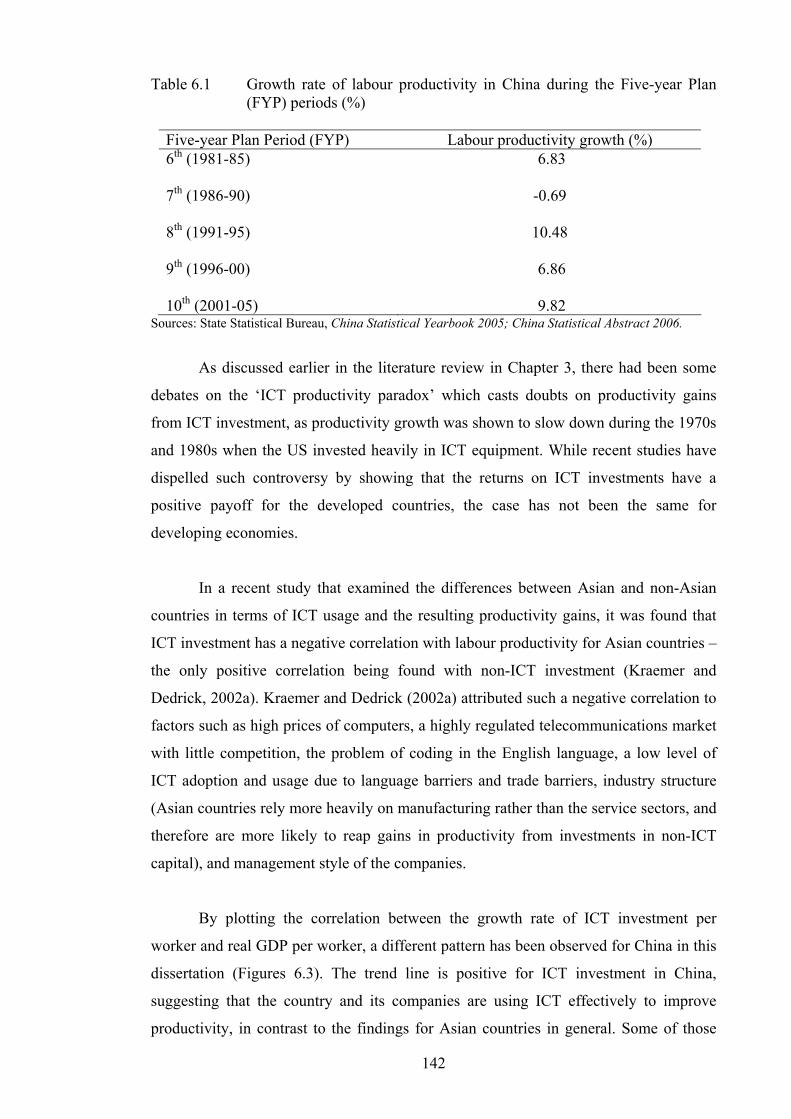
Table 6.1 Growth rate of labour productivity in China during the Five-year Plan (FYP) periods (%)
Five-year Plan Period (FYP) Labour productivity growth (%) 6th (1981-85) 7th (1986-90) 8th (1991-95) 9th (1996-00) 10th (2001-05)
6.83
-0.69
10.48
6.86
9.82 Sources: State Statistical Bureau, China Statistical Yearbook 2005; China Statistical Abstract 2006.
As discussed earlier in the literature review in Chapter 3, there had been some
debates on the ‘ICT productivity paradox’ which casts doubts on productivity gains
from ICT investment, as productivity growth was shown to slow down during the 1970s
and 1980s when the US invested heavily in ICT equipment. While recent studies have
dispelled such controversy by showing that the returns on ICT investments have a
positive payoff for the developed countries, the case has not been the same for
developing economies.
In a recent study that examined the differences between Asian and non-Asian
countries in terms of ICT usage and the resulting productivity gains, it was found that
ICT investment has a negative correlation with labour productivity for Asian countries –
the only positive correlation being found with non-ICT investment (Kraemer and
Dedrick, 2002a). Kraemer and Dedrick (2002a) attributed such a negative correlation to
factors such as high prices of computers, a highly regulated telecommunications market
with little competition, the problem of coding in the English language, a low level of
ICT adoption and usage due to language barriers and trade barriers, industry structure
(Asian countries rely more heavily on manufacturing rather than the service sectors, and
therefore are more likely to reap gains in productivity from investments in non-ICT
capital), and management style of the companies.
By plotting the correlation between the growth rate of ICT investment per
worker and real GDP per worker, a different pattern has been observed for China in this
dissertation (Figures 6.3). The trend line is positive for ICT investment in China,
suggesting that the country and its companies are using ICT effectively to improve
productivity, in contrast to the findings for Asian countries in general. Some of those
142
143
factors mentioned above that account for the negative correlation in Asian countries are
no longer applicable to China, especially since the 1990s. The rapid expansion of the
telecom and computer markets in China, which is followed by the drop in prices of ICT
equipment, has benefited residential as well as industrial users of ICT. This was evident
in the telecommunications market when the break-up of monopoly since 1993 and
bureaucratic reform during the late 1990s initiated pricing competition between
different telecommunications service providers. Furthermore, as discussed earlier, the
tertiary or service sectors have become more important contributors to the national
output, thus fuelling greater demand for ICT services, such as the broadband and
wireless Internet access, mobile telephony and other channels of communications.
However, as the manufacturing sector still occupies a major share of GDP, we expect
the payoff from investments in non-ICT capital such as factory plant and equipment to
be positive as well.
Another way of examining the role of ICT in the national economy is to
compare the size and growth rate of ICT capital stock relative to the total capital stock.
The share of ICT out of the total capital stock in China still miniscule – still slightly less
than 1% in 2004 (Figure 5.5 in Chapter 5), yet the former has grown at a faster rate than
the latter. For instance, ICT capital grew by about 22% on average annually from 2000
to 2004, which was almost double the growth rate of total capital stock at 12%. The
growth rate of China’s ICT capital stock is comparable to that of OECD countries,
which grew between 15% and 35% in 1999 (OECD, 2001). As shown in Figure 5.6 of
Chapter 5, the rapid rise in the share of ICT capital out of GDP – almost 3% in 2004 –
highlights its role as an increasingly significant driver of growth in China’s new
economy.
This section has shown the pace at which ICT has grown in importance relative
to the entire Chinese economy. In the next section, the dissertation shall seek to find the
empirical evidence, by measuring the contribution of ICT capital to output growth in
China, in comparison with those from other factor inputs. This would round up the
whole picture about the relationship between ICT and China’s economic growth.

Figure 6.3 ICT investment per worker and labour productivity in China, 1985-2004
y = 0.1538x + 9.1232R2 = 0.7443
8.4
8.6
8.8
9
9.2
9.4
9.6
9.8
10
10.2
-4 -3 -2 -1 0 1 2 3 4
Log (ICT per worker)
Log
(GD
P pe
r wor
ker)
GDP per worker Linear (GDP per worker)
144
Source: Figures 5.1 and 6.2 in this study.
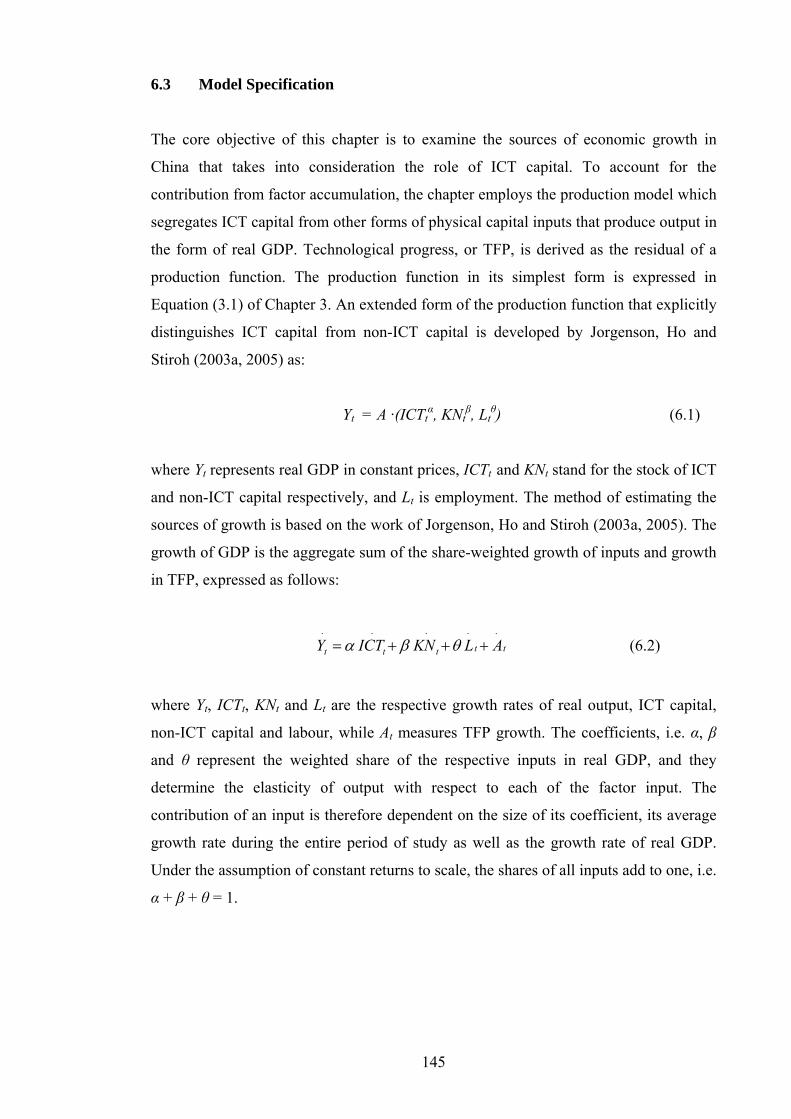
6.3 Model Specification
The core objective of this chapter is to examine the sources of economic growth in
China that takes into consideration the role of ICT capital. To account for the
contribution from factor accumulation, the chapter employs the production model which
segregates ICT capital from other forms of physical capital inputs that produce output in
the form of real GDP. Technological progress, or TFP, is derived as the residual of a
production function. The production function in its simplest form is expressed in
Equation (3.1) of Chapter 3. An extended form of the production function that explicitly
distinguishes ICT capital from non-ICT capital is developed by Jorgenson, Ho and
Stiroh (2003a, 2005) as:
Yt = A ·(ICTtα, KNt
β, Ltθ) (6.1)
where Yt represents real GDP in constant prices, ICTt and KNt stand for the stock of ICT
and non-ICT capital respectively, and Lt is employment. The method of estimating the
sources of growth is based on the work of Jorgenson, Ho and Stiroh (2003a, 2005). The
growth of GDP is the aggregate sum of the share-weighted growth of inputs and growth
in TFP, expressed as follows:
(6.2) ttttt ALKNICTY⋅⋅⋅⋅⋅
+++= θβα
where Yt, ICTt, KNt and Lt are the respective growth rates of real output, ICT capital,
non-ICT capital and labour, while At measures TFP growth. The coefficients, i.e. α, β
and θ represent the weighted share of the respective inputs in real GDP, and they
determine the elasticity of output with respect to each of the factor input. The
contribution of an input is therefore dependent on the size of its coefficient, its average
growth rate during the entire period of study as well as the growth rate of real GDP.
Under the assumption of constant returns to scale, the shares of all inputs add to one, i.e.
α + β + θ = 1.
145

6.4 Description of Data
The variables in the model are defined as follows:
Yt = real GDP
ICTt = real value of ICT capital stock
KNt = real value of non-ICT capital stock
Lt = total employment
Real GDP data is derived from nominal GDP deflated by the constant price index. GDP,
consumer price index and total employment is obtained from China Statistical Abstract
2006, for which the period of 1978-2005 is available. As for the variable representing
labour, unlike those of the US and Australian sources, data on the number of hours
worked is not available in Chinese statistical sources. The dissertation chooses
employment as the proxy variable for labour, after some trial and error with various
proxies.2
ICT and non-ICT capital stock
ICT capital stock is estimated in Chapter 5 and available for the period 1983-2004.
Non-ICT capital stock is derived from investment in non-ICT capital, which is
estimated by first taking the difference between total fixed asset investment and
investment in the ICT sector. The real value of non-ICT capital stock is then derived
using the same perpetual inventory method. Data for total fixed asset investment is
available from 1980 to 2004. As explained in Chapter 5, the ICT capital stock series is
based on an assumed depreciation of 15% over the period 1983-2004, with the initial
value in 1983 determined by the three approaches of estimation, i.e. initial value,
backcasting and integral approach.
Figures for ICT and non-ICT capital investment are deflated by the fixed asset
investment price index, which are obtained from China Statistical Abstract 2006. As
for the choice of the capital depreciation rate, δ, it is assumed that ICT equipment turns
obsolete faster than other forms of capital. Thus, for non-ICT capital stock, the
dissertation adopts a depreciation rate of 4% for the period from beginning of reform till 2 I have tried using other data such as number of staff and workers, as well as labour compensation as proxies for labour input, both of which did not work well in the regressions. Labour compensation, as defined in China Statistical Yearbook, includes ‘wages, bonuses and allowances the labourers earn in monetary form and in kind, as well as the free medical services and expenses provided to the labourers, traffic subsidies, social insurance and housing fund paid by employers’.
146

1992, and 5% for the period from 1993 onwards, which were used by Islam and Dai
(2005).3
6.5 Estimation Results and Interpretation
6.5.1 Estimation results
To examine the role of ICT in Chinese economic growth, the first step is to measure the
contribution of ICT to economic growth in China. This is accomplished by a regression
of output (real GDP) against factor accumulation, expressed in the following equation:
lnYt = β0 + β1lnICTt + β2lnKNt + β3lnLt + ui (6.3)
where total GDP in constant prices, Yt, is a function of ICT capital, non-ICT capital and
labour, represented by ICTt, KNt and Lt respectively. However, the chapter will also
apply the translog production function which is an unrestricted form of the production
function, expressed as follows:
lnYit = β0 + β1lnICTt + β2lnKNt + β3lnLt + γ1(lnICTt) 2 + γ2 (lnKNt) 2 + γ3 (lnLt) 2 +
η1 (lnICTt lnKNt) + η2 (lnICTt lnLt) + η3 (lnKNt lnLt) + ut (6.4)
where β, γ and η are the parameters to be estimated. A test of linear restriction on the
translog function is carried out using the Wald test in the MicroFit programme, based
on the null hypothesis of H0: γ1 = γ2 = γ3 = η1 = η2 = η3 = 0. The test statistic of χ2(6) =
0.0026 is obtained, and therefore the model specified by the Cobb-Douglas function
cannot be rejected at all levels of significance. The sample has 22 observations for the
period of 1983-2004. The initial estimates of the parameters in Equation (6.3) are
presented in Table 6.2. All regressions in this chapter are run using MicroFit 4.0.
All coefficients of the parameters have the correct sign at different levels of
significance. ICT and non-ICT capital are statistically significant at the 1% level, but
labour at the 10% level. The results show that the growths of ICT capital as well as
physical capital are positively related to China’s economic growth from the mid-1980s
3 In another study, the depreciation rate of China’s capital stock for the period of 1990 to 2000 is assumed to be 5% (Qian and Smyth, 2006).
147

till the beginning of the 21st century. The 2R is shown to be very high, at 0.99. This is
not unusual as empirical results for other countries have proven to be similar.4
Table 6.2 Regression results of China’s sources of economic growth, 1983-2004 Explanatory variables Model specification Initial value Backcasting Integral Intercept lnICT lnKN lnL R2
Adjusted R2
Standard Error Observations Durbin-Watson statistic
-4.5390 (-8.330)*** 0.1180 (4.652)*** 0.5256 (5.635)*** 0.3850 (1.722)* 0.9955 0.9947 0.0411 22 0.9371
-4.2741 (-7.802)*** 0.1210 (4.856)*** 0.5146 (5.612)*** 0.3675 (1.717)* 0.9957 0.9950 0.0402 22 0.9574
-4.6831 (-8.593)*** 0.1164 (4.541)*** 0.5314 (5.641)*** 0.3946 (1.721)* 0.9954 0.9946 0.0416 22 0.9259
Note: Figures in parentheses are the t-ratios. *, ** and *** indicate significance at 10%; 5% and1%.
Based on Durbin’s d statistic obtained from the three estimations, with the
values ranging from 0.9259 (integral approach) to 0.9574 (backcasting approach), there
is no conclusive evidence of the presence of positive first-order serial correlation as
these values lie between dL = 0.831 and dU = 1.407. Therefore, another test, the
Breusch-Godfrey (BG) test is conducted using EView 5.0. The test statistic of χ2(1) =
4.2468 (with p-value of 0.039) is obtained, suggesting that the null hypothesis of no
serial correlation is rejected at 5%, but not rejected at 1% level of significance. A
sensitivity test (to be discussed in section 6.5.4) reveals that a higher d statistic is
obtained at a higher depreciation rate of ICT capital.
As for non-ICT capital stock, this chapter has also attempted to estimate a series
using the backcasting and integral approach. However, the regression results based on
these estimations resulted in the labour variable being statistically insignificant at all
levels, and therefore the non-ICT capital stock series estimated from the initial value
approach is used in the dissertation.5
6.5.2 Decomposition of output growth
Using the estimates shown in Table 6.2, the sources of economic growth can be derived.
The backcasting approach is chosen for computation as it has the largest t-ratio for ICT
4 For instance, in a study of 69 countries all over the world, 48 have a 2R of 0.99 or higher (Dadkhah and Zahedi, 1990). Similarly, Diewert and Lawrence (2005) obtained an R2 of 0.9986 for the Australian production function. 5 Note that tests for unit root and stationarity are not considered in this exercise due to the fact that the results are potentially sensitive to the small sample size which is a limitation of this study. Owing to the limited number of observations, unit root tests would be unreliable with small sample sizes.
148

capital and the smallest standard error of the regression among the three estimations.
The contributions of the factor accumulations and technical change (or technological
progress) to real output growth in China for the period of 1983-2004 are shown in Table
6.3, based on the assumed depreciation rate of 15% for ICT capital. The results differ
from those of previous studies carried out by the IMF. For example, Lee and Khatri
(2003) show the contribution from ICT capital and TFP in China to be 3% and 43%
respectively during the 1990s, while in Wang and Yao (2003), TFP contributed 25% to
economic growth. Total capital accumulation (ICT and non-ICT capital) contributes to
half of economic growth. In another study that included human capital as a factor input,
TFP and human capital contributed to 22% and 13% of total GDP growth respectively
(Qian and Smyth, 2006).
Table 6.3 Contributions to output growth in China, 1983-2004 (unit: %)
Period
1983-2004 1983-1991 1992-2000 2001-2004
ICT Capital Other Capital Labour TFP Output
2.30 (25.1) 5.51 (60.1) 0.84 (9.2) 0.52 (5.6) 9.17 (100.0)
-0.21 (-2.5) 5.58 (69.3) 1.58 (19.6) 1.10 (13.6) 8.05 (100.0)
4.37 (46.1) 5.23 (55.1) 0.39 (4.1) -0.51 (-5.3) 9.49 (100.0)
2.65 (24.7) 6.01 (56.1) 0.39 (3.6) 1.66 (15.5) 10.70 (100.0)
Note: Figures in parentheses are the weights of each factor growth.
In this study, the contributions from ICT and non-ICT capital sum up to more
than 80% of total output growth in China. It also finds that the contribution from ICT
capital to growth has fluctuated substantially between the 1980s and the recent years,
whereas that from TFP ranges between negative and positive values during the same
period. Finally, Table 6.3 also shows remarkably contrasting results at different periods
during the 1980s and 1990s. During the 1980s, the contribution from ICT to economic
growth was a negative 2.5%, but the share increased to over 45% in the 1990s. Such a
huge jump in the share of contribution to growth is explained by the sharp increase and
the high growth rate of ICT investment during the early 1990s. During the first three
years of the 21st century, ICT capital contributed about 25% to economic growth. The
149
low share of TFP contribution to economic growth may be attributed to an extremely
low share of the ICT-producing industry in GDP, a result that is similar to that found in
Europe by Timmer and van Ark (2005).
It can be noted that the contribution rates of this finding are different from those
of other studies that analyse the contribution of ICT to Chinese economic growth,
namely, Lee and Khatri (2003) and Jorgenson and Vu (2005). Lee and Khatri (2003)
measure the contribution of ICT capital stock to the growth of GDP and labour
productivity in key Asian economies for the period 1990-1999, while Jorgenson and Vu
(2005) address the impact of ICT investment on the growth of world economy, seven
regions and 14 major economies during the period 1989-2003. This dissertation finds
the contribution from ICT capital to be considerably higher, and conversely, that from
labour to be much lower compared to the findings of other authors. For instance, the
contribution from labour has declined from 20% in the 1980s to about 3% in the most
recent years. The contribution from non-ICT capital has also declined from 70% during
1983-91 to 56% in 2001-04. The only findings in this chapter that are close to those of
the other authors are the contribution rates from non-ICT capital and TFP during the
years 2001-2004.
It may also be observed that this chapter has found a much lower proportion of
ICT capital to real GDP – less than 1% during the 1990s (refer to Chapter 5), compared
to 2% found in Lee and Khatri (2003). However, it should be noted that the latter
measured the ratio of ICT capital stock to nonfarm business GDP, whereas this
dissertation looks at the ratio to total GDP in China. As for non-ICT capital stock, the
proportion out of GDP found in this chapter is comparatively higher – 530% in this
chapter vs 172% in Lee and Khatri (2003) for the period of 1992-99. This could be
attributed to the fact that the non-ICT capital used in this dissertation is derived from
investment figures deflated by the fixed asset investment price index, instead of the
consumer price index, thus resulting in relatively higher values.
Another difference stems from the definition of ICT investment or spending. Lee
and Khatri (2003) used data on total ICT spending which comprises a wide range of
components such as spending on hardware, software, IT services (including IT
consulting, operations management, IT training and education, processing and IT
support), internal ICT spending (covering IT operating budget, internally customized
150

software, and other expenses related to IT ‘that cannot be tied to a vendor’), and other
office equipment and telecommunication.6 However, this dissertation uses only data on
investment in communications equipment, computer hardware and software. What can
be concluded is the surge in ICT production has been a major contributor to TFP growth
since the late 1990s.
In another study, Jorgenson and Vu (2005) used the same but a more recent
source of data as that of Lee and Khatri (2003). Although Jorgenson and Vu found the
contribution of ICT to economic growth in China to be considerably low compared to
that of this chapter – 9% for 1995-2003 vs 25% for 2001-2004, the authors attribute the
increase in its contribution rate over the last ten years to the surge in ICT investment
and software, especially after 1995, a conclusion supported by the dissertation. In
addition, Jorgenson and Vu (2005) further remarked that the next most important
increase in the investment in ICT equipment and software after the G7 economies was
in developing Asia, led by China. Thus there is a general consensus that the rising ICT
investment will lead to further increases in its contribution to China’s economic growth.
6.5.3 TFP growth in China
One of the best indicators of economic performance is total factor productivity (TFP),
which is brought about by technological progress and a more efficient management
practices. Figure 6.4 compares the total output (GDP) index with the input indices in
China, using 1984 as the base year. 7 The output and input indices illustrate the pace at
which each of the variables has grown over the past two decades. The growth rate of
TFP, illustrated in Figure 6.5, is derived from the difference between output growth and
sum of the share-weighted growth of inputs given in Equation (6.2):
∆ln At = Δln Yt – Σ{ αICT ΔlnICTt +βKNΔlnKNt + γL Δln Lt)} (6.5)
where TFP growth (ΔlnAt) is the difference between the growth of real GDP, Yt, and the
growth of factor inputs, i.e. ICT capital, non-ICT capital and labour, represented by
ICTt, KNt and Lt respectively; whereas α, β and γ are the respective weights of the three
factors.
6 Data was obtained from World Information Technology and Services Alliance (WITSA) and International Data Corporation (IDC). However, data on hardware spending was reported to be biased upwards as they include household spending. 7 Adopted from Diewert and Lawrence (2005) who estimated productivity growth for Australia.
151

152
Figure 6.4 shows that ICT capital has been growing much faster than output and
all other inputs. This could explain the difference between China and other Asian
countries, in which the latter have been reported to experience a negative correlation
between ICT and productivity growth in Kraemer and Dedrick (2002a)). As observed in
Chapters 2 and 5, China’s massive investment in ICT since 1992, made favourable by
the building of high technology industrial parks, is a major contributor to the rapid
growth of ICT capital. By contrast, TFP growth has been observed to be volatile over
the last two decades, facing spells of negative growth during the periods of 1988-91 and
1996-98. It grew at an annual rate of 0.1%, but negative growths were experienced in
1986-90 and 1995-99 (Figure 6.5). However, it can be observed that China has had a
positive and increasing trend in the growth rate of TFP since 2001.
6.5.4 Sensitivity analysis
The robustness of the estimation results can be examined with a sensitivity analysis by
assuming different rates of depreciation for the ICT capital stock. A series of
regressions and tests are run using ICT capital stock determined by depreciation rates
that vary from 10% to 30% (Table 6.4). The estimated growth rates of ICT capital stock
show a similar trend of contribution under different depreciation rates (Table 6.5). It can
be noted that the contribution from ICT capital gets lower as δ increases, whereas that
from non-ICT capital gets higher and that from labour becomes lower. This can be
explained from the fact that the estimation of non-ICT capital stock is derived from the
difference total fixed asset investment and ICT investment. Therefore, a higher
depreciation of ICT capital stock results in an increased share of non-ICT in total capital
stock, and thereby increasing its contribution to output growth. In this analysis, the
contribution from TFP to output growth is relatively unresponsive to changes in the
depreciation rate of ICT capital although it increased by a miniscule magnitude, as
shown in Table 6.5.

Figure 6.4 Output and input indexes in China, 1984-2004
0
5
10
15
20
25
30
35
40
45
50
1983 1984 1985 1986 1987 1988 1989 1990 1991 1992 1993 1994 1995 1996 1997 1998 1999 2000 2001 2002 2003 2004
Output index ICT index Non-ICT Capital index Labour index
Source: State Statistical Bureau, China Statistical Yearbook 2005; China Statistical Abstract 2006.Yearbook of China’s Electronics Industry and China Statistics Yearbook on High Technology Industry (various issues).
153

Figure 6.5 TFP growth in China, 1984-2004
-10
-8
-6
-4
-2
0
2
4
6
8
10
12
1984 1985 1986 1987 1988 1989 1990 1991 1992 1993 1994 1995 1996 1997 1998 1999 2000 2001 2002 2003 2004
%
154
Source: Estimates of this study.

As the depreciation rate of ICT capital increases, the regression results become
more robust as standard errors are reduced and the t-ratios of all variables increase.
Using the Breusch-Godfrey test, the null hypothesis of no serial correlation is rejected at
5% but not rejected at 1% level of significance when the depreciation rate, δ = 0.10,
given the test statistic, χ2(1) = 4.8926 (p-value = 0.027). However, for depreciation rates
of δ = 0.20, 0.25 and 0.30, the respective test statistics, χ2(1) = 3.6408 (p-value = 0.056),
3.0977 (p-value = 0.078) and 2.636 (p-value = 0.104) are produced, which show that the
null hypothesis of no serial correlation is rejected at 10% but not rejected at 5% level of
significance. The results of the sensitivity tests therefore suggest that China may have a
depreciation rate of ICT capital stock higher than that of developed countries such as
Japan and Korea even today. However, the regression results show that labour becomes
statistically insignificant when the assumed depreciation rate of ICT capital stock
reaches 20%. Therefore the dissertation concludes with the assumption of 15% as the
current depreciation rate of ICT capital stock in China.
Table 6.4 Sensitivity tests using various depreciation rates of ICT capital stock in China
Explanatory variables
Depreciation rates
0.10 0.20 0.25 0.30 Intercept lnICT lnKN lnL R2
Adjusted R2
Standard Error Observations d-statistic
-3.852(-6.427)*** 0.143 (4.666)*** 0.461 (4.359)*** 0.403 (1.785)* 0.9955 0.9948 0.0410 22 0.9140
-4.555 (-8.764)*** 0.104 ( 5.023)*** 0.559 ( 6.895)*** 0.327 ( 1.609) 0.9959 0.9942 0.0393 22 1.0054
-4.745 (-9.415)*** 0.091 (5.152)*** 0.595 (8.152)*** 0.286 (1.472) 0.9960 0.9953 0.0388 22 1.0561
-4.875 (-9.845)*** 0.080 (5.240)*** 0.625 (9.332)*** 0.248 (1.319) 0.9961 0.9954 0.0384 22 1.1061
Note: Figures in parenthesis ( ) are the t-ratios. *, ** and *** indicate significance at 10%; 5% and1%.
In addition, an alternative set of analysis are also produced using GDP and
capital stock. The latter is derived from investment deflated by the hedonic price index,
which showed a much lower initial value of ICT capital stock (see Table A5.4 of
Chapter 5 for the alternative capital stock series). The estimation results are presented
and discussed in the Appendix to this chapter. These findings, which are presented in
Tables A6.1-A6.3, show that the changes in contribution from ICT to output growth as δ
changes are lower than that presented in Table 6.4 earlier. The contribution from TFP to
output growth is also relatively lower – for instance, 1.6% in Table A6.3 compared with
5.6% in Table 6.4 for δ = 0.15.
155

Table 6.5 Results of sensitivity analysis
Contribution to output growth (%) Depreciation rate of ICT capital (%) ICT
KN L TFP
10 15 20 25 30
2.80 (30.5) 2.30 (25.1) 1.92 (20.9) 1.62 (17.7) 1.39 (15.2)
4.94 (53.8) 5.51 (60.1) 5.98 (65.2) 6.37 (69.5) 6.70 (73.0)
0.92 (10.1) 0.84 (9.2) 0.75 (8.2) 0.66 (7.2) 0.57 (6.2)
0.51 (5.6) 0.52 (5.6) 0.52 (5.7) 0.52 (5.7) 0.52 (5.7)
Note: Figures in italic parenthesis are the shares of each factor growth.
6.6 Conclusion
The empirical results indicate that China’s economic growth largely comes from factor
accumulation, which shows that the neo-classical approach to growth accounting is still
very much relevant today. China’s economic growth is largely driven by the expansion
of capital formation. Even though ICT capital has only a miniscule share out of total
capital stock and GDP, it has grown at a faster rate than any other form of capital. From
the fact that ICT investment as a proportion of GDP is much lower than that of other
forms of investment, and yet its contribution to economic growth is almost half of the
latter, it can be ascertained that ICT has become an important contributor to the growth
of China’s economy. The latter will in turn ensure a continued high demand for ICT
products and services.
This chapter highlighted findings on the sources of China’s economic growth in
the late 1990s and the early 21st century that are different from existing literature, even
though the actual depreciation rate of China’s ICT capital stock is still unknown.
Current literature has found the contribution of ICT to China’s economic growth to be
less than 10% even during the late 1990s and the early years of this century, much lower
than this dissertation’s findings of about 25%. The contribution from TFP to economic
growth in China is much lower compared with those from other literature – for instance,
about 6% in this chapter compared with 35% in Jorgenson and Vu (2005) for the period
after 1995.
156

There would be a need for further empirical research on the sources of China’s
productivity growth that investigates whether there has been a capital reallocation
between the ICT sector (i.e., ‘ICT-producing’ and ‘ICT-using’ industries) and the non-
ICT sectors. It should also be acknowledged that China’s regional disparity in ICT
investment will be an issue for examination. This could bring up a debate over whether
China should focus its ICT investment in the more developed eastern or coastal regions,
or to invest more in the inward or western regions. This issue will be examined in the
next chapter, which looks at the impact of ICT on technical efficiency in the Chinese
regions. Finally, one limitation of this study concerns the decomposition of ICT
contribution to TFP growth. There is currently no statistical source available that
provides data on ICT investment in individual industries in China that would enable any
formal analysis of the contribution of ICT to TFP growth.
157

APPENDIX TO CHAPTER 6
This appendix presents the estimation results based on the hedonic price index. The
sample has 22 observations for the period of 1983-2004. The initial estimates of the
parameters in equation (6.6) are presented in Table A6.1. All coefficients of the
parameters are statistically significant with the correct sign at all levels of significance.
Based on Durbin’s d statistic obtained from the three different model specifications,
with the values ranging from 0.9282 to 0.9305, there is no conclusive evidence of the
presence of positive first-order serial correlation as these values lie between dL = 0.831
and dU = 1.407. The Breusch-Godfrey (BG) test suggests that the null hypothesis of no
serial correlation is rejected at 5%, but not rejected at 1% level of significance.
Table A6.1 Regression results of China’s sources of economic growth, 1983-2004 Explanatory variables Model specification Initial value Backcasting Integral Intercept lnICT lnKN lnL R2
Adjusted R2
Standard Error Observations Durbin-Watson statistic
-3.0330 (-3.110)*** 0.1337 (2.860)*** 0.4513 (5.712)*** 0.4541 (2.207)*** 0.9764 0.9724 0.0855 22 0.9283
-2.4662 (-2.414)*** 0.1342 (2.895)*** 0.4299 (5.051)*** 0.4077 (2.102)*** 0.9765 0.9726 0.0851 22 0.9305
-3.1539 (-3.253)*** 0.1340 (2.855)*** 0.4554 (5.856)*** 0.4647 (2.229)*** 0.9763 0.9724 0.0855 22 0.9282
Note: Figures in parentheses are the t-ratios. *, ** and *** indicate significance at 10%; 5% and1%.
Decomposition of output growth
Using the estimates shown in Table A6.1, the sources of economic growth can be
derived. The backcasting is chosen for computation as it has the largest t-ratio for ICT
capital and the smallest standard error of the regression among the three models. The
contributions of the factor accumulations and technical change (or technological
progress) to real output growth in China for the period of 1983-2004 are shown in Table
A6.2.
The estimation results do not differ much from those reported in Table 6.2. The
contributions from ICT and non-ICT capital sum up to more than 80%. Similarly, this
study also finds that the contribution of ICT capital to growth has largely fluctuated
between the 1980s and the recent years, whereas that of TFP has increased to more than
40% during the most recent years. Finally, Table A6.2 also shows remarkably
contrasting results at different periods during the 1980s and 1990s. During the 1980s,
158

ICT had a contribution of only 3% to economic growth, but it increased to more than
60% in the 1990s. During the first three years of the 21st century, ICT capital
contributed 21% to economic growth.
Table A6.2 Contributions to output growth in China, 1983-2004 (unit: %) Period 1983-2004 1983-1991 1992-2000 2000-2004 ICT Capital Other Capital Labour TFP Output
2.79 (30.1) 5.41 (58.2) 0.94 (10.1) 0.15 (1.6) 9.28 (100.0)
0.29 (2.6) 6.26 (76.5) 1.75 (21.4) -0.04 (-0.4) 8.19 (100.0)
5.01 (61.8) 4.76 (58.8) 0.43 (5.4) -2.10 (-26.0) 8.10 (100.0)
2.97 (21.0) 5.16 (36.5) 0.43 (3.1) 5.58 (39.5) 14.14 (100.0)
Note: Figures in parentheses are the shares of each factor growth.
Sensitivity analysis
The robustness of the estimation results can be examined with a sensitivity analysis by
assuming different rates of depreciation for the ICT capital stock. The estimated growth
rates of ICT capital stock show a similar trend of contribution under different
depreciation rates (Table A6.3). Similar to the results shown in Table 6.5 earlier, the
contribution from ICT capital gets lower as δ increases, whereas that from TFP gets
higher. As the depreciation rate of ICT capital increases, the regression results become
more robust as standard errors are reduced and the t-ratios of all variables increase.
159

Table A6.3 Results of sensitivity analysis
Contribution to output growth (%) Depreciation rate of ICT capital (%)
ICT
KN L TFP
10 15 20 25 30
2.88 (31.0) 2.79 (30.1) 2.71 (29.2) 2.64 (28.5) 2.58 (27.8)
5.41 (58.2) 5.41 (58.2) 5.41 (58.2) 5.41 (58.2) 5.41 (58.2)
0.94 (10.1) 0.94 (10.1) 0.94 (10.1) 0.94 (10.1) 0.94 (10.1)
0.06 (0.7) 0.15 (1.6) 0.23 (2.5) 0.30 (3.2) 0.36 (3.9)
Note: Figures in italic parenthesis are the shares of each factor growth.
160

Chapter 7
ICT AND EFFICIENCY IN CHINESE REGIONS
7.1 Introduction
In the previous chapter, the contribution of ICT to China’s economic growth using data
at the national level was examined. This chapter will discuss issues related to regional
growth and disparities in China, using data at the provincial level. The role of ICT in
propelling China’s regional growth is, however, very rarely discussed, despite the
country’s emergence as one of the world’s largest ICT market. This chapter contributes
to existing literature by looking at the pattern of disparity in ICT investments in China.
It will provide a background review of how the pattern of regional disparity in China
has changed as far as ICT is concerned. The chapter attempts to look at the impact of
ICT on technical efficiency in Chinese regions. No previous work in this area has been
reported. There are two main objectives: a) to estimate China’s regional ICT capital
stock and b) to examine the impact of ICT investment on technical efficiency in China’s
regions.
The chapter begins with an account of the pattern of ICT investment in different
regions over the past decade (from 1996 to 2004). This is followed by a discussion of
literature concerned with the concepts of technical efficiency and its relationship with
ICT investment. The next section deals with the method applied in this study to assess
the impact of ICT capital stock as well as other inputs on technical efficiency using
regional data. Data for ICT and other forms of capital stock are derived from investment
figures. Finally, based on the estimation results, the pattern of change in the effect of
ICT on technical efficiency among Chinese regions is illustrated.
7.2 ICT investment in Chinese regions
Testifying the increasing importance of ICT to China’s economy, the ICT sector has
been placed among the ten categories for high priority development by the National
Development and Reform Commission and the Ministry of Science and Technology.1
1 The other sectors include bio-technology and new medicines, new materials, manufacturing, resource development, environmental protection, aeronautics and astronautics, agriculture and transportation. See “High-tech industries gain State priority”, China Daily (North American ed.), New York: July 9, 2004.
161

Among the eight most important tasks to be achieved during the Tenth Five Year Plan
(2001-2005) in former Chinese Premier Zhu Rongji’s ‘Report on National Economic
and Social Development during the Tenth Five Year Plan’, are ‘changing the structure
of industry towards more high-technology industry’, ‘developing the western region in a
strategy of regionally balanced economic development’ and ‘investing in human capital
in a strategy of promoting science, technology and education for the betterment of the
nation’ (Chow, 2002). The report thus marked a gradual shift of attention from
‘focusing on the rapid development of the coastal (eastern) region’ to one of ‘promoting
development of the interior’ (Lai, 2002).2 As China seeks to develop its inner (central
and western) regions, a key question is whether investment in ICT will help narrow the
country’s regional disparity.
To further boost the development of ICT industry, and to develop China into an
internationally competitive ICT powerhouse instead of being merely a manufacturing
centre, the Ministry of Information Industry (MII) set up several information industry
bases in 2004.3 In addition, the MII has also outlined development schemes for 23
special ICT sectors, such as digital television, mobile telecommunications and
automobile electronics, a part of the Eleventh Five-Year Plan (2006-2010) programme.4
The ICT industry has shown robust growth in different regions in the country,
supported by preferential policies for regional development.5 For instance, the ICT
industries in northeastern Jilin province and southwestern Guizhou province grew by
almost 30% and more than 50% respectively.6 To illustrate the relationship between
ICT investment and labour productivity in China, a scatter diagram plotting the
correlation between ICT investment per worker and GDP per worker among China’s
provinces and other regions is drawn (Figure 7.1). In 2004, the majority of provinces or
regions in China have a GDP per worker below 5,000 yuan, and investment in ICT per 2 After two decades of pursuing coastal development, the western development strategy was proposed by former Chinese President Jiang Zemin during the Ninth National People’s Congress (NPC) in March 1999 and the policy was officially endorsed in June the same year in which the phrase ‘great western development’ (xibu da kaifa) was used in Jiang’s ‘Xi’an speech’ (Lai, 2002: 436). 3 Aimed at nurturing China for home-grown leading technologies, these ICT bases would focus on the development of mobile telecommunications, digital TV, softare, as well as semiconductor technologies and products. See “Launch of IT bases planned”, China Daily (North American ed.), New York: August 16, 2004. 4 Ibid. 5 The preferential policies are listed in the state publication A Catalogue of Advantaged Industries for Foreign Investment in the Central and Western Region, in which ‘provinces in the central and western regions may upgrade an existing developmental zone in the capital cities into a national economic and technological development zone’ (Lai, 2002: 457). 6 “IT industry to maintain fast growth”, China Daily, Beijing: December 6, 2004.
162
worker below 50 yuan (Figure 7.1).7 Although most provinces are shown to cluster
close to the point of origin in the graph, it can be seen that there is a generally positive
correlation between ICT investment and labour productivity in China.
The municipal city of Shanghai is the outlier in this model, having GDP per
worker and ICT investment per worker of almost 98,000 yuan and 254 yuan in 2004
respectively. In descending order of the level of ICT investment per worker, Shanghai is
followed by Jiangsu (having less than half of Shanghai’s investment and the second
highest GDP per worker among the provinces after Guangdong), Tianjin, Guangdong
(the province with highest GDP per worker) and Beijing. Interestingly, in 2004, the two
provinces of Jiangsu and Guangdong and the three municipal cities are the only areas
with an ICT investment per worker at above 50 yuan, which is considerably higher than
the national average of about 24 yuan per worker, and they account for three-quarters of
total ICT investment in the whole of China. (For ICT investment in individual
province/municipal city, see Table A7.1 in the Appendix to Chapter 7).
ICT investment (in real terms) in China had increased ninefold in a decade
between 1993 and 2004, from 1.25 billion to 11.21 billion yuan (figures obtained from
Chapter 5). In terms of aggregate ICT investment, the highest is found in the eastern
region which had two-third of the national ICT investment in 2004 (Figure 7.2). The
three municipal cities of Beijing, Tianjin and Shanghai made up the bulk of ICT
investment during the 1990s, but their share was gradually displaced by the eastern
region since 1999. However, it should be noted that investment in the eastern region
was mainly concentrated in a few provinces such as Guangdong, Fujian, Jiangsu and
Zhejiang. Between 1996 and 2004, it appears that the share of ICT investment has risen
only in the eastern region, from 43% to 65%. The shares of the municipal cities, central
and western regions had dropped from 33% to 24%, 16% to 5%, and 8% to 5%
respectively. Yet, China, on average, still has a proportionately low ratio of ICT
investment to GDP – 0.2% in 2000 compared with Japan’s 4.5%8, and 0.34% in 2004.9
7 Regional division used in this paper is based on China Statistical Yearbook. The municipal cities are Beijing, Tianjin and Shanghai. Eastern region consists of Hebei, Liaoning, Jiangsu, Zhejiang, Fujian, Shandong, Guangdong, Guangxi and Hainan provinces. The central region is made up of the provinces of Shanxi, Inner Mongolia, Jilin, Heilongjiang, Anhui, Jiangxi, Henan, Hubei and Hunan. The western region makes up the remaining provinces and autonomous regions of Sichuan (includes Chongqing municipality), Guizhou, Yunnan, Shaanxi, Gansu, Ningxia and Xinjiang. As data on ICT investment is not available for Tibet and Qinghai, these 2 autonomous regions are omitted from the analysis. 8 See Miyagawa et al. (2004) for Japanese IT investment figures.
163

164
The shares of ICT investment to GDP in the regions are much lower. For instance, in
2004, the respective shares for the municipal cities, eastern, central and western regions
are 0.08%, 0.22%, 0.019% and 0.017%.
7.3 ICT and technical efficiency: a review
7.3.1 Conceptual issues
The concepts of productivity and efficiency are among the most commonly used
measures of firm or economic performance in economics literature. Productivity
generally refers to the ratio of output to inputs, i.e. the amount of output produced by a
given amount of inputs such as capital and labour (discussed in Chapter 3). Efficiency,
on the other hand, usually means the difference or gap between the actual and potential
output produced from a given unit of input. Any variation in productivity can be
attributed to differences in production technology or differences in the efficiency of the
production process (Lovell, 1993: 3). The term ‘efficiency’ is used interchangeably with
‘productive efficiency’, which is made up of two components: technical efficiency and
allocative efficiency. The former is concerned with ‘maximising output for given inputs,
or minimising inputs for a given output’, while the latter is concerned with ‘the
allocation of resources in such a way that consumers could not be better off without
making anybody else worse off’ (Black, 1997). This chapter focuses on examining the
effects of ICT on technical efficiency in the Chinese regions.
7.3.2 Efficiency measurement
Many studies have provided definitions and measures of technical efficiency. For
instance, in Koopmans (1951), ‘a producer is technically efficient if an increase in any
output requires a reduction in at least one other output or an increase in at least one
input, and if a reduction in any input requires an increase in at least one other input or a
reduction in at least one output.’ The key emphasis is on efficient production relative to
the ‘production possibility frontier’. Several approaches have been developed to
measure efficiency. The earliest study that calculates efficiency measures is found in
Farrell (1957) who analysed technical efficiency ‘in terms of realized deviations from
an idealized frontier isoquant’ (Greene, 1993). The econometric approach bears two
9 Note that the shares reported in this chapter are considerably lower than those in Chapter 5 as the latter looks at the share of ICT capital stock to GDP instead of investment.

Figure 7.1 Correlation between GDP per worker and ICT investment per worker in China's provinces, 2004
lny = 0.2204 lnx + 9.7341R2 = 0.4601
0
2
4
6
8
10
12
14
-3 -2 -1 0 1 2 3 4 5 6
Log of ICT investment per worker
Log
of G
DP
per w
orke
r
Source: State Statistical Bureau, Yearbook of China’s Electronics Industry and China Statistics Yearbook on High Technology Industry (various issues).
165

Figure 7.2 Total ICT investment in China's regions, 1996-2004
0
1000
2000
3000
4000
5000
6000
7000
8000
9000
1996 1997 1998 1999 2000 2001 2002 2003 2004
Mill
ion
yuan
Municipals East Central West
Source: State Statistical Bureau, Yearbook of China’s Electronics Industry and China Statistics Yearbook on High Technology Industry (various issues).
166

Figure 7.3 Ratio of ICT investment to GDP in China's regions, 1996-2004
0
0.05
0.1
0.15
0.2
0.25
0.3
0.35
0.4
1996 1997 1998 1999 2000 2001 2002 2003 2004
%
Municipal cities Eastern region Central region Western region
Source: State Statistical Bureau, Yearbook of China’s Electronics Industry and China Statistics Yearbook on High Technology Industry (various issues).
167

main characteristics, i.e. stochastic which ‘distinguishes the effects of noise from the
effects of inefficiency’ and parametric implying that ‘the effects arising from
misspecification of a functional form is confused with inefficiency’ (Lovell, 1993: 19).
A typical stochastic frontier production function can be expressed as:
yi = f(xi; β) exp{vi - ui} (7.1)
where output yi is the dependent variable, the inputs xi represent a set of explanatory
variables, and β is a vector of production technology parameters to be estimated for
producer i. The random disturbance term given by vi captures statistical noise and is
assumed to be independently and identically distributed as N (0, σ2v). The disturbance
term ui is a measure of technical inefficiency, a positive error component assumed to be
independently distributed of vi. Technical efficiency is given by the ratio of actual
output, yi, to the maximum potential output which is given by the stochastic production
frontier, represented by [f(xi; β) exp{vi}]. The stochastic production frontier is in turn
determined by the structure of production technology, i.e. the deterministic production
frontier (Lovell, 1993: 20). Therefore, technical efficiency (TE) can be measured as:
}exp{}exp{);( i
ii
ii u
vxfy
TE ==β
(7.2)
Having devised a technique for measuring technical efficiency, the outcome is
normally generated as ‘efficiency scores’. The distribution of efficiency scores can be
evaluated using a one-stage analysis, where the efficiency scores are obtained from a
regression of the dependent variable against a vector of explanatory variables.
Efficiency scores are bounded by zero and one or below one. Some studies have
attempted to transform efficiency scores for use as a dependent variable in a two-stage
analysis (Kalirajan and Shand, 1988). Lovell (1993) however advised caution on the use
of explanatory variables in the second stage, which are those that the decision maker has
no control over during the period under consideration, including quasi-fixed variables,
socioeconomic and demographic characteristics, or the weather, etc.
The relationship between technical efficiency and other explanatory variables
can be given as follows:
168

exp{ui} = g(zi; γ) exp{ei} (7.3)
where exp{ui}= TEi, as given in Equation (7.2). The application of this model for
empirical analysis of the relationship between ICT and technical efficiency in the
Chinese regions will be further discussed in section 7.4.
7.3.3 ICT and technical efficiency
How does ICT affect economic performance and technical efficiency (TE)? From an
organizational perspective, communication effectiveness is enhanced with computer
networks transferring information at a reduced time and transaction costs required for
task accomplishment (Shao and Lin, 2001). This in turn enables management to make
sound decisions and better utilize resources, which would enhance a firm’s capability to
produce more output with the same amount of input (Shao and Lin, 2002).
As shown in Chapters 3 and 4, there is extensive research documenting the
positive correlation between ICT investments and productivity growth. However, there
is relatively less literature that examines the impact of ICT on technical efficiency. Shao
and Lin (2001) found that ‘the increase in technical efficiency incurred by ICT is one
source for the productivity growth witnessed in previous studies.’ In theory, technical
inefficiency occurs when a country or firm produces output below its production
possibility frontier curve, given input. Measuring the impact of ICT on firm
performance by using the stochastic production frontier method, Shao and Lin (2001)
found that ICT indeed has a positive impact on a firm’s technical efficiency.
The same conclusion is also found in Becchetti et al. (2003) who used a
stochastic frontier approach to estimate the impact of ICT investment on efficiency for
small and medium sized firms in Italy. The authors found that ICT investment affects
firm efficiency by increasing the demand for skilled labour as well as average labour
productivity, introducing new products or processes of communications, and increasing
the average capacity utilization of telecommunications networks.
One empirical work that investigates the impact of ICT on regional economies is
Susiluoto (2003) who defined regional efficiency as ‘a region’s ability to use its basic
productive resources in an economic way to produce well being. In recognising the
difference in the resource base of regions, a region with a good knowledge base, for
169

instance, must produce more than its poorer neighbour in order to be equally efficient.’
By applying the Data Development Analysis (DEA) method to examine the effects of
the ICT sector on economic efficiency among the regions of Finland, Susiluoto showed
that ‘raising ICT in the regional economy increases the performance level or efficiency
of the regions.’10
7.3.4 China-related studies
Regional studies tend to look at the ‘catch up’ hypothesis of Abramovitz (1986) which
postulates that technologically backward countries or regions (followers) have the
potential for catching up with the more advanced (leaders) through faster growth in
productivity. The narrowing of such technological gap between the leaders and
followers, or in other words, convergence, rests on the condition that ‘improvement of
social capabilities in backward regions attracts advanced technology and other
production factors into these regions’ (Jia, 1998).
Evidence of convergence in China’s regional economies on the basis of
technical efficiency performance is found in Wu (1999), who applied a stochastic
frontier model to examine productivity growth among China’s regions for the period of
1981-1995. In an earlier study of China’s state enterprises, Kalirajan and Zhao (1997)
showed improvement in technical efficiency from 1986 to 1989 due to economic reform.
They found an increasing trend in technical efficiency in all provinces during the 4-year
period, the highest being in Shanghai with an average TE score of 0.98. Recent studies
that investigated convergence among China’s regions included Yao and Zhang (2001)
and Bhalla, Yao and Zhang (2003). The latter found evidence of convergence within
‘pre-defined geo-economic sub-regions’ such as the ‘east’, ‘central’ and ‘west’, but not
between the sub-regions.
Other authors have focused on studies of industrial efficiency. For example,
Kong et al. (1998) estimated a stochastic frontier production function for four Chinese
industries (i.e. building materials, chemicals, machinery and textiles) for the period of
1990-1994. Using regional dummies to capture the efficiency differences between the
state-owned enterprises in three provinces, Sichuan, Shanxi and Jilin and those in
Jiangsu province, they found firms in the latter province, which is more developed, to 10 The DEA is an alternative method for modeling the relationship between inputs and output in the production process, and has become popular especially in the study of public sectors such as school and hospitals (Susiluoto, 2003).
170

be more efficient. In a study on China’s iron and steel industry using data from the 1995
industrial census, Zhang and Zhang (2001) measured technical efficiency of all large
and medium-sized enterprises with a stochastic frontier production function. They found
that location has not much impact on technical efficiency, although enterprises in the
eastern region tend to be more efficient than those in other regions. One of their most
important findings is technical efficiency being closely related to the vintage of an
enterprise’s fixed capital assets, as efficient enterprises are those that use relatively new
capital equipment. This could suggest that investment in new ICT equipment is crucial
to improving firm efficiency.
Finally, in another study on China’s iron and steel industry, Movshuk (2004)
examined technological progress and changes in productive efficiency for about 100
large and medium enterprises during 1988-2000 using a stochastic frontier model with
panel data. This chapter will build up the existing literature by including ICT capital in
the production function, and provide new empirical findings of technical efficiency
scores for the period of 1995 to 2004.
7.4 Modelling framework
This section proposes a stochastic frontier model and applies it to test for the effect of
ICT on technical efficiency in China’s regions. The stochastic frontier model takes into
account the differences between the ideal and actual output, thereby seeking to
maximize technical efficiency theoretically (i.e. minimizing the differences). These
differences are attributed to factors ‘that might not be under the control of the agent
being studied’, such as bad weather, breakdown of equipment, or any other random
factors that might be construed as inefficiency (Greene, 1993: 76).
The model proposed by Battese and Coelli (1995) postulates the existence of
technical inefficiency in the production process. The stochastic frontier model (referred
to as the BC model) is conventionally expressed as follows:
lnYit = ln{f (Xit, β)} + εit
εit = vit – uit (7.4)
171

where X and β are the respective vectors in the independent variables and unknown
parameters to be estimated. The disturbance term, εit, is defined as the sum of vit, a
random measurement error assumed to be iid N(0, σ2v), independently distributed of uit;
and uit, a non-negative random variable associated with technical inefficiency in
production which is assumed to be independently distributed such that uit is truncated at
zero of the normal distribution with mean, µ, and variance, σ2 (Battese and Coelli,
1995).
The BC model was further extended to analyse the influence of ‘firm-specific
environmental conditions’ on economic performance in Wu (2001). By developing a
model which examines the effect of environmental variables on technical inefficiency,
the model in (7.4) is rewritten as (adapted from Wu, 2001):
lnYit = ln f(xit, zit, t) + vit – uit (xit, zit, t) (7.5)
where zit represents the ‘environmental variables’, such as ICT capital stock in this
model, xit represents all other explanatory variables and t is a time-trend variable. This
model can be used to test the influence of the environmental variable on technical
efficiency in the form of uit = uit (zit, t), as proposed by Battese and Coelli (1995). In this
model, the estimates of the unknown parameters of the frontier production function can
be obtained using the maximum-likelihood (ML) method (O’Donnell, Rao and Battese,
2005).
To investigate the impact of ICT on technical efficiency among China’s regions,
a hypothesis is formulated as follows:
H1: ICT investment has a positive effect on regional technical efficiency in the
production process.
In this chapter, a one-stage method is used to capture the effect of ICT on technical
efficiency. The stochastic frontier model is designed to capture the effects of efficiency
change resulting from factor inputs which incorporate the ICT capital stock. Following
the model of Kumbhakar and Wang (2005), the efficiency effect of ICT in a specific
region is determined by its endowment of ICT capital per worker, given by the ratio of
172

ICT to labour in logarithmic form (ICTit - Lit). By applying the KW model to equation
(7.4), the Cobb-Douglas production function is specified as follows:
lnY =β1 + β2lnICTit + β3lnKNit + β4lnLit + vit - uit (7.6)
uit = δ0 + δ1 (ICTit - Lit)
i = 1, 2, … , 28 (provinces)
t = 1, 2, … , 10 (time: 1995, … , 2004)
where Y, ICT, KN and L stand for real output, ICT capital stock, non-ICT capital stock
and employment respectively.
This chapter will also apply the more flexible translog production function
specified as follows:
lnYit = β0 + β1lnICTit + β2lnKNit + β3lnLit + γ1(lnICTit) 2 + γ2 (lnKNit) 2 +
γ3 (lnLit) 2 + η1 (lnICTit lnKNit) + η2 (lnICTit lnLit) + η3 (lnKNit lnLit) +
vit - uit (7.7)
uit = δ0 + δ1ln(ICTit - Lit)
i = 1, 2, … , 28 (provinces)
t = 1, 2, … , 10 (time: 1995, … , 2004)
where β, γ and η are the parameters to be estimated.
7.5 Description of data
Output and labour
Output is defined as real GDP, which is derived from nominal GDP deflated by the
consumer price index (CPI) in 1978 constant prices. The data for GDP and employment
for the period of 1995-2004 is obtained from China Statistical Yearbook. In order to
take into account the inter-regional differences in price level, the regional CPI at
constant prices for each municipal city, province and autonomous regions is derived by
dividing the national CPI in constant prices by the individual region’s CPI in current
prices.
173

ICT-capital stock
The ICT capital stock is estimated based on real ICT investment data that is derived
from ‘investment in capital construction’ and ‘investment in innovation’ from the
communications equipment, and computer (hardware and software) industries, obtained
from China Statistical Yearbook on High Technology Industry, deflated by the regional
fixed asset price index which is obtained from China Statistical Yearbook. As data for
investment in the ICT industry by region is only available for the period of 1996-2004,
the dissertation will only cover this period. It should be noted that data for Qinghai
province and Tibet are not available, and therefore the analysis will omit these two
regions altogether. To calculate the regional CPI in constant prices, the fixed asset price
index for each province/municipal city is derived from dividing the national fixed asset
price index by the individual region’s fixed asset investment price index.
The estimation of initial ICT capital stock is similar to that used in Chapter 5, by
applying the following formula, which has also been used by Shinjo and Zhang (2003)
and Miyagawa et al. (2004) for the estimation of Japanese ICT capital stock:
δγ += +1t
tI
K (7.8)
where γ is the average annual growth rate of ICT capital investment (I) and δ is the
weighted average rate of depreciation. The real ICT capital stock is then derived as
follows:
Kt = It + (1–δ) Kt-1 (7.9)
where the capital stock, K, at year t is dependent on the level of ICT investment, It in
the same year and capital stock level in the preceding year which is deflated by the rate
of depreciation, δ. The non-ICT capital stock series is derived from non-ICT investment
figures, which is the difference between total fixed asset investment and real ICT
investment.
Figures for ICT capital investment are deflated by the fixed asset price index, to
be consistent with the method of estimation used in Chapter 6. Similar to Chapter 6, the
choice of the capital depreciation rate, δ, for ICT capital stock is based on empirical
174

175
studies of Kim (2002) and Miyagawa et al. (2004), while that of non-ICT capital stock
is based on Islam and Dai (2005). The rate of depreciation for non-ICT capital stock is
assumed to be 5%, based on the rate for total capital stock used in Islam and Dai (2005).
Since ICT equipment turns obsolete faster than other forms of capital, this study adopts
15% as the proxy depreciation rate for China’s ICT capital stock in 1992-2003, i.e. δ =
0.15, used in the previous chapters.
The ICT capital stock is estimated for the municipal cities, eastern, central and
western regions (Figure 7.4). The share of ICT capital stock has changed remarkably
over the past ten years. In 1995, the municipal cities and eastern region took up one-
third of ICT capital stock respectively, with the central region having another one-fifth
of the total. However, by 2004, while the share of the eastern region has increased to
64%, those of the municipal cities and central region have dropped to 24% and 7%
respectively. The share of the western region has declined slightly during the same
period, from 8% in 1995 to about 5% in 2004.
7.6 Estimation results and interpretation
7.6.1 Estimation results
The empirical work begins with a regression of output (real GDP) against factor
accumulation, that is, ICT capital, non-ICT capital and labour, expressed in equations
(7.6) and (7.7) of the Cobb-Douglas and translog model respectively. The sample has
280 observations for the period of 1995-2004. The initial estimates of the parameters
are presented in Table 7.1. All coefficients of the parameters are statistically significant
at the correct sign. The results show that the growths of ICT capital as well as physical
capital and labour are positively related to China’s economic growth in the 1990s and
the beginning of the 21st century. The maximum likelihood estimates (MLE) of the
stochastic frontier model generated by the Cobb-Douglas and translog production
function are reported in Table 7.1. Using the likelihood ratio test, it is proven the
hypothesis that the production is better described by the Cobb-Douglas function for the
MLE specification, i.e. γ1 = γ2 = γ3 = η1 = η2 = η3 = 0 is rejected. The test statistic for
MLE is χ2(6) = 57.677. 11 Therefore, the Cobb-Douglas assumption is rejected in this
finding.
11 The likelihood ratio (LR) test statistic is given by λ = -2(LLRestricted – LLUnrestricted).

0
10000
20000
30000
40000
50000
60000
70000
80000
Mill
ion
yuan
1995 1996 1997 1998 1999 2000 2001 2002 2003 2004
Figure 7.4 ICT capital stock in China's regions, 1995-2004
Municipal East Central West
Source: State Statistical Bureau, Yearbook of China’s Electronics Industry and China Statistics Yearbook on High Technology Industry (various issues).
176
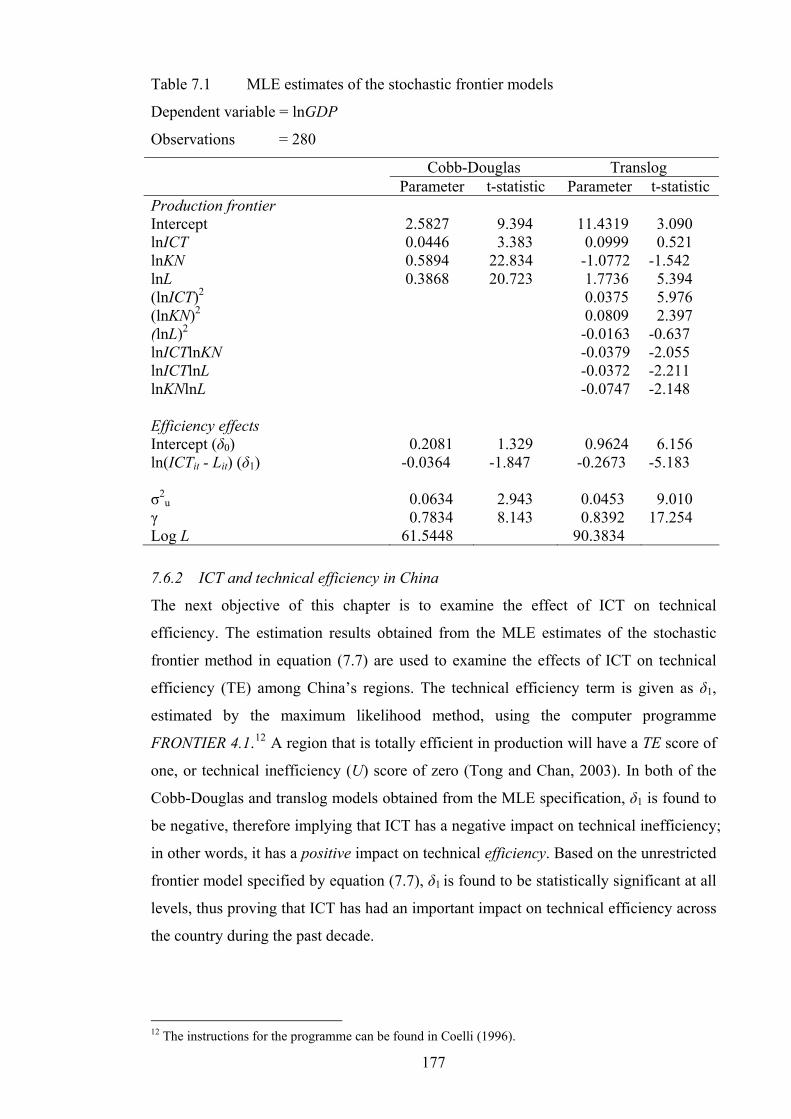
Table 7.1 MLE estimates of the stochastic frontier models
Dependent variable = lnGDP
Observations = 280
Cobb-Douglas Translog Parameter t-statistic Parameter t-statistic
Production frontier Intercept lnICT lnKN lnL (lnICT)2
(lnKN)2
(lnL)2
lnICTlnKN lnICTlnL lnKNlnL Efficiency effects Intercept (δ0) ln(ICTit - Lit) (δ1) σ2
u γ Log L
2.5827 0.0446 0.5894 0.3868 0.2081 -0.0364 0.0634 0.7834 61.5448
9.394 3.383 22.834 20.723
1.329 -1.847 2.943 8.143
11.4319 0.0999 -1.0772
1.7736 0.0375 0.0809 -0.0163 -0.0379
-0.0372 -0.0747 0.9624 -0.2673 0.0453 0.8392 90.3834
3.090 0.521 -1.542 5.394 5.976 2.397 -0.637 -2.055 -2.211 -2.148 6.156 -5.183 9.010 17.254
7.6.2 ICT and technical efficiency in China
The next objective of this chapter is to examine the effect of ICT on technical
efficiency. The estimation results obtained from the MLE estimates of the stochastic
frontier method in equation (7.7) are used to examine the effects of ICT on technical
efficiency (TE) among China’s regions. The technical efficiency term is given as δ1,
estimated by the maximum likelihood method, using the computer programme
FRONTIER 4.1.12 A region that is totally efficient in production will have a TE score of
one, or technical inefficiency (U) score of zero (Tong and Chan, 2003). In both of the
Cobb-Douglas and translog models obtained from the MLE specification, δ1 is found to
be negative, therefore implying that ICT has a negative impact on technical inefficiency;
in other words, it has a positive impact on technical efficiency. Based on the unrestricted
frontier model specified by equation (7.7), δ1 is found to be statistically significant at all
levels, thus proving that ICT has had an important impact on technical efficiency across
the country during the past decade.
12 The instructions for the programme can be found in Coelli (1996).
177

Table 7.2 Average technical efficiency (TE) in China’s regions Region/Province Average TE, 1986-89
(Kalirajan and Zhao, 1997)aAverage TE, 1995-2004
(this study) Beijing Tianjin Shanghai
0.9207 0.9098 0.9802
0.9014 0.9610 0.9468
Municipal cities 0.9369 0.9364 Hebei Liaoning Jiangsu Zhejiang Fujian Shandong Guangdong Guangxi Hainan
0.8444 0.8759 0.8999 0.9599 0.9241 0.9514 0.8967 0.8615 0.8085
0.7163 0.8699 0.9048 0.7832 0.9265 0.8832 0.9196 0.4695 0.5651
Eastern region 0.8914 0.7820 Shanxi Inner Mongolia Jilin Heilongjiang Anhui Jiangxi Henan Hubei Hunan
0.7235 0.6324 0.7810 0.8971 0.9121 0.7330 0.7711 0.8393 0.8516
0.5239 0.6004 0.7724 0.9121 0.5131 0.6094 0.6395 0.6949 0.6517
Central region 0.7934 0.6575 Sichuan Guizhou Yunnan Shaanxi Gansu Ningxia Xinjiang
0.6716 0.7464 0.9668 0.6170 0.7282 0.6846 0.7539
0.6465 0.3407 0.2323 0.5787 0.4400 0.4331 0.2894
Western region 0.7384 0.4230 National
0.8265
0.6997
Note: a. TE scores for state enterprises only.
The impact of ICT on technical efficiency can be examined by dividing the
sample period into two, i.e. during the second half of the 1990s and the first half of this
decade. The former covers the Asian financial crisis. By plotting the average TE scores
in each region over the years 1995-2004, it can be seen that all regions have experienced
178

a gradually increasing trend in technical efficiency over the past decade (Figure 7.5).13
However, there was a slight decline in technical efficiency in 1995-1997, which
suggests that the financial crisis had a negative impact on technical efficiency. This can
also be attributed to a fall in ICT investment occurring in many regions in 1997, except
for Liaoning, Guangxi, Hainan, Shanxi, Heilongjiang and Ningxia (see Table A7.1 in
the appendix to this chapter). It can also be noticed that only the municipal cities and
eastern regions have average TE scores which are consistently above the national
average since the mid-1990s. The central region has a TE score that approximated the
national average in 2004 though.
Regionally, the municipal cities have the highest average TE score of 0.92 over
the period of 1995-2004. The highest average TE for an individual area is found in
Tianjin and Shanghai, followed by Fujian, Guangdong, Heilongjiang, Jiangsu and
Beijing, which are the only areas with TE scores of 0.9 and above (Table 7.2). As of
2004, the highest TE scores were found in Tianjin (0.98), Beijing, Shanghai and
Guangdong (0.97 each), followed by Jiangsu (0.96), Fujian (0.95) and Shandong (0.94).
The lowest TE scores, in ascending order, were found in Xinjiang (0.29), Yunnan (0.41)
and Guizhou (0.47) of the western region. The northeastern provinces of Liaoning, Jilin
and Heilongjiang have performed comparatively well, having TE scores over 0.91 in
2004, while Liaoning and Heilongjiang have consistently scored over 0.9 since 2001.
These provinces could be further boosted with the implementation of the ‘Northeast
revitalization’ programme which has produced positive effects for economic growth in
the region. 14 As a matter of fact, the Northeast Revitalization Office of the State
Council approved over 260 ICT projects amounting to four billion yuan (US$481
million) in an overall plan for the development of the ICT sector as part of the economic
revitalization of the northeastern region.15 In the western region, the effect of ICT on
technical efficiency is lifted by the higher scores achieved by Sichuan and Shaanxi
provinces.
13 Figure 7.5 illustrates the contribution of ICT to efficiency in the Chinese regions. The efficiency scores are generated by FRONTIER 4.1. 14 Headed by the Chinese Premier Wen Jiabao, the ‘Northeast revitalization’ programme was initiated when an office in charge of affairs was formed in the State Council in October 2003. The programme provides preferential policies and financial support aimed at reviving the industrial bases and spurring the economic growth of Northeast China (Dong, 2006). 15 “IT giants to assist in Northeast revitalization”, China Daily (New York: July 23, 2004).
179

180
7.7 Conclusion
This chapter finds evidence that ICT investment has a significantly positive effect on
regional technical efficiency in China during the 1990s and early years of the 21st
century. As such, ICT investment is expected to be an important driver of China’s
economic growth. Although most of the investment is pumped into the coastal region
and municipal cities, the rising technical efficiency of the central and western regions
suggest a rapid catch-up of the latter with the more developed regions within the next
decade. The exceptional performance of the three north-eastern provinces indicates the
strong priority given to development in these areas.
There is thus a case for greater investment in infrastructure and ICT equipment,
especially in the central and western regions. While the Japanese experience has shown
the rate of return on ICT capital stock to be higher than that on other forms of capital,
thereby encouraging policies which stimulate ICT investment (Miyagawa et al., 2004),
there is no reason why China, having the potential for training of a much larger base of
skilled labour to better utilize its ICT resources, could not do the same.
There are areas for further research on this field of study. China’s economic
efficiency could be better evaluated using industrial or firm-level data. The issue of
factor re-allocation between ICT and non-ICT capital, as has been studied for developed
economies, has so far been unaccounted for. It is unknown as to whether there is any
substitution of ICT capital for non-ICT capital, as data on the price of ICT capital is
unavailable. Thus it still remains to be seen whether the same substitution has taken
place as shown in the developed countries. Finally, the inclusion of other variables in
the analysis such as openness, infrastructure and human capital could be taken into
consideration so that the impact of these factors on China’s growth can be assessed.

Figure 7.5 The effect of ICT on technical efficiency in China’s regions, 1995-2004
0
0.2
0.4
0.6
0.8
1
1.2
1995 1996 1997 1998 1999 2000 2001 2002 2003 2004
TE e
stim
ates
Municipal cities Eastern region Central region Western region National
181
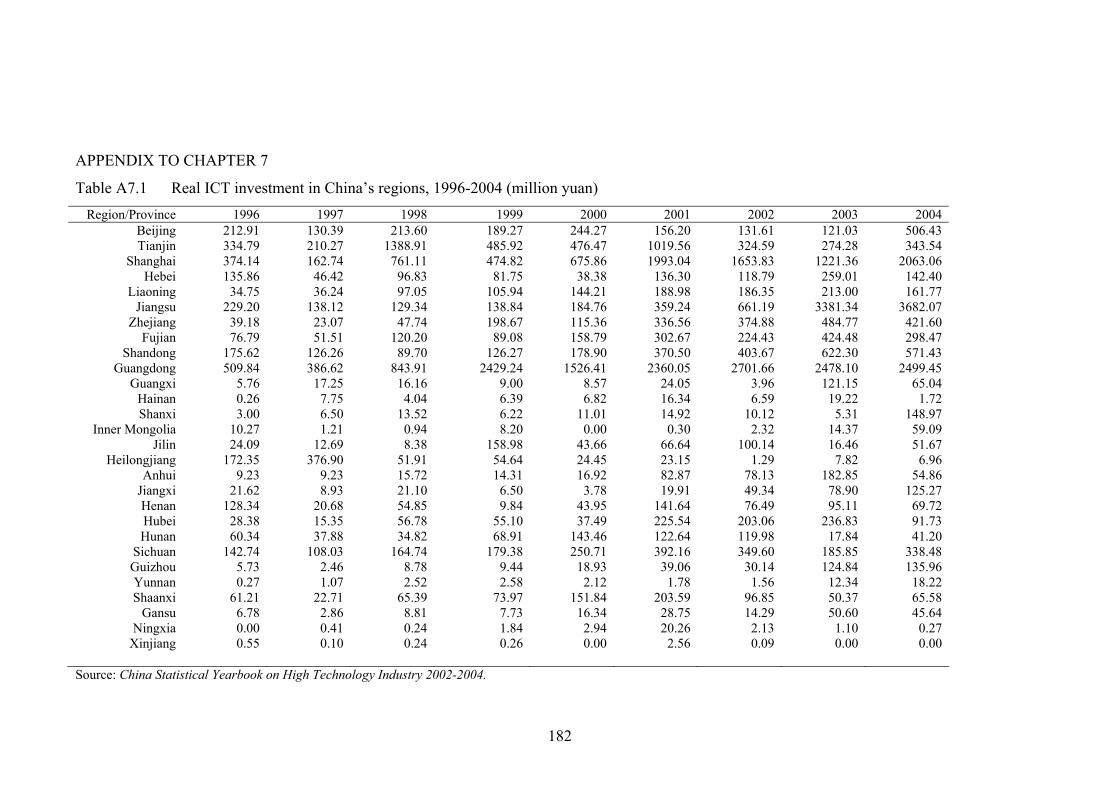
APPENDIX TO CHAPTER 7
Table A7.1 Real ICT investment in China’s regions, 1996-2004 (million yuan) Region/Province 1996 1997 1998 1999 2000 2001 2002 2003 2004
Beijing Tianjin
Shanghai Hebei
Liaoning Jiangsu
Zhejiang Fujian
Shandong Guangdong
Guangxi Hainan Shanxi
Inner Mongolia Jilin
Heilongjiang Anhui
Jiangxi Henan Hubei Hunan
Sichuan Guizhou Yunnan Shaanxi
Gansu Ningxia
Xinjiang
212.91 334.79 374.14 135.86 34.75 229.20 39.18 76.79 175.62 509.84 5.76 0.26 3.00 10.27 24.09 172.35 9.23 21.62 128.34 28.38 60.34 142.74 5.73 0.27 61.21 6.78 0.00 0.55
130.39 210.27 162.74 46.42 36.24 138.12 23.07 51.51 126.26 386.62 17.25 7.75 6.50 1.21 12.69 376.90 9.23 8.93 20.68 15.35 37.88 108.03 2.46 1.07 22.71 2.86 0.41 0.10
213.60 1388.91 761.11 96.83 97.05 129.34 47.74 120.20 89.70 843.91 16.16 4.04 13.52 0.94 8.38 51.91 15.72 21.10 54.85 56.78 34.82 164.74 8.78 2.52 65.39 8.81 0.24 0.24
189.27 485.92 474.82 81.75 105.94 138.84 198.67 89.08 126.27 2429.24 9.00 6.39 6.22 8.20 158.98 54.64 14.31 6.50 9.84 55.10 68.91 179.38 9.44 2.58 73.97 7.73 1.84 0.26
244.27 476.47 675.86 38.38 144.21 184.76 115.36 158.79 178.90 1526.41 8.57 6.82 11.01 0.00 43.66 24.45 16.92 3.78 43.95 37.49 143.46 250.71 18.93 2.12 151.84 16.34 2.94 0.00
156.20 1019.56 1993.04 136.30 188.98 359.24 336.56 302.67 370.50 2360.05 24.05 16.34 14.92 0.30 66.64 23.15 82.87 19.91 141.64 225.54 122.64 392.16 39.06 1.78 203.59 28.75 20.26 2.56
131.61 324.59 1653.83 118.79 186.35 661.19 374.88 224.43 403.67 2701.66 3.96 6.59 10.12 2.32 100.14 1.29 78.13 49.34 76.49 203.06 119.98 349.60 30.14 1.56 96.85 14.29 2.13 0.09
121.03 274.28 1221.36 259.01 213.00 3381.34 484.77 424.48 622.30 2478.10 121.15 19.22 5.31 14.37 16.46 7.82 182.85 78.90 95.11 236.83 17.84 185.85 124.84 12.34 50.37 50.60 1.10 0.00
506.43 343.54 2063.06 142.40 161.77 3682.07 421.60 298.47 571.43 2499.45 65.04 1.72 148.97 59.09 51.67 6.96 54.86 125.27 69.72 91.73 41.20 338.48 135.96 18.22 65.58 45.64 0.27 0.00
Source: China Statistical Yearbook on High Technology Industry 2002-2004.
182

Table A7.2 ICT capital stock in China’s regions, 1995-2004 (million yuan) Region/Province 1995 1996 1997 1998 1999 2000 2001 2002 2003 2004
Beijing Tianjin
Shanghai Hebei
Liaoning Jiangsu
Zhejiang Fujian
Shandong Guangdong
Guangxi Hainan Shanxi
Inner Mongolia Jilin
Heilongjiang Anhui
Jiangxi Henan Hubei Hunan
Sichuan Guizhou Yunnan Shaanxi
Gansu Ningxia
Xinjiang
566.85 799.80 902.69 325.74 95.65 516.59 84.04 157.91 413.95 1174.06 12.72 0.68 8.17 27.27 62.58 435.50 20.25 53.33 295.53 68.82 146.14 349.02 16.10 0.72 171.63 20.28 1.06 1.40
694.73 1014.63 1141.43 412.74 116.05 668.30 110.62 211.01 527.47 1507.79 16.57 0.84 9.93 33.46 77.29 542.53 26.44 66.95 379.54 86.88 184.55 439.41 19.41 0.89 207.09 24.03 0.90 1.74
720.91 1072.70 1132.96 397.25 134.88 706.18 117.10 230.86 574.61 1668.24 31.33 8.46 14.94 29.65 78.38 838.05 31.71 65.83 343.29 89.20 194.75 481.53 18.96 1.82 198.74 23.28 1.18 1.58
826.37 2300.70 1724.13 434.50 211.69 729.59 147.28 316.43 578.12 2261.92 42.79 11.23 26.22 26.14 75.01 764.25 42.67 77.06 346.65 132.60 200.36 574.04 24.90 4.07 234.32 28.60 1.24 1.58
891.68 2441.52 1940.32 451.07 285.88 758.99 323.85 358.05 617.67 4351.87 45.37 15.94 28.50 30.42 222.74 704.26 50.58 72.00 304.49 167.81 239.22 667.31 30.61 6.04 273.15 32.04 2.90 1.60
1002.20 2551.76 2325.14 421.79 387.20 829.90 390.63 463.13 703.92 5225.50 47.14 20.37 35.23 25.86 232.99 623.07 59.92 49.61 302.77 180.13 346.79 817.92 44.95 7.26 384.01 43.57 5.41 1.36
1008.07 3188.56 3969.41 494.82 518.10 1064.66 668.60 696.33 968.84 6801.72 64.12 33.66 44.87 22.28 264.68 552.76 133.80 75.14 399.00 378.65 417.41 1087.39 77.26 7.95 530.00 65.78 24.86 3.72
988.47 3034.86 5027.83 539.39 626.73 1566.15 943.19 816.31 1227.18 8483.12 58.46 35.20 48.25 21.26 325.12 471.14 191.85 113.21 415.63 524.91 474.78 1273.88 95.81 8.32 547.35 70.20 23.26 3.25
961.23 2853.91 5495.02 717.49 745.71 4712.57 1286.48 1118.34 1665.40 9688.75 170.85 49.14 46.33 32.44 292.81 408.28 345.92 175.13 448.40 683.01 421.40 1268.65 206.28 19.41 515.61 110.26 20.87 2.76
1323.47 2769.36 6733.82 752.27 795.63 7687.76 1515.11 1249.06 1987.02 10734.89 210.26 43.49 188.34 86.67 300.55 329.35 348.89 274.13 450.86 672.29 399.39 1416.84 311.29 34.72 503.85 139.36 18.01 2.35
183

Chapter 8
DEMAND FOR ICT SERVICES IN CHINA 8.1 Introduction
Up till now, the dissertation has been focusing on examining how information and
communications technology (ICT) contributes to economic growth in China. Output
growth generated through technological progress and increases in inputs is known as the
‘supply-side’ effect. However, this is only half of the story. Growth is also generated by
aggregate demand, as production capacity can only be fully utilized if there is sufficient
demand (Seiter, 2005).
China has built up a massive network of ICT infrastructure over the past few
decades to meet the strong growth in demand for telecommunications and other ICT
services. The definition of what is covered by ‘ICT services’ has changed dramatically
within the recent few years with a broad range of applications being introduced in the
market, which include gaming, multimedia messaging, emails, fax, voicemails and
streaming video.1 As examined in Chapter 2, the application of 3G (third generation)
technology will be a main force driving demand for a wide range of ICT products such
as mobile phones, personal digital assistants (PDAs) and other advanced electronic
communications devices.2 Therefore it is important to establish a model that estimates
and forecasts the demand for ICT services in China in the near future.
This chapter has two main objectives, i.e. to estimate the demand elasticity of
ICT services and compare China’s with other countries; and to project demand for ICT
services in the near future till 2010. It contributes to current literature that has largely
focused on the supply-side growth accounting framework, mainly the contribution of
ICT capital/investment to economic and labour productivity growth. Projection of ICT
demand would be useful for ICT policy makers in China as well as businesses making
inroads into the Chinese market.
The chapter is structured as follows: It first reviews the literature that focuses on
estimating demand for ICT services, which generally looks at the telecommunication 1 “3G License to Drive Demand for Wireless Test Equipment in China”, PR Newswire (New York: September 27, 2006). 2 Ibid.
184

and computer markets. The chapter then proceeds with estimating demand functions for
telecommunications and computers in China. The estimation results are then employed
to predict demand for telecommunications and computers in China till the year 2010.
Finally, the chapter rounds up with a discussion of the growth prospects for China’s ICT
market in the near future.
8.2 Literature review
How is demand for ICT defined and measured? Broadly speaking, there are two main
components of demand for ICT, namely, telecommunications and computers (which
covers hardware equipment and software application services). Theoretically, the
demand curve for ICT assumes the ordinary downward sloping form, where quantity
demanded is inversely dependent on price and positively on income (Brynjolfsson,
1994). Castro and Jensen-Butler (2003), who examined the notion that ICT will
promote regional economic convergence by developing a regional demand model,
define the potential demand as ‘the utility for the set of services when the number of
subscribers and the traffic that they generate is perceived as approaching infinity.’ In
other words, demand for ICT could be measured in terms of the number of subscribers
or calls traffic.
8.2.1 Demand for telecommunications
The notions of network externalities as a feature of telecommunications demand are
explored by Blonski (2002) and Varian (2003). The former pointed out two important
features of the telecommunications market - the size of a network which ‘represents a
force towards uniformity and thus monopoly’ and non-linear pricing owing to ‘the
possibility of price discrimination between heterogeneous customers’ (Blonski, 2002:
96). Similarly, Varian (2003) distinguished between the effects of ‘direct and indirect
network effects’ on price discrimination in high technology industries.
Authors who examine demand models for ‘telecommunications’ of specific
countries usually refer to fixed line telephones (Nadiri and Nandi, 1997; Das and
Srinivasan, 1999). Nadiri and Nandi (1997) estimated the determinants of demand for
the US telecommunications industry over the period 1935-87. They pointed out that
price and income alone cannot explain the exponential growth in telephone demand, and
therefore introduced a variable, i.e. the share of tertiary sector to non-agricultural
185

employment, to capture the effect of the changing structure of the US economy on
telecommunications demand. Das and Srinivasan (1999) estimated price elasticities of
demand for telephone usage in India for the period of 1992-97 using both national level
time-series and pooled state level cross-section data. Similar to Nadiri and Nandi (1997),
the authors also included the share of tertiary services in GDP as an explanatory
variable for telephone usage in their model.
A comparison of the two papers yields some interesting findings concerning the
price and income elasticities of telephone demand. Both regression results have shown
negative price elasticity and positive income elasticity, as postulated in the theory of
demand. The magnitude of elasticity coefficients with respect to price and income in the
US, however, are lower (-0.34 and 0.12) compared with those of India (-0.46 and 1.9)
respectively (Table 8.1). In another analysis of price elasticity of telecommunications
demand, Hackl and Westlund (1995) observed a range of -0.26 to -0.51 for the UK,
Germany and three Scandinavian countries. The evidence about the price elasticity of
demand being higher in less developed countries is supported by Martins (2003), who
found that the price elasticity of telecommunications demand range from -1.2 in richer
countries to -1.4 in poorer countries, which support the underlying theory that demand
is more elastic in smaller markets where the diffusion process is in its initial phase.
With the changing structure of the telecommunications industry as a result of
innovation and convergence with other ICT sectors, the telecommunications market has
become more differentiated ever since the last two decades, most evidently the rapid
growth of the mobile phone market. Therefore, literature that focuses on the demand for
mobile telephony has emerged in recent years. Madden and Coble-Neal (2004)
investigated the impact of fixed-line network on mobile telephone subscription for 58
countries from 1995-2000. They found the price elasticities with respect to fixed-line
telephones and mobile phones to be 0.12 and -0.05 respectively, and income elasticity
to be 0.03. Iimi (2005) estimated the demand for cellular phone services in Japan for the
period 1996-99 using a nested logit model, focusing on the effects of product
differentiation and network externalities on demand. It was found that the market for
cellular phone services to be highly product-differentiated and that the demand for such
services is highly price-elastic, with estimated elasticity ranging from 1.30 to 2.43.
Other authors focused on different segments of the telecommunications market, such as
the demand for second or additional telephone lines (Duffy-Deno, 2001; Eisner and
186
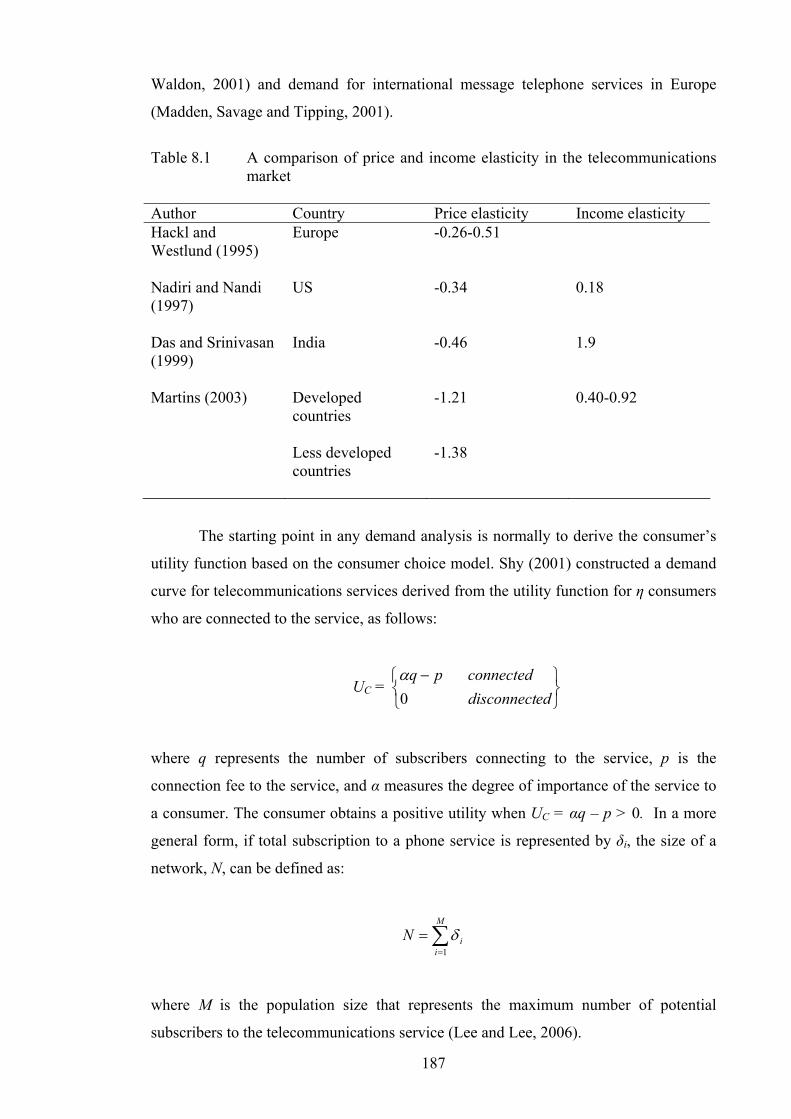
Waldon, 2001) and demand for international message telephone services in Europe
(Madden, Savage and Tipping, 2001).
Table 8.1 A comparison of price and income elasticity in the telecommunications
market Author Country Price elasticity Income elasticity Hackl and Westlund (1995) Nadiri and Nandi (1997) Das and Srinivasan (1999) Martins (2003)
Europe US India Developed countries Less developed countries
-0.26-0.51 -0.34 -0.46 -1.21 -1.38
0.18 1.9 0.40-0.92
The starting point in any demand analysis is normally to derive the consumer’s
utility function based on the consumer choice model. Shy (2001) constructed a demand
curve for telecommunications services derived from the utility function for η consumers
who are connected to the service, as follows:
UC = ⎩⎨⎧ −0
pqα
⎭⎬⎫
eddisconnectconnected
where q represents the number of subscribers connecting to the service, p is the
connection fee to the service, and α measures the degree of importance of the service to
a consumer. The consumer obtains a positive utility when UC = αq – p > 0. In a more
general form, if total subscription to a phone service is represented by δi, the size of a
network, N, can be defined as:
∑=
=M
iiN
1δ
where M is the population size that represents the maximum number of potential
subscribers to the telecommunications service (Lee and Lee, 2006).
187

The theory of network externalities tells us that the number of consumers
connected to the telephone network has a positive effect on the demand for access to
telephone services, since the utility of each consumer increases with each increase in the
total number of other consumers using the same products or services (Shy, 2001). Being
a ‘network good’, telecommunications services are subject to network externality
effects in which higher utility can be offered to customers with a larger size of the
network. This means that the utility of current subscribers will be increased by new
subscribers joining the network as the latter ‘enables existing subscribers to obtain
additional benefits from the ability to make or receive calls from him/her’ (Lee and Lee,
2006; Madden, Coble-Neal and Dalzell, 2004). In other words, one would not subscribe
to a phone service, especially the mobile, if there is nobody to talk to!
Another type of externality in the literature of telecommunications is the ‘call
externality’. In many countries, the caller pays for making calls, but not the receiving
party. In making an outgoing call, the caller considers only his/her own benefits and the
price of the call, but the receiving party benefits from answering the calls as well (Lee
and Lee, 2006). Assume that a consumer seeks to maximize his/her utility function from
making calls, subject to an income constraint. Further assume that call externality is
incorporated in the utility of an individual, which implies that the number of existing
subscribers making and receiving calls affects the demand for calls. The utility function
of a consumer, U, can be expressed as follows:
U = U(q, y, N) (8.1)
where q represents the number of calls, y is income of the consumer and N is the size of
network. The budget constraint further depends on access (or connection) and call
charges, given by:
(pa + pcq) + pzz = y (8.2)
where pa and pc are the access charge and call charges respectively, and pzz refers to the
total expenditure on all other goods and services. By aggregating all individual demand
for calls in the entire telecommunications market, the total demand for calls, Q, can be
expressed as:
188

Q = f(pa, pc, pz, N, Y) (8.3)
where N and Y represent the size of network and gross income respectively.
From Equation (8.3), a basic model of the demand for telecommunications,
which is a function of a set of composite prices, income and the size of network, can be
formulated. Assuming the demand curve for telecommunications service in a log-linear
form, Equation (8.3) can be re-expressed as:
(8.4) 43210 ααααα YNPPeQ ca=
where Pa and Pc are the access and call charges divided by the consumer price index
(CPI) respectively (and therefore internalizing the prices of other goods and services in
the model), N is the size of the network, Y is gross income deflated by the CPI, and α0,
α1, α2, α3 and α4 are the parameters to be estimated.
There has been some recent works which focus on estimating the growth of
mobile telephony (Madden and Coble-Neal, 2004; Madden, Coble-Neal and Dalzell,
2004). Madden and Coble-Neal (2004) expressed the utility of a telephone network
subscriber with income Y and a network of size N, as u(Y, NF, NM) where NF and NM
represent the number of fixed-line and mobile phone network subscribers respectively.
The equilibrium mobile telephony network size was then given as:
lnNMt = μ + α lnλt + β lnYt (8.5a)
lnNMt = μ + α lnλt + β lnYt + δ lnNFt (8.5b)
where λt is the price of subscription for fixed line and mobile services.3 Equation (8.5a)
estimates the demand for telecommunications by examining the factors affecting the
growth of mobile telephony. Equation (8.5b) examines the substitution effect between
fixed-line and mobile telephony by including the network size (or subscriber base) of
the former in the model. The models derived from Equations (8.4) and (8.5) are relevant
3 See Madden and Coble-Neal (2004: 521) for the meaning and derivation of μ and λt.
189
to this dissertation in determining the demand functions to be estimated for China’s
telecommunications market in section 8.3.
8.2.2 Demand for computers
Attempts to estimate the demand for computers went back to the 1960s when Gregory C.
Chow estimated a demand equation of ‘US-made general-purpose digital computers’ for
the period of 1955-65, which was to be used for forecasting (Chow, 1967). Using a
Gompertz growth curve that shows how computer users adjust their computers to an
equilibrium level, which is constantly moved upward due to the price of computers
falling by about 20% per year, Chow obtained an estimate of the price elasticity of
demand to be -1.44.
The demand function for computers has also been estimated by Brynjolfsson
(1994) and Stavins (1997). Brynjolfsson (1994) estimated the demand function for
computers based on the Marshallian and Exact consumer surplus calculations. Using
data of eight sectors on ‘office, computing and accounting machinery’ (OCAM) in the
US from 1970 to 1990, the author estimated the price elasticity of -1.33, and income
elasticity of 3.45. Stavins (1997) estimated the demand elasticity for US personal
computers from 1976 to 1988. Using the two-stage least squares (2SLS) estimation
method, the price elasticity of demand averaged -6.3, ranging from -2.9 in 1977 to -7.2
in 1988.
Other works have focused on the determinants of demand for computers
(Pohjola, 2003; Chinn and Fairlie, 2004). Pohjola (2003) reviewed the determinants of
the cross-country diffusion and adoption of ICT, and estimated a statistical model to
identify the most important determinants of real spending on computer hardware per
capita in a panel of 49 countries for the period 1993-2000. He found the most important
determinants of computer use to be the level of income, the relative price of computers
and the stock of human capital. The elasticity of human capital with respect to computer
spending is relatively large, at 2.97-3.02, compared to income elasticity of 0.92-1.08
and price elasticity of -1.10 (Table 8.2). Such results emphasize the importance of
education for the adoption of ICT, as Pohjola suggested a 10% increase in the years of
schooling is associated with a 30% increase in computer spending per capita.
190

Table 8.2: A comparison of price and other elasticity in the computer market Author Country Price elasticity Income
elasticity Human capital elasticity
Chow (1967) Brynjolfsson (1994) Pohjola (2003)
US (1955-65) US (1970-90) 49 countries (1993-2000)
-1.44 -1.33 -1.10
3.45 0.92-1.08
2.97-3.02
In another study, Chinn and Fairlie (2004) identified the determinants of cross-
country disparities in personal computer and Internet penetration by examining a panel
of 161 countries over the period 1999-2001. In contrast to Pohjola (2003) who used the
US price of computers as that for all economies, the authors estimated a reduced form
equation for computer penetration rates, as it was not clear to them that the underlying
structural parameters could be identified since the price index looks similar to a
downward sloping linear trend. As such, Chinn and Fairlie included several sets of
variables, such as economic variables (income per capita, years of schooling, illiteracy,
trade openness), demographic variables (dependency ratio, urbanization rate),
infrastructure indicators (telephone density, electricity consumption),
telecommunications pricing measures and regulatory quality. Their results suggest that
public investment in human capital, telecommunications infrastructure and the
regulatory infrastructure can mitigate the gap in PC and Internet use. This chapter draws
on existing literature to estimate a demand function for the telecommunications and
computer markets in China respectively. The estimation results will generate elasticity
values for the Chinese ICT market with respect to price, income and other exogenous
variables.
8.3 Modeling demand
8.3.1 Modeling demand for fixed-line telecommunications
The telecommunications market has been changing dramatically over the past decades
with the rapid introduction of new services such as the mobile and Internet phone
services. In China, as in other countries, the adoption of new technologies such as the
code division multiple access (CDMA) has created a fast-growing mobile telephony
market since the 1990s. Telecommunications demand is normally described in terms of
191

subscription and usage, which can be defined as access service and call service
respectively (Lee and Lee, 2006). However, subscription usually comes before usage, as
the consumer has to first pay for connection and subscription fees, and purchase
telephone equipment as well, prior to using the services provided by the
telecommunications carrier. This dissertation proposes to use subscription as the proxy
for telecommunications demand. To be more specific, the demand for fixed line and
mobile telephony is estimated separately.
Several factors can be attributed to account for the increase in demand for ICT
services in China. First, telecommunications demand is fuelled by rapid economic
growth which has stimulated increased demand for communications brought about by
rising investment and trade. The rise in demand for computers is also attributed to rising
income and educational standards of the population. The decline in phone connection
charges and falling prices of telecommunications and computing equipment has made
ICT services more affordable and accessible to a greater segment of China’s population.
As a measure of the aggregate size of the telecommunications market in China,
both fixed-line and mobile subscribers are used as the dependent variable in different
models. A general form of the demand equation based on the framework of Lee and Lee
(2006) is used in this chapter. In order to derive the respective price and income
elasticity of telecommunications demand, a model specified in Equation (8.4) is
transformed into a log-linear form, where the total number of telecom subscribers is
regressed against the price as well as income:
tit
m
ii
tt u
PP
PY
Q +⎟⎠⎞
⎜⎝⎛+⎟
⎠⎞
⎜⎝⎛+= ∑
=
lnlnln1
10 βββ (8.6)
where Qt refers to total telecommunications subscribers (either fixed or mobile), Y/P is
gross domestic product divided by the consumer price index (CPI) in constant prices,
and Pit/P represents the set of prices deflated by the CPI. In this case, in order to take
into account the price trend in China, the ICT hedonic price index obtained from the
US’ Bureau of Economic Analysis is divided by the Chinese CPI in constant prices. To
estimate the demand for fixed-line telephones in China, Equation (8.6) is further re-
written as:
192

lnFSt = α + βlnPt + δ lnYt + ut (8.7)
where lnFSt represents the number of fixed-line subscribers in China, Pt refers to the
ICT price index for China and Yt denotes real GDP per capita in constant prices, while β
and δ are the coefficients which give us the price and income elasticity respectively.
The model can further incorporate control variables that account for dynamic
changes occurring in the Chinese telecommunications market, based on the framework
of Vagliasindi et al. (2006). Both fixed and mobile phone services are increasingly
complemented by the use of Internet which is accessible not only through the fixed
network, but now with enhanced mobiles that offer IP telephony. A dummy variable, Dt
(equals to 1 when Internet usage began in 1994) captures the increasing use of Internet
by Chinese subscribers. By including the dummy variable, the model now takes the
following form:
lnFSt = α + βlnPt + δ lnYt + λDt + ut (8.8)
where Dt = 1 for observations in 1994-2005
= 0, otherwise (i.e. for observations in 1978-1993)
To further test for mobile-fixed substitution effects, the dissertation will also
include mobile subscription in Equation (8.8), which is then re-written as:
lnFSt = α + βlnPt + δlnYt + γlnMSt + λDt + ut (8.9)
where MSt refers to the number of mobile subscribers in China. The inclusion of the
latter may bring about endogeneity in the above model which will be dealt with in the
empirical exercise.
8.3.2 Modeling demand for mobile telecommunications
Next, the chapter goes on to estimate the demand for mobile phones in China. Annual
data for mobile phone subscription is available for the period of 1988-2005, as the
mobile network was introduced in China only from 1987 onwards. A model similar to
that specified by Equation (8.7) is formulated, using the number of mobile phone
subscribers (MSt) as the dependent variable.
193

To reflect the telecommunications reforms that took place in China during the
1990s, a dummy variable is introduced for the competition resulting from the first
break-up of China Telecom in 1999. Competition was further intensified in 1999 when
China Unicom was given the privilege to compete against the incumbent China Mobile
by giving 10 per cent discounts on prices offered by the latter (Lu and Wong, 2003: 46).
Therefore, a dummy variable, Dt (equal to 1 if there is more than one operator in the
market) captures the presence of competition in the telecommunications market. The
demand for mobile phones is then expressed as:
lnMSt = α + βlnPt + δ lnYt + λD2 + ut (8.10)
where Dt = 1 for observations in 1999-2005
= 0, otherwise (i.e. for observations in 1988-1998)
To further test for the presence (or absence) of fixed-mobile substitution effects,
the framework of Vagliasindi et al. (2006) is also applied in the model, by adding the
number of fixed-line subscribers as an explanatory variable. The model described in
Equation (8.10) is re-expressed as:
lnMSt = α + βlnPt + δ lnYt + γlnFSt + λDt + ut (8.11)
where MSt is dependent on price (Pt) which is given by the ICT hedonic price index
deflated by the Chinese CPI as in Equation (8.6), real income per capita in constant
prices (Yt) and fixed-line subscription (FSt), while β, δ and γ are the parameters to be
estimated. Again, the inclusion of the latter may bring about endogeneity in the above
model which will be dealt with in the empirical exercise.
8.3.3 Modeling demand for computers
Stavins (1997) specified the utility function of a computer consumer, assuming that
each consumer, i, chooses a computer model, m, to maximize his utility, uim, which is
positively related to the quantity of embodied characteristics, zm, and negatively related
to the model price, Pm, such that:
uim = δi zm - αPm + εim (8.12)
194

where δi represents the consumer’s valuation of quality of that model, and εim is a
random component.
Chow (2002) has estimated a model for forecasting demand for computers in
China. The model, however, looks at only the effect of price and income on the demand
for computers, but it does not take into account other factors that have been discussed in
some literature, such as the level of education, trade openness and infrastructure
indicators such as telephone density and electricity consumption (Pohjola, 2003; Chinn
and Fairlie, 2004).
Demand for computers is assumed to be a derived demand from firms and a
final demand from consumers (Chinn and Fairlie, 2004: 8). To integrate both forms of
demand into an estimation model for the computer industry in China, we first look at
the various factors identified in Chinn and Fairlie (2004) as the determinants of
computer use. Owing to limited data available that can be used as an indicator of
computer demand, and taking into account the utility function in Equation (8.12), the
demand model for computers is specified as follows:
lnCt = α + βlnPt + δlnYt + μt (8.13)
where the dependent variable, Ct, is taken to be the sales volume of computers, which is
influenced by price (Pt) and income (Yt). The sales volume of computers is also used as
an indicator of demand in a presentation by the State Science and Technology
Commission of China.4 One problem that arose is that an adequate time series data on
sales of computers is not available from statistical sources. However, in an analysis on
the supply side statistics of China’s ICT products, Katsuno (2005) has shown that sales
of PCs (desktops and laptops) are approximately close to their production volume
during the period of 1998-2001. Since a time series data on the production of PCs is
available from China Statistical Yearbook for the period of 1990-2005 (see Figure 2.8
in Chapter 2), it shall be used as a proxy for computer sales.
4 A powerpoint presentation by Mr Wu Yingjian, Director of Torch High Technology Industry Development Center, Ministry of Science & Technology of China. See http://www.ercim.org/ HPCN/docs/B4.pdf
195

As data on the price of computers in China is not available, the model uses the
ICT hedonic price index obtained from Chapter 5. The choice of using the US computer
price index is based on the assumption that computer prices are the same in all countries,
owing to the global nature of the computer market and competitiveness of the computer
industry (Pohjola, 2003). Yt is real GDP per capita in 1978 constant prices. To test the
robustness of the model, a dummy variable, Dt, which reflects the use of Internet, and
thus taking on the value of one from 1994 onwards is added to Equation (8.13). The
estimation model would now look like:
lnCt = α + βlnPt + δlnYt + ηDt + εt (8.14)
where Dt = 1 for observations in 1994-2005
= 0, otherwise (i.e. for observations in 1990-1993)
8.4 Data issues
As shown in Figure 2.4 of Chapter 2, the mobile penetration rate exceeded that of the
fixed telephone in 2003. Figure 8.1 further shows that the mobile phone market has
grown much more rapidly compared with the fixed line market as well as the national
output since its inception in the Chinese market in 1988. It has been established in
theory that ‘the growth of mobile can be expected to cause an initial increase in fixed
network traffic (due to complementarities) and subsequently a decline in the fixed
network (due to substitution effects ) (Vagliasindi et al., 2006). Therefore it would be
interesting to test whether such a case has occurred in China. To propose a model that
captures the substitution effect depends on the choice of a dependent variable which can
be used as a measure of telecommunications demand. One common proxy of
telecommunications demand is the usage of telecom services. Yang and Olfman (2006)
discussed two dimensions of telecommunications usage, that is, the actual traffic or
traffic intensity, measured in number of calls going through a network; and the number
of lines or subscribers registered on the network which reflects the availability of
telecom infrastructure or the size of the market. The call traffic was used as a dependent
variable in Das and Srinivasan (1999), but such data is unavailable in Chinese statistical
sources.
196

197
Annual data for fixed line and mobile subscription are obtained from China
Statistical Yearbook and the Ministry of Information Industry website, which is
available for the period of 1978 to 2005. Data for access charges and call charges is not
available from any Chinese statistical sources. Therefore the dissertation will use the
ICT hedonic price index obtained from the US national accounts as a proxy variable for
price. The application of this principle is based on the assumption that Chinese
machines are manufactured using foreign technology and therefore any pattern of price
changes should resemble that of the US. The demand curve for Chinese
telecommunications is assumed to be downward sloping, reflecting a market that is
facing increased demand and decline in prices. This assumption is made since the
introduction of competition into the mobile (as well as fixed line in 2001) telephony
market has provided incentives for carriers in China to lower prices. The negative
correlation between pricing and the fixed-line as well as mobile phone markets are
illustrated in Figures 8.2 and 8.3 respectively.
A positive relationship between income (measured in terms of either gross GDP
or GDP per capita) and telecommunications demand is expected, as greater income
implies greater affordability to subscribe to a phone service (Madden, Coble-Neal and
Dalzell, 2004). This proposition is well illustrated in Figure 8.4 which shows that both
the fixed line and mobile subscription have generally increased in tandem with rising
income in China, with the mobile market expanding at a much faster pace. Income
(GDP) is expressed in real terms, deflated by the consumer price index in constant
prices obtained from China Statistical Abstract 2006.
The total demand for telecommunications services constitutes residential and
industrial demand. However, no separate data are available for residential and industrial
telecommunications. Therefore the demand model is based on a single equation. Data
available from China Statistical Yearbook and the Ministry of Information Industry
(MII) website suggests that either the expansion of local switchboard capacity or the
number of phone subscribers could be used as an indicator of the demand for telecom
services as it reflects the expanding subscriber base and increasing complexity of the
telecom market. Data for the number of phone subscribers can be obtained from Lu and
Wong (2003) and China Statistical Abstract 2006. Data for all variables is available for
the period 1978-2005, whereas that of mobile phone subscription only appeared from
1988 onwards.

Figure 8.1 Growth rate of fixed-line, mobile and GDP in China, 1979-2005
-20
0
20
40
60
80
100
120
140
1979 1981 1983 1985 1987 1989 1991 1993 1995 1997 1999 2001 2003 2005
%
Fixed line growth Mobile growth GDP growth
Source: State Statistical Bureau, China Statistical Yearbook, Yearbook of China’s Electronics Industry and China Statistics Yearbook on High Technology Industry (various issues).
198
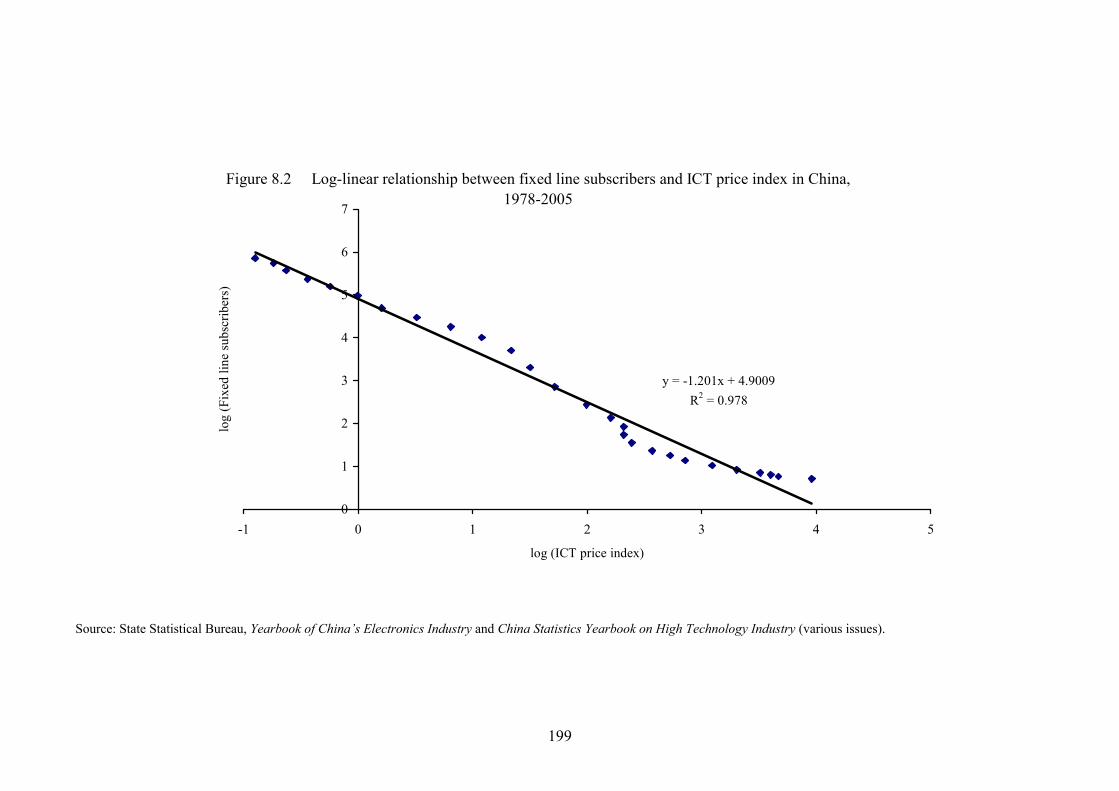
Figure 8.2 Log-linear relationship between fixed line subscribers and ICT price index in China, 1978-2005
y = -1.201x + 4.9009R2 = 0.978
0
1
2
3
4
5
6
7
-1 0 1 2 3 4 5
log (ICT price index)
log
(Fix
ed li
ne su
bscr
iber
s)
Source: State Statistical Bureau, Yearbook of China’s Electronics Industry and China Statistics Yearbook on High Technology Industry (various issues).
199

Figure 8.3 Log-linear relationship between mobile subscribers and ICT price index in China, 1988-2005
y = -3.0356x + 4.1825R2 = 0.9465
-6
-4
-2
0
2
4
6
8
-1.5 -1 -0.5 0 0.5 1 1.5 2 2.5
log (ICT price index)
log
(Mob
ile su
bscr
iber
s)
Source: State Statistical Bureau, Yearbook of China’s Electronics Industry and China Statistics Yearbook on High Technology Industry (various issues).
200

Figure 8.4 Correlations between fixed-line subscription, mobile subscription, and income per capita in China (1978-2005)
-8
-6
-4
-2
0
2
4
6
8
10
1978 1980 1982 1984 1986 1988 1990 1992 1994 1996 1998 2000 2002 2004
log
Fixed line Mobile GDP per capita
Source: State Statistical Bureau, Yearbook of China’s Electronics Industry and China Statistics Yearbook on High Technology Industry (various issues).
201

202
8.5 Estimation results
8.5.1 Estimation results for fixed-line telecommunications demand
The chapter begins with estimating the demand for fixed line telephone market, using
annual data for the period of 1978-2005. The initial estimates of the parameters
specified by Equations (8.8) and (8.9) are presented in Table 8.3. The first model
specification (1) includes Internet use as the dummy variable, as described by Equation
(8.8). The estimation results show price and Internet use to be statistically significant all
levels, but not income. As the Durbin’s d-statistic of 0.4406 is less than dL = 1.181,
there is evidence of positive first-order serial correlation at all levels of significance.
Therefore, a corrective measure using the Cochrane-Orcutt Method is proposed to
specification (1) above. The test result shows no conclusive evidence of the presence of
positive first-order serial correlation as the d-statistic of 1.2712 lies between dL = 0.933
and dU = 1.696. In this model specification (2), income is found to be statistically
significant at the 10% level.
Next, the estimates based on Equation (8.9) which includes mobile subscription
as an explanatory variable to test for mobile-fixed substitution effects is obtained, i.e.
specification (3). Note that in this case, there are only 18 observations (against 28 in the
previous two model specifications) as mobile subscription only started in 1988.
Compared with specification (1), all explanatory variables except the intercept term in
(3) are statistically significant at the 5% level or lower, but the d-statistic of 0.9112 is
below dL = 0.933, suggesting evidence of a positive first-order serial correlation.
Therefore, the model is further tested by including both mobile subscription and the
dummy variable for Internet use into Equation (8.9), specified as (5). All explanatory
and dummy variables are found to be statistically significant at all levels. There is no
evidence of positive first-order serial correlation at all levels of significance as the d-
statistic of 2.1772 is greater than dU = 1.604.

203
Table 8.3 Estimation results: fixed-line telephone demand
Model specification Explanatory Variables (1) OLS (2) GLS (3) OLS# (4) OLS# (5) GLS# (6) OLS#
Constant Price Income per capita Mobile subscription Mobile subscription (lagged) Dummy Internet use R2
Adjusted R2
Standard Error Observations Durbin-Watson statistic
2.1092 (0.533) -0.6694*** (-3.850) 0.1532 (0.280) - 0.7012*** (4.037) 0.9898 0.9885 0.1986 28 0.4406
0.2765 (0.149) -0.8027*** (-8.885) 0.4365* (1.699) - 0.1676** (2.368) 0.9990 0.9989 0.0621 28 1.2712
0.2462 (0.188) -0.5029*** (-6.757) 0.4535** (2.476) 0.1326*** (6.383) - 0.9987 0.9984 0.0590 18 0.9112
-1.1438 (-1.502) -0.4817*** (-11.695) 0.6340*** (5.995) 0.0977*** (7.545) 0.2088*** (5.750) 0.9996 0.9995 0.0325 18 2.1772
-1.3087 (-1.599) -0.4799*** (-12.623) 0.6562*** (5.770) 0.0946*** (5.817) 0.2228*** (5.649) 0.9996 0.9994 0.0349 18 2.0495
-0.5477 (-0.616) -0.4032*** (-7.879) 0.5653*** (4.610) - 0.1328*** (5.716) 0.1601*** (3.528) 0.9996 0.9994 0.0332 17 2.3227
Note: Figures in parentheses are the t-ratios. *, ** and *** indicate significance at 10%; 5% and1%. # The observed time series period for model specifications (3)-(5) is 1988-2005, as they take into account the mobile subscription which started only in 1988.

A final modification to specification (4) by using the Cochrane-Orcutt method
produced similar results. However, specification (4) is preferred as it has the lowest
standard error of regression and the highest value of d-statistic among all of the
specifications. Based on specification (4), this study reveals the price and income
elasticity of fixed line demand in China to be approximately -0.5 and 0.63 respectively.
The price elasticity is found to be exceptionally low even when compared with that of
developed countries, while income elasticity is lower than that of India, but slightly
higher than those of developed countries (see Table 8.1).
Due to inconclusive evidence concerning the presence of positive first-order
serial correlation in model specifications (1), (2) and (3) based on the d-statistic, another
test, the Breusch-Godfrey (BG) test is conducted using EView 5.0. For specifications (1)
and (2), the null hypothesis of no serial correlation is rejected at all levels of
significance. For specification (3), the test statistic of χ2(1) = 5.3301 (with p-value of
0.021) is obtained, suggesting that the null hypothesis of no serial correlation is rejected
at 5%, but not rejected at 1% level of significance.
In addition, the regression models are tested for structural stability by
introducing interactive dummy variables. Equations (8.8) and (8.9) are respectively
expressed as:
lnFSt = α + βlnPt + δ lnYt + λ1 DPt + λ2 DYt + ut (8.15)
and lnFSt = α + βlnPt + δlnYt + γlnMSt + λ1 DPt + λ2 DYt + λ3 DMSt + ut (8.16)
where Dt = 1 for observations in 1994-2005
= 0, otherwise (i.e. for observations in 1978-1993)
All of the interactive dummies are found to be statistically insignificant at all levels, and
therefore the null hypothesis of no structural change is not rejected.
To take into consideration of potential endogeneity in specifications (3), (4) and
(5), a one-lagged period of mobile phone subscription (MSt-1) and a dummy variable for
Internet usage ( ) are included as explanatory variables in the regression model as
follows:
tD1
204

tttttt uDMSYPFS +++++= − 1413210 lnlnlnln ααααα (8.17)
where D1t = 1 for observations in 1994-2005
= 0, otherwise (i.e. for observations in 1978-1993)
As shown in Table 8.3 as model specification (6), there is no evidence of
positive first-order serial correlation at all levels of significance as the d-statistic of
2.3227 is greater than dU = 1.900. This test has found all variables to be statistically
significant at all levels, including the dummy variable for Internet usage, except the
constant term.5
8.5.2 Estimation results for mobile telecommunications demand
Next, to estimate the demand for mobile phone market in China, a preliminary
regression is run, based on Equation (8.10) that uses competition introduced in 1999 as
the dummy variable. The estimation results are presented in Table 8.4. Shown as model
specification (1) in Table 8.4, all explanatory as well as the dummy variables are found
to be statistically significant as all levels. However, there is no conclusive evidence of
the presence of positive first-order serial correlation as the d-statistic of 1.1311 lies
between dL = 0.933 and dU = 1.696. To correct for the problem of serial correlation, the
Cochrane-Orcutt method is used, specified as (2). The d-statistic of 1.2811 is obtained,
which still points to indecision concerning the presence of positive first-order serial
correlation.
Finally, the variable of fixed-line subscription is added to the model specified by
Equation (8.11). Based on the OLS estimates, the income variable has become
statistically insignificant in model specification (3). The GLS in specification (4)
corrects for serial correlation, but income is still insignificant. Therefore, as a final
measure, the dissertation includes both fixed-line subscription and Internet use as a
dummy into the model. As a result, all of the explanatory and dummy variables in
model specification (5) are found to be statistically significant, although income is
5 Note that tests for unit root and stationarity are not considered for all empirical exercises in this chapter due to the fact that the results are potentially sensitive to the small sample size which is a limitation of this study. Owing to the limited number of observations, unit root tests would be unreliable with small sample sizes.
205
significant only at the 10% level. Therefore, specification (5) is preferred and will be
used for projection of the demand for mobile phone in China.
Even though specification (5) has the highest d-statistic of 1.5266, there is still
no conclusive evidence of a positive first-order serial correlation, as it lies between dL =
0.820 and dU = 1.872. The standard error of regression in (5) is also the lowest among
all of the specifications. Using specification (5) as the reference model, the price and
income elasticity with respect to mobile phone market in China are thus estimated to be
-0.67 and 1.12 respectively. As the elasticity values are higher in comparison with those
of the fixed-line market, it can be concluded that consumers in the mobile market are
more sensitive to changes in price and income. Higher income elasticity in the mobile
phone market could suggest that Chinese consumers would switch over to using the
mobile phone when affordability is no longer a problem with the improvement in living
standards and increase in income. On the other hand, for any increase in the price level,
consumer would exercise caution on the use of mobile phones, thus making calls on the
fixed-line telephone more often instead.
Due to inconclusive evidence concerning the presence of positive first-order
serial correlation in model specifications (1) to (5) based on the d-statistic, another test,
the Breusch-Godfrey (BG) test is conducted using EView 5.0. The null hypothesis of no
serial correlation is rejected at all levels of significance for specification (3), whereas for
specification (1), the test statistic of χ2(1) = 2.9287 (with p-value of 0.087) is obtained,
suggesting that the null hypothesis of no serial correlation is rejected at 10%, but not
rejected at 5% level of significance. It is proven serial correlation is absent in
specifications (2), (4) and (5) at all levels of significance.
In addition, the regression models are tested for structural stability by
introducing interactive dummy variables. Equations (8.10) and (8.11) are respectively
expressed as:
lnMSt = α + βlnPt + δ lnYt + λ1 DPt + λ2 DYt + ut (8.18)
and lnMSt = α + βlnPt + δlnYt + γlnFSt + λ1 DPt + λ2 DYt + λ3 DFSt + ut (8.19)
where Dt = 1 for observations in 1999-2005
206

207
tttttt uDFSYPMS +
As shown in Table 8.4 as model specification (6), there is no conclusive evidence of
positive first-order serial correlation as the d-statistic of 1.6997 lies between dL = 0.779
and dU = 1.900. This test has found all variables to be statistically significant at all
levels, including the dummy variable for mobile competition, except the constant term.
Using the Breusch-Godfrey test, the test statistic of χ2(1) = 0.0584 (with p-value of
0.809) is obtained, suggesting that the null hypothesis of no serial correlation is not
rejected at all levels of significance.
Some other phenomena can also be observed from the regression obtained in
Tables 8.4 and 8.6. Competition and Internet usage have a significant impact on the
mobile phone and fixed-line market respectively. The opening up of the telecom market
to competition has further brought about an increase in consumer choices where the
mobile and Internet services are concerned. Consumers are also more likely to be
attracted to interactive mobile services such as the SMS and MMS, and more recently
the mobile Internet games. Such effects can be attributed to the presence of network
externalities.
= 0, otherwise (i.e. for observations in 1978-1998)
To consider potential problems with endogeneity in specifications (3), (4) and (5)
in Table 8.4, a one-lag period of fixed-line subscription (FSt-1) and a dummy variable
for mobile competition (D2t) are included as explanatory variables in the regression
model as follows:
All of the interactive dummies are found to be statistically insignificant at all levels, and
therefore the null hypothesis of no structural change is not rejected.
= 0, otherwise (i.e. for observations in 1988-1998)
where D2t = 1 for observations in 1999-2005
++++= − 2413210 lnlnlnln α α α α α (8.20)

Model specification Explanatory variables (1) OLS (2) GLS (3) OLS (4) GLS (5) OLS (6) OLS Constant Price lncome Fixed-line subscription Fixed line subscription (lagged) Dummy First divestiture of China Telecom R2
Adjusted R2
Standard Error Observations Durbin-Watson statistic
-23.6708*** (-8.017) -0.9039*** (-16.140) 3.6481*** (9.013) - - 0.8800*** (3.943) 0.9970 0.9964 0.2335 18 1.1311
-22.5593*** (-5.923) -1.2026*** (-3.618) 3.5454*** (7.039) - - 0.3940* (1.876) 0.9980 0.9973 0.1846 18 1.2811
-9.9346** (-2.263) -0.5446*** (-8.491) 0.8532 (1.119) 1.5958*** (5.492) - - 0.9980 0.9976 0.1910 18 0.7349
-11.3727* (-1.988) -0.5708* (-1.984) 1.1659 (1.141) 1.4003*** (2.965) - - 0.9985 0.9980 0.1591 18 1.1888
-10.3335*** (-3.052) -0.6650*** (-10.768) 1.1223* (1.891) 1.2011*** (4.715) - 0.5203*** (3.251) 0.9989 0.9986 0.1472 18 1.5266
-12.2226 (-3.433)*** -0.8221 (-12.412)*** 1.6610 (2.861)*** - 0.7931 (3.617)*** 0.6271*** (3.470) 0.9984 0.9978 0.1656 17 1.6997
Note: Figures in parentheses are the t-ratios. *, ** and *** indicate significance at 10%; 5% and1%.
208
Table 8.4 Estimation results: mobile telephone demand

8.5.3 Estimation results for computer demand
The demand for computers in China is estimated using the time series data for the
period of 1990-2005. The initial estimates of the parameters in Equation (8.13) are
presented as specification (1) in Table 8.5. Price and income are statistically significant
at the 5% level. With a Durbin d-statistic of 0.981 which is lower than dL = 0.982, there
is evidence of a positive first-order serial correlation. The GLS estimates in
specification (2) raised the value of d-statistic to 1.6159, which is greater than dU =
1.539, hence providing no evidence of serial correlation. However the explanatory
variables have become statistically significant only at the 10% level.
Therefore, the dummy variable for Internet use is added to the model, specified
from Equation (8.14). The estimation results are generated as specification (3) in Table
8.5. The dummy variable is shown to be statistically insignificant. In this case, there is
no conclusive evidence of the presence of positive first-order serial correlation as the d-
statistic of 1.1073 lies between dL = 0.857 and dU = 1.728. Given that specification (2)
has the highest d-statistic and the lowest standard error of regression), it is chosen to
estimate price and income elasticity, since Dt can be omitted from the model. This study
therefore estimates the price and income elasticity to be approximately -0.9 and 2.9
respectively, which are lower than those of the US in the 1990s.
Table 8.5 Estimation results: computer demand
Model specification Explanatory variables (1) OLS (2) GLS (3) OLS Constant Price Income per capita Dummy Internet use R2
Adjusted R2
Standard Error Observations Durbin-Watson statistic
-19.2730** (-2.230) -0.8462** (-2.364) 2.6705** (2.210) - 0.9765 0.9729 0.3737 16 0.9810
-20.8572* (-1.776) -0.8818* (-1.733) 2.8736* (1.751) - 0.9817 0.9767 0.3311 16 1.6159
-16.7017* (-1.833) -1.0333** (-2.510) 2.3404* (1.851) -0.3515 (-0.935) 0.9781 0.9727 0.3755 16 1.1073
Note: Figures in parentheses are the t-ratios. *, ** and *** indicate significance at 10%; 5% and1%.
209

By running the Breusch-Godfrey (BG) test on EView 5.0, conclusions on the
presence or absence of serial correlation can be reached. The null hypothesis of no serial
correlation is not rejected at all levels of significance for specification (2). For
specifications (1) and (3), the respective test statistics of χ2(1) = 3.4618 (with p-value of
0.063) and χ2(1) = 3.4324 (p-value of 0.064) are obtained, suggesting that the null
hypothesis of no serial correlation is rejected at 10%, but not rejected at 5% level of
significance.
Finally, the regression models are tested for structural stability by introducing
interactive dummy variables. Equation (8.14) is re-expressed as:
lnCt = α + βlnPt + δ lnYt + λ1 DPt + λ2 DYt + ut (8.21)
where Dt = 1 for observations in 1994-2005
= 0, otherwise (i.e. for observations in 1990-1993)
All of the interactive dummies are found to be statistically insignificant at all levels, and
therefore the null hypothesis of no structural change is not rejected.
8.6 Projection of ICT demand
With the estimation results derived in the preceding section, the next focus of the
chapter is to project demand for the ICT market in China, namely, the fixed-line, mobile
and computer markets. Lanning et al. (1999) attempted to forecast demand for
telecommunications capacity. They present an alternative approach to the study of
telecommunications demand by building aggregate estimates for demand based on the
elasticity of demand for bandwidth. The same principle is applied to computer hardware
and software usage that is experiencing consistent growth in computing power.6 With
high demand elasticity in the ICT industry, as experienced in China, a drop in prices
would lead to a jump in consumer demand at a greater magnitude. Firms will have the
incentive to innovate since the fall in prices does not undermine their profits.
6 According to Moore’s Law, the computing capacity of microprocessors double every 18 months; whereas in optics, bandwidth capacity doubles every 12 months (Lanning, et al., 1999:5).
210

Chow (2002) presented a study on forecasting the demand for personal
computers in China for the period of 1997-98 due to limited data available, using a
mathematical model adapted from his earlier work, Chow (1967). For the purpose of
forecasting computer demand in China up to the year 2015, Chow used three income
elasticity estimates – the low 0.7988 estimate based on the mature US market, the high
1.693 estimate based on the Chinese new market, and the average 1.246 of the two.
8.6.1 Forecasting telecommunications demand
Projections of demand will be made separately for the fixed-line and mobile phone
markets. In the existing literature, two methods could generally be applied for
forecasting. First, the approach suggested by Lanning, et al. (1999) is based on
estimates of the elasticities. A comparison of price and income elasticities derived for
developed and developing countries can be used as a guide to impose the upper and
lower limits of demand elasticity with respect to telecommunications and computer
respectively. Based on this approach, the price elasticity of fixed-line
telecommunications could range from -0.465 to -0.475 for the low-growth, base case
and high-growth scenarios respectively; and income elasticity is estimated to range from
0.48 to 0.49 (Table 8.6).
The second approach is based on projected growth rates of the explanatory
variables. Price is estimated to decline at rates of 15-19% p.a., based on its average rate
of decline over the past years. The projected income growth is based on the average
growth rate over the past five years (from 2001 to 2005), with GDP growth ranging
from 8% to 10% (Tables 8.7).
It can be noted that projections based on the two approaches outlined above
produce a multitude of combinations. For instance, three projections can be derived
from a combination of high price elasticity with a high, base and low income elasticity
respectively. The same goes for projections based on the estimated growth rate of price
and income. This would create a total of 18 possible scenarios. Therefore, the
dissertation seeks to simplify the assumptions by limiting projections to those that
produce the highest and lowest possible as well as the base case scenarios. This is
defined by H-H, B-B, L-L where H, B and L represent the high, base and low elasticity
or growth rates respectively.
211
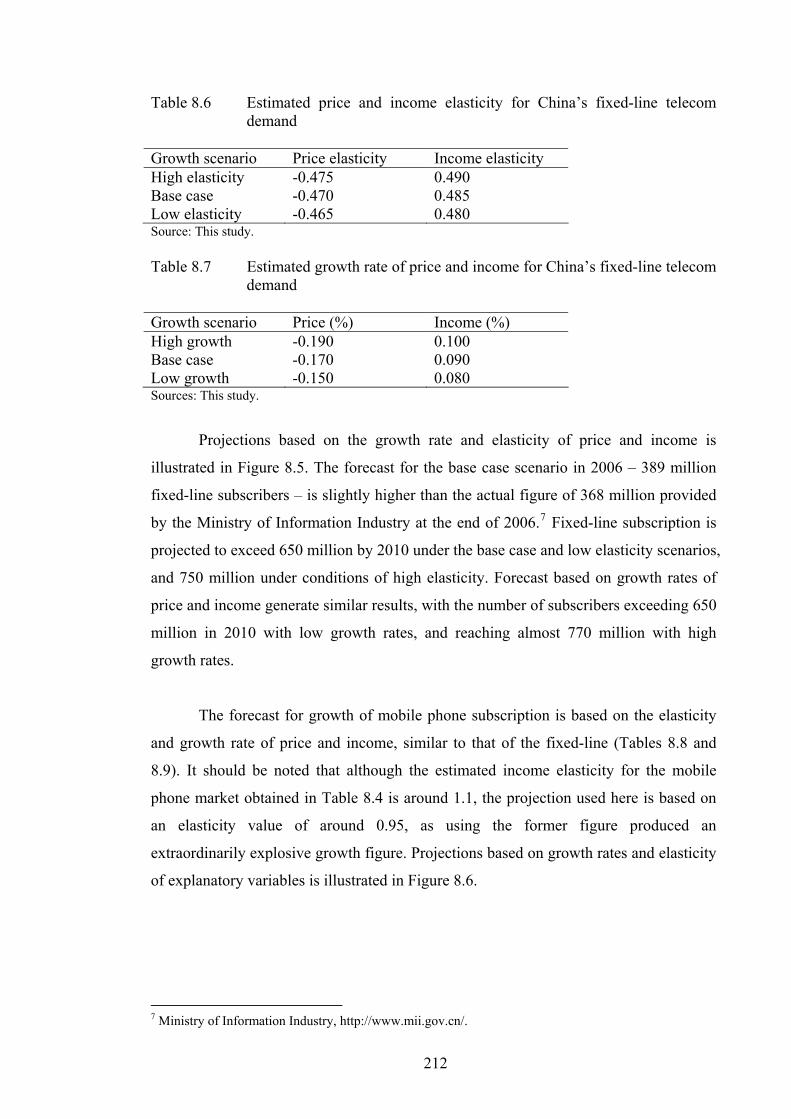
Table 8.6 Estimated price and income elasticity for China’s fixed-line telecom
demand Growth scenario Price elasticity Income elasticity High elasticity -0.475 0.490 Base case -0.470 0.485 Low elasticity -0.465 0.480 Source: This study. Table 8.7 Estimated growth rate of price and income for China’s fixed-line telecom
demand Growth scenario Price (%) Income (%) High growth -0.190 0.100 Base case -0.170 0.090 Low growth -0.150 0.080 Sources: This study.
Projections based on the growth rate and elasticity of price and income is
illustrated in Figure 8.5. The forecast for the base case scenario in 2006 – 389 million
fixed-line subscribers – is slightly higher than the actual figure of 368 million provided
by the Ministry of Information Industry at the end of 2006.7 Fixed-line subscription is
projected to exceed 650 million by 2010 under the base case and low elasticity scenarios,
and 750 million under conditions of high elasticity. Forecast based on growth rates of
price and income generate similar results, with the number of subscribers exceeding 650
million in 2010 with low growth rates, and reaching almost 770 million with high
growth rates.
The forecast for growth of mobile phone subscription is based on the elasticity
and growth rate of price and income, similar to that of the fixed-line (Tables 8.8 and
8.9). It should be noted that although the estimated income elasticity for the mobile
phone market obtained in Table 8.4 is around 1.1, the projection used here is based on
an elasticity value of around 0.95, as using the former figure produced an
extraordinarily explosive growth figure. Projections based on growth rates and elasticity
of explanatory variables is illustrated in Figure 8.6.
7 Ministry of Information Industry, http://www.mii.gov.cn/.
212

Table 8.8 Estimated price and income elasticity for China’s mobile telecom demand
Growth scenario Price elasticity Income elasticity High elasticity -0.620 0.960 Base case -0.615 0.950 Low elasticity -0.610 0.940 Source: This study. Table 8.9 Estimated growth rate of price and income for China’s mobile telecom
demand Growth scenario Price (%) Income (%) High growth -0.190 0.100 Base case -0.170 0.090 Low growth -0.150 0.080 Sources: This study.
The forecast for the base case scenario in 2006 – 470 million mobile phone
subscribers – is slightly higher than the actual figure of 461 million provided by the
Ministry of Information Industry at the end of 2006.8 Mobile subscription is projected
to reach over 950 million by 2010 under the base case and low elasticity scenarios, and
more than 1.1 billion under conditions of high elasticity. Similarly, forecast based on
growth rates of price and income yield projected figures of more than 880 million and
1.1 billion subscribers in 2010 under conditions of low and high growth rates
respectively. A realisation of the high-elasticity or high-growth scenario would mean
that almost every citizen in China would own a mobile phone in 2010.9 The forecast of
this study is consistent with that of another report which projected the total number of
fixed and mobile telephone lines to exceed one billion in 2009.10
8.6.2 Forecasting computer demand
To forecast the demand for computers, using the elasticity approach, the price elasticity
could be estimated to range from -0.86 for the low-growth to -0.9 for the high-growth
scenario; whereas income elasticity is estimated to range between 2.85 to 2.9. The
growth rate for price and income is similar to that used for projection of
telecommunications demand (Tables 8.10 and 8.11).
8 In the first quarter of 2007, mobile subscribers reached 480.65 million in China. See Ministry of Information Industry, http://www.mii.gov.cn. 9 While it is impossible to expect every citizen (which includes dependants aged below 15) to own a mobile phone, this scenario implies that many citizens of working age may own two or more lines. 10 “China – The world’s largest telecom market and more to come”, Online Telecom Reports (May 2006), http://www.hottelecoms.com/cp-article-may2006.htm.
213

214
Table 8.10 Estimated price and income elasticity for China’s computer demand Growth scenario Price elasticity Income elasticity High elasticity -0.900 2.900 Base case -0.880 2.870 Low elasticity -0.860 2.850 Source: This study. Table 8.11 Estimated growth rate of price and income for China’s computer demand Growth scenario Price Income High growth -0.190 0.100 Base case -0.170 0.090 Low growth -0.150 0.080 Source: This study.
Projections based on growth rates and elasticity yield markedly different
scenarios (Figure 8.7). Computer usage is projected to increase from 80 million in 2005
to 106 million in 2006 under the base case scenario.11 By 2010, it is estimated to reach
almost 550 million and exceed 750 million users under conditions of base and high
elasticity; whereas based on the growth rate approach, it is projected to reach almost
700 million users under conditions of high growth rate.
8.7 Conclusion and growth prospects
The demand for telecommunications and computers in China will be shaped by rapid
technological progress that changes the market structure of the entire ICT industry. For
telecommunications demand, the price elasticity is estimated to range between -0.07 and
-0.08 for the fixed-line network, and between -0.47 and -0.67 for mobile phone market;
income elasticity varies between 1.6 and 1.7 for the fixed-line, and between 0.81 and
1.78 for the mobile market. For computer demand, the price elasticity is estimated to be
around -0.10-0.11, whereas income elasticity ranges between 1.89 and 2.10. The
elasticity of human capital with respect to computer demand is found to lie between 6.4
and 7.0. Such results show that rising income and educational attainment, together with
falling prices of telecommunications and computers, will largely increase the appetite of
Chinese consumers for ICT products and services in the foreseeable future. The forecast
of demand for telecommunications and computers in China is based on two approaches
11 Unlike telecommunications demand, the actual figure for computer usage in 2006 was not available at the time of writing this dissertation, and therefore no comparison with the projected figure could be made.

Figure 8.5 Forecast of China's fixed-line telephone demand, 2005-2010
300
350
400
450
500
550
600
650
700
750
800
2005 2006 2007 2008 2009 2010
Mill
ion
subs
crib
ers
Base growth High growth Low growth Base elasticity High elasticity Low elasticity
Note: Complete lines represent projections based on growth rate; dotted lines represent those based on elasticity.
215

Figure 8.6 Forecast of China's mobile telephone demand, 2005-2010
300
400
500
600
700
800
900
1000
1100
1200
2005 2006 2007 2008 2009 2010
Mill
ion
subs
crib
ers
Base growth High growth Low growth Base elasticity High elasticity Low elasticity
Note: Complete lines represent projections based on growth rate; dotted lines represent those based on elasticity.
216

Figure 8.7 Forecast of China's computer demand, 2005-2010
0
100
200
300
400
500
600
700
800
2005 2006 2007 2008 2009 2010
Mill
ion
units
Base growth High growth Low growth Base elasticity High elasticity Low elasticity
Note: Complete lines represent projections based on growth rate; dotted lines represent those based on elasticity.
217
– the growth rates and elasticity of the explanatory variables. The number of
telecommunications subscribers (including both fixed-line and mobile telephony) is
projected to hit one billion in 2007, while computer sales is estimated to exceed one
trillion yuan by 2010.
There is optimism surrounding the future of the ICT market in 2005-6 for China,
and the Asia-Pacific region in general, driven by the boom in China as well as India.
For instance, both countries are expected to account for 42% of total ICT spending in
Asia-Pacific excluding Japan, with China dominating 33% of the market share.12 This
will provide opportunities for business outsourcing to these countries in the area of ICT
planning, education and training, especially in software application and systems
implementation, as well as human resources, accounting, logistics and risk
management.13 The telecommunications services market will also be driven by growth
in Internet Protocol (IP), broadband and wireless services.14
Following China’s entry into the WTO, and preparation for the 2008 Beijing
Olympic Games, there are strong prospects for the greater adoption of ICT in the years
ahead. Growth in the ICT market will be boosted by strong domestic demand for
telecommunications and computer services.15 A steady growth in the ICT market will
be driven by China’s strong economic growth, the emphasis on e-government (with the
State becoming the biggest ICT spender), the continuous inflow of foreign direct
investment, the potential role of the small and medium-sized cities in alleviating the
pressure of overheating hardware investment in the big cities where the overcapacity of
telecommunication networks have suppressed market demand, and the rise in
importance of the small and medium business market (Liu, 2004a). However, the fact
that the growth rate of fixed-line as well as mobile telecommunications has been
declining in recent years suggests that the Chinese telecommunications market is
approaching maturity, which may occur after 2008.
There is a broad consensus that China’s ICT industry will face a turning point
and achieves maturity in 2008 when the revenue from software and ICT services is
12 “India, China to be technology leaders of 2005”, Knight Ridder Tribune Business News (Washington: January 1, 2005). 13 Ibid. 14 “India, China growth rates may propel IT spending in Asia-Pacific region”, Businessline (Chennai: January 2, 2005). 15 “IT market to see steady growth”, China Daily (Beijing: February 28, 2002).
218

predicted to account for more than half of the total ICT market, surpassing that of the
hardware. Another sign of maturity can be seen from the unbundling of software and
ICT services from hardware, i.e. they are no longer offered free-of-charge.16 A final
point to note is that, the concern with overheating of the Chinese economy in the recent
years, in the view of International Data Corporation (IDC), will not have much impact
on the ICT industry, as those affected industries (such as the real estate, steel &
aluminium as well as a few other manufacturing industries) ‘account for only a small
proportion of ICT spending in China’. China’s continued moves toward a market-driven
economy, led by increasing ICT investments in the private sector will further increase
productivity and strengthen its competitiveness internationally.17
16 “Analyst predicts IT sector will mature by 2008”, China Daily (Beijing: November 11, 2004). 17 “IDC expects minimal impact on China IT spending following economic policy shifts”, World IT Report (London: June 21, 2004).
219

Chapter 9
CONCLUSION
This chapter serves as the concluding part of the dissertation. It begins by summarizing
the empirical findings related to the impact of ICT on the Chinese economy. Next, it
discusses the prospects for development of the ICT sector in China in the near future, in
particular development outlook for the post-WTO era. Finally, the chapter will briefly
outline those factors that will remain crucial for the future development of ICT in China.
9.1 Summary of findings
The role of ICT as a driver of productivity growth in many countries, especially those of
the developed world has been ascertained. Although there is evidence to suggest that the
continued surge in productivity growth will remain with increased investment in ICT,
the recent drop in productivity growth in the US has raised some questions over how
long such a strong productivity growth can be sustained in ‘old economies’ like the US
which may be reaching their limits in terms of innovation and diffusion of technology
(Atkinson, 2006). However, in the case of China, it may just be the beginning of a
period of strong productivity growth driven by increased investment in ICT, especially
in innovative investment, as proven empirically in the dissertation.
The salient features of findings in this dissertation are summarized as follows.
First, the ICT capital stock of China is estimated to be valued at more than 730 million
yuan in the initial year of 1983, based on an assumed depreciation rate of 15%; and it
grew at almost 20% on average over the past two decades, which is about twice the
growth rate of GDP. Second, ICT capital is proven to be a positive driver for the
Chinese economy, and is estimated to contribute about 25% to the country’s economic
growth, although the percentage varies at different periods. Although non-ICT capital is
still the dominant factor input to China’s economic growth, the contribution of ICT and
TFP has become increasingly important in the first few years of this century.
Third, ICT is found to have a positive and significant impact on technical
efficiency in China. However, a wide disparity still exists as far as the impact on
individual region or province is concerned. The gap between the eastern and western
regions in terms of technical efficiency scores is found to be very wide. This is due to
220

the bulk of ICT investment being pumped into the municipal cities and coastal
provinces. On the whole, however, technical efficiency resulting from ICT investment
has been gradually rising over the past few years for all regions.
Lastly, the dissertation has produced some projections of demand for the
telecommunications (fixed line and mobile) and computer markets in China. Using data
that is obtained from Chinese statistical sources, several model specifications are tested
to derive estimates of the price and income elasticity with respect to each of these
markets. Assuming three different scenarios of the base case, low and high
elasticity/growth, it is forecast that the majority of Chinese citizens would have access
to a basic telephone or even the mobile phone in five years from now. As for computer
demand, about half of all the Chinese population is expected to use the computer by
2010.
9.2 Future directions of ICT in China
9.2.1 Prospects after WTO
The year 2007 probably holds special meaning for research in this field of study as it
signifies the beginning of a new round of developments occurring in the ICT sector in
China. One of the most significant events is perhaps the 6th anniversary of China’s
accession to WTO on December 11, 2001. Observers domestic and foreign alike will be
assessing the extent to which the country has fulfilled its commitments of opening up its
telecommunications sector.
The ICT boom in China is attributed to the abolishment of tariffs on ICT imports
in an effort to observe its WTO commitments. China joined the WTO’s Information
Technology Agreement (ITA) on April 24, 2003 which requires it to remove all tariff
barriers to imports of ICT products such as telecom equipment and personal
computers.1 In keeping with the commitments, China had abolished the tariffs for 256
ICT-related taxable items since January 1, 2005 (Zi, 2006).
In accordance with the WTO timetable, with effect from December 11, 2006,
China will have to raise the foreign equity limit to 49%. As stipulated in the Sino-US
1 “China, Egypt join WTO’s Information Technology Agreement”, WTO News, http://www.wto.org/ English/news_e/news03_e/news_china_egypt_25apr03_e.htm
221

agreement on the commitment to open up its telecommunications market, China will
allow 49% of foreign ownership in mobile services nationwide five years after
accession to WTO (i.e. by end of 2006), and in fixed-line services six years after
accession (by end of 2007).2 Currently, major foreign companies that have a share in
the Chinese telecommunications market include Vodafone, SK Telecom, Telefonica, the
Commonwealth Bank of Australia and JP Morgan, etc.3 With the issue of 3G licenses
lingering at the start of 2007, the Chinese government is expected to set the legal
framework on new telecommunications standards, such as the 3G standards. In this
respect, the MII Vice-Minister, Jiang Yaoping, was reported to remark that the long-
awaited China’s Telecommunications Law could be promulgated earliest in 2007. 4
Furthermore, China will also remove the restrictions it has imposed on mobile voice and
data communications as well as other domestic and international telecommunications
businesses from 2007.5
The fact that China has become the world’s top ICT producer and exporter since
2004 is evidence of the country’s technological capability and transformation from
being a ‘manufacturing superpower’ to an ‘innovation superpower’ (Zeng and Wang,
2007). Based on empirical evidence found in this study, the dissertation supports the
recommendations put forth by some authors that China’s future ICT policy should focus
on boosting its innovation capacity. This can be achieved through improving the
efficiency and quality of domestic R&D and strengthening financial support for
innovation by promoting the venture capital market. Yusuf and Nabeshima (2007)
recommended that China’s policy effort to strengthen its technological capability should
focus on four specific areas: promoting R&D in large corporations by offering fiscal
incentives; enlarging the contribution of key universities to innovation by creating
linkages between these universities and private businesses; establishing institutional or
organizational channels for focusing research efforts and diffusing research findings to
small and medium-sized enterprises; and creating urban centres to attract innovation
activities and building urban innovation capability, which are taking place in major
cities such as Beijing, Shanghai, Shenzhen, Guangzhou, Chengdu and Xi’an. Zeng and
Wang (2007) suggested that China needs to improve its regulatory regime by
2 “China to Further Open its Telecom Industry”, SinoCast China Business Daily News (London: December 12, 2006). 3 “Innovation and IPR”, USITO Weekly China Summary (December 15, 2006), http://www.usito.org/ news_dls.php?id=200&category=USITO%20Weekly%20China%20Summary 4 Ibid. 5 Ibid.
222

restructuring the Ministry of Information Industry (MII) into a ‘State Communication
Commission’ along the lines of the US Federal Communications Commission (FCC).
China’s ICT policies should also aim to address the issue of digital divide
among its regions, as well as that between the urban and rural communities. Despite its
rapid growth in ICT penetration, the regional and urban-rural gaps still remain large
with no evident sign of narrowing. In this respect, China could look into establishing a
financial scheme for providing universal service. Funds to be used for such purpose
may be raised through taxation on the gross revenues of telecom and other ICT
companies, which can be further re-directed to building ‘ICT community centres’ for
the inner and rural regions (Zeng and Wang, 2007). Such policies will have a significant
impact on regional development and alleviating the problems of unemployment and
social inequalities in the poor areas.
Finally, the Chinese government has an important role to play in promoting
greater use of ICT across the country. Known in many countries as ‘e-government’,
introducing online services in the public sector will help to enhance efficiency as well as
transparency of government services and encourage greater participation from citizens.
China should also further tap on its capacity to expand its e-commerce network by
‘improving its credit system and logistic services’ to promote further development of
the ICT sector (Zeng and Wang, 2007).
9.2.2 Moving beyond the Earth: Development of satellite and space technology
The meaning of what constitutes ‘ICT’ in China has changed dramatically over the past
few years. The development of telecommunications has moved in pattern that began
with the construction of fixed-line network, followed by mobile communications and
3G mobile communications, and the convergence among telecommunications and other
forms of information technology applications. Now there is a move to an emphasis on
satellite communications. To identify the future directions of the ICT industry in China,
one may take a cue from two major events that occurred in the last quarter of 2006. The
first event took place on October 29, 2006 at the Xichang Satellite Launch Centre in
Sichuan Province is the launch of China’s first direct broadcasting satellite –
SINOSAT-2, a spacecraft designed to serve the needs for TV broadcasting, direct PC
and broadband multimedia systems in China as well as neighbouring countries for 15
223

years.6 Unfortunately, the launch ended in failure due to ‘the solar power panels not
working’.7
Needless to say, China is venturing into the realms of outer space exploration.
The new emphasis on satellite communications has given the Chinese authorities the
impetus for speeding up the development of its space industry. Indeed, the Chinese
government’s plan to boost its space programmes was announced in the State Council’s
white paper on ‘China’s Space Activities’ published in October 2006. The document
highlighted the progresses that have been made, development targets and major policies
for the near future, and prospects for international cooperation. 8 In this chapter, the
salient points pertaining to the development of satellite communications are extracted
from the white paper as follows:
• Progress made in the past five years
Space Technology: China has independently developed and launched 22 different
types of man-made satellites. A new satellite series have been developed, namely,
the Dongfanghong (or The East is Red) telecommunications and broadcasting
satellites.
Space Application: By the end of 2005, China had more than 80 international and
domestic telecommunications and broadcasting earth stations, and 34 satellite
broadcasting and TV link stations. Altogether, about 100 satellite communications
networks and more than 50,000 Very Small Aperture Terminals (VSAT) have been
established in several government departments and large corporations. Satellite
telecommunications and broadcasting technologies have also reached out to the rural
areas.
• Development targets for the next five years
It is stated in the white paper that China aims to set up ‘a relatively complete
satellite telecommunications and broadcasting system, and to enhance the scale and
economic efficiency of the satellite telecommunications and broadcasting industry’.
To achieve the aims, China will ‘develop and launch geostationary orbit
6 “China launches high-power communications, broadcast satellite”, Xinhua Online (October 29, 2006), http://news.xinhuanet.com/english/2006-10/29/content_5261682.htm
7 “China to launch ‘SinoSat-3’ next May”, Xinhua Online (November 28, 2006), http://news.xinhuanet.com/english/2006-11/28/content_5401086.htm 8 “Text of State Council’s 2006 white paper on China’s space activities”, BBC Monitoring Asia Pacific (London: October 12, 2006).
224

telecommunications satellites and direct TV broadcasting satellites with long
operating life, high reliability and large capacity; and develop satellite technologies
for live broadcast, broadband multimedia, emergency telecommunications, and
telecommunications for public service.’
• Major policies in the near future
China will strengthen the development of space application technologies with an
emphasis on telecommunications satellites, satellite remote-sensing, satellite
navigation and carrier rockets. The country will ‘construct a comprehensive chain of
space industry covering satellite manufacturing, launching services, ground
equipment production and operational services.9
9.3 Epilogue
Whether China would successfully achieve its goals and targets rests on overcoming
several barriers (as examined in Chapter two) and implementation of policies which lay
down guidelines that are unambiguous to would-be businesses operating in the Chinese
market. Structural barriers include ‘an ivory tower approach to engineering education,
weak links between universities and business, academic corruption, ineffective
intellectual property protection, the domination of markets by state-owned industries,
and the scarcity of funding for venture capital’. 10 One critical and probably most
pressing matter at hand is the issue of 3G licenses for mobile communications systems
which is a test of the standard of home-grown technologies.
Finally, China’s ICT industry is growing rapidly not only on the manufacturing
sector, but also in the services market. Several factors and trends taking shape at present
will turn China into a potential ICT outsourcing superpower in the near future, as
summarised in Chan (2005) as follows: First, China’s abolishment of tariffs and lifting
of equity restrictions in accordance to WTO commitments will boost competitiveness
for domestic firms as well as attracting greater investment from foreign services
providers. Second, China will assume a world leading position with the development of
home-grown 3G standards, and continued R&D on new computer models and software
9 In what seemed to mark the further advancement in space technology development at the beginning of the year, a Chinese test of an anti-satellite weapon conducted on January 11, 2007 has sparked off protests from the US and other allies such as Australia and Japan. See “U.S., allies protest China’s anti-satellite test”, CNN (January 19, 2007), http://www.cnn.com/2007/WORLD/asiapcf/01/19/ china.missile.ap/index.html?eref=rss_world 10 “To innovate, China needs more than standards”, Financial Times (London: July 13, 2006).
225

standards using core technologies. Furthermore, to improve its international reputation,
China will have to impose harsher crackdown on software piracy and infringement of
intellectual property rights. Third, China will adopt a different strategy than that of India
in becoming an ICT superpower. This can be seen from the example of Lenovo which
acquired the PC division of IBM and joint venture with other major multinational
companies. Lastly, China will accelerate its human capital investment by training more
ICT personnel through joint training programs with multinationals such as Microsoft
and IBM. The combined forces of an increasing pool of ICT talents and the return of
overseas graduates will greatly enhance the nation’s chances of achieving its ‘ICT or
high-tech superpower’ status within the next few years (Chan, 2005).
226

BIBLIOGRAPHY Abadir, K. and Talmain, G. (2001), “Depreciation Rates and Capital Stocks”, The Manchester School 69 (1), 42-51. Abramovitz, M. (1986), “Catching up, Forging ahead, and Falling behind”, Journal of Economic History 46 (2), 385-406. Anderson, W. P. and D. L. Rigby (1989), “Estimating Capital Stocks and Capital Ages in Canada’s Regions: 1961-1981”, Regional Studies 23(2), 117-26. Atkinson, R. D. (2006), “Is the Next Economy Taking Shape?”, Issues in Science and Technology 22 (2), 62-68. Atzeni, G. E. and Carboni, O. A. (2006), “ICT Productivity and Firm Propensity to Innovative Investment: Evidence from Italian Microdata”, Information Economics and Policy 18, 139-56. Batson, A. (2006), “Chinese Chinese PC Maker Agrees to Address Microsoft Piracy”, Wall Street Journal (April 6). Battese, G. E. and Coelli, T. J. (1995), “A Model for Technical Inefficiency Effects in a Stochastic Frontier Production Function for Panel Data”, Empirical Economics, 20, 325-32. Becchetti, L., Bedoya, D. A. L. and Paganetto, L. (2003), “ICT Investment, Productivity and Efficiency: Evidence at Firm Level Using a Stochastic Frontier Approach”, Journal of Productivity Analysis, 20, 143-67. Bhalla, A., Yao, S. and Zhang, Z. (2003), “Regional Economic Performance in China”, Economics of Transition, 11(1), 25-39. Black, J. (1997), Oxford Dictionary of Economics, Oxford: Oxford University Press. Blonski, M. (2002), “Network Externalities and Two-part Tariffs in Telecommunication Markets”, Information Economics and Policy 14, 95-109. Bohm, B., Gleib, A., Wagner, M. and Ziegler, D. (2002), “Disaggregated Capital Stock Estimation for Austria – methods, concepts and results”, Applied Economics 34, 23-37. Brilhault, G. (2000), “Retropolation of the GFCF Series and Calculation of Fixed Capital Stocks on the ESA-95 Basis in the French National Accounts”, paper presented at the International Workshop on “Capital Stock Estimation: Recent Contributions” in Valencia, December 18, 1-23. Brynjolfsson, E. (1994), “Some Estimates of the Contribution of Information Technology to Consumer Welfare”, http://ccs.mit.edu/papers/CCSWP161/ CCSWP161. html. Brynjolfsson, E. (2003), “The IT Productivity Gap”, in Optimize, July, accessed from ABI/INFORM Global.
227

Brynjolfsson, E. and Hitt, L. (1996), “Paradox Lost? Firm-level Evidence on the Returns to Information System Spending”, Management Science 42(4), 541-58. Castro, E. A. and Jensen-Butler, C. (2003), “Demand for information and communication technology-based services and regional economic development”, Papers in Regional Science 82, 27-50. Chabrow, E. and McGee, M. K. (2006), “Productivity’s Second Act”, InformationWeek (January 23, 2006), accessed from ABI/INFORM Global. Chaker, M. N. (2005), “Managing Disequilibria in the ‘New Economy’”, Journal of American Academy of Business, Cambridge 6(1), 58-61. Chan, S. S. (2005), “IT Outsourcing in China: How China’s Five Emerging Drivers Are Changing the Technology Landscape and IT Industry”, The Outsourcing Institute, http://www.outsourcing.com/china_trends/pdf/IT_Outsourcing_China.pdf. Chang, P. C. and Cheng, T. J. (2002), “The Rise of the Information Technology Industry in China: A Formidable Challenge to Taiwan’s Economy”, American Asian Review 20(3), 125-74. Chinn, M. D. and Fairlie, R. W. (2004), “The Determinants of the Global Digital Divide: A Cross-Country Analysis of Computer and Internet Penetration”, Centre Discussion Paper No. 881, Economic Growth Centre, Yale University, 1-36. Chow, G. (1967), “Technological Change and the Demand for Computers”, American Economic Review 57, 1117-30. Chow, G. (1993), “Capital Formation and Economic Growth in China”, The Quarterly Journal of Economics, August 1993, 809-42. Chow, G. (2002), China’s Economic Transformation, Massachusetts: Blackwell Publishers Inc.
Coelli, T. (1996), “A Guide to FRONTIER Version 4.1: A Computer Program for Frontier Production Function Estimation”, CEPA Working Paper 96/07, Department of Econometrics, University of New England, Armidale, Australia.
Colecchia, A. and Schreyer, P. (2002), “ICT Investment and Economic Growth in the 1990s: Is the United States a Unique Case? – A Comparative Study of Nine OECD Countries”, Review of Economic Dynamics 5, pp. 408-442. Conan, N. (2005), “The New China: Opportunity or Threat?”, NPR (July 21, 2005), http://www.npr.org/templates/story/story.php?storyId=4759625 Dadkhah, K. M. and F. Zahedi (1990), “Estimation and Cross-country Comparison of Capital Stocks”, Empirical Economics 15, 383-408. Das, P. and Srinivasan, P. V. (1999), “Demand for Telephone Usage in India”, Information Economics and Policy 11, 177-194.
228
Daveri, F. and Silva, O. (2004), “Not only Nokia: what Finland tells us about New Economy Growth”, Economic Policy (April), 117-63. Dedrick, J., Gurbaxani, V. and Kraemer, K. L. (2003), “Information Technology and Economic Performance: A Critical Review of the Empirical Evidence”, ACM Computing Surveys, Vol. 35, No. 1, 1-28. Dedrick, J., Kraemer, K. L. and Ren, F. (2004), China IT Report: 2004, Personal Computing Information Centre, University of California, Irvine. Diewert, E. and Lawrence, D (2005), Estimating Aggregate Productivity Growth for Australia: The role of information and communications technology, Occasional Economic Paper, Canberra: Meyrick and Associates. Doms, M. E., W. E. Dunn, S. D. Oliner and D. E. Sichel (2004), “How Fast Do Personal Computers Depreciate? Concepts and New Estimates”, Forthcoming in Tax Policy and the Economy, edited by J. Poterba, MIT Press. Dong, B. (2006), “Northeast China Presents New Look”, China Daily (New York: August 16). Dong, Y. (2004), “The Chinese Experience”, in P. Drysdale (ed.), The New Economy in East Asia and the Pacific, London: RoutledgeCurzon, 130-9. Duffy-Deno, K. T. (2001), “Demand for Additional Telephone Lines: An Empirical Note”, Information Economics and Policy 13, 283-99. Edquist, H. (2005), “The Swedish ICT Miracle – Myth or Reality?”, Information Economics and Policy 17, 275-301. Eisner, J. and Waldon, T. (2001), “The Demand for Bandwidth: Second Telephone Lines and On-line Services”, Information Economics and Policy 13, 301-9. Engelbrecht, H. and Xayavong, V. (2006), “ICT Intensity and New Zealand’s Productivity Malaise: Is the Glass Half Empty or Half Full?”, Information Economics and Policy 18, 24-42. Fabiani, S., Schivardi, F. and Trento, S. (2005), “ICT Adoption in Italian Manufacturing: Firm-level Evidence”, Industrial and Corporate Change 14(2), 225-49. Fan, P. (2006), “Catching up through Developing Innovation Capability: Evidence from China’s Telecom-equipment Industry”, Technovation 26, 359-68. Farrell, M. (1957), “The Measurement of Productive Efficiency”, Journal of the Royal Statistical Society Series A, General, 120(3), 253-81. Fraumeni, B. M. (1997), “The Measurement of Depreciation in the U.S. National Income and Product Accounts”, Survey of Current Business 77(7), 7-23. Gordon, R. J. (2000), “Does the ‘New Economy’ Measure up to the Great Inventions of the Past?”, Journal of Economic Perspectives 14 (4), Fall 2000, 49-74.
229

Greene, W. H. (1993), “The Econometric Approach to Efficiency Analysis”, in Fried, H. O. et al. (eds), The Measurement of Productive Efficiency, Oxford: Oxford University Press, 68-119. Hackl, P. and Westlund, A. H. (1995), “On Price Elasticities of International Telecommunication Demand”, Information Economics and Policy 7, 27-36. Hall, S. G. and Basdevant, O. (2002), “Measuring the Capital Stock in Russia: An Unobserved Component Model”, Economics of Planning 35, 365-70. Harberger, A. C. (1978), “Perspectives on Capital and Technology in Less Developed Countries”, in M. J. Artis and A. R. Nobay, eds., Contemporary Economic Analysis, London: Croom Helm, 15-40. Harchaoui, T. M., Tarkani, F., Jackson, C. and Armstrong, P. (2002), “Information Technology and Economic Growth in Canada and the U.S.”, Monthly Labour Review, October, 125(10), 3-12. Hobday, M. (1995), Innovation in East Asia: The Challenge to Japan, Cheltenham: Edward Elgar. Hsu, J. Y. (2006), “The Dynamic Firm-Territory Nexus of Taiwanese Informatics Industry Investments in China”, Growth and Change 37(2), 230-54. Hu, Q. and Quan, J. (2005), “Evaluating the Impact of IT Investments on Productivity: A Causal Analysis at Industry Level”, International Journal of Information Management 25, 39-53. Hu, S. C. and Chan, V. L. (2004), “The Taiwanese Experience: Impact on Production and Trade”, in P. Drysdale (ed.), The New Economy in East Asia and the Pacific, London: RoutledgeCurzon, 140-71. Hughes, A. and Morton, M. S. (2005), “ICT and Productivity Growth – The Paradox Resolved?”, Working Paper No. 316, Centre for Business Research, University of Cambridge, 1-41. Iimi, A. (2005), “Estimating Demand for Cellular Phone Services in Japan”, Telecommunications Policy 29, 3-23. Inklaar, R., O’Mahony, M. and Timmer, M. (2003), “ICT and Europe’s Productivity Performance Industry-level Growth Account Comparisons with the United States”, Paper presented at the Asia Pacific Productivity Conference, Brisbane, 14-16 July 2004. Islam, N. and Dai, E. (2005), “Alternative Estimates of TFP Growth in Mainland China: An Investigation Using the Dual Approach”, paper presented at the 17th Annual Conference of the ACESA, held on 7-8 July 2005 at University of Western Australia, Perth. Jalava, J. and Pohjola, M. (2001), “Economic Growth in the New Economy: Evidence from Advanced Economies”, WIDER Discussion Paper No. 2001/5, United Nations University, Finland, 1-23.
230
Jia, L. Q. (1998), “Regional Catching Up and Productivity Growth in Chinese Reform Period”, International Journal of Social Economics 25 (6/7/8), 1160. Jing, L. (2006), “A Comparative Analysis of the Information Communication Technology Industry in China”, The Chinese Economy 39 (1), 74-83. Jorgenson, D. W. (1989), “Capital as a Factor of Production”, in D. W. Jorgenson and R. Landau (eds.), Technology and Capital Formation, Massachusetts: The MIT Press, 1-35. Jorgenson, D. W. (2000), “Empirical Studies of Depreciation”, in D. W. Jorgenson (ed.), Econometrics Volume 1: Econometric Modeling of Producer Behavior, Massachusetts: The MIT Press, 73-95. Jorgenson, D. W. (2001), “Information Technology and the U.S. Economy”, The American Economic Review, March 2001, 91(1), 1-32. Jorgenson, D. W., Ho, M. S. and Stiroh, K. J. (2003a), “Lessons from the US growth resurgence”, Journal of Policy Modeling 25 (2003), 453-470. Jorgenson, D. W., Ho, M. S. and Stiroh, K. J. (2003b), “Growth of US Industries and Investments in Information Technology and Higher Education”, Economic Systems Research 15(3), 279-325. Jorgenson, D. W., Ho, M. S. and Stiroh, K. J. (2004), “Will the U.S. Productivity Resurgence Continue?”, Current Issues in Economics and Finance 10 (13), 1-7. Jorgenson, D. W., Ho, M. S. and Stiroh, K. J. (2005), Productivity Volume 3: Information Technology and the American Growth Resurgence, Massachusetts: The MIT Press. Jorgenson, D. W. and Motohashi, K. (2005), “Information Technology and the Japanese Economy”, Working Paper 11801, MA: National Bureau of Economic Research, 1-34. Jorgenson, D. W. and Stiroh, K. J. (1999), “Productivity Growth: Current Trends and Longer-term Trends - Information Technology and Growth”, The American Economic Review, May 1999; 89(2), 109-115. Jorgenson, D. W. and Stiroh, K. J. (2000), “Raising the Speed Limit: U.S. Economic Growth in the Information Age”, Brookings Papers on Economic Activity, 2000(1), 125-211. Jorgenson, D. W. and Vu, K. (2005), “Information Technology and the World Economy”, Scandinavian Journal of Economics 107 (4), 631-50. Jovanovic, B. and Rousseau, P. L. (2003), “General Purpose Technologies”, http://www.nyu.edu/econ/user/jovanovi/GPT.pdf. Kalirajan, K. P. and Shand, R. T. (1988), “Testing Causality Between Technical and Allocative Efficiencies”, Working Paper No. 88/6, Research School of Pacific Studies, Australian National University, Canberra, Australia.
231

Kalirajan, K. P. and Zhao, S. J. (1997), “Did the Technical Efficiency of State Enterprises Improve with the Same Speed in All Provinces in China?”, Applied Economics 29, 269-77. Katsuno, M. (2005), “Status and Overview of Official ICT Indicators for China”, STI Working Paper 2005/4: Statistical Analysis of Science, Technology and Industry, Paris: OECD, 1-42. Kharbanda, V. P. and Suman, Y. (2002), “Chinese Initiative in the Software Industry – Quest to Leap”, Current Science 83 (12), 1450-5. Kim, S. J. (2002), “Development of Information Technology Industry and Sources of Economic Growth and Productivity in Korea”, Journal of Economic Research 7, 177-213. Kong, X., Marks, R. E. and Wan, G. H. (1998), “Technical Efficiency, Technological Change and Total Factor Productivity Growth in Chinese State-Owned Enterprises During Early 1990s”, Working Paper 98-016, November, University of New South Wales, Sydney. Koopmans, T. C. (1951), “An Analysis of Production as an Efficient Combination of Activities”, in T. C. Koopmans (ed.), Activity Analysis of Production and Allocation, Cowles Commission for Research in Economics, Monograph No. 13, New York: John Wiley and Sons, Inc. Kraemer, K. L. and Dedrick, J. (1999), Information Technology and Productivity: Results and Policy Implications of Cross-country Studies, WIDER Working Paper 2-99, Center for Research on Information Technology and Organizations, University of California, Irvine. Kraemer, K. L. and Dedrick, J. (2002a), “Information Technology in Southeast Asia: Engine of Growth or Digital Divide”, in Chia, S. Y. and Lim, J. J. (ed.), Information Technology in Asia: New Development Paradigms, Singapore: Institute of Southeast Asian Studies. Kraemer, K. L. and Dedrick, J. (2002b), “Enter the Dragon: China’s Computer Industry”, IEEE Software (February), 28-36. Kshetri, N. (2005), “Structural Shifts in the Chinese Software Industry”, IEEE Software, July/August 2005. Kumbhakar, S. C. and Wang, H. J. (2005), “Estimation of Growth Convergence using a Stochastic Production Frontier Approach”, Economics Letters 88, 300-305. Lai, H. Y. (2002), “China’s Western Development Program”, Modern China 28 (4), 432-66. Lan, X. and Sheehan, P. (2002), “China’s Development Strategy”, in Grewal, G. et al. (ed), China’s Future in the Knowledge Economy, Melbourne: Victoria University of Technology, 1-24.
232

Lanning, S. G., O’Donnell, S. R. and Neuman, W. R. (1999), “A Taxonomy of Communications Demand”, Telecommunications Policy Research Conference 1999, 1-31. Lee, D. H. and Lee, D. H. (2006), “Estimating Consumer Surplus in the Mobile Telecommunications Market: The case of Korea”, Telecommunications Policy 30, 605-21. Lee, I. H. and Khatri, Y. (2003), Information Technology and Productivity Growth in Asia, IMF Working Paper, January 2003. Lee, S. T., Gholami, R. and Tan, Y. T. (2005), “Time Series Analysis in the Assessment of ICT Impact at the Aggregate Level – Lessons and Implications for the New Economy”, Information & Management 42, 1009-22. Levtchenkova, S. and Petchey, J. (2000), “Regional Capital Stock Data for Australia”, The Australian Economic Review 33(2), 193-7. Li, M. and Gao, M. (2003), “Strategies for Developing China’s Software Industry”, Information Technology and International Development 1 (1), 61-73. Lin, S. (2003), “High-Tech Park Development in China”, in Jussawalla, M. and Taylor, R. D. (ed), Information Technology Parks of the Asia Pacific: Lessons for the Regional Digital Divide, New York: M.E. Sharpe, 25-63. Lipsey, R. G. (2004), “The New Economy: Theory and Measurement”, in P. Drysdale (ed.), The New Economy in East Asia and the Pacific, London: RoutledgeCurzon, 32-59. Liu, B. (2004a), “IT Market Back in Fast Lane: IDC report”, China Daily (Beijing: March 26). Liu, X. (2004b), “Technology Policy, Language and Human Resource Factors in the Chinese Software Industry”, a presentation at Strategies for Building Software Industries in Developing Countries held on May 19-21, 2004. Loo, Becky P. Y. (2004), “Telecommunications Reforms in China: Towards an Analytical Framework”, Telecommunications Policy 28(9), 697-714. Lovell, C. A. K. (1993), “Production Frontiers and Productive Efficiency”, in Fried, H. O. et al. (eds), The Measurement of Productive Efficiency, Oxford: Oxford University Press, 3-67. Low, B. and Johnston, W. J. (2005), “Managing Ambiguous Policies in China’s Telecommunications Market: Network Navigation Insights and Techniques”, Journal of Asia-Pacific Business 6(4), 5-30. Lu, D. (2000a), “China’s Telecommunications Infrastructure Buildup: On its Own Way”, in T. Ito and Anne O. Krueger (eds), Deregulation and Interdependence in the Asia-Pacific Region, Chicago: University of Chicago Press, 371-414.
233

Lu, D. and Wong, C. K. (2003), China’s Telecommunications Market: Entering a New Competitive Age, Cheltenham: Edward Elgar. Lu, Louis Y. Y. and Liu, John S. (2004), “R&D in China: An Empirical Study of Taiwanese IT companies”, R&D Management 34(4), 453-65. Lu, Q. (2000b), China’s Leap into the Information Age: Innovation and Organization in the Computer Industry, Oxford: Oxford University Press. Ma, Y. F. and Goo, Y. J. (2005), “Technical Efficiency and Productivity Change in China’s High- and New-Technology Industry Development Zones”, Asian Business & Management 4, 331-55. Madden, G. and Coble-Neal, G. (2004), “Economic Determinants of Global Mobile Telephony Growth”, Information Economics and Policy 16, 519-34. Madden, G., Coble-Neal, G. and Dalzell, B. (2004), “A Dynamic Model of Mobile Telephony Subscription Incorporating a Network Effect”, Telecommunications Policy 28, 133-44. Madden, G., Savage, S. J. and Tipping, C. (2001), “Understanding European Union International Message Telephone Services Demand”, Information Economics and Policy 13, 127-36. Martins, M. L. C. (2003), “International Differences in Telecommunications Demand”, Information Economics and Policy 15, 291-303. Mas, M., Perez, F. and Uriel, E. (2000), “Estimation of the Stock of Capital in Spain”, Review of Income and Wealth 46 (1), 103-16. McGuckin, R. H., Stiroh, K. J. and van Ark, B. (1997), “Perspectives on a Global Economy - Technology, Productivity, and Growth: U.S. and German Issues”, The Conference Board Report No. 1206-97-RR, 1-26. Meng, Q. and Li, M. (2002), “New Economy and ICT Development in China”, Information Economics and Policy 14, 275-95. Ministry of Information Industry (various years), Yearbook of China Electronics Industry, Beijing: Publishing House of Electronics Industry. Miyagawa, T., Ito, Y. and Harada, N. (2004), “The IT Revolution and Productivity growth in Japan”, Journal of the Japanese and International Economies 18, 362-89. Morris, I. (2006), “China’s Broadband Boom”, Telecommunications International 40 (11), November. Movshuk, O. (2004), “Restructuring, Productivity and Technical Efficiency in China’s Iron and Steel Industry, 1988-2000”, Journal of Asian Economics 15, 135-51. Mueller, M. and Tan, Z. (1997), China in the Information Age: Telecommunications and the Dilemma of Reform, Westport, CT: Praeger Publishers.
234

Musgrave, J. C. (1992), “Fixed Reproducible Tangible Wealth in the United States, Revised Estimates”, Survey of Current Business, January 1992, 106-19. Nadiri, M. I. and Nandi, B. (1997), “The Changing Structure of Cost and Demand for the U.S. Telecommunications Industry”, Information Economics and Policy 9, 319-47. Nadiri, M. I. and I. R. Prucha (1996), “Estimation of the Depreciation Rate of Physical and R&D Capital in the U.S. Total Manufacturing Sector”, Economic Inquiry 34 (1), 43-56. Naughton, B. and Segal, A. (2001), “Technology Development in the New Millenium: China in Search of a Workable Model”, Working Paper Series 01.03, Massachusetts: MIT Japan Program, 1-24. O’Donnell, C. J., Rao, D. S. P. and Battese, G. E. (2005), “Metafrontier Frameworks for the Study of Firm-Level Efficiencies and Technology Ratios”, paper presented at Economics Program Seminar, School of Economics and Commerce, University of Western Australia. OECD (2001), OECD Science, Technology and Industry Scoreboard 2001: Towards a knowledge-based economy, http://www1.oecd.org/publications/e-book/92-2001-04-1-2987/ (accessed on 1 September 2003). OECD (2004), “ICTs and Economic Growth in Developing Countries”, The DAC Journal 5(4), 7-40. OECD (2006), “Made in China”, OECD Observer (November 2006), http://www.oecdobserver.org/news/fullstory.php/aid/1957/Made_in_China.html Oliner, S. D. and Sichel, D. E. (2000), “The Resurgence of Growth in the Late 1990s: Is Information Technology the Story?”, Journal of Economic Perspectives, Fall 2000, 14(4), 3-22. Oliner, S. D. and Sichel, D. E. (2003), “Information Technology and Productivity: Where Are We Now and Where Are We Going?”, Journal of Policy Modeling 25 (2003), 477-503. Oulton, N. and Srinivasan, S. (2005), “Productivity Growth in UK industries, 1970-2000: Structural Change and the Role of ICT”, Working paper no. 259, London: Bank of England, 1-56. Oz, E. (2005), “Information Technology Productivity: In search of a Definite Observation”, Information & Management 42, 789-98. Pakes, A. and Schankerman, M. (1986), “Estimates of the Value of Patent Rights in European Countries during the Post-1950 Period”, Economic Journal, December 1986, 1052-76. Parham, D. (2004), “ICT: An Engine or Enabler of Australia’s Productivity Growth?”, paper presented at the Asia Pacific Productivity Conference 2004, held on July 14-16 in Brisbane, Australia, 1-19.
235
Parham, D., Roberts, P. and Sun, H. (2001), Information Technology and Australia’s Productivity Surge, Productivity Commission Staff Research Paper, AusInfo, Canberra. Perez, B. (2006), “Olympics to Boost China ICT Market Value to Reach US$42b Next Year as Beijing Steps Up Games Preparations”, South China Morning Post (Hong Kong: December 12). Pohjola, M. (2002), “The New Economy: Facts, Impacts and Policies”, Information Economics and Policy 14, 133-144. Pohjola, M. (2003), “The Adoption and Diffusion of ICT Across Countries: Patterns and Determinants”, The New Economy Handbook, 1-28. Pyo, H. K. (1988), “Estimates of Capital Stock and Capital/Output Coefficients by Industries: Korea (1953-86)”, International Economic Journal 2 (3), 79-121. Qian, X. and Smyth, R. (2006), “Growth Accounting for the Chinese Provinces 1990-2000: Incorporating Human Capital Accumulation”, Journal of Chinese Economic and Business Studies 4 (1), 21-37. Quibria, M. G., Ahmed, S. N., Tschang, T. and Reyes-Macasaquit, M. R. (2003), “Digital Divide: Determinants and Policies with Special Reference to Asia”, Journal of Asian Economics 13, 811-25. Reinsdorf, M. and Cover, M. (2005), Measurement of Capital Stocks, Consumption of Fixed Capital, and Capital Services, Report on a Presentation to the Central American Ad Hoc Group on National Accounts, May 12, 2005 in Santo Domingo, Dominican Republic. Richmond, R. (2003), “China: The Next Microprocessor Giant?”, Techimo Hardware (July 3), http://www.techimo.com/articles/index.pl?photo=16. Robidoux, B. and Wong, B. S. (2003), “Has Trend Productivity Growth Increased in Canada?”, in International Productivity Monitor 6, Spring, 47-55. Salvatore, D. (2003), “The New Economy and Growth in the G-7 countries”, Journal of Policy Modeling 25, 531-540. Schreyer, P. (2000), The Contribution of Information and Communication Technology to Output Growth: A Study of the G7 Countries, OECD Working Paper 2000/2, OECD. Segal, A. (2003), Digital Dragon: High-Technology Enterprises in China, New York: Cornell University Press. Seiter, S. (2005), “Productivity and Employment in the Information Economy: What Kaldor’s and Verdoorn’s Growth Laws Can Teach the US”, Empirica 32, 73-90. Shao, B. B. M. and Lin, W. T. (2001), “Measuring the Value of Information Technology in Technical Efficiency with Stochastic Production Frontiers”, Information and Software Technology 43, 447-56.
236

Shao, B. B. M. and Lin, W. T. (2002), “Technical Efficiency Analysis of Information Technology Investments: A Two-stage Empirical Investigation”, Information and Management 39, 391-401. Sharpe, A. (2003), “Why are Americans More Productive than Canadians?”, in International Productivity Monitor 6, Spring, 19-37. Shinjo, K. and Zhang, X. (2003), “Productivity Analysis of IT Capital Stock: The USA-Japan comparison”, Journal of the Japanese and International Economies 17, 81-100. Shy, O. (2001), The Economics of Network Industries, Cambridge: Cambridge University Press. Simon, D. F. and Ashton, D. (1996), “Golden Ambition”, The China Business Review 23(6), 10. Simon, J. and Wardrop, S. (2002), “Australian Use of Information Technology and its Contribution to Growth”, Research Discussion Paper 2002-02, Reserve Bank of Australia, 1-38. Singer, J. and Dean, J. (2006), “China Mobile nears $5.3 Billion Deal for Millicom”, Wall Street Journal (New York: May 25). State Statistical Bureau (various years), China Statistical Yearbook, Beijing: China Statistics Press. State Statistical Bureau (various years), China Statistics Yearbook on High Technology Industry, Beijing: China Statistics Press. State Statistical Bureau (various years), Yearbook of China’s Electronics Industry, Beijing: China Statistics Press. Stavins, J. (1997), “Estimating Demand Elasticities in a Differentiated Product Industry: The Personal Computer Market”, Journal of Economics and Business 49, 347-67. Stiroh, K. J. (1998), “Computers, Productivity, and Input Substitution”, Economic Inquiry, Apr 1998; 36(2), 175-191. Stiroh, K. J. (2001), “Investing in Information Technology: Productivity Payoffs for U.S. Industries”, Current Issues in Economics and Finance, Vol. 7 (6), Federal Reserve Bank of New York. Stiroh, K. J. (2002a), “Information Technology and the U.S. Productivity Revival: What Do the Industry Data Say?”, The American Economic Review, December 2002, 92(5), 1559-1576. Stiroh, K. J. (2002b), “New and Old Economics in the New Economy”, in Siebert, Horst (ed), Economic Policy Issues of the New Economy, New York: Springer, 3-28. Susiluoto, I. (2003), “Effects of ICT on Regional Economic Efficiency”, Web Publications 2003, 16, MUTEIS Impact Study, Helsinki City Urban Facts Office.
237

Tan, Z., Mueller, M. and Foster, W. (1997), “China’s New Internet Regulations: Two Steps Forward, One Step Back”, Communications of the ACM 40(12), 11-16. Tang, S. (1997), “Sino-Japanese Technology Transfer and its Effects”, in Fernstein, C. and C. Howe (eds.), Chinese Technology Transfer in the 1990s: Current Experience, Historical Problems and International Perspectives, Cheltenham: Edward Elgar, 152-67. Timmer, M. P. and van Ark, B. (2005), “Does Information and Communication Technology drive EU-US Productivity Growth Differentials?”, Oxford Economic Papers 57, 693-716. Tong, Christopher S. P. and Chan, H. L. (2003), “Disparity in Production Efficiency of China’s TVEs Across Regions: A Stochastic Frontier Production Function Approach”, Asia Pacific Journal of Management 20 (1), 113-31. U.S. Department of Commerce, Bureau of Economic Analysis, http://www.bea.doc.gov/. USITO (2005), “Government – but not Market – Loves ‘Homegrown’ Processor”, China IT Weekly Briefing, http://www.usito.org/USITO/uploads/325/ USITO_IT_Weekly_05132005.htm. Vagliasindi, M., Guney, I. and Taubman, C. (2006), “Fixed and Mobile Competition in Transition Economies”, Telecommunications Policy 30, 349-67. Van Ark, B., Inklaar, R. and McGuckin, Robert H. (2003), “The Contribution of ICT-Producing and ICT-Using Industries to Productivity Growth: A Comparison of Canada, Europe and the United States”, in International Productivity Monitor, No. 6, Spring 2003, 56-63. Varian, H. R. (2003), Economics of Information Technology, revised version of the Raffaele Mattioli Lecture delivered at Bocconi University, Milano, Italy on November 15-16, 2001 and the Sorbonne, Italy on March 6, 2003. Wall, D. and X. Yin (1997), “Technology Development and Export Performance: is China a frog or a goose?”, in Fernstein, C. and C. Howe (eds.), Chinese Technology Transfer in the 1990s: Current Experience, Historical Problems and International Perspectives, Cheltenham: Edward Elgar, 169-91. Wang, Y. and Yao, Y. (2003), “Sources of China’s Economic Growth 1952-1999: Incorporating Human Capital Accumulation”, China Economic Review 14(2003), 32-52. Witzell, O. W. and Smith, J. K. L. (1989), Closing the Gap: Computer Development in the People’s Republic of China, Colorado: Westview Press. Wong, C. K. (2002), “China’s Telecommunications: Industrial Policy with ‘Chinese’ characteristics”, Thesis submitted for the degree of Master of Social Sciences, National University of Singapore.
238

Wong, J. and Wong, C. K. (2004), “China’s Software Industry: Moving on the Fast Track”, Journal of Chinese Economic and Business Studies, 2 (1), 73-95. World Trade Organization, Information Technology Agreement, http://www.wto.org/ English/tratop_e/inftec_e/inftec_e.htm. Wu, Y. (1999), “Productivity and Efficiency in China’s Regional Economies”, in Fu, T. T. et al. (eds), Economic Efficiency and Productivity Growth in the Asia-Pacific Region, Cheltenham: Edward Elgar, 171-90. Wu, Y. (2001), “Productivity Growth at the Firm Level: With Application to the Chinese Steel Mills”, Journal of Entrepreneurship, 10 (1), 1-16. Wu, Y. (2004), China’s Economic Growth: A miracle with Chinese characteristics, London: RoutledgeCurzon. Xiao, H. (2004), “Industrial Alliance Boosts IT Sector”, China Daily (New York: October 22). Xu, J. P. (1997), “China’s International Technology Transfer: The Current Situation, Problems and Future Prospects”, in Feinstein, C. and Howe, C. (ed), Chinese Technology Transfer in the 1990s: Current Experience, Historical Problems and International Perspectives, Cheltenham: Edward Elgar. Yang, S. C. and Olfman, L. (2006), “The Effects of International Telecommunication Investment: Wireline and Wireless Technologies, 1993-1998”, Telecommunications Policy 30, 278-96. Yao, S. and Zhang, Z. (2001), “Regional Growth in China Under Economic Reforms”, The Journal of Development Studies, 38(2), 167-86. Yorukoglu, M. (1998), “The Information Technology Productivity Paradox”, Review of Economic Dynamics 1, 551-92. Yuan, Y., Zhang, W., Wang, Y., Xu, Z., Yang, Q. and Gao, Y. (2006), “Xiaolingtong versus 3G in China: Which Will Be the Winner?”, Telecommunications Policy 30, 297-313. Yusuf, S. and Nabeshima, K. (2007), “Strengthening China’s Technological Capability”, Policy Research Working Paper 4309, The World Bank Development Research Group, 1-36. Zeng, D. Z. and Wang, S. (2007), “China and the Knowledge Economy: Challenges and Opportunities”, Policy Research Working Paper 4223, The World Bank Development Research Group, 1-38. Zhang, D. (2006a), “Nation’s IT Industry on Right Track”, China Daily (New York: April 6). Zhang, D. (2006b), “High growth expected in software field”, China Daily (New York: June 2).
239
Zhang, D. (2006c), “Software industry gets help”, China Daily (New York: June 22). Zhang, X. G. and Zhang, S. Q. (2001), “Technical Efficiency in China’s Iron and Steel Industry: Evidence from the New Census Data”, International Review of Applied Economics 15 (2), 199-211. Zhao, H. (1995), “Technology Imports and Their Impacts on the Enhancement of China’s Indigenous Technological Capability”, The Journal of Development Studies 31 (4), 585-602. Zhao, H. X. (2006), “Government doing its utmost to root out pirated software: Official”, China Daily (New York: April 20). Zi, M. (2006), “Joining WTO Boosts Technology Sector”, China Daily (New York: December 12).
240