influences on students’ gcse attainment and progress … · influences on students’ gcse...
TRANSCRIPT

Influences on students’ GCSE attainment and progress at age 16
Effective Pre-School, Primary & Secondary Education Project (EPPSE)
Research Report
September 2014
Pam Sammons1, Kathy Sylva1, Edward Melhuish1, 2, Iram Siraj3, Brenda Taggart3, Katalin Toth3 & Rebecca Smees3
1University of Oxford; 2Birkbeck, University of London, 3Institute of Education, University of London

The EPPSE Research Team
Principal Investigators Professor Kathy Sylva Department of Education, University of Oxford 00 44 (0)1865 274 008 / email [email protected]
Professor Edward Melhuish Institute for the Study of Children, Families and Social Issues Birkbeck University of London & Department of Education, University of Oxford 00 44 (0)207 079 0834 / email [email protected] 00 44 (0)1865 274 049 / email [email protected] Professor Pam Sammons Department of Education, University of Oxford 00 44 (0)115 951 4434 / email [email protected]
Professor Iram Siraj Institute of Education, University of London 00 44 (0)207 612 6218 / email [email protected]
*Brenda Taggart Institute of Education, University of London 00 44 (0)207 612 6219 / email [email protected]
Research Officers Dr. Katalin Toth Institute of Education, University of London Rebecca Smees Institute of Education, University of London **Wesley Welcomme Institute of Education, University of London
Acknowledgements The EPPSE 3-16 project is a major longitudinal study funded by the Department for Education (DfE). The research would not have been possible without the support and co-operation of the Local Authorities, pre-school centres, primary schools, secondary schools, and the many children and parents participating in the research.

Contents
The EPPSE Research Team 1
Principal Investigators 2
Acknowledgements 2
List of figures vii
List of tables viii
Executive summary xv
Summary of findings xviii
Raw differences in attainment for different student groups xviii
The net impact of child, family and HLE characteristics on GCSE attainment in Year 11 xix
Attendance xxiii
Duration xxiii
Quality xxiii
Effectiveness xxiv
Combined effects xxiv
Implications xxxii
1 Introduction 1
Aims 2
Analyses strategy 3
Structure of the report and analyses 4
2 Characteristics of the sample at the end of Year 11 6
Continuous measures 7
Dichotomous measures - performance benchmark indicators 10
Academic assessments 13
i

Descriptive statistics of academic outcomes 14
Associations between students’ attainment in different outcomes and over time 19
Differences in attainment for different groups of students 20
Gender 20
Ethnicity 22
Parents’ qualification level 22
Free school meals (FSM) 22
Special educational needs (SEN) 22
Early years home learning environment (HLE) 24
Pre-school attendance 24
3 Students’ academic attainment at the end of Year 11 in secondary school 25
The influence of different individual student, family and home learning environment characteristics as predictors of GCSE results 25
Null models 26
Individual measures 29
Age 29
Gender 29
Ethnicity 29
Early developmental, behavioural and health problems 30
Family size 30
Family measures 30
Mother’s age at age 3/5 30
Free school meals (FSM) 31
Income 31
Family SES 33
Parent’s highest qualification level 33
ii

Early years home learning environment (early years HLE) 34
KS1 HLE 35
KS2 HLE 36
KS3 HLE 37
The impact of neighbourhood characteristics and school composition 37
Index of Multiple Deprivation (IMD) 38
Income Deprivation Affecting Children Index (IDACI) 39
Percentage of White British 40
Level of crime 40
Level of unemployment 40
Neighbourhood safety 41
School level FSM 42
Summary of the impact of neighbourhood characteristics and school composition 43
4 The impact of pre-school, primary school and secondary school on students’ academic attainment at the end of Year 11 44
The impact of pre-school experience on Year 11 academic attainment 45
The continuing impact of pre-school attendance on later academic attainment at the end of KS4 45
The continuing impact of pre-school type and duration on later academic attainment at the end of KS4 46
The continuing impact of pre-school centre quality on later academic attainment at the end of KS4 47
The continuing impact of pre-school centre effectiveness on later academic attainment at the end of KS4 49
The continuing pre-school effects for different groups of students 51
The impact of primary school academic effectiveness on Year 11 academic attainment56
The impact of secondary school on Year 11 academic attainment 58
iii

The impact of secondary school academic effectiveness on Year 11 academic attainment 60
The impact of secondary school quality on Year 11 academic attainment 61
5 Exploring the effects of students’ experiences of secondary schools on KS4 attainment65
Experiences of school in Year 9 66
Emphasis on learning 67
Behaviour climate 67
Headteacher qualities 68
School environment 68
Valuing pupils 68
School/learning resources 69
Teacher discipline and care 69
Teacher support 70
Emphasis on learning and Behaviour climate 70
Experiences of school in Year 11 71
Teacher professional focus 72
Positive relationships 73
Monitoring students 73
Formative feedback 74
The impact of time spent on homework on KS4 academic attainment 74
6 Exploring students’ academic progress between Year 6 and Year 11 77
The impact of individual student, family, HLE, school composition and neighbourhood on KS2-KS4 academic progress 80
Overall academic progress for total GCSE score 80
Progress in English 81
Progress in maths 82
iv

The impact of neighbourhood on KS2-KS4 academic progress 83
Fixed effects (continuous) 84
The impact of pre-school and primary school experiences on KS2-KS4 academic progress 84
The impact of secondary school on KS2-KS4 academic progress 86
The impact of secondary school academic effectiveness on KS2-KS4 academic progress 87
The impact of secondary school quality on KS2-KS4 academic progress 89
The impact of students’ views of school on KS2-KS4 academic progress 90
The impact of homework on KS2-KS4 academic progress 92
7 Discussion and conclusions 94
Raw differences in attainment for different student groups 95
The net impact of child, family and HLE characteristics on GCSE attainment in Year 11 96
Attendance 100
Duration 100
Quality 100
Effectiveness 101
Combined effects 101
Overview 109
Implications 111
References 114
Appendix 1: Home Learning Environment (HLE) measures 123
The early years home learning environment (HLE) 123
The Key Stage 1 (KS1) home learning environment (HLE) 124
The Key Stage 2 (KS2) home learning environment (HLE) 125
The Key Stage 3 (KS3) home learning environment (HLE) 126
v
Appendix 2: Characteristics of the sample in Year 11 127
Appendix 3: Associations between students’ earlier measures of academic attainment 131
Appendix 4: Contextualised multilevel models 132
Appendix 5: Contextualised value added multilevel models 160
Appendix 6: Contextualised multilevel models for combined effects 166
Glossary of terms 169
vi

List of figures Figure 2.1: Distribution of total GCSE score in Year 11 15
Figure 2.2: Distribution of grade achieved in full GCSE English in Year 11 15
Figure 2.3: Distributions of grade achieved in full GCSE maths in Year 11 16
Figure 2.4: Distributions of total number of full GCSE entries in Year 11 17
Figure 4.1: The combined impact of gender and pre-school quality on total GCSE score 52
Figure 4.2: The combined impact of gender and pre-school quality on GCSE English 53
Figure 4.3: The combined impact of gender and pre-school quality on GCSE maths 53
Figure 4.4: The combined impact of parents’ highest qualification and pre-school quality on GCSE English 55
Figure 4.5: The combined impact of parents’ highest qualification and pre-school quality on GCSE maths 55
vii

List of tables Table 2.1: Selected characteristics of sample with valid academic continuous data - Part 1 8
Table 2.2: Selected characteristics of sample with valid academic continuous data - Part 2 9
Table 2.3: Selected characteristics of sample with valid academic dichotomous data - Part 1 11
Table 2.4: Selected characteristics of sample with valid academic dichotomous data - Part 2 12
Table 2.5: Distributions of different measures of academic attainment in Year 11 16
Table 2.6: Distribution of number of total number of full GCSE entries in Year 11 17
Table 2.7: Descriptive statistics of continuous academic outcomes in Year 11 18
Table 2.8: Descriptive statistics of benchmark indicators in Year 11 18
Table 2.9: Correlations between students’ standardised academic outcomes (KS4 English and maths) and prior attainment (KS3 English and maths test score) 19
Table 2.10: Correlations between students’ standardised academic outcomes (KS4 English and maths) and prior attainment (KS3 English and maths Teacher Assessments) 19
Table 2.11: Correlations between students’ standardised academic outcomes (KS4 English and maths) and prior attainment (KS2 English and maths) 19
Table 2.12: Means of Year 11 total GCSE score and number of full GCSE entries by various background characteristics 21
Table 2.13: Means of Year 11 grades in GCSE English and GCSE maths by various background characteristics 23
Table 3.1: Null model for total GCSE score in Year 11 27
Table 3.2: Null Models for grade achieved in full GCSE English in Year 11 27
Table 3.3: Null Models for grade achieved in full GCSE maths in Year 11 27
Table 3.4: Null Models for total number of full GCSE entries in Year 11 28
Table 3.5: Null Models for achieving 5 A*-C in Year 11 28
viii

Table 3.6: Null Models for achieving 5 A*-C including English and maths in Year 11 28
Table 3.7: Null Models for achieving EBacc in Year 11 28
Table 3.8: Summary findings from contextualised models for Year 11 academic outcomes 32
Table 3.9: Contextualised models for Year 11 benchmark indicators 35
Table 3.10: Correlations between different measures of neighbourhood disadvantage (n=3110) 38
Table 3.11: Contextualised models for Year 11 academic outcomes - Neighbourhood measures 39
Table 3.12: Contextualised models for Year 11 benchmark indicators - Neighbourhood measures 40
Table 3.13: Contextualised models for Year 11 academic outcomes - Neighbourhood safety 42
Table 3.14: Contextualised models for Year 11 benchmark indicators - Neighbourhood safety 42
Table 4.1: Contextualised models for Year 11 academic outcomes: Pre-school attendance 46
Table 4.2: Contextualised models for Year 11 benchmark indicators: Pre-school attendance 46
Table 4.3: Contextualised models for Year 11 academic outcomes: Pre-school duration 47
Table 4.4: Contextualised models for Year 11 academic outcomes: Pre-school quality ECERS-E 48
Table 4.5: Contextualised models for Year 11 benchmark indicators: Pre-school quality ECERS-E 48
Table 4.6: Contextualised models for Year 11 academic outcomes: Pre-school quality ECERS-R 48
Table 4.7: Contextualised models for Year 11 benchmark indicators: Pre-school quality ECERS-R 49
Table 4.8: Contextualised models for Year 11 academic outcomes: Pre-school effectiveness (Pre-reading) 50
ix

Table 4.9: Contextualised models for Year 11 benchmark indicators- Pre-school effectiveness (Pre-reading) 50
Table 4.10: Contextualised models for Year 11 academic outcomes- Pre-school effectiveness (Early number concepts) 51
Table 4.11: Contextualised models for Year 11 benchmark indicators- Pre-school effectiveness (Early number concepts) 51
Table 4.12: Contextualised models for Year 11 academic outcomes- Primary school academic effectiveness 57
Table 4.13: Contextualised models for Year 11 benchmark indicators- Primary school academic effectiveness 57
Table 4.14: Contextualised models for Year 11 benchmark indicators- Primary school academic effectiveness 58
Table 4.15: Distribution of Year 11 students in schools and Total number of full GCSE entries in Year 11 58
Table 4.16: Contextualised models for Year 11 academic outcomes - Secondary school type 59
Table 4.17: Contextualised models for Year 11 benchmark indicators - Secondary school type 59
Table 4.18: Contextualised models for Year 11 academic outcomes - Secondary school academic effectiveness 61
Table 4.19: Contextualised models- Ofsted judgement of the quality of pupils’ learning 62
Table 4.20: Contextualised models for Year 11 benchmark indicators - Ofsted judgement of the quality of pupils’ learning 62
Table 4.21: Contextualised models for Year 11 academic outcomes - Ofsted judgement of Attendance of learners 63
Table 4.22: Contextualised models for Year 11 benchmark indicators- Ofsted judgement of Attendance of learners 64
Table 5.1: Contextualised models for Year 11 academic outcomes -Year 9 views of school (tested separately) 69
Table 5.2: Contextualised models for Year 11 benchmark indicators –Year 9 views of schools (tested separately) 70
x
Table 5.3: Contextualised models for Year 11 academic outcomes –Year 9 views of school (tested in the same model) 71
Table 5.4: Contextualised models for Year 11 benchmark indicators –Year 9 views of schools (tested in the same model) 71
Table 5.5: Contextualised models for Year 11 academic outcomes –Year 11 views of school (tested separately) 73
Table 5.6: Contextualised models for Year 11 benchmark indicators –Year 11 views of schools (tested separately) 73
Table 5.7: Contextualised models for Year 11 academic outcomes - Year 9 Time spent on homework 74
Table 5.8: Contextualised models for Year 11 benchmark indicators – Year 9 Time spent on homework 75
Table 5.9: Contextualised models for Year 11 academic outcomes –Year 11 Time spent on homework 75
Table 5.10: Contextualised models for Year 11 benchmark indicators –Year 11 Time spent on homework 76
Table 6.1: Effects of prior attainment on Year 11 academic outcomes 79
Table 6.2: Effects of prior attainment on Year 11 academic outcomes 79
Table 6.3: Effects of prior attainment on Year 11 academic outcomes 80
Table 6.4: Contextualised value added models for Year 11 academic outcomes 83
Table 6.5: Contextualised value added models for Year 11 academic outcomes –Neighbourhood measures 84
Table 6.6: Contextualised value added models for Year 11 academic outcomes –Neighbourhood safety 84
Table 6.7: Contextualised value added models for Year 11 academic outcomes –Attendance 85
Table 6.8: Contextualised value added models for Year 11 academic outcomes –ECERS-R 85
Table 6.9: Contextualised value added models for Year 11 academic outcomes –ECERS-E 86
xi

Table 6.10: Contextualised value added models for Year 11 academic outcomes: Pre-school effectiveness (Early number concepts) 86
Table 6.11: Contextualised value added models for Year 11 academic outcomes –Secondary school type 87
Table 6.12: Contextualised value added models for Year 11 academic outcomes –Secondary school academic effectiveness 88
Table 6.13: Contextualised value added models for Year 11 academic outcomes - Ofsted judgement 89
Table 6.14: Contextualised value added models for Year 11 academic outcomes - Ofsted judgement 90
Table 6.15: Contextualised value added models for Year 11 academic outcomes –Year 9 views of school 91
Table 6.16: Contextualised value added models for Year 11 academic outcomes –Year 9 views of school (tested in the same model) 91
Table 6.17: Contextualised value added models for Year 11 academic outcomes –Year 11 views of school 91
Table 6.18: Contextualised value models for Year 11 academic outcomes –Year 9 Time spent on homework 92
Table 6.19: Contextualised value added models for Year 11 academic outcomes –Year 11 Time spent on homework 93
Table A2.1: Selected characteristics of sample with valid benchmark indicators data in Year 11 127
Table A2.2: Selected characteristics of sample with valid benchmark indicators in Year 11 129
Table A3.1: Correlations of different academic outcomes in Year 6 131
Table A3.2: Correlations of different academic outcomes in Year 9 and Year 6 131
Table A4.1: Contextualised model for total GCSE score in Year 11 - Parents’ highest qualification level 132
Table A4.2: Contextualised model for total GCSE score in Year 11 -Mother’s and Father’s highest qualification level 134
Table A4.3: Contextualised model for grade achieved in full GCSE English in Year 11 -Parents’ highest qualification level 136
xii

Table A4.4: Contextualised model for grade achieved in full GCSE English in Year 11 - Mother’s and Father’s highest qualification level 138
Table A4.5: Contextualised model for grade achieved in full GCSE maths in Year 11- Parents’ highest qualification level 140
Table A4.6: Contextualised model for grade achieved in full GCSE maths in Year 11- Mother’s and Father’s highest qualification level 142
Table A4.7: Contextualised model for total number of full GCSE entries in Year 11- Parents’ highest qualification level 144
Table A4.8: Contextualised model for total number of full GCSE entries in Year 11 -Mother’s and Father’s highest qualification level 146
Table A4.9: Contextualised model for achieving 5 A*-C in Year 11 - Parents’ highest qualification level 148
Table A4.10: Contextualised model for achieving 5 A*-C in Year 11- Mother’s and Father’s highest qualification level 150
Table A4.11: Contextualised model for achieving 5 A*-C including English and maths in Year 11 -Parents’ highest qualification level 152
Table A4.12: Contextualised model for achieving 5 A*-C including English and maths in Year 11 - Mother’s and Father’s highest qualification level) 154
Table A4.13: Contextualised model for achieving EBacc in Year 11 - Parents’ highest qualification level 156
Table A4.14: Contextualised model for achieving EBacc in Year 11 - Mother’s and Father’s highest qualification level 158
Table A5.1: Contextualised value added models for total GCSE score 160
Table A5.2: Contextualised value added models for GCSE English 162
Table A5.3: Contextualised value added models for GCSE maths 164
Table A6.1: Combined effects of pre-school quality and gender on total GCSE score 166
Table A6.2: Combined effects of pre-school quality and gender on GCSE English 166
Table A6.3: Combined effects of pre-school quality and gender on GCSE maths 167
Table A6.4: Combined effects of pre-school quality and parents’ highest qualification level on total GCSE score 167
xiii

Table A6.5: Combined effects of pre-school quality and parents’ highest qualification level on GCSE English 168
Table A6.6: Combined effects of pre-school quality and parents’ highest qualification level on GCSE maths 168
xiv

Executive summary The Effective Pre-school, Primary and Secondary Education (EPPSE 3-16+) project represents the secondary school phase of a major longitudinal study that started in 1997. The original first phase of the research, the Effective Provision of Pre-school Education (EPPE) project, was designed to explore the impact of pre-school on children's cognitive and social-behavioural outcomes, as well as other important background influences (including family characteristics and the home learning environment). For this purpose, a pre-school sample was recruited to the study at age 3. An additional ‘home’ sample of children who had not attended pre-school was recruited later, at the start of primary school. The whole sample was followed up through primary and secondary school until the end of Key Stage 3 (KS3) when they were 14 years old. The EPPSE 3-16+ project is an extension of this research and follows the same sample (pre-school and ‘home’ children) to the end of KS4 of secondary schooling when they were aged 16. Although EPPSE was originally developed to investigate pre-school effects on development, its extension to Key Stage 4 (KS4) allows for the exploration of any additional effects of primary as well as secondary schooling (see Sylva et al., 2014, Taggart et al., 2014).
The research design of this project has been based on a longitudinal educational effectiveness and mixed methods approach (Sammons et al., 2005; Siraj-Blatchford et al., 2006). This type of design allows for the study of individual, family and home influences on children’s and young people’s cognitive/academic and developmental outcomes. Furthermore, the relative importance of background influences can be investigated in relation to the strength of pre-school, primary and secondary school influences.
This report presents the results of analyses of students’ academic attainment at the end of Year 11, when they took the General Certificate of Secondary Education (GCSE) examinations. It also studies the students’ academic progress from the age of 11 to 16, between KS2 and KS4. The results extend the findings about these students’ educational outcomes at younger ages. Companion reports on students’ social-behavioural development, views of schools and dispositions over the same period will be presented separately (Sammons et al., 2014a; 2014b; 2014c).
Throughout the research, the EPPSE project has gathered a wide range of data on children’s development, individual, family, home learning environment (HLE), neighbourhood, pre-school, primary and secondary school characteristics. Measures such as secondary schools’ academic effectiveness1 and Ofsted inspection judgements
1 Independent indicators of secondary school academic effectiveness and quality were obtained from the Department for Education (DfE) and Ofsted. The measure of secondary school academic effectiveness is represented by the average KS2 to KS4 contextual value added (CVA) school level score over 4 years (2006-2009) during which the EPPSE students were in secondary school. The measures of secondary school quality were derived from various Ofsted inspection judgments.
xv

were used to provide indicators of the quality of the secondary schools attended by EPPSE students. These complement the measures of quality2 and effectiveness3 for pre-school settings and the measures of primary school academic effectiveness4. It was therefore possible to explore pre-school, primary and secondary school influences on EPPSE students’ academic attainment in Year 11 as expressed through various outcome measures based on GCSE results. The sample size for the analyses presented in this report varies on different outcomes, but includes a minimum of 2582 students representing over ninety-four percent of the sample tracked to the end of KS4 (n= 2744) and eighty-one percent of the original sample of children who attended pre-school and ‘home’ children (n= 3172).
The aims of this report are to:
• Investigate the relationships between students’ academic attainment in KS4 (Year 11, age 16) and individual student, family and home learning environment (HLE) characteristics.
• Model students’ academic attainment in Year 11, and their progress between KS2 and KS4 (Year 6 to Year 11). It should be noted that in the progress analyses, prior attainment in National Assessment tests taken at the end of primary education (Year 6, KS2) was included as a baseline in the statistical models.
• Explore the continuing influence of pre-school experience, particularly in terms of attendance, quality and academic effectiveness, on students’ later academic outcomes.
• Examine the combined influence of gender, parental qualification levels, HLE and pre-school characteristics on students’ academic attainment in Year 11.
• Investigate the influence of primary school academic effectiveness on later secondary school academic attainment and progress, when individual student, family and HLE characteristics have been taken into account.
2 Pre-school quality was measured for each setting using the aggregate scores from observations made using the ECERS-R (Harms et al., 1998) and ECERS-E (Sylva et al., 2003) – for more details of these measures see Glossary. 3 Measures of the effectiveness of individual pre-school centres were derived from value added models of the children’s progress during the pre-school period, controlling for prior attainment and children’s background characteristics (Sammons et al., 2004a). That is, children’s cognitive/academic progress was analysed from age 3 to rising 5 years and estimates of centre effects derived for a range of outcomes. 4 Independent indicators of primary school academic effectiveness were obtained from the analysis of National Assessment data for several cohorts across all primary schools in England. Mean value added scores of school academic effectiveness across the years 2002 to 2004 were calculated for each primary school in England and then extracted for schools attended by children in the EPPE 3-11 sample. These value added measures provide indicators of a school’s academic effectiveness in terms of National Assessment outcomes (Melhuish et al., 2006a; 2006b).
xvi
• Investigate the influence of secondary school academic effectiveness and quality on students’ academic attainment and progress, when individual student, family and HLE characteristics have been taken into account.
• Explore the influences of student reported experiences of secondary school on their academic attainment and progress when individual student, family and HLE characteristics have been taken into account.
Previously, the project has demonstrated that a range of measures related to child, family and HLE characteristics are important predictors of children’s early cognitive and later academic attainment and progress up to age 14 in secondary school (Sammons et al., 2008a; Sammons et al., 2011a; Sylva et al., 2010). The influences of these characteristics can be detected from a young age and can also predict later educational attainment. Analyses of variations in achievement point to the negative effects of socio-economic disadvantage and the importance of early years experiences. The results have contributed to policy developments in England associated with issues of equity and social inclusion (for example, see Taggart et al., 2008; The Equalities Review, 2007; Sylva et al., 2007) and informed the Allen Review on Early Interventions (2011) and Field Review on Poverty and Life Chances (2010).
The analyses presented in this report are based on the students’ GCSE results at the end of year 11:
• the total GCSE and equivalents point score
• the grade achieved in full GCSE English
• the grade achieved in full GCSE maths
• the total number of full GCSE entries.
The analyses presented in this report also used some important benchmark indicators:
• achieving 5 or more GCSE/GNVQs at grades A*-C
• achieving 5 or more GCSE and equivalents at grades A*-C including GCSE English and maths
• achieving the English Baccalaureate (EBacc).
These analyses identify which child, family and HLE characteristics predict EPPSE students’ KS4 academic attainment. The results show similarities to earlier findings for this sample. While many findings about the influences of gender, parents’ qualification levels or family socio-economic status (SES) are in accord with those from other educational research studies, EPPSE also reveals the continued importance of the early years HLE. The EPPSE project is unique in its exploration of early HLE across different phases of students’ later education. It shows that the early years HLE continues to predict attainment up to age 16. In addition, the latest research discussed in this report demonstrates that various individual and family background characteristics continue to
xvii

shape students’ academic progress between KS2 and KS4 (especially ethnicity, parents’ highest qualification levels and the KS3 HLE measure of academic enrichment).
As well as investigating the impact of child, family and HLE background, the EPPSE research has explored the continued influence of pre-school and primary school as predictors of students’ later attainment at age 16 and also tested a range of measures related to secondary school experiences based on students’ reports of their experiences and views of school in KS3 and KS4. The results, therefore, provide new evidence on the way different educational settings (pre-school, primary and secondary school) affect GCSE attainment and progress across five years in secondary education.
This report focuses on statistical trends and quantitative analyses of factors that predict attainment and progress in KS4 based on results using multilevel statistical models. Elsewhere, EPPSE has reported, in keeping with the mixed methods research design, findings from qualitative case studies of children and families who are educationally successful in overcoming disadvantage (see Siraj-Blatchford et al., 2011). These qualitative data help to provide a broader understanding of the way social disadvantage shapes students’ educational outcomes and experiences at different ages and what factors help to protect against its adverse consequences.
Summary of findings5
Raw differences in attainment for different student groups
Gender In Year 11, on average females continue to obtain better results in GCSE English than males (with a difference of about half a grade). However, there were no significant gender differences in GCSE maths. Females also obtained higher total GCSE scores (Mean=472.3; Std. Deviation=165), were entered for more full GCSEs (Mean=7.6; Std. Deviation=2.7) than males and were more likely to achieve the various DfE benchmark indicators of performance like 5 A*-C, 5 A*-C including English and maths and the EBacc. At younger ages, girls had been found to have higher attainment in reading and English. They also had higher maths and science outcomes in primary school, but by age 14 and later at 16, these differences are no longer statistically significant.
Ethnicity There was some evidence of ethnic differences in attainment, but due to low numbers for most ethnic origin subgroups in the EPPSE sample the results should be interpreted with caution. The differences found in average results by ethnic group are in line with those evident in other studies indicating higher attainment for some groups (e.g., those
5 Only statistically significant differences are presented.
xviii

students of Indian or Bangladeshi heritage) and lower attainment for others (e.g., those students of Pakistani heritage) when compared with students of White UK heritage.
Family characteristics There were marked differences in GCSE attainment related to parents’ qualification levels when children were age 3/5. As might be anticipated, students with highly qualified parents (degree level) had much higher attainment on average than those students whose parents had no qualifications. The differences were equivalent to 141 points for total GCSE score, 10 points in GCSE English, 13 points in GCSE maths (equal to two grades higher e.g., the difference between achieving a grade B instead of a grade D), and 4 extra full GCSE exam entries.
There were also large differences related to family socio-economic status (SES) between those students whose parents were from the professional non-manual category and those from lower SES categories. Moreover, students eligible for Free School Meals (FSM) had lower average attainment than students who were not eligible for FSM. The differences for FSM versus no FSM were around a full GCSE grade in size in GCSE English and GCSE maths.
The quality of the early years HLE showed a clear association with later differences in average GCSE results. The differences for GCSE English and GCSE maths were approximately 10 grade points, and for total GCSE score the difference was 125 points for those who had experienced a high versus low quality early years HLE. This again confirms earlier findings about the likely importance of parents providing a stimulating HLE in the early years.
The net impact of child, family and HLE characteristics on GCSE attainment in Year 11
The average group differences described above do not take into account the relative influence of other characteristics. Multilevel modelling provides more detailed results of the ‘net’ contribution of individual characteristics, whilst controlling for other predictors and so enables the identification of the ‘strongest’ net predictors. For instance, effects can distinguish differences in attainment for students with mothers who have degrees compared with those with no qualifications, net of the influence of other associated family and individual student level characteristics (e.g., family SES, income, HLE, age or gender). Results are reported in effect sizes (ES), a statistical measure of the relative strength of different predictors or in odds ratios (OR) representing the odds of achieving certain benchmark performance indicators given certain characteristics relative to the odds of the reference group (see Summary Tables).
Parents’ highest qualification level, when children were age 3/5, was the strongest net predictor of better attainment in terms of grades in GCSE English (ES=0.69 - for degree versus no qualification; ES=0.80 - for higher degree versus no qualification) and GCSE maths (ES=0.65 - for degree versus no qualification; ES=0.74 - for higher degree versus
xix

no qualification) and achieving 5 A*-C including English and maths (OR=2.86 - for higher degree, OR=3.92 - for degree). All these comparisons are to parents with no qualifications (see Summary Tables).
Differences related to ethnicity were strong predictors of total GCSE score (ES=0.76 for students of Bangladeshi heritage). Family income, measured in KS1, showed larger effects in terms of the likelihood of achieving 5 A*-C (OR=3.94 - for an income larger than £67000 when compared to no earned salary) and the EBacc (OR=4.04 - for an income larger than £67000 when compared to no earned salary).
There were also a number of additional strong/moderately strong effects for various family influences that are noted below:
• Total GCSE score: parents’ highest qualification level, KS3 HLE academic enrichment and the early years HLE.
• GCSE grade in English: ethnicity, family SES, early years HLE, KS3 HLE academic enrichment and family income.
• GCSE grade in maths: family SES, ethnicity, KS3 HLE academic enrichment, early years HLE and Year 11 FSM.
• Total number of full GCSE entries: family SES, ethnicity, family salary, early years HLE and KS3 HLE academic enrichment.
• Achieving 5 A*-C: early years HLE, parents’ highest qualification level, KS3 HLE academic enrichment and gender.
• Achieving 5 A*-C including English and maths: the early years HLE, KS3 HLE academic enrichment, ethnicity and family income.
• English Baccalaureate (EBacc): KS3 HLE academic enrichment, parents’ highest qualification level and gender.
It should be noted that ethnicity was not a significant predictor of the overall benchmark indicators (i.e., achieving 5 A*-C or the EBacc), but it was for the other GCSE outcomes like the total GCSE score and subject grades. Students of Pakistani6 and Bangladeshi7 heritage obtained statistically significant and higher total GCSE scores, better grades in GCSE maths and were entered for more full GCSEs than students of White UK heritage when account was taken of the effects of all other significant predictors like SES, income etc.
Both FSM (a low income indicator; ES=-0.31) and family SES (ES=-0.49 – for unskilled versus professional non-manual) have moderate effects on grades in GCSE English, but
6 This shows that for Pakistani students, their low raw scores are accounted for by background influences. 7 There is only a small sample size of EPPSE students who are of Bangladeshi heritage.
xx

the family SES effect was stronger for grades in GCSE maths (ES=-0.66 - for unskilled versus professional). The SES effects for grades in GCSE English were similar in size to the effects of the early years HLE (ES=0.51 - for high versus low) and KS3 enrichment HLE measure for English (ES=0.48 - for high versus low). Interestingly, the early years HLE had a stronger impact on all measures of students’ GCSE results than the low income indicator, FSM.
Older students (for their age group e.g., Autumn-born) showed better results although the effect was not strong. There were also small positive effects related to the age of the child’s mother (at age 3/5); the older the mother the better the academic outcomes (grades in GCSE English and GCSE maths), but also the higher the likelihood of achieving overall benchmark indicators (5 A*-C and the EBacc) when compared with students whose mothers were younger.
These results broadly confirm patterns identified at younger ages indicating that differences in attainment related to individual student and family background influences emerge early (measured when children were recruited to the study) and remain fairly stable as students progress through primary and secondary school. Evidence for this conclusion was well established in previous research (Mortimore et al., 1988; Nuttall, 1990; Rutter & Madge, 1976; Tizard et al., 1988; Sammons, 1995), but EPPSE shows the important effects of the HLE that have been little studied elsewhere.
Neighbourhood Influences A number of neighbourhood measures were tested as potential predictors of GCSE results from Year 11. These measures reflect the neighbourhood environment in which the child lived while in pre-school and primary school and do not necessarily reflect later neighbourhood environments resulting from moving house.
Previous research has suggested that contextual influences outside the family (such as ‘place poverty’ linked to living in a disadvantaged neighbourhood and school composition) can influence student attainment. Living in a disadvantaged area while in pre-school or primary school and attending a school with a higher representation of disadvantaged students may affect individual student and family aspirations and attitudes towards education, but also teacher expectations, classroom processes and school climate (Leckie, 2009; 2012; Sammons et al., 1997; Sampson, 2012).
Levels of neighbourhood disadvantage measured by the national indicators the Index of Multiple Deprivation (IMD - see Noble et al., 2004), and the Income Deprivation Affecting Children Index (IDACI – see Noble et al., 2008) were used as predictors of GCSE results from Year 11.
The IDACI was a significant and negative predictor of lower grades in GCSE English (ES=-0.15) and in GCSE maths (ES=-0.16), and also of lower likelihood of attaining the benchmark performance indicators (OR ranges between 0.32-0.39). This was not the case during the primary school years, possibly because neighbourhood influences
xxi
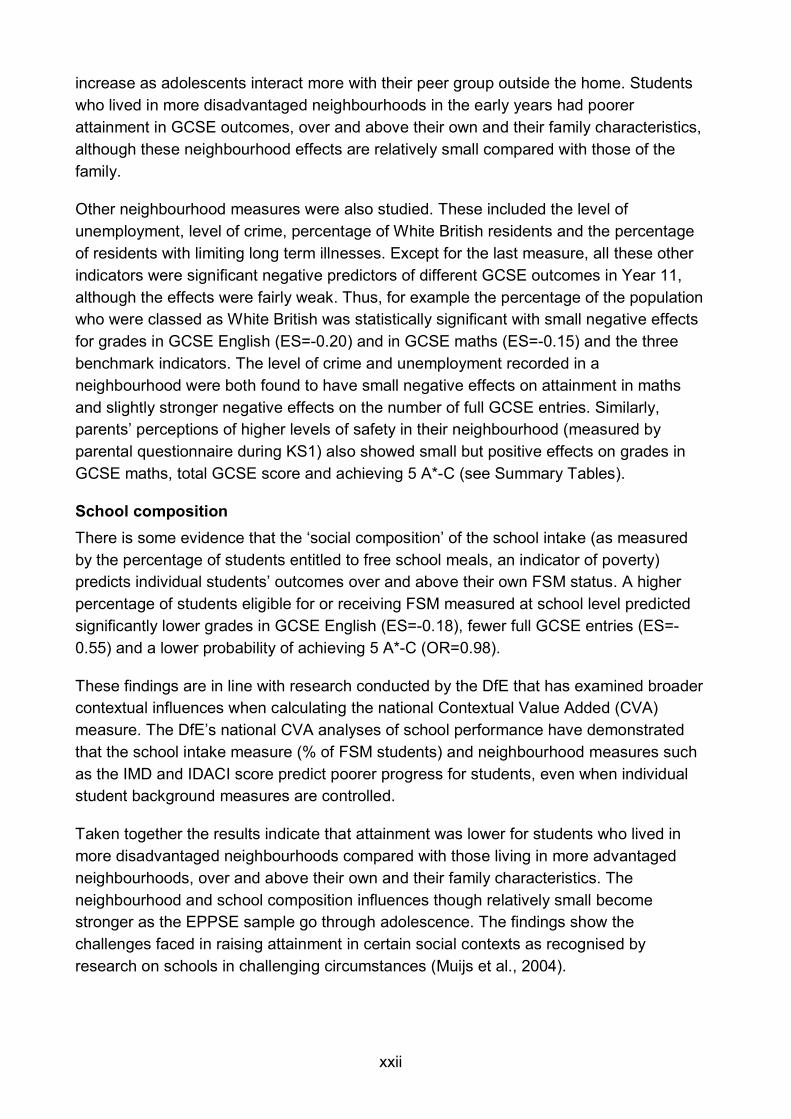
increase as adolescents interact more with their peer group outside the home. Students who lived in more disadvantaged neighbourhoods in the early years had poorer attainment in GCSE outcomes, over and above their own and their family characteristics, although these neighbourhood effects are relatively small compared with those of the family.
Other neighbourhood measures were also studied. These included the level of unemployment, level of crime, percentage of White British residents and the percentage of residents with limiting long term illnesses. Except for the last measure, all these other indicators were significant negative predictors of different GCSE outcomes in Year 11, although the effects were fairly weak. Thus, for example the percentage of the population who were classed as White British was statistically significant with small negative effects for grades in GCSE English (ES=-0.20) and in GCSE maths (ES=-0.15) and the three benchmark indicators. The level of crime and unemployment recorded in a neighbourhood were both found to have small negative effects on attainment in maths and slightly stronger negative effects on the number of full GCSE entries. Similarly, parents’ perceptions of higher levels of safety in their neighbourhood (measured by parental questionnaire during KS1) also showed small but positive effects on grades in GCSE maths, total GCSE score and achieving 5 A*-C (see Summary Tables).
School composition There is some evidence that the ‘social composition’ of the school intake (as measured by the percentage of students entitled to free school meals, an indicator of poverty) predicts individual students’ outcomes over and above their own FSM status. A higher percentage of students eligible for or receiving FSM measured at school level predicted significantly lower grades in GCSE English (ES=-0.18), fewer full GCSE entries (ES=-0.55) and a lower probability of achieving 5 A*-C (OR=0.98).
These findings are in line with research conducted by the DfE that has examined broader contextual influences when calculating the national Contextual Value Added (CVA) measure. The DfE’s national CVA analyses of school performance have demonstrated that the school intake measure (% of FSM students) and neighbourhood measures such as the IMD and IDACI score predict poorer progress for students, even when individual student background measures are controlled.
Taken together the results indicate that attainment was lower for students who lived in more disadvantaged neighbourhoods compared with those living in more advantaged neighbourhoods, over and above their own and their family characteristics. The neighbourhood and school composition influences though relatively small become stronger as the EPPSE sample go through adolescence. The findings show the challenges faced in raising attainment in certain social contexts as recognised by research on schools in challenging circumstances (Muijs et al., 2004).
xxii

Pre-school The EPPSE research was designed to follow up children recruited at pre-school into primary and later secondary school in order to identify the contribution of different educational influences on their later progress and development during various phases of education. In addition to investigating the effects of individual student, family, HLE and neighbourhood characteristics, further analyses sought to establish whether pre-school influences identified as significant predictors of attainment and progress in both cognitive/academic and social-behavioural outcomes at younger ages continued to show effects thirteen years later.
Four measures were tested: pre-school attendance (in comparison with the ‘home’ group); the duration (in months), the quality of the pre-school attended (as measured by the ECERS-R and ECERS-E rating scales – see Glossary) and the effectiveness of the pre-school attended in promoting better child outcomes at entry to primary school.
Attendance
Attending a pre-school was found to be a statistically significant predictor of higher total GCSE score (ES=0.31), more full GCSE entries (ES=0.21), better grades in GCSE English (ES=0.23) and GCSE maths (ES=0.21) and of a higher probability of achieving 5 A*-C including English and maths (OR=1.48) when compared with students from the ‘home’ (or no pre-school) group. Although relatively modest, these effects are still stronger than those found for ‘age’ (i.e. being Autumn rather than Summer born) or the effects of some home learning measures (i.e. KS1 and KS2 HLE or family composition). They indicate that attending a pre-school (versus not) still shapes academic outcomes in the longer term (see Summary Tables).
Duration
The amount of time in months (duration of attendance) that a student had spent in pre-school also showed continued effects on Year 11 academic outcomes. Students who had attended between 2 and 3 years (whether part-time or full-time) in pre-school obtained higher total GCSE scores (ES=0.38), better grades in GCSE English (ES=0.28) and in GCSE maths (ES=0.30), and were entered for more GCSE exams (ES=0.24) than those who had not attended any pre-school.
Quality
There was some evidence that the quality of pre-school also continued to predict better GCSE results (total GCSE score – ES=0.37; GCSE English – ES=0.31; GCSE maths – ES=0.36). Those who had attended a high quality setting were more likely to achieve 5 A*-C including English and maths (OR=1.69) than students who had not attended pre-school. Students who had attended high quality pre-schools showed the most consistent pattern. These quality effects were mostly fairly small although still statistically significant.
xxiii

This pattern shows broadly similar effects, but they are weaker than those found when students were in KS2 in primary school.
Effectiveness
The indicator of pre-school effectiveness in promoting pre-reading skills continued to predict academic attainment at the end of Year 11. Higher levels of pre-school effectiveness predicted more GCSE entries (ES=0.25), better grades in GCSE English (ES=0.31), and having a higher probability of achieving 5 A*-C including English and maths (OR=1.73).
The patterns of relationships between pre-school effectiveness (in terms of early number concepts) and students' later Year 11 academic outcomes also indicate positive and significant effects for grades in GCSE maths (ES=0.35) and total GCSE score (ES=0.48). However, no clear patterns for these predictors emerged for the various GCSE benchmark indicators.
Combined effects
Further analyses explored the joint effects of pre-school quality and gender. The results showed that males who had attended a medium (ES= 0.33) or a high quality (ES= 0.41) pre-school obtained significantly higher grades in GCSE maths than males who had not attended any pre-school at all. Similarly, we investigated the joint effects of pre-school quality and parental qualification levels. Results showed that students of low qualified parents who had attended a high quality pre-school obtained significantly better grades in GCSE English (ES= 0.35) and in GCSE maths (ES= 0.25) than students of low qualified parents who had not attended any pre-school. Additionally, a pre-school quality gradient was evident for grades in GCSE English for those students whose parents had moderate to high qualification levels when compared to students who had not attended a pre-school and whose parents had low qualification levels.
xxiv
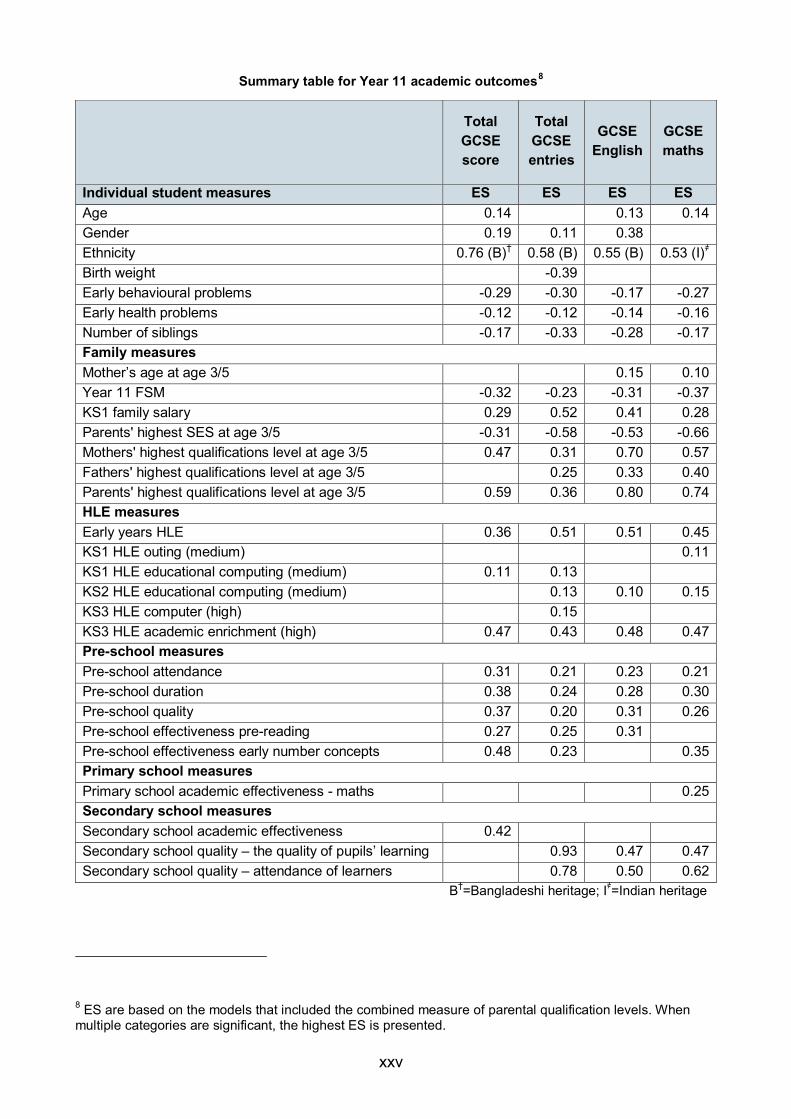
Summary table for Year 11 academic outcomes8
Total GCSE score
Total GCSE entries
GCSE English
GCSE maths
Individual student measures ES ES ES ES Age 0.14 0.13 0.14 Gender 0.19 0.11 0.38 Ethnicity 0.76 (B)† 0.58 (B) 0.55 (B) 0.53 (I)҂ Birth weight -0.39 Early behavioural problems -0.29 -0.30 -0.17 -0.27 Early health problems -0.12 -0.12 -0.14 -0.16 Number of siblings -0.17 -0.33 -0.28 -0.17 Family measures Mother’s age at age 3/5 0.15 0.10 Year 11 FSM -0.32 -0.23 -0.31 -0.37 KS1 family salary 0.29 0.52 0.41 0.28 Parents' highest SES at age 3/5 -0.31 -0.58 -0.53 -0.66 Mothers' highest qualifications level at age 3/5 0.47 0.31 0.70 0.57 Fathers' highest qualifications level at age 3/5 0.25 0.33 0.40 Parents' highest qualifications level at age 3/5 0.59 0.36 0.80 0.74 HLE measures Early years HLE 0.36 0.51 0.51 0.45 KS1 HLE outing (medium) 0.11 KS1 HLE educational computing (medium) 0.11 0.13 KS2 HLE educational computing (medium) 0.13 0.10 0.15 KS3 HLE computer (high) 0.15 KS3 HLE academic enrichment (high) 0.47 0.43 0.48 0.47 Pre-school measures Pre-school attendance 0.31 0.21 0.23 0.21 Pre-school duration 0.38 0.24 0.28 0.30 Pre-school quality 0.37 0.20 0.31 0.26 Pre-school effectiveness pre-reading 0.27 0.25 0.31 Pre-school effectiveness early number concepts 0.48 0.23 0.35 Primary school measures Primary school academic effectiveness - maths 0.25 Secondary school measures Secondary school academic effectiveness 0.42 Secondary school quality – the quality of pupils’ learning 0.93 0.47 0.47 Secondary school quality – attendance of learners 0.78 0.50 0.62
B†=Bangladeshi heritage; I҂=Indian heritage
8 ES are based on the models that included the combined measure of parental qualification levels. When multiple categories are significant, the highest ES is presented.
xxv

Primary school influence Previous EPPSE research has shown that the academic effectiveness of a child’s primary school was a statistically significant predictor of better attainment and progress across KS2 for English and more strongly for maths. Other educational effectiveness research has shown that primary schools can continue to influence students’ longer term academic outcomes at secondary school (Goldstein & Sammons, 1997; Leckie, 2009). Indeed, earlier EPPSE results from KS3 (in Year 9) show that measures of the primary school academic effectiveness significantly predicted their later academic attainment in maths and science three years after transferring to secondary school. The latest GCSE analyses show that primary school academic effectiveness continues to influence EPPSE students’ later academic attainment up to the end of Year 11. Thus, students who had attended a primary school that was more academically effective for maths had significantly better grades in GCSE maths (ES=0.25) than students who had attended a low academically effective primary school. Similarly, students who had previously attended a medium or highly academically effective primary school were almost twice as likely to achieve the EBacc as students who had attended a low academically effective primary school (OR=1.94), after controlling for student, family HLE and neighbourhood influences (see Summary Tables).
Secondary school influences Contextual Value Added (CVA9) measures of the academic effectiveness of secondary schools attended by EPPSE students were obtained from the DfE. These were derived from the DfE’s National Pupil Database (NPD). These CVA measures show the relative progress made by student intakes measured from KS2 to KS4 (across 5 years). In contrast to our primary school academic effectiveness measure that examined results in English, maths and science separately (Melhuish et al., 2006a; 2006b), we did not have subject specific results for these secondary school CVA indicators. The secondary school DfE based CVA combined measure of overall academic effectiveness significantly predicted students’ academic attainment in terms of total GCSE score (ES=0.42), but not the specific subject grades or the benchmark indicators. It is likely that the total GCSE score is more susceptible to overall school level influences as also shown by the larger intra-school correlation. Subject grades are likely to be more shaped by departmental effectiveness (Sammons, Thomas & Mortimore, 1997).
9 The EPPSE CVA indicator is based on DfE CVA results for 4 successive years, covering the 4 EPPSE cohorts, 2006-2009 for all secondary schools attended by EPPSE students. The EPPSE results have an overall CVA averaged mean of 1004, which is close to the national CVA mean of 1000. The students in the sample (based on their secondary school's average CVA score) were divided into high, medium and low CVA effectiveness groups based on the average CVA score to 1 SD above or below the mean; nationally, approximately 10% of secondary schools are 1 SD above the mean and approximately 10% of secondary schools are 1 SD below the mean.
xxvi

Summary table for Year 11 benchmark indicators
Achieved
5 A*-C
Achieved 5 A*-C
English & maths
EBacc
Individual student measures OR10 OR OR Age 1.04 Gender 1.45 1.24 1.74 Ethnicity 2.28(I) ҂ Developmental problems 0.68 0.67 Behavioural problems 0.65 0.63 Health problems 0.63 Number of siblings 0.62 0.69 Family measures Mother’s age at age 3/5 1.33 1.39 Year 11 FSM 0.61 0.51 KS1 family salary 3.94 1.95 4.04 Parents' highest SES at age 3/5 0.50 0.59 0.41 Mothers' highest qualifications level at age 3/5 3.14 4.11 Fathers' highest qualifications level at age 3/5 2.48 2.07 3.16 Parents' highest qualifications level at age 3/5 3.58 3.92 2.83 School level FSM 0.98 0.96 HLE measures Early years HLE 3.61 2.90 KS1 HLE outing (medium) 1.39 KS1 HLE educational computing (medium) 1.36 0.51
(high) KS3 HLE academic enrichment (high) 2.80 2.60 3.89 KS3 HLE parental interest (high) 1.34 Pre-school measures Pre-school attendance 1.48 Pre-school quality 1.69 Pre-school effectiveness pre-reading 1.73 Primary school measures Primary school academic effectiveness - maths 1.94 Secondary school measures Secondary school quality – the quality of pupils’ learning 3.04 2.74 5.44 Secondary school quality – attendance of learners 2.89 2.74
I҂=Indian heritage
10 Odds Ratios represent the odds of achieving certain benchmark performance indicators given certain characteristics relative to the odds of the reference group.
xxvii

Ofsted11 inspection ratings were used to provide additional measures of secondary school quality. EPPSE students who attended secondary schools classified as ‘outstanding’ based on the ‘quality of pupils’ learning and their progress’ had significantly better results in GCSE English (ES=0.47) and GCSE maths (ES=0.47), were more likely to achieve 5 A*-C, 5 A*-C including English and maths, as well as the EBacc than students from secondary schools characterised as ‘inadequate’ in their learning quality. Again, these analyses controlled for students’ individual, family and HLE and neighbourhood characteristics (see Summary Tables).
Ofsted inspectors also rated secondary schools based on the level of attendance of their students. ‘Learners’ attendance’ as rated by Ofsted inspectors was a statistically significant predictor of academic attainment in Year 11. Students from secondary schools rated as ‘outstanding’ on the ‘learners’ attendance’ got higher grades in GCSE English (ES=0.50) and GCSE maths (ES=0.62) than students from secondary schools characterised as ‘inadequate’ while controlling for other influences. Students from ‘outstanding’ schools (in terms of ‘learners’ attendance’) were entered significantly for more full GCSEs than students from schools where attendance was assessed as ‘inadequate’ (ES=0.78). The probability of achieving 5 A*-C and 5 A*-C including English and maths was significantly higher for students from schools with ‘outstanding’ attendance. There was less evidence of differences for schools rated as ‘good’ on Ofsted’s ‘learners’ attendance’ measure.
These results indicate that secondary school quality was important in shaping students’ academic attainment over and above the impact of background characteristics.
Students’ academic progress between KS2 and KS4 Students’ academic progress across five years in secondary school (Year 7-Year 11) was studied by controlling for their prior attainment at the end of primary school and taking account of the significant individual student, family, HLE, neighbourhood and school characteristics discussed previously. Fewer background characteristics predicted progress between KS2 and KS4 than were found to predict attainment. The patterns were similar to those found at younger ages when we studied students’ progress between KS2 and KS3 (Year 7- Year 9) for this sample.
Overall, there was evidence that students with the following characteristics made greater overall academic progress and progress in specific subjects between KS2 and KS4:
• older for their year group (Autumn-born) (total GCSE score - ES=0.16; GCSE English - ES=0.18; GCSE maths - ES=0.20).
11 It should be noted that the inspector data are related to the time EPPSE students were in KS3 and were measured by the inspection frameworks in use between 2005 and 2010.
xxviii

• females (total GCSE score - ES=0.25, GCSE English - ES=0.27; GCSE maths - ES=0.13).
• of Bangladeshi heritage12 (total GCSE score - ES=0.83; GCSE English - ES=0.66; GCSE maths - ES=0.88).
• with higher family incomes (total GCSE score - ES=0.26; GCSE English - ES=0.34; GCSE maths - ES=0.21).
• with higher qualified parents (total GCSE score - ES=0.39; GCSE English - ES=0.59; GCSE maths - ES=0.42).
• who experienced more learning opportunities in terms of KS3 HLE academic enrichment (total GCSE score - ES=0.36; GCSE English - ES=0.37; GCSE maths - ES=0.45).
There were also small negative effects on progress related to early behavioural problems, early health problems and eligibility for FSM. Again, this is in accord with patterns found by EPPSE in KS2 and KS3.
Of the neighbourhood measures tested, only the percentage of White British residents was a significant predictor of poorer student progress in English. For progress in maths however, reported crime, level of unemployment, perceived neighbour safety, and the IMD and IDACI were all statistically significant. These findings indicate that the disadvantage of the school’s intake and students’ neighbourhood characteristics had small negative effects predicting both poorer progress and attainment in some outcomes. The results suggest that neighbourhood context plays some role in shaping students’ outcomes up to age 16.
Similar to findings in Year 9, the pre-school measures and the primary school academic effectiveness measure did not predict academic progress in specific subjects (English and maths) between KS2 and KS4. These may be more sensitive to subject department effects. However, pre-school attendance, quality and effectiveness significantly predicted EPPSE students’ overall academic progress in terms of promoting a higher total GCSE score. Overall GCSE performance is likely to be a broader measure of school effects for all students in contrast to subject results that are more likely to reflect subject department effects. Similarly, the CVA13 measure of secondary school academic effectiveness was a moderately strong predictor of overall academic progress in terms of total GCSE score
12 There is only a small sample size of EPPSE students who are of Bangladeshi heritage. 13 The EPPSE CVA indicator is based on DfE CVA results for 4 successive years, covering the 4 EPPSE cohorts, 2006-2009 for all secondary schools attended by EPPSE students. The EPPSE results have an overall CVA averaged mean of 1004, which is close to the national CVA mean of 1000. The students in the sample (based on their secondary school's average CVA score) were divided into high, medium and low CVA effectiveness groups based on the average CVA score to 1 SD above or below the mean; nationally, approximately 10% of secondary schools are 1 SD above the mean and approximately 10% of secondary schools are 1 SD below the mean.
xxix

(ES=0.53). Moreover, measures of secondary school quality (Ofsted ratings) were significant predictors of progress in specific GCSE subject grades in English and maths but not students’ overall academic progress.
Students’ experiences and views of secondary school Students provided their own views on secondary school characteristics and on their experiences both in Year 9 (see Summary Table below) and Year 11. Various measures of school experiences were identified and tested whether they predicted variations in students’ KS4 academic attainment and progress after control for individual, family, HLE characteristics and the percentage of students on FSM in the school (see related reports Sammons et al., 2014b; 2014c).
Views in Year 9
The results indicate that students who perceived their school to place higher ‘emphasis on learning’ in Year 9 had significantly higher GCSE attainment and made more progress across the five years in secondary school. The summary table below shows the strongest effects were on total GCSE score (ES=0.36). The effect on the overall academic progress was similar (ES=0.33).
Summary table of the effects of Year 9 views of schools on Year 11 academic outcomes
Year 9 views of schools Year 11
Total GCSE score
Year 11 Total GCSE
entries
Year 11 GCSE
English
Year 11 GCSE maths
Fixed effects (continuous) ES Sig ES Sig ES Sig ES Sig Emphasis on learning 0.36 *** 0.26 *** 0.32 *** 0.23 *** Behaviour climate 0.34 *** 0.41 *** 0.34 *** 0.41 *** Headteacher qualities 0.14 * ns 0.12 * ns School environment 0.15 * 0.19 ** 0.12 * 0.13 * Valuing pupils 0.22 *** 0.20 *** 0.15 * ns School/Learning resources 0.20 *** 0.20 *** 0.14 * 0.17 ** Teacher discipline and care 0.14 * ns ns ns Teacher support 0.15 * 0.12 * ns ns
* p<0.05, ** p<0.01, *** p<0.001
EPPSE students’ attainment (in terms of all measures of GCSE results) was also found to be higher when they perceived a more positive ‘behaviour climate’ in their secondary school. The difference was particularly noticeable for grades in GCSE maths and the number of full GCSE entries (ES=0.41). For overall progress and progress in specific subjects the effects were similar and positive. Students’ perceived quality of their ‘school environment’14 was also a predictor of better attainment (in total GCSE score and subject grades), although the effects were smaller. Similarly, small but positive effects were
14 This factor includes attractive and well decorated buildings, cleanliness of toilets etc.
xxx

identified for the factor related to students’ perceptions of how much they felt teachers valued and respected them.
The factor ‘learning resources’ (related to whether students felt the school was well equipped with computers and technology) also predicted better attainment in all continuous measures of GCSE results. All Year 9 factors related to students’ perceptions of school characteristics and processes significantly predicted overall academic progress measured by total GCSE score and progress in English and maths, controlling for Year 6 prior attainment and other background characteristics.
After testing these factors separately as predictors of attainment, we also tested them together to investigate which ones are the most important in predicting academic outcomes in Year 11 when still controlling for the influences of individual student, familial and HLE characteristics. It was found that the two factors ‘emphasis on learning’ and ‘positive behaviour climate’ together significantly predicted the majority of Year 11 academic attainment measures, but also academic progress.
Summary table of the effects of Year 9 views of schools on Year 11 benchmark indicators
Year 9 views of schools Year 11
Achieved 5 A*-C
Year 11 Achieved 5 A*-C
English and maths
Year 11 EBacc
Fixed effects (continuous) OR Sig OR Sig OR Sig Emphasis on learning 5.95 *** 2.51 * 3.00 * Behaviour climate 3.12 *** 2.32 *** 1.94 * Headteacher qualities ns ns ns School environment ns ns ns Valuing pupils 2.44 *** 1.67 * ns School/Learning resources ns ns ns Teacher discipline and care 2.27 * ns ns Teacher support 1.69 * ns ns
* p<0.05, ** p<0.01, *** p<0.001
Views in Year 11
When testing the factors related to students’ experiences and views in Year 11, we found that significantly higher total GCSE scores and better grades in GCSE English were obtained by students who reported that 1) their teachers had a strong focus on learning; 2) in their schools the relationships between students and teachers were good in terms of trust, respect and fairness; 3) there was a high level of monitoring by their teachers; 4) their teacher provided more feedback. The same factors were significant predictors of overall academic progress and progress in English. ‘Positive relationship’ and ‘formative feedback’ were both significant predictors of better GCSE grades in maths and also of academic progress in maths during secondary school. The results point to the importance of school and teaching experiences in both KS3 and KS4 in shaping academic attainment at GCSE level.
xxxi
It is interesting to note that the latest report on PISA 2012 results shows that students in England generally have more favourable views of their schools (in terms of positive climate for learning) and teachers (and their relationships with teachers) than the students from other OECD countries (Wheater et al., 2013). The EPPSE analyses point to the importance of students’ perspectives.
Homework Again, after control for individual, family and HLE influences, the daily time spent on homework, as reported by students in Year 9 and Year 11, were important and strong predictors of better academic attainment and progress in both KS3 and KS4. The strongest effects were noted for those who reported spending 2-3 hours doing homework on a typical school night. Thus, for example, students who reported in Year 9 spending between 2 and 3 hours on homework on an average weeknight were almost 10 times more likely to achieve 5 A*-C (OR=9.97) than students who did not spend any time on homework. A similarly strong result was found for the time spent on homework reported in Year 11 (OR=9.61). Moderate to strong positive effects of time spent on homework were found for total GCSE score, specific GCSE grades and the benchmark indicators, but also on overall academic progress and progress in specific subjects.
Spending more time on homework is likely to increase students’ study skills and opportunities to learn. It may also be influenced by and provide an indicator of self-regulation. Homework is likely to reflect secondary schools’ policies, teachers’ expectations and the academic emphasis in the school as well as encouragement from parents to take school work seriously. These results show that independent study and effort by students are important contributors to academic success at GCSE over and above the important role of all the other background influences and prior attainment.
Implications The latest findings in KS4 are generally in line with those found in the most recent EPPSE analyses of Year 9 outcomes at the end of KS3. The latest findings cover outcomes at GCSE that have very important consequences for students’ subsequent further higher education and employment opportunities. They highlight a number of features of school experience that can be addressed in school improvement policies intended to promote better outcomes for secondary school students. They also point to the potential role of using survey data and other ways to tap into the student ‘voice’ in assessing the quality of their educational experiences. The aspects about secondary school experience identified here show the importance to school leaders and teaching staff of focusing on enhancing the quality of teaching and learning, student support, positive relationships, improving the behavioural climate of the school, ensuring students feel valued, and promoting a high quality physical environment and learning resources. These aspects should be viewed as key features for school self-evaluation and planning for improvement as well as for external evaluation.
xxxii

Policy makers are increasingly interested in student progression in judging school performance. Indeed, schools are now required to publish information on progression in their school, not just on academic attainment.
Overall, the latest results confirm and extend earlier EPPSE findings. The life chances of some children are shaped by important individual, family, home and school experiences from an early age. There is no level playing field at the start of school or in later phases. These early effects of disadvantage emerge at a young age and their influences continue to shape students' later educational outcomes through subsequent phases of their educational careers. It is widely recognised that England has a very large equity gap in achievement in international comparisons and that life chances and social mobility are highly stratified. However, some influences can help to ameliorate the effects of disadvantage. Positive pre-school effects remain evident, while secondary school experiences are also relevant. There are important and probably reciprocal associations between academic and social-behavioural development.
Disadvantage remains a complex and multi-faceted concept. The longitudinal EPPSE research indicates that disadvantage is by no means captured by one simple indicator such as the FSM status of a student. This has important implications for funding to tackle disadvantage. Poverty, in terms of FSM status, does not embrace the full range of characteristics which are shown in this report to shape students’ academic outcomes. The concept of multiple disadvantage is important and the challenges facing schools, parents and communities, in promoting better outcomes for students from disadvantaged homes and contexts remain strongly evident (related to neighbourhood and school composition influences).
Educational influences (including pre-school) have an important part to play in supporting those ‘at risk’ and can promote better outcomes by ameliorating the adverse effects of disadvantage. But the EPPSE data shows that equity gaps emerge early for all outcomes (cognitive/academic and social-behavioural) and remain strongly evident across different phases of education.
Taken together, the EPPSE research indicates that no single educational influence acts as a ‘magic bullet’ that can overcome disadvantage. However, parental actions that provide a better home learning environment and also supportive educational environments (pre-school, primary and secondary school) can make a difference to children and young people’s academic and other important educational outcomes and so can help to improve life chances. The findings confirm that pre-school effects last and have particular relevance for policy making. The academic effectiveness of the primary school, and later of the secondary school, attended also predicted students’ attainment and progress. Those fortunate to attend more academically effective or higher quality schools receive a significant boost in terms of GCSE outcomes at age 16. There are also clear implications for practitioners about the role of students’ secondary school experiences that can support school improvement strategies in KS3 and KS4.
xxxiii
1 Introduction The Effective Pre-school, Primary and Secondary Education project (EPPSE 3-16+) is a large-scale, longitudinal study funded by the Department for Education (DfE). The Effective Provision of Pre-school Education (EPPE) project was originally designed to investigate the influence of early childhood provision in promoting young children’s cognitive/academic and social development during pre-school and into early primary education.
The EPPE project was the first study of pre-schools in Europe to adopt an educational effectiveness design based on sampling children from a range of different pre-school settings (centres). It used a mixed methods educational effectiveness design to study children and their pre-school settings. The project was extended to follow the original sample through their later years in primary school and subsequently through their secondary school education. These extensions were intended to explore whether any pre-school effects persist across later phases of education and also sought to examine primary school and secondary school influences on academic and social-behavioural outcomes.
In the first stage of the project, children were initially tracked from pre-school to the start of primary school. In addition to the pre-school sample, children who had not attended any pre-school setting were also sampled (referred to as the ‘home’ group). Measures of the quality of the 141 pre-school centres that the sample attended were recorded from five regions across England. The centres were representative of six types of provision: nursery classes, playgroups, local authority day nurseries, private day nurseries, nursery schools and integrated centres (for details on the characteristics of these centres see Sammons et al., 2002; 2003).
The sample was then followed up to the end of Key Stage 1 (KS1) in primary school (age 7 plus years). Results of analyses of children’s cognitive/academic and social-behavioural outcomes in KS1 were reported by Sammons et al. 2004b and 2004c. The research then continued to track the original sample to the end of KS2 (age 11) (Sammons et al., 2007a; 2007b; 2008a; 2008b; Sylva et al., 2010). This phase of the research was designed to explore the continuing pre-school influences and the effects of primary school.
Subsequently, the project (EPPSE 3-14) focused on the same sample of students’ development in KS3 (age 14). Analyses examined the influences of pre-school, primary school and secondary school on these students’ academic attainment, their social-behavioural development and their dispositions at the end of Year 9, as well as on their progress between KS2 and KS3 (Sammons et al., 2011a; 2011b; 2011c).
1

The final stage, EPPSE 3-16+ explores the potential effects of pre-schools, primary schools and secondary schools on the same students’ outcomes at the end of compulsory schooling in Year 11. This report focuses on the analyses of EPPSE students’ academic outcomes measured by their General Certificate of Secondary Education (GCSE) results at the end of Year 11. EPPSE 3-16+ follows the practice of the previous phases of the project and continues to use a mixed methods approach (combining qualitative and quantitative methods) and an educational effectiveness design, including detailed statistical analyses of effectiveness and in-depth case studies of individual students and families (Sammons et al., 2005; Siraj-Blatchford et al., 2006; Sylva et al., 2010).
Aims The aims of this report are to:
• Investigate the relationships between students’ academic attainment in KS4 (Year 11, age 16) and individual student, family and home learning environment (HLE) characteristics.
• Model students’ academic attainment in Year 11, and their progress between KS2 and KS4 (Year 6 to Year 11). It should be noted that in the progress analyses, prior attainment in National Assessment tests taken at the end of primary education (Year 6, KS2) was included as a baseline in the statistical models.
• Explore the continuing influence of pre-school experience, particularly in terms of attendance, quality and academic effectiveness on students’ later academic outcomes.
• Examine the combined impact of gender, parental qualification levels and the home learning environment (HLE) and pre-school characteristics.
• Investigate the influence of primary school academic effectiveness on later secondary school academic attainment and progress, when individual student, family and home learning environment (HLE) characteristics have been taken into account.
• Investigate the influence of secondary school academic effectiveness and quality on EPPSE students’ academic attainment and progress, when individual student, family and home learning environment (HLE) characteristics have been taken into account.
• Explore the influences of student reported experiences of secondary school on their academic attainment and progress when individual student, family and HLE characteristics have been taken into account.
2

Analyses strategy A range of statistical techniques are employed including simple descriptive and correlation analyses and more complex approaches such as multilevel (hierarchical) modelling, used to examine the influence of different characteristics in predicting students’ academic attainment and progress. This report focuses on GCSE results in terms of total scores and subject specific grades, as well as on the benchmark measures of achievement of 5 or more GCSE/GNVQs at grades A*-C and the English Baccalaureate (EBacc). Age standardised National Assessment data at the end of Year 6 in English and maths were used as measures of prior attainment in analyses studying progress between KS2 and KS4. In addition, exploratory and confirmatory factor analysis has been used to identify underlying dimensions of the HLE in KS3 and to derive measures of students’ experiences of secondary school based on self-report questionnaire surveys.
Multilevel (hierarchical) regression models were used to study the influence of various individual student, family, HLE and neighbourhood characteristics as predictors of variation in students’ Year 11 academic outcomes. These models were extended to explore the effects of various pre-school, primary and secondary school influences on later academic attainment and progress between KS2 and KS4. Earlier analyses in the pre-school phase of the research enabled the calculation of value added estimates (residuals) of individual pre-school centre effects for the students who had attended a pre-school centre (for details see Sammons et al., 2002). These value added measures of centre effectiveness have been included in subsequent analyses of students’ educational outcomes in the longitudinal follow-up, including the GCSE results in Year 11 of secondary school to establish whether the effectiveness of the pre-school originally attended continues to shape later academic attainment.
To examine the potential impact of primary school, measures of primary school academic effectiveness in English, maths and science were derived from independent value added analyses of student progress for three successive full cohorts of children in English primary schools (2002-2004) using National Assessment data sets matched between KS1 and KS2 over three years (see Melhuish et al., 2006a; 2006b). The impact of secondary school academic effectiveness was explored using DfE contextual value added (CVA) indicators constructed using national data sets for all secondary schools. Additional data on secondary school quality was added to the EPPSE data sets based on various Ofsted inspection judgements.
As well as developing statistical models for student attainment in Year 11, further analyses of students’ academic progress were conducted to model the changes in EPPSE students’ outcomes from Year 6 (end of KS2, age 11) to Year 11 (in KS4, age 16). These analyses were used to explore how individual, family, HLE, neighbourhood and various educational (pre-school, primary and secondary school) influences shape students academic progress in secondary education.
3
Structure of the report and analyses This report is divided into seven sections. This first section has introduced the EPPSE 3-16+ study and the aims of the research on GCSE outcomes in Year 11. Section two provides the background information concerning the characteristics of the EPPSE 3-16+ sample and investigates the extent of the equity gap in attainment for different groups of students in their GCSE results. The group differences reported in Section 2 do not control for other influences. They are ‘raw’ univariate attainment differences in GCSE outcomes, whereas the results reported in later sections are based on analyses using multilevel models and are calculated ‘net’ of the influence of other predictors.
Section three examines the extent to which different individual student, family and HLE background characteristics account for variations in students’ GCSE results. The ‘net’ influence of different background characteristics on students’ attainments is explored. These analyses identify the unique (net) contribution of particular characteristics to variation in students’ academic outcomes, while other influences are controlled. Thus, for example, the influence of family socio-economic status (SES) is established while taking into account the influence of parents’ qualification levels, income, ethnicity, birth weight, HLE etc. Results are reported in effect sizes (ES), a statistical measure of the relative strength of different predictors or in odds ratios (OR), representing the odds of achieving certain benchmark performance indicators given certain characteristics relative to the odds of the reference group. In addition, estimates shown in tables illustrate differences in terms of total GCSE score or grades in GCSE English or GCSE maths. It is of policy interest to establish the nature and strength of such background influences individually and collectively, as they are relevant to issues of equity and social inclusion.
The fourth section explores the continued influence of pre-school, primary and secondary school experience on students’ academic attainment at the end of Year 11. As shown in previous reports, pre-school experience gave children a better start to primary school in terms of higher academic attainment and improved social-behavioural outcomes. Lack of pre-school experience, particularly for more vulnerable groups of young children, was found to be a further disadvantage (Sammons et al., 2002; 2003). The effect of pre-school attendance was, in these earlier analyses, supplemented with other measures of pre-school centre influence, namely the observed quality of pre-school provision (measured by the ECERS-R and ECERS-E scales – see Sylva et al., 2006) and pre-school centre effectiveness (measured by value added residual estimates based on cognitive/academic progress during the pre-school period). These pre-school measures proved to be significant predictors of later academic attainment for the EPPSE sample measured at the end of primary school.
4

In this report, we explore the potential lasting effects of attending pre-school on academic attainment in secondary school. Similarly, the predictive influence of measures of primary school academic effectiveness15 on students’ later academic outcomes in Year 11 is also explored. In addition, the analyses establish whether certain groups of students are more sensitive to the academic effectiveness of the primary school they had attended than other students. The predictive influences of measures of secondary school academic effectiveness16 and quality measured by Ofsted inspection judgements are also studied.
Section five shows the results of the analyses that examine the predictive influences of students’ self-views and views of their school on the various measures of academic outcomes in Year 11.
Section six presents the results of analyses focused on students’ academic progress from the end of Year 6 in primary school to the end of Year 11 in secondary school. Value added multilevel analyses of students’ academic progress between KS2 and KS4 have been conducted; these analyses controlled for prior attainment (at the end of Year 6) in analysing progress over time. They are used to complement the contextualised models of attainment to establish how far background characteristics and educational measures of pre-schools and primary schools also predict progress between KS2 and KS4. Section seven discusses the findings and presents the main conclusions.
15 These were value added academic effectiveness measures for primary schools that were calculated independently using National Assessment data for all primary schools in England linking KS1 and KS2 results (Melhuish et al., 2006a; 2006b). 16 These were KS2-KS4 CVA academic effectiveness measures for secondary schools provided by the DfE.
5
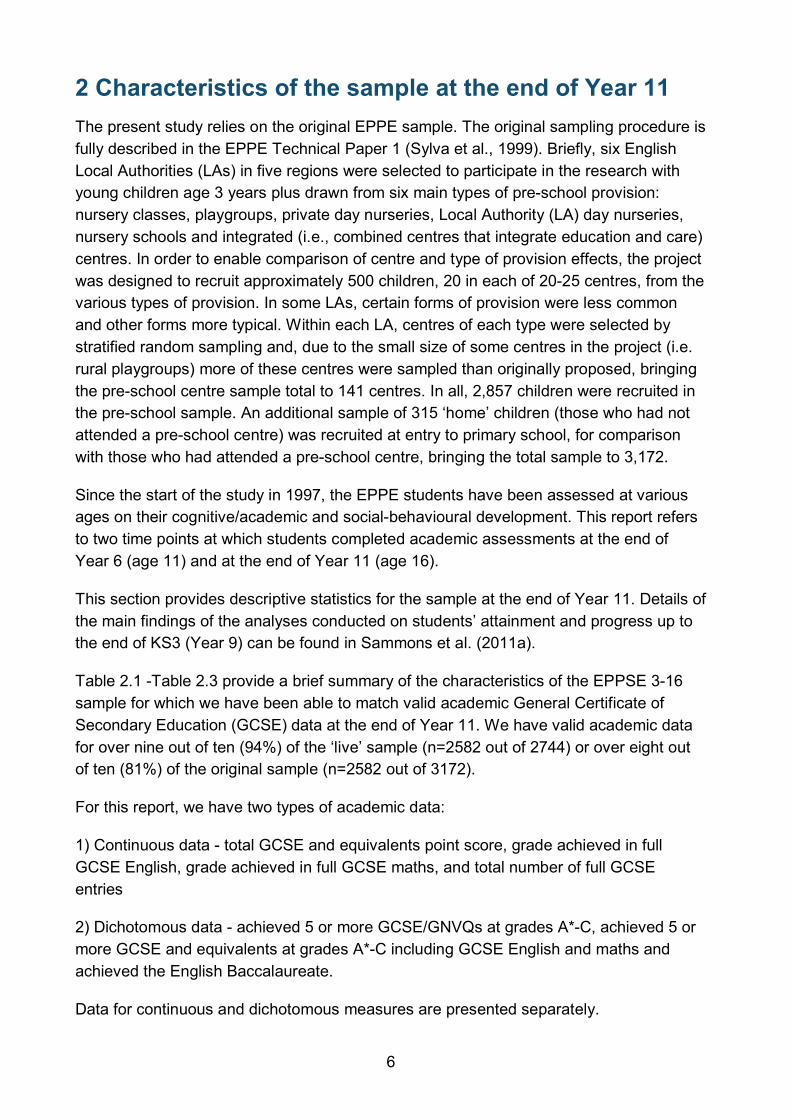
2 Characteristics of the sample at the end of Year 11 The present study relies on the original EPPE sample. The original sampling procedure is fully described in the EPPE Technical Paper 1 (Sylva et al., 1999). Briefly, six English Local Authorities (LAs) in five regions were selected to participate in the research with young children age 3 years plus drawn from six main types of pre-school provision: nursery classes, playgroups, private day nurseries, Local Authority (LA) day nurseries, nursery schools and integrated (i.e., combined centres that integrate education and care) centres. In order to enable comparison of centre and type of provision effects, the project was designed to recruit approximately 500 children, 20 in each of 20-25 centres, from the various types of provision. In some LAs, certain forms of provision were less common and other forms more typical. Within each LA, centres of each type were selected by stratified random sampling and, due to the small size of some centres in the project (i.e. rural playgroups) more of these centres were sampled than originally proposed, bringing the pre-school centre sample total to 141 centres. In all, 2,857 children were recruited in the pre-school sample. An additional sample of 315 ‘home’ children (those who had not attended a pre-school centre) was recruited at entry to primary school, for comparison with those who had attended a pre-school centre, bringing the total sample to 3,172.
Since the start of the study in 1997, the EPPE students have been assessed at various ages on their cognitive/academic and social-behavioural development. This report refers to two time points at which students completed academic assessments at the end of Year 6 (age 11) and at the end of Year 11 (age 16).
This section provides descriptive statistics for the sample at the end of Year 11. Details of the main findings of the analyses conducted on students’ attainment and progress up to the end of KS3 (Year 9) can be found in Sammons et al. (2011a).
Table 2.1 -Table 2.3 provide a brief summary of the characteristics of the EPPSE 3-16 sample for which we have been able to match valid academic General Certificate of Secondary Education (GCSE) data at the end of Year 11. We have valid academic data for over nine out of ten (94%) of the ‘live’ sample (n=2582 out of 2744) or over eight out of ten (81%) of the original sample (n=2582 out of 3172).
For this report, we have two types of academic data:
1) Continuous data - total GCSE and equivalents point score, grade achieved in full GCSE English, grade achieved in full GCSE maths, and total number of full GCSE entries
2) Dichotomous data - achieved 5 or more GCSE/GNVQs at grades A*-C, achieved 5 or more GCSE and equivalents at grades A*-C including GCSE English and maths and achieved the English Baccalaureate.
Data for continuous and dichotomous measures are presented separately.
6

Continuous measures In terms of gender, the sample with valid academic data was almost equally split between males (51%) and females (49%). The majority of the students (75%) were of White UK heritage, while young people of Bangladeshi heritage represented the smallest ethnic group (1%).
Regarding family structure, less than one in five of the young people (15%) were from large families (defined as having 3 or more siblings when recruited to the study), while more than half of the sample had one or two siblings (63%). Table 2.1 also shows the distribution of the early years HLE index, which is a measure of the home learning environment in the early years (see Appendix 1; Melhuish et al., 2008; Sammons et al., 2002; 2003; 2004a). A number of measures collected using a parent interview at entry to the study contributed to the early years HLE index. These measures were based on the frequency of engagement in specific activities involving the child such as, teaching the alphabet, reading to the child, listening to the child read, taking the child to the library etc. (as reported by the parents at interview). Over four out of ten (43%) of the adolescents had experienced a good or very good home learning environment in the early years. Less than one in ten (9%) of the current sample had a very poor early years HLE. In the present sample, less than one in ten (9%) of the adolescents had not attended any type of pre-school (the ‘home’ group) before entering primary school.
7

Table 2.1: Selected characteristics of sample with valid academic continuous data - Part 1
Background characteristics
Total GCSE score
N=2746
GCSE English N=2630
GCSE maths
N=2620
No. of GCSE entries N=2682
N % N % N % N % Gender Male 1405 51.2 1326 50.4 1329 50.7 1366 50.9 Female 1341 48.8 1304 49.6 1291 49.3 1316 49.1 Total 2746 100.0 2630 100.0 2620 100.0 2682 100.0 Ethnicity White European heritage 94 3.4 87 3.3 87 3.3 88 3.3 Black Caribbean heritage 108 3.9 102 3.9 102 3.9 103 3.8 Black African heritage 47 1.7 45 1.7 44 1.7 46 1.7 Any other ethnic minority heritage 65 2.4 63 2.4 63 2.4 64 2.4 Indian heritage 59 2.2 57 2.2 56 2.1 58 2.2 Pakistani heritage 144 5.2 139 5.3 139 5.3 140 5.2 Bangladeshi heritage 29 1.1 28 1.1 28 1.1 29 1.1 Mixed heritage 153 5.6 138 5.3 138 5.3 141 5.3 White UK heritage 2045 74.5 1969 74.9 1961 74.9 2011 75.0 Total 2744 100.0 2628 100.0 2618 100.0 2680 100.0 Number of siblings in the house (age 3/5) No siblings 537 19.6 513 19.5 511 19.5 522 19.5 1 sibling 986 35.9 953 36.2 942 36.0 969 36.1 2 siblings 727 26.5 705 26.8 703 26.8 716 26.7 3+ siblings 409 14.9 381 14.5 386 14.7 395 14.7 Missing 87 3.2 78 3.0 78 3.0 80 3.0 Total 2746 100.0 2630 100.0 2620 100.0 2682 100.0 Early Years HLE Index <13 251 9.6 228 9.1 231 9.3 239 9.4 14-19 583 22.3 553 22.1 554 22.2 569 22.3 20-24 641 24.5 613 24.5 614 24.6 626 24.5 25-32 834 31.9 812 32.4 807 32.3 821 32.1 >33 303 11.6 300 12.0 291 11.7 301 11.8 Total 2612 100.0 2506 100.0 2497 100.0 2556 100.0 Type of pre-school Nursery class 524 19.1 501 19.0 496 18.9 514 19.2 Playgroup 545 19.8 530 20.2 533 20.3 538 20.1 Private day nursery 433 15.8 428 16.3 418 16.0 432 16.1 Local authority day nursery 348 12.7 322 12.2 318 12.1 331 12.3 Nursery schools 473 17.2 457 17.4 461 17.6 465 17.3 Integrated (combined) centres 161 5.9 153 5.8 153 5.8 154 5.7 Home 262 9.5 239 9.1 241 9.2 248 9.2 Total 2746 100.0 2630 100.0 2620 100.0 2682 100.0
8

Table 2.2: Selected characteristics of sample with valid academic continuous data - Part 2
Background characteristics
Total GCSE score
N=2746
GCSE English N=2630
GCSE maths
N=2620
No. of GCSE entries N=2682
N % N % N % N % Mother’s qualification level None 562 21.4 515 20.4 522 20.8 536 20.9 Vocational 392 14.9 374 14.8 378 15.1 384 14.9 16 Academic 1007 38.4 979 38.8 975 38.8 990 38.5 18 Academic 214 8.2 212 8.4 213 8.5 214 8.3 Degree or higher degree 411 15.7 405 16.1 389 15.5 409 15.9 Other professional 38 1.4 36 1.4 34 1.4 36 1.4 Total 2624 100.0 2521 100.0 2511 100.0 2569 100.0 Father’s qualification level None 424 16.0 401 15.7 405 15.9 411 15.8 Vocational 302 11.4 296 11.6 297 11.7 300 11.5 16 academic 629 23.7 617 24.2 617 24.3 626 24.1 18 academic 189 7.1 182 7.1 182 7.2 186 7.2 Degree or higher degree 436 16.4 429 16.8 415 16.3 434 16.7 Other professional 28 1.1 25 1.0 24 0.9 25 1.0 Absent father 649 24.4 601 23.6 601 23.7 619 23.8 Total 2657 100.0 2551 100.0 2541 100.0 2601 100.0 Family highest SES (age 3/5) Professional non-manual 223 8.4 221 8.7 210 8.3 222 8.5 Other professional non-manual 658 24.8 647 25.4 637 25.1 651 25.0 Skilled non-manual 880 33.1 850 33.3 856 33.7 865 33.3 Skilled manual 403 15.2 379 14.9 384 15.1 391 15.0 Semi-skilled 352 13.3 327 12.8 324 12.8 338 13.0 Unskilled 65 2.4 59 2.3 59 2.3 62 2.4 Unemployed/not working 75 2.8 69 2.7 70 2.8 71 2.7 Total 2656 100.0 2552 100.0 2540 100.0 2600 100.0 FSM (Year 11) No Free School Meals (FSM) 2200 81.3 2130 82.1 2116 81.9 2159 81.6 Free School Meals (FSM) 507 18.7 463 17.9 467 18.1 486 18.4 Total 2707 100.0 2593 100.0 2583 100.0 2645 100.0 Family earned income (KS1) No earned salary 502 23.5 459 22.3 463 22.6 479 22.8 £ 2,500 – 17,499 449 21.0 435 21.1 437 21.3 444 21.2 £ 17,500 – 29,999 378 17.7 369 17.9 371 18.1 373 17.8 £ 30,000 – 37,499 253 11.8 248 12.0 249 12.1 250 11.9 £ 37,500 – 67,499 411 19.2 406 19.7 399 19.5 409 19.5 £ 67,500 – 132,000+ 144 6.7 143 6.9 132 6.4 144 6.9 Total 2137 100.0 2060 100.0 2051 100.0 2099 100.0 SEN status (Year 11) No special provision 2048 78.3 2037 80.4 2025 79.9 2041 79.3 School action 296 11.3 287 11.3 287 11.3 294 11.4 School action plus 179 6.8 158 6.2 158 6.2 167 6.5 Statement of SEN 92 3.5 52 2.1 63 2.5 73 2.8 Total 2615 100.0 2534 100.0 2533 100.0 2575 100.0
9

Table 2.2 shows that, in terms of parents’ qualification levels, less than a fifth (16-17%) of mothers and fathers had a degree or a higher degree. About a third (33%) of students originated from families characterised by high levels of socio-economic status17 (SES). A higher percentage (48%) of student’s parents were classified as skilled (either manual or non manual) and only a very small percentage (3%) were unemployed. Nearly a fifth (19%) of the students were eligible or receiving free school meals (FSM) in Year 1118. Almost half of the sample (44%) lived in families with low (below £17,500) or no earned income19. The majority (80%) of the students did not have any special educational (SEN) provision, while around 3% had a full SEN statement.
Dichotomous measures - performance benchmark indicators Female students were more likely to have achieved 5 or more GCSE/GNVQs at grades A*-C (62%) than males (52%) as is seen in Table 2.3. Most of the individual ethnic groups in the sample are relatively small so results should be interpreted with caution. The majority were more likely to have achieved 5 or more GCSE/GNVQs at A*-C than not, except for Pakistani students who were less likely to have achieved at this level. Indian students (over 70%) showed the highest frequencies in terms of achieving 5 or more GCSE/GNVQs at grades A*-C.
The greater the family size is the lower the likelihood of achieving 5 or more GCSE at grades A*-C. A clear gradation pattern is shown for the relationship between early years HLE and whether students achieved 5 or more GCSE/GNVQs at grades A*-C, with students who experienced a more favourable early years HLE (highest scores) being more likely to have achieved 5 or more GCSE/GNVQs at grades A*-C. Students who had attended a private day nursery were the most likely to have achieved 5 or more GCSE/GNVQs at grades A*-C, while the students who had not attended any form of pre-school provision were the least likely to have achieved at this level (see Table 2.3).
17 Family SES was calculated by considering the highest SES status of the mother or the father. 18 The FSM information collected with the EPPSE Year 11 Pupil Profile Questionnaire had a high percentage of missing values (39%). Therefore, this information was combined with the FSM information available from the National Pupil Database (NPD). Additionally, it is important to stress that the EPPSE FSM data represents the students who actually received FSM, while the NPD data indicates the students who are eligible to receive FSM. NPD ‘s definition of the FSM eligibility: “Pupils should be recorded as eligible (true) only if a claim for free school meals has been made by them or on their behalf by parents and either (a) the relevant authority has confirmed their eligibility and a free school meal is currently being provided for them, or (b) the school or the LEA have seen the necessary documentation (for example, an Income Support order book) that supports their eligibility, and the administration of the free meal is to follow as a matter of process. Conversely, if students are in receipt of a free meal but there is confirmation that they are no longer eligible and entitlement will be revoked, false should be applied.” 19 Based on data collected by parent questionnaires completed when students were in KS1 of primary school.
10

Table 2.3: Selected characteristics of sample with valid academic dichotomous data - Part 1
Background characteristics
Achieved 5 or more GCSE/GNVQs at grades A*-C N=2763
No Yes Total N % N % N %
Gender Male 682 48.2 733 51.8 1415 100.0 Female 511 37.9 837 62.1 1348 100.0 Total 1193 43.2 1570 56.8 2763 100.0 Ethnicity White European heritage 43 45.3 52 54.7 95 100.0 Black Caribbean heritage 55 50.5 54 49.5 109 100.0 Black African heritage 20 42.6 27 57.4 47 100.0 Any other ethnic minority heritage 29 43.9 37 56.1 66 100.0 Indian heritage 17 28.8 42 71.2 59 100.0 Pakistani heritage 81 55.9 64 44.1 145 100.0 Bangladeshi heritage 11 37.9 18 62.1 29 100.0 Mixed heritage 73 47.1 82 52.9 155 100.0 White UK heritage 862 41.9 1194 58.1 2056 100.0 Total 1191 43.1 1570 56.9 2761 100.0 Number of siblings in the house (age 3/5) No siblings 220 40.9 318 59.1 538 100.0 1 sibling 358 36.1 633 63.9 991 100.0 2 siblings 312 42.6 420 57.4 732 100.0 3 or more siblings 241 58.2 173 41.8 414 100.0 Missing 62 70.5 26 29.5 88 100.0 Total 1193 43.2 1570 56.8 2763 100.0 Early Years HLE Index 0-13 175 68.4 81 31.6 256 100.0 14-19 309 52.9 275 47.1 584 100.0 20-24 291 45.0 355 55.0 646 100.0 25-32 283 33.8 555 66.2 838 100.0 33-45 46 15.1 258 84.9 304 100.0 Total 1104 42.0 1524 58.0 2628 100.0 Type of pre-school Nursery class 235 44.8 290 55.2 525 100.0 Playgroup 244 44.4 305 55.6 549 100.0 Private day nursery 86 19.8 348 80.2 434 100.0 Local authority day nursery 188 53.3 165 46.7 353 100.0 Nursery schools 192 40.6 281 59.4 473 100.0 Integrated (combined) centres 77 47.8 84 52.2 161 100.0 Home 171 63.8 97 36.2 268 100.0 Total 1193 43.2 1570 56.8 2763 100.0 Pre-school attendance Pre-school 1022 41.0 1473 59.0 2495 100.0 No pre-school 171 63.8 97 36.2 268 100.0 Total 1193 43.2 1570 56.8 2763 100.0
11

Table 2.4: Selected characteristics of sample with valid academic dichotomous data - Part 2
Background characteristics
Achieved 5 or more GCSE/GNVQs at grades A*-C N=2763
No Yes Total N % N % N %
Mother’s qualification level None 393 68.7 179 31.3 572 100.0 Vocational 179 45.4 215 54.6 394 100.0 16 Academic 441 43.7 569 56.3 1010 100.0 18 Academic 59 27.6 155 72.4 214 100.0 Degree or higher degree 30 7.3 382 92.7 412 100.0 Other professional 6 15.8 32 84.2 38 100.0 Total 1108 42.0 1532 58.0 2640 100.0 Father’s qualification level None 277 65.0 149 35.0 426 100.0 Vocational 105 34.7 198 65.3 303 100.0 16 academic 255 40.3 377 59.7 632 100.0 18 academic 50 26.5 139 73.5 189 100.0 Degree or higher degree 42 9.6 396 90.4 438 100.0 Other professional 8 28.6 20 71.4 28 100.0 Absent father 392 59.7 265 40.3 657 100.0 Total 1129 42.2 1544 57.8 2673 100.0 Family highest SES (age 3/5) Professional non manual 18 8.0 206 92.0 224 100.0 Other professional non manual 146 22.2 512 77.8 658 100.0 Skilled non manual 372 42.0 513 58.0 885 100.0 Skilled manual 256 63.2 149 36.8 405 100.0 Semi-skilled 239 66.9 118 33.1 357 100.0 Unskilled 51 75.0 17 25.0 68 100.0 Unemployed /not working 44 58.7 31 41.3 75 100.0 Total 1126 42.1 1546 57.9 2672 100.0 FSM at Year 11 No Free School Meals (FSM) 815 36.9 1395 63.1 2210 100.0 Free School Meals (FSM) 360 70.0 154 30.0 514 100.0 Total 1175 43.1 1549 56.9 2724 100.0 Family earned income at KS1 No earned salary 314 61.6 196 38.4 510 100.0 £ 2,500 – 17,499 232 51.4 219 48.6 451 100.0 £ 17,500 – 29,999 136 35.9 243 64.1 379 100.0 £ 30,000 – 37,499 77 30.4 176 69.6 253 100.0 £ 37,500 – 67,499 78 19.0 333 81.0 411 100.0 £ 67,500 – 132,000+ 7 4.9 137 95.1 144 100.0 Total 844 39.3 1304 60.7 2148 100.0 SEN status at Year 11 No special provision 641 31.3 1408 68.7 2049 100.0 School action 231 77.0 69 23.0 300 100.0 School action plus 157 87.2 23 12.8 180 100.0 Statement of SEN 87 91.6 8 8.4 95 100.0 Total 1116 42.5 1508 57.5 2624 100.0
12

Parental highest qualification levels were also related to the likelihood of achieving a higher number of GCSE grades at A*-C. The higher the qualification level of the mother or the father, the more likely students had achieved the benchmark level. Similar patterns can be seen for the measures of family salary and socio-economic status (see Table 2.4).
Students eligible or receiving FSM as well as students with special educational needs (SEN) were less likely to achieve 5 or more GCSE/GNVQs at grades A*-C (30% versus 63% for FSM versus no FSM).
Please see Appendix 2 for the sample’s distributions across other dichotomous outcomes.
Academic assessments To take account of development and age, the study uses different type of measures for academic outcomes at different time points:
• Year 6 National Assessment at KS2 English and maths /decimalised, standardised and normalised
• Year 11 Grade achieved in full GCSE English (also referred to as GCSE English)
• Year 11 Grade achieved in full GCSE maths (also referred to as GCSE maths)
• Year 11 Total GCSE and equivalents new point score
• Year 11 Total number of full GCSE entries
• Year 11 Achieved 5 or more GCSE/GNVQs at grades A*-C
• Year 11 Achieved 5 or more GCSE and equivalents at grades A*-C including GCSE English and maths
• Year 11 Achieved English Baccalaureate - A*-C passes in English, mathematics, 2 sciences, a humanity and a language.
National Assessment data were collected for the sample at the end of Year 6 and Year 11. In Year 6, the students were classified in 6 groups from working towards level 1, level 1 through to level 6. In addition to test levels, data were also collected on students’ individual test scores within levels. This allowed the creation of more finely differentiated outcome measures (which are referred to as decimalised levels) for the multilevel analysis.
For students who scored high enough to attain a valid level for the National Assessment test taken, their decimalised score was calculated as follows
Decimalised score = level of test achieved + ([raw score - lowest valid raw score for corresponding level] / highest valid raw score possible for the level).
13

Furthermore, to ensure comparability over time, an internal age standardisation and normalisation procedure was applied to the decimalised data. This procedure takes account of age effects within one school year hence age of student does not feature as a significant predictor of attainment/progress although it was included in the models. The Year 6 scores presented in this report are internally standardised to a mean of 100 and a standard deviation of 15. Therefore, all students scoring better than 100 at a certain time point are scoring at or above the attainment level expected for their chronological age (belong to the upper half of the sample of that assessment, controlling for age effects). Due to the use of internally standardised attainment scores, the scores can only be used to investigate the progress or improvement of certain groups of students relative to the total EPPSE 3-16 sample, but cannot be used to show ‘absolute’ progress over time.
Data on GCSE results were obtained from the National Pupil Database (NPD) at the end of Year 11. The measures representing the grades achieved for English and maths were transformed into numerical values from symbolic letters (“A”, “B” etc., see Table 2.5), while total GCSE score and number of entries were maintained in their original scales. No standardisation or normalisations were applied to these measures. Similarly, the dichotomous indicators were preserved with the original coding (0 for ‘not achieved’ and 1 for ‘achieved’).
Descriptive statistics of academic outcomes Figure 2.1 - Figure 2.4 present the distributions of the total GCSE score, the grades achieved in full GCSE English and GCSE maths, and the total number of full GCSE and equivalents entries. Table 2.5 - Table 2.8 show the basic descriptive statistics for the Year 11 academic outcomes.
14
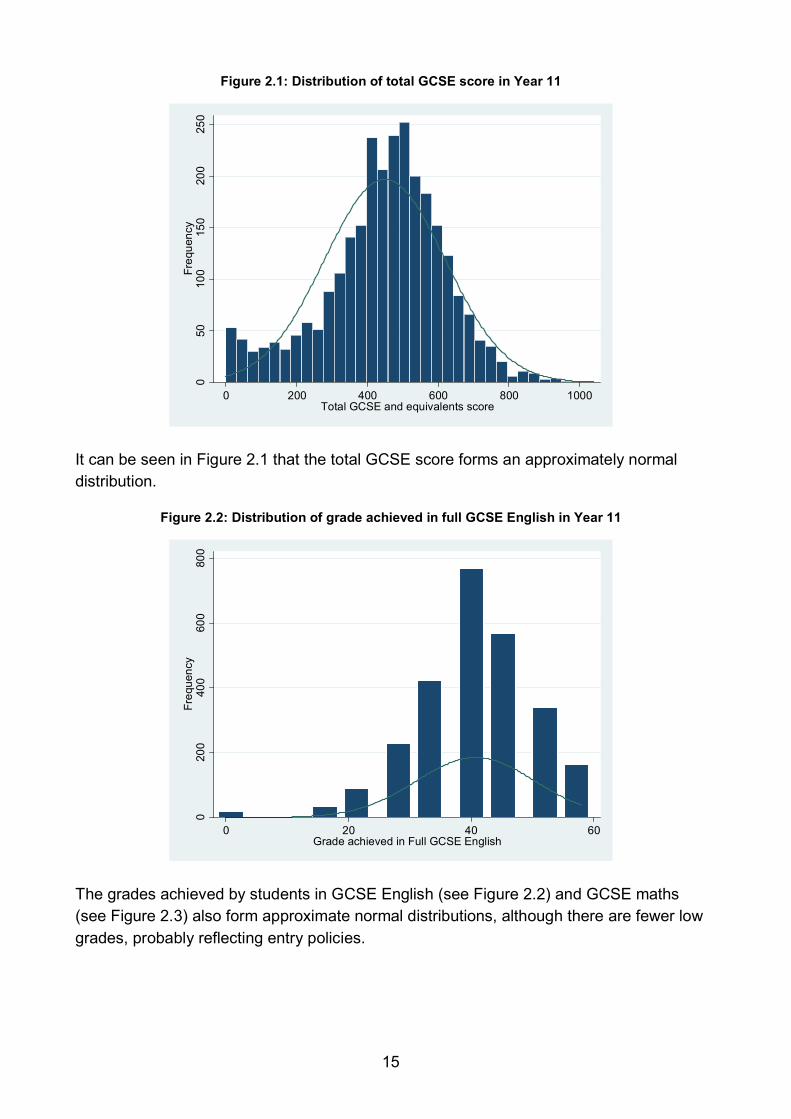
Figure 2.1: Distribution of total GCSE score in Year 11
It can be seen in Figure 2.1 that the total GCSE score forms an approximately normal distribution.
Figure 2.2: Distribution of grade achieved in full GCSE English in Year 11
The grades achieved by students in GCSE English (see Figure 2.2) and GCSE maths (see Figure 2.3) also form approximate normal distributions, although there are fewer low grades, probably reflecting entry policies.
050
100
150
200
250
Freq
uenc
y
0 200 400 600 800 1000Total GCSE and equivalents score
020
040
060
080
0Fr
eque
ncy
0 20 40 60Grade achieved in Full GCSE English
15

Figure 2.3: Distributions of grade achieved in full GCSE maths in Year 11
Table 2.5 shows around seven out of ten (70%) students gained a grade C or higher in GCSE English, with only one in twenty students (5%) being unable to attain a grade E or higher in GCSE English. Over six out of ten (67%) students gained a grade C or higher in GCSE maths, with just over one in ten students (11%) being unable to attain a grade E or higher in GCSE maths.
Table 2.5: Distributions of different measures of academic attainment in Year 11
Grade (Points value)
Grade achieved in full GCSE English Grade achieved in full GCSE maths
N % N % A*(58) 162 6.2 199 7.6
A (52) 338 12.8 361 13.8
B (46) 568 21.6 461 17.6
C (40) 770 29.3 730 27.9
D (34) 423 16.1 335 12.8
E (28) 227 8.6 261 10.0
F (22) 89 3.4 164 6.3
G (16) 35 1.3 81 3.1
Ungraded (0) 18 0.7 28 1.1
Total 2630 100 2620 100
Figure 2.4 and Table 2.6 show that students were most likely to be entered for nine full GCSEs.
020
040
060
080
0Fr
eque
ncy
0 20 40 60Grade achieved in Full GCSE Maths
16

Figure 2.4: Distributions of total number of full GCSE entries in Year 11
Table 2.6 shows that over half of the students (58%) were entered for between seven and ten full GCSEs, with less than one in ten students (8%) entered for more than ten full GCSEs. Just under a third of students (31%) were entered for less than seven full GCSEs and only three in one hundred (3%) students were not entered for any full GCSEs.
Table 2.6: Distribution of number of total number of full GCSE entries in Year 11
Total no. of Year 11 full GCSE entries N % 0 81 2.9
1 32 1.2
2 83 3.0
3 115 4.2
4 161 5.8
5 217 7.9
6 242 8.8
7 338 12.2
8 374 13.5
9 519 18.8
10 368 13.3
11 180 6.5
12 42 1.5
13 11 0.4
Total 2763 100
010
020
030
040
050
0Fr
eque
ncy
0 5 10 15Total number of Full GCSE entries
17
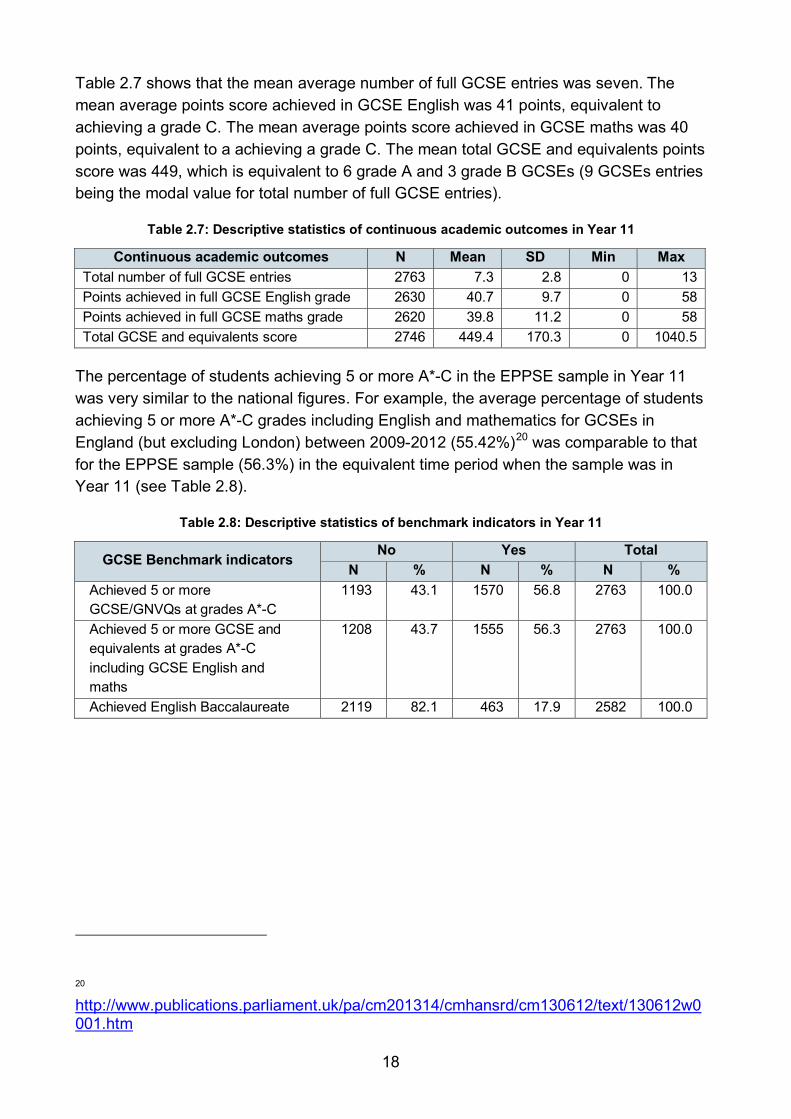
Table 2.7 shows that the mean average number of full GCSE entries was seven. The mean average points score achieved in GCSE English was 41 points, equivalent to achieving a grade C. The mean average points score achieved in GCSE maths was 40 points, equivalent to a achieving a grade C. The mean total GCSE and equivalents points score was 449, which is equivalent to 6 grade A and 3 grade B GCSEs (9 GCSEs entries being the modal value for total number of full GCSE entries).
Table 2.7: Descriptive statistics of continuous academic outcomes in Year 11
Continuous academic outcomes N Mean SD Min Max Total number of full GCSE entries 2763 7.3 2.8 0 13 Points achieved in full GCSE English grade 2630 40.7 9.7 0 58 Points achieved in full GCSE maths grade 2620 39.8 11.2 0 58 Total GCSE and equivalents score 2746 449.4 170.3 0 1040.5
The percentage of students achieving 5 or more A*-C in the EPPSE sample in Year 11 was very similar to the national figures. For example, the average percentage of students achieving 5 or more A*-C grades including English and mathematics for GCSEs in England (but excluding London) between 2009-2012 (55.42%)20 was comparable to that for the EPPSE sample (56.3%) in the equivalent time period when the sample was in Year 11 (see Table 2.8).
Table 2.8: Descriptive statistics of benchmark indicators in Year 11
GCSE Benchmark indicators No Yes Total
N % N % N % Achieved 5 or more GCSE/GNVQs at grades A*-C
1193 43.1 1570 56.8 2763 100.0
Achieved 5 or more GCSE and equivalents at grades A*-C including GCSE English and maths
1208 43.7 1555 56.3 2763 100.0
Achieved English Baccalaureate 2119 82.1 463 17.9 2582 100.0
20 http://www.publications.parliament.uk/pa/cm201314/cmhansrd/cm130612/text/130612w0001.htm
18
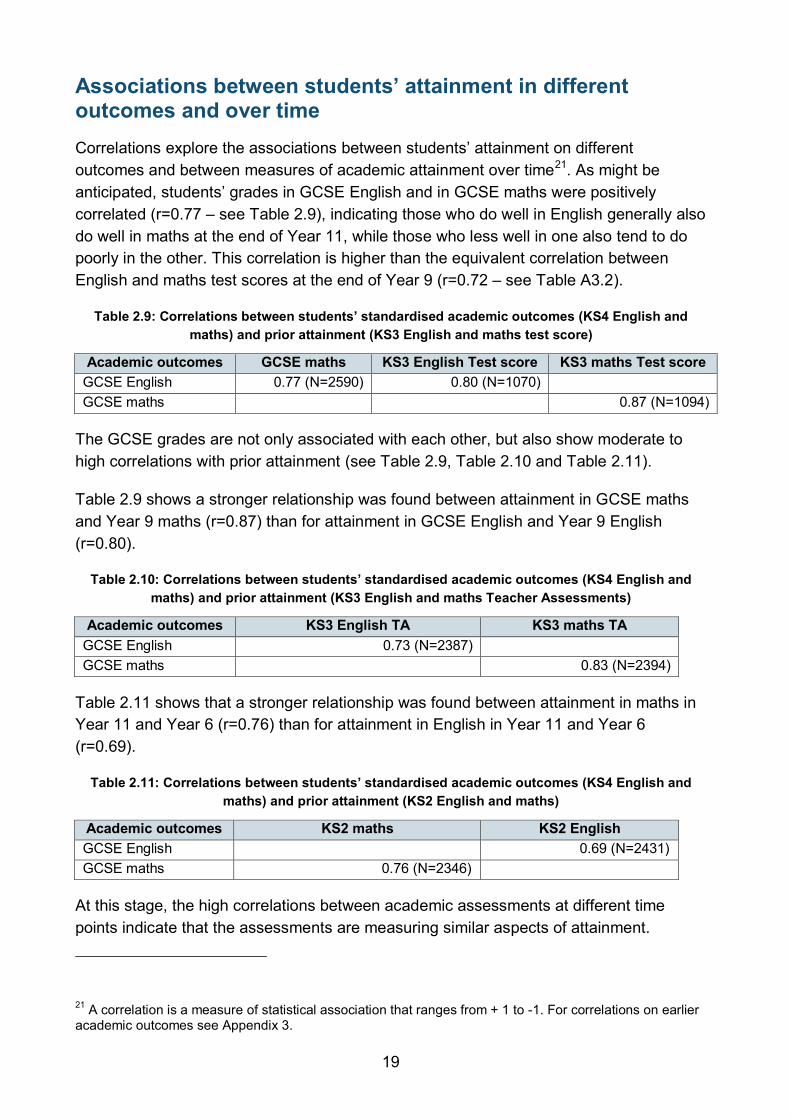
Associations between students’ attainment in different outcomes and over time Correlations explore the associations between students’ attainment on different outcomes and between measures of academic attainment over time21. As might be anticipated, students’ grades in GCSE English and in GCSE maths were positively correlated (r=0.77 – see Table 2.9), indicating those who do well in English generally also do well in maths at the end of Year 11, while those who less well in one also tend to do poorly in the other. This correlation is higher than the equivalent correlation between English and maths test scores at the end of Year 9 (r=0.72 – see Table A3.2).
Table 2.9: Correlations between students’ standardised academic outcomes (KS4 English and maths) and prior attainment (KS3 English and maths test score)
Academic outcomes GCSE maths KS3 English Test score KS3 maths Test score GCSE English 0.77 (N=2590) 0.80 (N=1070) GCSE maths 0.87 (N=1094)
The GCSE grades are not only associated with each other, but also show moderate to high correlations with prior attainment (see Table 2.9, Table 2.10 and Table 2.11).
Table 2.9 shows a stronger relationship was found between attainment in GCSE maths and Year 9 maths (r=0.87) than for attainment in GCSE English and Year 9 English (r=0.80).
Table 2.10: Correlations between students’ standardised academic outcomes (KS4 English and maths) and prior attainment (KS3 English and maths Teacher Assessments)
Academic outcomes KS3 English TA KS3 maths TA GCSE English 0.73 (N=2387) GCSE maths 0.83 (N=2394)
Table 2.11 shows that a stronger relationship was found between attainment in maths in Year 11 and Year 6 (r=0.76) than for attainment in English in Year 11 and Year 6 (r=0.69).
Table 2.11: Correlations between students’ standardised academic outcomes (KS4 English and maths) and prior attainment (KS2 English and maths)
Academic outcomes KS2 maths KS2 English GCSE English 0.69 (N=2431) GCSE maths 0.76 (N=2346)
At this stage, the high correlations between academic assessments at different time points indicate that the assessments are measuring similar aspects of attainment.
21 A correlation is a measure of statistical association that ranges from + 1 to -1. For correlations on earlier academic outcomes see Appendix 3.
19

The impact of earlier attainment as predictors for later attainment will be explored further in Section 6, which focuses on progress from KS2 to KS4. Of particular interest will be the ‘net’ influence of different student, background and HLE characteristics in Year 11, when controlling for prior attainment of the students, as this will indicate whether some groups make more or less progress relative to others during secondary school.
Differences in attainment for different groups of students In this part of the report, academic attainment in Year 11 is examined for different student subgroups that are of particular interest. Previous EPPSE analyses have reported significant differences in academic outcomes for different groups at various time points (e.g., pre-school, entry to primary school, at the end of Year 1 and in various key stages of education) (Sammons et al., 2004b; 2004c; 2007a; 2008a; 2011a). These particular student groups refer to individual student, family and early years HLE characteristics that were also used as predictors for different aspects of the EPPSE students’ social-behavioural development and dispositions (see Sammons et al., 2014a; 2014c).
The reported differences in this section represent the ‘raw’ differences in the average results for different student subgroups as there is no control for the influence of any other variables. This means, for example, if there are sizeable differences between individual ethnic groups, these differences could also be due, at least in part, to family socio-economic status (SES) or to language differences between the ethnic groups. Section 3 of this report provides more detailed statistical analyses of these patterns using multilevel models to explore the ‘net’ contribution of different characteristics and shows the strength of these predictors in terms of relevant effect sizes, controlling for other influences. Section 3 will also address the issue of change in ‘net’ contribution of different predictors over time in terms of the estimated effect sizes22.
Gender
Even though at younger ages girls were found to score higher in academic attainment, at the end of KS3 (Year 9) this pattern of average results was found only for English. In Year 11, the results are differentiated based on the specific academic outcome of interest. Thus, for example, on average female students obtained a higher total GCSE points score, were entered for more full GCSEs and had better grades in GCSE English than male students (see Table 2.12 and Table 2.13). However, there are no statistically significant gender differences in the average grade achieved in full GCSE maths. Female students were also more likely to obtain 5 A*-C, 5 A*-C including English and maths and the EBacc (see Table 2.3, Table A2.1, and Table A2.2).
22 Effect sizes (ES) are a statistical measure of the relative strength of different predictors.
20
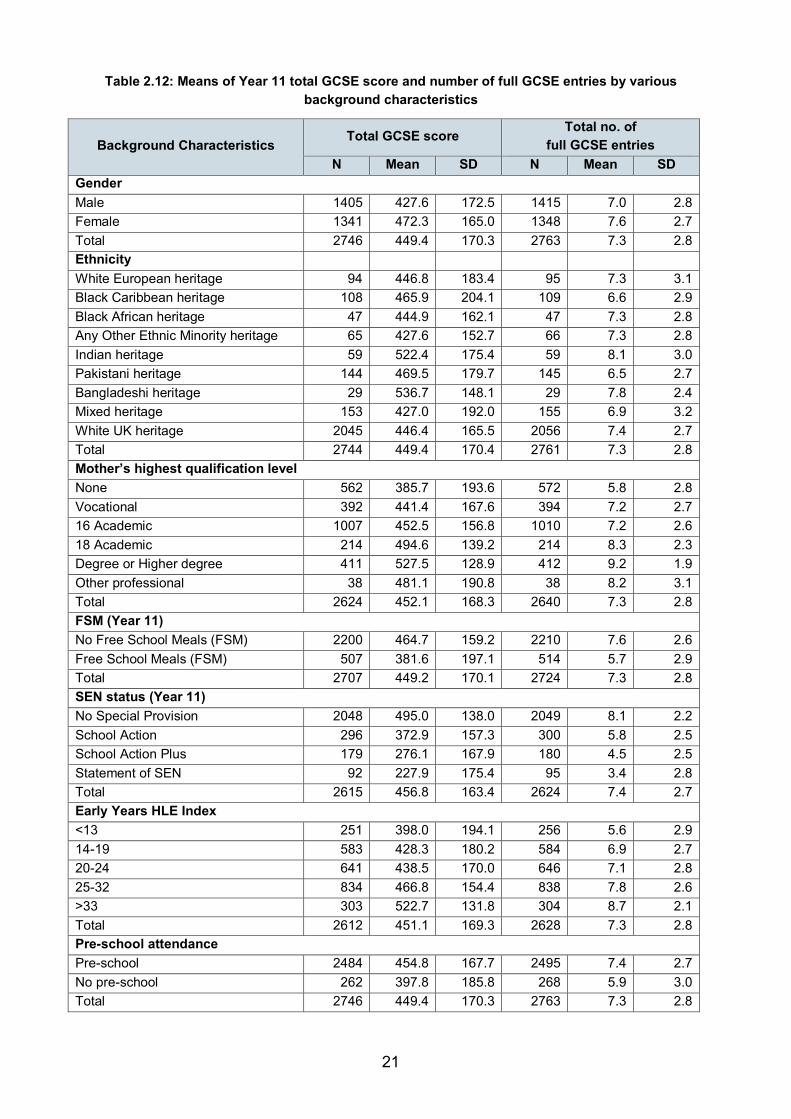
Table 2.12: Means of Year 11 total GCSE score and number of full GCSE entries by various background characteristics
Background Characteristics Total GCSE score
Total no. of full GCSE entries
N Mean SD N Mean SD Gender Male 1405 427.6 172.5 1415 7.0 2.8 Female 1341 472.3 165.0 1348 7.6 2.7 Total 2746 449.4 170.3 2763 7.3 2.8 Ethnicity White European heritage 94 446.8 183.4 95 7.3 3.1 Black Caribbean heritage 108 465.9 204.1 109 6.6 2.9 Black African heritage 47 444.9 162.1 47 7.3 2.8 Any Other Ethnic Minority heritage 65 427.6 152.7 66 7.3 2.8 Indian heritage 59 522.4 175.4 59 8.1 3.0 Pakistani heritage 144 469.5 179.7 145 6.5 2.7 Bangladeshi heritage 29 536.7 148.1 29 7.8 2.4 Mixed heritage 153 427.0 192.0 155 6.9 3.2 White UK heritage 2045 446.4 165.5 2056 7.4 2.7 Total 2744 449.4 170.4 2761 7.3 2.8 Mother’s highest qualification level None 562 385.7 193.6 572 5.8 2.8 Vocational 392 441.4 167.6 394 7.2 2.7 16 Academic 1007 452.5 156.8 1010 7.2 2.6 18 Academic 214 494.6 139.2 214 8.3 2.3 Degree or Higher degree 411 527.5 128.9 412 9.2 1.9 Other professional 38 481.1 190.8 38 8.2 3.1 Total 2624 452.1 168.3 2640 7.3 2.8 FSM (Year 11) No Free School Meals (FSM) 2200 464.7 159.2 2210 7.6 2.6 Free School Meals (FSM) 507 381.6 197.1 514 5.7 2.9 Total 2707 449.2 170.1 2724 7.3 2.8 SEN status (Year 11) No Special Provision 2048 495.0 138.0 2049 8.1 2.2 School Action 296 372.9 157.3 300 5.8 2.5 School Action Plus 179 276.1 167.9 180 4.5 2.5 Statement of SEN 92 227.9 175.4 95 3.4 2.8 Total 2615 456.8 163.4 2624 7.4 2.7 Early Years HLE Index <13 251 398.0 194.1 256 5.6 2.9 14-19 583 428.3 180.2 584 6.9 2.7 20-24 641 438.5 170.0 646 7.1 2.8 25-32 834 466.8 154.4 838 7.8 2.6 >33 303 522.7 131.8 304 8.7 2.1 Total 2612 451.1 169.3 2628 7.3 2.8 Pre-school attendance Pre-school 2484 454.8 167.7 2495 7.4 2.7 No pre-school 262 397.8 185.8 268 5.9 3.0 Total 2746 449.4 170.3 2763 7.3 2.8
21

Ethnicity
Students of mixed heritage obtained the lowest average total GCSE score, while students of Bangladeshi heritage had the highest average results; however the differences in mean are small and not statistically significant. Consistent with findings from previous years, students of Pakistani heritage obtained on average the lowest grades in GCSE English and maths, almost equivalent to a grade C at GCSE (see Table 2.13).
Parents’ qualification level
Mother’s highest qualification level proved to be a strong predictor of students’ academic results at earlier time points (from entry to pre-school until the end of Year 9) in the EPPSE research. At the end of Year 11, mother’s qualification level is still significantly associated with each of the GCSE academic outcomes studied. Students whose mothers have a degree or higher degree showed the highest average for total GCSE score, average number of full GCSE entries and the highest average grades achieved in GCSE English and GCSE maths, equivalent to at least a grade B (see Table 2.12 and Table 2.13). The lowest average attainment was found for students whose mothers have no qualifications and the differences were statistically significant when comparison were made with all other qualification categories (see Table 2.12 and Table 2.13). The average attainment for students whose mothers have no qualifications is equivalent to a grade D in GCSE English and GCSE maths.
Free school meals (FSM)
Students’ eligibility for free school meals (FSM) provides an indicator of low family income (although it is recognised that not all students take up their entitlement). Table 2.13 shows that students who are eligible and/or receive FSM had lower average academic attainment compared with those who are not. On average, FSM students achieved one grade lower in GCSE English and in GCSE maths than non-FSM students (e.g., the equivalent of a grade D compared to a grade C). Students with FSM were also less likely to achieve 5 A*-C, 5 A*-C including English and maths and the EBacc (see Table 2.3, Table A2.1 and Table A2.2). This pattern of results is in line with that found at younger ages indicating that social disadvantage continues to show a statistically significant association with academic attainment.
Special educational needs (SEN)
As might be expected, students identified in secondary school records as having any type of SEN showed on average significantly lower academic attainment at the end of Year 11. Those identified with a full SEN statement had the lowest average results in terms of total GCSE points score, maths (equivalent to a grade E) and, on average, were entered for the lowest number of full GCSE exams (see Table 2.12 and Table 2.13).
22

Table 2.13: Means of Year 11 grades in GCSE English and GCSE maths by various background characteristics
Background Characteristics Grade achieved in full GCSE English
Grade achieved in full GCSE maths
N Mean SD N Mean SD Gender Male 1326 39.1 9.9 1329 39.8 11.2 Female 1304 42.4 9.2 1291 39.8 11.2 Total 2630 40.7 9.7 2620 39.8 11.2 Ethnicity White European heritage 87 40.9 10.2 87 41.0 11.4 Black Caribbean heritage 102 40.6 7.7 102 39.0 10.1 Black African heritage 45 41.0 10.7 44 40.7 10.3 Any Other Ethnic Minority heritage 63 40.0 9.6 63 41.6 9.4 Indian heritage 57 44.3 8.6 56 44.3 12.3 Pakistani heritage 139 38.6 8.5 139 38.0 11.5 Bangladeshi heritage 28 42.1 10.2 28 40.6 12.9 Mixed heritage 138 41.2 10.9 138 40.3 11.4 White UK heritage 1969 40.8 9.7 1961 39.7 11.2 Total 2628 40.7 9.7 2618 39.8 11.2 Mother’s highest qualification level None 515 35.3 9.4 522 33.8 11.4 Vocational 374 40.4 8.7 378 38.6 10.3 16 Academic 979 40.1 8.7 975 39.4 10.1 18 Academic 212 43.7 8.2 213 43.5 9.5 Degree or Higher degree 405 49.1 6.9 389 48.9 7.7 Other professional 36 45.1 11.4 34 46.5 8.1 Total 2521 41.0 9.6 2511 40.0 11.1 FSM (Year 11) No Free School Meals (FSM) 2130 41.9 9.2 2116 41.1 10.6 Free School Meals (FSM) 463 35.4 10.1 467 33.7 11.9 Total 2593 40.7 9.7 2583 39.8 11.2 SEN status (Year 11) No Special Provision 2037 42.8 8.2 2025 42.1 9.6 School Action 287 34.1 8.7 287 32.2 11.4 School Action Plus 158 30.0 10.7 158 28.0 11.2 Statement of SEN 52 30.6 9.6 63 26.5 13.3 Total 2534 40.8 9.4 2533 39.7 11.1 Early Years home learning environment (HLE) Index <13 228 36.2 9.5 231 35.1 12.0 14-19 553 38.6 9.3 554 37.8 11.4 20-24 613 39.9 9.5 614 39.2 10.8 25-32 812 42.4 9.2 807 41.3 10.7 >33 300 47.1 7.5 291 45.9 8.6 Total 2506 40.9 9.6 2497 40.0 11.2 Pre-school attendance Pre-school 2391 41.2 9.6 2379 40.3 10.9 No pre-school 239 36.0 9.5 241 34.7 12.1 Total 2630 40.7 9.7 2620 39.8 11.2
23
Early years home learning environment (HLE)
The strong positive and statistically significant impact of the early years HLE on academic outcomes has been documented at earlier time points for the EPPSE sample. At the end of Year 11, the early years HLE index still shows a strong linear relationship with EPPSE students’ average academic attainment. On average, students who experienced a good or very good home learning environment in the early years achieved higher total GCSE point scores, higher grades in GCSE English and GCSE maths, and were entered for a higher number of full GCSEs.
Pre-school attendance
The positive effects of attending a pre-school have been identified in the EPPSE research up to the end of Year 9. When analysing the raw differences in Year 11 academic attainment, those students who had attended any pre-school obtained statistically significant higher average outcomes in terms of total GCSE points score, number of full GCSE entries and individual GCSE grades (equivalent to a grade C for GCSE English and GCSE maths compared with a grade D, the average grade achieved by the ‘home’ group, who did not attend any pre-school). Students who had attended pre-school were also more likely to achieve 5 A*-C, 5 A*-C including English and maths and the EBacc (see Table 2.3, Table A2.1 and Table A2.2).
The raw differences presented above should be considered with considerable caution because of the special characteristics of certain subgroups (for example, disadvantaged students are over-represented in the group that had not attended a pre-school). To improve the interpretation, further analyses are required to separate the ‘net’ pre-school effects from those related to background characteristics. Later in this report, Section 4 investigates the impact of attendance, quality and effectiveness of pre-school in more detail, controlling for the influence of differences in students’ background characteristics.
24

3 Students’ academic attainment at the end of Year 11 in secondary school
The influence of different individual student, family and home learning environment characteristics as predictors of GCSE results
Key findings
• Both mothers’ and fathers’ (to a lesser extent) highest qualification levels strongly predicted academic attainment at the end of Year 11.
• Older students (Autumn born) were more likely to obtain a higher total GCSE score, better grades in GCSE English and maths, & were more likely to have achieved 5 A*-C including English & maths than younger students (Summer born).
• Females obtained higher total GCSE scores, higher grades in GCSE English, were entered for more GCSEs, and were more likely to achieve 5 A*-C overall, 5 A*-C including English and maths and the EBacc than male students.
• Students whose parents reported early behavioural/health problems gained lower GCSE results (on all continuous measures) and were less likely to achieve 5 A*-C than students whose parents reported no early behavioural/health problems.
• FSM students obtained significantly lower results than non-FSM students and were also less likely to achieve 5 A*-C or 5 A*-C including English and maths.
• Students from higher income households gained higher total GCSE scores & higher grades in GCSE English & in GCSE maths than students whose parents had no earned salary. Salaries above £67,500 per annum were associated with an average increase of one full GCSE entry and an increased likelihood of achieving 5 A*-C or the EBacc.
• Students whose parents were classified in the highest SES group continued to show significantly higher attainment levels.
• The early years HLE remained a strong net predictor of better academic attainment at age 16 (total GCSE score, GCSE English & GCSE maths & total number of GCSE entries). Students with high early years HLE scores were three times more likely to achieve both 5 A*-C or 5 A*-C including English & maths.
• Medium & high levels of ‘academic enrichment’ in KS3 significantly predicted higher total GCSE scores, better grades in GCSE English and in GCSE maths, a higher number of full GCSE entries and increased the probability of achieving 5 A*-C, 5 A*-C including English and maths, and the EBacc. A high level of ‘parental interest’ predicted a higher probability of achieving 5 A*-C including English and maths.
• Students who grew up in disadvantaged neighbourhoods had significantly poorer Year 11 academic attainment in terms of GCSE outcomes.
25

This section presents the results of contextualised multilevel analyses establishing the patterns of relationships between various individual student, family and HLE characteristics and students’ academic attainment at the end of Year 11. Background details concerning the students’ earlier childcare experiences, health, family and HLE during the pre-school period were obtained from parental interviews conducted when students entered the EPPE study and from three parent questionnaires completed by the parents when students were in KS1 and KS2 of primary school education and in KS3 of secondary school education.
As potentially influencing background characteristics, the following measures have been used in the analyses:
• Individual student characteristics (i.e. gender, birth weight, number of siblings, early developmental problems, early behavioural problems, early health problems, ethnicity).
• Family characteristics (i.e., SES, parent’s qualification levels, family income23).
• The early years HLE - parents reported how often they read to the child, taught the child the alphabet, played with letters and numbers, taught songs and nursery rhymes, painted and drew etc. (see Appendix 1 for details of these measures).
• Parental HLE activities during KS1 such as the frequency of reading to the child, taking the child out to educational visits, computing activities, play, etc. (see Appendix 1 for details of these measures).
• KS2 HLE included activities such as computing, playing, reading etc. (see Appendix 1 for details of these measures).
• KS3 HLE reflected activities like parental support, involvement and supervision, computing and reading (see Appendix 1 for details of these measures).
Null models In order to control for potential secondary school influences and to take account of the clustering in the data, multilevel analyses were used to partition the variance in the continuous academic outcomes that is attributable to the schools (Level 2) and the individual students (Level 1). This method models the effects of clustering in the data (because students are nested in schools) and is widely recognized as essential in studying school influences (Creemers, Kyriakides & Sammons, 2010; Goldstein, 1995; 2003; Teddlie & Reynolds, 2000).
23 Marital status at KS2 was also included in initial analysis, but did not prove to be significant.
26

Table 3.1 - Table 3.4 show the null models for total GCSE scores, grades achieved in full GCSE English and in full GCSE maths, and their total number of full GCSE entries. The intra-school correlations (ICC) for all four of these academic outcomes show that there is significant school level variation (approximately 20-51%), so pursuing the analyses with multilevel models is essential to avoid bias in estimating the effects of the various predictors being modelled.
Table 3.1: Null model for total GCSE score in Year 11
Model statistics Total GCSE score
Coefficient SE Sig Intercept 441.17 5.44 *** Variance-school level 10735.01 1196.29 *** Variance-individual level 20932.92 661.64 *** Total variance 31667.93
Number of students 2746 Number of schools 732
Intra-school correlation (ICC) 0.3390 * p<0.05, ** p<0.01, *** p<0.001
Table 3.2: Null Models for grade achieved in full GCSE English in Year 11
Model statistics GCSE English
Coefficient SE Sig Intercept 41.52 0.30 *** Variance-school level 26.67 3.22 *** Variance-individual level 70.90 2.23 *** Total variance 97.57
Number of students 2630 Number of schools 683
Intra-school correlation (ICC) 0.2733 * p<0.05, ** p<0.01, *** p<0.001
Table 3.3: Null Models for grade achieved in full GCSE maths in Year 11
Model statistics GCSE maths
Coefficient SE Sig Intercept 40.35 0.32 *** Variance-school level 25.57 3.74 *** Variance-individual level 102.54 3.21 *** Total variance 128.11
Number of students 2620 Number of schools 689
Intra-school correlation (ICC) 0.1996 * p<0.05, ** p<0.01, *** p<0.001
Interestingly, half (50%) of the variance for total number of full GCSE entries is attributable to the school level (see Table 3.4). This shows that the secondary schools EPPSE students attended were very different in terms of how many GCSE exams they entered their students for. This may reflect differences in intake and in school policies.
27
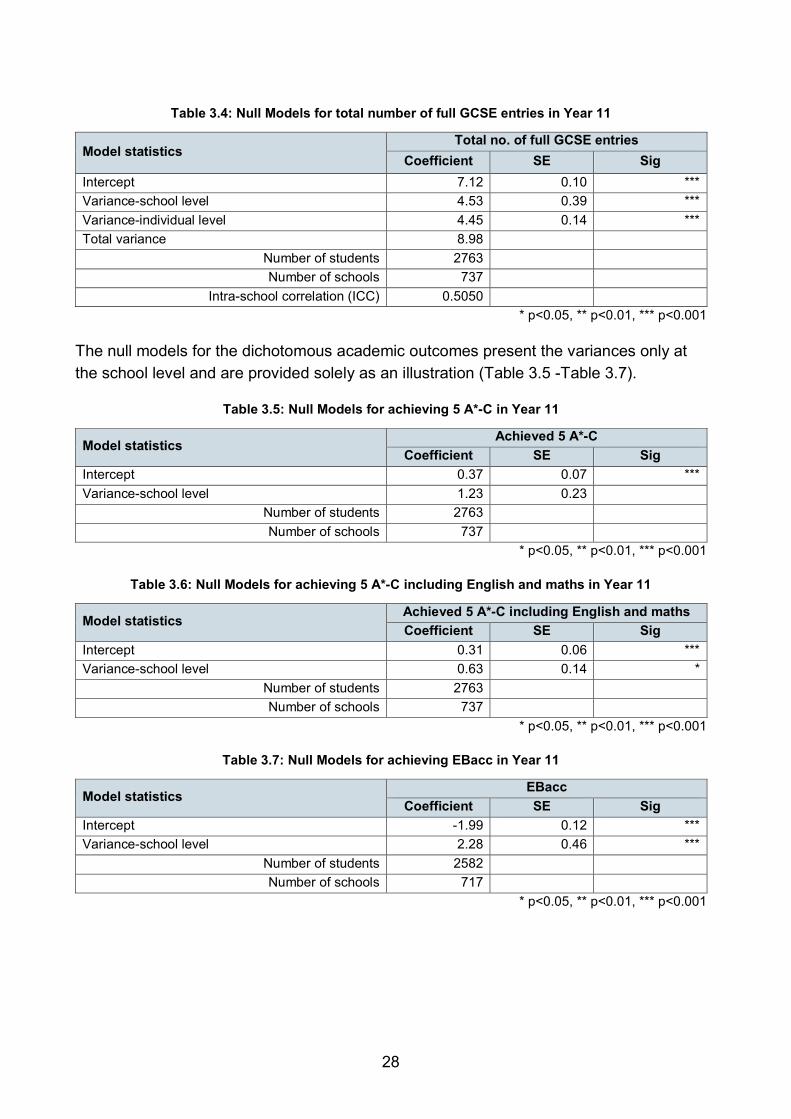
Table 3.4: Null Models for total number of full GCSE entries in Year 11
Model statistics Total no. of full GCSE entries
Coefficient SE Sig Intercept 7.12 0.10 *** Variance-school level 4.53 0.39 *** Variance-individual level 4.45 0.14 *** Total variance 8.98
Number of students 2763 Number of schools 737
Intra-school correlation (ICC) 0.5050 * p<0.05, ** p<0.01, *** p<0.001
The null models for the dichotomous academic outcomes present the variances only at the school level and are provided solely as an illustration (Table 3.5 -Table 3.7).
Table 3.5: Null Models for achieving 5 A*-C in Year 11
Model statistics Achieved 5 A*-C
Coefficient SE Sig Intercept 0.37 0.07 *** Variance-school level 1.23 0.23
Number of students 2763 Number of schools 737
* p<0.05, ** p<0.01, *** p<0.001
Table 3.6: Null Models for achieving 5 A*-C including English and maths in Year 11
Model statistics Achieved 5 A*-C including English and maths Coefficient SE Sig
Intercept 0.31 0.06 *** Variance-school level 0.63 0.14 *
Number of students 2763 Number of schools 737
* p<0.05, ** p<0.01, *** p<0.001
Table 3.7: Null Models for achieving EBacc in Year 11
Model statistics EBacc
Coefficient SE Sig Intercept -1.99 0.12 *** Variance-school level 2.28 0.46 ***
Number of students 2582 Number of schools 717
* p<0.05, ** p<0.01, *** p<0.001
28

Individual measures The relative strength of the associations between individual level predictors and various Year 11 academic outcomes are shown in Table 3.8 and Table 3.9. Most of the predictors that are statistically significant are common to all academic measures. Thus, ethnicity, number of siblings and early behavioural problems statistically significantly predicted total GCSE scores, grades in GCSE English and in GCSE maths, as well as whether students achieved 5 A*-C including English and maths and their total number of full GCSE entries. Age, measured in terms of months, significantly predicted total GCSE scores, grades in GCSE English and in GCSE maths and their probability of obtaining 5 A*-C including English and maths. The relative strength of different predictors is indicated by effect sizes (ES) in Table 3.8 and by odd ratios (OR) in Table 3.9.
Age
None of the academic outcomes were age standardised. Therefore, in the contextualised models it was necessary to control for the student’s age. A statistically significant age within the year group effect was found for total GCSE score, grades in GCSE English and in GCSE maths and whether students achieved 5 A*-C including English and maths (see Table 3.8 and Table 3.9). Older students were more likely to have obtained a higher total GCSE points score, better grades in GCSE English and maths, and were more likely to have achieved 5 A*-C including English and maths than younger students. This links with results in earlier phases of education and points to the importance of term of birth effects.
Gender
Female students gained higher total GCSE scores, higher grades in English and were entered for more full GCSEs than males (see Table 3.8). On average, female students obtained 26 points more for their total GCSE score, and about 3 points more (or half a grade) for grades in GCSE English. Female students were also more likely to achieve 5 A*-C overall, 5 A*-C including English and maths and the EBacc (see Table 3.9). The fact that female students do better than males in GCSE English is consistent with results in Year 9, but also with other studies focused on GCSE outcomes (Ofsted, 2013). Additionally, at earlier time points, in pre- and primary school girls showed statistically significantly higher attainment in maths than males. However, in secondary school in Year 9 and Year 11, this difference is no longer statistically significant.
Ethnicity
When compared with White UK students and controlling for the influences of other characteristics, Pakistani and Bangladeshi students obtained statistically significant and higher total GCSE scores, grades in maths and entered more full GCSEs (see Table 3.8,
29

Table A4.1, Table A4.3 and Table A4.5). For example, students of Pakistani heritage on average obtained total GCSE score of almost 50 points more than students of White UK heritage. Students of Black Caribbean heritage also got better total GCSE point scores and higher grades in GCSE English and in GCSE maths than EPPSE students of White UK heritage. Consistent with results in Year 9, Indian students had better results in GCSE maths, but in GCSE English as well, when compared with White UK students. Indian students also were more than twice as likely (2.28:1) to have achieved 5 A*-C including English and maths as White UK students (see Table 3.9). Analyses using the GCSE results for the whole 2012 cohort of students in England showed very similar patterns of results. For example, non-White British students obtained better results than White British students in maths (Ofsted, 2013). We can conclude that despite the relatively small numbers of ethnic minorities in the EPPSE sample, their results are likely to reflect national patterns fairly closely.
Early developmental, behavioural and health problems
Students whose parents reported early behavioural or health problems at entry to the study obtained lower Year 11 academic attainment results and entered fewer full GCSEs than students where no early behavioural or health problems were reported. Students who were identified with early developmental, behavioural or health problems were less likely to achieve 5 A*-C than students without these problems (0.60:1).
Family size
On average, students from larger families (3 siblings or more) obtained total GCSE scores 23 points lower, lower grades in English (ES=-0.28) or maths (ES=-0.17), were entered for fewer GCSEs and were less likely to achieve 5 A*-C or 5 A*-C including English and maths than students from smaller families (OR=0.62; OR=0.69) (see Table 3.8 and Table 3.9).
Family measures The following family characteristics had statistically significant net effects as predictors of Year 11 academic attainment: mother’s age (when child entered the study at age 3/5), eligibility for FSM (Year 11), family salary (collected using a parent questionnaire during KS1), parents’ highest SES (when child entered the study at age 3/5) and parents’ qualification levels (when child entered the study at age 3/5).
Mother’s age at age 3/5
Mother’s age was found to be a positive predictor for academic attainment in terms of grades in GCSE English, grades in GCSE maths and whether the students achieved 5
30

A*-C and the EBacc (see Table 3.8 and Table 3.9). Students whose mothers were older obtained better GCSE results and were more likely to achieve 5 A*-C and the EBacc than students with younger mothers (see Table 3.9). The effect sizes were weak but slightly higher for English (ES=0.15) than for maths (ES=0.10). The odds ratios for the dichotomous outcomes were also similar (OR=1.33; OR=1.39).
Free school meals (FSM)
FSM, a marker for low income, was a negative predictor of academic attainment in Year 11. Students eligible or receiving FSM obtained significantly lower results than students who were not eligible. The effects were similar for the total GCSE points score (ES=-0.32), GCSE English (ES=-0.31) and GCSE maths (ES=-0.37, see Table 3.8). These results are very similar to the ones found in Year 9, when English, maths and science were studied. In terms of total point scores, students eligible for FSM obtained on average 42 points less than students who were not eligible for FSM in Year 11. The weakest effect of Year 11 FSM was found for the total number of full GCSE entries (ES=-0.23). A negative probability of achieving 5 A*-C was also found for FSM; students who were eligible for FSM in Year 11 being less likely to achieve 5 A*-C (OR=0.61) or 5 A*-C including English and maths (OR=0.51, see Table 3.9). Jesson, Gray and Tranmer (1992) studied the GCSE results of students in Nottinghamshire and concluded that students in receipt of free school meals were less successful than their school mates who were not in receipt of this benefit. The same result was found nationally on the latest attainment data (Department for Education, 2013).
Income
Family salary data was collected from parents in KS1 and thus, does not reflect current salary levels. This measure points to relative difference in salary. In terms of household salary, the results indicated that students in households with higher incomes obtained higher total GCSE scores and higher grades in GCSE English and in GCSE maths than students whose parents had no earned salary (most of whom would be on benefits) (see Table 3.8).
Students from families with salaries between £37,500 and £66,000 gained on average almost 35 points in their total GCSE scores (equivalent to a GCSE grade D or the difference between achieving an A* rather than a grade F for a single GCSE), or 2 points in GCSE English and in GCSE maths (equivalent to a third of a grade i.e. 6 points separate grades) when compared with students from families with no earned salaries. Family salaries higher than £67,500 per annum were associated with an average increase of one full GCSE entry. Table 3.9 shows the same group of students were more likely to achieve 5 A*-C (OR=3.94) or the EBacc (OR=4.04).
31
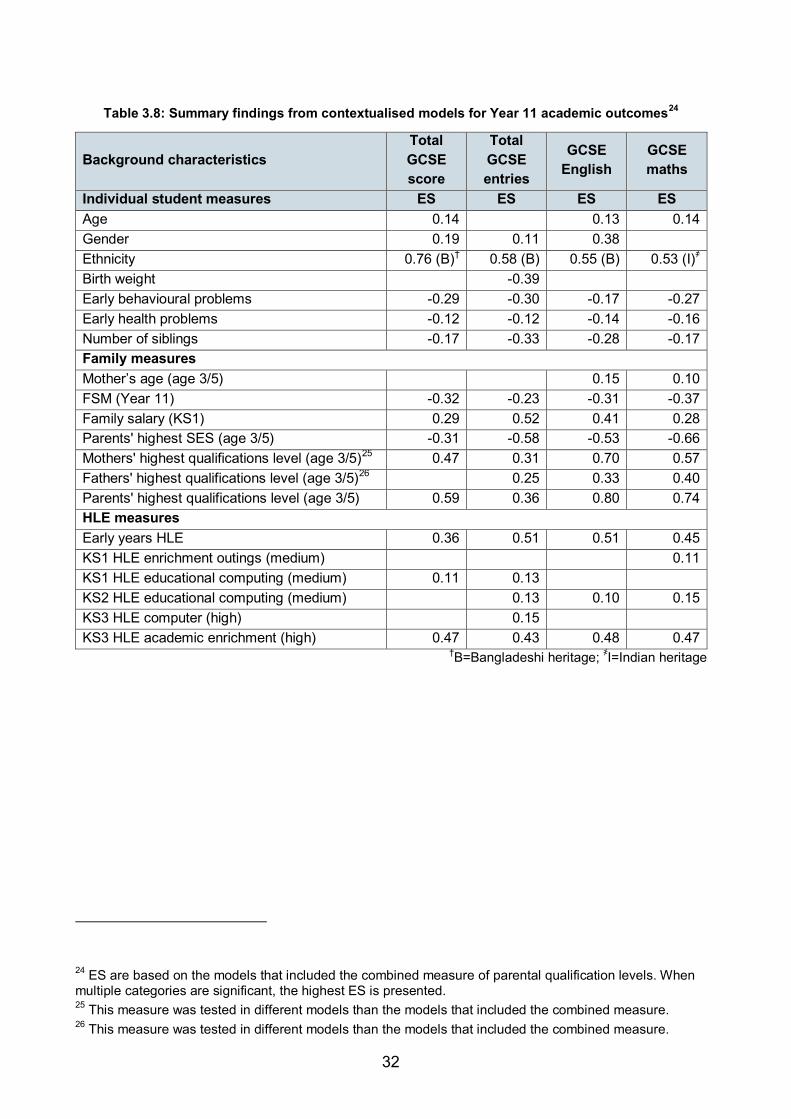
Table 3.8: Summary findings from contextualised models for Year 11 academic outcomes24
Background characteristics Total GCSE score
Total GCSE entries
GCSE English
GCSE maths
Individual student measures ES ES ES ES Age 0.14 0.13 0.14 Gender 0.19 0.11 0.38 Ethnicity 0.76 (B)† 0.58 (B) 0.55 (B) 0.53 (I)҂ Birth weight -0.39 Early behavioural problems -0.29 -0.30 -0.17 -0.27 Early health problems -0.12 -0.12 -0.14 -0.16 Number of siblings -0.17 -0.33 -0.28 -0.17 Family measures Mother’s age (age 3/5) 0.15 0.10 FSM (Year 11) -0.32 -0.23 -0.31 -0.37 Family salary (KS1) 0.29 0.52 0.41 0.28 Parents' highest SES (age 3/5) -0.31 -0.58 -0.53 -0.66 Mothers' highest qualifications level (age 3/5)25 0.47 0.31 0.70 0.57 Fathers' highest qualifications level (age 3/5)26 0.25 0.33 0.40 Parents' highest qualifications level (age 3/5) 0.59 0.36 0.80 0.74 HLE measures Early years HLE 0.36 0.51 0.51 0.45 KS1 HLE enrichment outings (medium) 0.11 KS1 HLE educational computing (medium) 0.11 0.13 KS2 HLE educational computing (medium) 0.13 0.10 0.15 KS3 HLE computer (high) 0.15 KS3 HLE academic enrichment (high) 0.47 0.43 0.48 0.47
†B=Bangladeshi heritage; ҂I=Indian heritage
24 ES are based on the models that included the combined measure of parental qualification levels. When multiple categories are significant, the highest ES is presented. 25 This measure was tested in different models than the models that included the combined measure. 26 This measure was tested in different models than the models that included the combined measure.
32

Family SES
Family SES was computed for different time points: at entry to the study (age 3/5), KS1, KS2 and KS3. Even though each of these alternative measures of family SES were significant predictors of academic outcome, the best and most robust predictor was the family SES collected at age 3/5 when interviewing the parents. This measure also had the highest response rate. Therefore, the contextualised models reported are based on this predictor.
When compared with the ‘professional non-manual’ category (representing the highest possible SES category), most of the other categories significantly predicted lower grades in GCSE English and in GCSE maths (see Table A4.3 and Table A4.5 in Appendix 4). Statistically significant effects on total GCSE score were found for students whose parents belong to the ‘skilled manual’ (ES=-0.31) and ‘semi-skilled’ (ES=-0.30) categories (see Table A4.1 in Appendix 4). Students whose parents were categorised as ‘unskilled’ were on average entered in one fewer full GCSE exam than students whose parents were from the highest SES group (see Table A4.7).
Students whose parents belong to the ‘skilled manual’ (OR=0.59), ‘semi-skilled’ (OR=0.58) and ‘unskilled’ (OR=0.42) categories were also less likely to achieve 5 A*-C including English and maths (see Table A4.1).
Overall, these results reveal that students whose parents were in employment classified as the highest SES group (‘professional non-manual’) when they were in the early years continued to show significantly higher attainment levels, net of the influence of income, HLE and qualifications. Nonetheless, qualification was a stronger predictor of academic outcomes than either income or family SES (see below).
Parent’s highest qualification level
In the current analyses, parents’ qualification levels collected at age 3/5 was tested in two ways: 1) as individual measures for mother’s and father’s qualification levels and 2) as a combined measure of parents’ highest qualification level. When, tested as individual measures, mother’s highest qualification level was a significant and positive predictor of total GCSE score (ES=0.47), grades in GCSE English (ES=0.70) and in GCSE maths (ES=0.57), and the total number of GCSEs students were entered for (ES=0.31, see Table 3.8). Students whose mothers were more qualified were also significantly more likely to have achieved 5 A*-C (OR=3.14) and 5 A*-C including English and maths (OR=4.11) than students whose mothers did not have any qualifications (see Table 3.9). Similarly, students whose fathers had a degree or higher degree obtained significantly better grades in GCSE English (ES=0.33) and in GCSE maths (ES=0.40), were entered for a higher number of GCSEs (ES=0.25) and were more likely to achieve both 5 A*-C (OR=2.48) and 5 A*-C including English and maths (OR=2.07) and the EBacc (OR=3.16)
33

than students whose fathers do not have any qualifications. It can be seen that when testing individual measures of parents’ qualification levels, mother’s qualification level was a somewhat stronger predictor than father’s qualification level.
Analyses using the combined measure that was calculated by taking into account the highest qualification level of either parent showed that students whose parents have a higher degree achieved significantly higher total GCSE scores (ES=0.59), better grades in GCSE English (ES=0.80) and in GCSE maths (ES=0.74) and were entered for a higher total number of GCSEs (ES=0.36) than students whose parents did not have any qualifications. Similarly, students with highly qualified parents were significantly more likely to achieve the benchmark indicators 5 A*-C (OR=3.58) and 5 A*-C including English and maths (OR=3.92) and the EBacc (OR=2.83).
Early years home learning environment (early years HLE)
Measures of the home learning environment were obtained from parents’ responses at four time points: at entry to the study, KS1, KS2 and KS3. The early years HLE measure is based on the frequency of specific activities involving the child (i.e., teaching the child the alphabet, playing with letters and numbers, library visits, reading to the child, teaching the child songs or nursery rhymes – see Appendix 1) as reported by parents when children were recruited to the study during the pre-school period. These measures were combined to form an overall early years HLE index with scores that could vary between 0 (very low early years HLE) and 49 (very high early years HLE).
The early years HLE index was tested and found to still be a strong net predictor of better academic attainment at age 16 after controlling for other background characteristics (e.g., parents’ highest SES, family salary and parents’ highest qualification levels). For total GCSE score and grades in GCSE English and in GCSE maths, only the two highest early years HLE categories (25-32 and 33-45) were found to be statistically significant predictors when compared with the lowest HLE category (0-13).
For the top early years HLE category, the following statistically significant effects ‘net’ of other individual student and family characteristics were obtained: total GCSE score (ES=0.36), grades in GCSE English (ES=0.51) and in GCSE maths (ES=0.45). For the total number of GCSE entries, all categories of early years HLE were statistically significant, the effect size of the highest group being largest (ES=0.51 - see Table A4.7 and Table 3.8). Similarly, students with high early years HLE scores were three times more likely to achieve the benchmark measures of both 5 A*-C (OR=3.61) or 5 A*-C including English and maths (OR=2.90, see Table 3.9).
34

These results confirm findings at younger ages and show that the early years HLE remains highly important for later secondary school academic outcomes even at age 16.
Table 3.9: Contextualised models for Year 11 benchmark indicators27
Background Characteristics Achieved 5
A*-C
Achieved 5 A*-C
English and maths
EBacc
Individual student measures OR OR OR Age 1.04 Gender 1.45 1.24 1.74 Ethnicity 2.28(I)҂ Developmental problems 0.68 0.67 Behavioural problems 0.65 0.63 Health problems 0.63 Number of siblings 0.62 0.69 Family measures Mother’s age (age 3/5) 1.33 1.39 FSM (Year 11) 0.61 0.51 Family salary (KS1) 3.94 1.95 4.04 Parents' highest SES (age 3/5) 0.50 0.59 0.41 Mothers' highest qualifications level (age 3/5)28 3.14 4.11 Fathers' highest qualifications level (age 3/5)29 2.48 2.07 3.16 Parents' highest qualifications level (age 3/5) 3.58 3.92 2.83 HLE measures Early years HLE 3.61 2.90 KS1 HLE enrichment outings (medium) 1.39 KS1 HLE educational computing (medium) 1.36 0.51 (high) KS3 HLE academic enrichment (high) 2.80 2.60 3.89 KS3 HLE parental interest (high) 1.34
҂I=Indian heritage
KS1 HLE
As the HLE during the pre-school period was shown to have a strong impact on children’s academic attainment during pre-school, parents were again surveyed about their interactions with their child at home during KS1 (age 6-7 years). Parents reported on activities such as the frequency of reading to/with the child, taking the child out on educational visits, computing activities, sport activities, dance, etc (see Appendix 1). It
27 OR are based on the models that included the combined measure of parental qualification levels. 28 This measure was tested in different models than the models that included the combined measure. 29 This measure was tested in different models than the models that included the combined measure.
35

should be noted that the KS1 HLE measures were collected by questionnaire and thus the data are not directly comparable to the measure of early years HLE collected via face-to face-interviews.
The individual KS1 HLE measures have been aggregated to form four factors30 representing different parental activities during KS1: ‘home computing’, ‘one-to-one interaction’, ‘expressive play’ and ‘enrichment outings’ (see Appendix 1 and Sammons et al., 2008a; 2008b). All four factors were tested in models that controlled for the individual student and family characteristics, but also for early years HLE. The early years HLE remained a stronger predictor even when KS1 HLE measures were included.
Only two KS1 HLE factors were statistically significant additional predictors of academic outcomes at the end of Year 11 (see Table 3.8). The ‘enrichment outings’ factor was a statistically significant predictor of grades in GCSE maths (ES=0.11), but only at moderate level (see Table A4.5). Likewise, only moderate levels of ‘educational computing’ were significantly associated with a higher total GCSE score (ES=0.11 – see Table A4.1) and a higher number of GCSE entries (ES=0.13 – see Table A4.7). A high computer usage significantly predicted a decreased probability of obtaining the EBacc (OR=0.51 – see Table 3.9). Moderate levels of ‘enrichment outing’ activities in KS1 significantly increased the probability of achieving 5 A*-C at the end of Year 11 (OR=1.36 – see Table 3.9).
These results are different from the ones obtained in Year 9, where both moderate and frequent outings during KS1 were significant predictors of attainment in English, but not predictors of maths. It seems that KS1 enrichment activities, such as outings, may have lasting effects on overall academic attainment even up to Year 11.
KS2 HLE
The HLE seems to be interestingly related to academic attainment, remaining an important predictor that needs to be continually investigated. At KS2, another questionnaire was sent to parents who were asked to state their level of involvement in different learning activities at home. The parents reported on activities such as the frequency of internet usage, taking the child out for physical activities and educational visits, computing activities, teaching the child different subjects. Four KS2 HLE factors were extracted from the individual items ‘parent-child educational computing’, ‘parent-child interactive learning processes’, ‘individual child activities’ and ‘computer games’ (see Appendix 1). These factors were tested with respect to their influence on academic
30 Exploratory factor analysis (EFA) and confirmatory factor analysis (CFA) were used to identify latent factors.
36

attainment at the end of Year 11. The models controlled for early years HLE and the specific KS1 HLE factors that were statistically significant.
Only ‘parent-child educational computing’ was a statistically significant predictor of academic attainment in Year 11. Thus, medium levels of computer usage for educational purposes predicted better grades in GCSE English (ES=0.10) and in GCSE maths (ES=0.15), and a higher total number of full GCSE entries (ES=0.13), but the effects were relatively weak (see Table 3.8). As shown in previous years, it seems that just an optimal level of home computing is good for academic attainment.
KS3 HLE
KS3 HLE measures incorporate information sourced not just from the parent, but from the students themselves. This way we were able to take account of the likely increased independence of adolescents from parents at age 14 and the young person’s own potential influence exerted over their HLE.
Individual items were submitted to factor analysis and five factors were extracted: ‘learning support and resources’, ‘computer use’, ‘parental interest in school’, ‘academic enrichment’ and ‘parental academic supervision’ (see Appendix 1). These factors were tested with respect to their influence on academic attainment at the end of Year 11. The models controlled for early years HLE and the specific KS1 HLE and KS2 HLE factors that were statistically significant.
Medium and high levels of ‘academic enrichment’ in KS3 significantly predicted higher total GCSE scores (ES=0.47), better grades in GCSE English (ES=0.48) and in GCSE maths (ES=0.47), and a higher total number of full GCSE entries (ES=0.43). Medium and high levels of ‘academic enrichment’ in KS3 also significantly increased the probability of achieving 5 A*-C (OR=2.80), 5 A*-C including English and maths (OR=2.60) and EBacc (OR=3.89). A high level of ‘parental interest’ predicted a higher probability of achieving 5 A*-C including English and maths (OR=1.34). Students who reported high levels of ‘computer use’ were entered for a higher number of full GCSEs (ES=0.15) than those who reported low computer usage at age 14.
The impact of neighbourhood characteristics and school composition We have already shown the individual student, family and HLE characteristics from different time points that continued to significantly predict students’ academic attainment at age 16. Next, we analysed whether a broader context like the neighbourhood environment had any influence on students’ attainment in Year 11. The neighbourhood measures were based on where the EPPSE children lived while they were in pre-school
37

and primary school, and so the indicators do not necessarily reflect later residential moves.
Various measures of neighbourhood environment were added to the full contextualised models predicting academic outcomes. Neighbourhood characteristics from census statistics included percentage of White British citizens in the neighbourhood, level of crime, level of unemployment and percentage of residents with limiting long-term illness. Additional measures from the National Pupil Database (NPD) included the Index of Multiple Deprivation (IMD), the percentage of students at school level receiving free school meals (FSM) and the Income Deprivation Affecting Children Index (IDACI). Measures of neighbourhood safety were derived from the KS1 parent questionnaire.
These neighbourhood measures were tested individually after control for individual student, family and HLE characteristics to avoid potential collinearity issues (see Table 3.10 for the correlations between different measures). The continuous measures of neighbourhood disadvantage were centred to the grand mean.
Table 3.10: Correlations between different measures of neighbourhood disadvantage (n=3110)
Neighbourhood characteristics
% of White British
citizens
Level of Crime
Level of Unemployment
% Residents with Limiting Long Term Illness
IDACI
IMD 2004 -.525*** .734*** .914*** .450*** .915***
% of White British citizens
-.399*** -.359*** .011 -.478***
Level of Crime .604*** .264*** .674***
Level of Unemployment
.510*** .842***
% Residents with Limiting Long-Term Illness
.418***
*** p<0.001
Index of Multiple Deprivation (IMD)
The first of the neighbourhood disadvantage measurements, IMD is a nationwide index combining weighted measures of levels of crime, barriers to housing, living environment, education and skills training, health deprivation and disability, employment and income. The greater the IMD score, the greater the level of neighbourhood deprivation. The index is divided into Local Authority (LA) and Super Output Area (SOA), where SOAs are defined as areas smaller than wards, frequently nested in wards, and of broadly consistent population size. For the purposes of analysis, the 2004 IMD scores were assigned to each child on the basis of their pre-school home address (using postcode)
38

being used to identify the appropriate SOA (for further details of the IMD see Noble et al., 2004; 2008).
Students’ academic outcomes at the end of Year 11 were significantly predicted by neighbourhood disadvantage as measured by IMD scores. The effect sizes are slightly larger than the ones obtained in Year 9. The higher the multiple deprivation index scores, the lower the academic results in Year 11, with the highest effect being on the total number of GCSE entries (ES=-0.28; see Table 3.11).
Income Deprivation Affecting Children Index (IDACI)
The Income Deprivation Affecting Children Index (IDACI) represents the percentage of children that live in families that are income deprived in each SOA. The overall IMD does not include the IDACI as the children are already captured in the Income Deprivation Domain (see Noble et al., 2004; 2008).
The IDACI is a negative predictor of students’ academic outcomes in Year 11 (see Table 3.11 and Table 3.12). Students who had grown up in a neighbourhood characterised by economically deprived families tend to do worse academically in Year 11, after control for their own background characteristics including family SES, HLE and income. The effect sizes of IDACI are small but statistically significant for all the academic outcomes.
Table 3.11: Contextualised models for Year 11 academic outcomes - Neighbourhood measures
Fixed effects (continuous) Total GCSE
score Total GCSE
entries GCSE
English GCSE maths
ES Sig ES Sig ES Sig ES Sig IMD ns -0.28 *** ns -0.17 ** IDACI -0.15 * -0.20 ** -0.15 ** -0.16 ** % White British ns -0.19 * -0.20 ** -0.15 * Crime -0.15 * -0.24 *** ns -0.12 * Unemployment ns -0.25 *** ns -0.12 *
* p<0.05, ** p<0.01, *** p<0.001 ns=not statistically significant
39

Table 3.12: Contextualised models for Year 11 benchmark indicators - Neighbourhood measures
Fixed effects (continuous) Year 11
Achieved 5 A*-C
Year 11 Achieved 5 A*-C
English and maths
Year 11 EBacc
OR Sig OR Sig OR Sig IMD 0.99 * 0.99 * ns IDACI 0.39 ** 0.35 *** 0.32 * % White British 0.99 ** 0.99 * 0.99 * Crime 0.85 * 0.84 ** ns Unemployment ns ns ns
* p<0.05, ** p<0.01, *** p<0.001 ns=not statistically significant
Percentage of White British
The percentage of White British citizens in the neighbourhood was also a significant and negative predictor of students’ academic attainment. A higher percentage of White British residents in the neighbourhood predicted significantly lower academic attainment at the end of Year 11 in terms of grades in GCSE English and in GCSE maths and students being entered for a lower number of total full GCSE entries (see Table 3.11 and Table 3.12).
Level of crime
The level of crime in a neighbourhood was another significant predictor of academic outcomes in Year 11, but not for all measures. A neighbourhood characterised by a higher level of crime negatively and significantly predicted total GCSE scores (ES=-0.15), their total number of GCSE entries (ES=-0.24) and their grade in GCSE maths (ES=-0.12). A higher level of crime also predicted lower probabilities in achieving 5 A*-C (OR=0.85) or 5 A*-C including English and maths (OR=0.84). The associations of crime levels with results in English were not statistically significant (see Table 3.11 and Table 3.12).
Level of unemployment
The level of unemployment in a neighbourhood was a negative predictor of academic outcomes in Year 11. A neighbourhood characterised by a higher level of unemployment negatively and significantly influenced total number of GCSE entries (ES=-0.25) and their grade in GCSE maths (ES=-0.12). The effect of unemployment levels on Year 11 students’ grades in GCSE English, their total GCSE score and their likelihood of achieving 5 A*-C, achieving 5 A*-C including English and maths or achieving EBacc were not statistically significant (Table 3.11 and Table 3.12).
40
Neighbourhood safety
The indicator of neighbourhood safety was based on EPPSE students’ parents’ own perceptions derived from the KS1 parent questionnaire. The results of the relationships between the views on neighbourhood safety and students’ later academic outcomes are presented in Table 3.13 and Table 3.14. A high level of neighbourhood safety was a significant predictor of students achieving higher total GCSE scores, higher grades in GCSE maths and having a higher probability of achieving 5 A*-C when compared with low levels of neighbourhood safety. Again, effects are weak but consistent.
This subsection has shown that characteristics of the neighbourhood where children lived while they were at pre-school continued to predict their later attainment in GCSE results in Year 11 of secondary school. The influences on GCSE results are slightly different from the influences on Year 9 academic results. For grades in GCSE English, only two features of the neighbourhood (% White British and the IDACI) were found to be statistically significant predictors whereas more neighbourhood measures were found to be statistically significant predictors for Year 9 English Teacher Assessment (TA) levels. In contrast, all of the neighbourhood measures that were tested were found to be significant predictors of students’ grades in GCSE maths.
41

Table 3.13: Contextualised models for Year 11 academic outcomes - Neighbourhood safety
Fixed effects Total GCSE
score Total GCSE
entries GCSE
English GCSE maths
Neighbourhood safety (compared with low safety) ES Sig ES Sig ES Sig ES Sig
Medium low safety 0.06 0.06 0.06 0.08 Medium high safety 0.01 0.09 -0.00 0.01 High safety 0.15 * 0.12 0.08 0.13 *
Number of students 2497 2510 2343 2535 Number of schools 610 614 573 675
Intra-school correlation (ICC) 0.3024 0.3028 0.0690 0.0412 % Reduction student variance 15.2 11.3 20.8 18.7 % Reduction school variance 28.3 62.2 84.4 86.0
% Reduction total variance 19.7 37.0 38.2 32.1 * p<0.05, ** p<0.01, *** p<0.001
Table 3.14: Contextualised models for Year 11 benchmark indicators - Neighbourhood safety
Fixed effects Year 11 Achieved 5 A*-C
Year 11 EBacc
Neighbourhood safety (compared with low safety) OR Sig OR Sig Medium low safety 1.22 1.71 * Medium high safety 1.19 1.40 High safety 1.48 * 1.22
Number of students 2429 2255 Number of schools 601 584
% Reduction school variance 83.0 77.9 * p<0.05, ** p<0.01, *** p<0.001
School level FSM
Another measure that might reflect both family and neighbourhood characteristics is the school level percentage of students eligible to receive free school meals (FSM). The percentage of FSM students at secondary school level was a statistically significant predictor of academic attainment in Year 11. This represents a compositional school measure and reflects the overall social economic status of the students attending these schools. A higher percentage of students eligible for or receiving FSM at school level significantly predicted lower grades in GCSE English (ES=-0.18 – see Table A4.3), fewer full GCSE entries (ES=-0.55 – see Table A4.7) and a lower probability of students achieving 5 A*-C (OR=0.98 – see Table A4.9).
42

Summary of the impact of neighbourhood characteristics and school composition
It seems that the importance of neighbourhood characteristics in predicting academic attainment increases slightly during secondary school. In primary school the EPPE research found that neighbourhood measures were not statistically significant predictors of children’s attainment when the early years HLE was taken into account. However, even when early years HLE was controlled for in these models for secondary school attainment, neighbourhood disadvantage has been a significant predictor, although relatively weak, for the same students at age 14 and age 16. This suggests that the neighbourhood context becomes more important in shaping students’ educational outcomes as they grow older. This is likely to reflect students’ greater involvement in activities outside the home and with their peer group in the local area as they move into early adolescence.
These findings link with the Bronfenbrenner’s ecological model (1994) that suggests that proximal influences (e.g., child/family) have stronger effects than more distal ones like school and neighbourhood, but that all contribute to shape development.
The intra-school correlations also point to statistically significant school level variations in student attainment outcomes at age 16 controlling for the influences of student, family, HLE and neighbourhood influences. The strongest school effects are on total GCSE score (see Table A4.1) and total number of GCSE entries (see Table A4.7). These two outcomes are linked and often reflect school policies (e.g., to allow higher number of subjects to be studied or alternatively to cap the number of GCSE entries at 8 or 9 or to focus students’ energies on a more limited number of subjects). The effects on grades in GCSE English and in GCSE maths may well reflect subject department effects in addition to possible school influences (Sammons, Thomas, & Mortimer, 1997).
43
4 The impact of pre-school, primary school and secondary school on students’ academic attainment at the end of Year 11
Key findings
Pre-school influences
• Measures of the quality and effectiveness of the pre-school attended continued to predict students’ later academic attainment at the end of Year 11.
• Students who had attended a high quality pre-school setting went on to obtain better GCSE results in terms of total GCSE score, grades in GCSE English and in GCSE maths, and were also more likely to achieve 5 A*-C including English and maths than students who had not attended pre-school.
• There was some evidence that pre-school quality showed a stronger effect for males than females when predicting grades in GCSE maths. Similarly, for students of low-qualified parents only high quality pre-school was a significant predictor of grades in GCSE maths.
• Higher levels of pre-school effectiveness (in terms of promoting pre-reading) predicted more GCSE exam entries, better grades in GCSE English and in GCSE maths and a higher probability of achieving 5 A*-C including English and maths.
Primary school influences
• Students who had attended an academically effective primary school had significantly better grades in GCSE maths and were almost twice as likely to achieve the EBacc as students who had attended a low academically effective primary school after controlling for student, family HLE and neighbourhood influences.
Secondary school influences
• An indicator of overall academic effectiveness at secondary school (the DfE CVA measure) significantly and positively predicted students’ academic attainment in terms of total GCSE score, but not the specific subject grades or the benchmark indicators.
• Students who had attended a secondary school rated as ‘outstanding’ in terms of the ‘quality of learning’ or ‘learners’ attendance’ got higher grades in GCSE English and in GCSE maths and were more likely to achieve 5 A*-C and 5 A*-C including English and maths than students who had attended secondary schools characterised as ‘inadequate’ in their learning quality.
44
So far the analyses have shown that various individual student and family background characteristics as well as measures of the students’ HLE and neighbourhood remain significant predictors of the students’ academic attainment in Year 11. The effects of individual student, parent and HLE characteristics are still in line with similar effects found at the end of primary school (KS2) and earlier in secondary school (KS3). The general pattern of results is also in line with findings from other studies that have focused on background predictors of GCSE outcomes (Jesson et al., 1992; Ofsted, 2013; Strand, 2008; 2014).
Continuing the tradition of previous EPPSE reports, we have further investigated the extent to which measures of students' pre-school experiences continue to predict academic outcomes in Year 11. In addition, measures of primary school and secondary school influence are also tested. Taking into account the effects of individual student, family, HLE and neighbourhood characteristics, various measures of pre-school quality and effectiveness, primary school and secondary school academic effectiveness, and secondary school quality, were tested as predictors of the variation in students' GCSE results.
The impact of pre-school experience on Year 11 academic attainment In order to investigate any possible continued effects of pre-school on students' later academic attainment in Year 11, we considered four aspects of pre-school experience:
• attendance at a pre-school centre compared with no pre-school
• pre-school duration
• pre-school quality
• pre-school effectiveness.
As in previous sections of this report, the findings from these analyses are presented in terms of effect sizes (ES) and odds ratios (OR).
The continuing impact of pre-school attendance on later academic attainment at the end of KS4
Having attended any pre-school centre continued to show a statistically significant effect on academic attainment at the end of Year 11. Students who had attended any pre-school centre obtained higher total GCSE scores (ES=0.31), were entered for more full GCSE exams (ES=0.21), got better grades in GCSE English (ES=0.23) and in GCSE maths (ES=0.21), and had a higher probability of achieving 5 A*-C including English and maths (OR=1.48) when compared with students who had not attended pre-school, the ‘home’ group. These results indicate an overall benefit for pre-school taking into account the effects of differences in individual, family, HLE and neighbourhood characteristics.
45
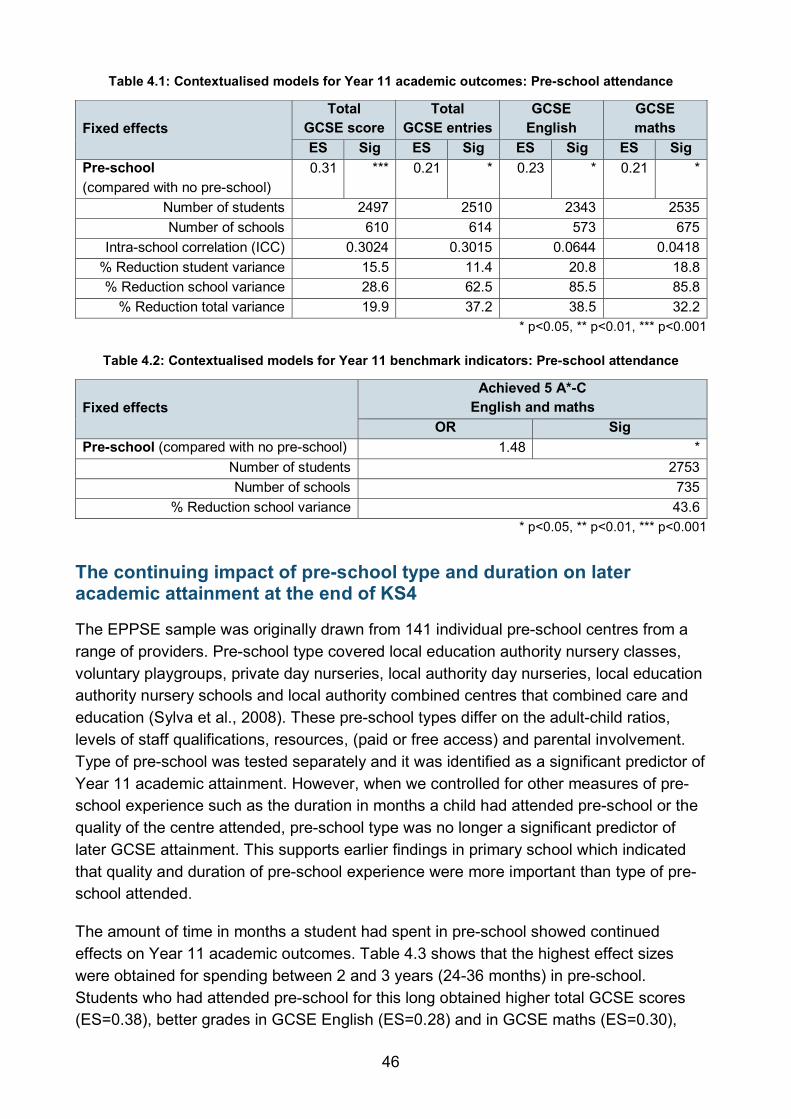
Table 4.1: Contextualised models for Year 11 academic outcomes: Pre-school attendance
Fixed effects Total
GCSE score Total
GCSE entries GCSE
English GCSE maths
ES Sig ES Sig ES Sig ES Sig Pre-school (compared with no pre-school)
0.31 *** 0.21 * 0.23 * 0.21 *
Number of students 2497 2510 2343 2535 Number of schools 610 614 573 675
Intra-school correlation (ICC) 0.3024 0.3015 0.0644 0.0418 % Reduction student variance 15.5 11.4 20.8 18.8 % Reduction school variance 28.6 62.5 85.5 85.8
% Reduction total variance 19.9 37.2 38.5 32.2 * p<0.05, ** p<0.01, *** p<0.001
Table 4.2: Contextualised models for Year 11 benchmark indicators: Pre-school attendance
Fixed effects Achieved 5 A*-C
English and maths OR Sig
Pre-school (compared with no pre-school) 1.48 * Number of students 2753 Number of schools 735
% Reduction school variance 43.6 * p<0.05, ** p<0.01, *** p<0.001
The continuing impact of pre-school type and duration on later academic attainment at the end of KS4
The EPPSE sample was originally drawn from 141 individual pre-school centres from a range of providers. Pre-school type covered local education authority nursery classes, voluntary playgroups, private day nurseries, local authority day nurseries, local education authority nursery schools and local authority combined centres that combined care and education (Sylva et al., 2008). These pre-school types differ on the adult-child ratios, levels of staff qualifications, resources, (paid or free access) and parental involvement. Type of pre-school was tested separately and it was identified as a significant predictor of Year 11 academic attainment. However, when we controlled for other measures of pre-school experience such as the duration in months a child had attended pre-school or the quality of the centre attended, pre-school type was no longer a significant predictor of later GCSE attainment. This supports earlier findings in primary school which indicated that quality and duration of pre-school experience were more important than type of pre-school attended.
The amount of time in months a student had spent in pre-school showed continued effects on Year 11 academic outcomes. Table 4.3 shows that the highest effect sizes were obtained for spending between 2 and 3 years (24-36 months) in pre-school. Students who had attended pre-school for this long obtained higher total GCSE scores (ES=0.38), better grades in GCSE English (ES=0.28) and in GCSE maths (ES=0.30),
46

and were entered for more GCSE exams (ES=0.24). There were also indications of stronger positive effects for 3+ years (>36 months) on total GCSE score (ES=0.38), but the pattern was less clear for other GCSE measures. Pre-school duration was not a significant predictor of any of the GCSE benchmark indicators.
Table 4.3: Contextualised models for Year 11 academic outcomes: Pre-school duration
Fixed effects Total GCSE score
Total GCSE entries
GCSE English
GCSE maths
Pre-school duration (compared with no pre-school)
ES Sig ES Sig ES Sig ES Sig
0-12 months 0.18 0.13 0.21 * 0.23 * 12-24 months 0.25 * 0.16 0.13 0.15 24-36 months 0.38 *** 0.24 * 0.28 ** 0.30 ** >36 months 0.38 ** 0.13 0.19 0.24 *
Number of students 2424 2437 2285 2470 Number of schools 592 596 557 654
Intra-school correlation (ICC) 0.2986 0.2834 0.0663 0.0389 % Reduction student variance 16.2 11.1 22.4 19.7 % Reduction school variance 30.5 65.5 85.4 87.0
% Reduction total variance 21.1 38.6 39.6 33.1 * p<0.05, ** p<0.01, *** p<0.001
The continuing impact of pre-school centre quality on later academic attainment at the end of KS4
Pre-school quality was measured with two different scales ECERS-R and ECERS-E (Sylva et al., 1999; 2006). Previous EPPSE analyses have found that the ECERS-E measure, which focuses on the education aspects of pre-school, predicted the most consistent positive effects upon academic attainment at younger ages. In this set of analyses, both the ECERS-E and ECERS-R measures were tested. The sample was divided into groups of students whose pre-school experience could be classified as ranging from no quality (i.e., the ‘home’ group) through low, medium and high quality, based on individual pre-school centres’ ECERS-E/R scores. The distribution of ECERS-E groups in the present sample was as follows: no pre-school (10%), low quality (14%), medium quality (53%) and high quality (22%). A very similar distribution was found for the ECERS-R measure.
The pattern of findings for the effects of pre-school quality was very similar regardless of whether the quality measurement was the ECERS-E or ECERS-R (see Table 4.4, Table 4.5, Table 4.6 and Table 4.7). Students who had attended high quality pre-schools obtained better GCSE results (total GCSE score, grades in GCSE English and in GCSE maths) and were more likely to have achieved 5 A*-C including English and maths than students who had not attended pre-school. There were also a number of positive effects for low and medium quality. Overall, high quality pre-school showed the most consistent pattern but again all pre-schools compared with none were beneficial in terms of predicting GCSE outcomes.
47

Table 4.4: Contextualised models for Year 11 academic outcomes: Pre-school quality ECERS-E
Fixed effects Total GCSE score
Total GCSE entries
GCSE English
GCSE maths
Pre-school quality (compared with no pre-school)
ES Sig ES Sig ES Sig ES Sig
Low quality 0.36 *** 0.24 * 0.22 * 0.20 * Medium quality 0.27 ** 0.20 * 0.19 * 0.20 * High quality 0.37 *** 0.20 0.31 ** 0.26 **
Number of students 2497 2510 2343 2535 Number of schools 610 614 573 675
Intra-school correlation (ICC) 0.3029 0.3020 0.0618 0.0409 % Reduction student variance 15.6 11.3 20.7 18.7 % Reduction school variance 28.4 62.4 86.1 86.1
% Reduction total variance 19.9 37.1 38.6 32.2 * p<0.05, ** p<0.01, *** p<0.001
Table 4.5: Contextualised models for Year 11 benchmark indicators: Pre-school quality ECERS-E
Fixed effects Achieved 5 A*-C English and maths
Pre-school quality (compared with no pre-school)
OR Sig
Low quality 1.48 Medium quality 1.40 High quality 1.69 *
Number of students 2753 Number of schools 735
% Reduction school variance 45.8 * p<0.05, ** p<0.01, *** p<0.001
Table 4.6: Contextualised models for Year 11 academic outcomes: Pre-school quality ECERS-R
Fixed effects Total GCSE score
Total GCSE entries
GCSE English
GCSE maths
Pre-school quality (compared with no pre-school)
ES Sig ES Sig ES Sig ES Sig
Low quality 0.30 ** 0.18 0.20 0.17 Medium quality 0.29 ** 0.25 ** 0.22 * 0.24 ** High quality 0.35 *** 0.13 0.25 * 0.20 *
Number of students 2497 2510 2343 2535 Number of schools 610 614 573 675
Intra-school correlation (ICC) 0.3005 0.3008 0.0631 0.0436 % Reduction student variance 15.4 11.4 20.6 18.9 % Reduction school variance 29.1 62.6 85.8 85.2
% Reduction total variance 20.0 37.3 38.4 32.1 * p<0.05, ** p<0.01, *** p<0.001
48

Table 4.7: Contextualised models for Year 11 benchmark indicators: Pre-school quality ECERS-R
Fixed effects Achieved 5 A*-C English and maths EBacc
Pre-school quality (compared with no pre-school)
OR Sig OR Sig
Low quality 1.36 1.81 Medium quality 1.42 2.55 * High quality 1.69 * 1.75
Number of students 2753 2255 Number of schools 735 584
% Reduction school variance 47.3 77.9 * p<0.05, ** p<0.01, *** p<0.001
The continuing impact of pre-school centre effectiveness on later academic attainment at the end of KS4
Measures of pre-school centre effectiveness were calculated separately for ‘pre-reading’ and ‘early number concepts’ for all 141 pre-school centres in the study. These measures were the residuals from multilevel value added models predicting academic attainment (at the end of pre-school) of children who had attended a pre-school centre, controlling for their prior attainment at entry to the study and their background characteristics. More effective pre-schools were those in which children had made more progress than predicted by the statistical models (Sammons et al., 2002). These measures of pre-school centre effectiveness proved to be significant predictors of students’ subsequent academic attainment in primary school (KS1 and KS2) and then later in secondary school (KS3). Therefore, it was expected that these measures might continue to shape students’ attainment later on in KS4 as well.
In order to establish whether the effectiveness of the pre-school setting a child had attended showed any continuing impact on their later attainment at the end of KS4, further multilevel analyses were conducted. In these analyses, pre-school centre effectiveness in promoting young children’s progress in ‘pre-reading’ was tested as a potential predictor for total GCSE score, grades in GCSE English, total number of GCSE entries, and whether the students achieved 5 A*-C, 5 A*-C including English and maths and the EBacc. Pre-school centre effectiveness, in terms of promoting young children’s progress in ‘early number concepts’, was also tested as a predictor for total GCSE score, grades in GCSE maths, total number of GCSE entries and whether the students achieved 5 A*-C, 5 A*-C including English and maths and the EBacc.
49

Table 4.8: Contextualised models for Year 11 academic outcomes: Pre-school effectiveness (Pre-
reading)
Fixed effects Total GCSE score
Total GCSE entries
GCSE English
Pre-school effectiveness - pre-reading (compared with no pre-school)
ES Sig ES Sig ES Sig
Low effectiveness 0.32 ** 0.19 0.18 Medium effectiveness 0.32 *** 0.20 * 0.22 * High effectiveness 0.27 ** 0.25 * 0.31 **
Number of students 2497 2510 2343 Number of schools 610 614 573
Intra-school correlation (ICC) 0.3016 0.3006 0.0628 % Reduction student variance 15.4 11.3 20.7 % Reduction school variance 28.8 62.6 85.9
% Reduction total variance 19.9 37.2 38.5 * p<0.05, ** p<0.01, *** p<0.001
Pre-school effectiveness (pre-reading) was a statistically significant and positive predictor of total number of full GCSE entries, grade in GCSE English and whether students achieved 5 A*-C including English and maths (see Table 4.8 and Table 4.9). Higher levels of pre-school effectiveness were associated with more GCSE entries (ES=0.25), better grades in GCSE English (ES=0.31) and a higher probability of achieving 5 A*-C including English and maths (OR=1.73). There was no clear pattern for the EBacc or for total GCSE score.
Table 4.9: Contextualised models for Year 11 benchmark indicators- Pre-school effectiveness (Pre-reading)
Fixed effects Achieved
5 A*-C English and maths
EBacc
Pre-school effectiveness - pre-reading (compared with no pre-school)
OR Sig OR Sig
Low effectiveness 1.32 2.81 * Medium effectiveness 1.48 * 1.83 High effectiveness 1.73 * 2.20
Number of students 2753 2255 Number of schools 735 584
% Reduction school variance 44.2 76.1 * p<0.05, ** p<0.01, *** p<0.001
50

Table 4.10: Contextualised models for Year 11 academic outcomes- Pre-school effectiveness (Early
number concepts)
Fixed effects Total GCSE score
Total GCSE entries
GCSE maths
Pre-school effectiveness - early number concepts (compared with no pre-school)
ES Sig ES Sig ES Sig
Low effectiveness 0.30 ** 0.29 ** 0.22 * Medium effectiveness 0.25 ** 0.17 0.16 High effectiveness 0.48 *** 0.23 * 0.35 ***
Number of students 2497 2510 2535 Number of schools 610 614 675
Intra-school correlation (ICC) 0.2979 0.3024 0.0389 % Reduction student variance 15.6 11.5 18.9 % Reduction school variance 30.2 62.4 86.8
% Reduction total variance 20.6 37.2 32.5 * p<0.05, ** p<0.01, *** p<0.001
The patterns and strengths of the relationships between pre-school effectiveness (early number concepts) and students' later Year 11 academic outcomes also suggest that there were positive and significant effects for students’ grades in GCSE maths (ES= 0.35) and their total GCSE score (ES= 0.48 - see Table 4.10). However, no clear patterns emerged for the GCSE benchmark indicators (see Table 4.11).
Table 4.11: Contextualised models for Year 11 benchmark indicators- Pre-school effectiveness (Early number concepts)
Fixed effects EBacc Pre-school effectiveness - early number concepts (compared with no pre-school)
OR Sig
Low effectiveness 2.77 * Medium effectiveness 2.05 High effectiveness 1.80
Number of students 2255 Number of schools 584
% Reduction school variance 77.6 * p<0.05, ** p<0.01, *** p<0.001
The continuing pre-school effects for different groups of students
A topic of particular interest is whether pre-school experience has differential effects for particular groups of students, specifically those more vulnerable in terms of the risk of low attainment. In terms of ‘risk’, key characteristics were identified as having an impact on attainment: the student’s gender, the level of their parents’ highest qualification and the early years HLE. Each of these was considered in relation to pre-school attendance, pre-school quality, and pre-school effectiveness. However, we are presenting only the statistically significant and noteworthy results.
51

The combined impact of pre-school experience and gender Differential effects of pre-school provision on gender have been an important objective of our study. Previous analyses showed that at earlier ages, boys benefited more than girls in attending a pre-school (Sylva et al., 2010). It is therefore helpful to investigate whether similar influences continue to exist in Year 11.
Results showed that for total GCSE score, attending any type of pre-school (regardless of the quality) had a beneficial effect for both male and female students (see Figure 4.1 or see Table A6.1 in Appendix 6). However, there is no clear evidence of a quality gradient for male or female students in terms of total GCSE score outcomes. The results confirm significant effects of attending any pre-school for this outcome irrespective of gender.
Figure 4.1: The combined impact of gender and pre-school quality on total GCSE score
For grades in GCSE English, there were combined effects of both gender and pre-school reflecting an overall pre-school effect rather than a quality gradient. However, for male students there was a clear gradation of the effects based on the pre-school provision’s quality with only the high quality pre-schools (ES=0.36) having a significant effect (see Figure 4.2 or Table A6.2 in Appendix 6). These findings suggest that male students’ attainment in GCSE English may be more sensitive to the quality of pre-school they attended. This is in line with findings at younger ages in primary school. By contrast, the results confirm that female students benefit from any pre-school experience when compared with none, irrespective of quality.
52

Figure 4.2: The combined impact of gender and pre-school quality on GCSE English
For grades in GCSE maths, we found evidence of pre-school quality effects for male students, with those who had attended a medium and high quality pre-school obtaining significantly higher grades than those who had not attended any pre-school provisions (ES=0.33 for medium quality; ES=0.41 for high quality - see Figure 4.3 or Table A6.3 in Appendix 6). The quality gradient for male students is distinct, whereas for female students, pre-school effects are weaker and do not show a clear quality gradient.
Figure 4.3: The combined impact of gender and pre-school quality on GCSE maths
53

The combined impact of pre-school experience and parent’s highest qualification level The sample was divided into two groups based on the highest qualification of the parents: students with lower qualified parents versus students with more qualified parents. The parents who had ‘no qualification’, ‘vocational’ or ‘16 academic’ qualification levels were categorised as lower qualified. Thus, if both of the parents were in any of these 3 groups the ‘Parent’s highest qualification level’ was set to low qualified. Conversely, if at least one of the parents had a qualification higher than ‘16 academic’ then the ‘Parent’s highest qualification level’ was set as moderate/high. Joint measures were created between parents’ highest qualification and pre-school attendance, pre-school quality and pre-school effectiveness. The combined terms were then entered separately into the contextualised models predicting Year 11 academic attainment.
With regard to the effect of past pre-school attendance, pre-school continues to be a statistically significant predictor of GCSE results for students with both low and higher qualified parents. The highest effect sizes were found for students who had attended a pre-school and had higher qualified parents (see Table A6.4, Table A6.5 and Table A6.6 in Appendix 6).
For total GCSE score, there was no evidence that quality made a statistically significant difference to the size of the pre-school effect for students from different parental qualification groups (see Table A6.4 in Appendix 6). However, for grades in GCSE English and in GCSE maths, there was some evidence that the quality of earlier pre-school experiences predicted differences in grades after controlling for individual student, family, HLE and neighbourhood influences (see Figure 4.4 and Table A6.5 for GCSE English; see Figure 4.5 and Table A6.6 for GCSE maths). Thus, for students of low qualified parents who had attended a high quality, there were significant effects for grades in GCSE English (ES=0.35) and in GCSE maths (ES=0.25). For students whose parents had moderate to high qualification levels, a clear pre-school quality gradient was evident for grades in GCSE English (see Figure 4.4 and Table A6.5). However, the same pattern did not show for grades in GCSE maths for this group (see see Figure 4.5 and Table A6.6). Rather, any pre-school experience, irrespective of quality, showed a benefit when compared to none.
54

Figure 4.4: The combined impact of parents’ highest qualification and pre-school quality on GCSE
English
Figure 4.5: The combined impact of parents’ highest qualification and pre-school quality on GCSE maths
These results reinforce the fact that parents’ qualification levels remained a strong predictor of better English and maths attainment in the long term.
Given that the previous EPPSE analyses have demonstrated modest effects for the quality and effectiveness of pre-school experience, but strong effects for the early years HLE on later academic attainment, their joint effects were investigated. For this analysis,
55
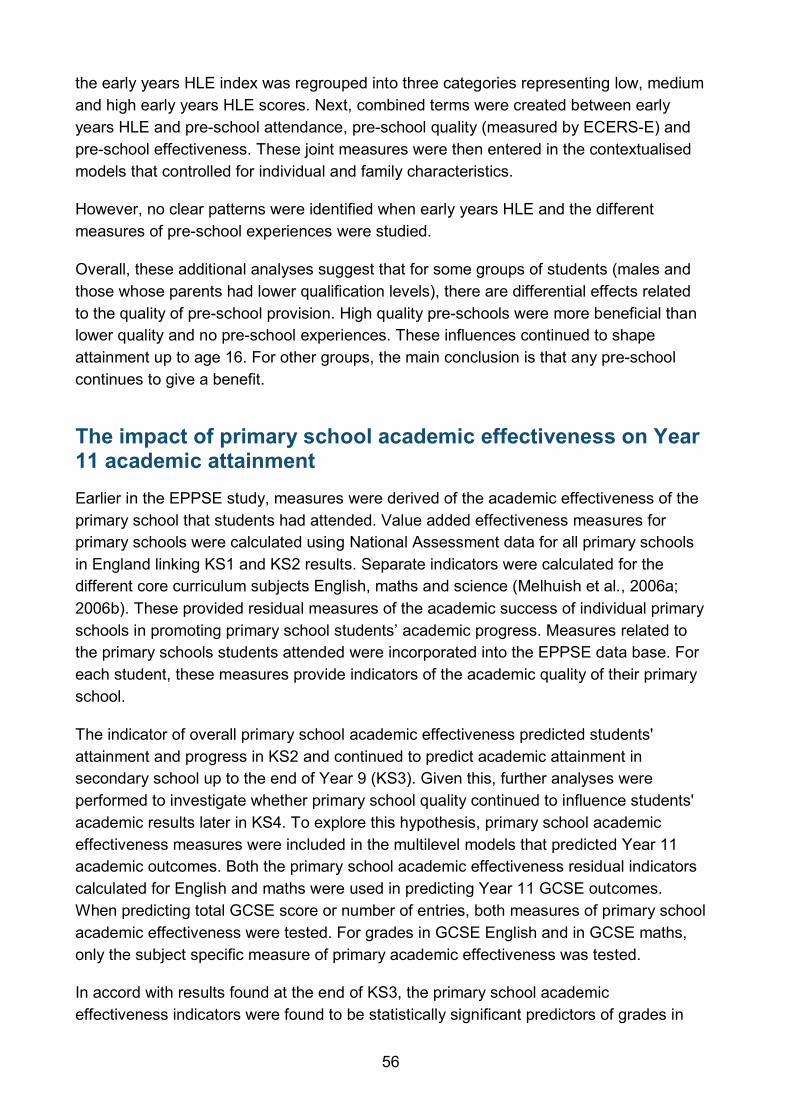
the early years HLE index was regrouped into three categories representing low, medium and high early years HLE scores. Next, combined terms were created between early years HLE and pre-school attendance, pre-school quality (measured by ECERS-E) and pre-school effectiveness. These joint measures were then entered in the contextualised models that controlled for individual and family characteristics.
However, no clear patterns were identified when early years HLE and the different measures of pre-school experiences were studied.
Overall, these additional analyses suggest that for some groups of students (males and those whose parents had lower qualification levels), there are differential effects related to the quality of pre-school provision. High quality pre-schools were more beneficial than lower quality and no pre-school experiences. These influences continued to shape attainment up to age 16. For other groups, the main conclusion is that any pre-school continues to give a benefit.
The impact of primary school academic effectiveness on Year 11 academic attainment Earlier in the EPPSE study, measures were derived of the academic effectiveness of the primary school that students had attended. Value added effectiveness measures for primary schools were calculated using National Assessment data for all primary schools in England linking KS1 and KS2 results. Separate indicators were calculated for the different core curriculum subjects English, maths and science (Melhuish et al., 2006a; 2006b). These provided residual measures of the academic success of individual primary schools in promoting primary school students’ academic progress. Measures related to the primary schools students attended were incorporated into the EPPSE data base. For each student, these measures provide indicators of the academic quality of their primary school.
The indicator of overall primary school academic effectiveness predicted students' attainment and progress in KS2 and continued to predict academic attainment in secondary school up to the end of Year 9 (KS3). Given this, further analyses were performed to investigate whether primary school quality continued to influence students' academic results later in KS4. To explore this hypothesis, primary school academic effectiveness measures were included in the multilevel models that predicted Year 11 academic outcomes. Both the primary school academic effectiveness residual indicators calculated for English and maths were used in predicting Year 11 GCSE outcomes. When predicting total GCSE score or number of entries, both measures of primary school academic effectiveness were tested. For grades in GCSE English and in GCSE maths, only the subject specific measure of primary academic effectiveness was tested.
In accord with results found at the end of KS3, the primary school academic effectiveness indicators were found to be statistically significant predictors of grades in
56
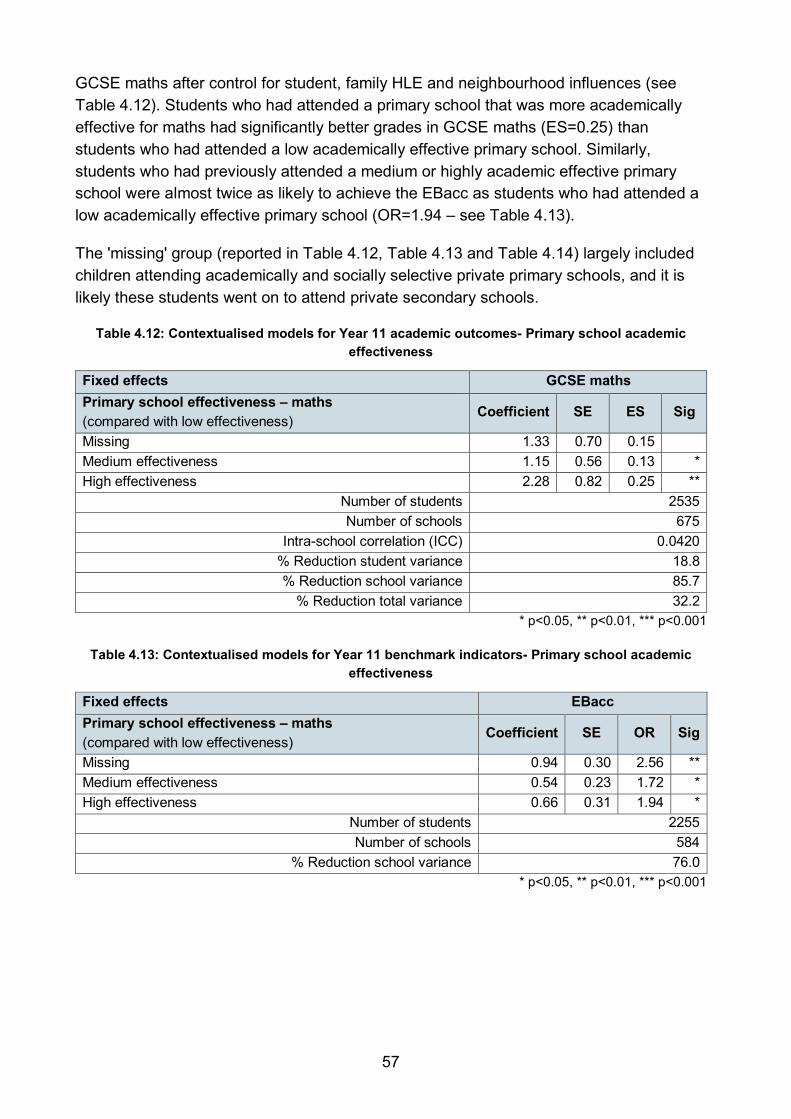
GCSE maths after control for student, family HLE and neighbourhood influences (see Table 4.12). Students who had attended a primary school that was more academically effective for maths had significantly better grades in GCSE maths (ES=0.25) than students who had attended a low academically effective primary school. Similarly, students who had previously attended a medium or highly academic effective primary school were almost twice as likely to achieve the EBacc as students who had attended a low academically effective primary school (OR=1.94 – see Table 4.13).
The 'missing' group (reported in Table 4.12, Table 4.13 and Table 4.14) largely included children attending academically and socially selective private primary schools, and it is likely these students went on to attend private secondary schools.
Table 4.12: Contextualised models for Year 11 academic outcomes- Primary school academic effectiveness
Fixed effects GCSE maths Primary school effectiveness – maths (compared with low effectiveness)
Coefficient SE ES Sig
Missing 1.33 0.70 0.15 Medium effectiveness 1.15 0.56 0.13 * High effectiveness 2.28 0.82 0.25 **
Number of students 2535 Number of schools 675
Intra-school correlation (ICC) 0.0420 % Reduction student variance 18.8 % Reduction school variance 85.7
% Reduction total variance 32.2 * p<0.05, ** p<0.01, *** p<0.001
Table 4.13: Contextualised models for Year 11 benchmark indicators- Primary school academic effectiveness
Fixed effects EBacc Primary school effectiveness – maths (compared with low effectiveness)
Coefficient SE OR Sig
Missing 0.94 0.30 2.56 ** Medium effectiveness 0.54 0.23 1.72 * High effectiveness 0.66 0.31 1.94 *
Number of students 2255 Number of schools 584
% Reduction school variance 76.0 * p<0.05, ** p<0.01, *** p<0.001
57

Table 4.14: Contextualised models for Year 11 benchmark indicators- Primary school academic
effectiveness
Fixed effects EBacc Primary school effectiveness – English (compared with low effectiveness)
Coefficient SE OR Sig
Missing 0.16 0.22 1.93 * Medium effectiveness 0.51 0.30 1.17 High effectiveness 0.66 0.29 1.67
Number of students 2255 Number of schools 584
% Reduction school variance 76.5 * p<0.05, ** p<0.01, *** p<0.001
The impact of secondary school on Year 11 academic attainment The majority of students attended a ‘comprehensive’ school in Year 11 (86%), while almost 4% were studying in an ‘independent’ school (see Table 4.15). As school type31 is highly likely to influence students’ attainment, this was tested as a predictor of GCSE results in contextualised models where other individual, family and home learning characteristics were also controlled for. Results showed that students who attended ‘selective’ secondary schools had significantly better total GCSE score, better grades in GCSE English and in GCSE maths and were entered for more full GCSE exams, were more likely to have achieved 5 A*-C, 5 A*-C including English and maths and the EBacc than students who attended ‘comprehensive’ schools (see Table 4.16 and Table 4.17).
Table 4.15: Distribution of Year 11 students in schools and Total number of full GCSE entries in Year 11
KS4 school type Distribution of Year 11
students in schools Total number of full
GCSE entries N % Mean SD
Comprehensive 2372 85.9 7.3 2.5 Selective 55 2.0 10.5 1.2 Modern 29 1.1 8.4 1.8 Other maintained 106 3.8 1.1 1.3 Independent 199 7.2 8.7 2.0 Total 2761 100.0 7.3 2.8
31 Based on this typology, we cannot differentiate the secondary schools that became Academies. Additionally, Free Schools were not part of this analysis and the policy changes that have recently taken place are not reflected in this report.
58

Students from the ‘other maintained’ category had the lowest GCSE results when compared with students from ‘comprehensive’ schools32 (see Table 4.16). Interestingly, students from ‘independent’ schools showed poorer GCSE results measured by the total GCSE score, but slightly better results for grades in GCSE maths. It should be noted that ‘independent’ schools are likely to be both socially and academically selective and that these contextualised models do not control for prior attainment. Further value added analyses in Section 6 provide a fairer comparison of secondary school type effects.
Table 4.16: Contextualised models for Year 11 academic outcomes - Secondary school type
Fixed effects Total GCSE score
Total GCSE entries
GCSE English
GCSE maths
KS4 Secondary school type (compared with Comprehensive)
ES Sig ES Sig ES Sig ES Sig
Selective 0.43 * 0.74 *** 0.72 *** 0.81 *** Modern -0.34 0.33 0.11 -0.23 Other maintained -2.43 *** -2.59 *** -0.95 *** -1.29 *** Independent -1.44 *** -0.45 -0.05 0.31 ***
Number of students 2497 2510 2343 2535 Number of schools 610 614 573 675
Intra-school correlation (ICC) 0.1920 0.1716 0.0595 0.0299 % Reduction student variance 16.3 14.4 21.3 20.8 % Reduction school variance 61.2 82.6 86.8 90.2
% Reduction total variance 31.6 48.8 39.2 34.7 * p<0.05, ** p<0.01, *** p<0.001
Table 4.17: Contextualised models for Year 11 benchmark indicators - Secondary school type
Fixed effects Achieved 5 A*-C Achieved 5 A*-C
English and maths
EBacc
KS4 Secondary school type (compared with Comprehensive)
OR Sig OR Sig OR Sig
Selective 14.34 * 19.00 ** 4.77 *** Modern 1.22 0.73 0.78 Other maintained n/a 0.01 *** n/a Independent 1.52 0.79 0.86
Number of students 2429 2753 2255 Number of schools 601 735 584
% Reduction school variance 83.2 57.9 77.3 * p<0.05, ** p<0.01, *** p<0.001
n/a – not applicable as no cases achieved the benchmark indicator
32 It should be noted that many of the schools in the ‘other maintained’ category cater specifically for students with special educational needs (SEN) or behavioural or health problems.
59

The impact of secondary school academic effectiveness on Year 11 academic attainment
Previous analyses presented within this report showed that the academic effectiveness of the primary school predicts students’ attainment in KS4 (particularly in maths) over and above the effects attributed to students’ background. It is therefore important to establish whether secondary school academic effectiveness and educational quality also help to predict better student outcomes at age 16. In order to do this, national data sets have been used to obtain indicators of the level of secondary schools academic effectiveness and quality.
The secondary school academic overall effectiveness was represented by the contextual value added (CVA) score at the school level. This measure33 was provided by the DfE34 and was matched onto our dataset using the school identification number.
A mean CVA score was calculated based on KS2 to KS4 (KS2-4) CVA secondary school progress scores for four years from 2006 to 2009 for the secondary schools attended by students. This measure of overall secondary school academic effectiveness was added to the contextualised models that predicted Year 11 academic attainment when controlling for individual student, family, HLE and neighbourhood characteristics.
Secondary school academic effectiveness35 was a significant predictor of total GCSE score but not of other measures (see Table 4.18). Students who attended highly academically effective secondary schools were more likely to obtain higher total GCSE scores than those who attended a low effective secondary school and effects were moderate (ES=0.42). It has to be noted that this measure reflects overall effectiveness rather than effectiveness in a specific subject and does not relate to specific academic outcomes in different subjects that are likely to reflect subject department effects. Earlier
33 At the student level, the CVA score was calculated as the difference between predicted attainment (i.e., the average attainment achieved by similar students) and real attainment in KS4. The predicted attainment was obtained by using multilevel modelling when controlling for students’ prior attainment and adjusting for their background characteristics (i.e. gender, age, ethnicity, special educational needs, FSM, mobility etc.). For each school, all individual student scores were averaged and adjusted for the proportion of students attending the school in a specific year. This final averaged score represents the school level CVA and it is presented as a number based around 1000. 34 However, DfE no longer uses this approach. A value added measure is used instead which compares progress, but does not take background into account. The pupil's value added score is based on comparing their exam performance with the median exam performance of other pupils with the same or similar prior attainment at KS2. The median value is the middle value - with half of the pupils having a capped point score at or below the median, and half at or above. A school's value added measure is a simple average (arithmetic mean) of the value added scores for all pupils in the school. 35 The EPPSE CVA indicator is based on DfE CVA results for 4 successive years, covering the 4 EPPSE cohorts, 2006-2009 for all secondary schools attended by EPPSE students. The EPPSE results have an overall CVA averaged mean of 1004, which is close to the national CVA mean of 1000. The students in the sample (based on their secondary school's average CVA score) were divided into high, medium and low CVA effectiveness groups based on the average CVA score to 1 SD above or below the mean; nationally, approximately 10% of secondary schools are 1 SD above the mean and approximately 10% of secondary schools are 1 SD below the mean.
60

analyses on subject specific academic effectiveness measures at primary school indicated that this is relevant. It should be noted that total GCSE score shows a larger school effect (measured by the intra-school correlation).
Table 4.18: Contextualised models for Year 11 academic outcomes - Secondary school academic effectiveness
Fixed effects Total GCSE score Secondary school academic effectiveness (compared with low)
Coefficient SE ES Sig
Medium effectiveness 11.53 13.41 0.09 High effectiveness 55.51 18.59 0.42 **
Number of students 2497 Number of schools 610
Intra-school correlation (ICC) 0.2967 % Reduction student variance 15.2 % Reduction school variance 30.2
% Reduction total variance 20.3 * p<0.05, ** p<0.01, *** p<0.001
The impact of secondary school quality on Year 11 academic attainment
The quality of secondary schools was measured by Ofsted school level inspection judgements. These judgements cover four dimensions at the school level:
• overall effectiveness
• achievement and standards
• personal development and well-being
• quality of provision.
Secondary schools were given grades from 1 to 4, where Grade 1 meant that the secondary school was ‘outstanding’; Grade 2 – indicated that the secondary school was ‘good’; Grade 3 – indicated that the secondary school was ‘satisfactory’; Grade 4 – indicated that the secondary school was ‘inadequate’. Since secondary schools are inspected in different years, we collected Ofsted inspection judgements from 2005 until 201036. When a secondary school had several Ofsted inspection judgements, we considered the earliest one in time.
EPPSE analyses at KS3 had shown that two Ofsted inspection judgements were significant predictors of students’ academic attainment in Year 9: the ‘quality of pupils' learning and their progress’ (pertaining to the ‘achievement and standards’ dimension)
36 These were downloaded from the Ofsted homepage http://www.ofsted.gov.uk/.
61

and the ‘attendance of learners’ (part of the ‘personal development and well-being’ dimension). These were also tested in the contextualised models that predicted academic attainment in Year 11, controlling for individual, family and HLE characteristics. Each inspection judgement was entered separately in the model in order to avoid potential collinearity.
The impact of the quality of pupils’ learning and their progress on Year 11 academic attainment Students attending secondary schools classified as ‘outstanding’ based on the ‘quality of pupils’ learning and their progress’ on average had significantly better grades in GCSE English (ES=0.47) and in GCSE maths (ES=0.47), and were more likely to have achieved 5 A*-C (OR=3.04), 5 A*-C including English and maths (OR=2.74) and the EBacc (OR=5.44) than students from secondary schools characterised as ‘inadequate’ in their learning quality (see Table 4.19 and Table 4.20).
The results for GCSE English are very similar to those obtained in Year 9. Moreover, students who did not attend an ‘inadequate’ school in terms ‘quality of pupil’s learning and their progress’ were entered for more full GCSE exams than students who attended schools judged as ‘inadequate’ (see Table 4.19).
Table 4.19: Contextualised models- Ofsted judgement of the quality of pupils’ learning
Fixed effects Total GCSE entries
GCSE English
GCSE maths
The quality of pupils’ learning (compared with inadequate)
ES Sig ES Sig ES Sig
Outstanding 0.93 *** 0.47 *** 0.47 *** Good 0.54 *** 0.13 0.15 Satisfactory 0.42 *** 0.09 0.12 Missing 0.42 * 0.04 0.25 * Number of students 2510 2343 2535 Number of schools 614 573 675
Intra-school correlation (ICC) 0.2930 0.0635 0.0383 % Reduction student variance 11.7 21.0 19.0 % Reduction school variance 64.1 85.8 87.1
% Reduction total variance 38.2 38.7 32.6 * p<0.05, ** p<0.01, *** p<0.001
Table 4.20: Contextualised models for Year 11 benchmark indicators - Ofsted judgement of the quality of pupils’ learning
Fixed effects Achieved 5 A*-C Achieved 5 A*-C English and maths EBacc
The quality of pupils’ learning (compared with inadequate)
OR Sig OR Sig OR Sig
Outstanding 3.04 *** 2.74 *** 5.44 *** Good 1.40 1.06 2.64 * Satisfactory 1.29 1.10 1.88
62

Missing 1.84 * 0.93 1.74 Number of students 2429 2753 2255 Number of schools 601 735 584
% Reduction school variance 83.7 50.8 80.2 * p<0.05, ** p<0.01, *** p<0.001
Given earlier findings, it is not surprising to find a strong relationship between the overall quality of learning in a specific secondary school and learning outcomes of its students; an outstanding provision leading to higher levels of attainment. It should be remembered that these analyses controlled for the influence of student, family, HLE and neighbourhood influences. Those who attended secondary schools with missing Ofsted data (mostly selective independent schools) also showed better GCSE outcomes.
The impact of the learners’ attendance on Year 11 academic attainment Ofsted inspectors also rated secondary schools based on the level of attendance of their students. ‘Learners’ attendance’ as rated by Ofsted inspectors was a statistically significant predictor of academic attainment in Year 11. Students from secondary schools rated as ‘outstanding’ for ‘learners’ attendance’ got higher grades in GCSE English (ES=0.50) and in GCSE maths (ES=0.62) than students from secondary schools characterised as ‘inadequate’ in their overall attendance, controlling for other influences (see Table 4.21). Additionally, students from all the other categories of schools obtained better grades in GCSE maths at the end of Year 11 than students from ‘inadequate’ schools. The average number of full GCSE entries was also significantly different for schools judged as ‘outstanding’, ‘good’ or ‘satisfactory’ in terms of ‘learners’ attendance’. Students attending secondary schools rated as ‘outstanding’ for ‘learners’ attendance’ were entered for significantly more full GCSEs than students from schools where attendance was assessed as being inadequate (ES=0.78) (see Table 4.21).
Table 4.21: Contextualised models for Year 11 academic outcomes - Ofsted judgement of Attendance of learners
Fixed effects Total
GCSE entries GCSE English GCSE maths
Attendance of learners (compared with inadequate)
ES Sig ES Sig ES Sig
Outstanding 0.78 *** 0.50 *** 0.62 *** Good 0.70 *** 0.31 * 0.51 *** Satisfactory 0.53 *** 0.19 0.43 *** Missing 0.49 ** 0.16 0.52 ***
Number of students 2510 2343 2535 Number of schools 614 573 675
Intra-school correlation (ICC) 0.2888 0.0665 0.0316 % Reduction student variance 11.4 21.2 18.8 % Reduction school variance 64.7 85.1 89.4
% Reduction total variance 38.3 38.6 32.9 * p<0.05, ** p<0.01, *** p<0.001
63

The probabilities of achieving 5 A*-C and 5 A*-C including English and maths were significantly higher for students attending secondary schools rated as ‘outstanding’ for ‘learners’ attendance’ (see Table 4.22).
Table 4.22: Contextualised models for Year 11 benchmark indicators- Ofsted judgement of Attendance of learners
Fixed effects Achieved A*-C Achieved A*-C
English and maths Attendance of learners (compared with inadequate)
OR Sig OR Sig
Outstanding 2.89 *** 2.74 *** Good 2.17 ** 1.97 ** Satisfactory 1.87 * 1.78 * Missing 2.56 ** 1.49
Number of students 2429 2753 Number of schools 601 735
% Reduction school variance 86.3 49.4 * p<0.05, ** p<0.01, *** p<0.001
The relationship between overall attendance and academic outcomes is interesting, but not straightforward. The positive strong relationship might be due to the fact that secondary schools that offer high quality academic provision have stricter policies on attendance and therefore are better attended, or are better attended because of the very quality of the provision. Reciprocal effects may, in part help to account for these findings. They do indicate that attending a higher quality secondary school confers significant and sizeable benefits in promoting better GCSE outcomes.
64

5 Exploring the effects of students’ experiences of secondary schools on KS4 attainment
Key findings
Experiences of schools in Year 9
• Students’ perceptions of their schools’ ‘emphasis on learning’, positive ‘behaviour climate’, ‘environment’ and ‘learning resources’ reported in Year 9 were significant and positive predictors of all continuous measures of Year 11 academic attainment. ‘Valuing pupils’ had small but positive effects on total GCSE score and GCSE English.
• Moreover, perceived ‘emphasis on learning’ and positive ‘behaviour climate’ predicted a higher likelihood of achieving 5 A*-C, 5 A*-C including English and maths and the EBacc.
Experiences of schools in Year 11
• Significantly higher total GCSE scores and better grades in GCSE English were obtained by students who reported in Year 11 that (1) their teachers had a strong focus on learning (‘teacher professional focus’); (2) in their schools the relationships between students and teachers were good in terms of trust, respect and fairness (‘positive relationships’); (3) there was a high level of monitoring by their teachers (‘monitoring students’); and (4) their teacher provided more feedback (‘formative feedback’).
• ‘Positive relationships’ and ‘formative feedback’ were both significant predictors of better grades in GCSE maths.
Homework
• In KS3, it was found that spending more time on homework predicted better attainment in Year 9 and progress between KS2 and KS3. Interestingly, the daily time spent on homework, as reported by students in Year 9 continued to strongly predict better academic attainment in Year 11. The strongest effects were noted for those who reported spending 2-3 hours doing homework on a typical school night. Students who reported spending between 2 and 3 hours on homework on an average weeknight in Year 9 were almost 10 times more likely to achieve 5 A*-C than students who did not spend any time on homework, controlling for other influences (individual, family, HLE and neighbourhood).
• Similarly, moderate to strong effects were found for the time students reported they spent on homework in Year 11 for total GCSE score, specific GCSE subject grades and the benchmark indicators.
65

Experiences of school in Year 9 During Year 9, students completed two questionnaires about their personal and academic life during KS3 of secondary education. One questionnaire (‘All about Me in School’) focused on their views of academic life, including their perceptions of their own school, their teachers, headteachers and other students, but also on their general experiences as students in secondary education. Based on this survey, several indicators were created reflecting secondary school and teaching in KS3 (for details see Sammons et al., 2011d).
The second questionnaire (‘All about me’) explored in more detail the personal, familial and the broader social context of the students while in secondary education. Interesting domains like ‘out of school’ learning, the opportunities students have for additional ‘after hours’ learning experiences in school, time spent on homework, and students own academic self-concepts for different individual subjects were investigated.
Exploratory and Confirmatory Factor Analysis (EFA and CFA) revealed several factors related to views of school in Year 9 (see Sammons et al., 2011d). The items analysed were originally Likert-type scales that went from (1) strongly agree to (4) strongly disagree37. The factors were calculated using factor weights, were treated as continuous measures, were centred to the grand mean and were entered in the models predicting the various GCSE outcome measures separately (unless otherwise stated).
The Year 9 factors based on students' self-reported views of schools included:
• Emphasis on learning
• Behaviour climate
• Headteacher qualities
• School environment
• Valuing pupils
• School/Learning resources
• Teacher discipline and care
• Teacher support.
37 These item scores were reversed to facilitate interpretation such that a high score indicates a stronger response for each factor (see Sammons et al., 2011c for details).
66

In earlier analyses of attainment in Year 9, EPPSE found that these various school experiences were significant predictors of students’ academic attainment, after controlling for individual student, family and HLE characteristics. It is thus, expected that the same factors might continue to influence later academic attainment at the end of Year 11.
The factors were tested as separate predictors of the GCSE outcome measures in multilevel models that also included various individual student, family, HLE, school and neighbourhood context characteristics (identified as significant and presented in Sections 2 and 3 of this report). A number of students’ views of school factors were found to be statistically significant for each academic outcome. The results of the multilevel models are presented in Table 5.1 and Table 5.2.
Emphasis on learning
The factor 'emphasis on learning' describes students' perceptions of the importance their teachers attach to their students’ learning, but also the students’ expectations regarding their own attainment. A greater ‘emphasis on learning’ was a significant predictor of better attainment in terms of GCSE results. Interestingly, the effect sizes are slightly higher than those found in equivalent analyses of attainment in Year 9. A greater ‘emphasis on learning’ predicted a higher total GCSE score (ES=0.36), better grades in GCSE English (ES=0.32) and in GCSE maths (ES=0.23), and being entered for a higher number of full GCSE entries (ES=0.26). In addition, it was a strong predictor of the GCSE benchmark indicators. For example, a greater ‘emphasis on learning’ increased the likelihood almost six fold of a student achieving 5 A*-C (OR=5.95), two and a half fold the likelihood of achieving 5 A*-C including English maths (OR=2.51) and three fold the likelihood of getting the EBacc (OR=3.00).
Behaviour climate
The factor 'behaviour climate' refers to students' perceptions of the specific (disruptive) behaviours that students notice around the school (e.g., the extent that students as a whole obey school rules, fighting, bringing knives or weapons into school). Higher scores on this factor reflect a more positive ‘behaviour climate’, in other words less negative behaviour. The results of the multilevel models predicting academic attainment indicated that all seven academic outcomes in Year 11 were significantly better for students who perceived their secondary schools’ ‘behaviour climate’ as more positive than those who rated the ‘behaviour climate’ of their schools less favourably (see Table 5.1 and Table 5.2). The effect for GCSE maths was slightly larger (ES =0.41) than for GCSE English and total GCSE score (ES=0.34 for both). A more positive ‘behaviour climate’ also significantly predicted higher probabilities of achieving 5 A*-C (OR=3.12), achieving 5 A*-C including English and maths (OR=2.32) and the EBacc (OR=1.94).
67
These results are in accord with previous school effectiveness research that points to the importance of the school’s overall ‘behaviour climate’ (see Creemers & Kyriakides, 2008; Rutter et al., 1979; Sammons, Thomas, & Mortimore, 1997; Scheerens & Bosker, 1997). These findings are also in line with international research that showed that a positive school behavioural climate was associated with higher academic achievement, healthier behavioural outcomes and better socio-emotional well-being generally (Brand et al., 2003; Hanson, Austin, & Zheng, 2011; Patton et al., 2006). Voight, Austin and Hanson (2013) showed that school climate can be used to differentiate successful from unsuccessful schools, even after controlling for student characteristics and resources.
Headteacher qualities
This factor refers to the visibility of the headteacher around the school, and perceptions of their interest in students’ learning and their interventions to make students behave well. Although this factor did not predict academic attainment in Year 9, in Year 11 it was a weak but statistically significant positive predictor of total GCSE score (ES=0.14) and grades in GCSE English (ES=0.12). Perceived ‘headteacher qualities’ did not predict any of the GCSE benchmark measures.
School environment
The ‘school environment’ factor represents the perceived quality of the physical environment of the secondary school (i.e. attractive building, decoration of the classroom, level of cleanness of the toilets) but also the level of organisation. As expected, the way students perceived the learning environment in Year 9 was found to predict their academic attainment in Year 11. Thus, when the ‘school environment’ was perceived as pleasant and attractive, students obtained higher total GCSE scores (ES=0.15), better results in GCSE English (ES=0.12) and GCSE maths (ES=0.13) and were entered for more full GCSE exams (ES=0.19), although the effects were weak. Perceived ‘school environment’ did not predict the likelihood of achieving 5 A*-C or the EBacc.
Valuing pupils
Students’ perceptions of the degree in which their teachers valued and respected them was a significant predictor of the Year 11 academic outcomes. Higher scores on this factor reflect higher perceived levels of respect and friendliness from the teachers. The more the teachers were perceived as valuing students’ views and opinions, the higher the total GCSE score (ES=0.22), the better their grades in GCSE English (ES=0.15), the greater the total number of GCSE entries (ES=0.20), and the higher the probability of students achieving 5 A*-C (OR=2.44) and 5 A*-C including English and maths (OR=1.67). Although the factor ‘valuing pupils’ significantly predicted Year 9 attainment in maths, this factor did not predict results in GCSE maths.
68

While the relationships are positive and statistically significant, it is not possible to make causal connections between perceived teachers’ attitudes and students’ attainment because the directionality of relationships may be reciprocal. Students with higher attainment may have more positive perceptions of their teachers. Additionally, teachers who value their students could also put more effort in the teaching and learning and therefore increase academic attainment. Regardless of the specific directionality, it is important for teachers to recognise that the way they relate and present themselves to their students may influence their academic outcomes. In Section 6, we control for students’ prior attainment to see whether the various factors also predict progress from KS2 to KS4.
School/learning resources
The schools’ capacity to offer good learning resources is likely to influence the way students learn and acquire new information. Amenities like good science labs, libraries and computer rooms were found to positively predict total GCSE score (ES=0.20), grades in GCSE English (ES=0.14) and in GCSE maths (ES=0.17). Higher scores on ‘school/learning resources’ meant that the students perceived that the school was well equipped with computers and technology and that there was enough time spent using these facilities. Students’ perceptions of available ‘school/learning resources’ significantly predicted all continuous measures of academic attainment as well as the total number of GCSE exams students were entered for (ES=0.20 - see Table 5.1).
Table 5.1: Contextualised models for Year 11 academic outcomes -Year 9 views of school (tested separately)
Fixed effects (continuous) Total GCSE score
Total GCSE entries
GCSE English
GCSE maths
Year 9 views of school ES Sig ES Sig ES Sig ES Sig Emphasis on learning 0.36 *** 0.26 *** 0.32 *** 0.23 *** Behaviour climate 0.34 *** 0.41 *** 0.34 *** 0.41 *** Headteacher qualities 0.14 * ns 0.12 * ns School environment 0.15 * 0.19 ** 0.12 * 0.13 * Valuing pupils 0.22 *** 0.20 *** 0.15 * ns School/Learning resources 0.20 *** 0.20 *** 0.14 * 0.17 ** Teacher discipline and care 0.14 * ns ns ns Teacher support 0.15 * 0.12 * ns ns
* p<0.05, ** p<0.01, *** p<0.001 ns=not statistically significant
Teacher discipline and care
The way students perceive their teachers’ actions and intervention to maintain order and discipline in classrooms was a weak but significant predictor of total GCSE score
69
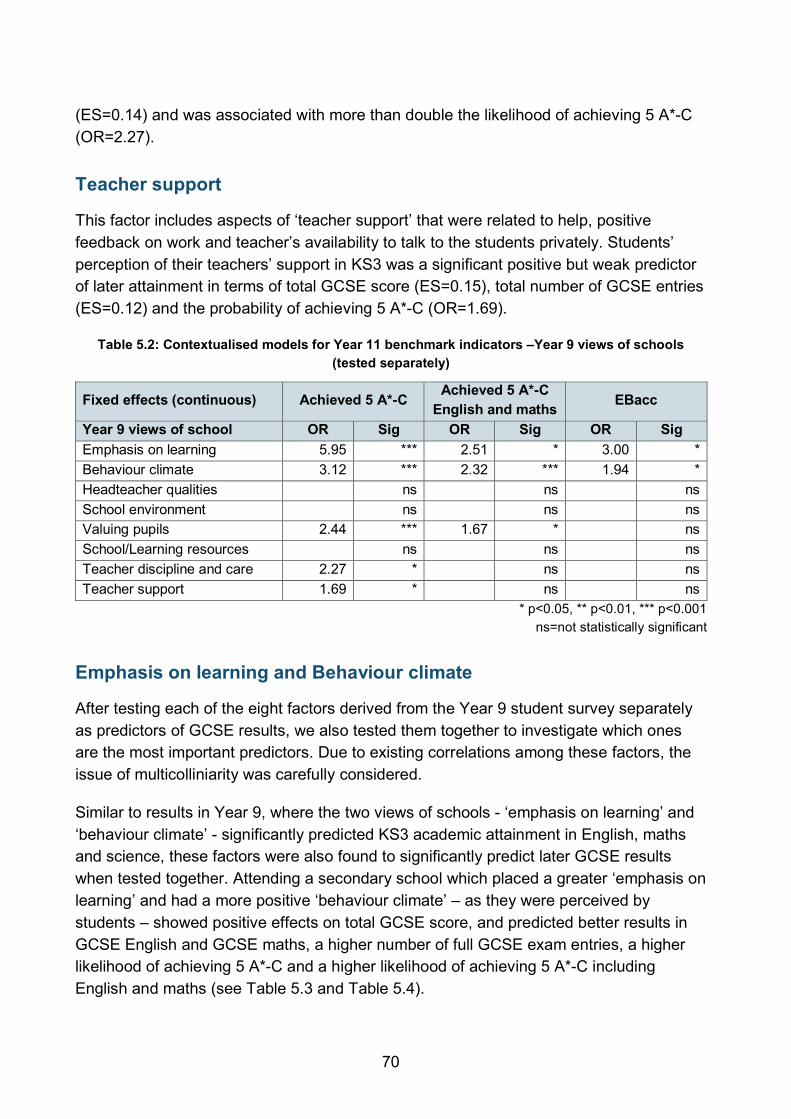
(ES=0.14) and was associated with more than double the likelihood of achieving 5 A*-C (OR=2.27).
Teacher support
This factor includes aspects of ‘teacher support’ that were related to help, positive feedback on work and teacher’s availability to talk to the students privately. Students’ perception of their teachers’ support in KS3 was a significant positive but weak predictor of later attainment in terms of total GCSE score (ES=0.15), total number of GCSE entries (ES=0.12) and the probability of achieving 5 A*-C (OR=1.69).
Table 5.2: Contextualised models for Year 11 benchmark indicators –Year 9 views of schools (tested separately)
Fixed effects (continuous) Achieved 5 A*-C Achieved 5 A*-C
English and maths EBacc
Year 9 views of school OR Sig OR Sig OR Sig Emphasis on learning 5.95 *** 2.51 * 3.00 * Behaviour climate 3.12 *** 2.32 *** 1.94 * Headteacher qualities ns ns ns School environment ns ns ns Valuing pupils 2.44 *** 1.67 * ns School/Learning resources ns ns ns Teacher discipline and care 2.27 * ns ns Teacher support 1.69 * ns ns
* p<0.05, ** p<0.01, *** p<0.001 ns=not statistically significant
Emphasis on learning and Behaviour climate
After testing each of the eight factors derived from the Year 9 student survey separately as predictors of GCSE results, we also tested them together to investigate which ones are the most important predictors. Due to existing correlations among these factors, the issue of multicolliniarity was carefully considered.
Similar to results in Year 9, where the two views of schools - ‘emphasis on learning’ and ‘behaviour climate’ - significantly predicted KS3 academic attainment in English, maths and science, these factors were also found to significantly predict later GCSE results when tested together. Attending a secondary school which placed a greater ‘emphasis on learning’ and had a more positive ‘behaviour climate’ – as they were perceived by students – showed positive effects on total GCSE score, and predicted better results in GCSE English and GCSE maths, a higher number of full GCSE exam entries, a higher likelihood of achieving 5 A*-C and a higher likelihood of achieving 5 A*-C including English and maths (see Table 5.3 and Table 5.4).
70

These results again point to the importance of the secondary school’s ‘behaviour climate’ as an important feature of overall school effectiveness and this is in accord with the findings of previous research on secondary schools in England (e.g., Rutter et al., 1979; Sammons, Thomas & Mortimore, 1997).
Table 5.3: Contextualised models for Year 11 academic outcomes –Year 9 views of school (tested in the same model)
Fixed effects Total
GCSE score Total
GCSE entries GCSE
English GCSE maths
Year 9 views of school ES Sig ES Sig ES Sig ES Sig Behaviour climate 0.27 *** 0.37 *** 0.27 *** 0.37 *** Emphasis on learning 0.31 *** 0.19 ** 0.26 *** 0.14 *
Number of students 1470 1474 1420 1531 Number of schools 411 412 401 465
Intra-school correlation (ICC) 0.2720 0.2115 0.0800 0.0296 % Reduction student variance 29.0 22.6 32.4 26.8 % Reduction school variance 48.3 79.7 84.4 91.0
% Reduction total variance 35.6 51.4 46.6 39.6 * p<0.05, ** p<0.01, *** p<0.001
ns=not statistically significant
Table 5.4: Contextualised models for Year 11 benchmark indicators –Year 9 views of schools (tested in the same model)
Fixed effects Achieved 5 A*-C Achieved 5 A*-C English and maths
Year 9 views of school OR Sig OR Sig Behaviour climate 2.77 *** 2.19 *** Emphasis on learning 4.02 ** 1.82
Number of students 1444 1613 Number of schools 407 485
% Reduction school variance 75.5 21.5 * p<0.05, ** p<0.01, *** p<0.001
Experiences of school in Year 11 Another questionnaire (‘Life in Year 11’) was sent out to students in the spring term of Year 11. The questionnaire covered areas of interest including students’ views/dispositions and aspirations, extended school activities, out of school activities, friendship, behaviour, and experiences of school and classroom life. In total, 1676 students completed the ‘Life in Year 11’ questionnaire.
The questionnaire contained a combination of existing scales or survey items and questions developed by the EPPSE team, and many of the items used in Year 11 were
71

also used at previous time points. The ‘Life in Year 11’ questionnaire incorporated the following scales:
• The Warwick-Edinburgh Mental Well-being scale (Stewart-Brown & Janmohamed, 2008).
• The General Academic self-concept scale (Marsh, 1990a; 1990b).
• The Resistance to Peer Influence scale (Steinberg & Monahan, 2007).
In addition, views of school items were adapted from the following surveys:
• The School Climate Assessment Instrument (Grosin & McNamara, 2001).
• The Lousiana ABC+ model (Teddlie & Stringfield, 1993).
Five factors were extracted from students’ responses by using exploratory and confirmatory factor analyses (see Sammons et al., 2014b for further details):
• Teacher professional focus
• Positive relationships
• Monitoring students
• Formative feedback
• Academic ethos.
In line with the strategy adopted for the Year 9 views of school factors, multilevel models tested each of the Year 11 factors separately as a predictor of GCSE attainment while controlling for the influence of individual student, family, HLE, school and neighbourhood characteristics (described as significant predictors in Section 3). For each academic outcome a number of school factors were found to be statistically significant.
Due to the response rates in both Year 9 and Year 11, it was not considered appropriate to test the combined effects of KS3 and KS4 views of school measures simultaneously (as the numbers of students who answered both surveys was only 1237 or 45% of the total for whom GCSE outcome data were available).
The results of the multilevel models are presented in Table 5.5 and Table 5.6.
Teacher professional focus
Students who perceived that their teachers focused on learning and were competent obtained higher total GCSE scores (ES=0.22) and better Year 11 results in GCSE English (ES=0.21).
72

Positive relationships
The highest effect sizes were obtained for perceived ‘positive relationships’ (see Table 5.5 and Table 5.6). Students who perceived that the relationships between students and teachers in their schools were good in terms of trust, respect and fairness obtained significantly higher total GCSE scores (ES=0.38), better results in GCSE English (ES=0.33) and in GCSE maths (ES=0.28), were entered for a higher number of full GCSE exams (ES=0.17), and were more likely to have achieved 5 A*-C (OR=1.94) and 5 A*-C including English and maths (OR=1.78).
Table 5.5: Contextualised models for Year 11 academic outcomes –Year 11 views of school (tested separately)
Fixed effects (continuous) Total
GCSE score Total
GCSE entries GCSE
English GCSE maths
Year 11 views of school ES Sig ES Sig ES Sig ES Sig Teacher professional focus 0.22 *** ns 0.21 *** ns Positive relationships 0.38 *** 0.17 ** 0.33 *** 0.28 *** Monitoring students 0.14 * ns 0.13 * ns Formative feedback 0.22 *** ns 0.22 *** 0.14 ** Academic ethos ns ns ns ns
* p<0.05, ** p<0.01, *** p<0.001 ns=not statistically significant
Table 5.6: Contextualised models for Year 11 benchmark indicators –Year 11 views of schools (tested separately)
Fixed effects (continuous) Achieved A*-C Achieved A*-C English and maths
Year 11 views of school OR Sig OR Sig Teacher professional focus ns ns Positive relationships 1.94 *** 1.78 *** Monitoring students ns ns Formative feedback ns ns Academic ethos ns ns
* p<0.05, ** p<0.01, *** p<0.001 ns=not statistically significant
Monitoring students
Students who perceived a high level of monitoring by their teachers, obtained higher total GCSE scores (ES=0.14) and better results in GCSE English (ES=0.13), although the effects were weak.
73

Formative feedback
The ‘formative feedback’ factor reflects the perceived level of help to improve their work that students received from their teachers. Greater levels of teacher feedback predicted higher total GCSE scores (ES=0.22) and better results in GCSE English (ES=0.22) and in GCSE maths (ES=0.14).
The impact of time spent on homework on KS4 academic attainment Students’ self-reports of time spent on homework on a typical school night were a strong positive predictor of academic attainment in Year 9 and progress between KS2 and KS3. It was hypothesised that spending more time on homework might also predict later academic attainment in Year 11 as well. Similar to the results in Year 9, self-reported time spent on homework was also a strong significant predictor of GCSE results. Generally, the relationship between time spent on homework and academic outcomes showed a broadly linear pattern up to 2-3 hours a night.
Table 5.7 shows that the strongest positive effects of completing 2-3 hours homework a night were found for total GCSE score (ES=0.95), followed by GCSE maths (ES=0.80) and GCSE English (ES=0.76). Similarly, Table 5.8 shows that spending between 2-3 hours on homework in KS3 increased the probability that a student would later achieve 5 A*-C (OR=9.97) and 5 A*-C including English and maths (OR=4.65).
Table 5.7: Contextualised models for Year 11 academic outcomes - Year 9 Time spent on homework
Fixed effects Total
GCSE score Total
GCSE entries GCSE
English GCSE maths
Year 9 Homework (compared with none) ES Sig ES Sig ES Sig ES Sig
Less than ½ hour 0.50 *** 0.47 *** 0.41 ** 0.35 * ½ -1 hour 0.57 *** 0.63 *** 0.45 *** 0.38 ** 1-2 hours 0.62 *** 0.68 *** 0.50 *** 0.50 *** 2-3 hours 0.95 *** 1.02 *** 0.76 *** 0.80 *** Over 3 hours 0.90 ** 1.04 ** 0.89 ** 0.15
Number of students 1469 1473 1420 1530 Number of schools 414 415 404 467
Intra-school correlation (ICC) 0.2548 0.2285 0.0845 0.0438 % Reduction student variance 27.4 23.0 31.7 26.7 % Reduction school variance 51.6 77.6 83.2 86.5
% Reduction total variance 35.6 50.6 45.8 38.6 * p<0.05, ** p<0.01, *** p<0.001
Studying for more than 3 hours significantly predicted students’ gaining a higher total GCSE score and better grades in GCSE English. However, spending more than 3 hours
74

on homework a night, when in Year 9, did not offer extra benefits for grades in GCSE maths.
Table 5.8: Contextualised models for Year 11 benchmark indicators – Year 9 Time spent on homework
Fixed effects Achieved 5 A*-C Achieved 5 A*-C English and maths
Year 9 Homework (compared with none) OR Sig OR Sig
Less than ½ hour 2.28 * 1.92 * ½ -1 hour 3.38 *** 2.57 ** 1-2 hours 3.30 *** 2.96 *** 2-3 hours 9.97 *** 4.65 *** Over 3 hours 8.63 * 1.92 *
Number of students 1443 1611 Number of schools 410 490
% Reduction school variance 71.2 13.3 * p<0.05, ** p<0.01, *** p<0.001
Students were again asked to report about the amount of time they spent on homework in Year 11. As expected, the relationship between self-reported time spent on homework and GCSE results was stronger as it was more likely that the content of the homework was more closely related to the materials covered in the Year 11 GCSE exams (see Table 5.9 and Table 5.10).
Table 5.9: Contextualised models for Year 11 academic outcomes –Year 11 Time spent on homework
Fixed effects Total GCSE score
Total GCSE entries
GCSE English
GCSE maths
Year 11 Homework (compared with none)
ES Sig ES Sig ES Sig ES Sig
Less than 1 hour 0.67 *** 0.66 *** 0.58 *** 0.55 *** 1-2 hours 0.75 *** 0.76 *** 0.70 *** 0.59 *** 2-3 hours 0.98 *** 0.87 *** 0.85 *** 0.88 *** Over 3 hours 1.39 *** 1.26 *** 1.14 *** 0.89 ***
Number of students 1369 1373 1327 1449 Number of schools 424 426 414 489
Intra-school correlation (ICC) 0.2679 0.2528 0.0665 0.0494 % Reduction student variance 32.8 29.6 38.2 34.9 % Reduction school variance 52.0 76.7 88.3 86.4
% Reduction total variance 39.3 53.4 51.9 45.2 * p<0.05, ** p<0.01, *** p<0.001
75

Table 5.10: Contextualised models for Year 11 benchmark indicators –Year 11 Time spent on homework
Fixed effects Achieved 5 A*-C Achieved 5 A*-C
English and maths EBacc
Year 11 Homework (compared with none) OR Sig OR Sig OR Sig
Less than 1 hour 4.58 *** 4.80 *** 2.12 1-2 hours 5.26 *** 5.34 *** 1.84 2-3 hours 9.61 *** 8.61 *** 2.79 * Over 3 hours 28.82^ *** 8.92 *** 4.05 *
Number of students 1347 1522 1240 Number of schools 422 510 409
% Reduction school variance 59.1 5.4 83.5 * p<0.05, ** p<0.01, *** p<0.001
^n<=61
An incremental pattern of gradation, similar to the one observed when exploring the effects of Year 9 homework can be observed. However, the effect sizes do not decrease for the ‘over 3 hours’ category. Spending more than 3 hours on homework in Year 11 is significantly associated with students’ obtaining higher total GCSE scores (ES=1.39), better grades in GCSE English (ES=1.14) and in GCSE maths (ES=0.89), being entered for more GCSE exams (ES=1.26), and being more likely to have achieved 5 A*-C including English and maths (OR=8.92) and the EBacc (OR=4.05).
Time spent on homework was one of the strongest predictors of attainment even when students’ background was controlled. Time spent on homework may reflect teachers’ expectations and/or the schools’ academic emphasis as well as a students’ own motivation and engagement. Our findings are in line with previous research about the relationship between homework and academic achievement (Cooper et al., 2006; Gustafsson, 2013; Holmes & Croll, 1989; Strand, 2012).
It is likely that the time students spent on homework in KS3 is also associated with the time students spent on homework in KS4. The correlation was r=0.48. Time spent on homework is likely to increase opportunities to learn and also increase self study skills and independence as a learner. Further analyses in Section 6 also tests whether time spent on homework predicted greater progress between KS2 and KS4.
76
6 Exploring students’ academic progress between Year 6 and Year 11
Key findings
Individual, family, HLE and neighbourhood characteristics
• Overall, there was evidence that students who were older for their year group, females, of Bangladeshi heritage, with higher family incomes, with higher qualified parents and who engaged in more KS3 HLE academic enrichment activities made greater progress between KS2 and KS4.
• There were also small negative effects on progress related to early behavioural or health problems and eligibility for FSM.
• Living in a neighbourhood with a higher percentage of White British citizens during the early years predicted poorer student progress in English. Progress in maths was significantly predicted by the IMD, the IDACI, as well as reported levels of crime, unemployment and neighbourhood safety.
Pre-school, primary and secondary school
• Pre-school attendance, and pre-school quality and effectiveness significantly predicted overall academic progress in terms of promoting a higher total GCSE score.
• Similarly, the CVA measure of secondary school academic effectiveness predicted the overall academic progress measured by total GCSE score.
• Measures of secondary school quality (Ofsted ratings) significantly predicted progress in specific GCSE subject grades, but not overall academic progress.
Experiences of schools in Year 9 and Year 11
• Year 9 student reports of a stronger ‘emphasis on learning’, a positive ‘behaviour climate’, teachers ‘valuing pupils’, a better ‘school environment’ and ‘school/learning resources’, more interested ‘headteachers’ and better ‘teacher behavioural management’ and ‘teacher support’ significantly predicted greater overall academic progress and subject specific progress in English and maths.
• Measures of Year 11 students’ views of school, except for ‘academic ethos’, also predicted academic progress between KS2 and KS4.
Homework
• Results show that for the overall academic progress in terms of GCSE total points score and progress in English and maths, any time spent on homework reported in Year 9 and Year 11 were beneficial, taking into account other influences.
77

KS2-KS4 Academic progress
Previous EPPSE analyses have studied students’ academic progress across different stages of their education. Thus, students’ academic progress was investigated over the pre-school period, from age 3 years plus to primary school entry and over different key stages up to KS3 (Sammons et al., 2002; 2007a; 2008a; 2011a).
In this section, we explore the students’ academic progress from the end of Year 6 at primary school (KS2) to the end of Year 11 at secondary school (KS4) using the same set of GCSE academic outcomes measures while controlling for Year 6 (KS2) National Assessment test scores as measures of prior attainment. The assessments at the end of Year 6 provide the baseline measures for these analyses of student progress across their time in secondary school (KS2-KS4)38. By controlling for prior attainment, the analyses show whether the same group of students are doing relatively better or worse in their later GCSE results than would be predicted by their earlier KS2 results.
The simple value added models control only for prior academic attainment at the end of Year 6 when predicting later GCSE results. The specific effect sizes are presented in Table 6.1, Table 6.2 and Table 6.3. Year 6 prior attainment is an important predictor for Year 11 attainment as shown by the percentage of total variance explained for each outcome. Prior attainment in maths accounted for nearly two thirds (62%) of the total variance in students' GCSE maths grade. Prior attainment in English accounted for over half (52%) of the total variance in the GCSE English grade. Year 6 English and maths scores together accounted for just almost a third (30%) of the total variance in total GCSE scores.
The variation in students’ progress associated with their school is shown by the intra-school correlation (ICC), an overall indicator of potential differences in school effectiveness. It is possible that any variation between schools, in terms of progress, might reflect differences in teaching approaches and emphases between KS2 and KS4. The results indicated that between fourteen and thirty-eight per cent of the variation in progress is accounted for by the secondary schools the students attended (see Table 6.1, Table 6.2 and Table 6.3). This is quite a substantial proportion. The proportion is lower for grades in GCSE English and in GCSE maths, reflecting the likely impact of subject departments rather than just a school effect. The proportion of variance in progress for total GCSE score is larger.
Table 6.1, Table 6.2 and Table 6.3 show the estimates for the effects of prior academic attainment at the end of Year 6 when predicting total GCSE score and grades in GCSE English and in GCSE maths. Prior attainment in English and maths were strong and
38 Prior attainment measures were chosen for KS2 because national test scores were available (in KS3 only less differentiated teacher assessments were available). By controlling for attainment at the end of primary school it is possible to investigate progress across the whole of the period in secondary education, giving a clearer focus on the contribution of secondary schooling.
78

KS2-KS4 Academic progress
significant predictors of total GCSE score, each contributing with an increase of approximately 3 points on the final score.
Prior attainment in English was also a strong and significant predictor of grades in GCSE English, with an estimate of 0.42. The large ES was similar to that previously found in earlier EPPSE analyses of Year 9 outcomes. The estimate for the prior attainment in maths when predicting the GCSE grade in the same subject was also a strong and significant predictor, with an estimate 0.55 and an ES of 2.54. This ES was smaller than the one found in Year 9.
Table 6.1: Effects of prior attainment on Year 11 academic outcomes
Fixed effect Total GCSE score
Coefficient SE ES Sig Year 6 English 3.06 0.24 0.78 *** Year 6 maths 3.18 0.24 0.81 ***
Number of students 2484 Number of schools 656
Intra-school correlation (ICC) 0.3776 % Reduction student variance 34.1 % Reduction school variance 22.0
% Reduction total variance 30.0 * p<0.05, ** p<0.01, *** p<0.001
Table 6.2: Effects of prior attainment on Year 11 academic outcomes
Fixed effect GCSE English
Coefficient SE ES Sig Year 6 English 0.42 0.01 2.0239 ***
Number of students 2431 Number of schools 632
Intra-school correlation (ICC) 0.1710 % Reduction student variance 45.3 % Reduction school variance 70.0
% Reduction total variance 52.1 * p<0.05, ** p<0.01, *** p<0.001
39 ES=2.09 for Year 9.
79
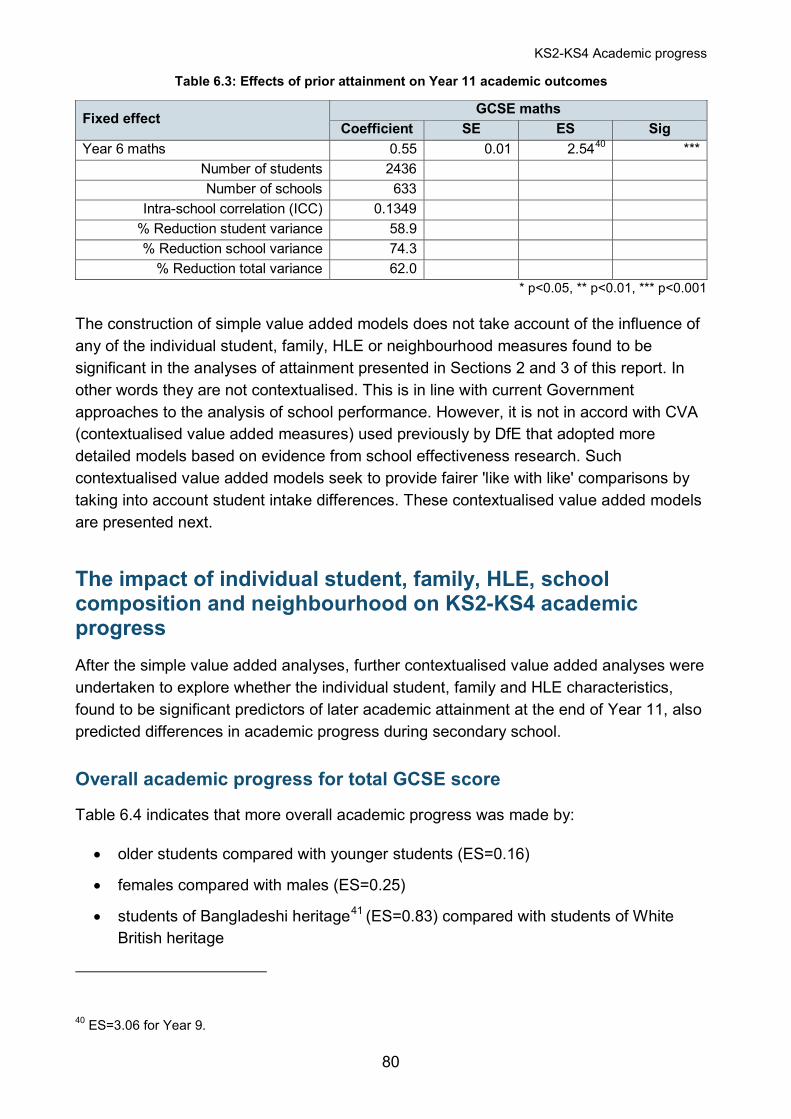
KS2-KS4 Academic progress
Table 6.3: Effects of prior attainment on Year 11 academic outcomes
Fixed effect GCSE maths
Coefficient SE ES Sig Year 6 maths 0.55 0.01 2.5440 ***
Number of students 2436 Number of schools 633
Intra-school correlation (ICC) 0.1349 % Reduction student variance 58.9 % Reduction school variance 74.3
% Reduction total variance 62.0 * p<0.05, ** p<0.01, *** p<0.001
The construction of simple value added models does not take account of the influence of any of the individual student, family, HLE or neighbourhood measures found to be significant in the analyses of attainment presented in Sections 2 and 3 of this report. In other words they are not contextualised. This is in line with current Government approaches to the analysis of school performance. However, it is not in accord with CVA (contextualised value added measures) used previously by DfE that adopted more detailed models based on evidence from school effectiveness research. Such contextualised value added models seek to provide fairer 'like with like' comparisons by taking into account student intake differences. These contextualised value added models are presented next.
The impact of individual student, family, HLE, school composition and neighbourhood on KS2-KS4 academic progress After the simple value added analyses, further contextualised value added analyses were undertaken to explore whether the individual student, family and HLE characteristics, found to be significant predictors of later academic attainment at the end of Year 11, also predicted differences in academic progress during secondary school.
Overall academic progress for total GCSE score
Table 6.4 indicates that more overall academic progress was made by:
• older students compared with younger students (ES=0.16)
• females compared with males (ES=0.25)
• students of Bangladeshi heritage41 (ES=0.83) compared with students of White British heritage
40 ES=3.06 for Year 9.
80
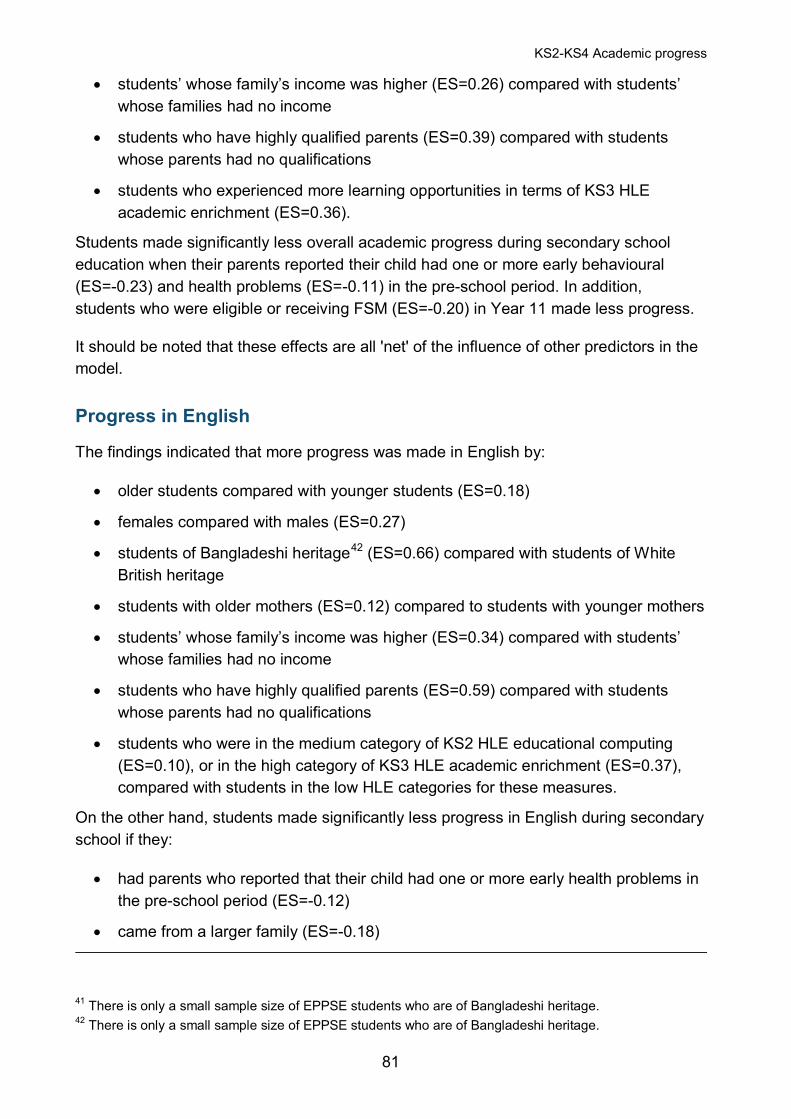
KS2-KS4 Academic progress
• students’ whose family’s income was higher (ES=0.26) compared with students’ whose families had no income
• students who have highly qualified parents (ES=0.39) compared with students whose parents had no qualifications
• students who experienced more learning opportunities in terms of KS3 HLE academic enrichment (ES=0.36).
Students made significantly less overall academic progress during secondary school education when their parents reported their child had one or more early behavioural (ES=-0.23) and health problems (ES=-0.11) in the pre-school period. In addition, students who were eligible or receiving FSM (ES=-0.20) in Year 11 made less progress.
It should be noted that these effects are all 'net' of the influence of other predictors in the model.
Progress in English
The findings indicated that more progress was made in English by:
• older students compared with younger students (ES=0.18)
• females compared with males (ES=0.27)
• students of Bangladeshi heritage42 (ES=0.66) compared with students of White British heritage
• students with older mothers (ES=0.12) compared to students with younger mothers
• students’ whose family’s income was higher (ES=0.34) compared with students’ whose families had no income
• students who have highly qualified parents (ES=0.59) compared with students whose parents had no qualifications
• students who were in the medium category of KS2 HLE educational computing (ES=0.10), or in the high category of KS3 HLE academic enrichment (ES=0.37), compared with students in the low HLE categories for these measures.
On the other hand, students made significantly less progress in English during secondary school if they:
• had parents who reported that their child had one or more early health problems in the pre-school period (ES=-0.12)
• came from a larger family (ES=-0.18)
41 There is only a small sample size of EPPSE students who are of Bangladeshi heritage. 42 There is only a small sample size of EPPSE students who are of Bangladeshi heritage.
81

KS2-KS4 Academic progress
• were eligible or receiving FSM in Year 11 (ES=-0.17)
• were from lower SES families (ES=-0.29)
• were from schools that had a higher proportion of FSM students (ES=-0.18).
Progress in maths
Similar results were found for progress in maths during secondary school. More progress was made in maths by:
• older students compared with younger students (ES=0.20)
• females compared with males (ES=0.13)
• Bangladeshi students (ES=0.88) compared with students of White British heritage
• students with older mothers (ES=0.14) compared to students with younger mothers
• students’ whose family’s income was higher (ES=0.21) compared with students’ whose families had no income
• students who have highly qualified parents (ES=0.42) compared with students whose parents had no qualifications
• students who were in the medium category of KS2 HLE educational computing (ES=0.13), or the high category of KS3 HLE academic enrichment (ES=0.45), compared with students in the low HLE categories for these measures.
Students made significantly less progress in maths during secondary school education if they:
• had parents who reported that their child had one or more early behavioural problems (ES=-0.18) or health problems (ES=-0.21) in pre-school
• were eligible or receiving FSM in Year 11 (ES=-0.28)
• were from lower SES families (ES=-0.42).
82

KS2-KS4 Academic progress
Table 6.4: Contextualised value added models for Year 11 academic outcomes
Background characteristics Total GCSE score
GCSE English
GCSE maths
Individual student measures ES ES ES Age 0.16 0.18 0.20 Gender 0.25 0.27 0.13 Ethnicity 0.83 (B)† 0.66 (B)† 0.88 (B)† Behavioural problems -0.23 -0.18 Health problems -0.11 -0.12 -0.21 Number of siblings -0.18 Family measures Mother’s age at age 3/5 0.12 0.14 Year 11 FSM -0.20 -0.17 -0.28 KS1 family salary 0.26 0.34 0.21 Parents' highest SES at age 3/5 -0.29 -0.42 Parents' highest qualifications level at age 3/5 0.39 0.59 0.42 HLE measures KS2 HLE educational computing (medium) 0.10 0.13 KS3 HLE academic enrichment (high) 0.36 0.37 0.45
†B=Bangladeshi heritage
The impact of neighbourhood on KS2-KS4 academic progress The neighbourhood measures43 described in Section 3 were also tested in the progress models for English and maths. Only the percentage of White British citizens in the neighbourhood was a significant predictor for progress in English (see Table 6.5). Progress in maths was significantly predicted by the IMD, the IDACI, as well as reported levels of crime, unemployment and neighbourhood safety (see Table 6.5 and Table 6.6).
Students from neighbourhoods characterised by higher levels of deprivation and/or crime made less progress in maths during secondary school taking into account prior attainment and other individual and family influences. These results differ from Year 9 and Year 6, when none of the neighbourhood measurements significantly predicted progress in maths between KS2 and KS3 or between KS1 and KS2. These measures however, are found to be important for the academic progress across the five years in secondary school. This may be due to the fact that adolescent students are probably more involved in activities outside the home and with their peer group, and this may be shaped by the neighbourhood they live in.
43 These measures reflect the neighbourhood environment in which the child lived while in pre-school and primary school and do not necessarily reflect the neighbourhood environment following later moves.
83

KS2-KS4 Academic progress
Table 6.5: Contextualised value added models for Year 11 academic outcomes –Neighbourhood measures
Fixed effects (continuous) GCSE
English GCSE maths
ES Sig ES Sig IMD ns -0.21 *** IDACI ns -0.16 ** % White British -0.20 ** ns Crime ns -0.16 ** Unemployment ns -0.17 **
* p<0.05, ** p<0.01, *** p<0.001 ns=not statistically significant
Table 6.6: Contextualised value added models for Year 11 academic outcomes –Neighbourhood safety
Fixed effects Total GCSE score
GCSE maths
Neighbourhood safety (compared with low safety)
ES Sig ES Sig
Medium low safety 0.04 0.03 Medium high safety 0.00 -0.03 High safety 0.16 * 0.15 *
Number of students 2367 2354 Number of schools 590 619
Intra-school correlation (ICC) 0.3731 0.0778 % Reduction student variance 37.9 63.3 % Reduction school variance 27.9 87.6
% Reduction total variance 34.5 68.1 * p<0.05, ** p<0.01, *** p<0.001
The impact of pre-school and primary school experiences on KS2-KS4 academic progress Similar to earlier EPPSE results found for academic progress between KS2 and KS3, pre-school and primary school measures did not predict the amount of academic progress students made in English and maths during their five years in secondary school. However, attending a pre-school significantly and positively predicted the overall academic progress between Year 6 and Year measured in terms of total GCSE score (see Table 6.7). Students who had attended a pre-school made more overall academic progress than students who had not attended any pre-school (ES=0.19). Additionally, students who had attended a high quality pre-school (measured by ECERS-R) also made more overall academic progress than the ‘home’ group (ES=0.25 - see Table 6.8)44.
44 The pre-school quality measure ECERS-E and the pre-school effectiveness measure (pre-reading) were also tested and found as statistically significant but no clear trend in results was found (see Table 6.9).
84

KS2-KS4 Academic progress
Students who attended a highly effective pre-school in terms of promoting early number concepts made more overall academic progress than the ‘home’ group (ES=0.27 - see Table 6.10). Although only weak, these effects are consistent and suggest some lasting benefits on both attainment and progress from pre-school experiences that remain evident up to age 16.
Although the academic effectiveness of the primary school attended has been shown to predict better GCSE attainment (see Section 5), it was not found to predict progress during secondary school. In other words, attending a more effective primary school conferred an attainment boost that continued to be evident in both Year 9 and Year 11 attainment, it did not shape progress (the change in attainment). By contrast, though effects are weak, there are suggestions that attending a pre-school predicts both attainment and progress in terms of total GCSE score.
Table 6.7: Contextualised value added models for Year 11 academic outcomes –Attendance
Fixed effects Total GCSE score
Pre-school attendance ES Sig Pre-school (compared with no pre-school) 0.19 *
Number of students 2367 Number of schools 590
Intra-school correlation (ICC) 0.3746 % Reduction student variance 37.9 % Reduction school variance 27.5
% Reduction total variance 34.4 * p<0.05, ** p<0.01, *** p<0.001
Table 6.8: Contextualised value added models for Year 11 academic outcomes –ECERS-R
Fixed effects Total GCSE score
Pre-school quality (compared with no pre-school) ES Sig Low quality 0.18 Medium quality 0.16 High quality 0.25 *
Number of students 2367 Number of schools 590
Intra-school correlation (ICC) 0.3723 % Reduction student variance 37.8 % Reduction school variance 28.1
% Reduction total variance 34.5 * p<0.05, ** p<0.01, *** p<0.001
85

KS2-KS4 Academic progress
Table 6.9: Contextualised value added models for Year 11 academic outcomes –ECERS-E
Fixed effects Total GCSE score
Pre-school quality (compared with no pre-school) ES Sig Low quality 0.23 * Medium quality 0.15 High quality 0.25 *
Number of students 2367 Number of schools 590
Intra-school correlation (ICC) 0.3747 % Reduction student variance 37.9 % Reduction school variance 27.5
% Reduction total variance 34.4 p<0.05, ** p<0.01, *** p<0.001
Table 6.10: Contextualised value added models for Year 11 academic outcomes: Pre-school effectiveness (Early number concepts)
Fixed effects Total GCSE score
Pre-school effectiveness -early number concepts (compared with no pre-school)
ES Sig
Low effectiveness 0.23 * Medium effectiveness 0.15 High effectiveness 0.27 *
Number of students 2367 Number of schools 590
Intra-school correlation (ICC) 0.3731 % Reduction student variance 37.9 % Reduction school variance 27.9
% Reduction total variance 34.5 p<0.05, ** p<0.01, *** p<0.001
The impact of secondary school on KS2-KS4 academic progress Secondary school type was a significant predictor or Year 11 academic attainment. The same measure was also tested in the contextualised value added models that predict the level of progress students made between KS2 and KS4. For total GCSE score, GCSE English and GCSE maths, students from the ‘other maintained’ schools category made less academic progress than the students from comprehensive schools (see Table 6.11). Those from ‘independent’ schools made significantly less progress in terms of total GCSE score, when account was taken of students' prior attainment in Year 6 and their background.
86

KS2-KS4 Academic progress
Table 6.11: Contextualised value added models for Year 11 academic outcomes –Secondary school type
Fixed effects Total GCSE score
GCSE English
GCSE maths
KS4 Secondary school type (compared with Comprehensive)
ES Sig ES Sig ES Sig
Selective -0.17 0.24 -0.08 Modern -0.41 0.00 -0.16 Other maintained -2.81 *** -1.45 *** -1.69 *** Independent -1.45 *** -0.04 0.10
Number of students 2367 2252 2354 Number of schools 590 561 619
Intra-school correlation (ICC) 0.2386 0.0572 0.0618 % Reduction student variance 39.3 50.4 63.9 % Reduction school variance 62.8 92.0 90.5
% Reduction total variance 47.3 61.7 69.2 * p<0.05, ** p<0.01, *** p<0.001
The impact of secondary school academic effectiveness on KS2-KS4 academic progress
EPPSE students who attended a highly academic effective secondary school in terms of the DfE CVA45 KS2-4 indicator made significantly more overall academic progress than those from less effective secondary schools (ES=0.53, see Table 6.12). Again this takes into account individual, family background and neighbourhood influences and prior attainment in Year 6. This points to the relative importance of school effects. The effect on progress of going to a more academically effective secondary school is approximately twice the size of the gender effect on progress, for example.
45 The EPPSE CVA indicator is based on DfE CVA results for 4 successive years, covering the 4 EPPSE cohorts, 2006-2009 for all secondary schools attended by EPPSE students. The EPPSE results have an overall CVA averaged mean of 1004, which is close to the national CVA mean of 1000. The students in the sample (based on their secondary school's average CVA score) were divided into high, medium and low CVA effectiveness groups based on the average CVA score to 1 SD above or below the mean; nationally, approximately 10% of secondary schools are 1 SD above the mean and approximately 10% of secondary schools are 1 SD below the mean.
87

KS2-KS4 Academic progress
Table 6.12: Contextualised value added models for Year 11 academic outcomes –Secondary school academic effectiveness
Fixed effects Total GCSE score
Secondary school academic effectiveness (compared with low)
ES Sig
Medium effectiveness 0.08 High effectiveness 0.53 ***
Number of students 2367 Number of schools 590
Intra-school correlation (ICC) 0.3648 % Reduction student variance 37.8 % Reduction school variance 30.4
% Reduction total variance 35.3 * p<0.05, ** p<0.01, *** p<0.001
88
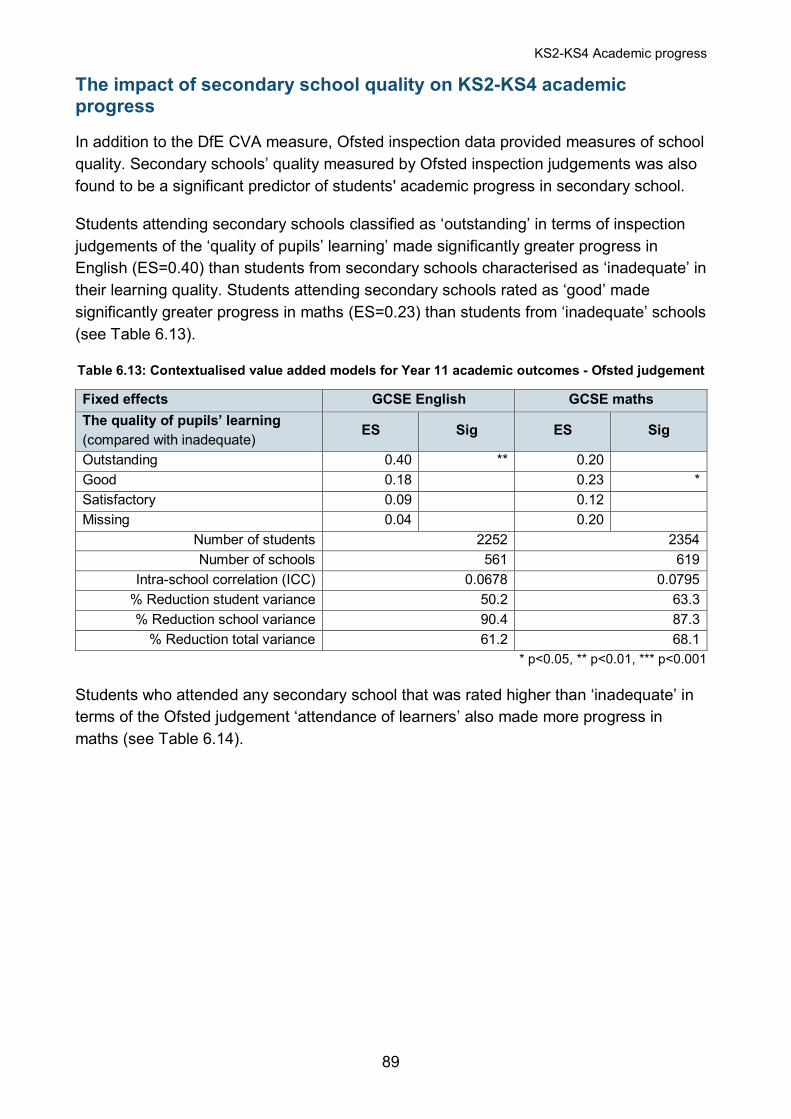
KS2-KS4 Academic progress
The impact of secondary school quality on KS2-KS4 academic progress
In addition to the DfE CVA measure, Ofsted inspection data provided measures of school quality. Secondary schools’ quality measured by Ofsted inspection judgements was also found to be a significant predictor of students' academic progress in secondary school.
Students attending secondary schools classified as ‘outstanding’ in terms of inspection judgements of the ‘quality of pupils’ learning’ made significantly greater progress in English (ES=0.40) than students from secondary schools characterised as ‘inadequate’ in their learning quality. Students attending secondary schools rated as ‘good’ made significantly greater progress in maths (ES=0.23) than students from ‘inadequate’ schools (see Table 6.13).
Table 6.13: Contextualised value added models for Year 11 academic outcomes - Ofsted judgement
Fixed effects GCSE English GCSE maths The quality of pupils’ learning (compared with inadequate)
ES Sig ES Sig
Outstanding 0.40 ** 0.20 Good 0.18 0.23 * Satisfactory 0.09 0.12 Missing 0.04 0.20
Number of students 2252 2354 Number of schools 561 619
Intra-school correlation (ICC) 0.0678 0.0795 % Reduction student variance 50.2 63.3 % Reduction school variance 90.4 87.3
% Reduction total variance 61.2 68.1 * p<0.05, ** p<0.01, *** p<0.001
Students who attended any secondary school that was rated higher than ‘inadequate’ in terms of the Ofsted judgement ‘attendance of learners’ also made more progress in maths (see Table 6.14).
89

KS2-KS4 Academic progress
Table 6.14: Contextualised value added models for Year 11 academic outcomes - Ofsted judgement
Fixed effects GCSE maths Attendance of learners (compared with inadequate) ES Sig Outstanding 0.28 * Good 0.42 *** Satisfactory 0.34 ** Missing 0.36 **
Number of students 2354 Number of schools 619
Intra-school correlation (ICC) 0.0775 % Reduction student variance 63.3 % Reduction school variance 87.6
% Reduction total variance 68.2 * p<0.05, ** p<0.01, *** p<0.001
The impact of students’ views of school on KS2-KS4 academic progress The Year 9 views of school factors that were tested as separate predictors of Year 11 GCSE attainment (see Section 5) were also tested to establish their significance in predicting students’ academic progress between KS2 and KS4. All measures of students’ Year 9 views of school were found to be significant predictors of students' academic progress between KS2 and KS4. Thus, a stronger ‘emphasis on learning’, a positive ‘behaviour climate’, teachers ‘valuing pupils’, a better ‘school environment’ and ‘school/learning resources’, more interested ‘headteachers’ and better ‘teacher behavioural management’ and ‘teacher support’ were significant predictors of greater overall academic progress and subject specific progress in English and maths (see Table 6.15).
Additionally, even when tested together a stronger ‘emphasis on learning’ and a positive ‘behaviour climate’ significantly predicted the overall academic progress in total GCSE score and progress in English and maths between KS2 and KS4 (see Table 6.16). Similarly, all the Year 11 views of school measures, except for ‘academic ethos’, predicted overall academic and subject specific progress between KS2 and KS4 (see Table 6.17).
90

KS2-KS4 Academic progress
Table 6.15: Contextualised value added models for Year 11 academic outcomes –Year 9 views of school
Fixed effects Total
GCSE score GCSE
English GCSE maths
Year 9 views of school ES Sig ES Sig ES Sig Emphasis on learning 0.33 *** 0.27 *** 0.24 *** Behaviour climate 0.22 ** 0.25 *** 0.23 *** Headteacher 0.15 * 0.14 * 0.12 * School environment 0.17 ** 0.17 ** 0.15 * Valuing pupils 0.31 *** 0.19 *** 0.23 *** School/Learning resources 0.24 *** 0.16 ** 0.18 ** Teacher behavioural management 0.26 *** 0.17 ** 0.21 *** Teacher support 0.23 *** 0.21 *** 0.13 *
* p<0.05, ** p<0.01, *** p<0.001
Table 6.16: Contextualised value added models for Year 11 academic outcomes –Year 9 views of school (tested in the same model)
Fixed effects Total GCSE score GCSE English GCSE maths Year 9 views of school ES Sig ES Sig ES Sig Behaviour climate 0.15 * 0.19 ** 0.17 ** Emphasis on learning 0.30 *** 0.23 *** 0.19 **
Number of students 1405 1371 1422 Number of schools 403 393 425
Intra-school correlation (ICC) 0.3526 0.0555 0.0447 % Reduction student variance 52.2 57.7 68.1 % Reduction school variance 49.2 93.4 94.0
% Reduction total variance 51.2 67.5 73.3 * p<0.05, ** p<0.01, *** p<0.001
Table 6.17: Contextualised value added models for Year 11 academic outcomes –Year 11 views of school
Fixed effects Total GCSE score GCSE English GCSE maths Year 11 views of school ES Sig ES Sig ES Sig Teacher professional focus 0.28 *** 0.27 *** 0.22 *** Positive relationships 0.39 *** 0.33 *** 0.34 *** Monitoring students 0.21 *** 0.19 ** ns Formative feedback 0.23 *** 0.22 *** 0.20 *** Academic ethos ns ns ns
* p<0.05, ** p<0.01, *** p<0.001 ns=not statistically significant
91

KS2-KS4 Academic progress
The impact of homework on KS2-KS4 academic progress It has been already demonstrated that students’ self-reports of time spent on homework positively and strongly predicted higher attainment in KS3 and better GCSE results in KS4. Therefore, it was important to test whether the Year 9 and Year 11 measures of the time students say they spent on homework significantly predict academic progress during secondary school, controlling for prior attainment and background and neighbourhood influences.
Results show that for the overall academic progress and progress in English, any time spent on homework reported in Year 9 was beneficial (see Table 6.18). This was also the case for the reported time spent on homework in Year 11 (see Table 6.19). Effects are strongest on total GCSE score and GCSE English for students who spent 2-3 or over 3 hours on homework a night.
For progress in maths from KS2 to KS4, there was a slight decrement in ES for spending more than 3 hours on homework in Year 9. This result was not found for progress in maths between KS2 and KS3. In Year 11, those spending more than 3 hours a night on homework showed no better outcomes than those spending 2-3 hours.
Table 6.18: Contextualised value models for Year 11 academic outcomes –Year 9 Time spent on homework
Fixed effects Total GCSE score GCSE English GCSE maths Year 9 Homework (compared with none)
ES Sig ES Sig ES Sig
Less than ½ hour 0.60 *** 0.50 *** 0.49 *** ½ -1 hour 0.69 *** 0.60 *** 0.60 *** 1-2 hours 0.73 *** 0.62 *** 0.63 *** 2-3 hours 0.94 *** 0.87 *** 0.79 *** Over 3 hours 1.26 *** 1.31 *** 0.55
Number of students 1403 1371 1423 Number of schools 407 397 430
Intra-school correlation (ICC) 0.3436 0.0570 0.0436 % Reduction student variance 51.9 58.0 67.8 % Reduction school variance 50.9 93.3 94.1
% Reduction total variance 51.6 67.6 73.0 * p<0.05, ** p<0.01, *** p<0.001
92
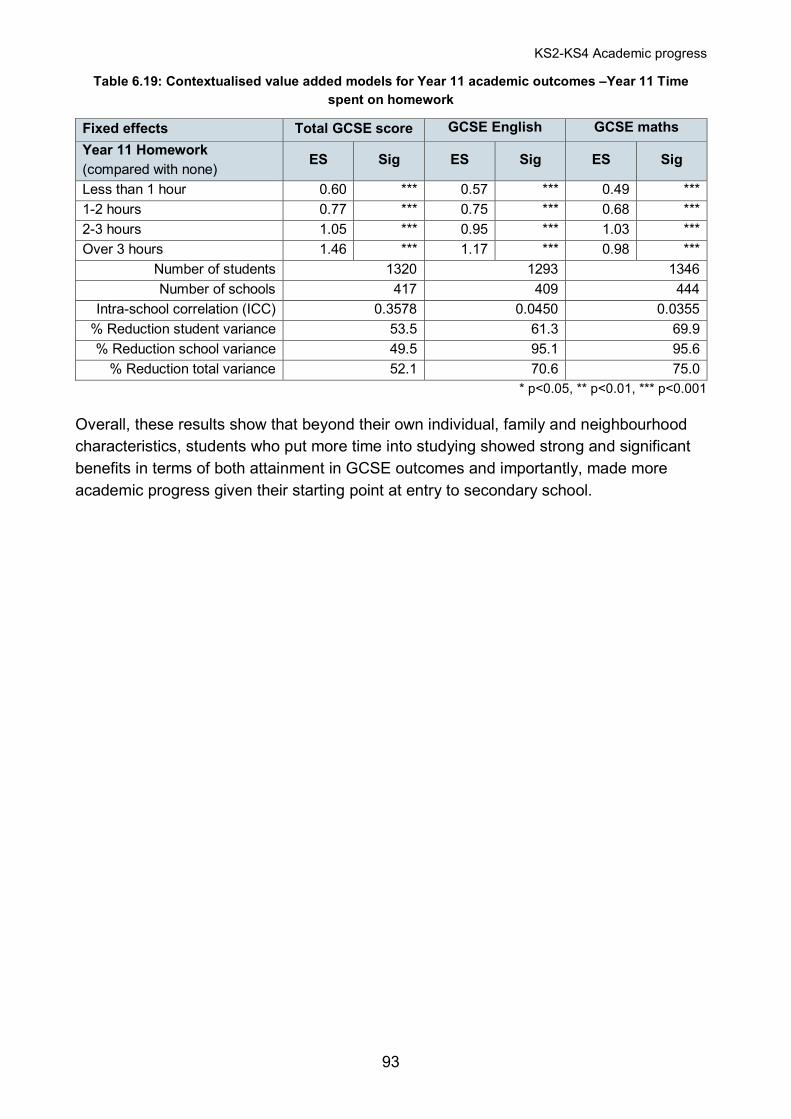
KS2-KS4 Academic progress
Table 6.19: Contextualised value added models for Year 11 academic outcomes –Year 11 Time spent on homework
Fixed effects Total GCSE score GCSE English GCSE maths Year 11 Homework (compared with none)
ES Sig ES Sig ES Sig
Less than 1 hour 0.60 *** 0.57 *** 0.49 *** 1-2 hours 0.77 *** 0.75 *** 0.68 *** 2-3 hours 1.05 *** 0.95 *** 1.03 *** Over 3 hours 1.46 *** 1.17 *** 0.98 ***
Number of students 1320 1293 1346 Number of schools 417 409 444
Intra-school correlation (ICC) 0.3578 0.0450 0.0355 % Reduction student variance 53.5 61.3 69.9 % Reduction school variance 49.5 95.1 95.6
% Reduction total variance 52.1 70.6 75.0 * p<0.05, ** p<0.01, *** p<0.001
Overall, these results show that beyond their own individual, family and neighbourhood characteristics, students who put more time into studying showed strong and significant benefits in terms of both attainment in GCSE outcomes and importantly, made more academic progress given their starting point at entry to secondary school.
93

7 Discussion and conclusions The findings within this report are based on studying the variation in students’ academic attainment measured by GCSE results in Year 11. Findings can be compared with those from earlier points in time when equivalent analyses were conducted for the EPPSE sample using outcomes from when they were in pre-school, primary school (KS1 and KS2) and earlier in secondary school (KS3). The present analyses reveal marked differences between individual students in their overall attainment. In addition, there are significant differences in the attainment levels of different groups of students. While gender differences are fairly modest, they remain significant for most of the outcomes studied. There are much larger equity gaps evident in comparisons of the GCSE results achieved by different groups of students in terms of parents’ qualification levels, family socio-economic status, family income and ethnic heritage. Such differences had previously been found earlier in the study, when the sample was aged 3+ and these differences continue to shape patterns of achievement that reflect wider social inequities across phases of education.
In order to increase our understanding of these group differences more detailed statistical analyses were conducted to tease out the net contributions of different individual student, family, HLE and neighbourhood characteristics. We have shown the strength of these in terms of net effect sizes. These help to reveal the more important predictors that shape academic attainment at age 16, and the progress students make over five years in secondary school.
The continued analysis of the EPPSE sample up to age 16 provides new evidence (as well as extending previous findings) about the continuing influence of individual, family and HLE influences. The analyses identify which background characteristics continue to predict students’ attainment. The pattern of results is broadly in line with that found at younger ages. In addition, many of the drivers of variation in GCSE outcomes show similar influences on social-behavioural outcomes at this age (see the companion report Sammons et al., 2014a).
The latest findings point to the influence of a range of background characteristics such as gender, family SES, Free School Meal status or family income on GCSE outcomes. In addition, EPPSE has data on the HLE students experienced in their early years, and at older ages (KS1, KS2 and KS3), as well as parental qualifications. This enables a more detailed approach to exploring the influence of background characteristics, including the home, on students’ attainment and progress. Our findings note that various influences from parents and parental support for learning in the home remain important in shaping students’ academic achievement up to the end of KS4.
94

The key findings within this report are based on the quantitative analyses that test a range of measures to predict various key GCSE indicators of attainment. As with the analyses strategy adopted previously at earlier time points in this longitudinal study, we used multilevel statistical models to ascertain which characteristics were the best predictors of various key attainment outcomes at age 16. The EPPSE study uses a mixed method design. Therefore, although this report is based on quantitative analysis of large data-sets, elsewhere we have reported findings from qualitative case studies of individual children and families that are more educationally successful in overcoming disadvantage (see Siraj-Blatchford et al., 2011). These qualitative findings enabled us to develop a broader understanding of the way disadvantage and other experiences shape children’s educational outcomes and experiences as they move through different phases of education and into adolescence.
This report has explored the role of pre-schools, primary schools, secondary schools in predicting Year 11 students’ academic attainment and progress after controlling for individual student, family, HLE and neighbourhood background characteristics. In addition it reports on students’ views and how these influence Year 11 outcomes.
The main findings are summarised below.
Raw differences in attainment for different student groups
Gender In Year 11, on average females continue to obtain better results in GCSE English than males (with a difference of about half a grade). However, there were no significant gender differences in GCSE maths. Females also obtained higher total GCSE scores (Mean=472.3; Std. Deviation=165), were entered for more full GCSEs (Mean=7.6; Std. Deviation=2.7) than males and were more likely to achieve the various DfE benchmark indicators of performance like 5 A*-C, 5 A*-C including English and maths and the EBacc. At younger ages, girls had been found to have higher attainment in reading and English. They also had higher maths and science outcomes in primary school, but by age 14 and later at 16, these differences are no longer statistically significant.
Ethnicity There was some evidence of ethnic differences in attainment, but due to low numbers for most ethnic origin subgroups in the EPPSE sample the results should be interpreted with caution. The differences found in average results by ethnic group are in line with those evident in other studies indicating higher attainment for some groups (e.g., those students of Indian or Bangladeshi heritage) and lower attainment for others (e.g., those students of Pakistani heritage) when compared with students of White UK heritage.
Family characteristics There were marked differences in GCSE attainment related to parents’ qualification levels when children were age 3/5. As might be anticipated, students with highly qualified
95

parents (degree level) had much higher attainment on average than those students whose parents had no qualifications. The differences were equivalent to 141 points for total GCSE score, 10 points in GCSE English, 13 points in GCSE maths (equal to two grades higher e.g., the difference between achieving a grade B instead of a grade D), and 4 extra full GCSE exam entries.
There were also large differences related to family socio-economic status (SES) between those students whose parents were from the professional non-manual category and those from lower SES categories. Moreover, students eligible for Free School Meals (FSM) had lower average attainment than students who were not eligible for FSM. The differences for FSM versus no FSM were around a full GCSE grade in size in GCSE English and GCSE maths.
The quality of the early years HLE showed a clear association with later differences in average GCSE results. The differences for GCSE English and GCSE maths were approximately 10 grade points, and for total GCSE score the difference was 125 points for those who had experienced a high versus low quality early years HLE. This again confirms earlier findings about the likely importance of parents providing a stimulating HLE in the early years.
The net impact of child, family and HLE characteristics on GCSE attainment in Year 11
The average group differences described above do not take into account the relative influence of other characteristics. Multilevel modelling provides more detailed results of the ‘net’ contribution of individual characteristics, whilst controlling for other predictors and so enables the identification of the ‘strongest’ net predictors. For instance, effects can distinguish differences in attainment for students with mothers who have degrees compared with those with no qualifications, net of the influence of other associated family and individual student level characteristics (e.g., family SES, income, HLE, age or gender). Results are reported in effect sizes (ES), a statistical measure of the relative strength of different predictors or in odds ratios (OR) representing the odds of achieving certain benchmark performance indicators given certain characteristics relative to the odds of the reference group (see Summary Tables).
Parents’ highest qualification level, when children were age 3/5, was the strongest net predictor of better attainment in terms of grades in GCSE English (ES=0.69 - for degree versus no qualification; ES=0.80 - for higher degree versus no qualification) and GCSE maths (ES=0.65 - for degree versus no qualification; ES=0.74 - for higher degree versus no qualification) and achieving 5 A*-C including English and maths (OR=2.86 - for higher degree, OR=3.92 - for degree). All these comparisons are to parents with no qualifications (see Summary Tables).
Differences related to ethnicity were strong predictors of total GCSE score (ES=0.76 for students of Bangladeshi heritage). Family income, measured in KS1, showed larger
96

effects in terms of the likelihood of achieving 5 A*-C (OR=3.94 - for an income larger than £67000 when compared to no earned salary) and the EBacc (OR=4.04 - for an income larger than £67000 when compared to no earned salary).
There were also a number of additional strong/moderately strong effects for various family influences that are noted below:
• Total GCSE score: parents’ highest qualification level, KS3 HLE academic enrichment and the early years HLE.
• GCSE grade in English: ethnicity, family SES, early years HLE, KS3 HLE academic enrichment and family income.
• GCSE grade in maths: family SES, ethnicity, KS3 HLE academic enrichment, early years HLE and Year 11 FSM.
• Total number of full GCSE entries: family SES, ethnicity, family salary, early years HLE and KS3 HLE academic enrichment.
• Achieving 5 A*-C: early years HLE, parents’ highest qualification level, KS3 HLE academic enrichment and gender.
• Achieving 5 A*-C including English and maths: the early years HLE, KS3 HLE academic enrichment, ethnicity and family income.
• English Baccalaureate (EBacc): KS3 HLE academic enrichment, parents’ highest qualification level and gender.
It should be noted that ethnicity was not a significant predictor of the overall benchmark indicators (i.e., achieving 5 A*-C or the EBacc), but it was for the other GCSE outcomes like the total GCSE score and subject grades. Students of Pakistani46 and Bangladeshi47 heritage obtained statistically significant and higher total GCSE scores, better grades in GCSE maths and were entered for more full GCSEs than students of White UK heritage when account was taken of the effects of all other significant predictors like SES, income etc.
Both FSM (a low income indicator; ES=-0.31) and family SES (ES=-0.49 – for unskilled versus professional non-manual) have moderate effects on grades in GCSE English, but the family SES effect was stronger for grades in GCSE maths (ES=-0.66 - for unskilled versus professional). The SES effects for grades in GCSE English were similar in size to the effects of the early years HLE (ES=0.51 - for high versus low) and KS3 enrichment HLE measure for English (ES=0.48 - for high versus low). Interestingly, the early years HLE had a stronger impact on all measures of students’ GCSE results than the low income indicator, FSM.
46 This shows that for Pakistani students, their low raw scores are accounted for by background influences. 47 There is only a small sample size of EPPSE students who are of Bangladeshi heritage.
97

Older students (for their age group e.g., Autumn born) showed better results although the effect was not strong. There were also small positive effects related to the age of the child’s mother (at age 3/5); the older the mother the better the academic outcomes (grades in GCSE English and GCSE maths), but also the higher the likelihood of achieving overall benchmark indicators (5 A*-C and the EBacc) when compared with students whose mothers were younger.
These results broadly confirm patterns identified at younger ages indicating that differences in attainment related to individual student and family background influences emerge early (measured when children were recruited to the study) and remain fairly stable as students progress through primary and secondary school. Evidence for this conclusion was well established in previous research (Mortimore et al., 1988; Nuttall, 1990; Rutter & Madge, 1976; Tizard et al., 1988; Sammons, 1995), but EPPSE shows the important effects of the HLE that have been little studied elsewhere.
Neighbourhood Influences A number of neighbourhood measures were tested as potential predictors of GCSE results from Year 11. These measures reflect the neighbourhood environment in which the child lived while in pre-school and primary school and do not necessarily reflect later neighbourhood environments resulting from moving house.
Previous research has suggested that contextual influences outside the family (such as ‘place poverty’ linked to living in a disadvantaged neighbourhood and school composition) can influence student attainment. Living in a disadvantaged area while in pre-school or primary school and attending a school with a higher representation of disadvantaged students may affect individual student and family aspirations and attitudes towards education, but also teacher expectations, classroom processes and school climate (Leckie, 2009; 2012; Sammons et al., 1997; Sampson, 2012).
Levels of neighbourhood disadvantage measured by the national indicators the Index of Multiple Deprivation (IMD - see Noble et al., 2004), and the Income Deprivation Affecting Children Index (IDACI – see Noble et al., 2008) were used as predictors of GCSE results from Year 11.
The IDACI was a significant and negative predictor of lower grades in GCSE English (ES=-0.15) and in GCSE maths (ES=-0.16), and also of lower likelihood of attaining the benchmark performance indicators (OR ranges between 0.32-0.39). This was not the case during the primary school years, possibly because neighbourhood influences increase as adolescents interact more with their peer group outside the home. Students who lived in more disadvantaged neighbourhoods in the early years had poorer attainment in GCSE outcomes, over and above their own and their family characteristics, although these neighbourhood effects are relatively small compared with those of the family.
98

Other neighbourhood measures were also studied. These included the level of unemployment, level of crime, percentage of White British residents and the percentage of residents with limiting long term illnesses. Except for the last measure, all these other indicators were significant negative predictors of different GCSE outcomes in Year 11, although the effects were fairly weak. Thus, for example the percentage of the population who were classed as White British was statistically significant with small negative effects for grades in GCSE English (ES=-0.20) and in GCSE maths (ES=-0.15) and the three benchmark indicators. The level of crime and unemployment recorded in a neighbourhood were both found to have small negative effects on attainment in maths and slightly stronger negative effects on the number of full GCSE entries. Similarly, parents’ perceptions of higher levels of safety in their neighbourhood (measured by parental questionnaire during KS1) also showed small but positive effects on grades in GCSE maths, total GCSE score and achieving 5 A*-C (see Summary Tables).
School composition There is some evidence that the ‘social composition’ of the school intake (as measured by the percentage of students entitled to free school meals, an indicator of poverty) predicts individual students’ outcomes over and above their own FSM status. A higher percentage of students eligible for or receiving FSM measured at school level predicted significantly lower grades in GCSE English (ES=-0.18), fewer full GCSE entries (ES=-0.55) and a lower probability of achieving 5 A*-C (OR=0.98).
These findings are in line with research conducted by the DfE that has examined broader contextual influences when calculating the national Contextual Value Added (CVA) measure. The DfE’s national CVA analyses of school performance have demonstrated that the school intake measure (% of FSM students) and neighbourhood measures such as the IMD and IDACI score predict poorer progress for students, even when individual student background measures are controlled.
Taken together the results indicate that attainment was lower for students who lived in more disadvantaged neighbourhoods compared with those living in more advantaged neighbourhoods, over and above their own and their family characteristics. The neighbourhood and school composition influences though relatively small become stronger as the EPPSE sample go through adolescence. The findings show the challenges faced in raising attainment in certain social contexts as recognised by research on schools in challenging circumstances (Muijs et al., 2004).
99

Pre-school The EPPSE research was designed to follow up children recruited at pre-school into primary and later secondary school in order to identify the contribution of different educational influences on their later progress and development during various phases of education. In addition to investigating the effects of individual student, family, HLE and neighbourhood characteristics, further analyses sought to establish whether pre-school influences identified as significant predictors of attainment and progress in both cognitive/academic and social-behavioural outcomes at younger ages continued to show effects thirteen years later.
Four measures were tested: pre-school attendance (in comparison with the ‘home’ group); the duration (in months), the quality of the pre-school attended (as measured by the ECERS-R and ECERS-E rating scales – see Glossary) and the effectiveness of the pre-school attended in promoting better child outcomes at entry to primary school.
Attendance Attending a pre-school was found to be a statistically significant predictor of higher total GCSE score (ES=0.31), more full GCSE entries (ES=0.21), better grades in GCSE English (ES=0.23) and GCSE maths (ES=0.21) and of a higher probability of achieving 5 A*-C including English and maths (OR=1.48) when compared with students from the ‘home’ (or no pre-school) group. Although relatively modest, these effects are still stronger than those found for ‘age’ (i.e. being Autumn rather than Summer born) or the effects of some home learning measures (i.e. KS1 and KS2 HLE or family composition). They indicate that attending a pre-school (versus not) still shapes academic outcomes in the longer term (see Summary Tables).
Duration The amount of time in months (duration of attendance) that a student had spent in pre-school also showed continued effects on Year 11 academic outcomes. Students who had attended between 2 and 3 years (whether part-time or full-time) in pre-school obtained higher total GCSE scores (ES=0.38), better grades in GCSE English (ES=0.28) and in GCSE maths (ES=0.30), and were entered for more GCSE exams (ES=0.24) than those who had not attended any pre-school.
Quality There was some evidence that the quality of pre-school also continued to predict better GCSE results (total GCSE score – ES=0.37; GCSE English – ES=0.31; GCSE maths – ES=0.36). Those who had attended a high quality setting were more likely to achieve 5 A*-C including English and maths (OR=1.69) than students who had not attended pre-school. Students who had attended high quality pre-schools showed the most consistent pattern. These quality effects were mostly fairly small although still statistically significant. This pattern shows broadly similar effects, but they are weaker than those found when students were in KS2 in primary school.
100
Effectiveness The indicator of pre-school effectiveness in promoting pre-reading skills continued to predict academic attainment at the end of Year 11. Higher levels of pre-school effectiveness predicted more GCSE entries (ES=0.25), better grades in GCSE English (ES=0.31), and having a higher probability of achieving 5 A*-C including English and maths (OR=1.73).
The patterns of relationships between pre-school effectiveness (in terms of early number concepts) and students' later Year 11 academic outcomes also indicate positive and significant effects for grades in GCSE maths (ES=0.35) and total GCSE score (ES=0.48). However, no clear patterns for these predictors emerged for the various GCSE benchmark indicators.
Combined effects Further analyses explored the joint effects of pre-school quality and gender. The results showed that males who had attended a medium (ES= 0.33) or a high quality (ES= 0.41) pre-school obtained significantly higher grades in GCSE maths than males who had not attended any pre-school at all. Similarly, we investigated the joint effects of pre-school quality and parental qualification levels. Results showed that students of low qualified parents who had attended a high quality pre-school obtained significantly better grades in GCSE English (ES= 0.35) and in GCSE maths (ES= 0.25) than students of low qualified parents who had not attended any pre-school. Additionally, a pre-school quality gradient was evident for grades in GCSE English for those students whose parents had moderate to high qualification levels when compared to students who had not attended a pre-school and whose parents had low qualification levels.
101

Summary table for Year 11 academic outcomes48
Total GCSE score
Total GCSE entries
GCSE English
GCSE maths
Individual student measures ES ES ES ES Age 0.14 0.13 0.14 Gender 0.19 0.11 0.38 Ethnicity 0.76 (B)† 0.58 (B) 0.55 (B) 0.53 (I)҂ Birth weight -0.39 Early behavioural problems -0.29 -0.30 -0.17 -0.27 Early health problems -0.12 -0.12 -0.14 -0.16 Number of siblings -0.17 -0.33 -0.28 -0.17 Family measures Mother’s age at age 3/5 0.15 0.10 Year 11 FSM -0.32 -0.23 -0.31 -0.37 KS1 family salary 0.29 0.52 0.41 0.28 Parents' highest SES at age 3/5 -0.31 -0.58 -0.53 -0.66 Mothers' highest qualifications level at age 3/5 0.47 0.31 0.70 0.57 Fathers' highest qualifications level at age 3/5 0.25 0.33 0.40 Parents' highest qualifications level at age 3/5 0.59 0.36 0.80 0.74 HLE measures Early years HLE 0.36 0.51 0.51 0.45 KS1 HLE outing (medium) 0.11 KS1 HLE educational computing (medium) 0.11 0.13 KS2 HLE educational computing (medium) 0.13 0.10 0.15 KS3 HLE computer (high) 0.15 KS3 HLE academic enrichment (high) 0.47 0.43 0.48 0.47 Pre-school measures Pre-school attendance 0.31 0.21 0.23 0.21 Pre-school duration 0.38 0.24 0.28 0.30 Pre-school quality 0.37 0.20 0.31 0.26 Pre-school effectiveness pre-reading 0.27 0.25 0.31 Pre-school effectiveness early number concepts 0.48 0.23 0.35 Primary school measures Primary school academic effectiveness - maths 0.25 Secondary school measures Secondary school academic effectiveness 0.42 Secondary school quality – the quality of pupils’ learning 0.93 0.47 0.47 Secondary school quality – attendance of learners 0.78 0.50 0.62
B†=Bangladeshi heritage; I҂=Indian heritage
48 ES are based on the models that included the combined measure of parental qualification levels. When multiple categories are significant, the highest ES is presented.
102

Primary school influence Previous EPPSE research has shown that the academic effectiveness of a child’s primary school was a statistically significant predictor of better attainment and progress across KS2 for English and more strongly for maths. Other educational effectiveness research has shown that primary schools can continue to influence students’ longer term academic outcomes at secondary school (Goldstein & Sammons, 1997; Leckie, 2009). Indeed, earlier EPPSE results from KS3 (in Year 9) show that measures of the primary school academic effectiveness significantly predicted their later academic attainment in maths and science three years after transferring to secondary school. The latest GCSE analyses show that primary school academic effectiveness continues to influence EPPSE students’ later academic attainment up to the end of Year 11. Thus, students who had attended a primary school that was more academically effective for maths had significantly better grades in GCSE maths (ES=0.25) than students who had attended a low academically effective primary school. Similarly, students who had previously attended a medium or highly academically effective primary school were almost twice as likely to achieve the EBacc as students who had attended a low academically effective primary school (OR=1.94), after controlling for student, family HLE and neighbourhood influences (see Summary Tables).
Secondary school influences Contextual Value Added (CVA) measures of the academic effectiveness of secondary schools attended by EPPSE students were obtained from the DfE. These were derived from the DfE’s National Pupil Database (NPD). These CVA measures show the relative progress made by student intakes measured from KS2 to KS4 (across 5 years). In contrast to our primary school academic effectiveness measure that examined results in English, maths and science separately (Melhuish et al., 2006a; 2006b), we did not have subject specific results for these secondary school CVA indicators. The secondary school DfE based CVA combined measure of overall academic effectiveness significantly predicted students’ academic attainment in terms of total GCSE score (ES=0.42), but not the specific subject grades or the benchmark indicators. It is likely that the total GCSE score is more susceptible to overall school level influences as also shown by the larger intra-school correlation. Subject grades are likely to be more shaped by departmental effectiveness (Sammons, Thomas & Mortimore, 1997).
103

Summary table for Year 11 benchmark indicators
Achieved
5 A*-C
Achieved 5 A*-C
English & maths
EBacc
Individual student measures OR49 OR OR Age 1.04 Gender 1.45 1.24 1.74 Ethnicity 2.28(I) ҂ Developmental problems 0.68 0.67 Behavioural problems 0.65 0.63 Health problems 0.63 Number of siblings 0.62 0.69 Family measures Mother’s age at age 3/5 1.33 1.39 Year 11 FSM 0.61 0.51 KS1 family salary 3.94 1.95 4.04 Parents' highest SES at age 3/5 0.50 0.59 0.41 Mothers' highest qualifications level at age 3/5 3.14 4.11 Fathers' highest qualifications level at age 3/5 2.48 2.07 3.16 Parents' highest qualifications level at age 3/5 3.58 3.92 2.83 School level FSM 0.98 0.96 HLE measures Early years HLE 3.61 2.90 KS1 HLE outing (medium) 1.39 KS1 HLE educational computing (medium) 1.36 0.51
(high) KS3 HLE academic enrichment (high) 2.80 2.60 3.89 KS3 HLE parental interest (high) 1.34 Pre-school measures Pre-school attendance 1.48 Pre-school quality 1.69 Pre-school effectiveness pre-reading 1.73 Primary school measures Primary school academic effectiveness - maths 1.94 Secondary school measures Secondary school quality – the quality of pupils’ learning 3.04 2.74 5.44 Secondary school quality – attendance of learners 2.89 2.74
I҂=Indian heritage
49 Odds Ratios represent the odds of achieving certain benchmark performance indicators given certain characteristics relative to the odds of the reference group.
104

Ofsted50 inspection ratings were used to provide additional measures of secondary school quality. EPPSE students who attended secondary schools classified as ‘outstanding’ based on the ‘quality of pupils’ learning and their progress’ had significantly better results in GCSE English (ES=0.47) and GCSE maths (ES=0.47), were more likely to achieve 5 A*-C, 5 A*-C including English and maths, as well as the EBacc than students from secondary schools characterised as ‘inadequate’ in their learning quality. Again, these analyses controlled for students’ individual, family and HLE and neighbourhood characteristics (see Summary Tables).
Ofsted inspectors also rated secondary schools based on the level of attendance of their students. ‘Learners’ attendance’ as rated by Ofsted inspectors was a statistically significant predictor of academic attainment in Year 11. Students from secondary schools rated as ‘outstanding’ on the ‘learners’ attendance’ got higher grades in GCSE English (ES=0.50) and GCSE maths (ES=0.62) than students from secondary schools characterised as ‘inadequate’ while controlling for other influences. Students from ‘outstanding’ schools (in terms of ‘learners’ attendance’) were entered significantly for more full GCSEs than students from schools where attendance was assessed as ‘inadequate’ (ES=0.78). The probability of achieving 5 A*-C and 5 A*-C including English and maths was significantly higher for students from schools with ‘outstanding’ attendance. There was less evidence of differences for schools rated as ‘good’ on Ofsted’s ‘learners’ attendance’ measure.
These results indicate that secondary school quality was important in shaping students’ academic attainment over and above the impact of background characteristics.
Students’ academic progress between KS2 and KS4 Students’ academic progress across five years in secondary school (Year 7-Year 11) was studied by controlling for their prior attainment at the end of primary school and taking account of the significant individual student, family, HLE, neighbourhood and school characteristics discussed previously. Fewer background characteristics predicted progress between KS2 and KS4 than were found to predict attainment. The patterns were similar to those found at younger ages when we studied students’ progress between KS2 and KS3 (Year 7- Year 9) for this sample.
Overall, there was evidence that students with the following characteristics made greater overall academic progress and progress in specific subjects between KS2 and KS4:
• older for their year group (Autumn born) (total GCSE score - ES=0.16; GCSE English - ES=0.18; GCSE maths - ES=0.20).
50 It should be noted that the inspector data are related to the time EPPSE students were in KS3 and were measured by the inspection frameworks in use between 2005 and 2010.
105

• females (total GCSE score - ES=0.25, GCSE English - ES=0.27; GCSE maths - ES=0.13).
• of Bangladeshi heritage51 (total GCSE score - ES=0.83; GCSE English - ES=0.66; GCSE maths - ES=0.88).
• with higher family incomes (total GCSE score - ES=0.26; GCSE English - ES=0.34; GCSE maths - ES=0.21).
• with higher qualified parents (total GCSE score - ES=0.39; GCSE English - ES=0.59; GCSE maths - ES=0.42).
• who experienced more learning opportunities in terms of KS3 HLE academic enrichment (total GCSE score - ES=0.36; GCSE English - ES=0.37; GCSE maths - ES=0.45).
There were also small negative effects on progress related to early behavioural problems, early health problems and eligibility for FSM. Again, this is in accord with patterns found by EPPSE in KS2 and KS3.
Of the neighbourhood measures tested, only the percentage of White British residents was a significant predictor of poorer student progress in English. For progress in maths however, reported crime, level of unemployment, perceived neighbour safety, and the IMD and IDACI were all statistically significant. These findings indicate that the disadvantage of the school’s intake and students’ neighbourhood characteristics had small negative effects predicting both poorer progress and attainment in some outcomes. The results suggest that neighbourhood context plays some role in shaping students’ outcomes up to age 16.
Similar to findings in Year 9, the pre-school measures and the primary school academic effectiveness measure did not predict academic progress in specific subjects (English and maths) between KS2 and KS4. These may be more sensitive to subject department effects. However, pre-school attendance, quality and effectiveness significantly predicted EPPSE students’ overall academic progress in terms of promoting a higher total GCSE score. Overall GCSE performance is likely to be a broader measure of school effects for all students in contrast to subject results that are more likely to reflect subject department effects. Similarly, the CVA measure of secondary school academic effectiveness was a moderately strong predictor of overall academic progress in terms of total GCSE score (ES=0.53). Moreover, measures of secondary school quality (Ofsted ratings) were significant predictors of progress in specific GCSE subject grades in English and maths but not students’ overall academic progress.
51 There is only a small sample size of EPPSE students who are of Bangladeshi heritage.
106

Students’ experiences and views of secondary school Students provided their own views on secondary school characteristics and on their experiences both in Year 9 (see Summary Table below) and Year 11. Various measures of school experiences were identified and tested whether they predicted variations in students’ KS4 academic attainment and progress after control for individual, family, HLE characteristics and the percentage of students on FSM in the school (see related reports Sammons et al., 2014b; 2014c).
Views in Year 9 The results indicate that students who perceived their school to place higher ‘emphasis on learning’ in Year 9 had significantly higher GCSE attainment and made more progress across the five years in secondary school. The summary table below shows the strongest effects were on total GCSE score (ES=0.36). The effect on the overall academic progress was similar (ES=0.33).
Summary table of the effects of Year 9 views of schools on Year 11 academic outcomes
Year 9 views of schools Year 11
Total GCSE score
Year 11 Total GCSE
entries
Year 11 GCSE
English
Year 11 GCSE maths
Fixed effects (continuous) ES Sig ES Sig ES Sig ES Sig Emphasis on learning 0.36 *** 0.26 *** 0.32 *** 0.23 *** Behaviour climate 0.34 *** 0.41 *** 0.34 *** 0.41 *** Headteacher qualities 0.14 * ns 0.12 * ns School environment 0.15 * 0.19 ** 0.12 * 0.13 * Valuing pupils 0.22 *** 0.20 *** 0.15 * ns School/Learning resources 0.20 *** 0.20 *** 0.14 * 0.17 ** Teacher discipline and care 0.14 * ns ns ns Teacher support 0.15 * 0.12 * ns ns
* p<0.05, ** p<0.01, *** p<0.001
EPPSE students’ attainment (in terms of all measures of GCSE results) was also found to be higher when they perceived a more positive ‘behaviour climate’ in their secondary school. The difference was particularly noticeable for grades in GCSE maths and the number of full GCSE entries (ES=0.41). For overall progress and progress in specific subjects the effects were similar and positive. Students’ perceived quality of their ‘school environment’52 was also a predictor of better attainment (in total GCSE score and subject grades), although the effects were smaller. Similarly, small but positive effects were identified for the factor related to students’ perceptions of how much they felt teachers valued and respected them.
The factor ‘learning resources’ (related to whether students felt the school was well equipped with computers and technology) also predicted better attainment in all
52 This factor includes attractive and well decorated buildings, cleanliness of toilets etc.
107

continuous measures of GCSE results. All Year 9 factors related to students’ perceptions of school characteristics and processes significantly predicted overall academic progress measured by total GCSE score and progress in English and maths, controlling for Year 6 prior attainment and other background characteristics.
After testing these factors separately as predictors of attainment, we also tested them together to investigate which ones are the most important in predicting academic outcomes in Year 11 when still controlling for the influences of individual student, familial and HLE characteristics. It was found that the two factors ‘emphasis on learning’ and ‘positive behaviour climate’ together significantly predicted the majority of Year 11 academic attainment measures, but also academic progress.
Summary table of the effects of Year 9 views of schools on Year 11 benchmark indicators
Year 9 views of schools Year 11 Achieved 5 A*-C
Year 11 Achieved 5 A*-C
English and maths
Year 11 EBacc
Fixed effects (continuous) OR Sig OR Sig OR Sig Emphasis on learning 5.95 *** 2.51 * 3.00 * Behaviour climate 3.12 *** 2.32 *** 1.94 * Headteacher qualities ns ns ns School environment ns ns ns Valuing pupils 2.44 *** 1.67 * ns School/Learning resources ns ns ns Teacher discipline and care 2.27 * ns ns Teacher support 1.69 * ns ns
* p<0.05, ** p<0.01, *** p<0.001
Views in Year 11 When testing the factors related to students’ experiences and views in Year 11, we found that significantly higher total GCSE scores and better grades in GCSE English were obtained by students who reported that 1) their teachers had a strong focus on learning; 2) in their schools the relationships between students and teachers were good in terms of trust, respect and fairness; 3) there was a high level of monitoring by their teachers; 4) their teacher provided more feedback. The same factors were significant predictors of overall academic progress and progress in English. ‘Positive relationship’ and ‘formative feedback’ were both significant predictors of better GCSE grades in maths and also of academic progress in maths during secondary school. The results point to the importance of school and teaching experiences in both KS3 and KS4 in shaping academic attainment at GCSE level.
It is interesting to note that the latest report on PISA 2012 results shows that students in England generally have more favourable views of their schools (in terms of positive climate for learning) and teachers (and their relationships with teachers) than the students from other OECD countries (Wheater et al., 2013). The EPPSE analyses point to the importance of students’ perspectives.
108

Homework Again, after control for individual, family and HLE influences, the daily time spent on homework, as reported by students in Year 9 and Year 11, were important and strong predictors of better academic attainment and progress in both KS3 and KS4. The strongest effects were noted for those who reported spending 2-3 hours doing homework on a typical school night. Thus, for example, students who reported in Year 9 spending between 2 and 3 hours on homework on an average weeknight were almost 10 times more likely to achieve 5 A*-C (OR=9.97) than students who did not spend any time on homework. A similarly strong result was found for the time spent on homework reported in Year 11 (OR=9.61). Moderate to strong positive effects of time spent on homework were found for total GCSE score, specific GCSE grades and the benchmark indicators, but also on overall academic progress and progress in specific subjects.
Spending more time on homework is likely to increase students’ study skills and opportunities to learn. It may also be influenced by and provide an indicator of self-regulation. Homework is likely to reflect secondary schools’ policies, teachers’ expectations and the academic emphasis in the school as well as encouragement from parents to take school work seriously. These results show that independent study and effort by students are important contributors to academic success at GCSE over and above the important role of all the other background influences and prior attainment.
Overview The EPPSE project is unique in providing a broad focus on students’ educational outcomes (academic, social-behavioural and dispositions) from pre-school to the end of compulsory schooling (age 16). It has been able to investigate students’ outcomes at different ages and across different phases of education: pre-school, primary school and secondary school; from early childhood to adolescence. In addition to measuring students’ outcomes and both academic and social-behavioural developmental progress over time, the research has collected rich data on students’ self-reports of their experiences and views of school. These provide additional evidence about the nature of students’ learning experiences in secondary school. This report provides a detailed analysis of GCSE outcomes in Year 11 at the end of compulsory schooling in England. It also explores students’ academic progress from age 11 to 16. Elsewhere, in companion reports, findings are presented on EPPSE students’ social-behavioural outcomes based on teacher ratings and on their views of school and dispositions including measures of health and well-being (Sammons et al., 2014a; 2014b; 2014c).
The KS4 phase of the research adds to the large body of evidence from the EPPSE sample at younger ages (pre-school and school entry, KS1, KS2 and KS3). The latest analyses extend and support previous findings that investigated the role of different sources of influence (proximal to distal) that shape children’s and adolescents’ development over time. The approach has links to the ecological model of human
109

development proposed by Bronfenbrenner (1994). We explore the way individual, family, HLE, neighbourhood, pre-school, and school influences shape children’s development from early childhood through to adolescence.
There is clear evidence that various proximal influences like individual, family and HLE characteristics continue to influence students’ attainments in secondary school up to the end of KS4. As at younger ages, significant differences in outcomes for different groups of students have been identified. Certain influences, especially a disadvantaged social background increase the risk of poor academic outcomes. While some influences reduce the likelihood of positive outcomes, others promote this.
There are modest gender effects on GCSE outcomes, as at younger ages. Females show better academic outcomes and are also rated much more favourably in terms of learning and other social-behaviours by their teachers compared to males (see Sammons et al., 2014a). The gender gap is the largest for total GCSE score and English GCSE grades.
The experience of various indicators of disadvantage in the early years increases the risk of poorer academic attainment up to age 16 years, as well as predicting poorer behaviour. The two are likely to be mutually reinforcing. Thus low family SES, low earned income level, eligibility for FSM status, single parent status and larger family size all predict poorer outcomes. Although often smaller in size, neighbourhood disadvantage measures and school context are significant negative predictors of academic attainment outcomes at GCSE, in line with findings in KS3. Contextual effects linked to ‘place poverty’ and school composition also shape social-behaviour in adolescence, as demonstrated in the companion report (Sammons et al., 2014a). Ways to target neighbourhood disadvantages as well as family disadvantages may be important in tackling such external conditions (e.g., via the Pupil Premium in schools or children’s centres in disadvantage areas).
By contrast, higher parental qualification levels and positive parenting experiences in the early and later years, measured by the HLE (especially early years HLE and enrichment learning experiences in KS3), predict better academic outcomes. Although not as strong as evidence found at school entry and in primary school, pre-school experiences continue to shape attainment in secondary school. Having attended any pre-school setting compared to none still shows positive effects on attainment up to age 16. This is the case for both females and males. Pre-school quality also shows an influence, although the quality gradient is more evident for males and those students whose parents have lower qualification levels. By contrast, females and those from families where parents are more qualified show benefits from pre-school irrespective of quality.
The measure of primary school academic effectiveness predicted better attainment in primary school and in secondary school, in Year 9 and for GCSE outcomes in Year 11. However, primary school academic effectiveness did not predict better (or worse) social-behaviour. Similar results are found for the academic effectiveness of the secondary
110

school. Attending a more academically effective secondary school (as measured by the DfE CVA indicators) proved to be a significant predictor of number of GCSE entries and total GCSE score. However, it did not predict the variation in social-behavioural outcomes for the EPPSE sample (see Sammons et al., 2014a). The influence of the academic effectiveness of the schools that students attend on their academic outcomes points to the importance of providing CVA subject indicators in English and maths in primary school and the value of overall CVA type indicators for measuring secondary school effectiveness in promoting student progress taking into account the characteristics of the intakes served.
In KS3, attending a poor quality secondary school as measured by Ofsted judgments predicted poorer attainment outcomes for those unfortunate enough to attend a school rated as ‘inadequate’, but better outcomes if a student went to an ‘outstanding’ school, even controlling for the influence of individual, family and HLE characteristics. By age 16, this effect was weaker. This may reflect changes in schools judged to be ‘inadequate’ or ‘satisfactory’ over the time of the research, given the strong pressure to improve, inherent in the accountability system for schools in England.
The latest EPPSE research in KS4 points to the importance of the ‘student voice’. Self-report surveys provided measures of students’ experiences and views of school in Year 9 and Year 11. The various factors derived from these measures show variation in school experiences. These measures are moderate to strong predictors of both academic outcomes at GCSE and also social-behaviour as rated by teachers.
The ‘quality of teaching’, the school’s ‘behavioural climate’, the ‘emphasis on learning’, ‘positive relationships’ with staff, and feeling ‘valued’ were found to be consistent predictors of better social-behavioural, as well as academic outcomes. Likewise, time spent on homework reported in Year 9 and also in Year 11 (as reported by students) strongly predict better academic and social-behavioural outcomes. These effects are found even when individual student, family, HLE and neighbourhood influences are taken into account. These factors also predict academic progress from Year 6 to Year 11 as well as social-behavioural developmental progress/change over the same time period.
The findings suggest that these features of students’ secondary school experiences are important in shaping their academic development.
Implications The latest findings in KS4 are generally in line with those found in the most recent EPPSE analyses of Year 9 outcomes at the end of KS3. The latest findings cover outcomes at GCSE that have very important consequences for students’ subsequent further higher education and employment opportunities. They highlight a number of features of school experience that can be addressed in school improvement policies intended to promote better outcomes for secondary school students. They also point to
111

the potential role of using survey data and other ways to tap into the student ‘voice’ in assessing the quality of their educational experiences. The aspects about secondary school experience identified here show the importance to school leaders and teaching staff of focusing on enhancing the quality of teaching and learning, student support, positive relationships, improving the behavioural climate of the school, ensuring students feel valued, and promoting a high quality physical environment and learning resources. These aspects should be viewed as key features for school self-evaluation and planning for improvement as well as for external evaluation.
Policy makers are increasingly interested in student progression in judging school performance. Indeed, schools are now required to publish information on progression in their school, not just on academic attainment.
Overall, the latest results confirm and extend earlier EPPSE findings. The life chances of some children are shaped by important individual, family, home and school experiences from an early age. There is no level playing field at the start of school or in later phases. These early effects of disadvantage emerge at a young age and their influences continue to shape students' later educational outcomes through subsequent phases of their educational careers. It is widely recognised that England has a very large equity gap in achievement in international comparisons and that life chances and social mobility are highly stratified. However, some influences can help to ameliorate the effects of disadvantage. Positive pre-school effects remain evident, while secondary school experiences are also relevant. There are important and probably reciprocal associations between academic and social-behavioural development.
Disadvantage remains a complex and multi-faceted concept. The longitudinal EPPSE research indicates that disadvantage is by no means captured by one simple indicator such as the FSM status of a student. This has important implications for funding to tackle disadvantage. Poverty, in terms of FSM status, does not embrace the full range of characteristics which are shown in this report to shape students’ academic outcomes. The concept of multiple disadvantage is important and the challenges facing schools, parents and communities, in promoting better outcomes for students from disadvantaged homes and contexts remain strongly evident (related to neighbourhood and school composition influences).
Educational influences (including pre-school) have an important part to play in supporting those ‘at risk’ and can promote better outcomes by ameliorating the adverse effects of disadvantage. But the EPPSE data shows that equity gaps emerge early for all outcomes (cognitive/academic and social-behavioural) and remain strongly evident across different phases of education.
Taken together, the EPPSE research indicates that no single educational influence acts as a ‘magic bullet’ that can overcome disadvantage. However, parental actions that provide a better home learning environment and also supportive educational environments (pre-school, primary and secondary school) can make a difference to
112

children and young people’s academic and other important educational outcomes and so can help to improve life chances. The findings confirm that pre-school effects last and have particular relevance for policy making. The academic effectiveness of the primary school, and later of the secondary school, attended also predicted students’ attainment and progress. Those fortunate to attend more academically effective or higher quality schools receive a significant boost in terms of GCSE outcomes at age 16. There are also clear implications for practitioners about the role of students’ secondary school experiences that can support school improvement strategies in KS3 and KS4.
113

References Allen, G. (2011). Early Intervention: The Next Steps - An Independent Report to Her Majesty’s Government. London: HM Government http://www.dwp.gov.uk/docs/early-intervention-next-steps.pdf
Brand, S., Felner, R. D., Shim, M., Seitsinger, A. and Dumas, T. (2003). 'Middle school improvement and reform: Development and validation of a school-level assessment of climate, cultural pluralism, and school safety'. Journal of Educational Psychology, 95, 570–588.
Bronfenbrenner, U. and Ceci, S. J. (1994). 'Nature-Nurture Reconceptualized in Developmental Perspective: A Bioecological Model'. Pschological Review, 101 (4), 568-586.
Byrne, B. M. (2010). Structural equation modeling with AMOS: Basic concepts, applications, and programming (2nd Edition). New York: Routledge Academic.
Cooper, H., Robinson, J. C. and Patall, E. A. (2006). 'Does homework improve academic achievement? A synthesis of research, 1987-2003'. Review of Educational Research, 76, 1-62.
Creemers, B. P. M. and Kyriakides, L. (2008). The Dynamics of Educational Effectiveness. London: Routledge.
Creemers, B. P. M., Kyriakides, L. and Sammons, P. (2010). Methodological Advances in Educational Effectiveness Research. London: Routledge Taylor Francis.
Department for Education (2013). Statistical First Release: GCSE and equivalent attainment by pupil characteristics in England, 2011/12. SFR 04/2013. London: Department for Education. https://www.gov.uk/government/uploads/system/uploads/attachment_data/file/219337/sfr04-2013.pdf
Elliot, K. and Sammons, P. (2004). 'Exploring the use of effect sizes to evaluate the impact of different influences on child outcomes: possibilities and limitations, Chapter 2 '. In K. Elliot and I. Schagen (Eds), What Does it Mean? The Use of Effect Sizes in Educational Research (pp. 6-24). Slough: NFER. Available [Online] at: http://www.nfer.ac.uk/nfer/publications/SEF01/SEF01.pdf.
Field, F. (2010). The Foundation Years: Preventing Poor Children Becoming Poor Adults - The report of the Independent Review on Poverty and Life Chances. London: HM Government: http://www.frankfield.com/campaigns/poverty-and-life-changes.aspx
114
Fredericks, J. A., Blumenfeld, P. C. and Paris, A. H. (2004). 'School engagement: Potential of the concept, state of the evidence'. Review of Educational Research, 74, 59 – 109.
Goldstein, H. (1995). Multilevel Statistical Models. (2nd ed.). London: Arnold. Available [Online] at: http://www.bristol.ac.uk/cmm/team/hg/multbook1995.pdf
Goldstein, H. (2003). Multilevel Statistical Models (3rd edition). London: Arnold.
Goldstein, H. and Sammons, P. (1997). 'The Influence of Secondary and Junior Schools on Sixteen Year Examination Performance: A Cross-classified Multilevel Analysis'. School Effectiveness and School Improvement, 8 (2), 219-230.
Goodman, R. (1997). 'The Strengths & Difficulties Questionnaire: A Research Note'. Journal of Child Psychology & Psychiatry, 38 (5), 581-586.
Grosin, L. and McNamara, P. (2001). 'Bedömningsinstrument för skolklimat (Assessment instrument for school climate)'. [Online]. Available at: http://www.mdh.se/isb/pedagogik/personal/peter_mcn/sv1.html [Last accessed 17 April 2002].
Gustafsson, J.-E. (2013). 'Causal inference in educational effectiveness research: A comparison of three methods to investigate effects of homework on student achievement'. School Effectiveness and School Improvement, 24, 275-295
Hanson, T., Austin, G. and Zheng, C. (2011). The relationship of academic achievement and school well-being. San Francisco: WestEd. http://www.childrennow.org/index.php/learn/beingwelllearningwell
Harker, H. (2001). The Effects of Student Composition on School Outcomes. Paper presented at the British Educational Research Association (BERA) Annual Conference. Leeds.
Harms, T., Clifford, R. M. and Cryer, D. (1998). Early Childhood Environmental Rating Scale, Revised Edition (ECERS-R). New York: Teachers College Press.
Holmes, M. and Croll, P. (1989). 'Time spent on homework and academic achievement '. Education Research, 31, 36-45.
Hu, L.-T. and Bentler, P. M. (1999). 'Cutoff criteria for fit indexes in covariance structure analysis: Conventional criteria versus new alternatives'. Structural Equation Modeling, 6 (1), 1-55.
Jesson, D., Gray, J. and Tranmer, M. (1992). GCSE performance in Nottinghamshire 1991: pupil and school factors. Nottingham: Nottinghamshire County Council.
115

Leckie, G. (2009). 'The complexity of school and neighbourhood effects and movements of pupils on school differences in models of educational achievement'. Journal of the Royal Statistical Society, 172 (3), 537-554.
Leckie, G. B. (2012). 'Cross-classified multilevel models using Stata: How important are schools and neighbourhoods for students’ educational attainment?'. In D. Garson (Ed.), Hierarchical Linear Modeling: Guide and Applications (pp. 311-332): Sage.
Marsh, H. W. (1990a). 'A multidimensional, hierarchical self-concept: Theoretical and empirical justification'. Educational Psychology Review, 2 (2), 77-171.
Marsh, H. W. (1990b). 'The structure of academic self-concept: The Marsh/Shavelson Model'. Journal of Educational Psychology, 82 (4), 623-636.
Marsh, H. W. and Craven, R. G. (2006). 'Reciprocal effects of self-concept and performance from a multidimensional perspective: Beyond seductive pleasure and unidimensional perspectives.'. Perspectives on Psychological Science, 1 (2), 133 - 163.
Marsh, H. W. and Hau, K. T. (2003). 'Big fish little pond effect on academic self concept: A cross cultural (26 country) test of the negative effects of academically selective schools'. American Psychologist, 58 (5), 364-376.
Matthews, P. and Sammons, P. (2004). Improvement through Inspection: An Evaluation of the Impact of Ofsted's work (HMI 2244). London: Ofsted.
Melhuish, E., Romaniuk, H., Sammons, P., Sylva, K., Siraj-Blatchford, I. and Taggart, B. (2006a). Effective Pre-school and Primary Education 3-11 Project (EPPE 3-11): The Effectiveness of Primary Schools in England in Key Stage 2 for 2002, 2003 and 2004. Full Report. London: Institute of Education, University of London.
Melhuish, E., Romaniuk, H., Sammons, P., Sylva, K., Siraj-Blatchford, I. and Taggart, B. (2006b). Effective Pre-school and Primary Education 3-11 (EPPE 3-11): The Effectiveness of Primary Schools in England in Key Stage 2 for 2002, 2003 and 2004, Research Brief No. RBX06-06. Nottingham: DfES Publications.
Melhuish, E., Phan, M., Sylva, K., Sammons, P., Siraj-Blatchford, I. and Taggart, B. (2008). 'Effects of the Home Learning Environment and Preschool Center Experience upon Literacy and Numeracy Development in Early Primary School'. Journal of Social Issues, 64 (1), 95-114.
Mortimore, P., Sammons, P., Stoll, L., Lewis, D. and Ecob, R. (1988). School Matters: The Junior Years. Wells: Open Books.
Muijs, D., Harris, A., Chapman, C., Stoll, L. and Russ, J. (2004). 'Improving Schools in Socio-Economically Disadvantaged Areas: A review of research evidence'. School Effectiveness and School Improvement, 15 (2), 149-175.
116

Noble, M., McLennan, D., Wilkinson, K., Whitworth, A., Exley, S., Barnes, H. and Dibben, C. (2008). The English Indices of Deprivation 2007. London: Department for Communities and Local Government.
Noble, M., Wright, G., Dibben, C., Smith, G. A. N., McLennan, D., Anttila, C., Barnes, H., Mokhtar, C., Noble, S., Avenell, D., Gardner, J., Covizzi, I. and Lloyd, M. (2004). The English Indices of Deprivation 2004. London: Office of the Deputy Prime Minister.
Nuttall, D. (1990). Differences in Examination Performance (RS1277/90). London: Research and Statistics Branch, ILEA.
Office of Population Censuses and Surveys (1995). Classification of occupations and coding index. London: HMSO.
Ofsted (2013). The most able students. Are they doing as well as they should in our non-selective secondary schools? http://www.ofsted.gov.uk/resources/most-able-students-are-they-doing-well-they-should-our-non-selective-secondary-schools
Patton, G. C., Bond, L., Carlin, J. B., Thomas, L., Butler, H., Glover, S., Catalano, R. and Bowes, G. (2006). 'Promoting social inclusion in schools: A group-randomized trial of effects on student health risk behavior and well-being'. American Journal of Public Health, 96, 1582-1587.
Reber, A. S. (1995). Dictionary of Psychology (2nd edition). London: Penguin Books.
Rutter, M. and Madge, N. (1976). Cycles of Disadvantage. London: Heinemann.
Rutter, M., Maughan, B., Mortimore, P. and Ouston, J. (1979). Fifteen Thousand Hours: Secondary Schools and Their Effects on Children. London: Open Books.
Sammons, P. (1995). 'Gender, ethnic and socio-economic differences in attainment and progress: a longitudinal analysis of student achievement over nine years'. British Education Research Journal, 21 (4), 465-485.
Sammons, P., Sylva, K., Melhuish, E. C., Siraj-Blatchford, I., Taggart, B. and Elliot, K. (2002). The Effective Provision of Pre-School Education (EPPE) Project: Technical Paper 8a - Measuring the Impact of Pre-School on Children's Cognitive Progress over the Pre-School Period. London: DfES / Institute of Education, University of London.
Sammons, P., Sylva, K., Melhuish, E. C., Siraj-Blatchford, I., Taggart, B. and Elliot, K. (2003). The Effective Provision of Pre-School Education (EPPE) Project: Technical Paper 8b - Measuring the Impact of Pre-School on Children's Social/Behavioural Development over the Pre-School Period. London: DfES / Institute of Education, University of London.
Sammons, P., Elliot, K., Sylva, K., Melhuish, E., Siraj-Blatchford, I. and Taggart, B. (2004a). 'The impact of pre-school on young children's cognitive attainments at entry to reception'. British Education Research Journal, 30 (5), 691-712.
117

Sammons, P., Sylva, K., Melhuish, E., Siraj-Blatchford, I., Taggart, B., Elliot, K. and Marsh, A. (2004b). The Effective Provision of Pre-School Education (EPPE) Project: Technical Paper 11 - Report on the continuing effects of pre-school education at age 7. London: DfES / Institute of Education, University of London.
Sammons, P., Sylva, K., Melhuish, E. C., Siraj-Blatchford, I., Taggart, B., Elliot, K. and Marsh, A. (2004c). The Effective Provision of Pre-School Education (EPPE) Project: Technical Paper 9 - Report on age 6 assessments. London: DfES / Institute of Education, University of London.
Sammons, P., Smees, R., Taggart, B., Sylva, K., Melhuish, E. C., Siraj-Blatchford, I. and Elliot, K. (2004d). The Early Years Transitions and Special Educational Needs (EYTSEN) Project: Technical Paper 2 - Special Educational Needs in the Early Primary Years: Primary school entry up to the end of Year 1. London: DfES / Institute of Education, University of London.
Sammons, P., Siraj-Blatchford, I., Sylva, K., Melhuish, E., Taggart, B. and Elliot, K. (2005). 'Investigating the Effects of Pre-school Provision: Using mixed methods in the EPPE research'. International Journal of Social Research Methodology special issue on Mixed Methods in Educational Research, 8 (3), 207-224.
Sammons, P., Sylva, K., Melhuish, E., Siraj-Blatchford, I., Taggart, B. and Grabbe, Y. (2007a). Effective Pre-school and Primary Education 3-11 Project (EPPE 3-11): Influences on Children’s Attainment and Progress in Key Stage 2: Cognitive Outcomes in Year 5. Full Report. London: Institute of Education, University of London.
Sammons, P., Sylva, K., Melhuish, E., Siraj-Blatchford, I., Taggart, B. and Barreau, S. (2007b). Effective Pre-school and Primary Education 3-11 Project (EPPE 3-11): Influences on Pupils’ Attainment and Progress in Key Stage 2: Social/behavioural Outcomes in Year 5. Full Report. London: Institute of Education, University of London.
Sammons, P., Sylva, K., Melhuish, E., Siraj-Blatchford, I., Taggart, B. and Hunt, S. (2008a). Effective Pre-school and Primary Education 3-11 Project (EPPE 3-11): Influences on Children’s Attainment and Progress in Key Stage 2: Cognitive Outcomes in Year 6. Research Report No. DCSF-RR048. Nottingham: DCSF Publications.
Sammons, P., Sylva, K., Melhuish, E., Siraj-Blatchford, I., Taggart, B. and Jelicic, H. (2008b). Effective Pre-school and Primary Education 3-11 Project (EPPE 3-11): Influences on Children’s Development and Progress in Key Stage 2: Social/behavioural outcomes in Year 6. Research Report No. DCSF-RR049. Nottingham: DCSF Publications.
Sammons, P., Sylva, K., Melhuish, E., Siraj-Blatchford, I., Taggart, B., Toth, K., Draghici, D. and Smees, R. (2011a). Effective Pre-School, Primary and Secondary Education Project (EPPSE 3-14) - Influences on students’ attainment and progress in Key Stage 3:
118

Academic outcomes in the core subjects in Year 9. London: Institute of Education, University of London / Department for Education.
Sammons, P., Sylva, K., Melhuish, E., Siraj-Blatchford, I., Taggart, B., Draghici, D., Toth, K. and Smees, R. (2011b). Effective Pre-School, Primary and Secondary Education Project (EPPSE 3-14) - Influences on students' development in Key Stage 3: Social-behavioural outcomes in Year 9. London: Institute of Education, University of London / Department for Education.
Sammons, P., Sylva, K., Melhuish, E., Siraj-Blatchford, I., Taggart, B., Smees, R., Draghici, D. and Toth, K. (2011c). Effective Pre-school, Primary and Secondary Education 3-14 Project (EPPSE 3-14) - Influences on students’ dispositions in Key Stage 3: Exploring Enjoyment of school, Popularity, Anxiety, Citizenship Values and Academic self-concept in Year 9. London: Institute of Education, University of London / Department for Education.
Sammons, P., Sylva, K., Melhuish, E., Siraj-Blatchford, I., Taggart, B., Smees, R., Draghici, D. and Toth, K. (2011d). Effective Pre-school, Primary and Secondary Education 3-14 Project (EPPSE 3-14): Students' Reports of Their Experiences of School in Year 9. London: Institute of Education, University of London / Department for Education.
Sammons, P., Sylva, K., Melhuish, E., Siraj, I., Taggart, B., Smees, R. and Toth, K. (2014a). Effective Pre-School, Primary and Secondary Education Project (EPPSE 3-16): Influences on students' social-behavioural development at age 16: DfE Publications. RR 351
Sammons, P., Sylva, K., Melhuish, E., Siraj, I., Taggart, B., Smees, R. and Toth, K. (2014b). Effective Pre-school, Primary and Secondary Education 3-16 Project (EPPSE 3-16): Students’ views of school in Key Stage 4 at age 16. London: Institute of Education, University of London / Department for Education.
Sammons, P., Sylva, K., Melhuish, E., Siraj, I., Taggart, B., Smees, R. and Toth, K. (2014c). Effective Pre-school, Primary and Secondary Education 3-16 Project (EPPSE 3-16): Influences on students’ dispositions and well-being in Key Stage 4 at age 16. London: Institute of Education, University of London / Department for Education.
Sammons, P., Thomas, S. and Mortimore, P. (1997). Forging Links: Effective Schools and Effective Departments. London: Paul Chapman.
Sampson, R. J. (2012). Great American City: Chicago and the enduring neighbourhood effect. Chicago: University of Chicago Press.
Scheerens, J. and Bosker, R. (1997). The Foundations of Educational Effectiveness. Oxford: Pergamon.
119

Scott, K. and Carran, D. (1989). 'Identification and referral of handicapped infants'. In M. C. Wang, M. C. Reynolds and H. J. Walberg (Eds), Handbook of Special Education Research and Practice: Low Incidence Conditions (Vol.3) (pp. 227-241). Oxford, England: Pergamon Press. Siraj-Blatchford, I., Sammons, P., Taggart, B., Sylva, K. and Melhuish, E. (2006). 'Educational Research and Evidence-Based Policy: The Mixed-method Approach of the EPPE Project'. Evaluation of Research in Education, 19 (2), 63-82.
Siraj-Blatchford, I., Mayo, A., Melhuish, E., Taggart, B., Sammons, P. and Sylva, K. (2011). Performing against the odds: developmental trajectories of children in the EPPSE 3-16 study. DfE Research Report DFE-RR128. Department for Education: https://www.education.gov.uk/publications/standard/publicationDetail/Page1/DFE-RR128
Steinberg, L. and Monahan, K. (2007). 'Age difference in resistence to peer influence'. Development Psychology, 43, 1531-1543.
Stewart-Brown, S. and Janmohamed, K. (2008). Warwick-Edinburgh Mental Well-being Scale (WEMWBS). User Guide Version 1. Warwick and Edinburgh: University of Warwick and NHS Health Scotland.
Strand, S. (2008). Minority ethnic pupils in the Longitudinal Study of Young People in England: Extension report on performance in public examinations at age 16. DCSF Research Report RR-029. London: Department for Children, Schools and Families.
Strand, S. (2012). 'The White British-Black Caribbean achievement gap: Tests, tiers and teacher expectations'. British Educational Research Journal, 38, 75-101.
Strand, S. (2014). 'Ethnicity, gender, social class and achievement gaps at age 16: intersectionality and 'Getting it' for the white working class'. Research Papers in Education, 29 (2), 131-171.
Sylva, K., Sammons, P., Melhuish, E. C., Siraj-Blatchford, I. and Taggart, B. (1999). The Effective Provision of Pre-School Education (EPPE) Project: Technical Paper 1 - An Introduction to The Effective Provision of Pre-School Education (EPPE) Project. London: DfEE / Institute of Education, University of London.
Sylva, K., Siraj-Blatchford, I. and Taggart, B. (2003). Assessing Quality in the Early Years: Early Childhood Environment Rating Scale Extension (ECERS-E): Four Curricular Subscales. Stoke on Trent, UK and Stirling, USA: Trentham Books.
Sylva, K., Siraj-Blatchford, I., Taggart, B., Sammons, P., Melhuish, E., Elliot, K. and Totsika, V. (2006). 'Capturing Quality in Early Childhood Through Environmental Rating Scales'. Early Childhood Research Quarterly 21 (1), 76-92.
120

Sylva, K., Taggart, B., Melhuish, E., Sammons, P. and Siraj-Blatchford, I. (2007). 'Changing models of research to inform educational policy'. Research Papers in Education, 22 (2), 155-168.
Sylva, K., Melhuish, E., Sammons, P., Siraj-Blatchford, I. and Taggart, B. (2008). Effective Pre-school and Primary Education 3-11 Project (EPPE 3-11) Final report from the primary phase: Pre-school, school and family influences on children’s development during Key Stage 2. Research Report No. DCSF-RR061. Nottingham: DCSF Publications.
Sylva, K., Melhuish, E., Sammons, P., Siraj-Blatchford, I. and Taggart, B. (Eds) (2010), Early Childhood Matters: Evidence from the Effective Pre-school and Primary Education project. London: Routeledge.
Sylva, K., Melhuish, E., Sammons, P., Siraj-Blatchford, I. and Taggart, B. (2014) The Effective Pre-school, Primary and Secondary Education Project (EPPSE 3-16): Students’ educational and developmental outcomes at age 16. DfE Publications. RR 354
Taggart, B., Sammons, P., Smees, R., Sylva, K., Melhuish, E., Siraj-Blatchford, I., Elliot, K. and Lunt, I. (2006). 'Early Identification of Special Needs and the Definition of 'At Risk': The Early Years Transition and Special Education Needs (EYTSEN) Project'. British Journal of Special Education, 33 (1), 40-45.
Taggart, B., Siraj-Blatchford, I., Sylva, K., Melhuish, E. and Sammons, P. (2008). 'Influencing Policy & Practice through Research on Early Childhood Education'. International Journal of Early Childhood Education, 14 (2), 7-21.
Taggart, B, Sammons, P., Siraj, I., Sylva,K., Melhuish, E., Toth. K., Smees, R. and. Hollingworth. K. (2014) The Effective Pre-school, Primary and Secondary Education Project (EPPSE 3-16): Students’ post 16 destinations. Institute of Education, University of London/ DfE www.ioe.ac.uk/eppse
Teddlie, C. and Stringfield, S. (1993). Schools Make a Difference: Lessons Learned from a 10 Year Study of School Effects. New York: Teachers College Press.
Teddlie, C. and Reynolds, D. (2000). The International Handbook of School Effectiveness Research. London: Falmer Press.
Tennant, R., Hiller, L., Fishwick, R., Platt, S., Joseph, S., Weich, S., Parkinson, J., Secker, J. and Stewart-Brown, S. (2007) The Warwick-Edinburgh Mental Well-being Scale (WEMWBS): development and UK validation, Health and Quality of Life Outcomes, 5, 63.
The Equalities Review (2007). Fairness and Freedom: The Final Report of the Equalities Review.http://webarchive.nationalarchives.gov.uk/20100807034701/http://archive.cabinetoffice.gov.uk/equalitiesreview/
121

Tizard, P., Blatchford, P., Burke, J., Farquhar, C. and Plewis, I. (1988). Young Children at School in the Inner City. Hove: Lawrence Erlbaum Associates Ltd.
Voight, A., Austin, G. and Hanson, T. (2013). A climate for academic success: How school climate distinguishes schools that are beating the achievement odds (Full Report). San Francisco: WestEd.
Wheater, R., Ager, R., Burger, B. and Sizmur, J. (2013). Achievement of 15-Year-Olds in England: PISA 2012 National Report (OECD Programme for International Student Assessment). DFE-RR307 (ISBN: 978-1-78105-282-2): National Foundation for Educational Research. https://www.gov.uk/government/publications/programme-for-international-student-assessment-pisa-2012-national-report-for-england.
122

Appendix 1: Home Learning Environment (HLE) measures
The early years home learning environment (HLE) The early years home learning environment (HLE) index is composed of the first seven of the measures below, specifically those deemed the most educationally orientated, and has a scale of 0-49; the frequency of each of the activities being coded on a scale of 0-7 (0 = not occurring, 7 = occurring very frequently) (Melhuish, Phan, Sylva, Sammons, Siraj-Blatchford, & Taggart, 2008).
The specific items associated with the early years (HLE) measure:
• Going to the library
• Being read to
• Learning activities with the alphabet
• Learning activities with numbers/shapes
• Learning activities with songs/poems/nursery rhymes
• Playing with letters/numbers
• Painting or drawing
• Playing with friends at home
• Playing with friends elsewhere
• Visiting relatives or friends
• Shopping with parent
• Watching TV
• Eating meals with the family
• Having a regular bedtime.
123

Appendix
The Key Stage 1 (KS1) home learning environment (HLE)
KS1 HLE Factors and the items (from the KS1 Parent questionnaire) loading on these factors:
Home Computing
• The Child plays on computer by themself
• Respondent plays computer games with the child
• Respondent uses computer with the child in educational ways
Parent-Child enrichment outing/activity outside home
• Respondent visits library with the child
• Respondent does sport/physical activity with the child
• Respondent goes on educational visits with the child
Parent-child one-to-one interactions at home
• Respondent plays with the child using toys/games/puzzles
• Respondent reads to the child
• Respondent listens to the child read
Expressive play
• The Child plays ‘make believe’ or pretend games
• The Child paints/draws/makes models
• The Child enjoys dance music and movement.
124

Appendix
The Key Stage 2 (KS2) home learning environment (HLE)
KS2 HLE Factors and the items (from the KS2 Parent Questionnaire and All about me) loading on these factors:
Parent-Child Educational Computing
• (Parent & EPPSE Child) Use the internet for learning (together)
• (Parent & EPPSE Child) Use the internet for play / recreation (together)
• (Parent & EPPSE Child) Use a computer in educational ways (together)
• (EPPSE Child) Uses the internet (on their own)
• (EPPSE Child) Uses the computer for activities related to learning (on their own).
Parent-Child Interactive Learning Processes
• (Parent & EPPSE Child) Sport, dance or physical activities (together)
• (Parent) Joins in with EPPE child during games or play
• (Parent & EPPSE Child) Go on educational visits to museums, nature parks, farm etc.
• (Parent) Teaches (EPPSE Child) a school subject e.g., geography, science, English
• (Parent & EPPSE Child) Visit the library (together).
Individual Child Activities
• (EPPSE Child) Reads on their own
• (EPPSE Child) Paints, draws or makes models (on their own)
• (EPPSE Child) Enjoys dance, music, movement (on their own).
Computer Games
• (Parent & EPPSE Child) Play computer games i.e. Play Station, X-Box etc. (together)
• (Child) Plays computer games i.e. Play Station, X-Box etc. (on their own).
125

Appendix
The Key Stage 3 (KS3) home learning environment (HLE)
KS3 HLE Factors and the items (from the KS3 Parent and All about me Questionnaires) loading on these factors:
Learning Support & Resources
• (Parent) Bought/downloaded educational computer software
• (Parent) Helped with using the internet
• (Parent) Given help with difficult homework
• (Parent) Bought a book to help with school work.
Computer Use
• (EPPSE Child) Computer use MSN
• (EPPSE Child) Computer use E mail
• (EPPSE Child) Computer use Listening to music
• (EPPSE Child) Computer use Browsing/downloading from the net.
Parental Interest in School
• (Parent) Talked to them about their school work
• (Parent) Talked to them about their experiences at school
• (Parent) Talked to them about subjects for GCSE.
Academic Enrichment
• (EPPSE Child) Read on your own for pleasure
• (EPPSE Child) With family Go on educational visits
• (EPPSE Child) Go to the library (not school library).
Parental Academic Supervision
• (EPPSE Child) My parents make sure I do my homework
• (EPPSE Child) My parents know about how I’m getting on in school.
126
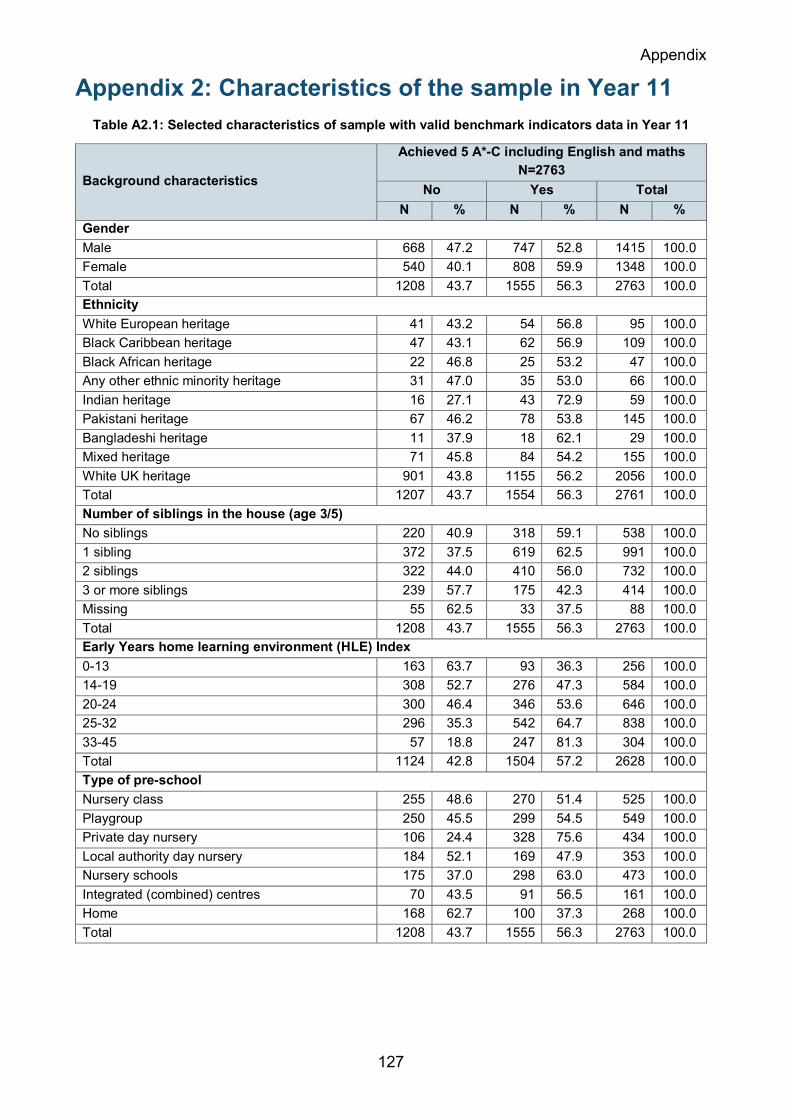
Appendix
Appendix 2: Characteristics of the sample in Year 11 Table A2.1: Selected characteristics of sample with valid benchmark indicators data in Year 11
Background characteristics
Achieved 5 A*-C including English and maths N=2763
No Yes Total N % N % N %
Gender Male 668 47.2 747 52.8 1415 100.0 Female 540 40.1 808 59.9 1348 100.0 Total 1208 43.7 1555 56.3 2763 100.0 Ethnicity White European heritage 41 43.2 54 56.8 95 100.0 Black Caribbean heritage 47 43.1 62 56.9 109 100.0 Black African heritage 22 46.8 25 53.2 47 100.0 Any other ethnic minority heritage 31 47.0 35 53.0 66 100.0 Indian heritage 16 27.1 43 72.9 59 100.0 Pakistani heritage 67 46.2 78 53.8 145 100.0 Bangladeshi heritage 11 37.9 18 62.1 29 100.0 Mixed heritage 71 45.8 84 54.2 155 100.0 White UK heritage 901 43.8 1155 56.2 2056 100.0 Total 1207 43.7 1554 56.3 2761 100.0 Number of siblings in the house (age 3/5) No siblings 220 40.9 318 59.1 538 100.0 1 sibling 372 37.5 619 62.5 991 100.0 2 siblings 322 44.0 410 56.0 732 100.0 3 or more siblings 239 57.7 175 42.3 414 100.0 Missing 55 62.5 33 37.5 88 100.0 Total 1208 43.7 1555 56.3 2763 100.0 Early Years home learning environment (HLE) Index 0-13 163 63.7 93 36.3 256 100.0 14-19 308 52.7 276 47.3 584 100.0 20-24 300 46.4 346 53.6 646 100.0 25-32 296 35.3 542 64.7 838 100.0 33-45 57 18.8 247 81.3 304 100.0 Total 1124 42.8 1504 57.2 2628 100.0 Type of pre-school Nursery class 255 48.6 270 51.4 525 100.0 Playgroup 250 45.5 299 54.5 549 100.0 Private day nursery 106 24.4 328 75.6 434 100.0 Local authority day nursery 184 52.1 169 47.9 353 100.0 Nursery schools 175 37.0 298 63.0 473 100.0 Integrated (combined) centres 70 43.5 91 56.5 161 100.0 Home 168 62.7 100 37.3 268 100.0 Total 1208 43.7 1555 56.3 2763 100.0
127

Appendix
Mother’s qualification level Achieved 5 A*-C including English and maths
No Yes Total N % N % N %
None 382 66.8 190 33.2 572 100.0 Vocational 177 44.9 217 55.1 394 100.0 16 Academic 445 44.1 565 55.9 1010 100.0 18 Academic 63 29.4 151 70.6 214 100.0 Degree or higher degree 57 13.8 355 86.2 412 100.0 Other professional 6 15.8 32 84.2 38 100.0 Total 1130 42.8 1510 57.2 2640 100.0 Father’s qualification level None 264 62.0 162 38.0 426 100.0 Vocational 119 39.3 184 60.7 303 100.0 16 academic 249 39.4 383 60.6 632 100.0 18 academic 65 34.4 124 65.6 189 100.0 Degree or higher degree 68 15.5 370 84.5 438 100.0 Other professional 10 35.7 18 64.3 28 100.0 Absent father 374 56.9 283 43.1 657 100.0 Total 1149 43.0 1524 57.0 2673 100.0 Family highest SES (age 3/5) Professional non manual 34 15.2 190 84.8 224 100.0 Other professional non manual 173 26.3 485 73.7 658 100.0 Skilled non manual 373 42.1 512 57.9 885 100.0 Skilled manual 241 59.5 164 40.5 405 100.0 Semi-skilled 233 65.3 124 34.7 357 100.0 Unskilled 50 73.5 18 26.5 68 100.0 Unemployed /not working 43 57.3 32 42.7 75 100.0 Total 1147 42.9 1525 57.1 2672 100.0 FSM at Year 11 No Free School Meals (FSM) 841 38.1 1369 61.9 2210 100.0 Free School Meals (FSM) 349 67.9 165 32.1 514 100.0 Total 1190 43.7 1534 56.3 2724 100.0 Family earned income at KS1 No earned salary 309 60.6 201 39.4 510 100.0 £ 2,500 – 17,499 231 51.2 220 48.8 451 100.0 £ 17,500 – 29,999 146 38.5 233 61.5 379 100.0 £ 30,000 – 37,499 84 33.2 169 66.8 253 100.0 £ 37,500 – 67,499 91 22.1 320 77.9 411 100.0 £ 67,500 – 132,000+ 23 16.0 121 84.0 144 100.0 Total 884 41.2 1264 58.8 2148 100.0 SEN status at Year 11 No special provision 653 31.9 1396 68.1 2049 100.0 School action 225 75.0 75 25.0 300 100.0 School action plus 156 86.7 24 13.3 180 100.0 Statement of SEN 87 91.6 8 8.4 95 100.0 Total 1121 42.7 1503 57.3 2624 100.0 Pre-school attendance Pre-school 1040 41.7 1455 58.3 2495 100.0 No pre-school 168 62.7 100 37.3 268 100.0 Total 1208 43.7 1555 56.3 2763 100.0
128
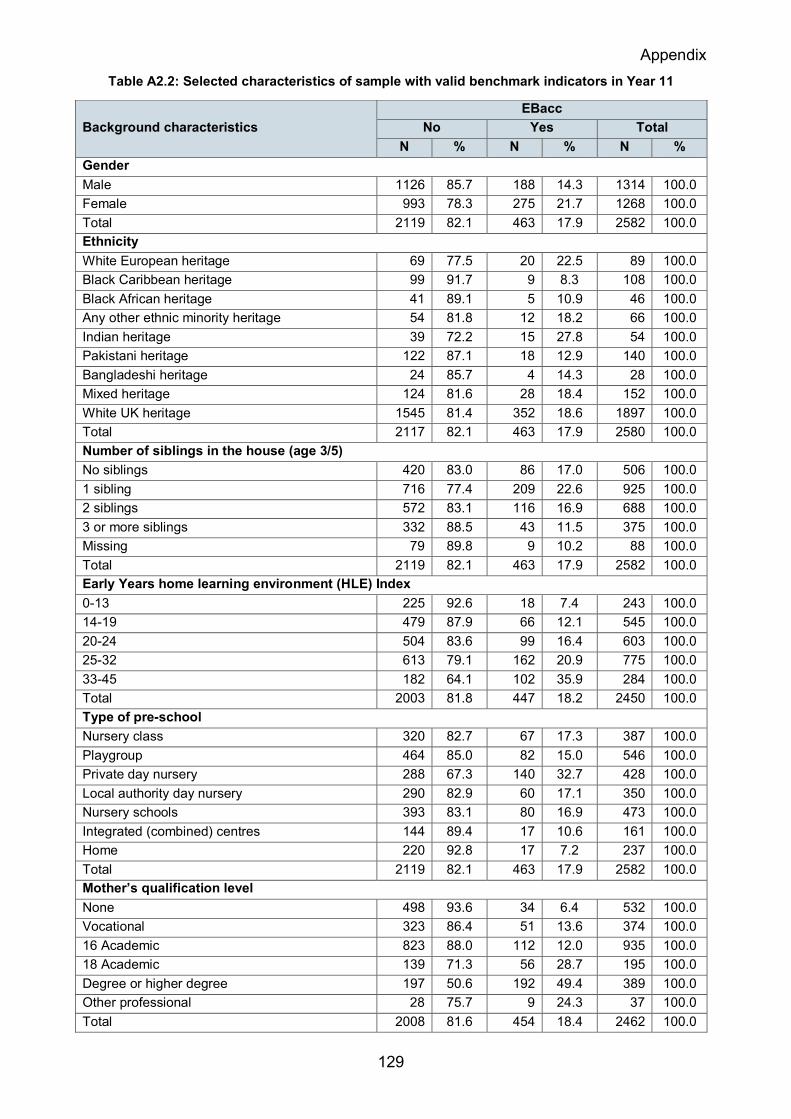
Appendix Table A2.2: Selected characteristics of sample with valid benchmark indicators in Year 11
Background characteristics EBacc
No Yes Total N % N % N %
Gender Male 1126 85.7 188 14.3 1314 100.0 Female 993 78.3 275 21.7 1268 100.0 Total 2119 82.1 463 17.9 2582 100.0 Ethnicity White European heritage 69 77.5 20 22.5 89 100.0 Black Caribbean heritage 99 91.7 9 8.3 108 100.0 Black African heritage 41 89.1 5 10.9 46 100.0 Any other ethnic minority heritage 54 81.8 12 18.2 66 100.0 Indian heritage 39 72.2 15 27.8 54 100.0 Pakistani heritage 122 87.1 18 12.9 140 100.0 Bangladeshi heritage 24 85.7 4 14.3 28 100.0 Mixed heritage 124 81.6 28 18.4 152 100.0 White UK heritage 1545 81.4 352 18.6 1897 100.0 Total 2117 82.1 463 17.9 2580 100.0 Number of siblings in the house (age 3/5) No siblings 420 83.0 86 17.0 506 100.0 1 sibling 716 77.4 209 22.6 925 100.0 2 siblings 572 83.1 116 16.9 688 100.0 3 or more siblings 332 88.5 43 11.5 375 100.0 Missing 79 89.8 9 10.2 88 100.0 Total 2119 82.1 463 17.9 2582 100.0 Early Years home learning environment (HLE) Index 0-13 225 92.6 18 7.4 243 100.0 14-19 479 87.9 66 12.1 545 100.0 20-24 504 83.6 99 16.4 603 100.0 25-32 613 79.1 162 20.9 775 100.0 33-45 182 64.1 102 35.9 284 100.0 Total 2003 81.8 447 18.2 2450 100.0 Type of pre-school Nursery class 320 82.7 67 17.3 387 100.0 Playgroup 464 85.0 82 15.0 546 100.0 Private day nursery 288 67.3 140 32.7 428 100.0 Local authority day nursery 290 82.9 60 17.1 350 100.0 Nursery schools 393 83.1 80 16.9 473 100.0 Integrated (combined) centres 144 89.4 17 10.6 161 100.0 Home 220 92.8 17 7.2 237 100.0 Total 2119 82.1 463 17.9 2582 100.0 Mother’s qualification level None 498 93.6 34 6.4 532 100.0 Vocational 323 86.4 51 13.6 374 100.0 16 Academic 823 88.0 112 12.0 935 100.0 18 Academic 139 71.3 56 28.7 195 100.0 Degree or higher degree 197 50.6 192 49.4 389 100.0 Other professional 28 75.7 9 24.3 37 100.0 Total 2008 81.6 454 18.4 2462 100.0
129

Appendix
Background characteristics EBacc
No Yes Total N % N % N %
Father’s qualification level None 375 94.2 23 5.8 398 100.0 Vocational 232 80.3 57 19.7 289 100.0 16 academic 508 86.8 77 13.2 585 100.0 18 academic 130 76.0 41 24.0 171 100.0 Degree or higher degree 209 50.5 205 49.5 414 100.0 Other professional 22 78.6 6 21.4 28 100.0 Absent father 562 92.4 46 7.6 608 100.0 Total 2038 81.7 455 18.3 2493 100.0 Family highest SES (age 3/5) Professional non manual 110 51.2 105 48.8 215 100.0 Other professional non manual 425 68.9 192 31.1 617 100.0 Skilled non manual 703 85.7 117 14.3 820 100.0 Skilled manual 355 94.9 19 5.1 374 100.0 Semi-skilled 313 95.7 14 4.3 327 100.0 Unskilled 63 95.5 3 4.5 66 100.0 Unemployed /not working 66 91.7 6 8.3 72 100.0 Total 2035 81.7 456 18.3 2491 100.0 FSM at Year 11 No Free School Meals (FSM) 1633 79.2 429 20.8 2062 100.0 Free School Meals (FSM) 453 94.2 28 5.8 481 100.0 Total 2086 82.0 457 18.0 2543 100.0 Family earned income at KS1 No earned salary 431 91.9 38 8.1 469 100.0 £ 2,500 – 17,499 375 88.9 47 11.1 422 100.0 £ 17,500 – 29,999 290 81.2 67 18.8 357 100.0 £ 30,000 – 37,499 175 75.8 56 24.2 231 100.0 £ 37,500 – 67,499 249 66.0 128 34.0 377 100.0 £ 67,500 – 132,000+ 69 49.6 70 50.4 139 100.0 Total 1589 79.6 406 20.4 1995 100.0 SEN status at Year 11 No special provision 1490 77.9 422 22.1 1912 100.0 School action 267 96.0 11 4.0 278 100.0 School action plus 163 98.8 2 1.2 165 100.0 Statement of SEN 87 97.8 2 2.2 89 100.0 Total 2007 82.1 437 17.9 2444 100.0 Pre-school attendance Pre-school 1899 81.0 446 19.0 2345 100.0 No pre-school 220 92.8 17 7.2 237 100.0 Total 2119 82.1 463 17.9 2582 100.0
130

Appendix 3: Associations between students’ earlier measures of academic attainment
Table A3.1: Correlations of different academic outcomes in Year 6
KS2 TA English KS2 TA maths
Year 6 English 0.77 0.641 National Assessment Standardised Scores N=2368
Year 6 maths 0.6718 0.82 National Assessment Standardised Scores N=2378
Table A3.2: Correlations of different academic outcomes in Year 9 and Year 6
Year 9 English National
Assessment Standardised
Scores
Year 9 maths
National Assessment Standardised
Scores
Year 9 English Teacher
Assessment (TA)
Year 9 maths
Teacher Assessment
(TA)
Year 9 English National Assessment Standardised Scores
1 0.75
(N=1105) 0.68
(N=1103)
Year 9 maths National Assessment Standardised Scores
0.72 (N=1133)
1 0.70
(N=1143) 0.89
(N=1144)
Year 6 English National Assessment Standardised Scores
0.74 (N=1100)
0.66 (N=1125)
0.70 (N=2416)
0.65 (N=2413)
Year 6 maths National Assessment Standardised Scores
0.60 (N= 1107)
0.86 (N=1135)
0.61 (N=2426)
0.82 (N=2424)
131

Appendix 4: Contextualised multilevel models Table A4.1: Contextualised model for total GCSE score in Year 11 - Parents’ highest qualification
level
Fixed Effects Total GCSE score
Coef. SE ES Sig Age 2.70 0.84 0.14 ** Gender 25.67 6.15 0.19 *** Ethnic group (compared with White UK) White European heritage 19.24 17.04 0.14 Black Caribbean heritage 37.82 16.84 0.28 * Black African heritage 3.62 24.28 0.03 Any other ethnic minority 18.70 20.97 0.14 Indian 48.77 22.24 0.37 * Pakistani 52.97 19.09 0.40 ** Bangladeshi 101.91 31.43 0.76 ** Mixed Race -15.91 13.58 -0.12 Early behavioural problems (compared with none) 1+ Behavioural problem -38.85 9.07 -0.29 *** Early health problems (compared with none) 1+ Health problem -15.90 6.65 -0.12 * Number of siblings at age 3/5 (compared with none) 1 sibling 6.48 8.29 0.05 2 siblings -0.72 8.74 -0.01 3 + siblings -23.18 10.27 -0.17 * Missing 67.04 47.87 0.50 Year 11 FSM (compared with no) -42.03 8.36 -0.32 *** KS1 family salary (compared with no earned salary) £2500-15000 14.12 9.93 0.11 £17500-27500 22.73 10.63 0.17 * £30000-35000 32.03 12.20 0.24 ** £37500-66000 34.69 11.41 0.26 ** £67500-132000 39.20 19.29 0.29 * Missing 16.65 10.08 0.12 Parents' highest SES at age 3/5 (compared with professional, non-manual) Other professional non-manual -5.50 13.90 -0.04 Skilled non-manual -19.76 14.74 -0.15 Skilled manual -41.60 16.03 -0.31 ** Semi-skilled -40.34 16.55 -0.30 * Unskilled -35.51 23.47 -0.27 Never worked -30.27 22.86 -0.23
* p<0.05, ** p<0.01, *** p<0.001
132

Fixed Effects Total GCSE score
Coef. SE ES Sig Parents' highest qualifications level at age 3/5 (compared with none) Vocational 29.22 11.94 0.22 * Academic age 16 38.81 9.42 0.29 *** Academic age 18 42.76 12.72 0.32 *** Other professional 47.29 24.63 0.35 Degree 69.43 13.28 0.52 *** Higher degree 78.94 18.68 0.59 *** Absent father or missing mother's 42.83 40.85 0.32 Missing -102.19 50.03 -0.77 * Early years HLE (compared with 0-13) 14-19 7.20 10.58 0.05 20-24 4.80 10.76 0.04 25-32 22.58 10.74 0.17 * >33 48.43 13.44 0.36 *** KS1HLE educational computing (compared with low) KS1 HLE educational computing medium 14.28 7.22 0.11 * KS1 HLE educational computing high 0.15 10.57 0.00 KS3 HLE academic enrichment (compared with low) KS3 HLE academic enrichment medium 39.77 6.73 0.30 *** KS3 HLE academic enrichment high 63.11 9.62 0.47 *** FSM school level (continuous) 0.11 0.36 0.03 % White British neighbourhood (continuous) -0.36 0.22 -0.13
Intercept 374.25 21.13 *** Variance-school level 7701.87 951.69 ***
Variance-student level 17763.03 579.71 *** Total variance 25464.90
Number of students 2497 Number of schools 610
Deviance (-2 x Log Restricted-Likelihood) 31642.29 Intra-school correlation (ICC) 0.3025
% Reduction student variance 15.1 % Reduction school variance 28.3
% Reduction total variance 19.6 * p<0.05, ** p<0.01, *** p<0.001
133

Table A4.2: Contextualised model for total GCSE score in Year 11 -Mother’s and Father’s highest
qualification level
Fixed Effects Total GCSE score
Coef. SE ES Sig Age 2.75 0.84 0.14 ** Gender 26.29 6.14 0.20 *** Ethnic group (compared with White UK) White European Heritage 20.69 17.00 0.16 Black Caribbean Heritage 37.59 16.95 0.28 * Black African Heritage 4.14 24.25 0.03 Any Other Ethnic Minority 18.37 20.91 0.14 Indian 54.22 22.19 0.41 * Pakistani 57.65 19.02 0.43 ** Bangladeshi 111.92 30.98 0.84 *** Mixed Race -14.19 13.55 -0.11 Early behavioural problems (compared with none) 1+ Behavioural problem -36.50 9.04 -0.28 *** Early health problem (compared with none) 1+ Health problem -16.09 6.62 -0.12 * Number of siblings at age 3/5(compared with none) 1 sibling 6.74 8.28 0.05 2 siblings 0.64 8.81 0.00 3 + siblings -21.02 10.32 -0.16 * Missing 94.32 41.16 0.71 * Year 11 FSM (compared with no) -40.67 8.36 -0.31 *** KS1 family salary (compared with no earned salary) £2500-15000 13.11 9.90 0.10 £17500-27500 19.99 10.68 0.15 £30000-35000 29.81 12.26 0.22 * £37500-66000 30.48 11.51 0.23 ** £67500-132000 33.92 19.37 0.26 Missing 16.01 10.07 0.12 Parents' highest SES at age 3/5 (compared with professional, non-manual) Other professional non-manual -6.22 14.02 -0.05 Skilled non-manual -21.98 14.92 -0.17 Skilled manual -40.74 16.14 -0.31 * Semi-skilled -39.67 16.79 -0.30 * Unskilled -35.47 23.60 -0.27 Never worked -27.78 23.14 -0.21 Mother's highest qualifications level at age 3/5 (compared with none) Vocational 21.95 10.77 0.17 * Academic age 16 38.23 8.79 0.29 *** Academic age 18 49.38 13.45 0.37 *** Degree or higher degree 62.96 14.01 0.47 *** Other professional 36.56 26.80 0.28 Missing -17.42 23.13 -0.13
* p<0.05, ** p<0.01, *** p<0.001
134

Fixed Effects Total GCSE score
Coef. SE ES Sig Father's highest qualifications level at age 3/5 (compared with none) Vocational 27.72 11.50 0.21 * Academic age 16 18.34 9.71 0.14 Academic age 18 4.14 13.87 0.03 Degree or higher degree 26.84 13.95 0.20 Other professional 16.74 31.53 0.13 Absent father 5.57 9.59 0.04 Missing -112.13 41.79 -0.85 ** Early years HLE (compared with 0-13) 14-19 6.34 10.55 0.05 20-24 2.09 10.74 0.02 25-32 19.66 10.71 0.15 >33 44.88 13.42 0.34 *** KS1HLE educational computing (compared with low) KS1 HLE educational computing medium 13.80 7.20 0.10 KS1 HLE educational computing high 1.08 10.54 0.01 KS3 HLE academic enrichment (compared with low) KS3 HLE academic enrichment medium 37.84 6.72 0.29 *** KS3 HLE academic enrichment high 61.57 9.60 0.46 *** FSM school level (continuous) 0.13 0.36 0.03 % White British (continuous) -0.36 0.21 -0.13
Intercept 371.67 21.63 *** Variance-school level 7787.26 954.61 ***
Variance-student level 17586.23 574.79 *** Total variance 25373.49
Number of students 2497 Number of schools 610
Deviance (-2 x Log Restricted-Likelihood) 31586.70 Intra-school correlation (ICC) 0.3069
% Reduction student variance 16.0 % Reduction school variance 27.5
% Reduction total variance 19.9 * p<0.05, ** p<0.01, *** p<0.001
135
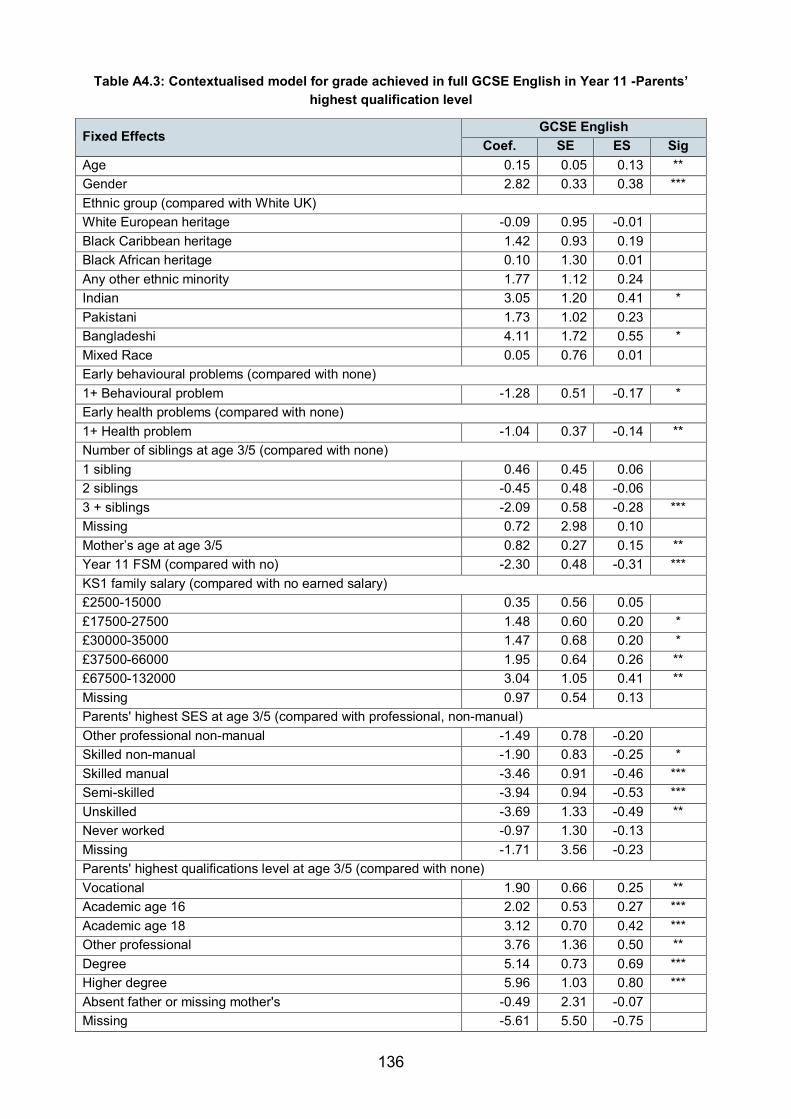
Table A4.3: Contextualised model for grade achieved in full GCSE English in Year 11 -Parents’
highest qualification level
Fixed Effects GCSE English
Coef. SE ES Sig Age 0.15 0.05 0.13 ** Gender 2.82 0.33 0.38 *** Ethnic group (compared with White UK) White European heritage -0.09 0.95 -0.01 Black Caribbean heritage 1.42 0.93 0.19 Black African heritage 0.10 1.30 0.01 Any other ethnic minority 1.77 1.12 0.24 Indian 3.05 1.20 0.41 * Pakistani 1.73 1.02 0.23 Bangladeshi 4.11 1.72 0.55 * Mixed Race 0.05 0.76 0.01 Early behavioural problems (compared with none) 1+ Behavioural problem -1.28 0.51 -0.17 * Early health problems (compared with none) 1+ Health problem -1.04 0.37 -0.14 ** Number of siblings at age 3/5 (compared with none) 1 sibling 0.46 0.45 0.06 2 siblings -0.45 0.48 -0.06 3 + siblings -2.09 0.58 -0.28 *** Missing 0.72 2.98 0.10 Mother’s age at age 3/5 0.82 0.27 0.15 ** Year 11 FSM (compared with no) -2.30 0.48 -0.31 *** KS1 family salary (compared with no earned salary) £2500-15000 0.35 0.56 0.05 £17500-27500 1.48 0.60 0.20 * £30000-35000 1.47 0.68 0.20 * £37500-66000 1.95 0.64 0.26 ** £67500-132000 3.04 1.05 0.41 ** Missing 0.97 0.54 0.13 Parents' highest SES at age 3/5 (compared with professional, non-manual) Other professional non-manual -1.49 0.78 -0.20 Skilled non-manual -1.90 0.83 -0.25 * Skilled manual -3.46 0.91 -0.46 *** Semi-skilled -3.94 0.94 -0.53 *** Unskilled -3.69 1.33 -0.49 ** Never worked -0.97 1.30 -0.13 Missing -1.71 3.56 -0.23 Parents' highest qualifications level at age 3/5 (compared with none) Vocational 1.90 0.66 0.25 ** Academic age 16 2.02 0.53 0.27 *** Academic age 18 3.12 0.70 0.42 *** Other professional 3.76 1.36 0.50 ** Degree 5.14 0.73 0.69 *** Higher degree 5.96 1.03 0.80 *** Absent father or missing mother's -0.49 2.31 -0.07 Missing -5.61 5.50 -0.75
136

Fixed Effects GCSE English
Coef. SE ES Sig Early years HLE (compared with 0-13) 14-19 0.56 0.59 0.07 20-24 0.62 0.60 0.08 25-32 1.60 0.60 0.21 ** >33 3.84 0.74 0.51 *** KS2 HLE educational computing (compared with low) KS2 HLE educational computing medium 0.77 0.38 0.10 * KS2 HLE educational computing high 0.12 0.60 0.02 KS3 HLE academic enrichment (compared with low) KS3 HLE academic enrichment medium 1.87 0.38 0.25 *** KS3 HLE academic enrichment high 3.57 0.53 0.48 *** FSM school level (continuous) -0.04 0.02 -0.18 ** % White British neighbourhood (continuous) -0.03 0.01 -0.20 **
Intercept 36.12 1.17 *** Variance-school level 4.08 1.10 ***
Variance-student level 56.17 1.79 *** Total variance 60.26
Number of students 2343 Number of schools 573
Deviance (-2 x Log Restricted-Likelihood) 16134.96 Intra-school correlation (ICC) 0.0678
% Reduction student variance 20.8 % Reduction school variance 84.7
% Reduction total variance 38.2 * p<0.05, ** p<0.01, *** p<0.001
137

Table A4.4: Contextualised model for grade achieved in full GCSE English in Year 11 - Mother’s and
Father’s highest qualification level
Fixed Effects GCSE English
Coef. SE ES Sig Age 0.15 0.05 0.14 ** Gender 2.92 0.33 0.39 *** Ethnic group (compared with White UK) White European Heritage -0.10 0.95 -0.01 Black Caribbean Heritage 1.19 0.94 0.16 Black African Heritage -0.11 1.29 -0.02 Any Other Ethnic Minority 1.69 1.11 0.23 Indian 3.22 1.19 0.43 ** Pakistani 1.87 1.02 0.25 Bangladeshi 4.08 1.71 0.55 * Mixed Race 0.06 0.76 0.01 Early behavioural problems (compared with none) 1+ Behavioural problem -1.12 0.50 -0.15 * Early health problem (compared with none) 1+ Health problem -1.04 0.37 -0.14 ** Number of siblings at age 3/5(compared with none) 1 sibling 0.46 0.45 0.06 2 siblings -0.38 0.48 -0.05 3 + siblings -1.90 0.58 -0.25 ** Missing 0.78 2.95 0.11 Mother's age at age 3/5 0.78 0.27 0.14 ** Year 11 FSM (compared with no) -2.19 0.48 -0.29 *** KS1 family salary (compared with no earned salary) £2500-15000 0.33 0.55 0.04 £17500-27500 1.36 0.60 0.18 * £30000-3500 1.26 0.68 0.17 £37500-6600 1.65 0.64 0.22 * £67500-132000 2.47 1.06 0.33 * Missing 0.96 0.54 0.13 Parents' highest SES at age 3/5 (compared with professional, non-manual) Other professional non-manual -1.27 0.79 -0.17 Skilled non-manual -1.64 0.85 -0.22 Skilled manual -3.08 0.93 -0.41 *** Semi-skilled -3.47 0.96 -0.47 *** Unskilled -3.28 1.34 -0.44 * Never worked -0.58 1.31 -0.08 Missing -1.62 3.55 -0.22 Mother's highest qualifications level at age 3/5 (compared with none) Vocational 1.80 0.60 0.24 ** Academic age 16 2.07 0.49 0.28 *** Academic age 18 2.87 0.74 0.39 *** Degree or higher degree 5.25 0.77 0.70 *** Other professional 3.94 1.47 0.53 ** Missing 1.07 1.59 0.14
* p<0.05, ** p<0.01, *** p<0.001
138

Fixed Effects GCSE English
Coef. SE ES Sig Father's highest qualifications level at age 3/5 (compared with none) Vocational 1.84 0.63 0.25 ** Academic age 16 1.41 0.53 0.19 ** Academic age 18 1.83 0.76 0.25 * Degree or higher degree 2.49 0.77 0.33 ** Other professional 2.84 1.74 0.38 Absent father 0.69 0.53 0.09 Missing -4.54 3.21 -0.61 Early years HLE (compared with 0-13) 14-19 0.53 0.59 0.07 20-24 0.43 0.60 0.06 25-32 1.43 0.59 0.19 * >33 3.57 0.74 0.48 *** KS2 HLE educational computing (compared with low) KS2 HLE educational computing medium 0.71 0.37 0.10 KS2 HLE educational computing high 0.15 0.60 0.02 KS3 HLE academic enrichment (compared with low) KS3 HLE academic enrichment medium 1.73 0.37 0.23 *** KS3 HLE academic enrichment high 3.48 0.53 0.47 *** FSM school level (continuous) -0.04 0.02 -0.17 ** % White British (continuous) -0.03 0.01 -0.21 **
Intercept 35.16 1.20 *** Variance-school level 4.33 1.14 ***
Variance-student level 55.43 1.78 *** Total variance 59.77
Number of students 2343 Number of schools 573
Deviance (-2 x Log Restricted-Likelihood) 16104.06 Intra-school correlation (ICC) 0.0725
% Reduction student variance 21.8 % Reduction school variance 83.7
% Reduction total variance 38.7 * p<0.05, ** p<0.01, *** p<0.001
139

Table A4.5: Contextualised model for grade achieved in full GCSE maths in Year 11- Parents’
highest qualification level
Fixed Effects GCSE maths
Coef. SE ES Sig Age 0.19 0.05 0.14 *** Gender -0.61 0.39 -0.07 Ethnic group (compared with White UK) White European heritage 0.97 1.07 0.11 Black Caribbean heritage 1.60 1.10 0.18 Black African heritage 0.67 1.53 0.07 Any other ethnic minority 3.83 1.29 0.42 ** Indian 4.80 1.42 0.53 *** Pakistani 2.69 1.16 0.29 * Bangladeshi 3.96 2.03 0.43 Mixed Race 0.90 0.88 0.10 Early behavioural problems (compared with none) 1+ Behavioural problem -2.47 0.59 -0.27 *** Early health problems (compared with none) 1+ Health problem -1.43 0.43 -0.16 *** Number of siblings at age 3/5 (compared with none) 1 sibling 0.58 0.52 0.06 2 siblings -0.53 0.56 -0.06 3 + siblings -1.53 0.68 -0.17 * Missing 0.21 3.59 0.02 Mother’s age at age 3/5 0.66 0.31 0.10 * Year 11 FSM (compared with no) -3.41 0.56 -0.37 *** KS1 family salary (compared with no earned salary) £2500-15000 -0.06 0.65 -0.01 £17500-27500 1.14 0.70 0.12 £30000-35000 1.25 0.80 0.14 £37500-66000 2.02 0.74 0.22 ** £67500-132000 2.57 1.07 0.28 * Missing 0.94 0.67 0.10 Parents' highest SES at age 3/5 (compared with professional, non-manual) Other professional non-manual -1.84 0.82 -0.20 * Skilled non-manual -3.00 0.91 -0.33 *** Skilled manual -4.31 1.01 -0.47 *** Semi-skilled -4.96 1.05 -0.54 *** Unskilled -6.02 1.54 -0.66 *** Never worked -2.30 1.49 -0.25 Missing -7.88 3.65 -0.86 *
* p<0.05, ** p<0.01, *** p<0.001
140

Fixed Effects GCSE maths
Coef. SE ES Sig Parents' highest qualifications level at age 3/5 (compared with none) Vocational 1.54 0.78 0.17 * Academic age 16 1.83 0.63 0.20 ** Academic age 18 3.81 0.83 0.42 *** Other professional 4.43 1.64 0.48 ** Degree 5.93 0.85 0.65 *** Higher degree 6.77 1.13 0.74 *** Absent father or missing mother's -0.61 2.79 -0.07 Missing -14.73 6.68 -1.61 * Early years HLE (compared with 0-13) 14-19 0.96 0.75 0.10 20-24 1.44 0.76 0.16 25-32 2.07 0.76 0.23 ** >33 4.08 0.91 0.45 *** Missing 3.70 1.45 0.40 * KS1 HLE outing (compared with low) KS1 HLE outing medium 1.03 0.50 0.11 * KS1 HLE outing high 0.73 0.82 0.08 KS2 HLE educational computing (compared with low) KS2 HLE educational computing medium 1.40 0.44 0.15 ** KS2 HLE educational computing high 0.81 0.71 0.09 KS3 HLE academic enrichment (compared with low) KS3 HLE academic enrichment medium 2.38 0.44 0.26 *** KS3 HLE academic enrichment high 4.28 0.61 0.47 *** % White British neighbourhood (continuous) -0.03 0.01 -0.15 *
Intercept 36.30 1.37 *** Variance-school level 3.58 1.34 ***
Variance-student level 83.48 2.56 *** Total variance 87.06
Number of students 2535 Number of schools 675
Deviance (-2 x Log Restricted-Likelihood) 18393.63 Intra-school correlation (ICC) 0.0411
% Reduction student variance 18.6 % Reduction school variance 86.0
% Reduction total variance 32.0 * p<0.05, ** p<0.01, *** p<0.001
141

Table A4.6: Contextualised model for grade achieved in full GCSE maths in Year 11- Mother’s and
Father’s highest qualification level
Fixed Effects GCSE maths
Coef. SE ES Sig Age 0.19 0.05 0.14 *** Gender -0.51 0.39 -0.06 Ethnic group (compared with White UK) White European Heritage 1.10 1.07 0.12 Black Caribbean Heritage 1.57 1.11 0.17 Black African Heritage 0.72 1.53 0.08 Any Other Ethnic Minority 3.92 1.29 0.43 ** Indian 5.00 1.42 0.55 *** Pakistani 2.80 1.16 0.31 * Bangladeshi 4.02 2.02 0.44 * Mixed Race 0.94 0.88 0.10 Early behavioural problems (compared with none) 1+ Behavioural problem -2.33 0.59 -0.26 *** Early health problem (compared with none) 1+ Health problem -1.41 0.42 -0.15 *** Number of siblings at age 3/5(compared with none) 1 sibling 0.46 0.52 0.05 2 siblings -0.61 0.56 -0.07 3 + siblings -1.51 0.68 -0.17 * Missing 0.43 3.57 0.05 Mother's age at age 3/5 0.59 0.31 0.09 Year 11 FSM (compared with no) -3.24 0.56 -0.36 *** KS1 family salary (compared with no earned salary) £2500-15000 -0.05 0.65 -0.01 £17500-27500 1.04 0.71 0.11 £30000-3500 1.08 0.80 0.12 £37500-66000 1.81 0.74 0.20 * £67500-132000 1.99 1.07 0.22 Missing 0.89 0.67 0.10 Parents' highest SES at age 3/5 (compared with professional, non-manual) Other professional non-manual -1.34 0.83 -0.15 Skilled non-manual -2.54 0.92 -0.28 ** Skilled manual -3.75 1.03 -0.41 *** Semi-skilled -4.29 1.07 -0.47 *** Unskilled -5.29 1.56 -0.58 *** Never worked -1.63 1.51 -0.18 Missing -7.09 3.65 -0.78 Mother's highest qualifications level at age 3/5 (compared with none) Vocational 1.07 0.71 0.12 Academic age 16 2.39 0.58 0.26 *** Academic age 18 3.24 0.86 0.36 *** Degree or higher degree 4.88 0.88 0.54 *** Other professional 5.18 1.72 0.57 ** Missing -0.51 1.92 -0.06
* p<0.05, ** p<0.01, *** p<0.001
142
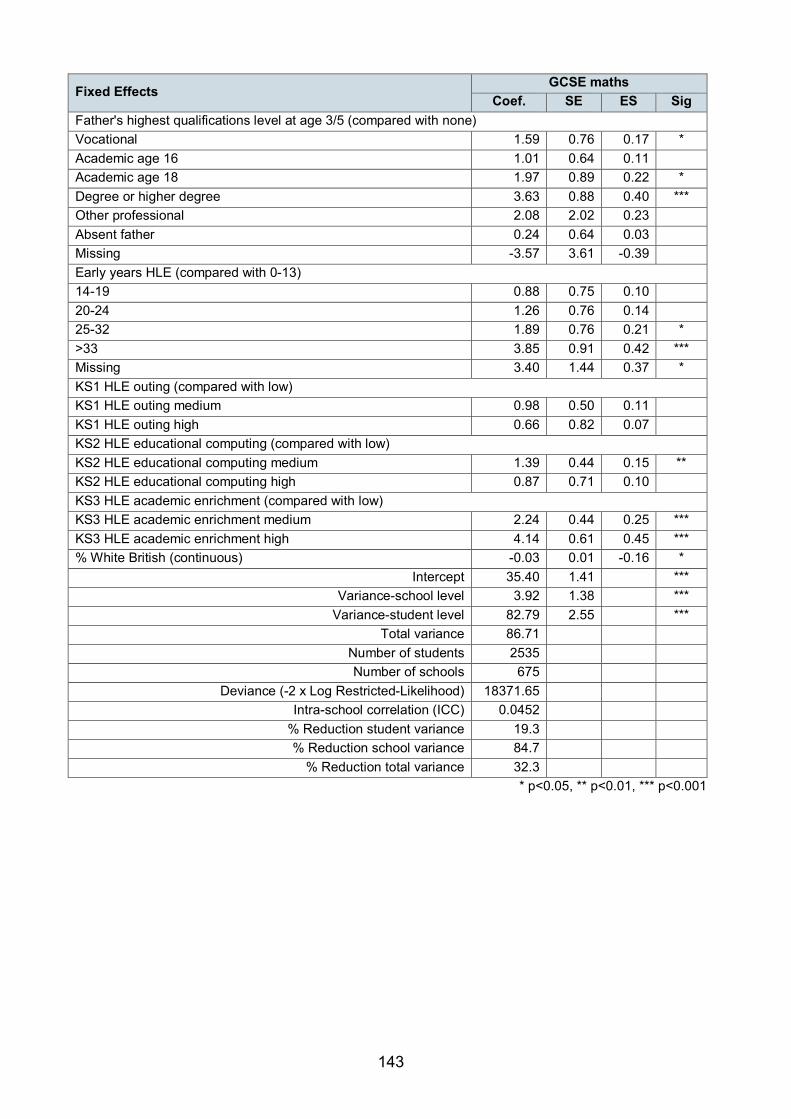
Fixed Effects GCSE maths
Coef. SE ES Sig Father's highest qualifications level at age 3/5 (compared with none) Vocational 1.59 0.76 0.17 * Academic age 16 1.01 0.64 0.11 Academic age 18 1.97 0.89 0.22 * Degree or higher degree 3.63 0.88 0.40 *** Other professional 2.08 2.02 0.23 Absent father 0.24 0.64 0.03 Missing -3.57 3.61 -0.39 Early years HLE (compared with 0-13) 14-19 0.88 0.75 0.10 20-24 1.26 0.76 0.14 25-32 1.89 0.76 0.21 * >33 3.85 0.91 0.42 *** Missing 3.40 1.44 0.37 * KS1 HLE outing (compared with low) KS1 HLE outing medium 0.98 0.50 0.11 KS1 HLE outing high 0.66 0.82 0.07 KS2 HLE educational computing (compared with low) KS2 HLE educational computing medium 1.39 0.44 0.15 ** KS2 HLE educational computing high 0.87 0.71 0.10 KS3 HLE academic enrichment (compared with low) KS3 HLE academic enrichment medium 2.24 0.44 0.25 *** KS3 HLE academic enrichment high 4.14 0.61 0.45 *** % White British (continuous) -0.03 0.01 -0.16 *
Intercept 35.40 1.41 *** Variance-school level 3.92 1.38 ***
Variance-student level 82.79 2.55 *** Total variance 86.71
Number of students 2535 Number of schools 675
Deviance (-2 x Log Restricted-Likelihood) 18371.65 Intra-school correlation (ICC) 0.0452
% Reduction student variance 19.3 % Reduction school variance 84.7
% Reduction total variance 32.3 * p<0.05, ** p<0.01, *** p<0.001
143

Table A4.7: Contextualised model for total number of full GCSE entries in Year 11- Parents’ highest
qualification level
Fixed Effects Total no. of full GCSE entries
Coef. SE ES Sig Gender 0.21 0.09 0.11 * Ethnic group (compared with White UK) White European heritage 0.05 0.25 0.03 Black Caribbean heritage 0.20 0.25 0.10 Black African heritage 0.16 0.36 0.08 Any other ethnic minority 1.05 0.31 0.53 *** Indian 0.73 0.33 0.37 * Pakistani 0.58 0.29 0.29 * Bangladeshi 1.15 0.47 0.58 * Mixed Race -0.09 0.20 -0.05 Birth weight (compared with normal, i.e. > 2500g) Fetal infant < 1500g -0.78 0.38 -0.39 * Low birth weight 1501-2500g -0.14 0.17 -0.07 Missing 0.64 0.37 0.32 Early behavioural problems (compared with none) 1+ Behavioural problem -0.59 0.13 -0.30 *** Early health problems (compared with none) 1+ Health problem -0.24 0.10 -0.12 * Number of siblings at age 3/5 (compared with none) 1 sibling -0.12 0.12 -0.06 2 siblings -0.15 0.13 -0.08 3 + siblings -0.65 0.15 -0.33 *** Missing -0.66 0.74 -0.33 Year 11 FSM (compared with no) -0.45 0.12 -0.23 *** KS1 family salary (compared with no earned salary) £2500-15000 0.25 0.15 0.12 £17500-27500 0.45 0.16 0.23 ** £30000-35000 0.64 0.18 0.32 *** £37500-66000 0.59 0.17 0.30 *** £67500-132000 1.04 0.29 0.52 *** Missing 0.35 0.15 0.17 * Parents' highest SES at age 3/5 (compared with professional, non-manual) Other professional non-manual 0.00 0.22 0.00 Skilled non-manual -0.22 0.23 -0.11 Skilled manual -0.71 0.25 -0.36 ** Semi-skilled -0.51 0.26 -0.25 Unskilled -1.15 0.36 -0.58 ** Never worked -0.13 0.35 -0.06 Missing -0.32 0.70 -0.16
* p<0.05, ** p<0.01, *** p<0.001
144

Fixed Effects Total no. of full GCSE entries
Coef. SE ES Sig Parents' highest qualifications level at age 3/5 (compared with none) Vocational 0.24 0.18 0.12 Academic age 16 0.24 0.14 0.12 Academic age 18 0.45 0.19 0.23 * Other professional 0.60 0.37 0.30 Degree 0.80 0.20 0.40 *** Higher degree 0.72 0.28 0.36 * Absent father or missing mother's 0.86 0.61 0.43 Missing -0.70 0.92 -0.35 Early years HLE (compared with 0-13) 14-19 0.51 0.17 0.26 ** 20-24 0.48 0.17 0.24 ** 25-32 0.70 0.17 0.35 *** >33 1.01 0.21 0.51 *** Missing 0.68 0.33 0.34 * KS1HLE educational computing (compared with low) KS1 HLE educational computing medium 0.25 0.11 0.13 * KS1 HLE educational computing high 0.04 0.16 0.02 KS2 HLE educational computing (compared with low) KS2 HLE educational computing medium 0.27 0.10 0.13 ** KS2 HLE educational computing high 0.15 0.17 0.08 KS3 HLE computer (compared with low) KS3 HLE computer medium 0.22 0.11 0.11 * KS3 HLE computer high 0.29 0.14 0.15 * KS3 HLE academic enrichment (compared with low) KS3 HLE academic enrichment medium 0.61 0.11 0.31 *** KS3 HLE academic enrichment high 0.86 0.15 0.43 *** FSM school level (continuous) -0.04 0.01 -0.55 *** % White British neighbourhood (continuous) -0.01 0.00 -0.19 *
Intercept 5.76 0.33 *** Variance-school level 1.73 0.22 ***
Variance-student level 3.94 0.13 *** Total variance 5.67
Number of students 2510 Number of schools 614
Deviance (-2 x Log Restricted-Likelihood) 11092.77 Intra-school correlation (ICC) 0.3047
% Reduction student variance 11.4 % Reduction school variance 61.9
% Reduction total variance 36.9 * p<0.05, ** p<0.01, *** p<0.001
145

Table A4.8: Contextualised model for total number of full GCSE entries in Year 11 -Mother’s and
Father’s highest qualification level
Fixed Effects Total no. of full GCSE entries
Coef. SE ES Sig Gender 0.22 0.09 0.11 * Ethnic group (compared with White UK) White European Heritage 0.05 0.25 0.02 Black Caribbean Heritage 0.26 0.25 0.13 Black African Heritage 0.18 0.36 0.09 Any Other Ethnic Minority 1.03 0.31 0.52 *** Indian 0.77 0.33 0.39 * Pakistani 0.63 0.28 0.32 * Bangladeshi 1.24 0.46 0.63 ** Mixed Race -0.07 0.20 -0.03 Birth weight (compared with normal, i.e. > 2500g) Fetal infant < 1500g -0.80 0.38 -0.40 * Low birth weight 1501-2500g -0.10 0.17 -0.05 Missing 0.73 0.36 0.37 * Early behavioural problems (compared with none) 1+ Behavioural problem -0.53 0.13 -0.27 *** Early health problem (compared with none) 1+ Health problem -0.24 0.10 -0.12 * Number of siblings at age 3/5(compared with none) 1 sibling -0.13 0.12 -0.07 2 siblings -0.18 0.13 -0.09 3 + siblings -0.65 0.15 -0.33 *** Missing -0.34 0.69 -0.17 Year 11 FSM (compared with no) -0.44 0.12 -0.22 *** KS1 family salary (compared with no earned salary) £2500-15000 0.21 0.15 0.11 £17500-27500 0.37 0.16 0.19 * £30000-35000 0.56 0.18 0.28 ** £37500-66000 0.49 0.17 0.25 ** £67500-132000 0.91 0.29 0.46 ** Missing 0.32 0.15 0.16 * Parents' highest SES at age 3/5 (compared with professional, non-manual) Other professional non-manual 0.06 0.22 0.03 Skilled non-manual -0.15 0.24 -0.07 Skilled manual -0.63 0.25 -0.32 * Semi-skilled -0.36 0.26 -0.18 Unskilled -0.99 0.36 -0.50 ** Never worked 0.09 0.36 0.04 Missing -0.01 0.67 -0.00
* p<0.05, ** p<0.01, *** p<0.001
146

Fixed Effects Total no. of full GCSE entries
Coef. SE ES Sig Mother's highest qualifications level at age 3/5 (compared with none) Vocational 0.09 0.16 0.04 Academic age 16 0.21 0.13 0.11 Academic age 18 0.45 0.20 0.23 * Degree or higher degree 0.61 0.21 0.31 ** Other professional 0.40 0.40 0.20 Missing -0.08 0.35 -0.04 Father's highest qualifications level at age 3/5 (compared with none) Vocational 0.55 0.17 0.28 ** Academic age 16 0.32 0.14 0.16 * Academic age 18 0.26 0.21 0.13 Degree or higher degree 0.49 0.21 0.25 * Other professional 0.64 0.47 0.33 Absent father -0.06 0.14 -0.03 Missing -1.25 0.68 -0.63 Early years HLE (compared with 0-13) 14-19 0.48 0.17 0.24 ** 20-24 0.45 0.17 0.23 ** 25-32 0.66 0.17 0.33 *** >33 0.96 0.21 0.48 *** Missing 0.68 0.33 0.34 * KS1HLE educational computing (compared with low) KS1 HLE educational computing medium 0.24 0.11 0.12 * KS1 HLE educational computing high 0.06 0.16 0.03 KS2 HLE educational computing (compared with low) KS2 HLE educational computing medium 0.27 0.10 0.14 ** KS2 HLE educational computing high 0.15 0.16 0.08 KS3 HLE computer (compared with low) KS3 HLE computer medium 0.20 0.11 0.10 KS3 HLE computer high 0.30 0.14 0.15 * KS3 HLE academic enrichment (compared with low) KS3 HLE academic enrichment medium 0.58 0.11 0.30 *** KS3 HLE academic enrichment high 0.85 0.15 0.43 *** FSM school level (continuous) -0.03 0.01 -0.54 *** % White British (continuous) -0.01 0.00 -0.18 *
Intercept 5.66 0.34 *** Variance-school level 1.74 0.22 ***
Variance-student level 3.90 0.13 *** Total variance 5.65
Number of students 2510 Number of schools 614
Deviance (-2 x Log Restricted-Likelihood) 11080.81 Intra-school correlation (ICC) 0.3086
% Reduction student variance 12.2 % Reduction school variance 61.6
% Reduction total variance 37.1 * p<0.05, ** p<0.01, *** p<0.001
147

Table A4.9: Contextualised model for achieving 5 A*-C in Year 11 - Parents’ highest qualification
level
Fixed Effects Achieved 5 A*-C
Coef. SE OR Sig Age 0.01 0.01 1.01 Gender 0.37 0.10 1.45 *** Ethnic group (compared with White UK) White European Heritage -0.16 0.30 0.85 Black Caribbean Heritage 0.26 0.28 1.29 Black African Heritage -0.03 0.39 0.97 Any Other Ethnic Minority 0.56 0.34 1.75 Indian 0.72 0.39 2.06 Pakistani 0.22 0.30 1.24 Bangladeshi 0.88 0.53 2.41 Mixed Race -0.07 0.23 0.93 Early developmental problems (compared with none) 1+ Developmental problem -0.39 0.16 0.68 * Early behavioural problems (compared with none) 1+ Behavioural problem -0.43 0.15 0.65 ** Early health problems (compared with none) 1+ Health problem -0.46 0.12 0.63 *** Number of siblings at age 3/5 (compared with none) 1 sibling 0.13 0.14 1.14 2 siblings -0.08 0.15 0.93 3 + siblings -0.48 0.18 0.62 ** Missing -1.09 1.10 0.34 Mother's age at age 3/5 0.29 0.08 1.33 *** Year 11 FSM (compared with no) -0.49 0.15 0.61 *** KS1 family salary (compared with no earned salary) £2500-15000 0.08 0.17 1.08 £17500-27500 0.48 0.18 1.61 ** £30000-35000 0.46 0.21 1.59 * £37500-66000 0.57 0.20 1.76 ** £67500-132000 1.37 0.51 3.94 ** Missing 0.28 0.17 1.32 Parents' highest SES at age 3/5 (compared with Professional, Non-Manual) Other professional non-manual -0.02 0.30 0.99 Skilled non-manual -0.14 0.31 0.87 Skilled manual -0.69 0.32 0.50 * Semi-skilled -0.57 0.33 0.57 Unskilled -0.85 0.44 0.43 Never worked -0.00 0.42 1.00
* p<0.05, ** p<0.01, *** p<0.001
148

Fixed Effects Achieved 5 A*-C
Coef. SE OR Sig Parents' highest qualifications level at age 3/5 (compared with none) Vocational 0.34 0.20 1.40 Academic age 16 0.20 0.16 1.23 Academic age 18 0.52 0.21 1.68 * Other professional 1.20 0.45 3.32 ** Degree 1.21 0.24 3.36 *** Higher degree 1.28 0.42 3.58 ** Absent father or missing mother's 0.60 0.69 1.82 Early years HLE (compared with 0-13) 14-19 0.28 0.18 1.32 20-24 0.42 0.18 1.51 * 25-32 0.60 0.18 1.82 ** >33 1.28 0.25 3.61 *** KS1 HLE outing (compared with low) KS1 HLE outing medium 0.31 0.13 1.36 * KS1 HLE outing high 0.20 0.23 1.22 KS3 HLE academic enrichment (compared with low) KS3 HLE academic enrichment medium 0.75 0.12 2.12 *** KS3 HLE academic enrichment high 1.03 0.19 2.80 *** % White British neighbourhood (continuous) -0.01 0.00 0.99 ** FSM school level (continuous) -0.02 0.00 0.98 ***
Intercept -0.94 0.40 * Variance-school level 0.21 0.09 ***
Number of students 2429 Number of schools 601
Deviance (-2 x Log Restricted-Likelihood) 2569.47 % Reduction school variance 82.9
* p<0.05, ** p<0.01, *** p<0.001
149

Table A4.10: Contextualised model for achieving 5 A*-C in Year 11- Mother’s and Father’s highest
qualification level
Fixed Effects Achieved 5 A*-C
Coef. SE OR Sig Age 0.01 0.01 1.01 Gender 0.40 0.11 1.48 *** Ethnic group (compared with White UK) White European Heritage -0.16 0.31 0.85 Black Caribbean Heritage 0.31 0.28 1.36 Black African Heritage -0.00 0.39 1.00 Any Other Ethnic Minority 0.59 0.34 1.80 Indian 0.73 0.40 2.09 Pakistani 0.23 0.31 1.25 Bangladeshi 0.81 0.53 2.24 Mixed Race -0.05 0.24 0.95 Early developmental problems (compared with none) 1+ Developmental problem -0.37 0.16 0.69 * Early behavioural problems (compared with none) 1+ Behavioural problem -0.37 0.16 0.69 * Early health problem (compared with none) 1+ Health problem -0.46 0.12 0.63 *** Number of siblings at age 3/5(compared with none) 1 sibling 0.09 0.14 1.10 2 siblings -0.11 0.15 0.89 3 + siblings -0.48 0.18 0.62 ** Missing -1.00 1.10 0.37 Mother's age at age 3/5 0.26 0.08 1.30 ** Year 11 FSM (compared with no) -0.47 0.15 0.62 ** KS1 family salary (compared with no earned salary) £2500-15000 0.05 0.17 1.05 £17500-27500 0.41 0.18 1.50 * £30000-35000 0.37 0.21 1.44 £37500-66000 0.46 0.21 1.58 * £67500-132000 1.20 0.52 3.31 * Missing 0.24 0.17 1.27 Parents' highest SES at age 3/5 (compared with professional, non-manual) Other professional non-manual 0.07 0.32 1.08 Skilled non-manual -0.04 0.32 0.96 Skilled manual -0.59 0.34 0.56 Semi-skilled -0.39 0.34 0.68 Unskilled -0.60 0.45 0.55 Never worked 0.16 0.43 1.17 Mother's highest qualifications level at age 3/5 (compared with none) Vocational 0.15 0.18 1.16 Academic age 16 0.31 0.15 1.37 * Academic age 18 0.42 0.23 1.52 Degree or higher degree 1.14 0.28 3.14 *** Other professional 1.14 0.53 3.13 * Missing 0.46 0.46 1.58
* p<0.05, ** p<0.01, *** p<0.001
150

Fixed Effects Achieved 5 A*-C
Coef. SE OR Sig Father's highest qualifications level at age 3/5 (compared with none) Vocational 0.68 0.19 1.97 *** Academic age 16 0.38 0.16 1.46 * Academic age 18 0.53 0.24 1.70 * Degree or higher degree 0.91 0.27 2.48 *** Other professional 0.80 0.57 2.22 Absent father 0.06 0.16 1.06 Missing 0.72 0.89 2.05 Early years HLE (compared with 0-13) 14-19 0.28 0.18 1.32 20-24 0.41 0.19 1.51 * 25-32 0.57 0.19 1.77 ** >33 1.25 0.25 3.49 *** KS1 HLE outing (compared with low) KS1 HLE outing medium 0.28 0.13 1.32 * KS1 HLE outing high 0.15 0.24 1.16 KS3 HLE academic enrichment (compared with low) KS3 HLE academic enrichment medium 0.72 0.12 2.06 *** KS3 HLE academic enrichment high 1.02 0.19 2.77 *** % White British (continuous) -0.01 0.00 0.99 ** FSM school level (continuous) -0.02 0.00 0.98 ***
Intercept -1.22 0.41 ** Variance-school level 0.21 0.09 ***
Number of students 2429 Number of schools 601
Deviance (-2 x Log Restricted-Likelihood) 2545.09 % Reduction school variance 83.0
* p<0.05, ** p<0.01, *** p<0.001
151

Table A4.11: Contextualised model for achieving 5 A*-C including English and maths in Year 11 -
Parents’ highest qualification level
Fixed Effects Achieved 5 A*-C
including English and maths Coef. SE OR Sig
Age 0.04 0.01 1.04 ** Gender 0.22 0.10 1.24 * Ethnic group (compared with White UK) White European Heritage 0.24 0.27 1.27 Black Caribbean Heritage 0.53 0.26 1.70 * Black African Heritage -0.22 0.37 0.80 Any Other Ethnic Minority 0.40 0.32 1.50 Indian 0.83 0.38 2.28 * Pakistani 0.66 0.28 1.94 * Bangladeshi 0.70 0.49 2.02 Mixed Race 0.03 0.22 1.03 Early developmental problems (compared with none) 1+ Developmental problem -0.40 0.15 0.67 ** Early behavioural problems (compared with none) 1+ Behavioural problem -0.47 0.15 0.63 ** Number of siblings at age 3/5 (compared with none) 1 sibling 0.12 0.13 1.12 2 siblings -0.08 0.14 0.92 3 + siblings -0.38 0.17 0.69 * Missing -0.32 0.39 0.72 Year 11 FSM (compared with no) -0.68 0.14 0.51 *** KS1 family salary (compared with no earned salary) £2500-15000 0.07 0.16 1.08 £17500-27500 0.37 0.17 1.45 * £30000-35000 0.45 0.20 1.57 * £37500-66000 0.67 0.19 1.95 *** £67500-132000 0.54 0.30 1.71 Missing 0.50 0.16 1.64 ** Parents' highest SES at age 3/5 (compared with Professional, Non-Manual) Other professional non-manual 0.04 0.24 1.04 Skilled non-manual -0.11 0.25 0.90 Skilled manual -0.52 0.27 0.59 * Semi-skilled -0.54 0.27 0.58 * Unskilled -0.88 0.40 0.42 * Never worked -0.04 0.37 0.96 Parents' highest qualifications level at age 3/5 (compared with none) Vocational 0.34 0.19 1.41 Academic age 16 0.38 0.15 1.46 * Academic age 18 0.63 0.20 1.87 ** Other professional 1.09 0.42 2.97 * Degree 1.37 0.22 3.92 *** Higher degree 1.05 0.32 2.86 *** Absent father or missing mother's 1.04 0.65 2.84
* p<0.05, ** p<0.01, *** p<0.001
152
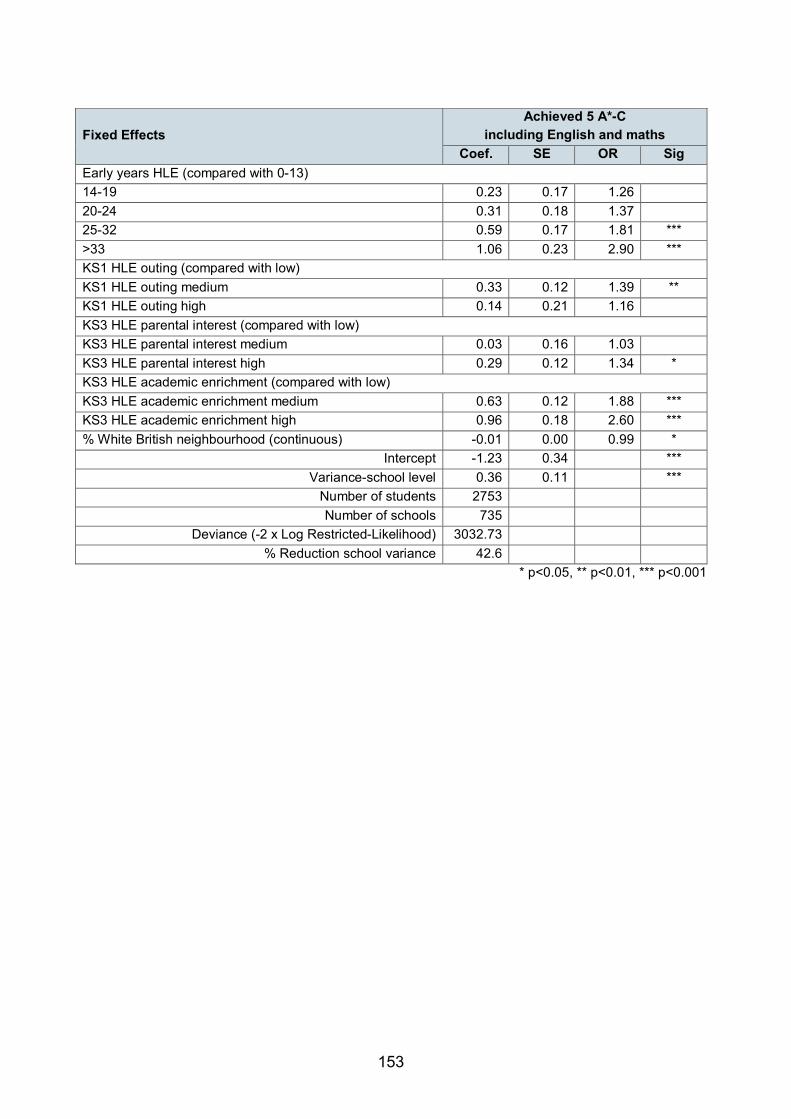
Fixed Effects Achieved 5 A*-C
including English and maths Coef. SE OR Sig
Early years HLE (compared with 0-13) 14-19 0.23 0.17 1.26 20-24 0.31 0.18 1.37 25-32 0.59 0.17 1.81 *** >33 1.06 0.23 2.90 *** KS1 HLE outing (compared with low) KS1 HLE outing medium 0.33 0.12 1.39 ** KS1 HLE outing high 0.14 0.21 1.16 KS3 HLE parental interest (compared with low) KS3 HLE parental interest medium 0.03 0.16 1.03 KS3 HLE parental interest high 0.29 0.12 1.34 * KS3 HLE academic enrichment (compared with low) KS3 HLE academic enrichment medium 0.63 0.12 1.88 *** KS3 HLE academic enrichment high 0.96 0.18 2.60 *** % White British neighbourhood (continuous) -0.01 0.00 0.99 *
Intercept -1.23 0.34 *** Variance-school level 0.36 0.11 ***
Number of students 2753 Number of schools 735
Deviance (-2 x Log Restricted-Likelihood) 3032.73 % Reduction school variance 42.6
* p<0.05, ** p<0.01, *** p<0.001
153

Table A4.12: Contextualised model for achieving 5 A*-C including English and maths in Year 11 -
Mother’s and Father’s highest qualification level)
Fixed Effects Achieved 5 A*-C
including English and maths Coef. SE OR Sig
Age 0.04 0.01 1.04 ** Gender 0.23 0.10 1.26 * Ethnic group (compared with White UK) White European Heritage 0.25 0.28 1.28 Black Caribbean Heritage 0.55 0.27 1.74 * Black African Heritage -0.18 0.38 0.84 Any Other Ethnic Minority 0.43 0.32 1.54 Indian 0.88 0.38 2.41 * Pakistani 0.76 0.28 2.15 ** Bangladeshi 0.83 0.48 2.30 Mixed Race 0.05 0.22 1.06 Early developmental problems (compared with none) 1+ Developmental problem -0.38 0.15 0.68 ** Early behavioural problems (compared with none) 1+ Behavioural problem -0.43 0.15 0.65 ** Number of siblings at age 3/5 (compared with none) 1 sibling 0.11 0.13 1.12 2 siblings -0.08 0.14 0.92 3 + siblings -0.36 0.17 0.70 * Missing 0.06 0.70 1.06 Year 11 FSM (compared with no) -0.67 0.14 0.51 *** KS1 family salary (compared with no earned salary) £2500-15000 0.05 0.16 1.05 £17500-27500 0.32 0.17 1.38 £30000-35000 0.41 0.20 1.50 * £37500-66000 0.60 0.19 1.82 ** £67500-132000 0.36 0.31 1.43 Missing 0.47 0.16 1.60 ** Parents' highest SES at age 3/5 (compared with professional, non-manual) Other professional non-manual 0.17 0.24 1.19 Skilled non-manual 0.03 0.25 1.03 Skilled manual -0.36 0.27 0.69 Semi-skilled -0.37 0.28 0.69 Unskilled -0.66 0.40 0.52 Never worked 0.16 0.38 1.17 Mother's highest qualifications level at age 3/5 (compared with none) Vocational 0.27 0.17 1.30 Academic age 16 0.40 0.14 1.49 ** Academic age 18 0.65 0.22 1.91 ** Degree or higher degree 1.12 0.24 3.06 *** Other professional 1.41 0.53 4.11 ** Missing 0.08 0.38 1.09
* p<0.05, ** p<0.01, *** p<0.001
154
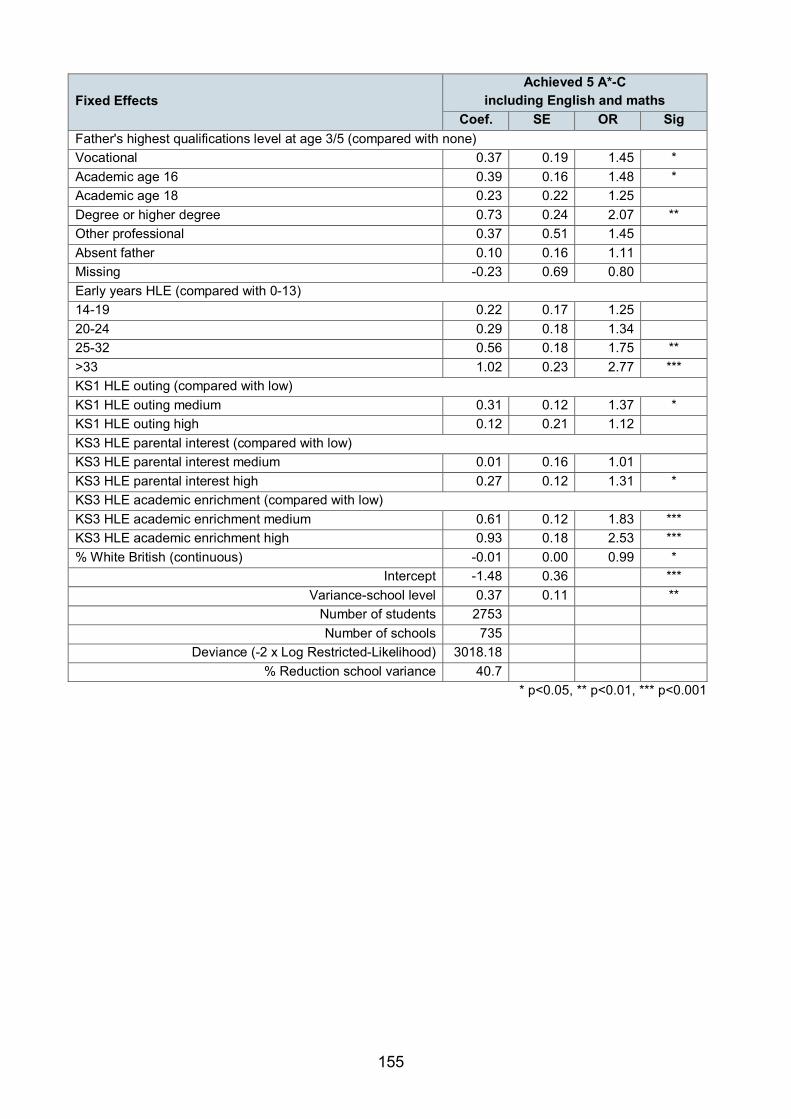
Fixed Effects Achieved 5 A*-C
including English and maths Coef. SE OR Sig
Father's highest qualifications level at age 3/5 (compared with none) Vocational 0.37 0.19 1.45 * Academic age 16 0.39 0.16 1.48 * Academic age 18 0.23 0.22 1.25 Degree or higher degree 0.73 0.24 2.07 ** Other professional 0.37 0.51 1.45 Absent father 0.10 0.16 1.11 Missing -0.23 0.69 0.80 Early years HLE (compared with 0-13) 14-19 0.22 0.17 1.25 20-24 0.29 0.18 1.34 25-32 0.56 0.18 1.75 ** >33 1.02 0.23 2.77 *** KS1 HLE outing (compared with low) KS1 HLE outing medium 0.31 0.12 1.37 * KS1 HLE outing high 0.12 0.21 1.12 KS3 HLE parental interest (compared with low) KS3 HLE parental interest medium 0.01 0.16 1.01 KS3 HLE parental interest high 0.27 0.12 1.31 * KS3 HLE academic enrichment (compared with low) KS3 HLE academic enrichment medium 0.61 0.12 1.83 *** KS3 HLE academic enrichment high 0.93 0.18 2.53 *** % White British (continuous) -0.01 0.00 0.99 *
Intercept -1.48 0.36 *** Variance-school level 0.37 0.11 **
Number of students 2753 Number of schools 735
Deviance (-2 x Log Restricted-Likelihood) 3018.18 % Reduction school variance 40.7
* p<0.05, ** p<0.01, *** p<0.001
155

Table A4.13: Contextualised model for achieving EBacc in Year 11 - Parents’ highest qualification
level
Fixed Effects Achieved EBacc
Coef. SE OR Sig Age 0.03 0.02 1.03 Gender 0.55 0.15 1.74 *** Ethnic group (compared with White UK) White European Heritage 0.14 0.40 1.15 Black Caribbean Heritage -0.18 0.47 0.83 Black African Heritage -0.41 0.61 0.67 Any Other Ethnic Minority 0.72 0.46 2.06 Indian 0.38 0.49 1.46 Pakistani 0.45 0.46 1.56 Bangladeshi 0.89 0.74 2.44 Mixed Race 0.07 0.32 1.07 Mother's age at age 3/5 0.33 0.12 1.39 ** Year 11 FSM (compared with no) -0.31 0.27 0.73 KS1 family salary (compared with no earned salary) £2500-15000 0.37 0.30 1.44 £17500-27500 0.67 0.30 1.96 * £30000-35000 0.85 0.32 2.33 ** £37500-66000 0.72 0.30 2.06 * £67500-132000 1.40 0.39 4.04 *** Missing 0.03 0.31 1.03 Parents' highest SES at age 3/5 (compared with Professional, Non-Manual) Other professional non-manual 0.04 0.25 1.04 Skilled non-manual -0.06 0.29 0.94 Skilled manual -0.90 0.38 0.41 * Semi-skilled -0.54 0.41 0.58 Unskilled -0.61 0.72 0.54 Never worked 0.04 0.58 1.04 Parents' highest qualifications level at age 3/5 (compared with none) Vocational -0.05 0.35 0.95 Academic age 16 -0.25 0.30 0.78 Academic age 18 0.36 0.34 1.44 Other professional 0.36 0.57 1.43 Degree 0.82 0.34 2.28 * Higher degree 1.04 0.41 2.83 * KS1HLE educational computing (compared with low) KS1 HLE educational computing medium -0.10 0.17 0.90 KS1 HLE educational computing high -0.67 0.30 0.51 * KS3 HLE academic enrichment (compared with low) KS3 HLE academic enrichment medium 0.65 0.16 1.92 *** KS3 HLE academic enrichment high 1.36 0.20 3.89 *** % White British neighbourhood (continuous) -0.01 0.00 0.99 * FSM school level (continuous) -0.04 0.01 0.96 ***
* p<0.05, ** p<0.01, *** p<0.001
156

Model statistics Achieved EBacc
Coef. SE OR Sig Intercept -3.16 0.45 ***
Variance-school level 0.52 0.20 Number of students 2255 Number of schools 584
Deviance (-2 x Log Restricted-Likelihood) 1505.62 % Reduction school variance 77.3
* p<0.05, ** p<0.01, *** p<0.001
157

Table A4.14: Contextualised model for achieving EBacc in Year 11 - Mother’s and Father’s highest
qualification level
Fixed Effects Achieved EBacc
Coef. SE OR Sig Age 0.03 0.02 1.03 Gender 0.58 0.15 1.78 *** Ethnic group (compared with White UK) White European Heritage 0.12 0.41 1.13 Black Caribbean Heritage -0.14 0.48 0.87 Black African Heritage -0.50 0.64 0.60 Any Other Ethnic Minority 0.75 0.47 2.11 Indian 0.40 0.50 1.49 Pakistani 0.50 0.47 1.64 Bangladeshi 0.87 0.73 2.38 Mixed Race 0.03 0.33 1.03 Mother's age at age 3/5 0.30 0.12 1.34 * Year 11 FSM (compared with no) -0.32 0.27 0.73 KS1 family salary (compared with no earned salary) £2500-15000 0.28 0.30 1.32 £17500-27500 0.58 0.30 1.78 £30000-35000 0.69 0.32 1.99 * £37500-66000 0.56 0.30 1.75 £67500-132000 1.15 0.39 3.16 ** Missing -0.04 0.31 0.96 Parents' highest SES at age 3/5 (compared with professional, non-manual) Other professional non-manual 0.20 0.26 1.22 Skilled non-manual 0.16 0.30 1.17 Skilled manual -0.73 0.39 0.48 Semi-skilled -0.24 0.43 0.79 Unskilled -0.25 0.73 0.78 Never worked 0.34 0.60 1.41 Mother's highest qualifications level at age 3/5 (compared with none) Vocational -0.18 0.30 0.84 Academic age 16 -0.23 0.26 0.79 Academic age 18 0.23 0.33 1.26 Degree or higher degree 0.61 0.32 1.84 Other professional 0.33 0.56 1.39 Father's highest qualifications level at age 3/5 (compared with none) Vocational 0.77 0.31 2.15 * Academic age 16 0.38 0.29 1.46 Academic age 18 0.77 0.35 2.16 * Degree or higher degree 1.15 0.33 3.16 *** Other professional 0.85 0.68 2.33 Absent father 0.13 0.31 1.14 KS1HLE educational computing (compared with low) KS1 HLE educational computing medium -0.11 0.18 0.90 KS1 HLE educational computing high -0.64 0.30 0.53 *
* p<0.05, ** p<0.01, *** p<0.001
158

Fixed Effects Achieved EBacc
Coef. SE OR Sig KS3 HLE academic enrichment (compared with low) KS3 HLE academic enrichment medium 0.61 0.16 1.84 *** KS3 HLE academic enrichment high 1.34 0.20 3.81 *** % White British (continuous) -0.01 0.00 0.99 FSM school level (continuous) -0.04 0.01 0.96 ***
Intercept -3.62 0.48 *** Variance-school level 0.58 0.22
Number of students 2255 Number of schools 584
Deviance (-2 x Log Restricted-Likelihood) 1490.59 % Reduction school variance 74.4
* p<0.05, ** p<0.01, *** p<0.001
159
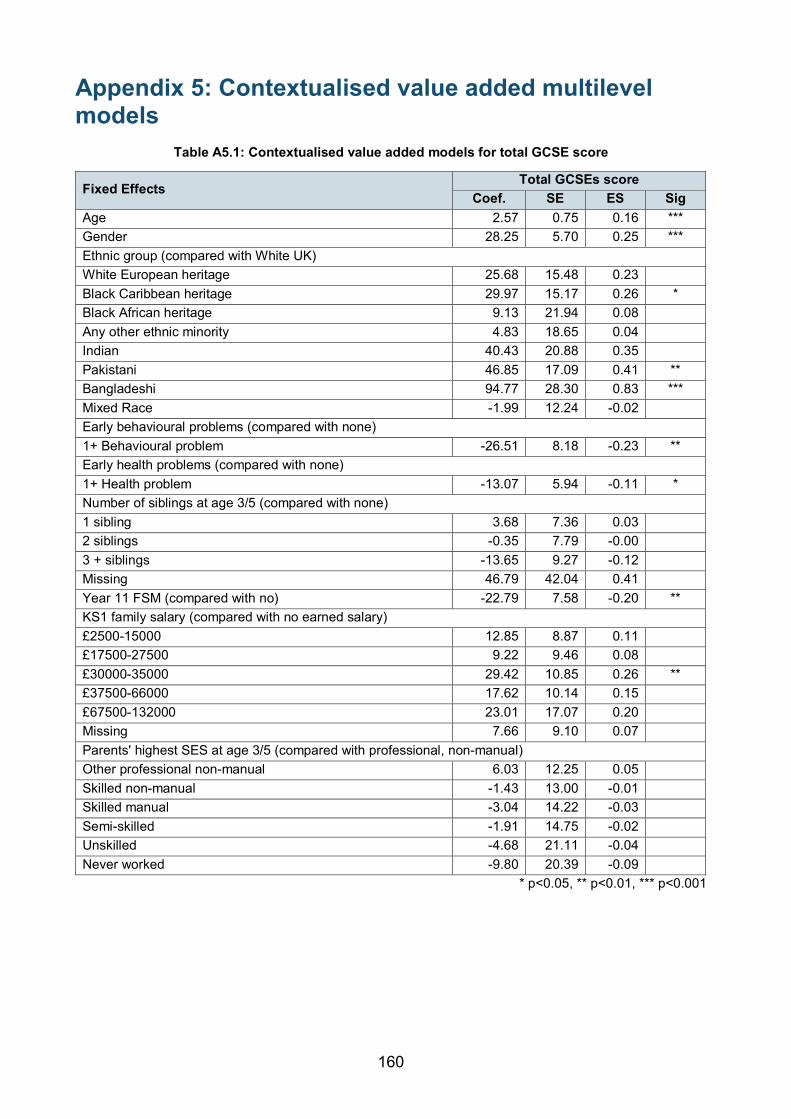
Appendix 5: Contextualised value added multilevel models
Table A5.1: Contextualised value added models for total GCSE score
Fixed Effects Total GCSEs score
Coef. SE ES Sig Age 2.57 0.75 0.16 *** Gender 28.25 5.70 0.25 *** Ethnic group (compared with White UK) White European heritage 25.68 15.48 0.23 Black Caribbean heritage 29.97 15.17 0.26 * Black African heritage 9.13 21.94 0.08 Any other ethnic minority 4.83 18.65 0.04 Indian 40.43 20.88 0.35 Pakistani 46.85 17.09 0.41 ** Bangladeshi 94.77 28.30 0.83 *** Mixed Race -1.99 12.24 -0.02 Early behavioural problems (compared with none) 1+ Behavioural problem -26.51 8.18 -0.23 ** Early health problems (compared with none) 1+ Health problem -13.07 5.94 -0.11 * Number of siblings at age 3/5 (compared with none) 1 sibling 3.68 7.36 0.03 2 siblings -0.35 7.79 -0.00 3 + siblings -13.65 9.27 -0.12 Missing 46.79 42.04 0.41 Year 11 FSM (compared with no) -22.79 7.58 -0.20 ** KS1 family salary (compared with no earned salary) £2500-15000 12.85 8.87 0.11 £17500-27500 9.22 9.46 0.08 £30000-35000 29.42 10.85 0.26 ** £37500-66000 17.62 10.14 0.15 £67500-132000 23.01 17.07 0.20 Missing 7.66 9.10 0.07 Parents' highest SES at age 3/5 (compared with professional, non-manual) Other professional non-manual 6.03 12.25 0.05 Skilled non-manual -1.43 13.00 -0.01 Skilled manual -3.04 14.22 -0.03 Semi-skilled -1.91 14.75 -0.02 Unskilled -4.68 21.11 -0.04 Never worked -9.80 20.39 -0.09
* p<0.05, ** p<0.01, *** p<0.001
160

Fixed Effects Total GCSEs score
Coef. SE ES Sig Parents' highest qualifications level at age 3/5 (compared with none) Vocational 18.20 10.80 0.16 Academic age 16 29.30 8.48 0.26 *** Academic age 18 31.00 11.38 0.27 ** Other professional 13.55 21.47 0.12 Degree 35.94 11.88 0.32 ** Higher degree 44.19 16.55 0.39 ** Absent father or missing mother's -8.11 36.79 -0.07 Missing -66.13 44.04 -0.58 Early years HLE (compared with 0-13) 14-19 -8.16 9.64 -0.07 20-24 -13.93 9.82 -0.12 25-32 -4.35 9.80 -0.04 >33 1.50 12.17 0.01 KS1HLE educational computing (compared with low) KS1 HLE educational computing medium 3.22 6.43 0.03 KS1 HLE educational computing high -3.94 9.34 -0.03 KS3 HLE academic enrichment (compared with low) KS3 HLE academic enrichment medium 28.26 5.96 0.25 *** KS3 HLE academic enrichment high 41.10 8.57 0.36 *** FSM school level (continuous) 0.39 0.34 0.11 % White British (continuous) -0.24 0.20 -0.10 Year 6 English 2.11 0.26 0.55 *** Year 6 maths 3.33 0.25 0.87 ***
Intercept -143.93 28.50 *** Variance-school level 7789.70 911.87 ***
Variance-student level 13013.32 446.36 *** Total variance 20803.02
Number of students 2367 Number of schools 590
Deviance (-2 x Log Restricted-Likelihood) 29353.50 Intra-school correlation (ICC) 0.3745
% Reduction student variance 37.8 % Reduction school variance 27.4
% Reduction total variance 34.3 * p<0.05, ** p<0.01, *** p<0.001
161

Table A5.2: Contextualised value added models for GCSE English
Fixed Effects GCSE English
Coef. SE ES Sig Age 0.16 0.04 0.18 *** Gender 1.58 0.27 0.27 *** Ethnic group (compared with White UK) White European heritage 1.06 0.79 0.18 Black Caribbean heritage 0.28 0.76 0.05 Black African heritage 0.19 1.05 0.03 Any other ethnic minority 1.68 0.89 0.28 Indian 2.35 1.01 0.40 * Pakistani 1.65 0.82 0.28 * Bangladeshi 3.92 1.40 0.66 ** Mixed Race 0.74 0.62 0.12 Early behavioural problems (compared with none) 1+ Behavioural problem -0.81 0.41 -0.14 Early health problems (compared with none) 1+ Health problem -0.72 0.30 -0.12 * Number of siblings at age 3/5 (compared with none) 1 sibling 0.51 0.36 0.08 2 siblings 0.06 0.39 0.01 3 + siblings -1.06 0.47 -0.18 * Missing 1.38 2.37 0.23 Mother's age 0.53 0.22 0.12 * Year 11 FSM (compared with no) -1.04 0.39 -0.17 ** KS1 family salary (compared with no earned salary) £2500-15000 0.23 0.45 0.04 £17500-27500 0.92 0.48 0.15 £30000-35000 1.41 0.55 0.24 * £37500-66000 0.84 0.51 0.14 £67500-132000 2.00 0.85 0.34 * Missing 0.78 0.44 0.13 Parents' highest SES at age 3/5 (compared with professional, non-manual) Other professional non-manual -1.04 0.62 -0.17 Skilled non-manual -1.15 0.67 -0.19 Skilled manual -1.48 0.74 -0.25 * Semi-skilled -1.73 0.76 -0.29 * Unskilled -1.38 1.07 -0.23 Never worked 0.37 1.05 0.06 Missing -2.15 2.83 -0.36
* p<0.05, ** p<0.01, *** p<0.001
162
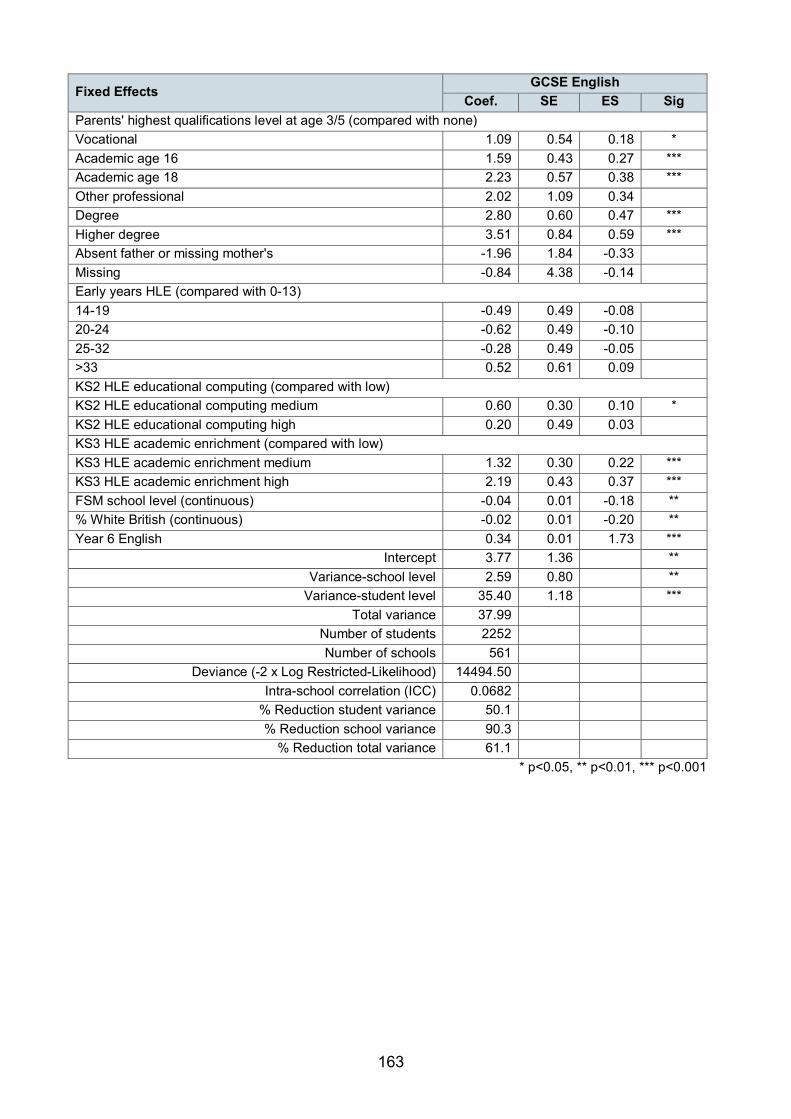
Fixed Effects GCSE English
Coef. SE ES Sig Parents' highest qualifications level at age 3/5 (compared with none) Vocational 1.09 0.54 0.18 * Academic age 16 1.59 0.43 0.27 *** Academic age 18 2.23 0.57 0.38 *** Other professional 2.02 1.09 0.34 Degree 2.80 0.60 0.47 *** Higher degree 3.51 0.84 0.59 *** Absent father or missing mother's -1.96 1.84 -0.33 Missing -0.84 4.38 -0.14 Early years HLE (compared with 0-13) 14-19 -0.49 0.49 -0.08 20-24 -0.62 0.49 -0.10 25-32 -0.28 0.49 -0.05 >33 0.52 0.61 0.09 KS2 HLE educational computing (compared with low) KS2 HLE educational computing medium 0.60 0.30 0.10 * KS2 HLE educational computing high 0.20 0.49 0.03 KS3 HLE academic enrichment (compared with low) KS3 HLE academic enrichment medium 1.32 0.30 0.22 *** KS3 HLE academic enrichment high 2.19 0.43 0.37 *** FSM school level (continuous) -0.04 0.01 -0.18 ** % White British (continuous) -0.02 0.01 -0.20 ** Year 6 English 0.34 0.01 1.73 ***
Intercept 3.77 1.36 ** Variance-school level 2.59 0.80 **
Variance-student level 35.40 1.18 *** Total variance 37.99
Number of students 2252 Number of schools 561
Deviance (-2 x Log Restricted-Likelihood) 14494.50 Intra-school correlation (ICC) 0.0682
% Reduction student variance 50.1 % Reduction school variance 90.3
% Reduction total variance 61.1 * p<0.05, ** p<0.01, *** p<0.001
163

Table A5.3: Contextualised value added models for GCSE maths
Fixed Effects GCSE maths
Coef. SE ES Sig Age 0.17 0.04 0.20 *** Gender 0.78 0.28 0.13 ** Ethnic group (compared with White UK) White European heritage 1.74 0.81 0.28 * Black Caribbean heritage 0.73 0.77 0.12 Black African heritage 2.34 1.07 0.38 * Any other ethnic minority 3.62 0.91 0.59 *** Indian 2.24 1.01 0.37 * Pakistani 2.59 0.81 0.42 ** Bangladeshi 5.42 1.44 0.88 *** Mixed Race 1.28 0.63 0.21 * Early behavioural problems (compared with none) 1+ Behavioural problem -1.11 0.42 -0.18 ** Early health problems (compared with none) 1+ Health problem -1.28 0.30 -0.21 *** Number of siblings at age 3/5 (compared with none) 1 sibling 0.29 0.37 0.05 2 siblings -0.37 0.40 -0.06 3 + siblings -0.82 0.48 -0.13 Missing -0.81 2.45 -0.13 Mother's age 0.66 0.22 0.14 ** Year 11 FSM (compared with no) -1.74 0.39 -0.28 *** KS1 family salary (compared with no earned salary) £2500-15000 0.52 0.46 0.08 £17500-27500 0.53 0.49 0.09 £30000-35000 1.26 0.56 0.21 * £37500-66000 0.75 0.52 0.12 £67500-132000 1.51 0.81 0.25 Missing 0.05 0.48 0.01 Parents' highest SES at age 3/5 (compared with professional, non-manual) Other professional non-manual -0.81 0.62 -0.13 Skilled non-manual -1.05 0.67 -0.17 Skilled manual -0.74 0.74 -0.12 Semi-skilled -1.32 0.76 -0.21 Unskilled -2.58 1.10 -0.42 * Never worked -0.07 1.06 -0.01 Missing -2.53 2.51 -0.41
* p<0.05, ** p<0.01, *** p<0.001
164

Fixed Effects GCSE maths
Coef. SE ES Sig Parents' highest qualifications level at age 3/5 (compared with none) Vocational 1.19 0.55 0.19 * Academic age 16 1.16 0.44 0.19 ** Academic age 18 2.06 0.58 0.33 *** Other professional 2.45 1.12 0.40 * Degree 2.31 0.60 0.38 *** Higher degree 2.56 0.82 0.42 ** Absent father or missing mother's -2.89 1.98 -0.47 Missing -4.53 4.56 -0.74 Early years HLE (compared with 0-13) 14-19 0.20 0.53 0.03 20-24 -0.15 0.54 -0.02 25-32 0.53 0.54 0.09 >33 1.07 0.65 0.17 Missing 1.55 1.03 0.25 KS1 HLE outing (compared with low) KS1 HLE outing medium -0.45 0.35 -0.07 KS1 HLE outing high -0.62 0.58 -0.10 KS2 HLE educational computing (compared with low) KS2 HLE educational computing medium 0.77 0.31 0.13 * KS2 HLE educational computing high 0.16 0.50 0.03 KS3 HLE academic enrichment (compared with low) KS3 HLE academic enrichment medium 1.33 0.31 0.22 *** KS3 HLE academic enrichment high 2.76 0.43 0.45 *** % White British (continuous) -0.01 0.01 -0.08 Year 6 maths 0.50 0.01 2.43 ***
Intercept -12.25 1.39 *** Variance-school level 3.28 0.93 ***
Variance-student level 37.70 1.24 *** Total variance 40.98
Number of students 2354 Number of schools 619
Deviance (-2 x Log Restricted-Likelihood) 15309.27 Intra-school correlation (ICC) 0.0800
% Reduction student variance 63.2 % Reduction school variance 87.2
% Reduction total variance 68.0 * p<0.05, ** p<0.01, *** p<0.001
165
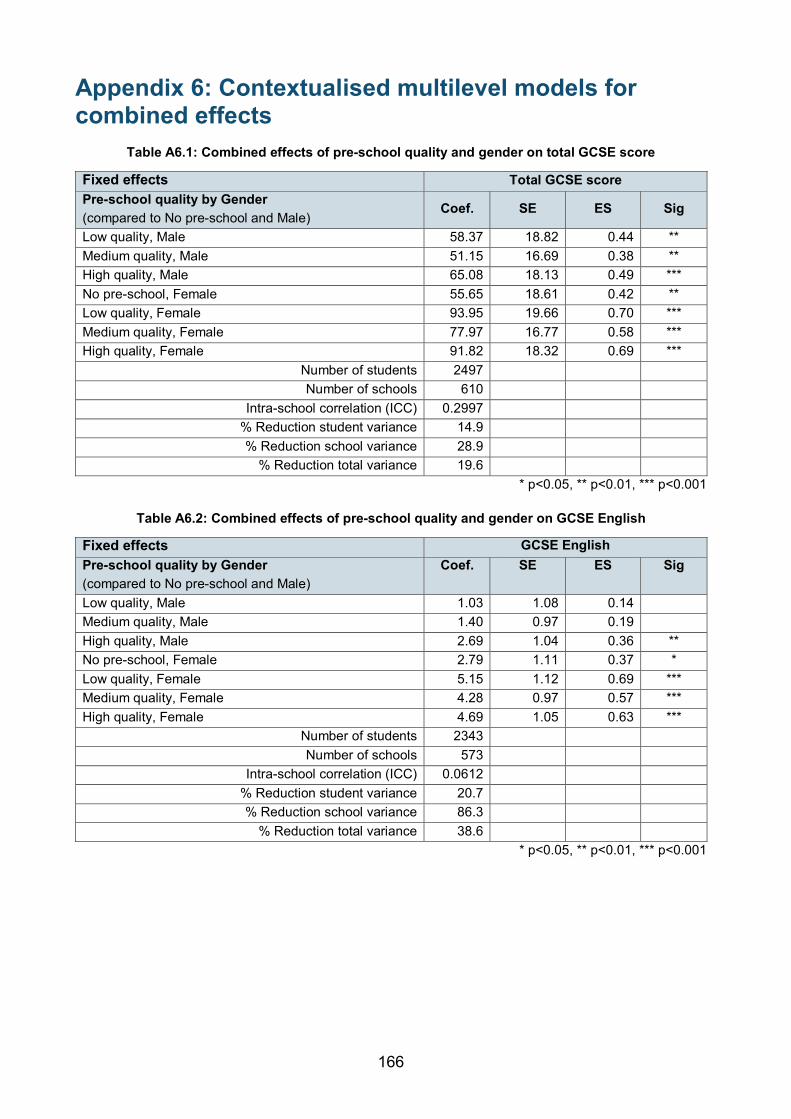
Appendix 6: Contextualised multilevel models for combined effects
Table A6.1: Combined effects of pre-school quality and gender on total GCSE score
Fixed effects Total GCSE score Pre-school quality by Gender (compared to No pre-school and Male)
Coef. SE ES Sig
Low quality, Male 58.37 18.82 0.44 ** Medium quality, Male 51.15 16.69 0.38 ** High quality, Male 65.08 18.13 0.49 *** No pre-school, Female 55.65 18.61 0.42 ** Low quality, Female 93.95 19.66 0.70 *** Medium quality, Female 77.97 16.77 0.58 *** High quality, Female 91.82 18.32 0.69 ***
Number of students 2497 Number of schools 610
Intra-school correlation (ICC) 0.2997 % Reduction student variance 14.9 % Reduction school variance 28.9
% Reduction total variance 19.6 * p<0.05, ** p<0.01, *** p<0.001
Table A6.2: Combined effects of pre-school quality and gender on GCSE English
Fixed effects GCSE English Pre-school quality by Gender (compared to No pre-school and Male)
Coef. SE ES Sig
Low quality, Male 1.03 1.08 0.14 Medium quality, Male 1.40 0.97 0.19 High quality, Male 2.69 1.04 0.36 ** No pre-school, Female 2.79 1.11 0.37 * Low quality, Female 5.15 1.12 0.69 *** Medium quality, Female 4.28 0.97 0.57 *** High quality, Female 4.69 1.05 0.63 ***
Number of students 2343 Number of schools 573
Intra-school correlation (ICC) 0.0612 % Reduction student variance 20.7 % Reduction school variance 86.3
% Reduction total variance 38.6 * p<0.05, ** p<0.01, *** p<0.001
166

Table A6.3: Combined effects of pre-school quality and gender on GCSE maths
Fixed effects GCSE maths Pre-school quality by Gender (compared to No pre-school and Male)
Coef. SE ES Sig
Low quality, Male 2.48 1.27 0.27 Medium quality, Male 3.01 1.14 0.33 ** High quality, Male 3.71 1.22 0.41 ** No pre-school, Female 1.28 1.32 0.14 Low quality, Female 2.82 1.31 0.31 * Medium quality, Female 2.17 1.14 0.24 High quality, Female 2.46 1.23 0.27 *
Number of students 2535 Number of schools 675
Intra-school correlation (ICC) 0.0397 % Reduction student variance 18.7 % Reduction school variance 86.5
% Reduction total variance 32.2 * p<0.05, ** p<0.01, *** p<0.001
Table A6.4: Combined effects of pre-school quality and parents’ highest qualification level on total GCSE score
Fixed effects Total GCSE score Pre-school quality by Parents’ highest qualification level (compared to No pre-school and Low qualification)
Coef. SE ES Sig
Low quality, Low qualification 44.60 16.18 0.33 ** Medium quality, Low qualification 32.34 13.77 0.24 * High quality, Low qualification 44.56 15.39 0.33 ** No pre-school, Moderate/High qualification -34.60 29.44 -0.26 Low quality, Moderate/High qualification 64.43 19.60 0.48 ** Medium quality, Moderate/High qualification 58.12 15.59 0.44 *** High quality, Moderate/High qualification 72.09 18.15 0.54 ***
Number of students 2413 Number of schools 598
Intra-school correlation (ICC) 0.2955 % Reduction student variance 15.2 % Reduction school variance 30.6
% Reduction total variance 20.4 * p<0.05, ** p<0.01, *** p<0.001
167
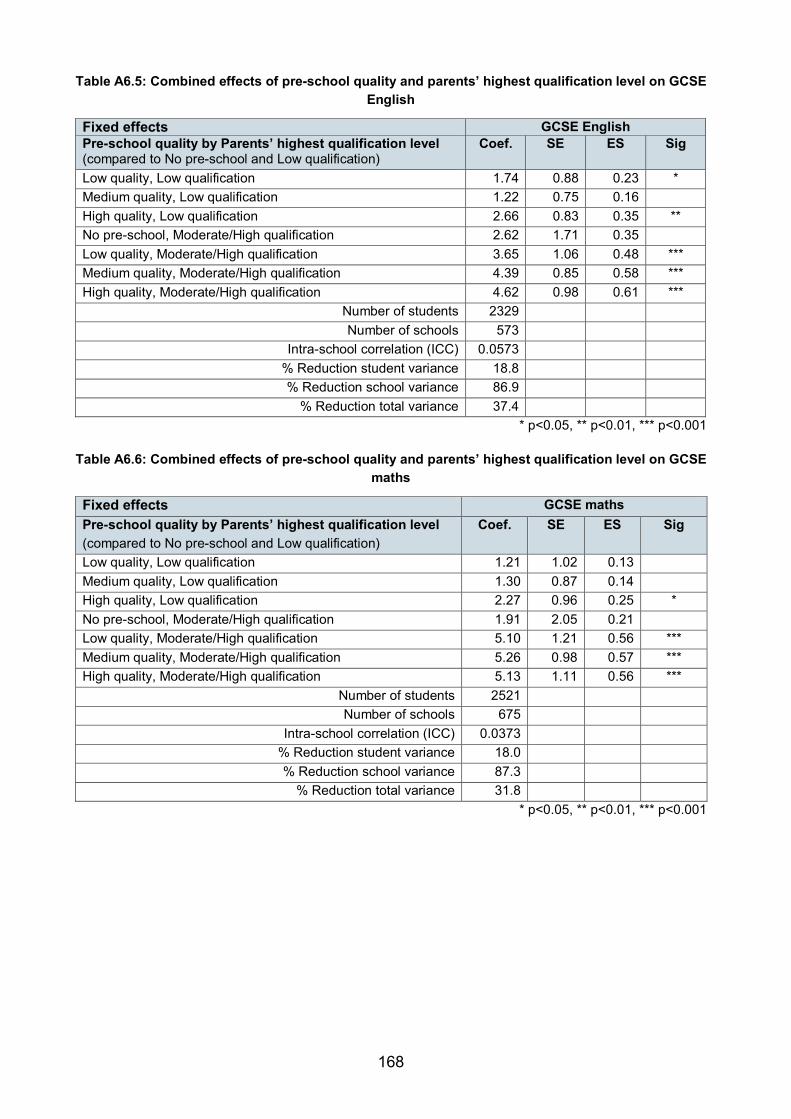
Table A6.5: Combined effects of pre-school quality and parents’ highest qualification level on GCSE
English
Fixed effects GCSE English Pre-school quality by Parents’ highest qualification level (compared to No pre-school and Low qualification)
Coef. SE ES Sig
Low quality, Low qualification 1.74 0.88 0.23 * Medium quality, Low qualification 1.22 0.75 0.16 High quality, Low qualification 2.66 0.83 0.35 ** No pre-school, Moderate/High qualification 2.62 1.71 0.35 Low quality, Moderate/High qualification 3.65 1.06 0.48 *** Medium quality, Moderate/High qualification 4.39 0.85 0.58 *** High quality, Moderate/High qualification 4.62 0.98 0.61 ***
Number of students 2329 Number of schools 573
Intra-school correlation (ICC) 0.0573 % Reduction student variance 18.8 % Reduction school variance 86.9
% Reduction total variance 37.4 * p<0.05, ** p<0.01, *** p<0.001
Table A6.6: Combined effects of pre-school quality and parents’ highest qualification level on GCSE maths
Fixed effects GCSE maths Pre-school quality by Parents’ highest qualification level (compared to No pre-school and Low qualification)
Coef. SE ES Sig
Low quality, Low qualification 1.21 1.02 0.13 Medium quality, Low qualification 1.30 0.87 0.14 High quality, Low qualification 2.27 0.96 0.25 * No pre-school, Moderate/High qualification 1.91 2.05 0.21 Low quality, Moderate/High qualification 5.10 1.21 0.56 *** Medium quality, Moderate/High qualification 5.26 0.98 0.57 *** High quality, Moderate/High qualification 5.13 1.11 0.56 ***
Number of students 2521 Number of schools 675
Intra-school correlation (ICC) 0.0373 % Reduction student variance 18.0 % Reduction school variance 87.3
% Reduction total variance 31.8 * p<0.05, ** p<0.01, *** p<0.001
168

Glossary of terms A-level (include Applied A-level): the GCE Advanced Level qualifications are the main pre-university qualification taken by students in England. For further information see http://ofqual.gov.uk/qualifications-and-assessments/qualification-types/a-levels/
A/S-level: The AS is a stand-alone qualification, usually made up of two units, and is worth half the value of a full A level. For further information see http://ofqual.gov.uk/qualifications-and-assessments/qualification-types/a-levels/
Academic self-concept: EPPSE derived two measures of Academic self-concept from Year 9 student questionnaire data: ‘Academic self-concept for English’ & ‘Academic self-concept for maths’. Both measures are based on items taken from existing well established ‘academic self-concept’ scales (Marsh, 1990a; 1990b; Marsh & Hau, 2003; Marsh & Craven, 2006). In addition a General academic self-concept measure, based on similar items (and based on Marsh's scale) was derived from the Year 11 questionnaire.
Academic ethos – Year 11 Factor: A factor derived from Year 11 student questionnaire items that relate to the extent to which students feel that other students within the school are interested in learning, doing well and continuing their education past compulsory schooling age.
Age standardised scores: Assessment scores adjusted to take account of the pupil’s age at testing, enabling comparisons between the cognitive/academic outcome of an individual pupil, and the achievement of a nationally representative sample of pupils in the same age group or, in this case, the achievement of the EPPSE sample.
Anti-social behaviour: A social-behavioural construct identified from teachers’ ratings about EPPSE students, collected through a pupil profile based on Goodman’s (1997) Strength and Difficulties questionnaire. Five items formed the factor ‘anti-social’ behaviour e.g., Steals from home, school or elsewhere.
Anxiety: A factor derived from Year 9 student questionnaire items that reflect the degree to which the students feel unhappy, worried, nervous, fearful in new situations, or suffer from minor ailments.
Aspiration: Aspirations refer to students intentions for future educational destinations and achievements, such as gaining qualifications, carry on in education (e.g. going to university) and career choices.
‘At risk’: The term ‘at risk’ is complex and differs depending on the criteria used. The definition of possible cognitive/academic ‘at risk’ used in the ETYSEN study (Taggart et al., 2006), was based on children’s cognitive/academic attainment age 3; a score of one standard deviation (sd) below the mean (in standardised assessments) in relation to national norms (at risk). In the EPPSE case studies, there are various definitions of risk and resilience (Siraj-Blatchford et al., 2011).
Basic Skills: qualifications in literacy and numeracy for adults and other skills for everyday life (http://ofqual.gov.uk/files/2010-11-26-statistics-glossary.pdf [Last accessed 14 March 2014]).
Birth weight: In the EPPSE research, babies born weighing 2500 grams (5lbs 8oz) or less are defined as below normal birth weight; foetal infant classification is below 1000 grams, very low birth weight is classified as 1001-1500 grams and low birth weight is classified as 1501-2500 grams (Scott and Carran, 1989). When EPPSE uses this measure in analyses, the categories foetal infant (<1000g) and very low birth weight (1001-1005g) are often collapsed into one category due to small numbers in the former group.
British Ability Scales (BAS): This is a battery of assessments specially developed by NFER-Nelson to assess very young pupils’ abilities. The assessments used at entry to the EPPE study and at entry to reception were:
• Block building - Visual-perceptual matching, especially in spatial orientation (only entry to study).
• Naming Vocabulary – Expressive language and knowledge of names.
• Pattern construction – Non-verbal reasoning and spatial visualisation (only entry to reception).
• Picture Similarities – Non-verbal reasoning.
• Early number concepts – Knowledge of, and problem solving using pre-numerical and numerical concepts (only entry to reception).
• Copying – Visual–perceptual matching and fine-motor co-ordination. Used specifically for pupils without English.
• Verbal comprehension – Receptive language, understanding of oral instructions involving basic language concepts.
BTEC: This is a type of vocational work-related qualification offered by the Business and Technology Education Council (BTEC) in three levels: Award, Certificate and Diploma. Centre/School level variance: The proportion of variance in a particular child/student outcome measure (i.e. Year 9 English Teacher Assessment level at the end of Key Stage 3 in secondary school) attributable to differences between individual centres/schools rather than differences between individual children/students. Citizenship values: A factor derived from Year 9 student questionnaire items that relate to how important students feel certain behaviours are such as strong people not picking on weak people, respecting rules and laws, controlling your temper, respecting other’s views, and sorting out disagreements without fighting.
170

City & Guilds: This is a type of vocational work-related qualification, offered by City & Guilds qualifications, which can be completed in the workplace, in the classroom or workshop. For further information, see http://www.cityandguilds.com/courses-and-qualifications/qualifications-explained/ [Last accessed 14 March 2014]).
Comparative Fit Index (CFI): The CFI is an index of a statistical model fit that takes into account sample size. Values close to 0.95 indicate good fit (Hu & Bentler, 1999).
Compositional effects: The influence of a student’s peer group on that particular student’s individual outcomes.. For example, the influence of attending a school where a high percentage of students are in receipt of Free School Meals (FSM) or come from disadvantaged backgrounds. This influence is irrespective of the characteristics (FSM status) of the individual student in question. For further details see Harker (2001).
Confidence intervals (at 95 or 99%): A range of values which can be expected to include the ‘true’ value in 95 or 99 out of 100 samples (i.e. if the calculation was repeated using 100 random samples).
Continuous measures: Numerical/Scale variables. In this report, continuous measures include total GCSE and equivalents point score, grade achieved in full GCSE English, grade achieved in full GCSE maths, and total number of full GCSE entries
Contextualised models: Cross-sectional multilevel models exploring individuals’ outcomes, while controlling for individual, family and home learning environment characteristics (but not prior attainment).
Controlling for: Several variables may influence an outcome and these variables may themselves be associated. Multilevel statistical analyses can calculate the influence of one variable upon an outcome having allowed for the effects of other variables. When this is done the net effect of a variable upon an outcome controlling for other variables can be established.
Correlation: A correlation is a measure of statistical association ranging from + 1 to -1.
Cronbach’s alpha (α): A measurement of the internal reliability (or consistency) of the items on a test or questionnaire that ranges between 0 and 1 showing the extent to which the items are measuring the same thing (Reber, 1995). A value greater than 0.7 (α<0.7) suggests that the items consistently reflect the construct that is being measured.
CVA (Contextualised Value Added): Measures of secondary school academic effectiveness derived from KS2-KS4 contextual value added (CVA) indicators produced by the Department for Education (DfE). At the pupil level, the CVA score was calculated as the difference between predicted attainment (i.e., the average attainment achieved by similar pupils) and real attainment in KS4. The predicted attainment was obtained by using multilevel modelling controlling for pupils’ prior attainment and adjusting for their background characteristics (i.e., gender, age, ethnicity, SEN, FSM, mobility etc.). For
171

each school, all individual pupil scores were averaged and adjusted for the proportion of pupils attending the school in a specific year. This final averaged score represents the school level CVA and it is presented as a number based around 1000.
Dichotomous measures: categorical variable with only two possible values (1 defining the existence of a characteristic and 0 defining the inexistence). In this report, dichotomous measures include achieved 5 or more GCSE/GNVQs at grades A*-C, achieved 5 or more GCSE and equivalents at grades A*-C including GCSE English and maths and achieved the English Baccalaureate.
The Diploma: The Diploma is composite qualification for 14 to 19 year-olds, made up of individual free-standing qualifications combined in a specific way, mixing practical and theoretical learning, with an emphasis on 'applied learning'. Three of the components of the Diploma (Principal Learning, Project and Functional Skills) can also be studied as qualifications in their own right. (http://webarchive.nationalarchives.gov.uk/+/http://www.ofqual.gov.uk/popups/explaining-qualifications/ [Last accessed 14 March 2014]).
Disaffected behaviour (from Year 11 Dispositions report): Disaffected behaviour is the term EPPSE has used to reflect negative and positive behaviours/attitudes that indicate the extent of school engagement (behaviour within class and a more general item covering perceptions of the worth of schooling).
Dispositions: An overarching term used to refer to factors such as ‘Mental well-being’, ‘School Enjoyment’, ‘Disaffected behaviour’, ‘Resistance to Peer Influence’ and ‘general academic self concept’. The EPPSE study derived these factors from the Life in Year 11 questionnaire. EPPSE had previously derived other disposition factors such as ‘enjoyment of school’, ‘academic self concept (English and maths)’, ‘popularity’, ‘citizenship values’ and ‘anxiety’ from questionnaires completed by students in Year 9 called ‘All about Me’ and ‘All about Me in school’.
E2E: Entry to employment is a learning programme which is part of the work-based learning route and funded by the Learning and Skills Council (LSC). It is designed to provide opportunities for young people aged 16 and over who are not yet ready or able to take up a Modern Apprenticeship or further education or to move directly into employment. http://www.nfer.ac.uk/publications/EET01/EET01_home.cfm
English Baccalaureate (EBacc): The EBacc is not a qualification but a performance measure that indicates where a student has secured a C grade or above across a core of KS4 academic subjects (https://www.gov.uk/government/publications/english-baccalaureate-eligible-qualifications/ [Last accessed 14 March 2014]).
172

ECERS-R and ECERS-E: The American Early Childhood Environment Rating Scale (ECERS-R) is an observational instrument based on child centred pedagogy that assesses interactions and resources for indoor and outdoor learning (Harms et al., 1998). The English ECERS-E rating scale (Sylva et al., 2003) is an extension to the ECERS-R that was developed specially for the Effective Provision of Pre-school Education (EPPE) study to reflect developmentally appropriate practices in early years Literacy, Numeracy, Science & the Environment and Diversity (gender, race, individual needs).For more information see Sylva et al., (2010).
Educational effectiveness: Research design which seeks to explore the effectiveness of educational institutions in promoting a range of child/student outcomes (often academic measures) while controlling for the influence of intake differences in child/student characteristics.
Effect size (ES): Effect sizes (ES) provide a measure of the strength of the relationships between different predictors and the outcomes under study. For further information see Elliot & Sammons (2004).
Emphasis on learning: A factor derived from Year 9 student questionnaire items that relate to teacher expectations, emphasis on understanding something not just memorising it, teachers believing that it is okay for students to mistakes as long as they learn from them, students wanting to do well in exams, and lessons being challenging.
Enjoyment of school: A factor derived from Year 9 student questionnaire items that reflect the degree to which students reported they like lessons and being at school, like answering questions in class, but also how much the student experiences boredom in lessons or feels school is a waste of time. EPPE: The Effective Provision of Pre-school Education (EPPE) project was designed to explore the impact of pre-school on children's cognitive/academic and social-behavioural outcomes as well as other important background influences (including family characteristics and the home learning environment). EPPE was the original phase of the EPPSE study, funded by the Department for Education and Employment it ran from 1997-2003.
Factor Analysis (FA): An umbrella term covering a number of statistical procedures that are used to identify a smaller number of factors or dimensions from a larger set of independent variables or items (Reber, 1995). At KS3 EPPSE used:
• Exploratory FA – a type of analyses where no prior (theoretical) knowledge is imposed on the way the items cluster/load.
• Principal Components Analysis (PCA) – a procedure that converts a set of observations of possibly correlated items into a set of values of uncorrelated items called principal components.
173
• Confirmatory FA – type of factor analyses used where the measure of a factor/construct are tested against a prior (theoretical) knowledge.
Family characteristics: Examples of family characteristics are mother’s highest qualification level, father’s highest qualification level and family socio-economic status (SES).
Formative feedback – Year 11 Factor: A factor derived from Year 11 student questionnaire items that relate to students’ experiences of practical support from teachers, helping students when they are stuck and guiding them on how to improve their work.
Free school meals (FSM): An indicator of family poverty.
Functional Skills: These qualifications, available in England to those aged 14 and older, are available as stand-alone qualifications at a number of different levels, and may also contribute towards the Diploma qualification. Functional Skills qualifications lead to the development of practical skills that allow learner to use English, maths and ICT in real life contexts (http://ofqual.gov.uk/files/2010-11-26-statistics-glossary.pdf [Last accessed 14 March 2014]).
GCSE: General Certificate of Secondary Education (GCSE) exams are usually sat during Year 11 at age 16 but can be taken by 15 to 18 year olds in schools or colleges. They can also be taken by those wanting to gain an exit school level qualification see http://ofqual.gov.uk/qualifications-and-assessments/qualification-types/gcses/ [Last accessed 14 March 2014]).
GCSE Benchmark Indicators: DfE benchmark indicators of GCSE performance include: achieved 5 or more GCSE/GNVQs at grades A*-C /-/ achieved 5 or more GCSE and equivalents at grades A*-C including GCSE English and maths /-/ achieved the English Baccalaureate.
Head teacher qualities: A factor derived from Year 9 student questionnaire items that reflect the head teacher making sure that students behave well, their presence around the school and interest in how much students learn.
Hierarchical nature of the data: Data that clusters into pre-defined subgroups or levels within a system (i.e. students, schools, local authorities).
Higher academic route: dichotomous measure based on students’ responses on the Life After Year 11-Questionnaire 1- Full-Time Education. It takes the value 1 for those who took 4 or more AS/A levels and 0 for all others returning a Life After Year 11 questionnaires.
174

Home learning environment (HLE) characteristics: Measures derived from reports from parents (at interview or using parent questionnaires) about what children do at home (with/independent of their parents). There are several HLE measures: early years HLE, KS1 HLE, KS2 HLE (please see Appendix 1 for further details). Homework: Student’s self-reported time spent on homework on an average school night.
Hyperactivity: A social-behavioural construct identified from teachers’ ratings about EPPSE students, collected through a pupil profile based on Goodman’s (1997) Strength and Difficulties questionnaire. Several items formed the factor ‘hyperactivity’ e.g., Restless, overactive, cannot stay still for long. Income Deprivation Affecting Children Index (IDACI): The IDACI represents the percentage of children in each SOA that live in families that are income deprived. For further details see Noble et al., (2008).
Independent School - Category: An independent school is any school or establishment, which is not maintained by a local authority or a non-maintained special school, that provides full time education for 5 or more pupils of compulsory school age (http://www.education.gov.uk/edubase/glossary.xhtml?letter=I [Last accessed 14 March 2014]).
Index of Multiple Deprivation (IMD): The IMD is a measure of a range of characteristics evident in a neighbourhood. For further details see Noble et al. (2004; 2008).
Internal Reliability/Consistency: The degree to which the various parts of a test (items) or other instrument (e.g., questionnaire) measure the same variables/construct (Reber, 1995). An example measure would be Cronbach’s alpha (see earlier).
International Baccalaureate: The International Baccalaureate Diploma Programme (DP) is a programme of education with final examinations that prepares students, aged 16 to 19, for success at university and life beyond - see http://www.ibo.org/diploma/ [Last accessed 14 March 2014]).
Intra-centre/school correlation: The intra-centre/school correlation measures the extent to which the outcomes from children/students in the same centre/school resemble each other as compared with those from children/students at different centres/schools. The intra-centre/school correlation provides an indication of the extent to which unexplained variance in children’s/students’ progress (i.e. that not accounted for by prior attainment) may be attributed to differences between centres/schools. This gives an indication of possible variation in pre-school centre/school effectiveness.
Key Skills: These qualifications can be studied in 6 subject areas (communication, application of number, information and communication technology (ICT), working with others, improving own learning and performance, and problem solving) that provide the necessary skills for learning, working and life in general (http://ofqual.gov.uk/files/2010-11-26-statistics-glossary.pdf [Last accessed 14 March 2014]).
175

Key Stage (KS): The English education system splits students into age phases known as Key Stages as follows: KS1 (age 5-7), KS2 (8-11), KS3 (12-14), KS4 (14-16).
Lower academic route: dichotomous measure based on students’ responses on the “Life After Year 11-Questionnaire 1- Full-Time Education”. It takes the value 1 for those who took 3 or less As/A levels and 0 for those who are on a higher academic route.
Matriculation: exam refers to the qualification (in any country) that describes the transfer from secondary to tertiary education.
Mean average: A measure of central tendency that is calculated by summing a set of values (or scores) and then dividing by the number of values or scores (Reber, 1995).
Mental well-being (from Year Dispositions report): In order to asses mental well-being EPPSE included items from the Warwick-Edinburgh Mental Well-Being scale (WEMWB; Tennant et al., 2007) in the Life in Year 11 questionnaire. The Warwick-Edinburgh Mental Well-being scale was used to measure students’ positive mental well-being in Year 11 allowing investigation of specific aspects of mental well-being as well as providing an overall scale.
Monitoring students – Year 11 Factor: A factor derived from Year 11 student questionnaire items that relate to the extent to which teachers monitor the progress students are making, set targets and reward hard work.
Multilevel modelling: A methodology that allows data to be examined simultaneously at different levels within a system (i.e. children/students, pre-school centres/schools, local authorities), essentially a generalisation of multiple regression.
Multiple Disadvantage Index: This measure was developed as part of the Early Years Transition & Special Educational Needs (EYTSEN) Project, which focuses on the identification of children ‘at risk’ of SEN (see Sammons et al., 2004d). An index was created based on 10 indicators in total: three child variables, six parent variables, and one related to the Early years Home Learning Environment (HLE).
Child variables: First language: English as an additional language (EAL) - Large family: 3 or more siblings - Pre-maturity / low birth weight.
Parent/HLE variables:mother’s highest qualification level: no qualifications - Social class of father’s occupation: Semi-skilled, unskilled, never worked, absent father - Father not employed - Young Mother (Age 13-17 at birth of EPPE child) - Lone parent - Mother not working / unemployed - Low Early years Home Learning Environment (HLE). For further details see Sammons et al., (2002).
Multiple regression: method of predicting outcome scores on the basis of the statistical relationship between observed outcome scores and one or more predictor variables.
176
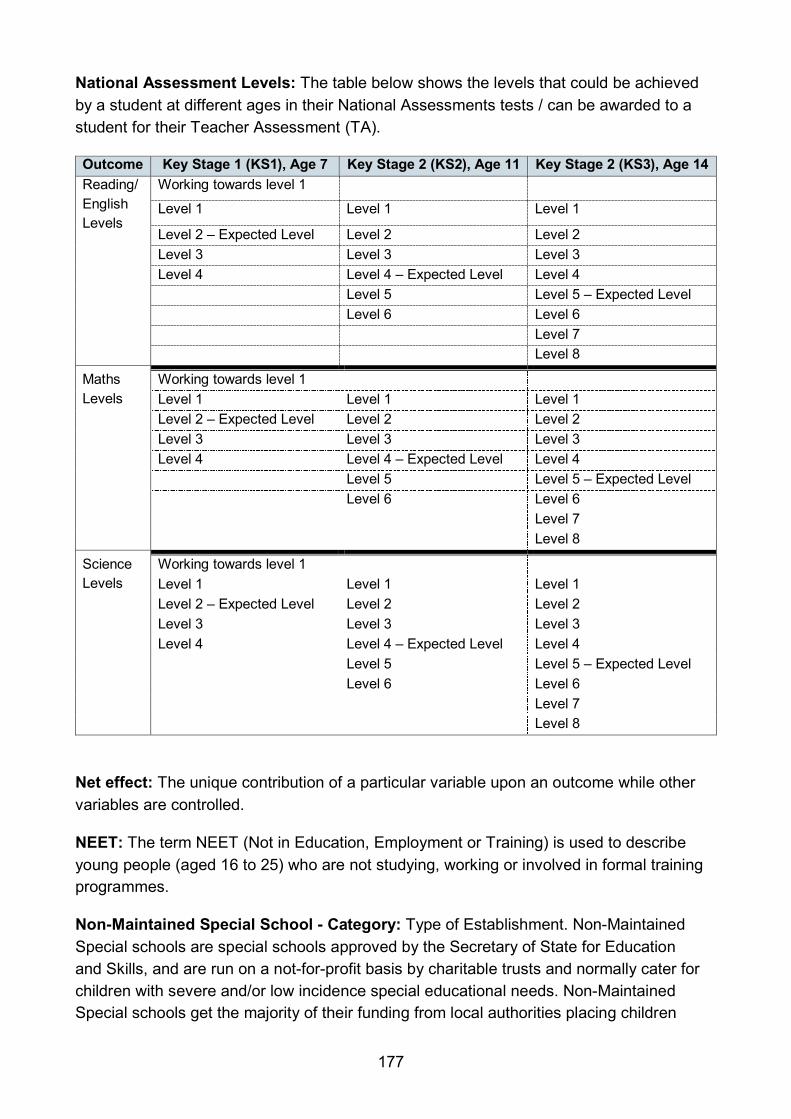
National Assessment Levels: The table below shows the levels that could be achieved by a student at different ages in their National Assessments tests / can be awarded to a student for their Teacher Assessment (TA).
Outcome Key Stage 1 (KS1), Age 7 Key Stage 2 (KS2), Age 11 Key Stage 2 (KS3), Age 14 Reading/ English Levels
Working towards level 1
Level 1 Level 1 Level 1
Level 2 – Expected Level Level 2 Level 2 Level 3 Level 3 Level 3 Level 4 Level 4 – Expected Level Level 4 Level 5 Level 5 – Expected Level Level 6 Level 6 Level 7 Level 8
Maths Levels
Working towards level 1 Level 1 Level 1 Level 1 Level 2 – Expected Level Level 2 Level 2 Level 3 Level 3 Level 3 Level 4 Level 4 – Expected Level Level 4 Level 5 Level 5 – Expected Level Level 6 Level 6 Level 7 Level 8
Science Levels
Working towards level 1 Level 1 Level 1 Level 1 Level 2 – Expected Level Level 2 Level 2 Level 3 Level 3 Level 3 Level 4 Level 4 – Expected Level Level 4 Level 5 Level 5 – Expected Level Level 6 Level 6 Level 7 Level 8
Net effect: The unique contribution of a particular variable upon an outcome while other variables are controlled.
NEET: The term NEET (Not in Education, Employment or Training) is used to describe young people (aged 16 to 25) who are not studying, working or involved in formal training programmes.
Non-Maintained Special School - Category: Type of Establishment. Non-Maintained Special schools are special schools approved by the Secretary of State for Education and Skills, and are run on a not-for-profit basis by charitable trusts and normally cater for children with severe and/or low incidence special educational needs. Non-Maintained Special schools get the majority of their funding from local authorities placing children
177

with special educational needs statements at the schools and paying the fees (http://www.education.gov.uk/edubase/glossary.xhtml?letter=N ) [Last accessed 14 March 2014]).
Null model: multilevel model with no predictors.
NVQ: National Vocational Qualifications (NVQ)s are ‘outcome based’ and are delivered in a workplace setting. NVQs are work-related, competence-based qualifications that cover a broad range of industry sectors and occupations (http://webarchive.nationalarchives.gov.uk/+/http://www.ofqual.gov.uk/popups/explaining-qualifications/ [Last accessed 14 March 2014]).
Odds Ratio (OR): Odds Ratios represent the odds of achieving certain benchmark performance indicators given certain characteristics relative to the odds of the reference group.
Ofsted: The Office for Standards in Education, Children’s Services and Skills (Ofsted) inspect and regulate services that care for children and young people, and those providing education and skills for learners of all ages. See Matthews & Sammons (2004), and the Ofsted website (http://www.ofsted.gov.uk/) for further details.
Out of school activities (from Year 11 Dispositions report): Out of school activities include activities students were involved in outside of school during Year 11 (during the month previous to completing the Life in Year 11 questionnaire). They include activities such as reading, going to the library, going to parties, going to church, music groups etc.
Pedagogical strategies: Strategies used by an educator to support learning. These include the face to face interactions with students, the organisation of resources and the assessment practices.
Peer group (and Peer group affiliation) (from Year 11 Dispositions report): The peer group refers to other students in their immediate social circle, primarily other students sharing similarities such as age and background. Peer affiliation refers to being affiliated, or associated, with a specific friendship group.
Physical Health (from Year 11 Dispositions report): Physical health refers to students' health status, including any illness, disability or infirmity experienced in the 12 months pervious to completing the Life in Year 11 questionnaire.
(Poor) behaviour climate: A factor derived from Year 9 student questionnaire items that relate to the general behaviour climate in the EPPSE student’s school; students being given a hard time by others if they work hard, level of compliance with school rules, fighting and weapons being brought into school, and whether most students want to leave the school as soon as they can.
178

Popularity: A factor derived from Year 9 student questionnaire items that relate to how popular students feel they are with other teenagers and how many friends they have.
Positive relationships – Year 11 Factor: A factor derived from Year 11 student questionnaire items that relate to how well students and teachers get on, such as students feeling they are treated fairly and respected and teachers showing an interest in students.
Pre-reading attainment: Composite formed by adding together the scores for phonological awareness (rhyme and alliteration) and letter recognition.
Pre-school effectiveness: Measures of the effectiveness of pre-schools were derived from Value Added (VA) models of the sample’s actual progress during pre-school, controlling for prior attainment and children’s background characteristics (Sammons et al., 2004b).
Primary school effectiveness: Primary school academic effectiveness scores were obtained from National Assessment data for several cohorts across all primary schools in England. Value-added scores were calculated across the years 2002-4, for each primary school in England and then extracted for schools attended by the EPPE sample (Melhuish et al., 2006a; 2006b).
Prior attainment: Measures which describe a participant’s achievement at the beginning of the phase or period under investigation (i.e. taken on entry to the study or school, or for Year 9 and Year 11 analyses, outcomes from Year 6).
Pro-social Behaviour: A social-behavioural construct identified from teachers’ ratings about EPPSE students, collected through a pupil profile based on Goodman’s (1997) Strength and Difficulties questionnaire. Several items formed the factor ‘pro-social’ behaviour e.g., Considerate of other people’s feelings.
Pupil Profile: An instrument containing Goodman’s (1997) Strength and Difficulties questionnaire plus some additional items used to collect information about EPPSE student’s social behaviour. It is completed by a teacher who knows the EPPSE student well.
Resistance to peer influence (from Year 11 Dispositions report): The Resistance to Peer Influence scale (RPI) examines a students’ ability to resist the influence of their peers in more than just anti-social scenarios, ranging from wanting to fit in with the crowd to being willing to break the law to fit in with friends. Items included ‘I think it’s more important to be who I am than to fit in with the crowd’.
Risky behaviours (from Year 11 Dispositions report): Students were asked about activities considered as risky to health or as risky anti-social behaviours and responses to these items were then combined to form an overall measure of ‘risky’ behaviours. EPPSE asked about the following risky behaviours in the Life in Year 11 questionnaire: Truanting
179

- Smoking prevalence - Drinking prevalence - Drug usage - Anti-social criminal behaviours and legal intervention.
Quality of pre-school: Measures of pre-school centre quality were collected through observational assessments (ECERS-R, ECERS-E) completed by trained researchers. For further information see ECERS and Sylva et al. (2010).
Quality of secondary schools: Secondary school quality was derived from measures taken from Ofsted inspection judgments. See Ofsted for further details.
Root Mean Square Error of Approximation (RMSEA): The RMSEA is an index measure of model; values less than 0.06 are an indication of a good fit.
Sampling profile/procedures: The EPPSE sample was constructed of: Five regions (six Local authorities) randomly selected around the country, but being representative of urban, rural, inner city areas. Pre-schools from each of the 6 main types of target provision (nursery classes, nursery schools, local authority day nurseries, private day nurseries, play groups and integrated centres) randomly selected across the region.
School engagement (from Year 11 Dispositions report): Fredericks et al (2004) view School engagement as multi-dimensional covering ‘behavioural engagement’, ‘emotional engagement’ and ‘cognitive engagement’.
School enjoyment (from Year 11 Dispositions report): The EPPSE definition of School Enjoyment is an aspect of what Fredricks et al., (2004) would describe as the ‘emotional’ dimension of ‘school engagement’. The EPPSE factor ‘School Enjoyment’ includes items such as ‘On the whole I like being at school’.
School environment: A factor derived from Year 9 student questionnaire items that relate to how EPPSE students view their school in terms of the physical space (the attractiveness of buildings, the decorative state of the classrooms, the condition of the toilets), as well as its reputation as a good school and how well organised it is.
School/learning resources: A factor derived from Year 9 student questionnaire items that relate to practical resources for learning at the EPPSE student’s school; amount of computers and getting enough time on them in lessons, and the quality of science labs and the school library.
School level variation: School level variance here refers to the percentage of variation in students’ outcomes that can be attributed to differences between schools.
Secondary school effectiveness: Secondary school academic effectiveness scores were obtained from the Department for Education (DfE). The measure of academic effectiveness is represented by the average KS2 to KS4 contextual value added (CVA) school level scores over 4 years (2006-2009) when EPPSE students were in secondary school. See ‘CVA’ as this is the same measure.
180
Self-regulation: A social-behavioural construct identified from teachers’ ratings about EPPSE students, collected through a pupil profile based on Goodman’s (1997) Strength and Difficulties questionnaire. Several items formed the factor ‘self-regulation’ e.g., Likes to work things out for self; seeks help rarely.
Significance level: Criteria for judging whether differences in scores between groups of children/students or centres/schools might have arisen by chance. The most common criteria is the 95% level (p<0.05), which can be expected to include the ‘true’ value in 95 out of 100 samples (i.e. the probability being one in twenty that a difference might have arisen by chance).
Social-behavioural development: A student’s ability to ‘socialise’ with other adults and pupils and their general behaviour to others. EPPSE uses this overarching name to refer to a range of social-behavioural outcome measures. At age 16, two of these outcomes refer to positive outcomes (‘self-regulation’ and ‘pro-social’ behaviour) and two refer to negative outcomes (‘hyperactivity’ and ‘anti-social’ behaviour).
Socio-economic status (SES): Occupational information was collected by means of a parental interview/questionnaire at different time points. The Office of Population Census and Surveys (OPCS) (1995) Classification of Occupations was used to classify mothers and fathers current employment into one of 8 groups: professional I, other professional non manual II, skilled non manual III, skilled manual III, semi-skilled manual IV, unskilled manual V, never worked and no response. Family SES was obtained by assigning the SES classification based on the parent with the highest occupational status.
Special Educational Needs (SEN): Children with an SEN have been assessed as having a specific need which demands additional attention/resources. Children with an SEN can be placed on the Code of Practice a various levels, depending on their conditions see https://www.gov.uk/government/publications/special-educational-needs-sen-code-of-practice
Standard deviation (sd): A measure of the spread around the mean in a distribution of numerical scores. In a normal distribution, 68% of cases fall within one standard deviation of the mean and 95% of cases fall within two standard deviations.
Structural equation modelling (SEM): is an umbrella term for statistical modelling techniques which allow for testing causal processes and structural relationships (Byrne, 2010).
Student background characteristics: Student background characteristics include age, birth weight, gender, and ethnicity.
Target centre: A total of 141 pre-school centres were recruited to the EPPSE research covering 6 types of provision
181
Teacher Assessment (TA) : These assessments made by teachers provide measures of students’ educational outcomes for English, maths and science in Year 9 (age 14) in the form of National curriculum levels.
Teacher discipline: A factor derived from Year 9 student questionnaire items that relate to the level of teacher control during lessons, in terms of behaviour, noise, rule breaking and teachers being bothered if students turn up late.
Teacher professional focus – Year 11 Factor: A factor derived from Year 11 student questionnaire items that relate to perceptions of teachers’ focus on day to day teaching responsibilities such as learning and behaviour within the classroom.
Teacher support: A factor derived from Year 9 student questionnaire items that relate to support given by teachers in terms of helping students, giving them feedback, making them feel confident about their work, rewarding them for good behaviour, being available to talk privately, and marking and returning homework.
Term of birth: Using EPPSE student’s dates of birth, the EPPSE sample were categorised into three ‘term of birth’ categories: Autumn born (September to December); Spring born (January to April); Summer born (May to August).
Total GCSE and equivalents point score: This is a mechanism for comparing equivalencies of different types of KS4 exams, based on the total pupil’s point scores and not the average points scores per subject. For example in School A, if pupils take 10 full GCSEs and in each obtain grade C, which has a points score of 40, their total points score will be 10 x 40, which is 400. If all pupils in the school had the same results, the school’s average total points score would be 400. In School B all pupils might take only 8 GCSEs but in each attain grade B, which has a points score of 46. The school’s average total points score would be 368. So School A has a higher average total points score than School B. In EPPSE total points score is a continuous measure.
Total number of full GCSE entries: The total number of GCSE’s entered regardless of the results.
Truanting (from Year 11 Dispositions report): Truanting refers to whether the student had taken unauthorised time off school during Year 11 (the students were asked if they had bunked/skived off in Year 11).
Value added models: Longitudinal multilevel models exploring individuals’ progress over time, controlling for prior attainment as well as significant individual, family and home learning environment characteristics.
182
Value added residuals (pre-school effectiveness): Differences between predicted and actual results for pre-school centres (where predicted results are calculated using value added models). See Pre-school effectiveness for further information
Value added residuals (primary school academic effectiveness): Differences between predicted and actual results for primary schools measuring pupil progress across KS1 – KS2. For further information see Primary school effectiveness and Melhuish et al. (2006a; 2006b).
Valuing pupils: A factor derived from Year 9 student questionnaire items that relate to whether the school values students’ views, teachers listen to students views, are respectful and friendly to students, teachers are unpleasant to students if they make mistakes.
Views of school: An overarching term refering to factors such as ‘teacher support’, ‘school environment’, ’valuing pupils’, ‘headteacher qualities’, ‘poor behaviour climate’, ‘emphasis on learning’, ‘teacher discipline’, and ‘school/learning resources’. EPPSE derived these factors from a Year 9 questionnaire called ‘All about me in school’, and the Life in Year 11 questionnaire, completed in Year 11.
Vocational qualifications: work-related qualifications examined through practical assessment as opposed to formal academic assessment i.e. NVQs, VRQs & Diploma.
Vocational route: dichotomous measure based on students’ responses on the “Life After Year 11-Questionnaire 1- Full-Time Education”. It takes the value 1 for those who did not take any As/A levels, but returned a “Life After Year 11-Questionnaire 1- Full-Time Education” questionnaire.
Z score (from Year 11 Dispositions report): A Z score is a statistical method for standardising data so that the mean equals zero and the standard deviation equals one.
VRQ: Vocationally Related Qualifications (VRQ) are related to employment but, unlike NVQs, do not necessarily require a work placement. VRQs are work-related, competence-based qualifications designed to provide learners with the skills and knowledge needed to do a job (http://ofqual.gov.uk/files/2010-11-26-statistics-glossary.pdf [Last accessed 14 March 2014]).
Well-being: Well-being here refers to aspects of young people's life such as physical health, peer and family relationships, and engagement (or not) in risky behaviours.
The Warwick-Edinburgh Mental Well-being scale: The Warwick-Edinburgh Mental Well-being scale is a 14 item scale (WEMWB; Tennant et al., 2007) that covers aspects of hedonic and eudaemonic well-being. Hedonic well-being is more emotional in nature, such as feelings of optimism, cheerfulness and feeling good about oneself. Eudaemonic well-being relates to mental capacities such as dealing with problems, thinking clearly and decision making.
183
© Institute of Education, University of London 2014
Reference: DFE-RR352
ISBN: 978-1-78105-404-8
The views expressed in this report are the authors’ and do not necessarily reflect those of the Department for Education
Any enquiries regarding this publication should be sent to us at: [email protected] or www.education.gov.uk/contactus
This document is available for download at www.gov.uk/government/publications
184